1 reporting under the nec directive joint tfeip/eionet 19-20 october 2004 andreas barkman (eea)
TRANSCRIPT

1
Reporting under the NEC DirectiveReporting under the NEC Directive
Joint TFEIP/EIONET 19-20 October 2004
Andreas Barkman (EEA)

2
Outline…Outline…
• Status of reporting due 31 Dec 2003• Why harmonize reporting?

3
Observed issues in NEC reportingObserved issues in NEC reporting• Much better reporting in NFR!But……• Not in time• Not complete • Inconsistent reporting CLRTAP/NEC/FCCC• Unclear reporting status NEC/CLRTAP• Poor projections reporting (7 MS, some
projections=ceilings)• Incomplete National Programme reporting (due
2002)• Poor guidance and coordination of MS
reporting at EU level (1/3). So is this a problem then or
what……?

4
Well…Yes..but for whom/what?Well…Yes..but for whom/what?• The environmental integrity of the whole
exercise• MS risk of non-compliance by being uncertain
of the distance to their ceilings and the likelihood of getting there and additional PAMs needed
• Policy development, including integrated assessments, and assessing policy implementation and effectiveness on EC level
• The EC not being able to comply with its reporting obligation under CLRTAP (least common denominator situation cf. UNFCCC)
So…?

5
Why is it like this then?Why is it like this then?
• Are we still in a learning curve? (2010 is far away…)?
• Don’t we have enough resources to do what we committed ourselves to do?
• Is there too tough competition on resources with other environmental issues – e.g. climate change?
• Is there not enough incentives to improve the situation within EC?
• Do we need more/less technical guidance, streamlining/harmonization efforts NEC/ CLRTAP/FCCC to free resources?
=things to think of for the discussion
6
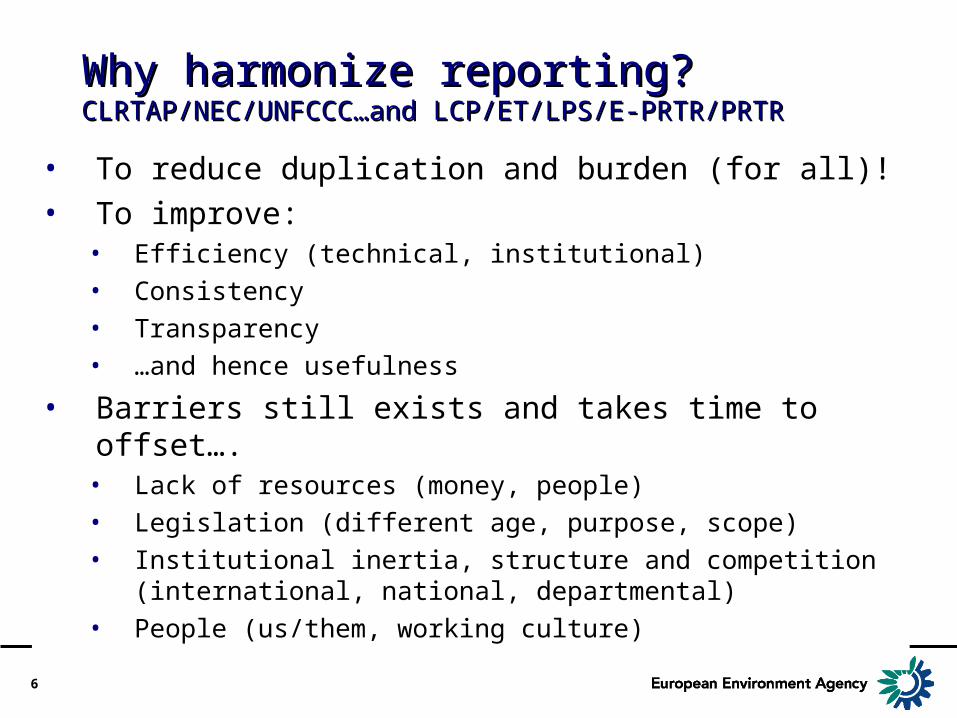
Why harmonize reporting? Why harmonize reporting? CLRTAP/NEC/UNFCCC…and LCP/ET/LPS/E-PRTR/PRTRCLRTAP/NEC/UNFCCC…and LCP/ET/LPS/E-PRTR/PRTR
• To reduce duplication and burden (for all)!• To improve:
• Efficiency (technical, institutional)• Consistency• Transparency• …and hence usefulness
• Barriers still exists and takes time to offset….• Lack of resources (money, people)• Legislation (different age, purpose, scope)• Institutional inertia, structure and competition
(international, national, departmental)• People (us/them, working culture)
7
Some differences NEC-CLRTAPSome differences NEC-CLRTAP
• NEC includes both national and international LTO
• NEC includes international inland shipping

8
Streamlining efforts - EUStreamlining efforts - EU
• Intensive discussion between CEC/MS/EEA on ways to improve the situation
• Harmonization and streamlining in paralell
• Streamlining short term, facilitate reporting rather than reducing load of reporting

9
Thank you!Thank you!

10
What next…?What next…?
• 2005: Thematic Strategy presented• 2005-2006: Revision of NEC Directive• 2006: Reporting national programmes
according to a common agreed format• 2006: 2nd EPER reporting

11
Emission trends of acidifying pollutants EU15 Emission trends of acidifying pollutants EU15
0
20
40
60
80
100
120
1990 1992 1994 1996 1998 2000 2002 2004 2006 2008 2010
Ind
ex
0
200
400
600
800
1000
1200
kt a
cid
eq
uiv
alen
t
EU15 total
NECD Target Path
2010 NECD Target

12
Emission trends of acidifying pollutants EU10Emission trends of acidifying pollutants EU10
0
20
40
60
80
100
120
1990 1992 1994 1996 1998 2000 2002 2004 2006 2008 2010
Ind
ex
0
100
200
300
400
kt a
cid
eq
uiv
alen
t
EU10 total
NECD Target Path
2010 NECD Target

13
Contribution to total change in acidifying pollutant emissions for each sector and pollutant 1990 – 2002, (EU15)
-77%
-19%
-4%
-52%
-16%
-3%
-8%
-13%
-3%
-4%
-0.8%
-0.1%
-90% -70% -50% -30% -10% 10% 30%
Sulphur Dioxide
Nitrogen Oxides (as NO2)
Ammonia
Energy Industries
Industry (Energy)
Industry (Processes)
Other (Energy)
Road Transport
Other Transport
Agriculture
Waste
Other

14
-76%
-11%
-13%
-45%
-24%
-4%
-16%
-5%
-11%
-0.9%
5.6%
0.2%
-90% -70% -50% -30% -10% 10% 30%
Sulphur Dioxide
Nitrogen Oxides (as NO2)
Ammonia
Energy Industries
Industry (Energy)
Industry (Processes)
Other (Energy)
Road Transport
Other Transport
Agriculture
Waste
Other
Contribution to total change in acidifying pollutant emissions for each sector and pollutant 1990 – 2002, (EU10)

15
Emissions of ozone precursors Emissions of ozone precursors between 1990 and 2002 (EU15)between 1990 and 2002 (EU15)
0
20
40
60
80
100
120
1990 1992 1994 1996 1998 2000 2002 2004 2006 2008 2010
Ind
ex
0
5000
10000
15000
20000
25000
30000
35000
kto
nn
es N
MV
OC
eq
NMVOC and NOx as Ozone Precursors
NECD Target Path (NMVOC & NOx only)
2010 NECD Target (NMVOC & NOx only)
NMVOC, CO, CH4 and NOx as Ozone Precursors

16
Emissions of ozone precursors Emissions of ozone precursors between 1990 and 2002 (EU10)between 1990 and 2002 (EU10)
0
20
40
60
80
100
120
1990 1992 1994 1996 1998 2000 2002 2004 2006 2008 2010
Ind
ex
0
1000
2000
3000
4000
5000
6000
kto
nn
es N
MV
OC
eq
NMVOC and NOx as Ozone Precursors
NECD Target Path (NMVOC & NOx only)
2010 NECD Target (NMVOC & NOx only)
NMVOC, CO, CH4 and NOx as Ozone Precursors

17
Contribution to change in ozone Contribution to change in ozone precursors emissions for each sector precursors emissions for each sector and pollutant 1990 – 2002and pollutant 1990 – 2002 (EU15) (EU15)
-10%
-4%
-5%
-2%
-3%
-8%
-65%
-2%
0%
-18%
-44%
-37%
-1%
-0.1%
-70% -60% -50% -40% -30% -20% -10% 0% 10% 20% 30%
Carbon Monoxide
NMVOC
Nitrogen Oxides
Methane
Energy Industries
Fugitive Emissions
Industry (Energy)
Industry (Processes)
Other (Energy)
Other (Non Energy)
Transport
Agriculture
Waste
Unallocated

18
Contribution to change in ozone Contribution to change in ozone precursors emissions for each sector precursors emissions for each sector and pollutant 1990 – 2002and pollutant 1990 – 2002 (EU10) (EU10)
-25%
1%
-21%
-14%
-23%
-5%
-26%
-1%
-24%
-30%
-45%
-0.1%
12.4%
-0.9%
-50% -40% -30% -20% -10% 0% 10% 20% 30%
Carbon Monoxide
NMVOC
Nitrogen Oxides
Methane
Energy Industries
Fugitive Emissions
Industry (Energy)
Industry (Processes)
Other (Energy)
Other (Non Energy)
Transport
Agriculture
Waste
Unallocated

19
Emissions of primary and secondary Emissions of primary and secondary fine particulates (ktonnes) 1990-2002 fine particulates (ktonnes) 1990-2002
0
20
40
60
80
100
1990 1992 1994 1996 1998 2000 2002
Ind
ex
0
5000
10000
15000
20000
25000
kt e
mis
sio
n
Particulate Emissions (Primary and Secondary)

20
Contribution of the change in Contribution of the change in emissions of primary and secondary emissions of primary and secondary fine particulates (PM10), per sector and fine particulates (PM10), per sector and per pollutant, relative to the total per pollutant, relative to the total change in emissions between 1990 and change in emissions between 1990 and 2002 (%) 2002 (%)
-4%
-35%
-59%
-2%
-46%
-1%
-16%
-3%
-7%
-22%
-3%
-2%
-0.1%
0.2%
0.0%
-80% -60% -40% -20% 0% 20% 40%
PM10
NOx
SO2
NH3
Energy Industries
Fugitive Emissions
Industry (Energy)
Industry (Processes)
Other (Energy)
Other (Non Energy)
Road Transport
Other Transport
Agriculture
Waste
Unallocated

21
Projections submitted under NEC Projections submitted under NEC 31/12 200331/12 2003
Member State SOx (as SO2) NOx (as NO2) NH3 NMVOC
Denmark56 146.4 82.8 83
Finland97.5 151 31 130
France 387 988 857 954
Greece<300 344 73 261
Netherlands70 289 127 220
Sweden67 148 57 241
United Kingdom585 1 167 297 1 200

22
Polluta
nts c
overe
d
Proje
ctio
ns pre
sente
d
Changes in
Geo. D
ist.
Socio-e
con. a
ssum
ptions
Policy
name
Polluta
nts a
ffected
Impl.
statu
s
Quant. Ass
essm
.
of e
ffects
Austria +++ + o o +++ +++ +++ oBelgium Denmark +++ ++ + + +++ +++ ++ oFinland +++ ++ +++ + +++ +++ +++ +France +++ ++ o o + ++ ++ oGermany +++ + o + ++ +++ + +Greece Ireland Italy +++ + o o ++ + + oLuxembourg Netherlands +++ ++ o o +++ ++ + +++Portugal +++ + o ++ ++ +++ + ++Spain +++ + o o ++ ++ + oSweden +++ + o o + +++ + +United Kingdom +++ ++ o o +++ ++ ++ +
Projections Policies and Meas.
Explicitrequirements:

23
Split o
f pro
j. by
sect
or
Pres.
of r
esults
Disc. o
n unce
rtain
ty
Aim o
f polic
y
Imple
ment.
body
Inte
ract
ion w
.
other p
olicie
s
Projections Policies and Meas.
Austria + + o + + +Belgium Denmark +++ +++ + ++ + oFinland ++ + ++ +++ ++ ++France +++ ++ +++ ++ + +Germany ++ ++ o + o oGreece Ireland Italy +++ ++ o ++ + +Luxembourg Netherlands ++ +++ ++ +++ ++ +Portugal +++ + + + o oSpain + + o + o oSweden +++ + o ++ + ++United Kingdomo + ++ +++ ++ +
Good PracticeReporting:

24
Projected shortfall in emission abatement to meet emission ceilings in 2010 (% of ceiling)
SO2 (% of ceiling)
-30% -20% -10% 0% 10% 20% 30% 40% 50%
Sweden
Austria
Finland
Germany
Italy
United Kingdom
Denmark
Portugal - low
Portugal - high
France
Netherlands
With Additional Measures
With Measures
NOx (% of ceiling)
-20% -10% 0% 10% 20% 30% 40% 50%
Finland
Portugal - low
United Kingdom
Sweden
Portugal - high
Italy
Germany
Netherlands
Denmark
France
Austria
With Additional Measures
With Measures
VOCs (% of ceiling)
-20% -10% 0% 10% 20% 30% 40% 50% 60%
France
Sweden
Italy
Denmark
Finland
United Kingdom
Austria
Netherlands
Germany
Portugal - high
Portugal - low
With Additional measures
With Measures
NH3 (% of ceiling)
-25% -20% -15% -10% -5% 0% 5% 10% 15% 20% 25%
Austria
Portugal - low
Finland
United Kingdom
Portugal - high
Netherlands
Italy
Germany
France
Denmark
With Additional Measures
With Measures
NOxNOxSO2SO2
NH3NH3VOCVOC

25
• First reporting not timely, scattered and with varying level of detail
• With measures projections indicate that only two MS reach NEC ceilings for all pollutants
• The ceilings for NOx and NH3 are most problematic
• Few MS report envisaged additional measures
• Key socio-economic assumptions and uncertainties are seldom addressed and discussed
• Effects of reported PAMs are generally not quantified and interaction with other policies (e.g. CC policies) are often not addressed
Conclusions

26
Inventory Improvement Programme (IIP)TFEIP
CLRTAP/NEC Review 2004CLRTAP/NEC Review 2004
• Review to….• Establish Confidence• Focus Improvement• Improve Usefulness
• Review process….• Part of TFEIP IIP• Managed by EEA/EMEP• Annual Review• Quality & Compliance• Country Involvement• Report to EMEP & TFEIP
Use:
CAFÉIndicatorsPolicyTarget setting……
Recommendations
Impro
vem
en
t
Inventory Reporting
ReviewEEA/EMEP

27
Comparability:- Comparability:- How do emission Factors compare?How do emission Factors compare?
0
50000
100000
150000
200000
250000
300000
350000
0 500000 1000000 1500000 2000000 2500000
Activity Data
Em
issi
on D
ata
NLBE
DESE
2002 NMVOC 1A4b Residential Combustion

28
Recalculation:- Recalculation:- % Change between 2001 and 2002 inventories% Change between 2001 and 2002 inventories
NOxNOx EU15
New MS
29
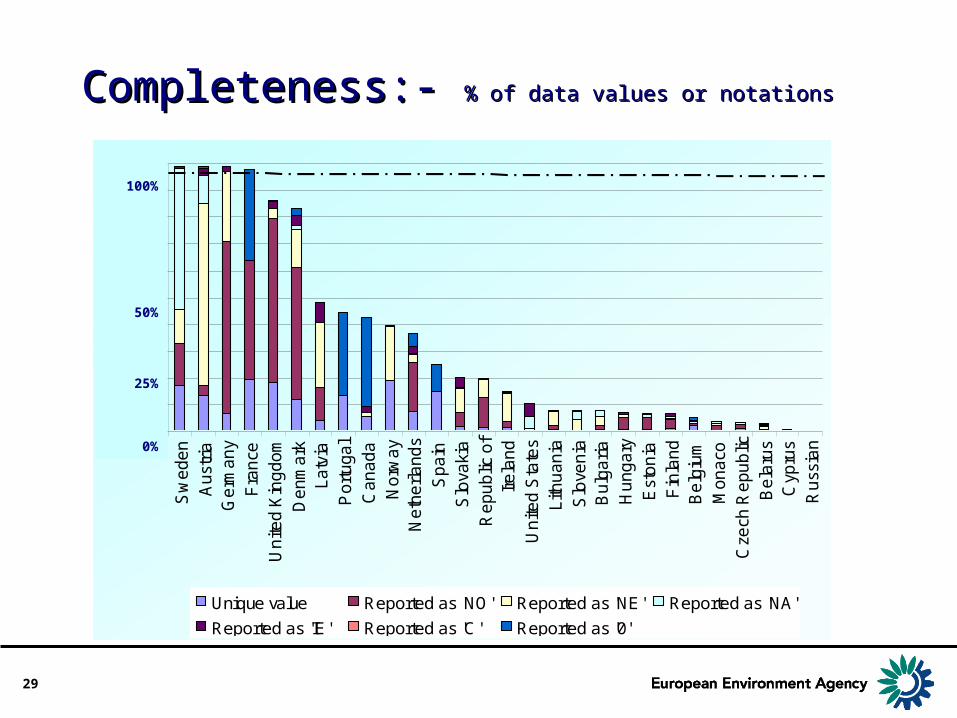
Completeness:- Completeness:- % of data values or notations% of data values or notations
0
5000
10000
15000
20000
25000
30000
35000
40000
45000
50000S
we
de
n
Au
stri
aG
erm
an
y
Fra
nce
Un
ited
Kin
gd
om
De
nm
ark
La
tvia
Po
rtu
ga
l
Ca
na
da
No
rwa
yN
eth
erl
an
ds
Sp
ain
Slo
vaki
a
Re
pu
blic
of
Ire
lan
d
Un
ited
Sta
tes
Lith
ua
nia
Slo
ven
iaB
ulg
ari
a
Hu
ng
ary
Est
on
ia
Fin
lan
dB
elg
ium
Mo
na
co
Cze
ch R
ep
ub
lic
Be
laru
sC
ypru
s
Ru
ssia
n
Unique value Reported as 'NO' Reported as 'NE' Reported as 'NA'
Reported as 'IE' Reported as 'C' Reported as '0'
100%
50%
25%
0%

30
Conclusions: Benefits of ReviewConclusions: Benefits of Review• Understand the limitations
Where are the gaps… Are they important?
• Improve quality of the data we use Identify problems & focus improvement
• Administrative e.g. Reporting
• Scientific e.g. Consistency, Comparability
– Research– Data Gathering– Guidelines
• Improve the quality of, and confidence in emission inventory based decisions

31
Draft recommendationsDraft recommendations
National Programmes• There is a need to clarify the level of detail on
reporting requirements and formats for projections as well PAMs.
• Any type of guidance for projections and PAMs should be consistent with the implementing provisions of EU GHG Monitoring Mechanism
Review process• There is a need to develop a formal framework
for strengthening review of emission inventories and projections under CAFE

32
Thank you for your attention!Thank you for your attention!

33
2.1
-7.8
-7.4
-4.8
-0.1
1.9
3.0
3.5
3.9
5.7
5.9
17.4
24.4
25.0
36.2
45.7
-20.0 -10.0 0.0 10.0 20.0 30.0 40.0 50.0 60.0
EU15
Germany
United Kingdom
Italy
Finland
Netherlands
Luxembourg
Denmark
Greece
Sweden
France
Belgium
Spain
Austria
Ireland
P ortugal
-21.9-47.7
-38.3
-38.2
-35.5
-32.0
-25.7
-23.4
-22.8
-14.6
-14.5
-13.3
-5.0
1.8
10.3
29.1
-50.0 -40.0 -30.0 -20.0 -10.0 0.0 10.0 20.0 30.0
EU15
Denmark
Luxembourg
Germany
Finland
Italy
Austria
United Kingdom
Sweden
Netherlands
France
Belgium
Greece
Spain
Ireland
P ortugal
-0.1
-11.7
-11.7
-7.8
-4.0
-3.9
-3.6
-2.6
-2.5
-0.1
3.3
3.6
4.3
7.1
7.4
21.6
-40.0 -30.0 -20.0 -10.0 0.0 10.0 20.0 30.0 40.0
EU15
Netherlands
Austria
United Kingdom
Sweden
Belgium
Germany
Finland
Greece
France
Denmark
Luxembourg
Italy
P ortugal
Ireland
Spain
-2.5
-17.1
-12.1
-11.1
-10.7
-10.6
-7.3
-4.4
-3.0
-0.7
2.5
3.8
5.8
9.3
25.1
55.8
-20.0 -10.0 0.0 10.0 20.0 30.0 40.0 50.0 60.0
EU15
United Kingdom
Germany
Luxembourg
Sweden
Netherlands
Finland
Italy
Austria
France
Denmark
Greece
Ireland
Belgium
Spain
P ortugal