the trader's edge, grant noble
TRANSCRIPT
I
On dieWinning
Strategies ofFloor Traders,
Commercials& Marketlnsite Grant IVoble
McGraw-HillNew York San Francisco Washington, D.C. Auckland Bogota
Caracas Lisbon London Madrid Mexico City MilanMontreal New Delhi San Juan Singapore
Sydney Tokyo Toronto
McGraw-HillA Division of The McGraw-Hitt Companies
© 1995, Richard D. Irwin, a Times Mirror Higher Education Group, Inc. company
ALL RIGHTS RESERVED. No part of this publication may be reproduced, stored ina retrieval system, or transmitted, in any form or by any means, electronic,mechanical, photocopying, recording, or otherwise, without the prior writtenpermission of the publisher and author.
This publication is designed to provide accurate and authoritative information inregard to the subject matter covered. It is sold with the understanding that the authorand the publisher are not engaged in rendering legal, accounting, or otherprofessional service.
ISBN 1-55738-599-8
Printed in the United States of America
BB
CTV/BJS
5 6 7 8 9 BRBBRB 97 9 8 7 6 5 4 3 2 1 0
To my wonderful wife.
This book would have never been completedwithout your patience and love.
Table of Contents
Introduction
Chapter 1
Chapter 2
Chapter 3
Chapter 4
Chapter 5
Chapter 6
Chapter 7
Chapter 8
Chapter 9
Chapter 10
Chapter 11
Chapter 12
Chapter 13
Chapter 14
Chapter 15
Index
vu
Why Every Investor Should LearnHow to Trade Futures
Your Greatest Enemy to SuccessfulInvestment
What the Floor Trader Knows
Sayings from the Floor
The Theory of the Opening
The Routine of the Market
Expected Range
Fib Times
A Short Introduction tothe Commercials
Reading Their Mail: The Commitmentof Traders Report
Spreads
Real-World Investing—It's Not "All in the Charts"
Analogous Year
Long-Term Cycles
The Media: The Best Trading Indicator
13
35
45
55
77
103
111
121
127
139
147
179
201
217
243
introduction
There are three main reasons why I wrote this book:
1. To tell the truth and nothing but the truth about futurestrading.
I've written articles for virtually every major futures-oriented publication, but it's become more and moredifficult for me to find a publication that will print ex-actly what I want to say. There's a lot of institutionpressure from brokers and vendors not to tell the aver-age futures trader about the mathematics of investing,etc.
2. To defend a lot of people in our industry (especially floortraders) who get a bum rap from the media and other financialprofessionals.
It's true most people lose money trading futures, but asI will point out in the next chapter, most people don'tmake money (after inflation, taxes, fees, etc.) in such safeinvestments as bonds and stocks. The major differenceis that in futures (thanks to the low margins), the badhabits of the average investor will just cause him to losemoney faster than he would in "safe" investments.
vll
introduction
The futures market actually is the fairest market for theaverage investor. An investor that has mastered his big-gest investment problem—emotional, lazy decisionmaking—will find the futures market gives him the bestrewards for the least effort of any investment vehicle.
3. Finally, I want to warn investors about the difficult investingenvironment that lies directly ahead.
Investors who assume the recent bull market in stocksand bonds will continue forever (with only a few smallinterruptions) are going to lose most of their assets thenext few years. Investors who rely on inflation hedgeslike precious metals and real estate will also be sorelydisappointed.
The only investors that are going to survive the nextfew years intact are those who can go long and short ina variety of markets with a relatively short investmenttime horizon time (six months at most). True, there willbe other vehicles (like options and other derivatives) thatcan accomplish many of the same things futures can. Butfor the average investor, futures will be the investinginstrument of choice. I believe this book has techniquesthat will be new to even experienced and sophisticatedfutures traders. But it's my fervent hope this book willbe the catalyst for thousands of average investors to takeoff the blinders, investigate the futures market, learnhow to trade it, and thus save their assets in the comingeconomic distress.
To this end, I've tried to write only about inexpensive andeasy-to-use trading techniques designed with the average inves-tor in mind. I've also tried to avoid techniques pushed in everymagazine and brokerage office. If you want to learn about RSI,Elliott Waves, etc., this is not the book for you. But if you wantthe trader's edge, the techniques used by the real winners infutures trading (floor traders, commercials, and financial insid-ers), read on.
Chapter one
Why Every investorShould Learn HOW to
Trade Futures
Stocks and Return on investment
Stockbrokers like to trot out the fact that common stocks havebeen the best investment vehicle this century. Supposedly theyhave generated better total returns (capital appreciation plus divi-dends) than gold, bonds, or even the average real estate invest-ment.
For the sake of argument, let's assume this fact is true. Let'sassume stocks are the best way to go among common investmentvehicles. Is this great return on common stocks all it's crackedup to be?
From February 1926 to February 1993 the S&P 500 averageda 10.4 percent total return (capital gains plus dividends). Aftersubtracting the 3.1 percent CPI inflation rate during this period,that's still a 7.3 percent return. A 7.3 percent real return willdouble your assets (even after inflation is factored out) in lessthan 10 years.
Chapter One
At this point the average investor might say, "Why shouldI worry about finding a successful trading method, especially inthe ultrarisky futures market, when 'hold-and-sweat' in thestock market will give me such a good average return?"
In the first place, this return assumes you had enoughmoney to buy all the stocks in the S&P 500. Round lots (100shares) of just the 30 Dow stocks is a big hunk of change (over$100,000 today at full margin). Index funds (which track a popu-lar average like the S&P 500) are a phenomena of only the lastfew decades.
If you couldn't buy the entire S&P 500 (or even the Dow)all at once, then you would have had to buy odd lots (less than100 shares), which would add greatly to your trading costs. Evenif you had the unusual psychological stamina to avoid marginbuying, ignore stock crashes, ride out many years of below-av-erage yields, and be satisfied with only an average return fromboring stock averages, a 7.3 percent return after inflation forhold-and-sweat is still deceptive.
As companies fell in and out of the S&P 500 (or the Dow),you would have to replace them, adding to your initial transac-tion costs. A1 percent total for all these costs (commissions andthe slippage of buying the asking price and selling the bid price)is very reasonable (especially when you consider the extra costof odd-lot trading). This would lower your total return from 10.4percent to 9.4 percent.
Estate taxes and income taxes have been high as 91 percent.About one-third of your 10.4 percent total return is in highlytaxed dividends, not capital gains. But let's use the current 28percent tax on capital gains as a very conservative estimate oftaxes. Taxes would further lower your return from 9.4 percentto 6.77 percent. Subtracting the average inflation rate of 3.1 per-cent would leave you a true return of only 3.67 percent.
Actually, there's many more mice eating your investmentcheese. Undoubtedly you invested more at market tops than atmarket bottoms, even if you were that one in a hundred thatavoided selling out at bottoms and doubling up at tops. Yourincome would naturally fluctuate with the economy (which
Learn How to Trade Futures
roughly parallels the stock market).At market bottoms, you would have less to invest. If you
were unemployed or the victim of an emergency (such as anoutbreak of war or a natural disaster), you may have had to sellyour stocks along with everyone else—right at the bottom. Overtime, this could cost you several percent points on your net totalreturn (after taxes and inflation) of 3.67 percent from the S&P500.
If you add a yearly fee (usually 1 to 2 percent) for a marketadviser to administer this strategy (do you think the managersof all those mutual funds you own are working for free?), themost determined hold-and-sweat strategy would probably gen-erate very small, or even negative, returns after taxes, inflation,commissions, financial emergencies, and fees!
In the 202 years of the New York Stock Exchange, we haveat least five multiyear periods where owning the average com-mon stock was a losing investment idea after inflation was fac-tored out (1807-1813, 1837-1859, 1907-1921, 1929-1949,1968-1982). In other words, about 43 percent of the time, stockshave been a long-term bear market where it was difficult if notimpossible to make money buying common stocks.
Even during the bullish periods, we have had heart-stop-ping corrections, crashes, or panics that tried the courage of themost determined investor—the inflation-adjusted correction of1862-1864, the panics of 1873, 1883, 1893, and 1903; the correc-tions of 1956-1957 and 1983-1984, and the crashes of 1962 and1987. How many of you sold all your stocks at the low in 1987?
At this point, I can hear some saying "I have a balancedportfolio of stocks, bonds, and precious metals. I am diversifiedenough to ride out any investing scenario."
Since 1920, we have had at least seven major periods wherenone of the usual investment vehicles—stocks, bonds, real estate,precious metals—rose in price (1920-1921, 1929-1932, 1941-1942,1946-1949,1968-1970,1980-1981,1983-1984). Over the last75 years, about 15 percent of the time nothing conventionalworks (later on I will try to show why I feel we are on the vergeof another no-win period).
Chapter one
Stocks & Options versus Futures
The fact is, any investor who can't go short and take advantageof falling prices is really living in a fool's paradise of diversifica-tion. The unlimited risk of short-selling is only a problem fortraders that refuse to limit their losses, violate the mathematicsof investment (see the next chapter), and would end up a long-term loser any way. It's the futures market's unsurpassed abilityto go both long and short that is the main (but not the only reason)why futures are the premier investment vehicle of the mid- tolate 1990s.
I once worked with a gentleman I'll call "Sandy," whomanaged millions of dollars during the great stock bear marketof 1973-1974. In a severe bear market, it's very hard to sell a lotof stock on an uptick, as required by stock exchange rules foranyone who isn't a specialist. Sandy described all the maneuvershe had to go through to get off a simple stock short sale. Inessence, he had to buy enough stock so he could get an uptickto sell even more stock at a higher price.
During the go-go days of the 1980s, this uptick rule waswaived for program traders that sold baskets of stocks againstpositions in the futures market. During the Crash of 1987, thesetraders dumped stocks without ceasing. Even sophisticated trad-ers like Sandy could not find an uptick to go short!
This loophole has since been closed, but one fact still stands.It's very difficult for the average stock trader to go short in abear market. In any market condition, a stock short-seller mustkeep a balance equivalent to the cost of the stock he is shorting,which is a heavy burden in interest or opportunity costs (unlikethe futures market where he earns interest on the money he putup for margin).
Of course, investors can use options (puts) to go short. Andthe average investor is usually delighted to find out he can onlylose what he puts up when he buys an option. Since the majorityof options expire worthless, this is often a dubious advantage. Ihave read statistics that over 90 percent of options lose moneyfrom the time they are put on until the time they are offset (or
Learn How to Trade Futures
expire worthless). That's even worse than the 80-85 percentlosing ratio shown by academic studies of futures traders.
Unlike futures, the option premium (the difference betweenthe price of the option and the underlying security) usuallyincreases with volatility. When a market becomes a bear market,the cost of buying a put option increases. In a bear market infutures, normally you have a negative carry charge marketwhere the futures price is higher than the underlying cash mar-ket. You get paid to go short (i.e., if there is no change in thecash price, eventually the futures price will converge with thecash price by going lower).
In any case, any premium (the difference between futuresand cash prices, known as basis) that exists in futures is only onone side of the trade. If the futures price is below that of cash(as in interest rate futures), this positive carry charge benefitsthe buyer just as much as it disadvantages the seller (the reverseof the example above). But whether you buy a put or a call, orwhether you wish to go long or short a market in options, youwill pay a premium on either side of the transaction. You loseeither way you go.
Unlike a stock, you don't get dividends (or interest on yourmargin money as in futures) on an option. Option commissionstend be much higher proportionally than futures. (Discountcommissions of $35 are normal on a 100-share option of a secu-rity worth $3,000-$5,000. Contrast that with the normal $25 dis-count commission on a futures contract, which can control upto $250,000 in equivalent cash assets.)
Perhaps the only advantage of options over futures is theability to make money if there is no change in the market. Pro-fessionals often put on strangles (simultaneous selling of anout-of-the-money call and put) and collect the premium on bothsides if the underlying market doesn't make a major move. (Themajority of time markets are in easily defined trading rangemarkets.)
But even this option advantage is better used with optionson futures rather than options on individual stocks. The dirtylittle secret of the stock market is that it is far more volatile and
Chapter One
far less predictable than soybeans, cattle, copper, and other tra-ditional futures contracts.
There are many academic studies that prove this fact, butyou really don't need to be an academic to figure this out. Indi-vidual stocks that double in price or lose 50 percent of their valuein a day are a relatively common occurrence. This type of actionis a once-in-a-lifetime occurrence in futures (I can't think of asingle example off the top of my head).
In October 1987, the S&P 500 future lost 45 percent of itsvalue in 13 days of trading. The most spectacular commoditycrashes—soybeans in June 1973, cattle in August 1973, sugar inNovember 1974, silver in January 1980, and crude oil in January1986—all took about three times as long to travel the same dis-tance (a 45 percent collapse).
The reputation for volatility in futures is strictly a functionof its low margin requirements. A 5 percent move in a stock from20 to 21 would only draw a yawn. A 5 percent move in corn(from $2.00 to $2.10 a bushel) is a $500 move approximately equalto the usual margin on corn.
Not only is the stock market more volatile, it's volatility isless predictable than futures. Mergers (or the sudden failure ofa merger), preliminary earnings reports, the comments of cor-porate officials and politicians—all these bolts from the blue cancause a stock to double or lose half its value. Totally unexpectedevents in futures (like the Russian coup, Chernobyl, etc.) are farmore rare and, in any case, hardly ever have the same impact ofstock shocks.
A freeze in Brazil can cause coffee prices to triple, but weknow that will only occur in "our summertime." An orange juicefreeze or soybean drought can cause prices to explode, but theseevents can only come at regular intervals, which can be easilyanticipated.
Even regular reports are not so regular in the stock market.Earnings reports can be shifted around in an unexpected manner.Highly touted announcements or press conferences can myste-riously disappear or be rescheduled. Over the last decade, we haveseen key reports shift around with the latest investment fad.
Learn How to Trade Futures
In the 1960s, it was earnings. In the 1970s, it was the moneysupply. In the 1980s, it was the trade deficit. In the 1990s, it's theunemployment report. I don't know what the next critical gov-ernment report will be in the next decade, but I do know the PigCrop Report, the USDA crop conditions as of July 1, etc., willbasically have the same influence over futures prices tomorrowas they do now. If you are going to use options, it makes senseto use them in the (relatively) regular world of futures ratherthan the wacky world of individual stocks.
There is a slight tax advantage (thanks to the latest Clintontax increase) in holding cash assets (such as stocks and preciousmetals) for a capital gain, which you can't do in futures or otherderivatives like options. But capital gains tax breaks can be takenaway at any time (as they were in the 1986 tax "reform"). Andin order to take advantage of a lower capital gains rate, you needa bull market—which as we've seen only occurs about half thetime in stocks. Many investors have seen a winning investmentturn into a loser while waiting for the proper time to take acapital gain.
Virtually every investment vehicle outside of futures de-pends on a market maker or specialist. A market maker or spe-cialist has tremendous advantages over those media demons,futures floor traders, who supposedly make sure no investor canpossibly win trading futures.
A market maker can declare an order imbalance and simplyshut down trading in an option or a stock. No single pit tradercan do that to a future. A floor trader only knows the bid/askshe sees in open outcry in the pit. An order filler may have 1,000contracts to sell, but he doesn't have to show them all by openoutcry in the pit. He can sell them off 50 or 100 contracts at atime until he has sold them all.
By contrast, anyone who wants to sell stock at a specifiedprice must register his order in the specialist's book. In otherwords, unless a stock trader wants to play "hot potato" byconstantly juggling his order size, he gives up any chance ofkeeping his order size a secret.
As Sandy explained it to me, the specialist (or his friends)
Chapter One
are not above stepping in front of a large order by selling a tickor two below this large order. This is supposed to be against therules; however, wherever you have insider monopolies (ratherthan the free market of an open outcry auction), you are goingto have these eternal problems of human nature.
Did you know that no futures trader has ever lost moneydue to the failure of a clearing member of the Board of Trade orthe Chicago Mercantile Exchange? The New York Stock Ex-change can't say that—which is why there is now stock insuranceto protect against bankruptcy in stock firms. The clearing systemof futures is inherently safer than the system in place for stocks.
Much has been made of the zero sum game of futures, i.e,for every short there is a long, for every winner there is an equaland opposite loser. (Often the loser is a perfectly content hedgerwho has already locked up a profitable price.) However, thiszero sum game aspect of futures has an unexpected bonus in afinancial crisis.
Let's use the latest shock in futures as an example. Over theweekend of June 28-29,1994, a freeze struck Brazil's coffee fields.Coffee opened almost 40 cents higher on Monday's openingfrom Friday's close—a price move of over 30 percent, or $15,000per futures contract.
Since the minimum margin for one coffee contract wasaround $3,000 at the time, it would appear the clearing firmguaranteeing this trade and hundreds of others might be introuble if the losers reneged and refused to post extra margin orpay their losses. But even if we assume there was no extra moneyin the losers' accounts (very unlikely) and they refused to sendany more money to cover their losses (another unlikely event),the clearing firm is still far from getting into trouble.
Say the clearing firm has a total of 250 short coffee contractsand 200 long coffee contracts on its books before the freeze, ornet short 50 contracts. Fifty times $15,000 is $750,000, which isfar less than the $1.25 million (450 x $3,000) it has on accountfor customer margin.
8
Learn How to Trade Futures
You can see it is very difficult for a futures clearing firmthat is clearing accounts from a wide variety of customers to gobroke. Only gross overspeculation by its principals could causesuch a problem.
(If a clearing firm's owners were net short hundreds ofcontracts of coffee before the freeze, and if that position repre-sented the overwhelming majority of their assets, then conceiv-ably that clearing firm could go broke. In that case, thecommodity clearing corporation of that exchange would guar-antee the trades and seize whatever assets the firm and its prin-cipals had left. All customer positions and money then wouldbe transferred to solvent clearing firms. This has happened onlyonce in Chicago during the two decades of my experience.)
By contrast, even a "prudent" stock firm could go broke ina meltdown similar to the 1987 crash. A stock investor only hasto put up 50 percent margin to purchase a stock, 35 percent tomaintain that position. A 45 percent collapse in two weeks (likethat which occurred in 1987) could bring a client's balance tonegative territory. If that firm's investors were speculating inbonds and other securities that can be purchased for 10 percentmargin or less, it could be only a matter of hours before they arein the firm's pocket, so to speak.
The billions in losses racked up banks and brokerage houseduring the bear market in bonds in 1994 is just the tip of theiceberg of what could happen in a crisis. Through October 1994,the bond market had dropped 15 percent for the year. In a crisisatmosphere, where bonds could go down 50 percent in a fewmonths, there could be trillions in losses.
Yes, stock options are cleared basically the same way asfutures in that both the seller and buyer of the option (and theirrespective clearing firms) guarantee that trade. But the clearingof stock options is far more concentrated in a handful of firmsthan is futures. It's far more likely the whole stock option clear-ing system will fail in a 1987-type meltdown than hundreds ofclearing firms, which specialize in clearing futures as uncon-nected as cattle and bonds.
Chapter one
Finally, the futures clearing corporations (to which all fu-tures clearing firms belong) have been in existence for up to 150years (versus the 20+ years of the option clearing corporations).They have had a far longer time to accumulate assets (throughclearing fees charged on every futures trade). These assets arefar in excess of the miniscule amount of assets that backs theinsurance that "guarantees" stock trading.
As Will Rogers used to say, "I am more concerned aboutthe return of my money than the return on my money." In termsof a potential financial crisis, I think we can safely say the federalgovernment is more likely to renege on its debt than the clearingcorporations of the futures market fail to make good on trans-ferring money from futures losers to futures winners.
For smaller investors, the low cost of entry and the ease oftrue diversification may be a great advantage. For $10,000, youcan have a balanced portfolio among the six trillion-dollar mar-kets—metals, currencies, interest rates, agriculturals, crude com-plex, and stocks (through options on index stock futures), while$10,000 won't buy you even a round lot (100 shares) of a Dowstock like Caterpillar at today's prices.
The price of individual stocks are far more correlated thanthe futures prices, i.e., the price of IBM, GM, and Disney are farmore likely to rise and fall together than the price of cattle, silver,and T-bonds. Even the price of gold stocks are far more tied tothe rise and fall of the overall valuation of the stock market thanthe rise and fall of the Consumer Price Index!
True, to achieve diversification among the six trillion-dollarmarkets with a $10,000 futures account you may have to controlthe futures equivalent of $150,000 in cash assets. But because ofthe more negative correlation of futures markets, plus less vola-tility and chance of negative surprises, the real risk may not beall that much greater than an equivalent amount of marginedstocks ... and you don't have to put up $75,000 (50 percent)!
From every rational perspective, the futures market is abetter deal, especially for small investors. As I have stated before,all the low margins of the futures market do is speed up the
Learn How to Trade Futures
losing investment process of the average investor. The next chap-ter will discuss the real reasons why 85 percent of futures traderslose. They are the same reasons why 85 percent of stock investorsunderperform the market averages (which, as we have seen,barely keep up with inflation after expenses and taxes).
11
Chapter Two
Your Greatest Enemyto Successfulinvestment
The following is a reprint of an old article I wrote called "TheGreat Con Game." This article was written specifically for futuresbut its principles apply to every field of investing. There is nomagic formula in any market that can turn you into an instantmillionaire. If you are determined to believe that, nothing I sayis going to help you.
* * *The Great Con Game1
"/ was a commodity loser until I discovered I couldn'tbelieve my results..." "To pay my costs, only a select few...""There will be no second chance, so send money fast..."
If you wonder about these "perfect systems," consider thelaw of compound interest. Recently, a system advertised a
1 Grant Noble, "The Great Con Game," Futures (Nov. 1985), Copyright 1985 byCommodities Magazine, Inc., 218 Parkade, Cedar Falls, IA 50613)
Chapter TWO
2,100 percent return in two years or double your money infive-and-a-half months. Assume it works and its inventorsells 200 of these systems for $1,000 each. Also assume eachbuyer invests $10,000. With the inventor's $200,000, that's$2.2 million total equity.
After five-and-a-half months, every account has dou-bled. Then greed takes over. Old investors get 10 new ones,some as "fund managers." Others use copiers. In less thana year, the system has $50 million total equity—a sum im-possible to invest without market distortions.
In short, anyone bright enough to invent a system thatperforms in every market and time period would neverjeopardize it by selling it to the public. He can make far moreby trading it for himself and his clients.
"Holy Grail" BoundMost traders realize you can't buy a perfect system, but theystill believe it exists. There are three main sources of thismyth: (1) returns from simple trend-following methods, (2)track records, and (3) experts promoting the latest technicalfad.
When I worked for a Midwest stock firm, an Easterncomputer expert impressed the bigwigs with his real-timerecord. A few calculations showed a simple trend-followingmethod would have returned more over the same period.Another source of the perfect system myth is the spectacularbut brief track record. A famous technical trader wrote howhe made a million. Unfortunately, he went into a losingperiod soon afterward. Had he continued to sustain thereturns shown in his book, it's unlikely he would still hegiving seminars.
Consider these system cliches:
* "The trend is your friend." Nine of 10 commodities arenot trending at any given time. When they breakout,simple trend-following methods will catch it as well asmost systems.
Your Greatest Enemy
# "Risk a dollar to make four." Contrary to what you read,most traders have the discipline to follow their system.Unfortunately, because most commodities are trendless,the four-dollar profit simply is not there. Many systemtraders are risking a dollar to make 50 cents (after fees,commissions, etc.).
# "Don't put all your eggs into one basket." Why are theremore rich scalpers and pyramiders than system traders?Because it's easier to spot a big move if you concentrateon a few markets. Because nine of ten commodities aretrendless, a system trader must diversify to ride out thelong time between winners.
* "The close is the number." Most price movement occurswithin an hour of the opening. Long before the computerfunds mangle the close to "catch the trend," smart tradersare well-positioned for the next day.
* "It's all in the numbers." There are 27 major commodities,at least a dozen major trading methods, several indicatorsper method, and at least three signals per indicator (long,short, or neutral). To expect any system to handle all theseis like asking a computer to write a Mozart symphony.
In the end, nothing can take the place of a trader analyzingand combining all the data into his own winning pattern.For most of us, this takes years of hard work and sometimesunprofitable trading.No wonder the "perfect system" con game flourishes! Thepublic in its lazy greed wants a quick way to a million. Andit can always find "experts" to sell it what it wants.
* * *I honestly believe futures trading is the best opportunity forthe average investor, and the techniques I will describe later on aresome of the best you can use in trading futures. But it is still true:Nothing can take the place of a trader analyzing and combiningall the data into his own winning pattern. You can attempt to applyevery concept written in this book and still lose.
Chapter TWO
Why? Because the biggest trading problem you face is nothigh commissions, lousy fills, insider trading, lack of informa-tion, bad advice from your broker, discovering the secret of the(trading) universe, or finding the next Warren Buffet. It's you. Y,O, U, YOU! Your emotions, hidden psychological problems, andpreconceived notions are your greatest enemies whether youtrade stocks, bonds, options, futures, real estate, precious metals,or what have you.
As Richard Dennis, one of the foremost trading legends ofour time, put it: "I always say that you could publish (my)trading rules in the newspaper and no would follow them. Thekey is consistency and discipline. Almost anybody can make upa list of rules that are 80 percent as good as what (I) taught."2
I was a futures broker for six years. Since then I've talkedwith dozens of investment professionals. Not one of them men-tioned a client coming to them and saying, "After long study, "Ibelieve these trading principles are the key to success and I wantyou to help me use them in your area of expertise." Instead,investors always seem to fall into the following four basic cate-gories.
What's Hot or Who's Hot?
This type thinks a specific area (stocks, bonds, futures, real estate,precious metals, etc.) or a specific adviser/broker is his ticket tosuccess. He is another victim of what I call track recorditis.
Suppose I told you the absolutely true, verifiable fact thatI made over 500 percent in a two-week period trading futures.Sounds impressive, doesn't it?
But this fact doesn't tell you how I made this 500 percent.It was during the October 1987 stock crash, a time of unprece-dented volatility. I stumbled into the profitable side of copper inthe beginning and afterwards was able to take advantage of theobvious distortions the stock crash generated in all the otherfutures markets. As I look back on it now, I really didn't know
2 Jack Schwager, Market Wizards (New York: Simon & Schuster, 1989), 86.
Your Greatest Enemy
what I was doing, and I was very blessed not to be 500 percentin the hole instead.
Virtually all the stockbrokers working today have never ex-perienced a major bear market like that of 1973-74. What are theygoing to recommend if we repeat the 1973-74 experience? The vastmajority of mutual funds weren't around 20 years ago. What goodwill all those great track records be in a 1974 type of environment?
Even if a fabulous track record is not fraudulent, the resultof chance, or a massive, once-in-a-generation trend, there are atleast two other factors that can make it irrelevant.
First of all, every investment vehicle has dull times whenno strategy can make money. If you (or your expert) do notunderstand this and concentrate only in one area of expertise,you could be very disappointed. More trading fortunes havebeen built on soybeans than any other commodity I know. Yetin 1985 and 1986, soybean prices moved so little traders wereleaving the soybean pits in frustration.
Secondly, even the best traders or advisers choke whengiven too much money. As assets grow arithmetically, the accom-panying psychological and asset allocation problems grow geo-metrically. Many trading geniuses like Arthur Cutten and JesseLivermore made millions only to lose at the end. Success wentto their heads and they began to disregard the very rules thatmade them a success in the first place. Like most beginninginvestors, they began to believe it was their great genius, nottheir great money management, that made them winners. Any-one who relies solely on track records to make his investmentdecisions is bound to be disappointed in the end.
I've Found (invented) This Surefire System
The finest minds in the country are not the heads of governmentor big corporations. They are not even on university campuses.The best brains in the world are trying to figure out where stocks,bonds, gold, etc., are going to be tomorrow morning.
Chapter TWO
My friend Neal Weintraub runs the "Tricks of the Trader"futures trading seminars in Chicago. Everyone who attends hasto go through the libraries of the Board of Trade and the Mer-cantile Exchange. Neal loves to point out that virtually everybook, system, newsletter, or seminar published about futurestrading ends up on these shelves long before the public knowsabout them. Even those methods "restricted to the first hundredwho pay" get passed around exchanges very quickly, thanks toour local copy machines.
Maybe you are that one in a million that has found some-thing truly original in investing. However, like the Chinese whoinvented gun powder but didn't know how to use it, you canstill lose in the stressful world of trading. It's better to masterthe simple laws of trading first and find that breakthrough later.
I'm on the Ground Floor of a Great idea
Of all the things that seduce the average investor, concept invest-ing is the worst. Yes, I know Peter Lynch says that you have abetter chance than he does of finding the next Xerox or Wal-Mart.That may be true, but it is also true that Peter has a much betterchance of benefiting from the next Xerox or Wal-Mart.
Let's say you find a company, commodity, option, etc., thatdoubles your investment in a short time. If you are the typicalinvestor, you will do one of two things. You will sell your entireposition and brag about the profits at the country club. Or youwill put most of your life savings in it.
Inevitably, your next Xerox has a small fall in price. Becauseyou've invested most of your money at higher prices, this fallcauses you to lose money, panic, and sell just before the next bigrise. In either case, you aren't really going to cash in on the nextXerox.
A Peter Lynch will start tracking your hot company as soonas it becomes public. He may miss the initial surge, but his capitaland trading techniques will take advantage of the rest of the move.
Your Greatest Enemy
Or take the "gold bugs." They were absolutely right incondemning paper money and predicting higher precious metalprices in the 1970s. But how many actually took advantage ofthe big moves? How many threw away what little profits theymade by buying high-priced metals in the early 1980s? It's beenmy experience that only one gold bug in a hundred has made abetter than average return over the last twenty years.
Creativity or intelligence has no more to do with successfultrading than it does with a successful business. Both need suffi-cient capital, a well-thought-out plan of operation, and, most ofall, the humility to copy those who were successful before you.
True, the greatest traders, like the greatest businessmen,also have creativity and intelligence to go along with elementarytrading techniques. But like their business counterparts, oftenthey had to unlearn all they knew before they could really startto succeed. Only when market humiliations forced them to fol-low the "simple" laws of investing could they begin to use theirgreat talents in the markets.
That's why the ranks of great traders are filled with manycollege dropouts and very few Ph.D.'s. That's why, like mostnew businesses, most new investors fail. Their investments failto keep up with market averages or even inflation. Their returnsnever justify their opportunity costs in time and treasure. Sadly,the record of new investors is even more dismal than new busi-nesses due to this next and last type of investor.
Where's the Action?
Few start a business to satisfy an urge for excitement and risk.Unfortunately, a casino mentality controls a large segment ofinvestors. As lottery fever grips our society, more and more in-vestors are looking for that easy way to millions. Often they keepplaying the market until the money runs out.
This craving for action infects even professionals. Manycan't take a vacation without keeping a quote machine and a
Chapter Two
phone by their side. Many continue to trade even when theshrinking bottom line is screaming, "Stop! Take time out." Forevery trader who had the courage to quit the business when helost his touch, there are a dozen other megatraders that contin-ued to trade themselves into oblivion.
Ninenty-nine percent of investors that walk into a broker'soffice fall into one of these four categories. Even the most honest,skilled, and persuasive broker is going to have a hard timeconvincing these investors to change their losing ways. Thattakes time, time the average investor doesn't have because of theMathematics of Investing.
Mathematics of investing
What do you get when you initiate a trade in stocks, bonds,futures, options, precious metals, or any other investment? Aninstant loss!
Everyone understands commissions, but not every under-stands the bid/ask spread. Any trader who isn't a specialist ora pit trader is always going to pay a premium to get in and apremium to get out. He pays the asking price to buy and the bidprice to sell.
Let's say our trader is trading S&P 500 futures. Presentlythe asking price is 450.10 while the bid price is 450.05. If he goesto buy this future, he will pay 450.10. If he goes to sell the future,he will get 450.05. Even if the S&P 500 market remains absolutelythe same, our trader will be forced to lose not only his commis-sion but the difference between 450.10 and 450.05 or $25 percontract plus commission.
In our example, we assumed the bid/ask spread was onlya minimum fluctuation, or one tick. In the real trading world ofstop-loss selling, fast markets, and wild openings and closes, thebid/ask is often more than one tick even in the most liquidmarkets. Let's say the average bid/ask spread is two ticks, or$50 in the S&P 500 futures market. Let's further assume commis-sions of $25 for a completed buy and sell. If a trader daytrades
Your Greatest Enemy
just one S&P 500 futures contract each day, that would be about$18,000 ($75 x 240 days) a year in trading expenses (commissionplus bid/ask slippage) before any winnings are collected.
If you add in the $750 a month the average trader spendsfor computerized, real-time futures quotes and other informa-tion, you can see why someone with the average $10,000daytrading account must nearly quadruple his initial investmentjust to cover trading expenses.
But let's assume that this slippage factor of bid/ask tradingplus commissions has been taken care of in our tale of HumbleHarry versus Trader Tom.
Humble Harry versus Trader TomTrader Tom has developed his own ultrasophisticated, personal-ized system that makes an honest-to-God 200 percent a yeartrading futures. Tom spends all his time trading. His normalliving expenses are $3,000 a month plus another $1,000 a monthto pay for real-time quotes, software, computer depreciation,books, seminars, etc.
Humble Harry uses a simple moving average system thatmakes 40 percent a year. Harry looks at yesterday's futures pricesand puts his orders in at the beginning of the trading day. Harrydoesn't need to look at a quote screen all day, so he worksanother job that pays him $4,000 a month, of which $3,000 goestoward his expenses with the final $1,000 plowed back eachmonth into his trading account. Both Harry and Tom start witha $100,000 trading account.
Harry gets a 2 percent gain the first month, a 1 percent lossthe second month followed by monthly gains of 3 percent, 0percent, 4 percent, 5 percent, 6 percent, 4 percent, 4 percent, 3percent, 4 percent and .4 percent for an average return of 40percent. Tom's monthly totals are -20 percent, -10 percent, 0, 0,20 percent, 20 percent, 20 percent, -10 percent, 0, 30 percent, 40percent, 47 percent or a 200 percent yearly return. Because Tomtrades all the time, he goes for the lowest commission rate andtherefore doesn't get T-bill interest on his account balances.
Chapter Two
Harry gets the float of .5 percent a month on his account.At year's end, Harry's account has $162,356.40 while Trader
Tom has only $160,094.45. Tom is on his way to ulcers whileHarry sleeps like a baby every night.
Sure, I stacked the deck a little bit. I had Tom's winningscome late in the year after expenses and losses had eaten awayhis equity down to $56,400 in the fourth month of trading. AndHarry's 40 percent using a simple moving average may be a trifleabove average. But on the whole, these figures are in the ballpark.
In real life, the average Tom wouldn't have gone on withhis system after his big losses in the first and second month ofhis trading. The Psychological Law of 10/20 Percent would havetaken over.
The Psychological Law of 10/20 PercentWhenever anything (except normal living expenses) takes morethan 10 percent of our income or savings, we become annoyed.This law of humanity is as old as the tithe or the agent's 10percent. When this expense or loss reaches over 20 percent of ourincome or savings, we become irate and spend most of our sparetime figuring out how to avoid this expense or loss.
That's why the totally oppressed Egyptian peasant andMedieval serf rarely paid more than 20 percent of their incometo their landlords.
Societies forced to pay more than 20 percent of their incomein taxes, which doesn't come back in the form of some govern-ment entitlement, inevitably have tax revolts, go into economiccollapse, or are forced to tolerate a huge underground economythat effectively lowers the tax rate.
It's no accident that the percent of federal taxes paid by theaverage American has been stable at 19 percent of income forthe past three decades. The total U.S. tax rate from all sources(state, federal, municipal) is around 42 percent, but when youadd in unfunded mandates plus the cost of filling out forms (likethe 1040) and the deficit, the real rate is closer to 50 percent.
Your Greatest Enemy
But direct disbursements (like entitlements, subsidies, etc.)brings that figure down to 20 percent. Politicians instinctivelyknow that this is all they can get away with (at least until re-cently). In Italy, high tax rates have created an undergroundeconomy almost equal to the official economy.
My most vivid lesson in the 10/20 rule was managingmoney. I started with a $10,000 account and tripled it to $30,000.I took a management fee of 25 percent of the profits, sent myclient's original $10,000 home, and started to trade again withthe remaining $15,000.
Unfortunately, the account then fell 33 percent to $10,000.My client withdrew all his money to trade it for himself. It didn'tmatter he was still 100 percent ahead. I had taken a loss greaterthan 20 percent and so he lost confidence. (He later lost whatwas left trading the account himself).
Let's say a trading system is right 60 percent of the time (avery good average in the real world). In a perfectly randomworld, the chances of this system losing 10 trades in a row wouldbe one in a thousand. But trading is not random, and tradingsystems (and traders) can blow hot and cold for extended peri-ods of time.
If 25 percent of the time the system was right 90 percent,50 percent of the time it was right 60 percent, and 25 percent ofthe time it was right 30 percent, that would average out to 60percent for a given time period. But during the 30 percent correctperiod, there would a 2.83 percent chance of losing 10 in a row.If this 30 percent period is extended over 250 trades in a three-month period, the odds are 50/50 this system will see 10 losingtrades in a row, despite its yearly average of a 60 percent winningratio.
If you are risking 1 percent of your trading equity on eachtrade, 10 losses in a row isn't likely to shatter your confidencein a normally successful system. But if you are risking 3 percentof your equity on each trade, the resulting 27 percent loss after10 losing trades could cause you to abandon the system or stoptrading all together.
Chapter Two
Now let's go back to our S&P 500 daytrader with $10,000.Let's say his system is right on average 60 percent, but with thefluctuating winning percentages described above. This systemwins $300 and loses $125 on an average trade. However, slippagedue to commissions and the bid/ask spread causes an extra $75loss on both ends, raising the average loss to $200 and cuttingthe average winner to $225. Our one-trade-per-day daytradermakes only a few thousand more than his $9,000-a-year over-head ($750 a month for quotes, seminars, newsletters, etc.).
If this daytrader began to trade three times a day insteadof once, theoretically he would make another $23,400 a year ifhis system continued to perform at 60 percent. But what if heincreases trading just when the system is entering the 30 percentwinning mode? Over a four-month period of 250 trades, he hasa 50/50 chance of losing 10 times in a row and taking a $2,000loss on a $10,000 starting account. This will probably cause ourtrader to abandon his system just when it is ready for big gains.
In actuality, it's a very rare futures speculator who doesn'trisk more than 1 percent of his equity on a trade. When I was abroker, risking $500, a $1,000, or even $2,000 on a $10,000 accountwas routine for many of my customers.
The average investor violates the 10/20 percent factor allthe time. He routinely puts more than 20 percent of his equityin one stock, one futures contract, etc. With most of his eggs invery few baskets, he becomes liable to jettison any trading planand trade very emotionally.
These investors begin to track that particular future or stocktick for tick, becoming totally mesmerized. They refuse to takeprofits ("Just a little more and I'm a millionaire") or losses ("It'llcome back") at the appropriate time. These overcommitted in-vestors become oblivious to their danger or to investment op-portunities elsewhere.
However, there is another psychological law that probablycauses even more investment losses than the 10/20 Percent Law.I call it the 3/21-Day Memory Law.
Your Greatest Enemy
The 3/21-Day Memory LawScientific studies have shown that humans lose about 80 per-cent of what they learned within three days of having firstlearned it. Afterwards this memory loss continues graduallyuntil about the 21st day where it stabilizes at about 3 percentpermanent memory.
This 3/21-Day Memory Law has many implications forinvestment strategies, which I will discuss in later chapters. Butby far the biggest implication of the 3/21-Day Memory Law isa psychological one.
Ask any professional trader what is his toughest day wasand he'll say, "The day after the market has beaten my brainsin." The painful memory of one bad trading day can causemarket paralysis or erratic trading for up to three weeks. Unlessyou are thoroughly convinced of the validity of your tradingmethods, you will be sorely tempted to drop out of trading orat least "modify" your methods to "prevent further losses."
On the other hand, the worst trading I ever saw as a brokerwas after a spectacular winning day by a client. As a broker, Ifelt the best thing for the average client was to take a few (small)losses in the beginning to gain humility and respect toward themarkets. Novice traders that won in the beginning went out ofcontrol in the end, sometimes losing more than their initial in-vestment.
Floor traders or specialists who trade on the exchange floorhave many advantages over public traders: a bigger capital base,a far lower cost of market entry, the ability to see the entire flowof orders, etc. But I honestly believe their greatest advantage isthat their trading style rarely runs afoul of the 3/21-Day MemoryLaw.
Trading hundreds of times in a three-day period on theexchange, floor traders may experience a spectacular winningperiod, but it's very likely they will also experience a losingperiod that will splash cold water on their "I'm-a-trading-gen-ius-that-can-do-no-wrong" fantasies. Losing periods, on the
Chapter TWO
other hand, rarely extend for more than one day.Over a 21-day period, a floor trader or exchange specialist
will make enough trades to experience (at least on a small scale)virtually every trading outcome known. Even during years oflow volatility or traditional seasonal slowdowns (like holidayperiods), he is never bored for weeks on end. The average publictrader is very tempted during these slow times to overtradebecause every few days, he needs to feel the jolt, the excitementof trading the markets. With a $45 loss built into every trade,that's a proscription for disaster.
Fear (after losing), greed (after winning), boredom (leadingto no-chance trading), and ignorance (of the mathematics andpsychology of trading) are the Four Horsemen of the Apocalypsefor traders. Unless you conquer them, nothing in this book isgoing to help you make money.
Finding a Guru: No Investing Panacea
What about those hot shot market advisers you read about? Is itpossible to find someone who could manage your money andconsistently beat the market averages in stocks and beat a simplemoving average system in futures (after expenses)? Yes, but it'snot very likely.
1. You have to find this adviser before the rest of the worldfinds out about him and makes it impossible for him tosustain those big returns (especially after those heftyfees). There's also a very real chance he could crackunder the strain of managing megamillions.
2. You must avoid "track recorditis" and find someone thatcan really deliver a superior performance over time in allsorts of markets. An adviser who can only generate above-average returns in a bull market is positively dangerous.
In any case, the more you know how to trade, the betteryou can separate the wheat from the chaff among outside moneymanagers.
Your Greatest Enemy
Your Psychological Profile:Can You Stand the Dull World of
Winning Futures Trading?
If you trade 100 times a year and it costs (on average) a minimumof $45 to enter the futures market on any one trade, you will haveto generate $4,500 a year in trading profits (by correctly guessingthe direction of the market) just to break even. That's a 45 percentreturn on a $10,000 futures account! That brings me to Dull-but-Successful Trading Rule #1:
1. Never spend more on trading expense and overhead than yourfutures account will take in T-bill interest.
A $100,000 futures account opened today will generateabout $4,000 in interest (assuming the standard payoutrate of 90 percent of today's T-bill interest of around 4.5percent). If you spend $100 a month on quotes and re-search, that leaves you $2,800 or about five trades amonth (60 x $45) for trading expenses.
Five trades a month from a $100,000 account woulddrive the average futures broker up a wall in frustration.The system gurus who claim returns of 100-200 percenta year would sneer. But here's why the average investorin futures must follow this rule as closely as possible.
If your total trading expenses (commission, bid/askslippage, overhead) are going to exceed your guaranteedinterest income, you make it far more likely that you willsuffer a drawdown during trading that will exceed 10percent or even 20 percent of a period's starting equity.Unless you've experienced the strain of this type of draw-down, you will never understand the enormous tempta-tion to make emotional decisions (by overtrading orwithdrawing into a shell) that ruin trading performance.
It's this type of irrational, emotional trading thatcaused the search for the Holy Grail—a mechanical sys-tem that never suffers emotional lapses. But now thateveryone has a personal computer, which can go
Chapter Two
through umpteen numerical manipulations of the SacredSix (High, Low, Open, Close, Volume, and Open Inter-est), purely mechanical trading is losing its punch. Moreand more we are seeing false technical breakouts thatnever follow through to the downside or upside. Thereis no fundamental reason behind these price movements,only the hum of thousands of computers making thesame dumb decisions at the same time.
If you want a better-than-average return in any investment,you are going to have to do something besides what the averageinvestor is doing. Increasingly, even in stocks, the average inves-tor is looking at momentum indicators (like stochastics) andcharts to make his decisions.
The techniques described later in this book are not rehashesof the same old technical methods that dominate the investmentmarket. They do offer you the opportunity of making above-av-erage returns, but unfortunately you will have to use your brainas well as your computer. If the human brain is in the equation,you must at all costs keep out the emotional factors that ruinstrading decisions. One of those factors is large losses, another isthe sheer stress that making many trading decisions in a shortperiod puts on one's brain.
Dull-but-successful Trading Rule #2 is similar to the first rule:
2. Never risk more than 1 percent (trading risk plus commis-sions) on any one trade.
That means a $5,000 account should only risk $50 a trade,including the cost of commissions. If that means tradingonly agricultural contracts on the MidAmerica Exchangeor out-of-the-money options, so be it.
We've talked about the psychological problem of los-ing more than 10 percent or 20 percent. But there are twoother mathematical reasons to limit your losses to thesmallest ratio possible.
All trading activity is a struggle to try every invest-ment idea that looks promising in the hopes that one ofthem will work. The more you lose the less you have to
Your Greatest Enemy
try another trade, another trading method, another in-vestment vehicle. To illustrate this we'll bring backHumble Harry and Trader Tom.
Trader Tom and Humble Harry both start with$100,000. Both lose five trades in a row. Harry keeps hislosses to 1 percent of equity—he ends up with $95,100.Tom risks $5,000 a trade and goes down to $75,000. Toget to $150,000, Tom must make 100 percent. To get to$150,000, Harry only has to make 57 percent. Tom mustoutperform Harry by 75 percent to get to the same goal!
Harry is long one contract of coffee before the lateJune freeze because the moving averages turned bullisha long time ago. Tom is long two contracts because hissystem takes big risks. Harry makes $15,000, and Tommakes $30,000 over one weekend. Harry is still aheadby $5,000 despite the ulcer-producing risks Tom takes.That brings me to Dull-but-Successful Trading Rule #3:
3. No matter how intellectually stimulating or exciting to trade,any trading method that, after expenses, couldn't beat asimple 18-day moving average system over the same periodhas to be dropped.
Charles LeBeau (who use to edit the Technical Trader Bulletinout of Torrance, California) once made a statement some-thing like this at a seminar I spoke at: "I've tested hundredsof moving averages and I found an 18-day moving averageis as good as any of them in tracking the futures markets."Intrigued, I called him later on and he confirmed that itdidn't matter too much whether you used a weighted,exponential, or simple moving average or whether youused four days, five days, or any specific number of daysfor the crossover average.
(Eighteen days is midway between the 16 days oftrading that is necessary to create 21 days between trad-ing events—remember the 3/21-Day Memory Law?—and the 20 trading days that constitute a lunar cycle of28 days. I will discuss these two powerful external fac-
Chapter Two
tors on trading later, but for the moment I just want tonote that LeBeau's 18-day figure also lines up perfectlywith what we might predict theoretically.)
In stocks, the total return (capital appreciation anddividends) of the S&P 500 is the benchmark for advisersand any stock system. Anyone or anything that can'toutperform the total return of the S&P 500 isn't worthfollowing. I propose an 18-day moving average standardfor the futures industry.
Add up the last 18 days of trading in a specific future.Divide by 18. When that specific future closes above the18-day moving average, buy the next opening. When itcloses below the 18-day moving average, sell the nextopening. Thirty days before first delivery date, start col-lecting closes of the next viable futures contract. Whenyou've collected 18 days of data, switch over to the newmonth.
This system is simplicity itself. If you track all the majorfutures with it, you will find it produces many small losses thatare made up by one or two huge moves (like what took placethis year in coffee). In good years (like 1974 and 1980), it makesover 100 percent. In bad years (like dull 1976), it barely breakseven. But over time (I'll let you on to a dirty secret in ourbusiness), it's net performance is better than the vast majority ofbrokers, trading advisers, funds, and systems that are touted inthe media.
Your only expense is a subscription to The Wall Street Journal(or your local paper if they have complete futures coverage). Ittakes only a few minutes a day to update and calculate on anycomputer. It's entirely unemotional and while you will takemany frustrating little losses, you won't miss the big ones (likethe charting expert who was urging his subscribers to go shortcoffee the day before the big freeze).
Because moving averages force you to stay with the trend,you rarely lose more than 1 percent of your equity even on badtrades. Finally, a moving average system limits your trad-
Your Greatest Enemy
ingso you hardly ever violate Dull-but-Successful Futures Trad-ing Rule #1.
Believe me, these three simple rules are worth the price ofthis book. The vast majority of investors would be far better offavoiding all the expensive seminars and computerized tradingsystems that fill up the ads. They should stick to a simple movingaverage system and use whatever profits and spare time theyhave to read everything they can get their hands on concerningthe futures market.
I especially recommend the Chicago Mercantile's Bibliog-raphy and Information Source List as a starting point. One$5,000 loss or one $10,000 seminar can buy you a greatmany books. You'll find that most "secrets of trading" arealready in print at a much cheaper price than big losses orexpensive seminars.
If you want to be slightly different, use openings instead ofclosing prices (later on I will discuss how I use opening prices).If you understand option strategy, you can use futures optionsinstead. And, if you must, you can experiment with differenttypes of moving averages. But until you are sure—quite sure—that you have a system that can beat this dull but profitable oneI've proposed, don't bother to trade any other way.
There are some of you who have read the last few pagesand are inwardly screaming, "I couldn't take this. I need to becreative, I need to be involved everyday. I want to trade fulltime." Okay, here's my advice to you. There is a futures exchangein Chicago called the MidAmerica Exchange. It trades smaller-sized contracts than what are traded on such exchanges as theChicago Board of Trade, the Chicago Mercantile Exchange, theComex, etc.
Presently the asking price for a seat on this exchange isaround $6,300 (There are also a few thousand a year in fees,which are mostly waived if you do enough volume). As anexchange member, you no longer have to worry about thebid/ask slippage because you are making the market. Yourcommission cost is around $.50 a trade (many MidAm Clearing firmsrebate part or all of your commission if you trade enough volume).
Chapter Two
As a member of a recognized exchange, if you must tradein a contract outside the MidAm, your commissions will bearound $3 at the Board of Trade and $10 at the other exchanges,not the $20-$30 of discount futures commissions. One tradingtechnique to cover all markets would be to use a simple movingaverage for contracts traded outside the MidAm while you floortrade MidAm contracts.
For further information, you can call the MidAmerica Ex-change in Chicago or you can call my friend Neal Weintraub at1-800-753-7085. Neal is a member of the MidAm and for a smallfee can walk you through all the steps in becoming a member,including finding you a sponsor from the exchange. Many greattraders (like Richard Dennis) got their start in the mini-contractsof the MidAmerica Exchange.
Maybe you can't move to Chicago. But then you can't avoidthat $45 entrance fee every time you trade a futures contract (orjust about any other investment, for that matter). You are goingto have to get together enough money in your account so that ifyou do trade every day, your trading equity isn't headed tooblivion in a very short time.
You say, "But so-and-so is trading using (software name)and making a mint." Maybe he's a terrific trader, but more likelyhe's just fortunate like I was during the Crash of 1987. The"Mathematics of Investing" will catch up with everyone overtime. If you continue to violate them, eventually you are goingto end up with the 80-90 percent who lose. At the very leastyou'll be like Trader Tom. You won't be able to justify all thetime and energy you spend trading futures.
Follow the Winners
Before I go on to individual techniques in the futures market, I'dlike to talk about the competition. There are many "How to Makea Million" in the (pick the investment)" books. Most of them arecookbooks about methods an alleged master used, or how asurefire system worked in the past.
Your Greatest Enemy
I prefer to investigate what winning traders use now. As Isee it, only 1 percent of those who trade futures make a livingat it. Virtually all of them fall into three groups: floor traders (orexchange specialists), who are the masters of money manage-ment; commercials, who are the experts of the fundamentals;and those I call the insiders, the lords of high finance and theexchanges.
I don't claim this book contains every method of thesesuccessful traders or even most of them. But I tried to put downas many of their most easily applied methods as I could. I'msure you will find something that will fit your personality andhelp your present trading system if you remember the first ruleof investing is humility—the humility not to blame others foryour trading failures, the humility to not think you are abovethe mathematical and psychological laws of trading, and mostof all, the humility to constantly learn from others.
Chapter Three
What theFloor Trader Knows
A client of mine was trying to sell 100,000 shares of a well-knownutility stock. He had an order in to sell it, but decided he wantedto get out now. The specialist's order book showed a 100,000 buyorder slightly below the price of the last trade in that stock. Butwhen my client went to meet the bid by selling his stock to thatorder on the specialist's book, it suddenly disappeared. It was aphantom order never meant to be filled.
Here's the same scenario in futures. A local floor traderA is crying out in the bond pit "100 to buy at 104." A uses thehand signals that indicate that he wants to buy 100 bondcontracts. Pit trader B turns to him and says "sold 100 at 104."Suddenly trader A turns to trader B and says, "I don't wantto buy. It was a mistake."
Trader A won't get away with it like the phantom order-giver in the utility stock. If he doesn't relent right then, hewould be hauled before a pit committee who would undoubt-edly rule against him if there were any other witnesses to thattransaction.
35
Chapter Three
Even if no one supported Trader B's complaint, the com-mittee might still force Trader A to honor the trade. If he hadany previous history of "chicken bids," he might be suspendedor even expelled from the exchange. At the very least, he couldbe shunned by other pit traders who would ignore his dishonestbids and offers in favor of other traders.
That phantom utility order cost my client about $50,000.But it raised no comment in the stock market amidst the sacredspecialist system. However, the financial establishment looksaskance at the activities of futures floor traders.
At this point, I ought to admit my prejudices. I started inthis business back in the old days when commissions were fixedby the exchanges, 24-hour trading was unheard of, and mostfutures pits were gentlemen's clubs that started around nineo'clock and ended just after lunch. In those days it was possibleto spend hours talking to floor traders before and after trading.Virtually all of the concepts in this book had their origin in thosetalks. Even in these hectic times, it is still far easier to approachand have an honest discussion with a floor trader than any otherconsistent winner (commercial, financial insider, etc.) that tradesthe futures market. So I guess what I have to say is colored byhundreds of contacts with futures floor traders and my friend-ships with many of them. But here are the incontrovertible factsabout futures floor traders:
1. They have a level of integrity that is way above average.
Each day they trade billions based on fleeting, verbalcontracts in the pit. Yes, many megamillion financialdeals in stocks, bonds, and other financial instrumentsare also conducted strictly over the phone. Isolated casesinvolving stock or bond fraud don't lead the media tocondemn the entire stock and bond industry. But if theoccasional floor trader runs into an FBI sting, it startsanother round of futures bashing.
Many businesses in the country are heavily depend-ent on government subsidies. Many professions, such asdoctors and lawyers, have legal monopolies that restrict
What the Floor Trader Knows
entry and thereby boost costs to the consumer. The floortrader is one of the last pure entrepreneurs who asks thegovernment for nothing but the right to stay in businesswithout overwhelming regulation.
2. They are absolutely essential to the economy of America.
The futures market, just like the stock market, can betreated like one big casino. But, like stocks, futures per-form an essential economic task. They facilitate the needof producers and consumers, who don't want price fluc-tuations to ruin their business, to transfer the risk tosomeone else.
Floor traders are responsible for over 50 percent ofthe trading in futures. Without them, the futures marketwould be illiquid and spasmodic in price movement.Futures markets would begin to dry up and fail to servetheir essential economic function in our society.
Some have called for the abolition of the open outcrysystem of futures, to be replaced by computerized trad-ing where every order is matched electronically. In myopinion, this is very dangerous. There have been enoughcases of computer fraud to show how easy it is to ma-nipulate computer programs. The computerized systemof NASDAQ has also been plagued with problems anda series of scandals.
That's not to say that increased computerization can'thelp. I think futures trading should adopt the systemalready in place with the OEX option contract, whereorders under 10 contracts are matched electronically andavoid the overcrowded pit. If the technology can everbe debugged, it makes sense to replace the paper cards,which floor traders use to record pit trades, with a hand-held electronic device.
But I don't want electronic trading to replace theopen outcry system any more than I want Perot's Elec-tronic Town Hall to replace the U.S. Congress. Any timeyou concentrate market power in the hands of the few
37
Chapter Three
(in this case, those who control the computer program),you are in danger. Why should futures lose one of itsbiggest advantages over the stock market—a truly com-petitive marketplace—and give a handful of people anenormous advantage, like the specialist system?
3. Becoming a floor trader isn't a license to steal. The only oneswho survive are those who truly love to trade.
According to exchange statistics, about half the peoplewho trade on the floor quit after two years of trading.Not all of them go broke—many retire to trade upstairsaway from the frenzy of the floor; others go on to someother business. A 50 percent washout rate after two yearsis a lot better than the 80-85 percent loss rate after sixmonths, which academic studies claim to be the loss ratefor the average novice futures trader. But it still doesn'tsuggest that everyone on the floor is making a million.
Tom Baldwin is acknowledged as one of the biggest,if not the biggest, floor trader in the world. He was asked(in Futures Industry) if he would recommend trading asa lifetime occupation. He replied:
"I wouldn't do it for the money. I'd do whatmakes me happy. You're just going to tortureyourself unless you really love to trade. Makingmoney is not what makes it fun. Being successfulmakes it fun, but there's so much personal, emo-tional involvement in it, if you don't love to workon the emotional aspect of it, you are going tohate it. I mean understanding your own emo-tions. Most people only deal with the emotionalaspect of losing. That really is just a minor aspectto overcome. The emotional aspect of being suc-cessful is actually more difficult. Once you're suc-cessful, you have to deal with keeping your focus,and that's a full time job I think that's why theworld developed systems. You try and develop acomputerized system that doesn't have feelings
38
What the Floor Trader Knows
and then you don't have to deal with it. You canblame the system and make adjustments."
Face it, investors. A lot of successful investing is do-ing the same things at the same time in the same way.The bulk of the price movement of any investment oc-curs in a tiny fragment of time—about 1 percent of theentire year. If you don't love what you are doing, youare going to lose your focus or become bored. Boredom,the need for a new thrill, has ruined more great tradersthan anything else I know.
4. Floor traders are the ultimate world capitalists.
The Nobel Prize-winning economist Schumpeter calledcapitalism creative destruction. He meant the free mar-ket was always tearing down one business or industryand replacing it with another—the free flow of capitalfrom an area of inefficiency to an area of efficiency.
All successful investing is is learning to go with thisflow of funds. Predicting the future is a nice hobby andI do try to do that as much as any analyst. But nobodyreally knows for sure what the next Microsoft is goingto be or whether it will rain in the Midwest next May.We can guess, and they may be educated guesses, butthey are still only guesses.
Standing in the pit, the floor trader is at the center ofa world system of allocating money among competinginvestments. The flow of funds of the multitrillion-dollarworld economy is taking place right before him. Millionsof minds with billions of data inputs in their brains areputting their two cents' worth into the market. If thefloor trader doesn't constantly keep abreast of this flowof funds, he will soon find himself as obsolete as thebuggy whip manufacturer.
Futures trading 25 years ago was 95 percent agricul-tural. Today only around 5 percent of its volume is inagricultural markets. Ten years ago, most futures tradingtook place in the United States. Very soon, the over-
39
Chapter Three
whelming majority of futures trading will occur over-seas.
Tom Baldwin, in that same Futures Industry interview,went on to remark, "We found that the markets inEurope tend to trend very well whereas the marketshere, especially the bond market, is a difficult market totrade long term." In other words, the same big trendingmarkets that built many a fortune and the reputation ofmany a trading system in the United States futures mar-ket of the 1970s are now occurring overseas. But howmany "I Made a Million in Futures" books are tellingyou how to place an order in London?
The only investors that are going to survive the rol-lercoaster nineties are those who imitate the floor traderby being prepared to go wherever the international flowof funds is taking the world economy.
5. Most floor traders understand that the greatest secret to in-vestment success, outside of emotional control, is consistency.
Remember Humble Harry? He put $1,000 a month intoa system that was making 40 percent. Let's assume hestarted with $50,000 and a system that returned "only"35 percent a year. If he continued to put in $1,000 amonth, at the end of 10 years his account would be$1,775,049.
Compound interest is the "eighth wonder of theworld," as Baron Rothschild called it. That's why mostfloor traders are delighted to earn 50 percent a year ontheir capital. If they can do that consistently year afteryear, in no time they will get rich. To that end theyengage in all those boring investment activities likescalping hundreds of trades for one-tick profits or wait-ing for that lock trade, the sure winner that comes alongevery few months.
I once heard a floor trader describe what his biggestprofit was on one trade. "It was in the early days of bondtrading. Somebody put in a massive market order to buy
What the Floor Trader Knows
a thinly traded back-month bond contact. I watched inamazement as the price was quickly bid up a whole basispoint ($1,000 a contract) in a matter of seconds. I quicklyran over to where this back-month option was trading andsold a thousand contracts and than ran back to the monthwhere I was trading and bought a thousand contracts.When market conditions returned to normal, I liquidatedmy spread and made almost a million dollars."
It's these types of stories that give the floor trader his"vulture" reputation. But I don't see how this is muchdifferent than meeting a sudden demand by emotionalconsumers for Cabbage Patch dolls. If people have tohave something right now and can't wait, they are goingto have to pay a premium. The only other alternative isto have the government watch every economic trade todetermine, like some national nanny, whether it is fair.If it doesn't involve fraud or coercion, it's fair.
It's so much sexier to talk about a system that gener-ates a 9.56-to-l profit-to-loss ratio than making 35 per-cent a year on your money, year after year. But unlessyou are willing to accept this reality—like most floortraders—you are almost guaranteed to fail in investing.
6. The floor trader understands it's not all in the numbers.
One of the most successful floor traders, Mark Ritchie, wasquoted in Futures magazine: "Everybody is on the hunt fora mechanical system that will make money—there's nosuch thing. The computer is nothing more than a very goodslide rule, but all of the decisions made are human deci-sions. All the computer does is crunch the numbers we askit to crunch."
Do you know that computers are banned in the pits ofmost exchanges? Have you ever thought how those poorslobs, the floor traders, make it without that comfortingcomputer screen in front of them? "How come they aremaking more money than me I am when they don't evenknow what the 14-period stochastic is saying now?"
40 41
Chapter Three
According to one estimate I read, 93 percent of tradersare using price data as the basis of their trading. That'sabout the same percent as academic studies say lose moneytrading futures. Isn't about time you consider getting awayfrom the bondage of the umpteenth computer manipula-tion of the Sacred Six (high, low, open, close, volume, andopen interest)?
There is a service in Chicago called Listen Only Systems.Through a telephone or satellite link, a running commen-tary of what is happening in the S&P 500 pit is piped toan individual trader. This running commentary is con-stantly describing who is bidding or offering, the size ofthose bids or offers, what outside factors the pit is lookingat (bond prices as they are printed on the exchange priceboards, etc.). Not the least of their service is the ability tolisten to the noise of the pit, which is a good barometer ofthe emotion and size of trading.
Why would some of the most sophisticated traders inthe world pay for such a service if everything you neededto know was in that price you see on your computer screen?
Again and again floor traders have told me howmuch "being there" helps their trading: seeing the trad-ers that (almost) always win and the ones that normallylose (and won't be around much longer), seeing the fearor the confidence reflected in the eyes of individual trad-
What the Floor Trader Knows
ers.One ex-floor trader put it this way: "Guys will be
yelling and carrying on, but the good floor traders willbe quiet for a long time. Then the market breaksthrough a key point. They see opportunity and low riskand they pounce."
Of all the winners that truly have the trader's edge, thetechniques of the floor trader are the ones the average trader canimitate the best. Of course, there are many things public specu-lators can't do because they are not trading at $1.00 commissionrates (elaborate spread and option strategies, etc.).
But over the next few chapters I will discuss floor trad-ing techniques that don't depend on a computer or ultra-lowcommissions. They may not be discussed in the media by theexperts, but they are the lifeblood of people who do every daywhat these experts can only dream about—capture millions ofdollars in trading profits.
43
Chapter Four
Sayings from the Floor
Up to now, I haven't discussed any of those "hot" techniquesmost of you bought this book for. I'm sure some have alreadyskipped the first few chapters and are busy reading The Theoryof the Opening, Fib Time Trading, etc.
I understand how the things I've written in the last chaptersare like castor oil to many. They are so contrary to what youcommonly hear about futures trading that I'm sure many of youare wondering, "Just who is this guy? Is this really right?"
The ancient book of wisdom says that out of two or threewitnesses shall every fact be established. So I am going to giveyou that second witness (and a few more besides that). Read thewords admired by some of the best traders that ever existed,words I call "Sayings from the Floor."
Over the years I've heard many traders discuss the markets.I've read many interviews by the big names in futures trading.Over and over again, you hear the same secrets of success, thesame books mentioned, etc. So I've compiled what I call the "BigThree" of successful futures trading:
Most successful traders had someone special who helped themwhen they started out and showed them what to do.
45
Chapter Four
If you want to be a winner, pattern yourself after somebodyyou know who is actually winning in the same circumstancesyou find yourself. What's possible for a floor trader may not bepossible for a public trader who is paying that $45 initiation feeevery time he or she trades. If you can't watch the market eighthours a day, you shouldn't assume the methods of your local"Joe the Daytrader" are going to be of any use to you, despitehis glittering track record.
The greatest enemy of successful futures trading is trading onemotion rather than on a rational, well-executed plan.
I've never heard of or read about any big-time futures traderthat didn't have at least one (usually it was more than one)horrible trading experience that made them painfully aware ofthis fact.
There is no bible for futures trading, but there are least three booksthat are cited again and again.
If you cornered a big name and asked him, "What shouldI read to become a successful futures trader," he would probablymumble something about reading a basic manual about futurestrading (like the one the Chicago Board of Trade puts out).
That's a good answer since a great deal of mastering anyprofession is just knowing what people are talking about. It'samazing how people will spend years of study and thousandsof dollars to become a lawyer or a doctor, but somehow theythink they can enter the high-income profession of futures traderwithout doing a bit of preparation. Finishing school won't makeyou a successful lawyer or doctor, but unless you acquire a baseof market knowledge, you can't possibly hope to succeed.
Again and again I've seen public traders lose tens of thou-sands of dollars and be none the wiser after all their time andmoney. They should have put that lost $10,000 into buying everyfutures book they could find. All that time watching prices couldhave been poured into a self-directed "college course" learningabout the market. This wouldn't have given them the self-disci-
46
Sayings from the Floor
pline they also need to succeed, but it would have given themknowledge, which is one side of the two-sided coin known assuccessful futures trading.
A basic training manual is not the simple secret of theuniverse that guarantees you will become a millionaire over-night. Neither is reading everything you can get your hands on,although that is a far cheaper and less painful substitute for thenormally dreadful trading results of novice traders.
But for those who must have a "secret-of-success" book,when pressed, those big names do mention three books againand again. These books are no substitute for truly studying themarket and learning how to control your emotions by actuallytrading. But they must have something special to be mentionedover and over again by successful futures traders.
The first is Reminiscences of a Stock Operator by Edwin Le-fevre.1 First published in 1923, it was brought back into printbecause it was publicly mentioned by several prominent futurestraders. In my observation (probably because it has been aroundlonger than the other two books), this is the book most oftenmentioned by big-name traders as influential to their careers.
The next is Viewpoints of a Commodity Trader by Roy Long-street.2 Roy was actually trading when I first started in thefutures business as a broker. But he was only a name, a wispylegend, until I read an interview of him in the now defunctIntermarket magazine. After reading Longstreet's interview, I wasinspired to read his book. If you can't find it, next time you arein Chicago, stop off and read the copy housed in the Board ofTrade Library.
The last book is Market Wizards by Jack Schwager,3 whichis a collection of interviews mainly with well-known New Yorktraders. This book deserves all the praise that's been heaped onit, although I think at least some of its success is due to what Icall the "Reggie Jackson factor." Reggie was a great ballplayer
1 Edwin Lefevre, Reminiscences of a Stock Operator, reprint of 1923 ed. (Chicago: TradersPress, 1985)
2 Roy Longstreet, Viewpoints of a Commodity Trader (New York: Fraser Publishing Co.1947)
3 Jack Schwager, Market Wizards (New York: Simon & Schuster, 1989)
47
Chapter Four
when he played in Oakland, but he didn't become "Mr. October"until he played for the Yankees.
I suspect Roy Longstreet's track record was comparable tomost of the Market Wizards interviewed by Schwager. One ofJack's wizards, Michael Steinhardt, had an awful track record in1994. But as the denizens of the Big Apple are fond of saying,"If doesn't happen in New York, it doesn't happen."
The following are selected quotes from these books plusquotes from floor traders I have known. I call them "Sayingsfrom the Floor" since you hear the same things again and again,repeated in different ways, from floor traders and other success-ful futures traders.
"It takes a man a long time to learn all the lessons ofhis mistakes. They say there are two sides to every-thing. But there is only one side to the stock market;and it is not the bull side or bear side but the right side.It took me longer to get that principle fixed firmly inmy mind than it did most of the more technical phasesof the game of stock speculation."
—Edwin Lefevre, Reminiscences of a Stock Operator
My friend Neal Weintraub heard this once from a trader:"The way to make money in this business is not to be smart, justavoid being stupid (by betting everything you have on a fewtrades)."
"It never was my thinking that made the big moneyfor me. It was always my sitting... It's no trick to beright on the market. You always find a lot of early bullsin bull markets and early bears in bear markets.... Menwho can both be right and sit tight are uncommon."
—Edwin Lefevre, Reminiscences of a Stock Operator
48
Sayings from the Floor
"When I am long with a large profit, I get into my carand leave town. At each town I come to, I call the officeand reduce my position & I always took my profits toosoon."
—Roy Longstreet, Viewpoints of a Commodity Trader
At this point, I'd like to stop and say that the last two quotesare not necessarily contradictory. Futures trading, because of thelower margin and commission rates, has a different pulse thanstocks. The usual rule of thumb (as told to me by one floor trader)is: "Double your money, take your profits. If you still like themarket, start a new position as if you had never made a dime."
With 5 percent down, a 5 percent move in futures doublesyour money. Commissions are a tiny fraction of the underlyingcontract. With stocks, you must put up 50 percent margin, soyou need a 50 percent move to double your money (which, dueto inflation and growth, is generally easier to do in bull markets.Unfortunately, markets move down faster than they move up,even if, in percentage terms, stocks tend to go up farther thanthey move down).
In stocks, it doesn't make sense to take 2 percent profitswhen your commissions (in and out) are 2 percent. You musthave the patience to wait for those 50 percent (usually) upmoves. In futures, you need the discipline to get out whenyou've doubled your initial stake and not yield to greed. Youcan't pyramid a winning position by violating the PsychologicalLaw of 10/20 Percent—which is very easy to do when the marketmoves in your direction. Or, as Longstreet put it:
"A good general never risks all of his troops in thefront line at one time."
—Roy Longstreet, Viezvpoints of a Commodity Trader
49
Chapter Four
"The average man doesn't wish to be told that this isa bull or bear market. What he desires is to be toldspecifically which particular stock to buy or sell. Hewants to get something for nothing. He doesn't wantto work. He doesn't even wish to have to think. It istoo much bother to count the money that he picks upfrom the ground."
—Edwin Lefevre, Reminiscences of a Stock Operator
"People don't want to learn how to trade. They wantto be told what to do."
—Common floor saying
"A loss never bothered me after I take it. I forget itovernight. But being wrong—and not taking the loss—that is what does the damage to the pocketbook andto the soul."
—Edwin Lefevre, Reminiscences of a Stock Operator
"The greatest loss is self-confidence."
—Roy Longstreet, Viewpoints of a Commodity Trader
"The speculator's chief enemies are always boringfrom within. It is inseparable from human nature tohope and to fear. In speculation when the market goesagainst you, you hope that every day will be the lastday—and you lose more than you should had you notlistened to hope—to the same ally that is a potentsuccess-bringer to empire builders and pioneers, bigand little. And when the market goes your way youbecome fearful that the next day will take away yourprofit, and you get out—too soon. Fear keeps you frommaking as much money as you ought to. The success-ful trader has to fight these two deep-seated instincts.
50
Sayings from the Floor
He has to reverse what you might call his naturalimpulses.... He must fear that his loss may developinto a much bigger loss and hope that his profit maybecome a big profit."
—Edwin Lefevre, Reminiscences of a Stock Operator
Another old floor trader saying, as quoted in Market Wiz-ards, reads, "Put stops where they can't be reached (easily)." Theidea is to make sure your analysis (at least temporarily) was badif you are stopped out. That way you won't pull your stops orimmediately reenter the market on the same side without step-ping back and analyzing the situation afresh.
Market Wizards also contains another common saying: "Wedon't trade markets, we trade money."
"That is one trouble about trading on a large scale. Youcannot sneak out as you can when you pike along. Youcannot always sell out when you wish or when youthink it wise. You have to get out when you can, whenyou have a market that will absorb your entire line.Failure to grasp the opportunity to get out may costyou millions. You cannot hesitate. If you do you arelost."
—Edwin Lefevre, Reminiscences of a Stock Operator
"The big players always tip their hand."
—Michael Marcus, as quoted in Market Wizards
"A market can and often does cease to be a bull marketlong before prices generally are ready to break. Mylong expected warning came to me when I noticedthat, one after another, those stocks which had beenthe leaders of the market...did not come back."
—Edwin Lefevre, Reminiscences of a Stock Operator
51
Chapter Four
"Three drives to a top" is another common floor saying Iheard long before I heard of R.N. Elliott. By the way, the threedrives to a top of a commodity bull are quite different than thoseof a stock bull (more on this later).
"I like the short side of the market because there is lesscompany."
—Roy Longstreet, Viewpoints of a Commodity Trader
Consider this facetious floor trader saying: "When you'relong, you're wrong." This saying contains these kernels of truth:bear markets go down faster than bull markets, and during thestart and middle of bull markets, selling points are usually easierto identify than buying spots.
"Observation, experience, memory, and mathematics:these are what the successful trader must depend on.He must not only observe accurately but remember atall times what he has observed.... He must always relyon probabilities—that is, try to anticipate them. Yearsof practice at the game, of constant study, of alwaysremembering, enable the trader to act on the instantwhen the unexpected happens as well as when theexpected comes to pass."
—Edwin Lefevre, Reminiscences of a Stock Operator
The worse the fills are, the better the trade.
—Bruce Kovner as quoted in Market Wizards
"Now, ordinarily a man ought to be able to buy andsell a million bushels of wheat within a range of 1/4cent. On this day when I sold 250,000 bushels to testthe market for timeliness, the price went down 1/4cent. Then, since the reaction did not definitely tell meall I wished to know, I sold another quarter of a million
52
Sayings from the Floor
bushels...the price went down 1-1/2 cents on my sell-ing.... Such being the case, what was the only thing todo? Of course, to sell a lot more. Following the dictatesof experience may fool you, now and then. But notfollowing them invariably makes an ass of you. So Isold 2 million bushels and the price went down more.A few days later the market's behavior practicallycompelled me to sell an additional 2 million bushelsand the price declined further still; a few days laterwheat started to break badly and slumped off sixcents...."
—Edwin Lefevre, Reminiscences of a Stock Operator
Two more common sayings are: "The best charts are theones you never see," and "You're never far from (take your pick):a Gann Line, an Elliott Wave Extension, a tech point, etc."
Ninety percent of traders are taught to look at two basicindicators: momentum measures (like stochastics, RSI, percentR, etc.) and chart formations. Since 90 percent are losing, maybeit's time for you to find the charts you never see running inInvestor's Business Daily and stop looking for some esoteric rea-son why you lost ("I missed this Gann line," ad nauseum) inthe charts you do see.
"Every time you tell somebody what you know, yousell yourself on its importance."
—Roy Longstreet, Viewpoints of a Commodity Trader
"Trading is like baseball. Winning is 90 percent defenseand knowing when to swing for a three-run homer. Ifyou strike out, remember Ruth struck out more thanhe homered."
—Floor trader speaking to me years ago
53
Chapter Four 1"Traders often enter the 'Hall of Mirrors'... They seeonly success (wherever they look)."
—Roy Longstreet, Viewpoints of a Commodity Trader
"Yesterday's hero, today's goat" is an old floor trader adagerepeated to me in many forms (a good thing to remember whenyou see the next George Soros touted to the skies by the media).
On that note, I better stop. I could go on and on. Get thosethree books, read them yourself, and take a small step on thelong road that leads to successful futures investing.
54
Chapter Five
The Theory of theOpening
For years I've been speaking at Neal Weintraub's seminars herein Chicago. Neal founded Commodity Boot Camp, sold it, and nowruns the "Tricks of the Trader" seminars. There is one thing Nealdoes at every seminar I've seen: After a weekend of teachingsessions, Neal takes his attendees to watch Monday's opening inthe grain pits at the Board of Trade. After the frenzy of theopening, Neal points out that about half the traders get off thefloor and take a break. You can actually hear the decrease in thenoise from the pit. By 10:00 A.M., half an hour after the opening,some days it seems you could shoot off a gun in the middle ofthese grain pits and not hit anyone.
This phenomenon is most visible in the grain pits, but italso occurs in varying degrees in every other trading pit I haveever seen. Virtually every floor trader that is not sick or onvacation seems to be there on the opening. That's not the caseduring other trading hours. Even the close often finds many floortraders on the sideline or already home.
Back in the days when futures trading was basically a 9:00A.M.-to-l:00 P.M. gentlemen's club, a lot of us brokers wouldstumble in around 8:00 A.M. and complain bitterly about how lucky
55
Chapter Five
stockbrokers were. Their market opened at 10:00 A.M. instead ofthe ungodly 8:30 A.M. of silver. For a long time, it never ceased toamaze me that many floor traders who cleared through our firmhad come in hours earlier; some as early as 4:00 A.M.!
After calling half the country to find out market conditionsand thinking about the markets for hours, many of the same floortraders would still get to the pit early, sometimes hours before theopening bell, just so they could get a good position to executeorders on the opening. Then we would often see these same earlyrisers, a half hour after the opening, back up in their offices, oftenjoking, and quite willing to talk to us peon brokers.
I learned many a good trading technique during these mid-session breaks as floor traders would talk with one eye on thescreen and one eye on me. Occasionally, they would see someprice movement and say, "That looks interesting," and go backon the floor. But most of the time they would do one of twothings: Go home, or come back to the market at a regular time,notably at 11:00 A.M., the start of the New York lunch hour. (Breaktimes vary with markets. Bond traders usually want to be aroundduring Fed intervention time from 10:20 to 10:50 A.M. CST.)
Why would these men, who paid big bucks for a seat andspent enormous time preparing for the market opening, be sowilling to leave their livelihood early, sometimes after only a fewminutes of trading? Why were they so often cavalier about theclose, which everyone "knows" is the most important event ofthe trading day?
One explanation could be the Psychological Law of 10/20Percent. We have 168 hours in a week. Ten percent of 168 hoursis 16.8 hours; 20 percent is 33.6 hours. The average worker offi-cially puts in about 33.6 hours per week after break time, vaca-tions, and sick leave are taken out.
But actually, much of our society's work (especially in gov-ernment institutions) is "F&S"—faking and stretching work tofill out the time before 5:00 P.M. Some 16.8 hours a week of realwork may be a generous estimate of what workers actually do.They so resent the time they are forced to work, an agent's 10percent is all the effort they can muster up.
56
The Theory of the Opening
Even people who love their work will find it hard to sustainall-out hours of work much beyond 20 percent of the week. Theymight begin to suffer serious fatigue and burn out. In short, afterhours preparing for the strain of a market opening, even themost committed floor traders might need a break shortly afterthe opening.
But this still doesn't explain all this emphasis on the open-ing. Why don't floor traders come into the pit during the middleof the day (when the other floor traders are off the floor resting),claim a good position in the pit to execute trades, and stay forthe rest of the trading day? If six hours a day, 30 hours a weekis about all the quality hours anyone can put into his or her job,why don't S&P 500 floor traders, to give an example, waltz inabout an hour after the opening at 9:30 A.M., put in their sixhours, and quit after the "all-important" closing bell at 3:15 P.M.?
Then it dawned on me. How many hours do the marketstrade? How many hours do they not trade? Don't events thatmove markets occur all the time, seven days a week?
What does the close reflect? A few hours of price explora-tion, which might not reflect any major external or internal eventthat would influence the long-term trend of the market. Whatdoes the opening reflect? Doesn't it reflect the accumulated wis-dom, the market events of many more hours of human existence?Which is more important in terms of potential market move-ment? The trading decisions made and events that occur duringthe up to 68 hours (on a weekend) when a future is closed, orthe few hours the future is trading?
Even 24-hour trading in currencies has gaps in tradinghours. There is an hour or two between the close of the NewYork markets and the start of Asian trading in Sydney. And thenthere is the long hiatus between the end of New York trading onFriday and the start of Asian trading on Sunday night U.S. time.Which is a more important price? The close of New York trad-ing, with only 22 hours of continuous trading behind it, or theopening of Asia Sunday night, the first time the currency marketcan speak after a rest of about 50 hours?
57
Chapter Five
Think of it this way. Measure the size of the closing range(the price movement of the last 30 seconds in trading). Measurethe price movement of the opening range (the first 30 secondsin trading). You will probably find on average they are similar,with a slight edge in volatility usually going to the openingrange. But if you measure price movement between the closeand the extreme quote (up or down versus the close) in theopening range, you will suddenly find the opening range win-ning hands down in the volatility race with the closing range.
Even the most novice trader is warned about those instru-ments of devastation, the dreaded commodity reports, the USDAPig-Crop Report that will trap you for days in limit moves, orthe unemployment report that causes half your bond equity todisappear in a single minute.
But what is an opening but a report? Every trading day, atthe opening, the market makes its report on what happenedovernight. Every opening (except the relatively rare "split open-ing" where there is no price movement from yesterday's close)is a time of rejoicing for some and weeping for others. It's themoment of truth when cheap talk is finished and every partici-pant has to put up or shut up and make his bids and offers.
What is the usual worst case scenario after a Pig CropReport? A $1,000 limit move against you in hogs? $1,500? Yetinvestors think nothing of losing $100 or $200 on the hog open-ing, day after day, week after week, month after month. Everymorning they say to themselves, "I don't need to worry. Themarket will go back my way again." Panicked in front of the bigreports, they are suffering the death of a thousand cuts from thelittle "reports" of each day's opening.
It's the fear of what the opening will bring that causes manyto daytrade and never hold a futures position overnight. Butthere's two big problems for the public with this approach. Oneis that average $45 initiation fee for every contract you trade.The other is the loss of volatility so necessary for public specu-lators to even up the odds with their professional rivals.
A floor trader can make money with one-tick trading. If hebuys the bid and sells the offer and pockets a one-tick profit in
58
The Theory of the Opening
cattle of $10.00, his only expenses are about $1.00 in clearing feesand whatever the interest cost of his seat (in loans or opportunitycosts) turns out to be on a single trade (the year-to-year percent-age increase in the price of exchange seats has been greater thanthe cost of borrowing over the last 25 years, "basically" makingthis expense practically nothing).
Of course, even a floor trader doesn't always buy the bidor sell the offer. If he is wrong about the direction of the market,he might be forced to (just like the public trader) get in and outat any price he can get. But let's say he is buying the bid andselling the offer half the time he trades. The other half of the timehe has to pay that same one-tick price to enter and exit that thepublic pays. That averages out to a $6.00 cost every time hetrades.
Let's say cattle's daily range averages 50 cents a day, or $200.The floor trader's average cost per trade versus the daily range is6-to-200, or a 3 percent daily ratio of costs to potential profits percontract. The public speculator's cost per trade is $35 (one tick of$10.00 plus $25.00 in commissions and exchange fees). His fixedcost to potential profit ratio is 35-to-200, or 17.5 percent.
Now let us assume that cattle's price range from the pre-vious day's extreme to today's high or low (depending on whichis greater) averages out to be 75 points, or $300. If the publicspeculator buys or sells on yesterday's extreme price and offsetsit some time during today's trading, that decreases the cost topotential profit ratio to 35-to-300, or 11.66 percent, a 50 percentdecrease over daytrading alone.
In order for the public trader to get down to the 3 percentratio of the floor trader, he must look for potential swings inprice action totaling $1,167 from top to bottom. A $1,167 swingin cattle trading happens, on average, every few weeks. (This isexactly what following a standard moving average like our 18-day example does. A public trader is forced to take only tradesthat fit the 3 percent ratio of potential profit to fixed costs ofdaytrading floor traders).
Still not convinced the opening is a more important pricethan the close? According to a book by R. Earl Hadady (the father
59
Chapter Five Iof contrary opinion futures trading), the opening is more likelyto be near the low or high of the day than the close. (OpeningPrice Statistical Data, 1984.)
Listen up, daytraders. If you are not prepared for the open-ing, if you don't make that the focus of your trading instead ofthe close, you are going to lose a great deal of the potential profitthat there is in each day's trading.
You see, the close is just a bookkeeping entry. It's just aconvenient way to give the back office a chance to catch up andeveryone a chance to get some rest. The strong hands of the
/ market know that, about 60 percent of the time, if the openingis higher, the close is going to be higher. In other words, most ofthe time the opening has already told the professionals whatthey can expect at the end of the day, and they plan their tradingaccordingly.
It's only the weak hands, the dumb money, that hold outto the close, hoping for some miracle reversal to save them.When it doesn't, like the majority of the time, they go on margincall and are forced out. Even if there is a last-minute miraclereversal, these poor slobs might still be long gone, forced out bytheir broker well before the close because their intraday accountbalance went near zero and their credit with their broker wasalready used up.
I have one last appeal for all you technicians out there.Why were candlestick charts all the rage the last few years?Isn't the secret of the Orient the opening? What is the essentialingredient that makes all those hammers and clouds differentfrom standard Western bar charts? Isn't it the fact that theopening is used to draw the candle body? Aren't candlesticksjust a much overdue admission that the opening is at least theequal of the close in determining market direction?
By the way, do any of those hotlines you spend good moneyon use open-only stops? Does your hotshot computer systemweight the opening price more than the closing price in itsdecisions? Does it even input the opening price? Is the chart yousee also missing the opening?
The Theory of the Opening
Ninety percent of futures traders don't give a secondthought to the opening. Ninety percent of futures traders arelosing. Isn't there a strong correlation between these two statis-tics?
Floor Trading opening Systems
The opening is not only a report, it is usually a gap. The openingprice range normally does not touch or include prices from theprevious night's closing range. This may be a common gap, butit is a gap nonetheless. And just as we would expect from tech-nical theory, usually there is an immediate attempt to close thegap on the part of the markets. Floor traders call this "fading theopening."
For the first 10 seconds or so of the opening, usually there areno trades consummated. Bids and offers are made until one bid andone offer finally meet. This feeling-out process is critical to the waythe floor trader will act during the rest of the opening.
Normally, he will not bid or offer on the opening until themarket uncovers a big bid or big offer. Then he will step in frontof this order by bidding one tick below (if it is an offer) or onetick above (if it is a bid). If the market appears to be against thedirection of his order, he can cover his order safely into the armsof that waiting bid or offer. Like every professional, and unlikethe public, the floor trader is always more concerned aboutminimizing his losses than he is about being right.
Here's an example. The opening range in November soy-beans is 6.03 to 6.04. It immediately moves up to 6.04 1/2 wherea big commercial is attempting to sell a few million bushels. Theprevious closing range was 5.99 1/2 to 6.00 1/2, or 6.00 settle-ment. Our floor trader will sell his November beans at 6.04 1/4,a tick below the big order to sell at 6.04 1/2.
His expectation is that the market will fade and attempt toclose the gap created by the bottom of the opening range at 6.03and the top of the closing range at 6.00 1/2. If he sees that themarket is acting too strong, he can buy in his short sale using
60 61
Chapter Five IIthe commercial order at 6.041 /2. If he didn't have that big order,he might have to pay 6.04 3/4, 6.05, or even higher to get out ofhis position as the market surged up with little selling.
This fading action is normal because public traders, whoare usually long, normally have an irresistible impulse to takeprofits whenever they are the tiniest bit ahead. Even when themarket opens lower, there is a tendency by the public to doubleup and buy some more "bargains." Any public trader that isshort, like his long counterparts, will tend to take profits andhelp force the market up.
"Public time" varies slightly with every market. In gold, itpeaks during the New York lunch hour, from 11:10 to 11:50 A.M.CST. In the agricultural markets, we have the "Noon Balloon,"where farmers call their broker after listening to the noon agri-cultural (ag) report on their radio and tell them to "Texas hedge,"which means to go long in the market when they already haveplenty to sell of the same thing on their farm.
y Commercials and floor traders are not stupid. They knowthis is the normal pattern. If they are bullish, they will wait untilpublic profit-taking has battered prices back to the closing rangeor some other technical or fundamental buying point. If theywant to sell, they do the opposite. If they are so eager to sell orbuy that they don't wait for this routine of the market, that isvery significant for future price action. (I'll discuss this later.)
The gap created by the opening from the closing price iseasily observed on an intraday price chart that extends overseveral days trading. You can use a 30-minute bar chart as youwould a daily chart and do all the technical tricks chartists dowith gaps. Since less people look at intraday charts than dailycharts, you will have a greater chance of being right in usingstandard gap technical analysis.
Gap analysis is in every book on charting. Since I promisedmyself this book would be about techniques rarely if ever dis-cussed, I'll confine myself to saying that most gaps created bythe action of the opening are closed within a few days, since
>\ about 85 percent of the time markets are not trending stronglyin one direction or another.
The Theory of the Opening
If you call your broker up or if you have some sort of servicethat pipes in news about the futures market to your place oftrading, you can usually get the "opening call." This openingcall can be a powerful signal, especially if you are trading aprimary market.
There are many places that trade currencies, but the pri-mary markets are the big banks in New York and London. Soy-beans are traded in Osaka and Rotterdam, but the primarymarket is in Chicago. London trades U.S. stocks, but the bulk ofthe trading is in New York.
Based on the latest prices in Rotterdam, soybeans are ex-pected to rise 10 cents immediately on the opening. If soybeansare only up five cents on the opening, that is a powerful sellsignal. Either somebody wants to get out of beans so badly theyare willing to forego $250 a contract in profit to get out, and/orthe demand that pushed up the thin Rotterdam market is notenough to get the much bigger market in Chicago moving.
This works exactly in reverse for a lower opening. A market -vthat was called 10 cents lower and opens five cents lower hasgiven a strong signal to buy. (No, this doesn't always work, buthopefully if you read the first chapters in my book, you are nevergoing to be tempted by "bet-the-ranch" trading.)
The Split Opening
Still another opening routine is the split opening. This works bestin the agricultural markets, but it is worth noting wherever ithappens in a primary market. A split opening is when the open-ing range is inside or identical to the previous closing range.* /
When a market opens within a tick of the close, it signifiesa lack of fresh overnight fundamentals. The market then isdriven purely by technical factors. It should trade below andabove the opening range.
On Figure 5-1, you can see that the June 22, 1994 openingof July beans was almost identical to the June 21,1994 July bean
* The previous close "splits" the opening range down the middle.
62 63
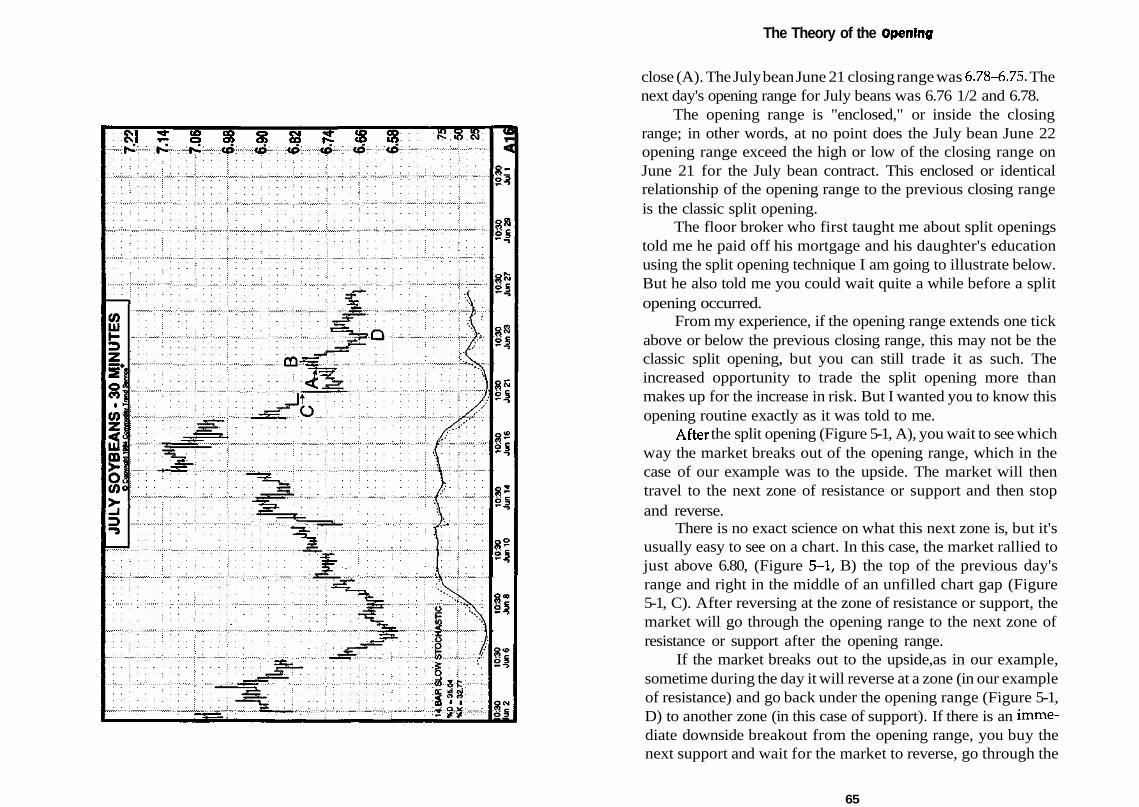
! ? 8 8 8 8 S S £8
The Theory of the Opening
close (A). The July bean June 21 closing range was 6.78-6.75. Thenext day's opening range for July beans was 6.76 1/2 and 6.78.
The opening range is "enclosed," or inside the closingrange; in other words, at no point does the July bean June 22opening range exceed the high or low of the closing range onJune 21 for the July bean contract. This enclosed or identicalrelationship of the opening range to the previous closing rangeis the classic split opening.
The floor broker who first taught me about split openingstold me he paid off his mortgage and his daughter's educationusing the split opening technique I am going to illustrate below.But he also told me you could wait quite a while before a splitopening occurred.
From my experience, if the opening range extends one tickabove or below the previous closing range, this may not be theclassic split opening, but you can still trade it as such. Theincreased opportunity to trade the split opening more thanmakes up for the increase in risk. But I wanted you to know thisopening routine exactly as it was told to me.
After the split opening (Figure 5-1, A), you wait to see whichway the market breaks out of the opening range, which in thecase of our example was to the upside. The market will thentravel to the next zone of resistance or support and then stopand reverse.
There is no exact science on what this next zone is, but it'susually easy to see on a chart. In this case, the market rallied tojust above 6.80, (Figure 5-1, B) the top of the previous day'srange and right in the middle of an unfilled chart gap (Figure5-1, C). After reversing at the zone of resistance or support, themarket will go through the opening range to the next zone ofresistance or support after the opening range.
If the market breaks out to the upside,as in our example,sometime during the day it will reverse at a zone (in our exampleof resistance) and go back under the opening range (Figure 5-1,D) to another zone (in this case of support). If there is an imme-diate downside breakout from the opening range, you buy thenext support and wait for the market to reverse, go through the
65
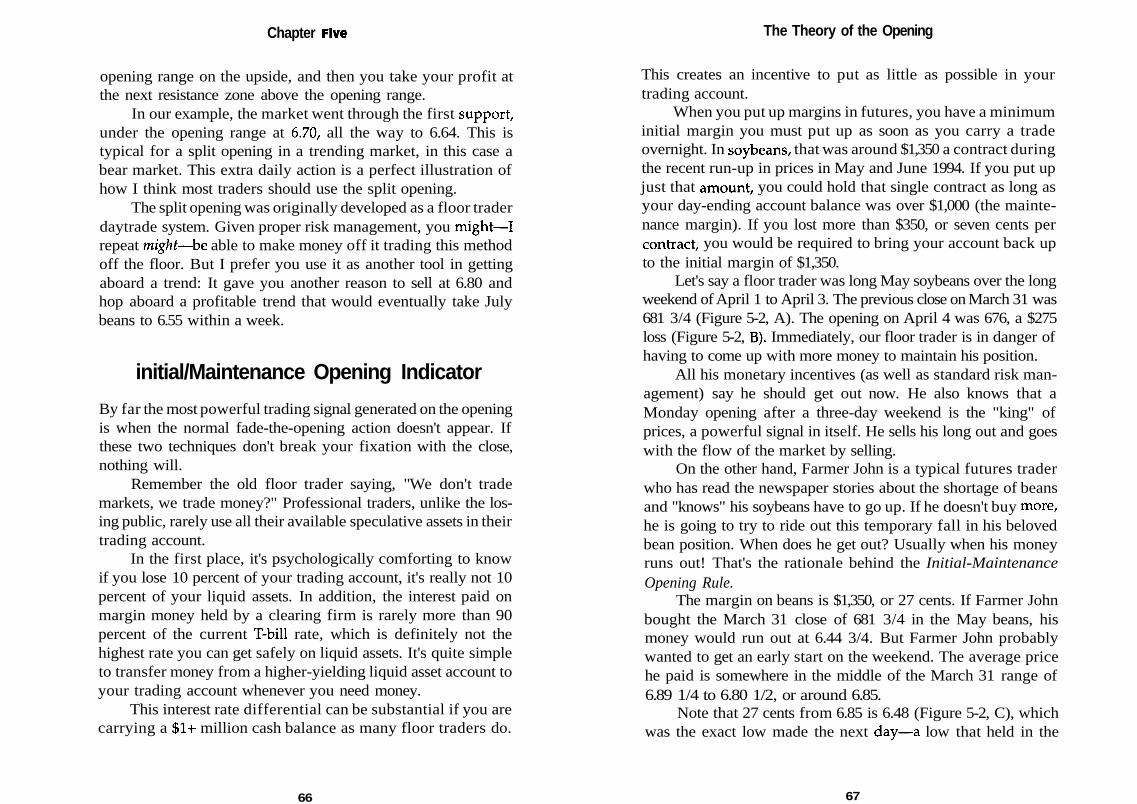
Chapter Five
opening range on the upside, and then you take your profit atthe next resistance zone above the opening range.
In our example, the market went through the first support,under the opening range at 6.70, all the way to 6.64. This istypical for a split opening in a trending market, in this case abear market. This extra daily action is a perfect illustration ofhow I think most traders should use the split opening.
The split opening was originally developed as a floor traderdaytrade system. Given proper risk management, you might—Irepeat might—be able to make money off it trading this methodoff the floor. But I prefer you use it as another tool in gettingaboard a trend: It gave you another reason to sell at 6.80 andhop aboard a profitable trend that would eventually take Julybeans to 6.55 within a week.
initial/Maintenance Opening Indicator
By far the most powerful trading signal generated on the openingis when the normal fade-the-opening action doesn't appear. Ifthese two techniques don't break your fixation with the close,nothing will.
Remember the old floor trader saying, "We don't trademarkets, we trade money?" Professional traders, unlike the los-ing public, rarely use all their available speculative assets in theirtrading account.
In the first place, it's psychologically comforting to knowif you lose 10 percent of your trading account, it's really not 10percent of your liquid assets. In addition, the interest paid onmargin money held by a clearing firm is rarely more than 90percent of the current T-bill rate, which is definitely not thehighest rate you can get safely on liquid assets. It's quite simpleto transfer money from a higher-yielding liquid asset account toyour trading account whenever you need money.
This interest rate differential can be substantial if you arecarrying a $1+ million cash balance as many floor traders do.
66
The Theory of the Opening
This creates an incentive to put as little as possible in yourtrading account.
When you put up margins in futures, you have a minimuminitial margin you must put up as soon as you carry a tradeovernight. In soybeans, that was around $1,350 a contract duringthe recent run-up in prices in May and June 1994. If you put upjust that amount, you could hold that single contract as long asyour day-ending account balance was over $1,000 (the mainte-nance margin). If you lost more than $350, or seven cents percontract, you would be required to bring your account back upto the initial margin of $1,350.
Let's say a floor trader was long May soybeans over the longweekend of April 1 to April 3. The previous close on March 31 was681 3/4 (Figure 5-2, A). The opening on April 4 was 676, a $275loss (Figure 5-2, B). Immediately, our floor trader is in danger ofhaving to come up with more money to maintain his position.
All his monetary incentives (as well as standard risk man-agement) say he should get out now. He also knows that aMonday opening after a three-day weekend is the "king" ofprices, a powerful signal in itself. He sells his long out and goeswith the flow of the market by selling.
On the other hand, Farmer John is a typical futures traderwho has read the newspaper stories about the shortage of beansand "knows" his soybeans have to go up. If he doesn't buy more,he is going to try to ride out this temporary fall in his belovedbean position. When does he get out? Usually when his moneyruns out! That's the rationale behind the Initial-MaintenanceOpening Rule.
The margin on beans is $1,350, or 27 cents. If Farmer Johnbought the March 31 close of 681 3/4 in the May beans, hismoney would run out at 6.44 3/4. But Farmer John probablywanted to get an early start on the weekend. The average pricehe paid is somewhere in the middle of the March 31 range of6.89 1/4 to 6.80 1/2, or around 6.85.
Note that 27 cents from 6.85 is 6.48 (Figure 5-2, C), whichwas the exact low made the next day—a low that held in the
67
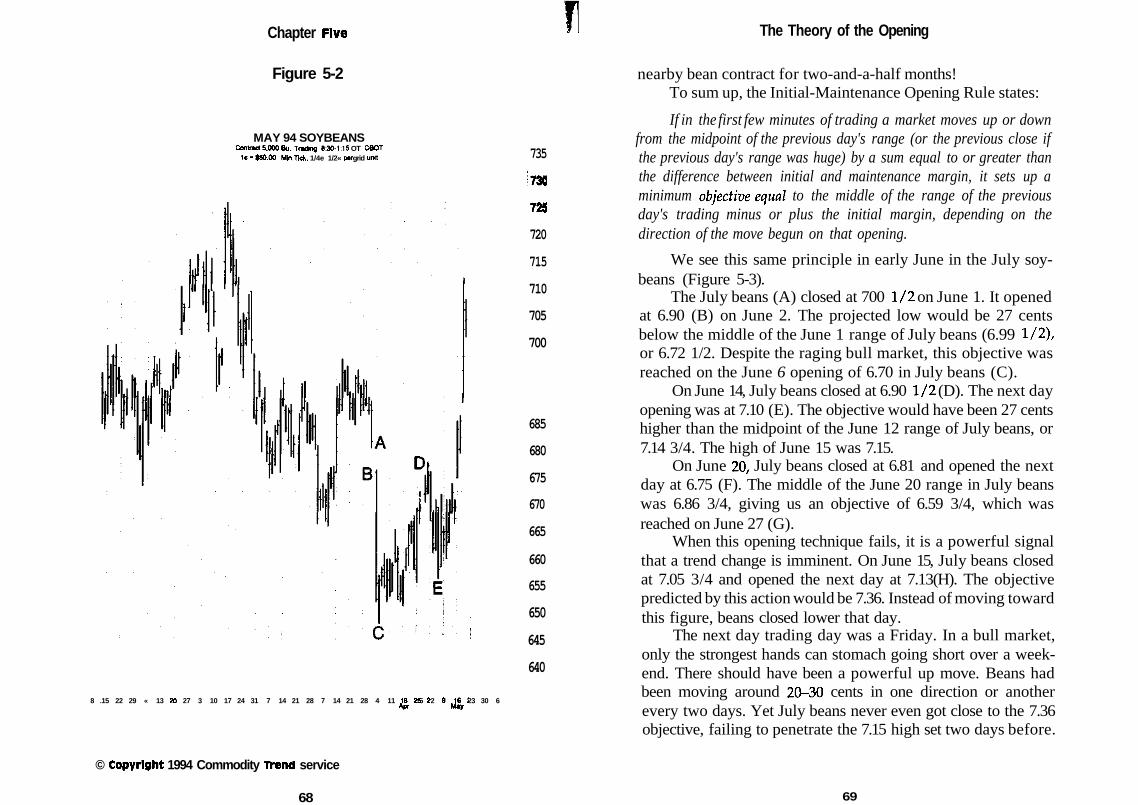
Chapter Five IIFigure 5-2
MAY 94 SOYBEANSContract 5.000 Bu. Trading: 8:30-1:15 OT CBOT
tc-$50.00 Min.TK*: 1/4e 1/2« fK grid unit 735
^730
72S
720
715
710
705
700
685
680
675
670
665
660
655
650
645
640
8 .15 22 29 « 13 20 27 3 10 17 24 31 7 14 21 28 7 14 21 28 4 11 18 25 2 9 .16 23 30 6&* 2 "JV
The Theory of the Opening
© Copyright 1994 Commodity Trend service
68
nearby bean contract for two-and-a-half months!To sum up, the Initial-Maintenance Opening Rule states:
If in the first few minutes of trading a market moves up or downfrom the midpoint of the previous day's range (or the previous close ifthe previous day's range was huge) by a sum equal to or greater thanthe difference between initial and maintenance margin, it sets up aminimum objective equal to the middle of the range of the previousday's trading minus or plus the initial margin, depending on thedirection of the move begun on that opening.
We see this same principle in early June in the July soy-beans (Figure 5-3).
The July beans (A) closed at 700 1/2 on June 1. It openedat 6.90 (B) on June 2. The projected low would be 27 centsbelow the middle of the June 1 range of July beans (6.99 1/2),or 6.72 1/2. Despite the raging bull market, this objective wasreached on the June 6 opening of 6.70 in July beans (C).
On June 14, July beans closed at 6.90 1/2 (D). The next dayopening was at 7.10 (E). The objective would have been 27 centshigher than the midpoint of the June 12 range of July beans, or7.14 3/4. The high of June 15 was 7.15.
On June 20, July beans closed at 6.81 and opened the nextday at 6.75 (F). The middle of the June 20 range in July beanswas 6.86 3/4, giving us an objective of 6.59 3/4, which wasreached on June 27 (G).
When this opening technique fails, it is a powerful signalthat a trend change is imminent. On June 15, July beans closedat 7.05 3/4 and opened the next day at 7.13(H). The objectivepredicted by this action would be 7.36. Instead of moving towardthis figure, beans closed lower that day.
The next day trading day was a Friday. In a bull market,only the strongest hands can stomach going short over a week-end. There should have been a powerful up move. Beans hadbeen moving around 20-30 cents in one direction or anotherevery two days. Yet July beans never even got close to the 7.36objective, failing to penetrate the 7.15 high set two days before.
69
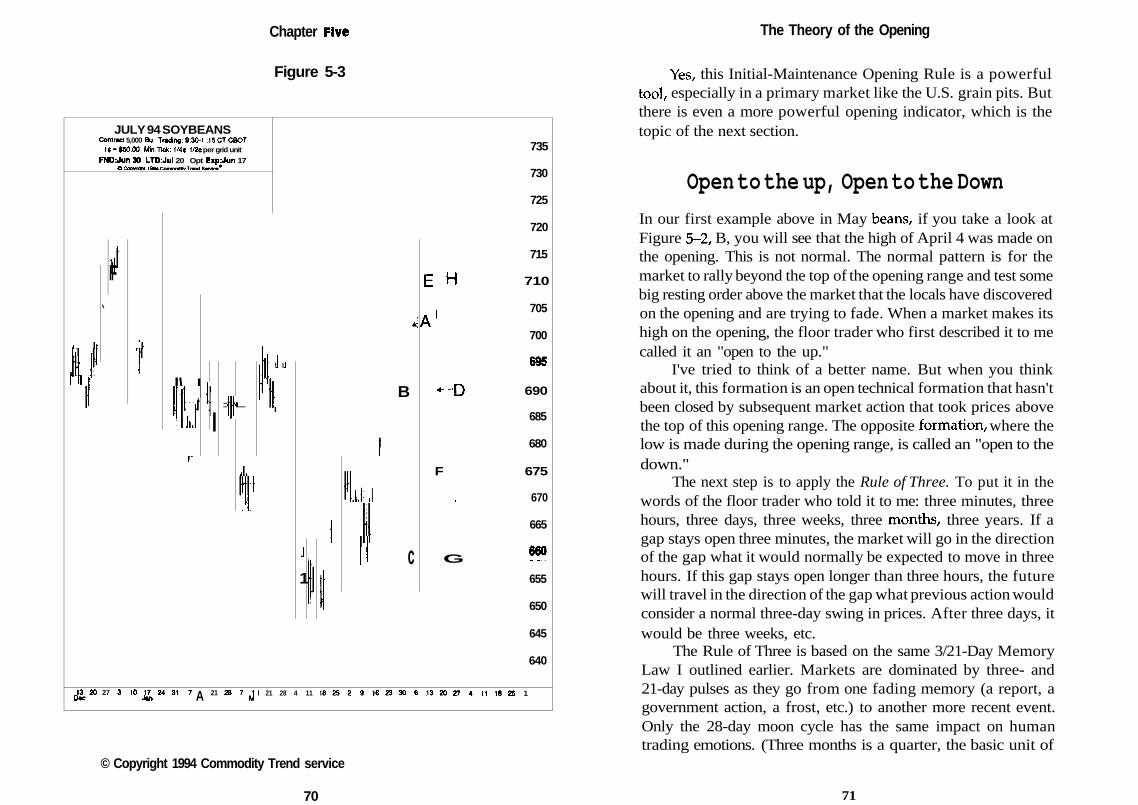
Chapter Five
Figure 5-3
The Theory of the Opening
JULY 94 SOYBEANSContract 5,000 Bu. Tradng: 9:30-1 :15CTCBOT1t-$50.00 Min.Tiek:1Mt 1/2t per grid unit
FND:Jun 30 LTO:Jul 20 Opt Exp:Jun 17C CaowtoM IflBl ComnodKv Tnnd Swvlc**
111 1
l\ 1
I1
[&M
\
iIF
27 3
j1l\ II f
r
I
10 JZ, 24 31 7 A
I
21
1
1
28
1"II1
7 J
III&,J ,J
I
J
11
I 21 28 4 11
*j
B
1
1
1
I I I
I
1 1 c
735
730
725
720
715
E H 710
705A '
700
cocD93
+ -D 690
685
680
F 675
. 670
665
G ^
655
650
645
640
1 8 2 5 2 9 1 6 2 3 3 0 6 1 3 2 0 2 7 4 1 1 1 8 2 5 1
© Copyright 1994 Commodity Trend service
70
Yes, this Initial-Maintenance Opening Rule is a powerfultool, especially in a primary market like the U.S. grain pits. Butthere is even a more powerful opening indicator, which is thetopic of the next section.
Open to the up, Open to the Down
In our first example above in May beans, if you take a look atFigure 5-2, B, you will see that the high of April 4 was made onthe opening. This is not normal. The normal pattern is for themarket to rally beyond the top of the opening range and test somebig resting order above the market that the locals have discoveredon the opening and are trying to fade. When a market makes itshigh on the opening, the floor trader who first described it to mecalled it an "open to the up."
I've tried to think of a better name. But when you thinkabout it, this formation is an open technical formation that hasn'tbeen closed by subsequent market action that took prices abovethe top of this opening range. The opposite formation, where thelow is made during the opening range, is called an "open to thedown."
The next step is to apply the Rule of Three. To put it in thewords of the floor trader who told it to me: three minutes, threehours, three days, three weeks, three months, three years. If agap stays open three minutes, the market will go in the directionof the gap what it would normally be expected to move in threehours. If this gap stays open longer than three hours, the futurewill travel in the direction of the gap what previous action wouldconsider a normal three-day swing in prices. After three days, itwould be three weeks, etc.
The Rule of Three is based on the same 3/21-Day MemoryLaw I outlined earlier. Markets are dominated by three- and21-day pulses as they go from one fading memory (a report, agovernment action, a frost, etc.) to another more recent event.Only the 28-day moon cycle has the same impact on humantrading emotions. (Three months is a quarter, the basic unit of
71
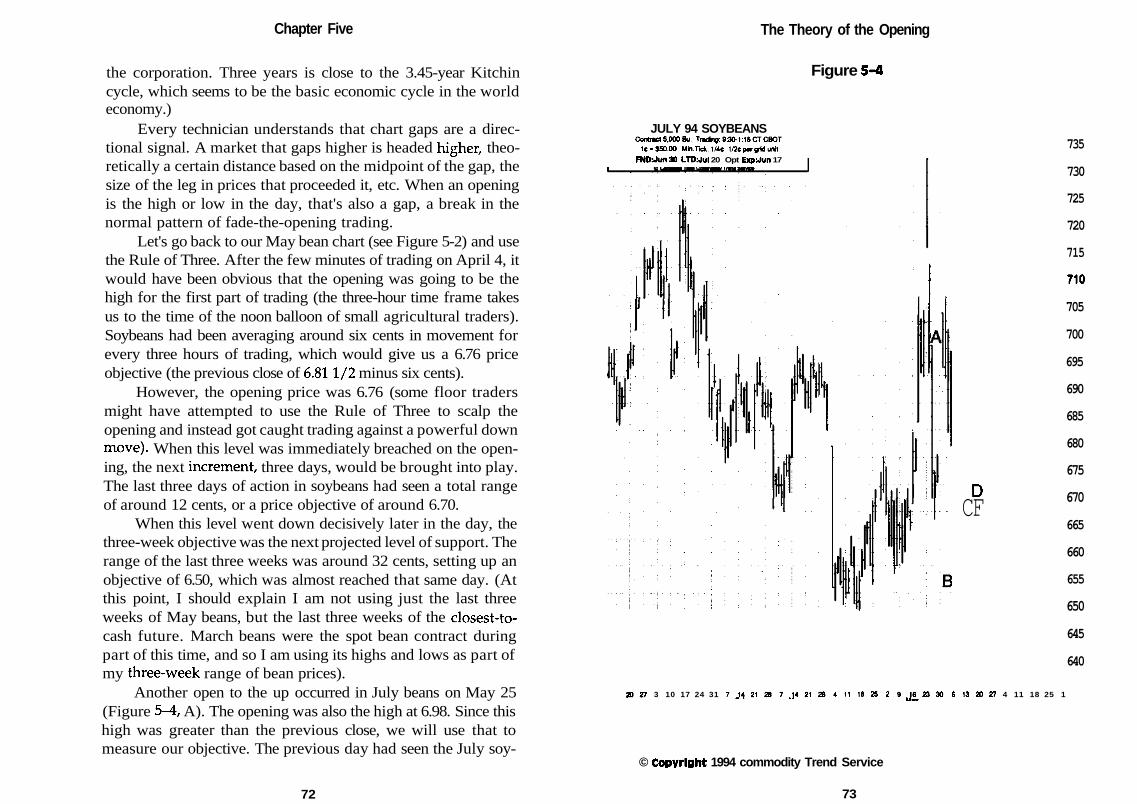
Chapter Five The Theory of the Opening
the corporation. Three years is close to the 3.45-year Kitchincycle, which seems to be the basic economic cycle in the worldeconomy.)
Every technician understands that chart gaps are a direc-tional signal. A market that gaps higher is headed higher, theo-retically a certain distance based on the midpoint of the gap, thesize of the leg in prices that proceeded it, etc. When an openingis the high or low in the day, that's also a gap, a break in thenormal pattern of fade-the-opening trading.
Let's go back to our May bean chart (see Figure 5-2) and usethe Rule of Three. After the few minutes of trading on April 4, itwould have been obvious that the opening was going to be thehigh for the first part of trading (the three-hour time frame takesus to the time of the noon balloon of small agricultural traders).Soybeans had been averaging around six cents in movement forevery three hours of trading, which would give us a 6.76 priceobjective (the previous close of 6.811/2 minus six cents).
However, the opening price was 6.76 (some floor tradersmight have attempted to use the Rule of Three to scalp theopening and instead got caught trading against a powerful downmove). When this level was immediately breached on the open-ing, the next increment, three days, would be brought into play.The last three days of action in soybeans had seen a total rangeof around 12 cents, or a price objective of around 6.70.
When this level went down decisively later in the day, thethree-week objective was the next projected level of support. Therange of the last three weeks was around 32 cents, setting up anobjective of 6.50, which was almost reached that same day. (Atthis point, I should explain I am not using just the last threeweeks of May beans, but the last three weeks of the closest-to-cash future. March beans were the spot bean contract duringpart of this time, and so I am using its highs and lows as part ofmy three-week range of bean prices).
Another open to the up occurred in July beans on May 25(Figure 5-4, A). The opening was also the high at 6.98. Since thishigh was greater than the previous close, we will use that tomeasure our objective. The previous day had seen the July soy-
72
Figure 5-4
JULY 94 SOYBEANSConmct5,000Bu. Tradng:9:30-t:1SCTCBOT
1C-MOOO Mn.Ttdt:1M« 1/2«pwgridunttFNDtJiin 30 LTO:Jul 20 Opt ExpJun 17
D
CF
735
730
725
720
715
710
705
700
695
690
685
680
675
670
665
660
655
650
645
640
2027 3 10 17 24 31 7 J 4 2 1 2 8 7 1 4 2 1 2 8 4 1 1 1 8 2 5 2 8 J 6 2 3 3 0 6 1 3 2 0 2 7 4 11 18 25 1
© Copyright 1994 commodity Trend Service
73
Chapter Five
X
bean contract plunge 391 /4 cents. Eighty percent of 391 /4 (threehours is about 80 percent of the time the soybean market is open)is 31 1/4 cents, and 31 1/4 cents from the opening of 6.98 onMay 25 would give us a goal of 6.66 3/4—almost identical tothe 6.66 low reached the next day on May 26 (B).
An open to the down occurred on June 9 in the July beans(C). The low of the day was made on the opening at 6.70. Basedon the previous close of 6.67 3/4 and the previous day's rangeof prices of 12 1/2 cents, that would give a three-hour objectiveof 6.77 3/4 near the high of that day.
Two days later, the market attempted to close the gap cre-ated by the open to the down at 6.70. It opened at 6.71 (D) andmade a low of 6.701/2 and then sprang up straight. The three-dayrule would give us an objective of 6.90 1/4 (22 cent range plus theprevious gap close of 6.67 3/4). When this level was decisivelybroken on June 15 (E), the three-week objective was 7.18 1/4 (6.673/4 plus the 50 1/2 cent range of the last three weeks).
That's not quite the high of the move of 7.15 made that day,but it was one more piece of evidence to add to the failure of theInitial-Maintenance Opening Rule that this soybean move wasalmost over.
When an open to the down or an open to the up is filled(that is, the market goes lower than the open to the down orhigher than the open to the up), there is almost always a sharpreversal right after this happens.
The 6.76 open to the up on April 4 was finally filled whenthe May beans went to 6.78 on April 29 (Figure 5-2, D). Imme-diately May beans fell, eventually reaching 6.56 1/4 on May 5(Figure 5-2, E).
The open to the up at 6.98 of the July beans on May 25 wasfilled when July beans opened at 7.04 on June 1. That was thehigh of that day, and July beans fell to 6.92 the next day.
The open to the down of June 6 at 6.70 in the July beanswas filled on June 21, when July beans made a low of 6.69 (Figure5-4, F). Despite the powerful bear market that would carry soy-beans a dollar lower a month later, the July beans never lookedback and rallied straight to 6.80 1/2 the next day.
74
The Theory of the Opening
At this point, you probably think I am deliberately lookingfor the best examples of these previous two opening techniques.Actually, I just used the first examples I could find over the lastfew months.
Yes, I did look first at the most likely suspect to find exam-ples—a bull market in grains that was full of volatility andunsophisticated traders. But all I can say is that these techniqueswork more often than not in any primary market. Try it yourselfon many different markets. You'll wonder how you traded be-fore you knew about these opening techniques.
The opening is the most important price of the day. That'swhy those floor traders could take a break after it occurred. Theyknew what was probably going to happen the rest of the day.They already had made their money (or at the very least hadtaken a minimum amount of losses).
So apply the same opening techniques the floor traders useand take a break, like they do, from the screen. In my opinion,freedom from the tyranny of always having to watch the screenis worth just as much to you as any technique I write about.
75
Chapter Six
The Routineof the Market
I
If you went to college, perhaps you were forced like I was to sitthrough some required Psych 101 class. To this day, I am suspi-cious of what passes for psychology. But I do remember oneclassic experiment.
A number of people are put into a room with a psychologist.All but one are "ringers" put there by the psychologist. Theunsuspecting individual is seated last away from the psycholo-gist. In this room is a film screen. A picture is flashed on thescreen of two sticks. One is slightly, but clearly, longer than theother.
The psychologist then asks the ringers: "Are these sticks thesame size?" All around the room each of the ringers say "Yes."What do you think the poor slob who wasn't in on the trick said?Most of the time he or she said, "Yes," too! Testing showed thisphenomena became quite strong after eight ringers had an-swered and leveled out after 12 ringers had said their lying"Yesses."
I often think of the public futures trader as that poor slob.He's always being confused into thinking 2 + 2 = 5. It's not thathe is being lied to all the time. It's just that his ignorance of
77
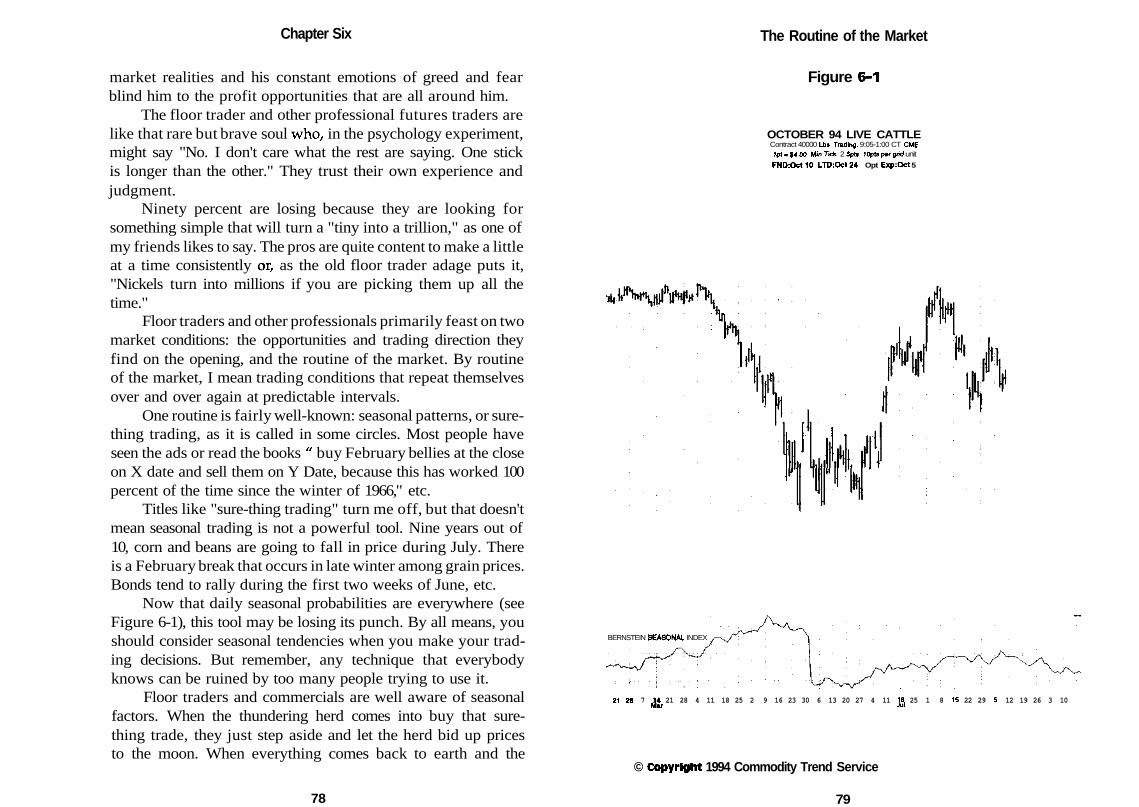
Chapter Six
market realities and his constant emotions of greed and fearblind him to the profit opportunities that are all around him.
The floor trader and other professional futures traders arelike that rare but brave soul who, in the psychology experiment,might say "No. I don't care what the rest are saying. One stickis longer than the other." They trust their own experience andjudgment.
Ninety percent are losing because they are looking forsomething simple that will turn a "tiny into a trillion," as one ofmy friends likes to say. The pros are quite content to make a littleat a time consistently or, as the old floor trader adage puts it,"Nickels turn into millions if you are picking them up all thetime."
Floor traders and other professionals primarily feast on twomarket conditions: the opportunities and trading direction theyfind on the opening, and the routine of the market. By routineof the market, I mean trading conditions that repeat themselvesover and over again at predictable intervals.
One routine is fairly well-known: seasonal patterns, or sure-thing trading, as it is called in some circles. Most people haveseen the ads or read the books " buy February bellies at the closeon X date and sell them on Y Date, because this has worked 100percent of the time since the winter of 1966," etc.
Titles like "sure-thing trading" turn me off, but that doesn'tmean seasonal trading is not a powerful tool. Nine years out of10, corn and beans are going to fall in price during July. Thereis a February break that occurs in late winter among grain prices.Bonds tend to rally during the first two weeks of June, etc.
Now that daily seasonal probabilities are everywhere (seeFigure 6-1), this tool may be losing its punch. By all means, youshould consider seasonal tendencies when you make your trad-ing decisions. But remember, any technique that everybodyknows can be ruined by too many people trying to use it.
Floor traders and commercials are well aware of seasonalfactors. When the thundering herd comes into buy that sure-thing trade, they just step aside and let the herd bid up pricesto the moon. When everything comes back to earth and the
The Routine of the Market
Figure 6-1
OCTOBER 94 LIVE CATTLEContract 40000 Lbs Trading: 9:05-1:00 CT CME1pt.$400 Win Tick: 2 Spts 10pte pcrgrid unit
FND:Oct10 LTD:Oct24 Opt Exp:Oct 5
BERNSTEIN SEASONAL INDEX
dir J321 28 7 14 21 28 4 11 18 25 2 9 16 23 30 6 13 20 27 4 11 18 25 1 8 15 22 29 5 12 19 26 3 10
© Copyright 1994 Commodity Trend Service
78 79
Chapter Six
thundering herd has been stopped out, they quietly pick up thepieces and take advantage of the seasonal trade.
For this reason, and because I am determined to discussonly rarely used techniques in this book, I am going to skip anydiscussion of seasonal trading. But there are many other calendarroutines in futures.
Each day has its own routine. Monday, as the opening day,often sets the tone for the week. Tuesday is often a top or bottomof a move. Tuesday at 10:30 A.M is supposedly the favorite timefor grain tops and bottoms. It didn't quite work with grains in1988 (the top was closer to 11:00 A.M.) but it sure did work in thestock bottom of 1987.
Wednesday has some of the most powerful trends of the week.If you must daytrade, Wednesday is your day. I believe the bigmoney decides how next week is going to trade on Wednesdayand trades accordingly. Thursday is an evening up day as thebigger traders are already maneuvering for the weekend.
Friday is the fear day. In a weather market in grains, if thelow of the week is Monday, the high will usually be on Friday.If the high is on Monday, the low of the week will be on Friday.Small traders finally decide to abandon their losing positions asthey face a weekend. Gold (and, to a lesser extent, bonds) oftenis lower on Monday when the world doesn't blow up over theweekend.
Monthly and Quarterly Routines
The month has its routines. The margin on crude oil increasesfive days before the contract ends. On first notice day of otherfutures, you can possibly get delivery. As a result, most specula-tive houses force their clients to roll over or liquidate their con-tracts at these times. Since the public is mainly long, the end resultis artificially low prices. These spot futures normally will rallyafterwards.
The floor knows this and usually buys up everything insight during the period around first notice day (sometimes this
80
The Routine of the Market
doesn't work in extreme bear markets, but Neal Weintraub, whotrades on the floor, says 77 percent of the time it does). If floortraders get delivery, they've already made arrangements withtheir clearing firm or bank to lend the money on the full networth of the contract. They can borrow $1 million or even $10million for a day or two on their signature. They only have topay the interest on that money for the amount of time they areholding the contract.
Another monthly routine is the Social Security effect incattle. The first weekend after Social Security checks are deliv-ered (usually the third or the fourth day of the month) is a bannerday for red meat sales.
Retailers know that consumers will be flush with govern-ment checks and monthly payrolls, ready to spend money onhigh-priced meat. (The end of the month, when people run outof money and can only afford hamburger, is the time for the realgrocery sales. Consumers can save at least 5 percent on theirgrocery bills just by getting all their items then.)
It takes about a week to slaughter cattle, dress the meat,box it, ship it to the cooler of the grocery store, and then have it i^.priced in time for the start of the sales on Thursday. Therefore,a week before Social Security Thursday is a time of higher-than-average cattle prices. A week before the last Thursday of themonth is a time of (relatively) low cattle prices.
Many stock traders understand that institutions get newmoney to invest the first few days of the month and that divi-dends, monthly salaries and government checks all are issuedin the first 10 days of the month. That's why stocks tend to bestrong those first 10 days.
Stock traders also know that institutional traders "win-dow dress" before the end of the quarter. If it was a bad quarterfor stocks and bonds (like the first quarter of 1994), they willsell stocks and bonds before the last day of the quarter toconvince the people who invest with them that they don't ownany losers.
If gold and other commodities did well (like the first quarterof 1994), they'd buy gold and commodities before the end of the
81
Chapter six
quarter so they can pretend they were smart enough to own thewinners. Needless to say, these actions created golden opportu-nities for those who knew it was time to sell gold and buy stocksand bonds.
Another "Quarterly Routine" is the various governmentauctions of notes and bonds. By some strange coincidence, thenews for bonds and notes always seems to be good just beforeand just after these auctions.
Invariably any pronounced weakness in the bond and notemarkets comes at least a week after these auctions, giving gov-ernment security dealers plenty of time to market or hedge theexcess "inventory" they bought during these auctions
The Monthly Brokerage Effect
Here's a dirty little secret that I never could get published in afinancial magazine: One of the reasons I wrote this book is to giveyou the truth, unfiltered and uncensored, about a monthly bro-kerage effect I call the End-of-the-Month Commission Rule.
Brokers are like everyone. They run out of money at theend of the month. When that happens, they become most crea-tive in getting their clients to trade and generate commissions,whether the investment they tout is good for the client or not.
I spent many years as a broker in futures-only firms or as thetoken futures broker in several stock houses. Believe me, I saw ithappen again and again. It's one of the reasons why I quit being abroker. Eventually, I knew I might succumb to this temptation.
In futures, commissions are normally paid monthly basedon the entire month's production. In futures, the last day of themonth is known as "pay-the-mortgage day." Check out howmany times futures make at least a short-term high or low onthe last day of the month.
In stocks, it takes five business days from the time a stockis sold until it is settled, i.e., when the money changes hands.Settlement day is the day the broker gets credit for commissions.
82
The Routine of the Market
See for yourself how many times the stock market has made ashort-term high or low five business days from the end of themonth.
No, the End-of-the-Month Commission Rule doesn't al-ways work. But if you think the 70-point Dow rally we had onAugust 24,1994, five business days before the end of the month,didn't have a thing to do with the monthly brokerage effect, youare just like that poor slob in the psych experiment. You refuseto believe what your very eyes tell you because every financialinstitution is reassuring you it's all an unfortunate coincidence.Coincidences like these are what enables the floor trader to payfor his million-dollar exchange seat.
The Routines of Bull and Bear Markets
One of the most obvious routines is that markets fall faster thanthey go up. I have seen figures that state, on average, they fallthree times faster than they go up. Anyone who saw three yearsof a bull S&P 500 market disappear in 13 trading days duringOctober 1987 might say that figure is very conservative.
Take some of the other great bull markets in history: the1973 soybean and cattle market, The 1974 sugar market, thesilver market of late 1979 to early 1980. As I pointed out in thefirst chapter of this book, each collapsed 45 percent in less thantwo months (just like the 1987 stock market).
Only in sugar did a futures market go up almost as fast asit went down. The average of these four market futures crashesis about 3-to-l—the downside was three times faster than theprevious upside move.
This brings me to this major routine of the market: Bearmarkets make much shallower retracements than bull markets:one-third, one-fifth, and one-eighth retracements versus the .382,.5, .618, etc., retracements of bull markets. It's harder to get backon the train if you attempt to countertrend-trade in a bear mar-ket.
There are so many profound trading implications from this
83
Chapter Six Iffact I can only begin to scratch the surface of them in this book.Chart patterns that work in bull trends don't work the same inbear markets. A system that is good in an uptrend is not so goodin a downtrend. Just like stock trading (with its 50 percent mar-gins) produces different trading patterns than futures trading(with its 5 percent margins), so bear markets must be treateddifferently than bull markets.
I have not backtested it (I'll leave that to all you out therewith those computerized test programs), but I am sure a shortermoving average (like 15 days) works better than a 20-day mov-ing average during down markets. If there is one single reasonwhy there will never be any Holy Grail system that is immensely
[profitable in all circumstances, the difference between bull andbear markets has got to be it.
Carrying Charges
Another routine that never seems to get the attention it deservesfrom all those market experts is the carrying charge betweendifferent months of the same futures market.
In August of 1994, August Comex gold closed at 383.30 (I'lluse this as the cash price of gold). The December gold contractfinished at 388.10, a $480 premium over August ($355.10 -$383.30 x 100, the number of ounces in a contract). If gold pricesstay level between now and December 1, the price of Decembergold will gradually fall to 383.30. Since the minimum margin ongold is a little over $1,000, that's about a 45 percent return onyour money if you went short and the price of gold held steady.
Today, September Treasury bonds closed at 102-12 whileDecember bonds closed at 101-19, a 25-point ($781) difference(remember that a tick for a bond contract is 1/32). The ratiobetween the delivery dates of December and September bondsis constant, so for purposes of illustration I will call the Septem-ber close the cash price. (Yes, I understand that since the Sep-tember contract is also discounted to the present cash bond price,this figure is not accurate. But for illustration purposes, it will do.)
The Routine of the Market
The minimum margin on one T-bond contract is $2,700. Ifthe cash price of bonds stays the same between now and Decem-ber and you went long December bonds, that's about a 29 percentreturn.
Previously I talked about how a 35 percent return wouldmake you rich if you could sustain it over 10 years. Here are 29percent and 45 percent returns you can have if only gold andbonds remain in nontrending markets—which most markets do85 percent of the time. It's the futures equivalent of selling anoption with a large premium. You get paid to sit.
Here's one way I know to use this premium play in yourtrading decisions. Whatever future you are thinking about for apremium play, find out the range that occurred before in a timeinterval equal to the time ahead of your premium future on theday of your analysis.
In the case of gold, December is a little more than threemonths ahead of when I write. The last three months of tradinghas seen the closest-to-cash Comex gold contract move in a rangeof about 20.20, or $2,020 (when you multiply by 100 ounces ina contract). $480 to $2,020 is about a 23 percent carry chargepayout-to-risk ratio. The higher the number, the better the oddsto go short (or, in the case of the positive carry charge of bonds,go long).
Of course, markets can suddenly explode against the direc-tion of the carry charge. So this technique, like every technique,cannot be used alone. But it's another thing to consider whenyour other indicators expect the market to go in the direction ofthe carrying charge.
Minor (But Profitable) Routines
The Rule of Doubles says that when something has doubled inprice, it is due for a sell-off. It applies to doubling the money youinvested, as well. It's one of the reasons why a floor trader toldme to take your money off the table when a future has returnedprofits equal to the amount you put up in margin. It's also one
84 85
Chapter six
of the reasons why the Initial-Maintenance Opening Rule worksso well.
The Rule of 72 is usually taken to mean the interest rate rule.If you want to know how long it will take to double your money,divide 72 by the interest percent your money is earning, i.e., yourmoney will double in eight years if you compound it at 9 percent.But futures trading has its own Rule of 72.
If a future has retraced 72 percent of a move, it will (even-tually) go all the way back to the start of the move. This ruleworks better on short-term swings of three days or less.
I'm sure you've seen how a new high or new low willsuddenly disappear on your screen as if it never existed. (Thisis not the obvious bad quote, which is far away from marketaction.) Wiped-out trades occur because pit conditions are wildand a broker on one side of the pit didn't hear the offer or bidof another broker and went on to the next tick before the otherbroker had satisfied his offer or bid. It also shows there was nota whole lot of selling (if the wiped-out quote is a high) or buying(if it was a low) at this point. Almost invariably, the market willgo back and officially print that wiped-out price.
Exchanges have quote boards with the yearly high and lowof each future traded. When a yearly high or low is taken out,floor traders go with the move. Forget everything you've learnedabout support and resistance when it comes to taking out theyearly high or low. The floor does over 50 percent of volume onany given day. Their buying or selling power will overwhelmanything in their way.
The importance of these numbers may not seem technicallyimportant when a later generation of technicians looks over thisaction. But the floor knows the truth of the old saying attributedto W. D. Gann: "Trading is learning how to buy high and sellhigher; to sell low and buy still lower."
Consider the 1993 bull bond market. For years I used to sayat seminars, "Bonds are going to 120." I'd get stares like I wascrazy. When an all-time high or low is pierced, you get the yearlyhigh/low effect in spades.
1 The Routine of the Market
Selling breeds selling and buying breeds buying. If the bondopening is strong, the stock opening will (usually) be strong. Ifgold is up on the opening, the tendency is for every other com-modity from crude oil to soybeans to be up.
It works the same way on the close. If the bonds close ontheir daily lows, sell the stock market. If the meats are weak, allthings being equal (no obvious fundamentals), the grains willclose weak.
During the late March/early April period we saw virtuallyevery commodity future rally together and then fall together. Wesaw every interest rate and stock future do just the opposite.This brings me to the sugar-cattle-copper closing indicator.
When you are a big trader or futures fund, you are like anelephant. Every time you move, you are in danger of smashingsomething. Your biggest problem (after determining long-termmarket direction) is to put your orders in in such a way youdon't crush the market. So you wait all day, patiently putting inorders little by little. But eventually, there comes the moment oftruth—the end of the trading day. If you have anything left tobuy or sell, you've got to do it now.
On a normal day, sugar is the first future to close. If it makesa sudden move down or up on the close, it may be a sign thata big boy is making a move. If this pattern continues on the nextmajor futures to close—copper and cattle—look for this patternto continue in grains, the precious metals, etc.
The Routine of Major Reports
I've discussed how the opening is like a minor report that occursat regular intervals. It's time now to talk about those dreadedreports like the Producer Price Index, the USDA Pig Crop Report,the July 1st Crop Conditions Report, etc., that can cause drasticchanges in markets.
If economic activity were a static affair (or if human emo-tions didn't come into play), the reaction to reports would gosomething like this: November soybeans close at 7.00 a bushel
86 87

Chapter six
before a major crop report. The expectations are for the govern-ment to issue an estimate of a two-billion-bushel soybean crop.The market has placed a value on the total crop of $14 billion($7.00 times two billion). The report comes out and shows a2.05-billion-bushel soybean crop. Based on this, the opening ofNovember should be 6.83 because 6.83 times 2.05 billion equals$14 billion, the previous amount allocated by the economy tothe soybean crop.
We know this is not accurate, because Economics 101 tellsus that lower prices will increase demand. So perhaps the No-vember beans should open at 6.90 to reflect this increased de-mand.
On the other hand, perhaps the estimates put out to thepublic of a two-billion-bushel crop were simply fodder for themasses. Putting out estimates for a crop report is not a courtproceeding. No one is under oath to tell you what he reallythinks and nothing but what he really thinks.
Even if the firm has customers, the embarrassment of awrong forecast is nothing compared to the embarrassment oflosing in the market. It's possible that everyone was secretlyexpecting a 2.05-billion-bushel soybean crop but wanted to getas high a price as they could before the report. So perhaps theNovember beans should really open unchanged or even higher!
The point is that the final arbiter of what a report reallymeans has to be market action, not the chatter of the analysts.Just like the opening call indicator, if a market that is expectedto open down after a report actually opens unchanged, that is avery powerful buy signal (and vice versa for a bullish report).
New information is constantly entering the market. Manyof these reports have been prepared from data collected a longtime ago (and much of it may have been leaked to the marketsalready). Especially when the media have been pounding a cer-tain line (unemployment report expected to pressure bonds,etc.), everybody that had to sell or buy (due to emotion or margincalls) will do so before the report. All weak hands have alreadyleft the market or changed their position to reflect the obviousway the report will come out. The only traders left daring to go
88
The Routine of the Market
against the media consensus are very strong hands who won'tbe shaken out even if the report comes out strongly in the direc-tion of the consensus.
In some markets, like the bond market, there seems to be areport that moves the market every day. On some days there aremany reports in the bond market (7:30 A.M. and 9:00 A.M. gov-ernment reports, a report from a Federal Reserve bank, or auc-tion results). But there are two basic market formations thatoccur before major reports that either your broker or the mediawill be talking about as "biggies":
1. Weak Hands Formation. A few days before a majorreport, the market will temporarily bottom or top, usu-ally at some minor support or resistance area obviouson the chart. Then there is a small countertrend rallyright up to the time the report is issued as weak handsare frightened out of the market. Most of the time thereport confirms the trend and the market goes on tomake new lows or highs.
2. Panic Formation. In this case, the market hammersdown into a major support level or rockets up to a majorresistance level just before the report is issued. After thereport is issued, the market has a major reversal even ifthe report is even worse than the market expected, forc-ing a new high or low on the opening after the report.
Figure 6-2, A shows the June bonds during late March andearly April. A is the day before and the day of the infamousMarch 1994 Unemployment Report issued April 1,1994. It wasinfamous not only for the bond collapse that followed but alsofor its release on Good Friday (this may have been the only timein history the U.S. markets have traded on this holiday).
Since the next Monday was an Easter Monday holiday inEurope, the American traders had two days to themselves totrade the U.S. bond market without major competition. Beingunable to take protection or advantage of a major report withoutskipping your vacation and trading long distance for two dayswould have been enough to shake the strongest European trader.
89
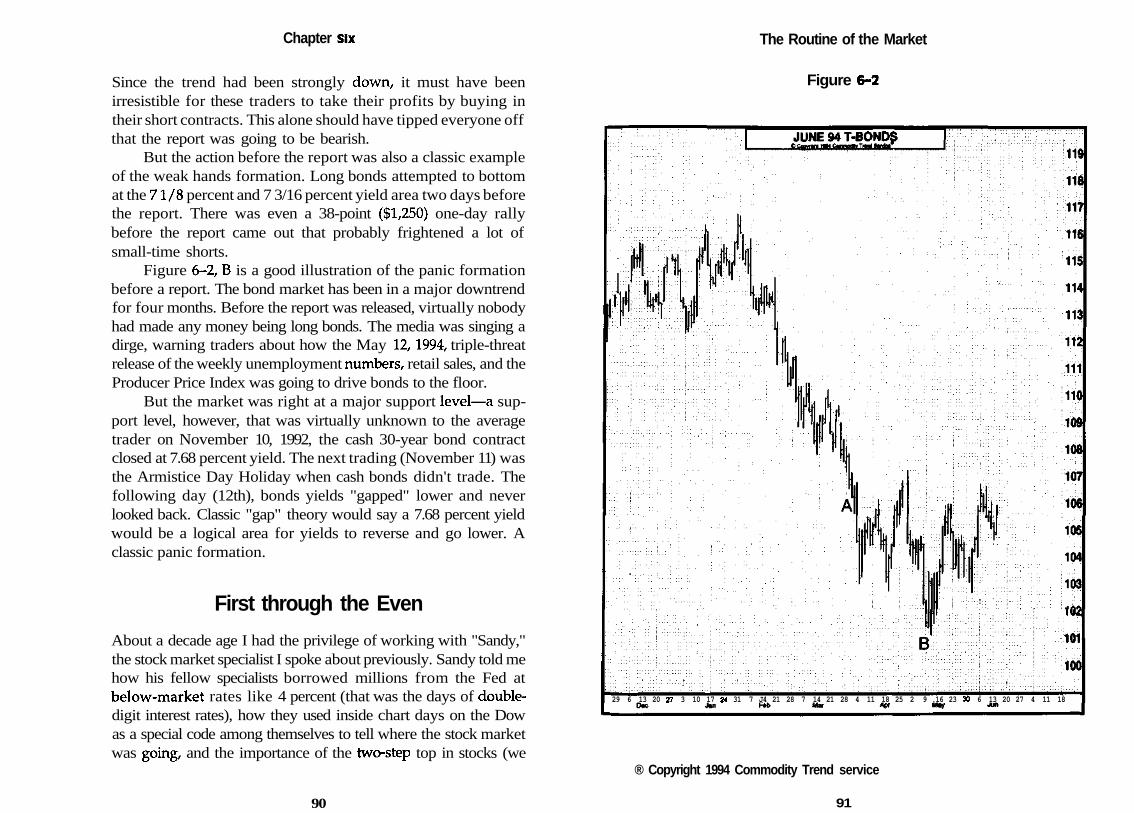
Chapter Six
Since the trend had been strongly down, it must have beenirresistible for these traders to take their profits by buying intheir short contracts. This alone should have tipped everyone offthat the report was going to be bearish.
But the action before the report was also a classic exampleof the weak hands formation. Long bonds attempted to bottomat the 71/8 percent and 7 3/16 percent yield area two days beforethe report. There was even a 38-point ($1,250) one-day rallybefore the report came out that probably frightened a lot ofsmall-time shorts.
Figure 6-2, B is a good illustration of the panic formationbefore a report. The bond market has been in a major downtrendfor four months. Before the report was released, virtually nobodyhad made any money being long bonds. The media was singing adirge, warning traders about how the May 12,1994, triple-threatrelease of the weekly unemployment numbers, retail sales, and theProducer Price Index was going to drive bonds to the floor.
But the market was right at a major support level—a sup-port level, however, that was virtually unknown to the averagetrader on November 10, 1992, the cash 30-year bond contractclosed at 7.68 percent yield. The next trading (November 11) wasthe Armistice Day Holiday when cash bonds didn't trade. Thefollowing day (12th), bonds yields "gapped" lower and neverlooked back. Classic "gap" theory would say a 7.68 percent yieldwould be a logical area for yields to reverse and go lower. Aclassic panic formation.
First through the Even
About a decade age I had the privilege of working with "Sandy,"the stock market specialist I spoke about previously. Sandy told mehow his fellow specialists borrowed millions from the Fed atbelow-market rates like 4 percent (that was the days of double-digit interest rates), how they used inside chart days on the Dowas a special code among themselves to tell where the stock marketwas going, and the importance of the two-step top in stocks (we
The Routine of the Market
Figure 6-2
29 6 13 20 27 3 10 17 24 31 7 J4 21 28 7 14 21 28 4 11 18 25 2 9 .16 23 30 6 13 20 27 4 11 18
® Copyright 1994 Commodity Trend service
90 91
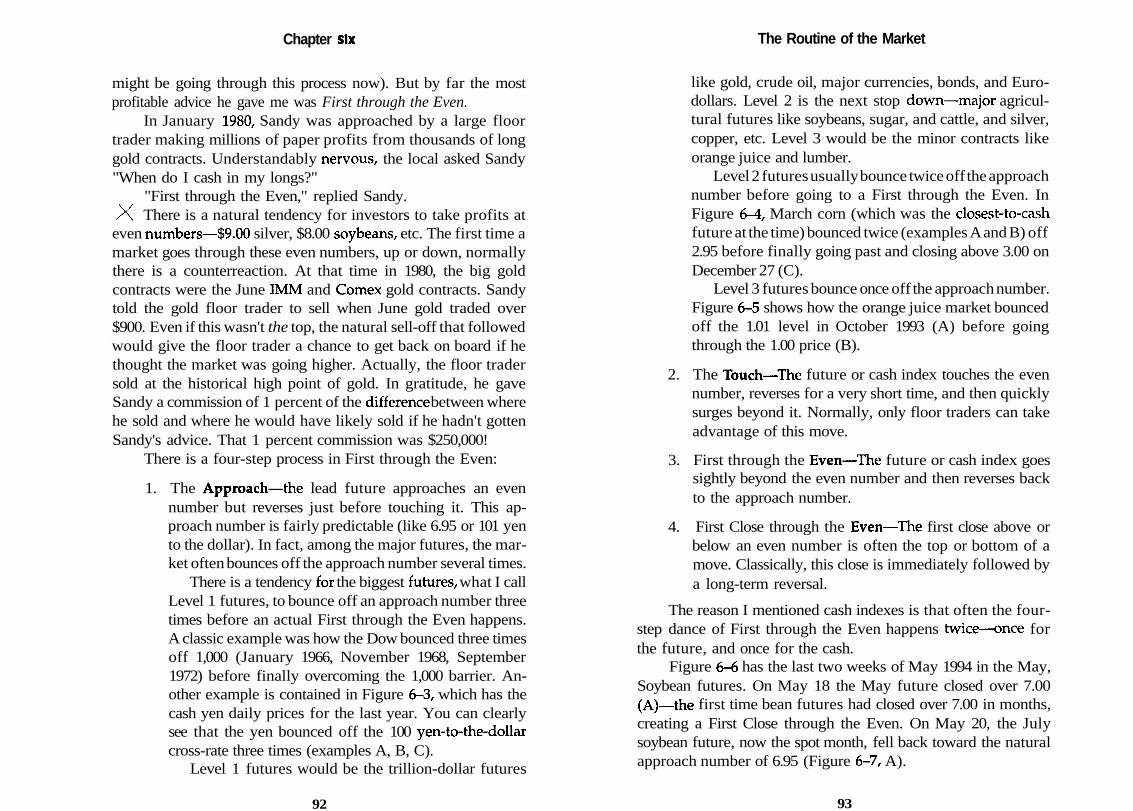
Chapter Six
might be going through this process now). But by far the mostprofitable advice he gave me was First through the Even.
In January 1980, Sandy was approached by a large floortrader making millions of paper profits from thousands of longgold contracts. Understandably nervous, the local asked Sandy"When do I cash in my longs?"
"First through the Even," replied Sandy.X, There is a natural tendency for investors to take profits at
even numbers—$9.00 silver, $8.00 soybeans, etc. The first time amarket goes through these even numbers, up or down, normallythere is a counterreaction. At that time in 1980, the big goldcontracts were the June IMM and Comex gold contracts. Sandytold the gold floor trader to sell when June gold traded over$900. Even if this wasn't the top, the natural sell-off that followedwould give the floor trader a chance to get back on board if hethought the market was going higher. Actually, the floor tradersold at the historical high point of gold. In gratitude, he gaveSandy a commission of 1 percent of the difference between wherehe sold and where he would have likely sold if he hadn't gottenSandy's advice. That 1 percent commission was $250,000!
There is a four-step process in First through the Even:
1. The Approach—the lead future approaches an evennumber but reverses just before touching it. This ap-proach number is fairly predictable (like 6.95 or 101 yento the dollar). In fact, among the major futures, the mar-ket often bounces off the approach number several times.
There is a tendency for the biggest futures, what I callLevel 1 futures, to bounce off an approach number threetimes before an actual First through the Even happens.A classic example was how the Dow bounced three timesoff 1,000 (January 1966, November 1968, September1972) before finally overcoming the 1,000 barrier. An-other example is contained in Figure 6-3, which has thecash yen daily prices for the last year. You can clearlysee that the yen bounced off the 100 yen-to-the-dollarcross-rate three times (examples A, B, C).
Level 1 futures would be the trillion-dollar futures
92
The Routine of the Market
like gold, crude oil, major currencies, bonds, and Euro-dollars. Level 2 is the next stop down—major agricul-tural futures like soybeans, sugar, and cattle, and silver,copper, etc. Level 3 would be the minor contracts likeorange juice and lumber.
Level 2 futures usually bounce twice off the approachnumber before going to a First through the Even. InFigure 6-4, March corn (which was the closest-to-cashfuture at the time) bounced twice (examples A and B) off2.95 before finally going past and closing above 3.00 onDecember 27 (C).
Level 3 futures bounce once off the approach number.Figure 6-5 shows how the orange juice market bouncedoff the 1.01 level in October 1993 (A) before goingthrough the 1.00 price (B).
2. The Touch—The future or cash index touches the evennumber, reverses for a very short time, and then quicklysurges beyond it. Normally, only floor traders can takeadvantage of this move.
3. First through the Even—The future or cash index goessightly beyond the even number and then reverses backto the approach number.
4. First Close through the Even—The first close above orbelow an even number is often the top or bottom of amove. Classically, this close is immediately followed bya long-term reversal.
The reason I mentioned cash indexes is that often the four-step dance of First through the Even happens twice—once forthe future, and once for the cash.
Figure 6-6 has the last two weeks of May 1994 in the May,Soybean futures. On May 18 the May future closed over 7.00(A)—the first time bean futures had closed over 7.00 in months,creating a First Close through the Even. On May 20, the Julysoybean future, now the spot month, fell back toward the naturalapproach number of 6.95 (Figure 6-7, A).
93
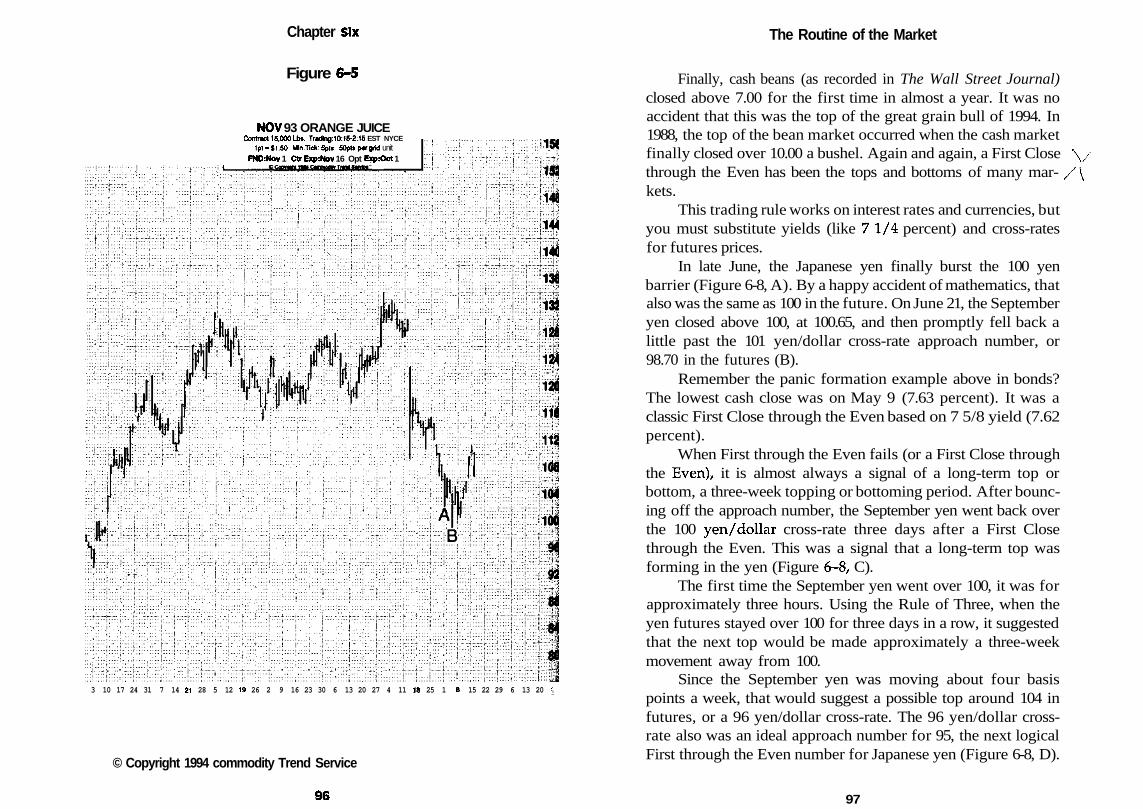
Chapter Six
Figure 6-5
NOV 93 ORANGE JUICEContract 15.000 Lbt. Tr*ding:10:15-2:15 EST NYCE
1pt-$1.50 Min.Tick: Spli SOpti par grid unitFND:Nov 1 Ctr Exp:Nov 16 Opt Exp:Oet 1
The Routine of the Market
3 10 17 24 31 7 14 21 28 5 12 19 26 2 9 16 23 30 6 13 20 27 4 11 J8 25 1 8 15 22 29 6 13 20 J
© Copyright 1994 commodity Trend Service
Finally, cash beans (as recorded in The Wall Street Journal)closed above 7.00 for the first time in almost a year. It was noaccident that this was the top of the great grain bull of 1994. In1988, the top of the bean market occurred when the cash marketfinally closed over 10.00 a bushel. Again and again, a First Close \/through the Even has been the tops and bottoms of many mar- /\kets.
This trading rule works on interest rates and currencies, butyou must substitute yields (like 71/4 percent) and cross-ratesfor futures prices.
In late June, the Japanese yen finally burst the 100 yenbarrier (Figure 6-8, A). By a happy accident of mathematics, thatalso was the same as 100 in the future. On June 21, the Septemberyen closed above 100, at 100.65, and then promptly fell back alittle past the 101 yen/dollar cross-rate approach number, or98.70 in the futures (B).
Remember the panic formation example above in bonds?The lowest cash close was on May 9 (7.63 percent). It was aclassic First Close through the Even based on 7 5/8 yield (7.62percent).
When First through the Even fails (or a First Close throughthe Even), it is almost always a signal of a long-term top orbottom, a three-week topping or bottoming period. After bounc-ing off the approach number, the September yen went back overthe 100 yen/dollar cross-rate three days after a First Closethrough the Even. This was a signal that a long-term top wasforming in the yen (Figure 6-8, C).
The first time the September yen went over 100, it was forapproximately three hours. Using the Rule of Three, when theyen futures stayed over 100 for three days in a row, it suggestedthat the next top would be made approximately a three-weekmovement away from 100.
Since the September yen was moving about four basispoints a week, that would suggest a possible top around 104 infutures, or a 96 yen/dollar cross-rate. The 96 yen/dollar cross-rate also was an ideal approach number for 95, the next logicalFirst through the Even number for Japanese yen (Figure 6-8, D).
96 97
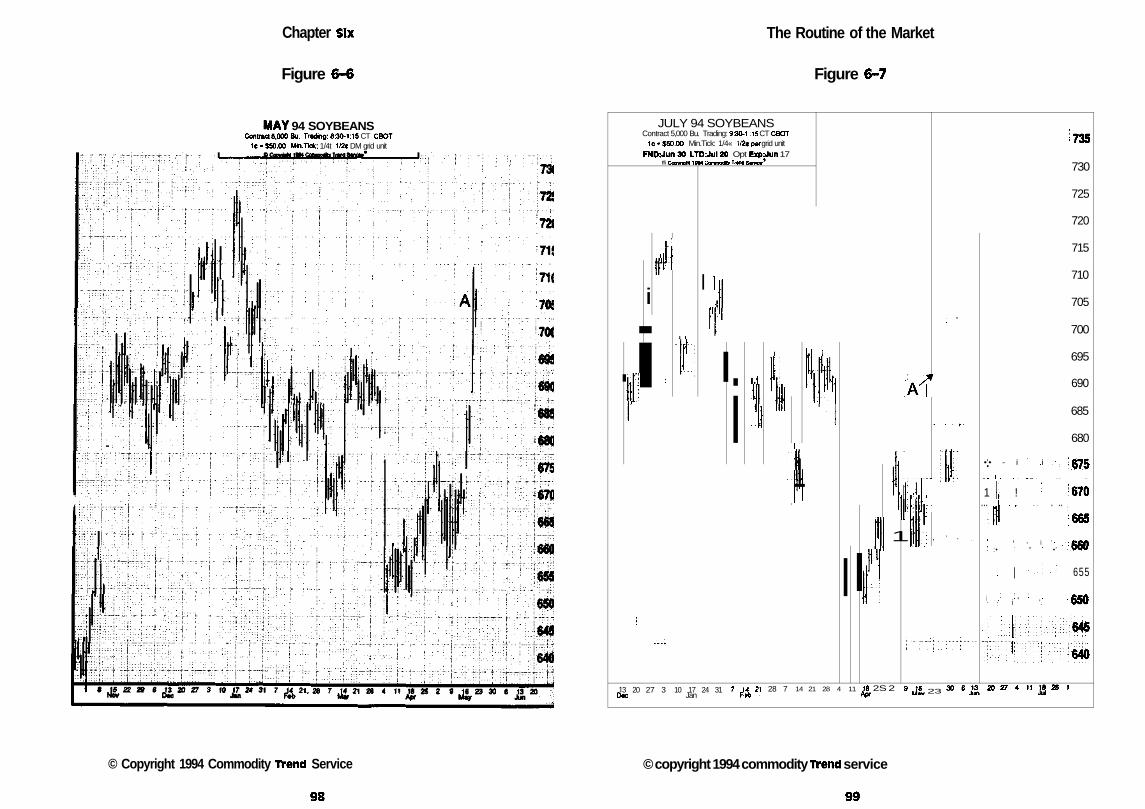
Chapter six
Figure 6-6
MAY 94 SOYBEANSContract 5,000 Bu. Trading: 8:30-1:15 CT CBOT
1C-J50.00 Min.Tick: 1/4t 1/2« DM grid unit
The Routine of the Market
Figure 6-7
JULY 94 SOYBEANSContract 5,000 Bu. Trading: 9:30-1 :15 CT C8OT
1C -$50.00 Min.Tick: 1/4« 1/aepw grid unitFND:Jun30 LTD:Jul20 Opt EKprJun 17
ffi CcowoM 19M CttmMdlh Trtno Swvn'
Ii§| !
!
13 20D«c
i
1If
"
i
...;.4 .
27 3
J
. ( ;
I II'I
I
10 17 24 31Jan
i
7 A
11
42t
\i
28 7
11
(il\
II
14 21 28 4 11
1
f'
11
£ 2S 2
;A'*
[ I"
1
!?35
730
725
720
: " i
,. .. . ;.... .
1
: ' - : •
.|:....;.....:|.....;........j.....;...
715
710
705
700
695
690
685
680
•'• - i "•• i ; ^K7K• : • • -••-• :0fp
.. :. L . .: . . . . . . : - .... ... | . ... ..
1 t; ! : ; : '670... i . r . .... . . .. j. . . . .
i l l ' ! ' ! !665
; \ - i ' • \ CCAI :• . : . " ' '• • ' -.iWW
! . | . : . - ! , ! 655
i : ; i • : ' • • • • CCA: '.:' i : . '. '. Wv
l.a:i:^hl:!li:;|^5
p:i.|;;;:!:;:l!::5;::;;|p
^ J«w 23 ^ * ji 20 * ^ JS ^
© Copyright 1994 Commodity Trend Service © copyright 1994 commodity trend service
98 99
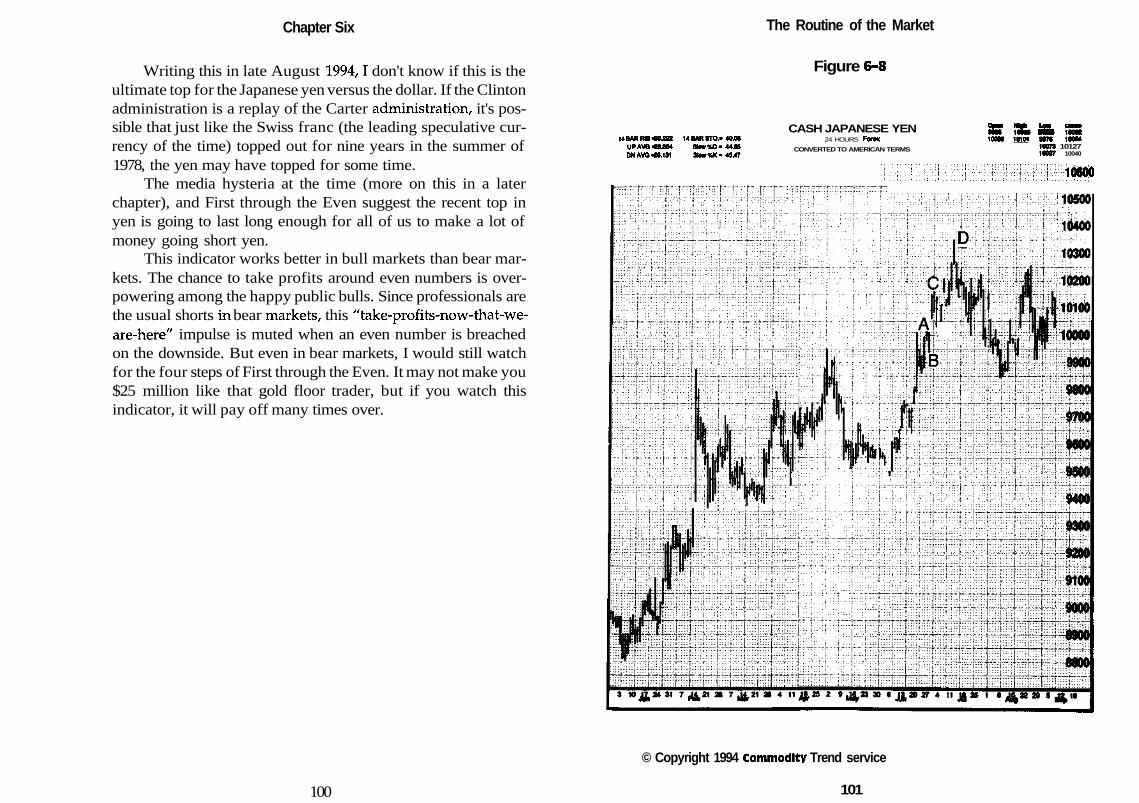
Chapter Six The Routine of the Market
Writing this in late August 1994,1 don't know if this is theultimate top for the Japanese yen versus the dollar. If the Clintonadministration is a replay of the Carter administration, it's pos-sible that just like the Swiss franc (the leading speculative cur-rency of the time) topped out for nine years in the summer of1978, the yen may have topped for some time.
The media hysteria at the time (more on this in a laterchapter), and First through the Even suggest the recent top inyen is going to last long enough for all of us to make a lot ofmoney going short yen.
This indicator works better in bull markets than bear mar-kets. The chance to take profits around even numbers is over-powering among the happy public bulls. Since professionals arethe usual shorts in bear markets, this "take-profits-now-that-we-are-here" impulse is muted when an even number is breachedon the downside. But even in bear markets, I would still watchfor the four steps of First through the Even. It may not make you$25 million like that gold floor trader, but if you watch thisindicator, it will pay off many times over.
Figure 6-8
14BANRSI40J22 148AR9TO.- 40.06UPAVO4UM So»«O- 44J6ONAVO46.131 9o*«K- 4&47
CASH JAPANESE YEN24 HOURS Fom
CONVERTED TO AMERICAN TERMS
DPMI HHI HW MM*Mil io5» •• 100M1003B 10101 tin 100M
10071 10127100(7 10040
WMmiSSii§miil$M
© Copyright 1994 Commodity Trend service
100 101
Chapter Seven
Expected Range
This is a chapter I almost didn't write. But if I am honestly goingto examine some of the main methods floor traders use, I haveto do it.
There are many, many telephone services and seminars thatcater to the daytrade market and, for a fee, will tell you whatthey expect tomorrow's range will be in various futures—or atleast how to calculate it. There are three things you need to keepin mind when you see ads for this type of service and seminar:
1. Every system is subject to the Mathematics of Investing.If you are going to daytrade, come to Chicago, join theMidAm, and do things right. Yes, you might beat theodds for a while, but if you are really that good of ashort-term trader, you'd be much better off coming tothe center of the futures universe and renting or owningsome sort of exchange seat. Every time I have listenedto or read something about great futures traders, thereis at least one point that comes through loud and clear.They love what they are doing. Even the drudgery is nodrudgery to them. They love to study, calculate, and talkabout the markets during the long hours when there isreally nothing specific to do. (Learning to wait for the
103
Chapter Seven
right time to trade is half the battle.) If you really lovesomething or someone, you want to be around them allthe time. If you really love trading—not simply themoney and excitement you think it will bring—youwon't balk at making the sacrifices necessary to become
_—T) a good trader. There are many great traders (perhaps^ most of them) who trade away from the floor. But:
/ * Most of them depend on trading methods other than/^ daytrading.
# If they do daytrade, they operate with rock-bottomy( commissions and a thorough knowledge of the floor
because many of them started as floor traders.
y * They started daytrading in a much more forgivingenvironment if you made a mistake.
Let me try to explain this third point. From 1973 to 1984,T-bill rates averaged in the double-digit range. If you had$100,000 in your futures account and got a 10 percent T-billinterest rate on your money, that gave you $10,000 for losses,equipment charges, etc. The Mathematics of Investing were alittle more in your favor. In addition, we continuously had wildswings in almost every futures market. Many markets, like theS&P 500, were just starting. As a result, they were loaded withopportunities for the astute trader as novice traders and theirmoney rolled in. Finally, not everybody was computerized inthose days, i.e., knowing about stochastics might have given youa real advantage then, not like today.
2. Market conditions change every morning. The openingprice has already shattered that comfortable technicalworld your 900-number or sure-thing range finder gen-erated the night before.
3. The range of many, if not most, trading days is more ofan accident than you might think.
While floor traders do over 50 percent of the volume, mostof the market-making moves are made by the big institutions. If
104
Expected Range
they are not in the market in a big way, there can be a lot ofmeaningless churning. Highs and lows get made simply becausethe floor found going one way or the other was not generatingoutside orders and quit. Floor traders were simply cutting eachother up, so they stepped aside at some point or even got off thefloor. This happens not just on slow days, before holidays, orwhen a snowstorm hits the market. (Volume studies are a goodway to see if that was a nothing day. One way to measure volumeis the resistance index. The resistance index is the number ofcontracts traded in a future divided by the sum created bysubtracting the low from the high.)
So a word to the wise. If your range-finding service ormethod treats every previous day alike in making its calculationsof tomorrow's range, if it doesn't adjust for today's opening, youmay find yourself in difficulty.
Rather than a panacea for daytrading, most traders shoulduse any method that generates an expected range for that day'strading as a starting point for their market entry system. By amarket entry system, I mean a method that will help you put yourbuy order nearer the bottom of the day and your sell orders nearerthe top of the day than mere chance would dictate. Unlike theaverage floor trader, you are not looking to get out before the endof the day unless prices have moved against you. You are notdaytrading. You are simply making a decision: "I probably wantto buy or sell today if XYZ happens. If that happens, I am goingto use market entry techniques to minimize my exposure."
The Pivot
Computers are banned on the pits of most exchanges. In any case,it would be very difficult to look at a screen in one hand and tryto trade with the other. Floor traders have had to develop simplerange-finding systems that they can keep in their head or on theback of their trading card. The most common expected-rangesystem floor traders have used in the past is the "Pivot."
First, you calculate the pivot point (sometimes called the
105
Chapter Seven
daily average), which is merely the sum of the high, low, andclose of a future divided by 3. (For illustration purposes only,I'm going to use artificially simple numbers.) If the high was 10,the low 6, and the close 7, the pivot point would be 7.67 (or 23divided by 3). After we have found the pivot point, we computethe next high and the next low. The next high equals the pivotpoint times 2 minus the low, or 9.34 (7.67 x 2 = 15.34 - 6 = 9.34).The next low is the pivot point times 2 (which we have alreadycalculated as 15.34) minus the high of 10, or 5.34. The next pointsto compute are the highest high and the lowest low.
The highest high is the pivot point (7.67) minus the nextlow (5.34) plus the next high (9.34), or 11.67 (7.67 - 5.34 + 9.34= 11.67). The lowest low is the pivot point (7.67) minus thesum of the next high minus the next low (9.34 - 5.34 = 4.00), or3.67 (7.67 - 4).
In review:
1. Pivot point = previous day's high + low + close dividedby 3.
2. Next high = 2 x pivot point minus the low.
3. Next low = 2 x pivot point minus the high.
4. Highest high = pivot point minus next low plus nexthigh.
5. Lowest low = pivot point minus the sum of the next highminus the next low.
The pivot point, or Pivot, is the average. Above it you arebullish. Below it you are bearish. If the market is in an uptrendand you are above the Pivot, you buy. If the market is in adowntrend and you are below the Pivot, you sell. If the marketis neutral, you use the next high to sell against and the lowestlow to buy against. (The public uses the next low to do itsfavorite thing: buy the market. This number usually doesn'thold as a support level.)
These rules are not set in stone. The key to all range tradingis resonation. The more reasons (such as First through the Even,
106
Expected Range
the Rule of Three, the Rule of Doubles, etc.) you can find thatpredict the same number (resonate), the more likely the marketwill stall at that number and give you a logical spot to buy orsell.
One variation of the Pivot is to add today's opening toyesterday's high, low, and close and divide that sum by 4 to giveyou a pivot point. Another would be to substitute today's open-ing for yesterday's close. You simply add the opening to the sumof yesterday's high and low and divide this total by three to getyour Pivot.
I have not done an exhaustive computer study on the ques-tion of whether to use the opening or the close to calculate thePivot. My suggestion based on some preliminary work is to usethe traditional Pivot to determine support and resistance on theopening. Then, a few minutes after the opening, substitute theopening for the close in creating a new Pivot. In hectic marketsit may take a minute or two to establish the exact prices of the30-second opening range. Then it will take another minute ortwo for the clerks of the floor traders to do the calculations andsend the new open Pivot into the pit. Then it might be anotherminute or two before the floor trader can actually look down tosee the new numbers in the hectic conditions of the openingtrades.
Remember, even though many of these floor traders are likehuman computers, making all these calculations in your head atthe most critical time of day is risky. The floor trader knowsmuch of his potential trading profit for the whole day hangs onhow well he does in the opening. The best most of them canmanage is to memorize the numbers generated from the closePivot and wait until their clerk tells them the new open Pivotnumbers.
The secret of the Pivot system is the same secret of anylogical trading strategy. It's elementary physics: A body that isin motion will stay in motion in the same direction until it meetsresistance equal to or greater than its velocity. The Pivot is justa numeric representation of where the average trader bought orsold yesterday. If the average seller of yesterday is losing, there
107

Chapter Seven
will be a tendency for him to cover and send prices higher. If theaverage buyer of yesterday is losing, he will likely sell and sendprices still lower. At some point in the day, prices will attemptto stabilize, if for no other reason than profit-taking and thedesire of floor traders to even up their positions before the close.The highest high and lowest low are an attempt to find out theapproximate area where that might happen.
The Four Quadrants
There's another relatively simple way to find an expected rangefor today's trading. I call it the Four Quadrants.
Take three moving averages of varying length. I used expo-nential moving averages of the last 5,21, and 55 days of openingswhen I tested it. But today I don't believe it's that importantwhat type of moving average you use (simple, weighted, expo-nential, displaced, etc.), or the exact numbers you use for yourmoving averages (I prefer using openings to closes for tradinga few minutes after the opening). The key is to make sure youuse at least three moving averages that are spaced somewhatapart. If you are using a simple 18-day moving average already,you can simply add in a small moving average (say three to fivedays) and a larger one (say 40-60 days).
Let's say the five-day moving average of future X is 100while the 20-day and 60-day moving averages are 95 and 90respectively. Yesterday's close in X was 96. The four quadrantsare placed along a line; quadrant 1 is above the highest movingaverage (in this case above 100); quadrant 2 is between thehighest and the second highest moving average (100 and 95 inthis example); quadrant 3 is between the second highest and thelowest moving average (95 and 90); and quadrant 4 is below thelowest moving average (in this example, the area below 90).
The wider the range between the highest and lowest mov-ing average, the more that future is trending. When the shortestand middle average converge, a short-term trend change is im-minent. When all three moving averages converge, a long-term
108
Expected Range
trend change is imminent.To generate an expected range for today's action, you find
the closest moving averages that are within a limit move of thefuture. For the purpose of our very hypothetical example, let'sassume a limit move is three full points (i.e., our future has amaximum range of 99 on the upside and 93 on the downside).In this case, only one moving average is within a limit move ofthe close of future X: the 20-day moving average of 95.
Next we take this moving average, 95, and compare it withthe next lowest moving average, which is the 60-day movingaverage at 90. We add both of those numbers together and divideby two to get a midpoint number of 92.5. Since this number isout of range for today, we take that midpoint number (92.5) andthe original average that was in range (95) and add them to-gether and divide that number by two to get 93.75. That numberis in range and becomes our second support number (95 is ourfirst support number). To get our resistance number, we gothrough the same procedure with the moving average that is inrange (the 20-day at 95) and the next highest future (the five-dayat 100).
In big trends, sometimes there is no moving average in range,or only the top or bottom moving average is in range (of a limitmove). In that case we use a flip to generate a hypothetical movingaverage to generate our support and resistance numbers.
Let's use the same moving averages above but change theclose of future X to 104. A limit move is 101, which is out of rangefor the highest moving average. The difference between thehighest moving average (the five-day at 100) and the secondhighest (the 20-day at 95) is five. We "flip" this number by addingit to the highest moving average (the five-day at 100) to createa new artificial moving average at 105. Then we go through thesame calculations as before to determine our support number(102.5). 105 now becomes our new resistance number. We candivide again to create a second support number at 103.75 and asecond resistance number at 106.25. (You do this until you haveat least two support and two resistance points within the limitmove of the future up or down).
109
Chapter Seven
I claim nothing for these numbers other than they work aswell as trend lines, Bollinger Bands, and other more commontechniques of determining support and resistance. Their onlyweakness is the relatively rare event when all three movingaverages get so close together there isn't much space to createsupport and resistance points. At this point you may have to doseveral flips to get numbers that correspond to the range wherethe future has been trading for the last few weeks or days.
I'll leave it to those with the megadrives to find the opti-mum set of three averages for each future. I like the Four Quad-rant Method more than other support and resistance techniquesbecause:
1. It is simple—you only need a spreadsheet or a calculator,not any special software like Bollinger Bands, etc.
2. You get two indicators in one. You get support/resis-tance plus the added insight of a Moving Average Con-vergence/Divergence (MACD).
3. The movement of the future among the four quadrantscan give you a graphic insight into what is happeningwith that future, an insight no black-box software pro-gram can give.
You remember "Sandy," who taught me about First throughthe Even? He did all his calculations by hand because he could"see" more things that way. There are many, many first-classtraders that believe the same thing.
Before you sneer, let me say one thing. I've seen a lot moresuccessful traders doing calculations by hand than I have black-box daytraders with all their fancy permutations of the SacredSix.
110
Chapter Eight
Fib Times
The physical world is measured in three dimensions: height,width, and depth. The floor trader's world also has three di-mensions: the opening, which tells him "the direction" he canexpect the market to move, the routine of the market, whichshows him how deep (in terms of volume and risk) he cantrade, and the expected range, or what to expect for the widthof today's move.
According to Einstein, time is the fourth physical dimen-sion. But this fourth dimension can only be observed on earthby careful observation during special circumstances. Time is alsothe fourth dimension of the floor trading world. When you firstlook at it, it seems to be only a routine. But after careful obser-vation, you realize it is more than just a normal routine. It's soimportant to the floor trader it deserves a chapter of its own.
In a backhanded way, I've talked about the routine of timethroughout the first chapters of this book: the 10:20-10:40 A.M.Fed time in bonds, Tuesday at 10:30 A.M. as a potential toppingtime, how the strength (or weakness) of openings or closes ofone future might influence another, how floor traders come upafter the opening to take a break until the New York lunch houror the noon balloon in ag contracts.
111
Chapter Eight
There are other minor time routines:
1. Meats often make highs and lows just before the openingof the grains. The price of grain is such a huge compo-nent of meat prices, often it seems you are trading thedirection of grains as much as that of hogs and cattle(much like the relationship between stocks andbonds) .This unknown factor reaches its peak of greed orfear in the heart of the average public meat trader justbefore grains open. And like most ag futures, the meatshave more small traders than average.
2. London markets usually close around 10:00 A.M. CSTLondon trades more deutsche marks than Chicago andNew York combined. It is the dominant world market,the primary market for currencies, gold, platinum, cop-per, cocoa, sugar, and crude oil. (Don't be fooled by thefact that New York trades more crude oil contracts thanLondon. Brent is still the standard of the world, thanksto its proximity to the Middle East. Brent going over$40—a First through the Even—was the top of the 1990bull market in crude oil.)
After London closes in those markets it dominates, U.S.traders usually do one of two things. If things were dull inLondon, they'll be duller in the U.S., so U.S. floor traders startdrifting off the floor. But if a London-dominated market had lotsof excitement, U.S. floor traders and commercials have a chanceto go wild without the interference of London arbitrageurs. Justlike London often makes extreme quotes in U.S. bonds beforethe main U.S. trading begins, U.S. markets often make extremequotes in London-dominated markets after 10:00 A.M.
The advent of 24-hour trading has made the element of timea harder thing to apply in trading. The idea of an opening priceis getting strained (although, as I pointed out before, not lost).Around-the-clock trading has the opposite effect of a snowstormin New York or Chicago. In a snowstorm, traders try to geteverything done in a few hours so they can go home early
112
Fib Times
(whether or not the exchange officially closes early). With 24-hour trading, volume fades in and out, making it difficult todetermine just what is a significant time in trading. Both throwoff the time routine of the day.
In analyzing how to use time, you have to do the same thingas you would for any other aspect of trading some future. Youhave to determine the primary market. If it is London, you aregoing to have to look at the same charts and fundamentals thatLondon is looking at. If you want to trade rice (and possibly theyen), you should attempt to understand how the Japanese tradethat market.
The big money is made in the big markets by big playersthrough big moves. Rotterdam may make a new high in soybeanmeal, but if it is not validated by Chicago, the big money won'tfollow it. On March 2, 1994, the London market in U.S. bondscollapsed along with all the other European bond markets. Butafter a sell-off about half the size of London's, U.S. bonds ralliedseveral days before going lower than the London low the fol-lowing week. The London move was premature.
Market wizard and megacurrency trader Bruce Kovner sayshe has assistants that can help him trade through the night.Totally absorbed in his work, he sometimes trades all night ifmarket conditions warrant it.
For the rest of us mere mortals, I have a suggestion—espe-cially if the size of your account demands any trading be inhalf-size MidAm contracts that don't trade all night. Use theLondon closing time of 10:00 A.M. as your close and trade ac-cordingly. If you have enough money to trade full contracts ofLondon-dominated futures, and if they have enough volume foryour type of trading during London's opening hours on Globexor some other night trading system, then use London's hoursfor any time routine and be prepared to get up very, very earlyin the morning to catch London's all-important opening.
For all the above reasons and because watching the U.S.media doesn't work as well on London-dominated futures, Irecommend novice traders stick to U.S.-dominated futures. The"Fib Times" I am giving are only for the trading hours of U.S.
113
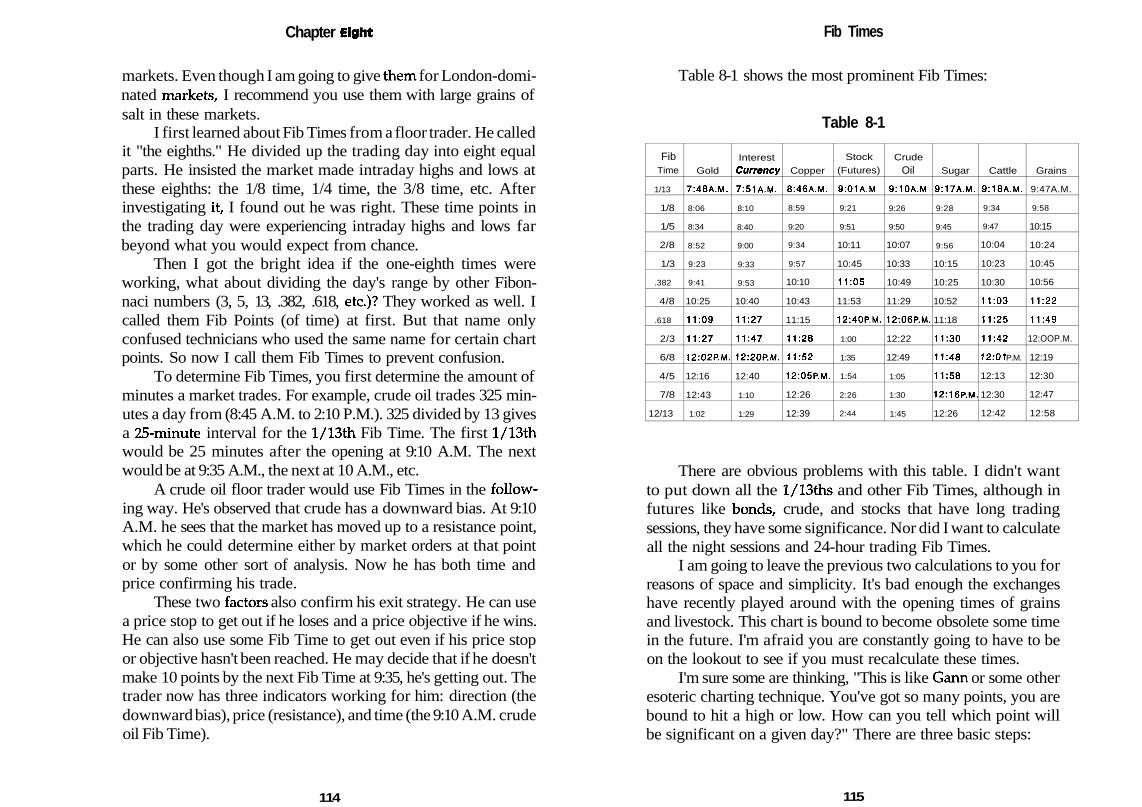
Chapter Eight
markets. Even though I am going to give them for London-domi-nated markets, I recommend you use them with large grains ofsalt in these markets.
I first learned about Fib Times from a floor trader. He calledit "the eighths." He divided up the trading day into eight equalparts. He insisted the market made intraday highs and lows atthese eighths: the 1/8 time, 1/4 time, the 3/8 time, etc. Afterinvestigating it, I found out he was right. These time points inthe trading day were experiencing intraday highs and lows farbeyond what you would expect from chance.
Then I got the bright idea if the one-eighth times wereworking, what about dividing the day's range by other Fibon-naci numbers (3, 5, 13, .382, .618, etc.)? They worked as well. Icalled them Fib Points (of time) at first. But that name onlyconfused technicians who used the same name for certain chartpoints. So now I call them Fib Times to prevent confusion.
To determine Fib Times, you first determine the amount ofminutes a market trades. For example, crude oil trades 325 min-utes a day from (8:45 A.M. to 2:10 P.M.). 325 divided by 13 givesa 25-minute interval for the I/13th Fib Time. The first I/13thwould be 25 minutes after the opening at 9:10 A.M. The nextwould be at 9:35 A.M., the next at 10 A.M., etc.
A crude oil floor trader would use Fib Times in the follow-ing way. He's observed that crude has a downward bias. At 9:10A.M. he sees that the market has moved up to a resistance point,which he could determine either by market orders at that pointor by some other sort of analysis. Now he has both time andprice confirming his trade.
These two factors also confirm his exit strategy. He can usea price stop to get out if he loses and a price objective if he wins.He can also use some Fib Time to get out even if his price stopor objective hasn't been reached. He may decide that if he doesn'tmake 10 points by the next Fib Time at 9:35, he's getting out. Thetrader now has three indicators working for him: direction (thedownward bias), price (resistance), and time (the 9:10 A.M. crudeoil Fib Time).
114
Fib Times
Table 8-1 shows the most prominent Fib Times:
Table 8-1
FibTime
1/13
1/8
1/5
2/8
1/3
.382
4/8
.618
2/3
6/8
4/5
7/8
12/13
Gold
7:48A.M.
8:06
8:34
8:52
9:23
9:41
10:25
11:09
11:27
12:02P.M.
12:16
12:43
1:02
InterestCurrency
7:51A.M.
8:10
8:40
9:00
9:33
9:53
10:40
11:27
11:47
12:20P.M.
12:40
1:10
1:29
Copper
8:46A.M.
8:59
9:20
9:34
9:57
10:10
10:43
11:15
11:28
11:52
12:05P.M.
12:26
12:39
Stock(Futures)
9:01A.M
9:21
9:51
10:11
10:45
11:05
11:53
12:40P.M.
1:00
1:35
1:54
2:26
2:44
CrudeOil
9:10A.M
9:26
9:50
10:07
10:33
10:49
11:29
12:06P.M.
12:22
12:49
1:05
1:30
1:45
Sugar
9:17A.M.
9:28
9:45
9:56
10:15
10:25
10:52
11:18
11:30
11:48
11:58
12:16P.M.
12:26
Cattle
9:18A.M.
9:34
9:47
10:04
10:23
10:30
11:03
11:25
11:42
12:01 P.M.
12:13
12:30
12:42
Grains
9:47A.M.
9:58
10:15
10:24
10:45
10:56
11:22
11:49
12:OOP.M.
12:19
12:30
12:47
12:58
There are obvious problems with this table. I didn't wantto put down all the l/13ths and other Fib Times, although infutures like bonds, crude, and stocks that have long tradingsessions, they have some significance. Nor did I want to calculateall the night sessions and 24-hour trading Fib Times.
I am going to leave the previous two calculations to you forreasons of space and simplicity. It's bad enough the exchangeshave recently played around with the opening times of grainsand livestock. This chart is bound to become obsolete some timein the future. I'm afraid you are constantly going to have to beon the lookout to see if you must recalculate these times.
I'm sure some are thinking, "This is like Gann or some otheresoteric charting technique. You've got so many points, you arebound to hit a high or low. How can you tell which point willbe significant on a given day?" There are three basic steps:
115
Chapter Eight
Step One: Match the Fib Timeswith other Routines and Fib Times
If you are trading bonds, compare the Fib Times based on thetime range of only the day session with the Fib limes of the entiretrading day including the night session. Where these Fib Timesintersect are points of time likely to have intraday tops andbottoms. You could do the same Fib Time comparisons betweenLondon and the equivalent U.S. future in London-dominatedmarkets.
The 2/13th Fib Time in cattle is 9:31 A.M., right at the grainopening. The 4/8ths Fib Time in bonds is 10:40 A.M., near thetime the Federal Reserve jiggles the money supply. A prominentFib Time for stocks and bonds is 9:00 A.M., the time the govern-ment issues reports.
It's very common for expected events that have no specifictime (like an earnings report for IBM, a Treasury auction result,or a Federal Reserve announcement) to come at Fib Times. Themore routines you can find out about, the better you will under-stand what Fib Time will be significant for that trading day.
Step Two: Determine the UnderlyingTrend of a Market
Is it bullish, bearish, or a trading range? Is it a volatile marketfull of news or a quiet market waiting for some sort of news tomove it? Slow markets or markets anticipating a report usuallyhave the most movement at either the opening 1/13 or the closing12/13 Fib Time.
In bear markets, typical periods of strength come after theopening 1/13 until the appropriate public lunch hour—NewYork's lunch hour (11:10 to 11:50 A.M.) or the noon balloon ofU.S. agricultural futures. This is the time you want to sell to getin on the trend and the collapse on the close.
In bull markets, it's just the opposite. After the initial open-ing 1/13 surge, the market typically fades back to the previousclose until reaching a bottom around the appropriate lunch hour.Then it rallies until the close.
116
Fib Times
Step Three: is Your Market a Leader or a Follower?All U.S. futures in London-dominated markets are followers, butthis also can occur in U.S. primary markets. Sometimes gold isthe leader (like 1979-1980). Sometimes it's the Dollar that everyother future is keying off of. At these times, it's important to keepin mind conjunctions of Fib Times.
In the fall of 1990 the skyrocketing price of crude was onthe minds of everyone. If Saddam Hussein blew up Saudi Ara-bia, the price of oil could go sky high, causing stocks and bondsto collapse. Every S&P 500 trader was keeping one eye on theprice of crude, and it shows in the interday charts. Often a crudeoil Fib Time was the top or bottom of the intraday Dow chart.The conjunction of the 2/8 Fib Time for crude at 10:07 and the2/8 Fib Time of stocks at 10:11 often was the time of peaks andbottoms in the Dow.
Fib Times can also be used to determine stops. The Rule of72 also applies to time. A future that makes a new high or lowafter 72 percent of the day's trading is completed will usuallynot reverse itself later in the day. Witness the following quotefrom the July 1990 issue of Stocks & Commodities magazine:
Every day at 1:00 P.M. we check the 12:00-1:00 P.M.hourly bar of the T-bond contract. If the tick volume(the number of times the future has moved one tick upor down) is greater than 100, we then place two or-ders—a buy-stop one tick above the high of the barand a sell-stop one tick below the low of the bar.
If either order is filled before 2:00 P.M., we cancelthe other and place a $1,500 money management stop-loss. We then do nothing until 1:00 P.M. when we againlook at the 12:00-1:00 P.M. bar. If we are long and notstopped out and today's 1:00 P.M. bar tick volume isgreater than 100, we would place a sell order for twocontracts one tick below the low of the bar.
If we are filled to the short side before 2:00 P.M. wewould then use a new $1,500 stop. If we are not filled,
117
Chapter Eight
we cancel the sell-stop below the 1:00 P.M. bar andreinstate our original $1,500 money management sell-stop. We again have nothing to do until the next dayat 1:00 P.M.
The author, Charles Wright, claimed this system earned 476percent through the first 10 months of 1989. Whether this wasexactly true or whether this system continues to work as wellnow, I don't know. But it is typical of the evidence I have seenof the power of the Rule of 72.
The trend is definitely your friend in the latter stages of theday. The public stubbornly carries losses until the last minute,hoping for a miracle reversal. The funds also like to use ham-fisted, close-only orders to make sure of the trend. The pros havelong since positioned themselves for the close.
Another rule is never take a losing position into the lastI/13th. It's a very rare day when the market has a strong reversalduring the last l/13th. When it does happens, it is almost in-variably a sign of a major top or bottom.
Key reversals often start after the opening I/13th, espe-cially after reports. The Tuesday at 10:30 A.M rule for grain topsor bottoms reflects the 2/8th (10:24 A.M.) and l/3rd Fib Time(10:37). By that time, professional traders figure that enoughweak hands have been squeezed out of the market, and theybegin the long trek to the close accumulating positions.
Like expected range, I almost hate to put out this informa-tion on Fib Times. Invariably, people will take these conceptsand try to make them into a daytrade system, completely ignor-ing the Mathematics of Investing. I've seen brokers become com-pletely oblivious to everything else once I've told them aboutFib Times. They watch the screen, fascinated, exclaiming,"There's another Fib Time reversal. And another one!" Unfortu-nately, most Fib Times can only be used by floor traders, they ofthe $1.00 commission.
I prefer people use Fib Times as an adjunct to their ownlonger-term systems. It's another way to help you sell the upperquadrant or buy the lower quadrant of price action when you
118
Fib Times
have determined that today is the day you would like to entera market. Shaving off a few hundred this week and a few hun-dred the next week off the cost of your fills are those nickels thatturn into millions.
A stock market that loses 20 percent in an hour (as in1987) or a soybean market that collapses 5 percent in a matterof minutes (as in 1988) can completely overwhelm any price-only based system of entry dependent on protective stops(Neal Weintraub claims he has seen currency stops filled over100 points away from their trigger price). Without the elementof what time it is in your trading, even a conservative, longer-range futures trader can get crushed.
One final point: If you know what time it is in trading, youdon't have to be a slave to the quote machine, especially afterthe opening of whatever future you are looking at. You can checkin at Fib Time intervals and be fairly confident you are keepingup with most of the action.
You can even (horrors!) junk that $600-a-month monstercalled the "quote service package." If you still want to chartintraday action, you can use 10-minute delayed quotes from aservice like DTN Wall Street (1-800-485-4000), that hooks up toyour computer and generates charts through an inexpensivesoftware package. The total cost is only about $50 a monthamortized over two years.
For those critical openings, you can use the quotes on CNBC'sfinancial program, which would cost you nothing if you alreadyhave cable. You could back them up by a service like Infoline,provided by your discount broker. You simply dial an 800-numberand get the latest quote. (If you want more information on Infoline,call First American Brokerage at 1-312-368-4700.)
According to a trader profile in Futures magazine, success-ful daytrader Gary Smith uses nothing for quotes except theticker tape of CNBC, which gives him rninute-by-minute quotesof the S&P 500. Says Gary, "I don't even know how to turn acomputer on." Mindboggling!*
Gary Smith has one of the few daytrading courses I respect. You can write Gary atP.O. Box 40523, Reno NV 89504, (702)-329-8589.
119
Chapter Eight
But then again, not using a computer, isn't that what floortraders do every day? Maybe Smith is beating the Mathematicsof Investing not only because he is a remarkable trader but alsobecause he doesn't have that big overhead other daytradershave.
"I am the only daytrader I know who can put on a positionand take a nap," Smith says. Well, Mr. Smith, I've seen a lot ofdaytraders take a nap in my presence with positions on. Theywere called floor traders. But they did have their alarm clocksset for a certain time to wake up and go back into the pit to offsettheir positions.
If you can't take an occasional nap with a position on, nomatter how short term that position, perhaps it's time for youto change trading styles. Knowing what time it is is the best wayI know to achieve that peace of mind.
120
Chapter Nine
A Short introductionto the Commercials
A few years ago I saw an ad by a firm that claimed to have founda way to provide econometric data to the futures market at afraction of the $10,000- to $40,000-a-year per sector (grains, met-als, currencies, etc.) typically charged by big names like Chase orWharton for their clients (banks, stock firms, grain processors,etc.) (Econometrics is an attempt to program every known vari-able that might influence the price of something and predictfuture prices based on mathematical calculations. Or, as Websterdefines it, the application of statistical methods to economic dataand problems.)
Intrigued, I studied their track record over a few months'time and found out that, yes, their forecasts were very accurateover time. I agreed to join their firm to run their subscriberhotline. They would tell me which direction they believed aspecific futures market was heading. Then I would apply tradingtechniques (like those described in this book) to give specifictrade recommendations to their subscribers.
Our hotline gradually became so popular that in smallermarkets (like cotton and platinum), our buy and sell recommen-dations were often the high or the low. Alas, all this came to an
121
Chapter Nine
end when I found out how they were generating those greatforecasts. They were making copies of the big-name econometricfirms's reports housed in the Library of Congress in Washington,D.C. Plagiarizing the latest issues, they were able to keep abreastof the markets and make those remarkable forecasts.
There are software programs that claim to generateeconometric forecasts, but the average PC is not going to be ableto handle the thousands of variables and millions of calculationsof an econometric program used by the biggies—even if you hadtime to program all those data entries. More importantly, no onehas Chase or Wharton's political and economic connections tothe centers of power—the Fed, Congress, etc. The results can bevery impressive. For example, here are some of the highlights ofa June 1987 executive summary of one of the big-nameeconometric firms:
1. A 1990 recession because of tightening by monetaryauthorities in response to escalating inflation and aphased-in tax increase in 1989-1990 to get the deficitunder control.
2. Growth would be 0.6 percent in 1990 and then reboundto 4.7 percent in 1991 (the tax increase was not phasedin but postponed until 1990. That's probably why thesefigures were a year off).
3. The dollar will rally from time to time, but will continueto go lower against the major currencies over the next10 years (I think it is very likely that before 1998 thedollar index will go lower than its recent lows in Sep-tember 1992).
Do you honestly think you are going to get these types ofpredictions from a software program costing a few hundreddollars?
Besides thorough knowledge of market fundamentals, com-mercials often have access to special intelligence well beyondthe capability of the average trader, no matter how hard hestudies the subject.
122
A Short Introduction to the Commercials
While I worked for the econometric firm described above,the Chernobyl nuclear reactor blew up. Fearing that half thewheat fields of Ukraine would be ruined with radioactivity,grains exploded, led by a limit up-move in wheat. The next daywheat was scheduled to go up another limit move, but mycolleagues insisted I put out a sell recommendation on the hot-line. Wheat topped that day and promptly collapsed to belowthe price levels it was trading at before the Chernobyl incidentoccurred.
Later I found out why my colleagues were so confident.One of their friends from the CIA had called them up. "Don'tworry about Chernobyl. We've seen the data from the spy sat-ellites. The damage is very localized, only about 4 percent ofUkraine's wheat crop."
Not every commercial trader has a friend at the CIA, butmost of them have very good sources of information totallyunavailable to the public. In the case of Chernobyl, there wasalso data from a private, French commercial satellite called Spot.Spot's data may not have been as complete or processed asquickly as the CLA's multiple spy satellites, but rest assured theaverage commercial grain trader got the true facts of the situ-ation well before the readers of The Wall Street Journal.
The largest privately held firm in the world is also theworld's largest commercial grain dealer: Cargill. A privately heldfirm has an enormous disadvantage over publicly held busi-nesses—it must raise all its capital internally or through bankborrowing (which carries interest costs far above dividends oncommon stock). But it also has one enormous advantage—itdoesn't have to report a thing about its finances (or its tradingpractices) to the public.
Compared to floor traders, commercial traders are a secre-tive bunch that rarely tip their hand in public. But that standsto reason since even the biggest floor traders (such as Tom Bald-win) only compare in trading size to the smallest commercialtraders. Commercials go to great lengths to disguise their tradinglest any hint of their overall trading strategy create a buying orselling panic.
123
Chapter Nine
One favorite technique (among many) to disguise theirtrading intentions is the "give-up." Orders can be executed atone clearing firm and then given up at the end of the day toanother. Cargill's broker may be selling 500,000 bushels of wheatwhile Merrill Lynch's brokers are buying 2 million. To all theworld it appeared smart Cargill was selling grain while MerrillLynch was buying for some dumb, technically oriented com-modity fund. But, after trading hours, the 2 million bushelsMerrill Lynch bought is given up (for a fee) to Cargill's account,making them net long 1.5 million bushels.
If commercials are willing to pay extra charges just to dis-guise their buying and selling, if they are paying millions in extrainterest charges just to keep their trading activities from thepublic, why would they ever talk to you or me about theirtrading techniques?
Fortunately, there are ways—that don't cost $40,000 ayear—that the public can follow these superb traders. I willoutline some of them in the next four chapters. But before I do,I would like to give one word of caution. Just like floor tradershave a better success record than the public, commercials on thewhole trade better than the average floor trader (but perhaps notmuch better than veteran floor traders with many years of ex-perience). However, individual commercial firms can be asdumb as any novice futures trader.
In the fall of 1993, reports started coming out that a majorGerman industrial firm had lost hundreds of millions of dollarshedging in the crude oil market. Of course, when you read thefine print, this firm actually violated every principle of truehedging and was guilty of the worst kind of naked specula-tion.This multibillion dollar company certainly fit the govern-ment's definition of commercial trader. The average publictrader would have been impressed if their broker had reported:"XYZ Gigantic firm is buying thousands of contracts of crude.Maybe we should go long, too."
Good trading, like good traders, should be felt but not seen.Once a megatrader becomes a household word like GeorgeSoros, you can be sure old George's public trading funds are
124
A Short introduction to the Commercials
headed for a fall (like their recent 25 percent dive). Similarly, ifyour broker says XYZ's buying (selling) is the talk of the street,it's a sure sign you want to be on the opposite side of the trade.
Occasionally, even smart commercial traders get fooled.From early June until mid-August of 1992, the commercials (asmeasured by the Commitment of Traders Report, more on thisin the next chapter) began to go on a buying orgy. Ninety percentof the time this is a sign of a major bottom in commodity prices.But beginning in mid-August 1992, commercials gradually liq-uidated their long positions and became progressively moreshort. Then, in January 1993, a month before the recent bottomin the Commodity Research Bureau index CRB, they returnedto their normal habit of buying a ton at bargain basement prices.
My contacts with commercial trading firms are slim. In anycase, given their habitual secrecy, I doubt any man in Americaknows for sure exactly what made hundreds of commercial firmsdecide to abandon a profitable downtrend and go from beingheavily short to heavily long. But there is one, huge coincidencethat makes me fairly confident of the reason why.
In early June 1992, Perot's poll numbers began to slip andClinton's numbers began to climb. By the start of August, Clin-ton had such a huge lead in the polls, it looked like the Demo-crats would sweep Congress. The Republicans would not be ableto muster a filibuster in the Senate, and it would be "Carter-nomics" once again in America. (It was a Republican Senatefilibuster that stopped Clinton's stimulus package).
Beginning in mid-August, Clinton's polls began to declineand, thanks to a successful convention, Bush was almost evenwith Clinton by September. By then, commercials could see that,whatever the fate of Bush, the Republicans were not going tolose big numbers in the Senate. They would be able to filibusterand stop many spending initiatives. The inflationary aspects ofthe Clinton presidency would be postponed.
All this goes to show that any one indicator can go wrongand you must have other things to back up your trading. Butother than reading the media (which is the window to insiderthinking), finding out what the commercials are doing (via the
125
Chapter Nine
Commitment of Traders report) is the indicator I respect the most.I am very, very reluctant to take positions contrary to what theyare doing.
126
Chapter Ten
Reading Their Mail:The Commitmentof Traders Report
The following report is by Jim Bianco CMT, chief analyst forArbor Trading, a commercial bond trading firm. I've reprintedthis report to give some idea of the incredibly accurate and timelyinformation available to commercial traders and the importanceof following the Commitment of Traders (COT) report.
Commentary for Friday October 1,1993
Are commodities the Trigger?In last week's commentary (Tulipmania, September 23) wediscussed the effect that the high rate of expansion in theadjusted monetary base is having on the bond market. Weconcluded: Eventually something will trigger a turnaround.Until then, a market that acts like a speculative bubble hasconsiderable risk. Could commodity prices be that trigger?
127
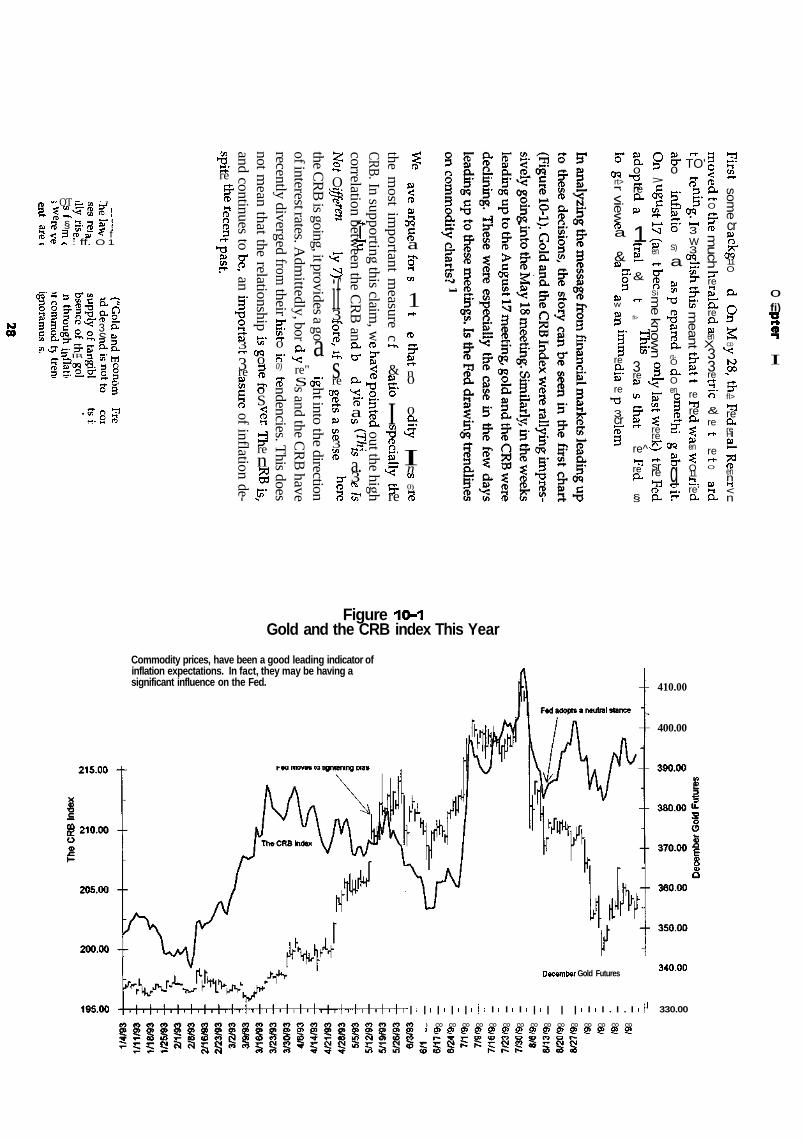
§ •" OT . »i S3«. | S %!» S § g-S S-|3 < B jo » < f«, & ^ : ff. O 1
M09
"9'n 3 fS
S l f S ^I l l a o5S O- |5* l~r>
S" •S' e- ? ST„ £» IB 3
sSt.1
0.^g3 o-S »g.g.S' M
Mo|
• s s s 1
•3&•re
1
1r-^
T3o>Cnj^
and continues to be, an importa
3rf
3reBJrniure of inflation de-not m
ean that the relationship i;
\JJ
ereo§J?oS1
3ren§h-4*
P
recently diverged from their hist
oK'0)
FTndencies. This does
of interest rates. Adm
ittedly, bor
o-•~<re"Ss and the C
RB
havethe C
RB
is going, it provides a go
acw'ht into the direction
?*•*•
O
1
|
C3
if3cT
?t-nsre
OK?n>rt»cn&>tn(T>3«(B
1
correlation between the C
RB
an
CLcr
CL
*aen
155'
a.3n>sr
CRB. In supporting this claim, w
n>
g*
SiTl>ointed out the high
the most im
portant measure c
i-*i
&&>r-f
5'
I3nQ.E.
X*ri-3"re
1
&>
»
*§<T>a
&TUl
1,-f-
rc?SJf-t-n0
0O-4'Inen0)s
o*CMrt>r vie
w
d>a
&&>
!s>w
S
1re&S're
T53crJrr*9
S)a.o
T3ETreaw
1*•*•
S.
&
r*-
fl>
i3reB)
en
S1&>ft-
re^Tlre&-
§
P>
1enf-i-i— 'V]
"5Tenr^
ITSim
e kn
ow
n
I*5Tsrwr-t-
3rere£T
(-(-
srreS1fDo-
S-o
5'g21-o'S)
a
&>en
T3
^SBJSD-rt-OCLOen
1l-*t
eraS-g«-t-(-*•
^
(-
TO'«-h(T>
1qq
t— 13W3
OLh».
S-5-ds m
eant t
ET&>rfr+
re^flreO-
a>en?O11l-!_
re'&
3A
OU
I
CL«-t-
O
g^ie much
3-re11a>KreP-&jenX33ref-hHn'
&ref-t-
rer-hO
&>11
a-
*Bh^-
E2r^
some
cr0)
*
11O
&.
£
sCD
*<
KJ,00
?fl>hflrefi-reHI
8L£enn<-t<n
ofi)
!?
I
Figure 10-1Gold and the CRB index This Year
Commodity prices, have been a good leading indicator ofinflation expectations. In fact, they may be having asignificant influence on the Fed. 410.00
400.00
34000December Gold Futures
| i | i | ! | i | i | i I ! I i I . | i | ! | i | i I i I . I . I i I 1 330.00
) CO CO CO CO CO CO CO CO CO CO CO CO CO CO CO) O > o ) c > g > g i o > o > g ) o > g > g i c > g > g > g >
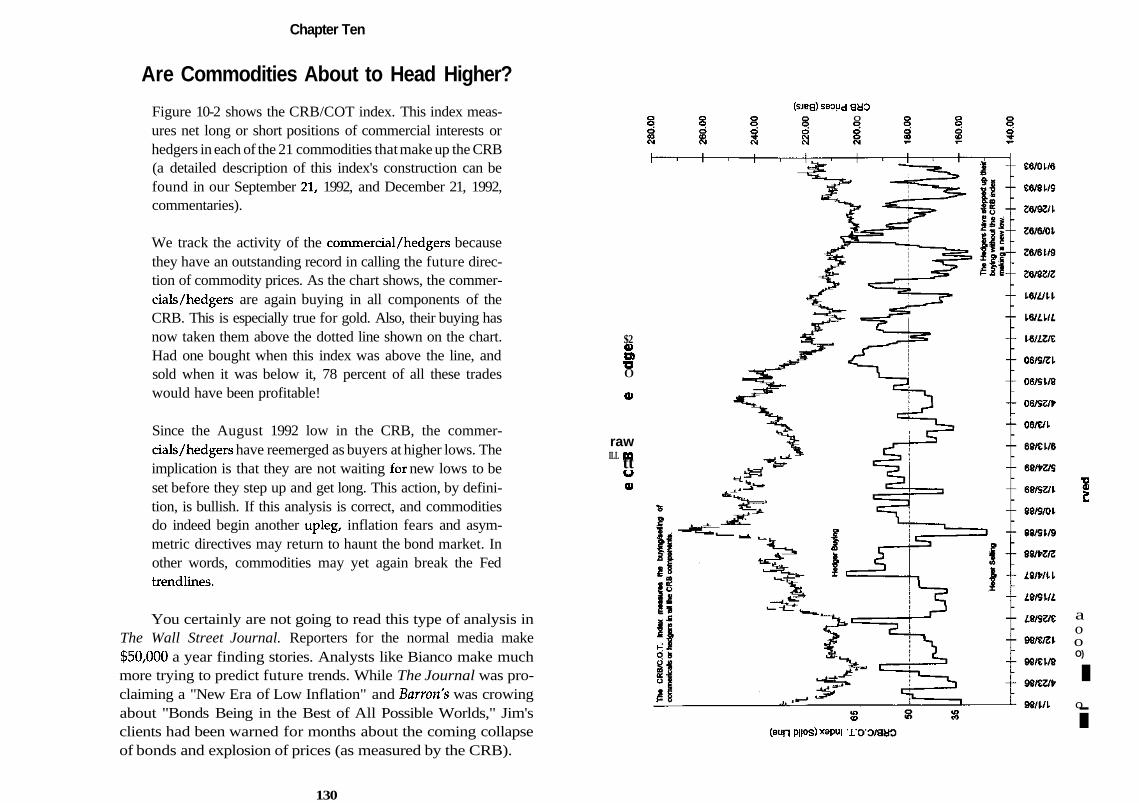
Chapter Ten
Are Commodities About to Head Higher?
Figure 10-2 shows the CRB/COT index. This index meas-ures net long or short positions of commercial interests orhedgers in each of the 21 commodities that make up the CRB(a detailed description of this index's construction can befound in our September 21, 1992, and December 21, 1992,commentaries).
We track the activity of the commercial/hedgers becausethey have an outstanding record in calling the future direc-tion of commodity prices. As the chart shows, the commer-cials/hedgers are again buying in all components of theCRB. This is especially true for gold. Also, their buying hasnow taken them above the dotted line shown on the chart.Had one bought when this index was above the line, andsold when it was below it, 78 percent of all these tradeswould have been profitable!
Since the August 1992 low in the CRB, the commer-cials/hedgers have reemerged as buyers at higher lows. Theimplication is that they are not waiting for new lows to beset before they step up and get long. This action, by defini-tion, is bullish. If this analysis is correct, and commoditiesdo indeed begin another upleg, inflation fears and asym-metric directives may return to haunt the bond market. Inother words, commodities may yet again break the Fedtrendlines.
You certainly are not going to read this type of analysis inThe Wall Street Journal. Reporters for the normal media make$50,000 a year finding stories. Analysts like Bianco make muchmore trying to predict future trends. While The Journal was pro-claiming a "New Era of Low Inflation" and Barren's was crowingabout "Bonds Being in the Best of All Possible Worlds," Jim'sclients had been warned for months about the coming collapseof bonds and explosion of prices (as measured by the CRB).
(sjeg) saoud gyoo
$201O>7J0
0>
rawILL GOttu
0) I
(aun Plios) xapui TI
aooO)
Io
i
130
Chapter Ten
The COT report is the best way to find out what commer-cials are doing. It's like reading their mail. Every two weeks thegovernment tells you what positions the largest commercials aretaking in the marketplace. The COT report divides traders intothree groups. The first group is small traders who are not re-quired to report their overnight positions daily to the govern-ment. Reportable positions can be as little as 50 contracts insmaller-volume futures to 850 contracts in the huge Eurodollarmarket. (Normally brokers report these positions to the govern-ment as a courtesy to their customers.) Those traders whoseovernight contract size requires them to report their positionsare divided further into large speculators (mostly futures fundssince a majority of large floor brokers even up their holdingsbefore each close) and commercials, who use the futures marketmainly as a hedging vehicle.
The Commodity Futures Trading Commission (CFTC) is-sues the COT report, but since the report has become so popular,they no longer send out the report to individuals. So you haveto get the report through intermediaries.
Through its data center, the Futures Industry Institute (FIFsNew York phone number is 1-202-223-1528) of the National Fu-tures Association (NFA) puts out historical data of the COT fromJanuary 1986. The NFA (200 W. Madison, Suite 1600, Chicago, IL60606-3447; 1-312-781-1300; 1-800-621-3570) through the FII alsoprovides the CFTC's long-form COT reports, which indicate theproportion of total open interest in each regulated market heldby the top four and top eight largest long and short reportingtraders. In certain agricultural futures, this long-form COT re-port separates the large traders' positions by old crop and newcrop futures.
You can also get the COT data through various chart serv-ices. Commodity Trend Service (P.O. Box 32309, Palm BeachGardens, FL 33420; 1-800-331-1069; fax 1-407-622-7623) has avery good introductory pamphlet to the COT report titled, "Howto Use Net Traders Positions." They also have the best graphicillustration of any chart service of the COT report and sell the
132
The commitment of Traders Report
data on the COT report like Pinnacle Data (below).Pinnacle (460 Trailwood Ct., Webster, NY 14580; 1-800-724-
4903; fax 1-716-872-1597) will send you the COT database of 42futures back to January 1983 for $99. They also throw in aDataMaker software that can interpolate the semimonthly andthe weekly values into daily values. (The CFTC used to collectthe COT data once a month, now it does so every two weeks).
For another $144 a year ($18 a month for diskette) you canget the COT data updated every two weeks by modem fromPinnacle. The CFTC releases two COT reports every other Fridayat 3:30 P.M. covering the holdings at the close of the previous twoTuesdays. These two reports, along with updates to the COTdatabase, are available for downloading by approximately 4:30P.M. on those Fridays. A COT report can be downloaded in oneminute at 4,800 baud; updates take approximately 10 seconds todownload.
I have tried to minimize the need for computers in the tech-niques I discuss in this book. But if you are part of the computergeneration, this data is a lot cheaper and far more valuable thanany other futures software peddled on the market today.
In my introductory comments about the commercial trader,I stated that following the commercial trader through the COTis the indicator I respect the most except for following the media.But, like any single indicator, there are problems:
1. You are getting data that is three days behind the market,which can be an eternity in fast-moving markets. It'shard for the commercials to totally reverse their posi-tions in three days, but this is still something for you toconsider.
2. Now that the government is releasing the COT reportevery two weeks, this data has become very popular.Barren's and The Wall Street Journal have had major fea-tures on the COT report. Its popularity has become sogreat that the release of the COT has been credited withmoving markets.
133
Chapter Ten
The April 1,1994, COT report showed commercial tradershad cut back their long positions in many commodities, notablyprecious metals, and increased their bearish short positions. Asa May 2,1994 Wall Street Journal article put it, "Its negative tonewas widely cited as the cause of the rout (in commodities)."
As a devoted follower of the print and electronic businessmedia, I didn't see much media evidence that the April 1,1994,COT report was cited as the cause for the fall in futures exceptin soybeans, which, in typical media trading fashion, wereheaded to a two-month low a few days later. But the point stillstands. The more widely known and popular the indicator, theless value it is to the trader, who must find the charts andindicators no one sees.
3. The futures the COT report covers are not always theprimary market for trading in that market.
Futures comprise less than 3 percent of the U.S. currencymarket, which in turn is not the primary market for world cur-rency trading (London is). Any COT report about London-domi-nated futures has to be used with some caution.
During the last half of June 1994, gold commercials werereported in the COT to have begun to cover their shorts. Theywere at their most bullish reading since March 1993 by theAugust 12 report. Even a brilliant analyst like Bianco concluded:"Given their (the gold commercials) track record, we expect tosee higher prices." While prices didn't collapse during the timecommercials were becoming more bullish on gold, anyone pig-gybacking on their buying had to be somewhat disappointed. Itmay turn out that this was a great opportunity to buy gold butit also could be just another minor rally that fizzled at the $390-$410 level.
The silver commercials increased their short position shortduring June 1993, creating the largest short position for them in10 years. The long position of the large traders in silver was thelargest in ten years. Silver suffered over a 10 percent sell-off fromlate June to early August 1994.
134
The Commitment of Traders Report
Gold is mainly produced in South Africa and Russia and ismainly disposed of in Europe. U.S. gold commercials are rela-tively penny-ante compared to those in Europe. Even the bestof them could be fooled concerning world market conditions.Silver is mainly produced in the western hemisphere (Mexico,Peru, Canada, the United States, Chile, etc.). The center of thesilver trade is in New York. In other words, the commercials whohave to report their futures trading to the government have theirpulse directly on world demand because they are part of theprimary market. They rarely, if ever, make mistakes.
When you use the COT Report, remember whether thedominant market is here or overseas. You should watch thecommercials who are not part of the dominant market trade.They certainly know more about the fundamentals than you andI. But they can get fooled, so trade accordingly.
4. Commercial traders are emotional human beings likeevery other trader. Unlike the public, they normally con-tain these emotions, but occasionally even they will yieldto emotions and make dumb decisions.
In my introduction to the commercials, I discussed howthey panicked and loaded up on everything when it seemedClinton would bring in an era of free-spending Democrats. Allthey could see was a repeat of the Carter years when futuresprices zoomed. But even during the Carter era, futures pricesdidn't go straight up immediately after Carter's inaugural. After12 years of deflationary policies, even Clinton policies couldn'tchange things overnight. Any way you look at it, this was anoverreaction.
But by far the worst example of emotional, dumb decisionsby savvy commercial traders that I can think of was the secon-dary bond top in January 1994. The COT Report in bonds onJanuary 4, 1994, showed commercial traders at the highest netlong position since the August 1987 period, when bond priceswere over 30 basis points lower. It was not that they weren'twarned. As you can see from Bianco's report, many analysts
135
Chapter Ten
were warning of collapse. Storm clouds were everywhere on thebond horizon, but the average commercial was blissfully loadingup on bonds.
A very astute analyst, Paul Montgomery of Legg Mason,has made the observation that participants in a bull market,become more concerned about their income statement than theirbalance sheet. This means that investors will take more riskbecause they fear a missed opportunity more than they fearpotential loss of capital. Many commercial bond portfolio man-agers are in the same boat as their Wall Street counterparts. Ifthe Street consensus said to buy and the portfolio manager does,and then stocks and bonds go down, the portfolio managerrarely gets in trouble. After all, he was only doing what everyonesaid was the smart thing to do.
But if the Street consensus is long and the manager doesnot follow it but stocks and bonds go up anyway, he is in deeptrouble. The classic example is the stock managers who gotout of the market in the spring of 1987 because stocks weregetting far too frothy. Sitting in cash while the Dow soaredfrom 2,300 to 2,700, they were crucified by their subscribers.They lost millions in assets as disgruntled investors rushed toinvest with more stupid managers who only knew one way inthe markets.
Even when the Dow plunged to 1630 in October 1987 andthese managers were proven right, they rarely got back theirprevious investors. By that time these investors were toofrightened to put money back into the stock market. If theydidn't panic and sell out entirely, they left their money withthe dumb managers because "Why should I make any movesnow when things are so cheap?" Just like the special intereststrample any legislator who really wants to represent his peo-ple by cutting spending, so the thundering emotions of WallStreet (and bond) investors insure they will always deservea below average return.
You can't blame the January 1994 failure of commercial bondtraders on the fact they didn't trade the primary market. That's why
136
The commitment of Traders Report
I feel the media is the best indicator. The media was giddy, almostslaphappy in their reporting on the bond and stock market.Unlike even the best commercial traders, the media never failsto register a clear signal at major tops and bottoms.
137
Chapter Eleven
Spreads
There are two old floor trader definitions of a spread: a tradewhere you have twice the chance to lose, and the only positionwhere two things have to go the right way for you to profit.
If you read all the interviews given by the traders quotedin Market Wizards,1 spread trading seems to have caused moregrief than anything else. In their early years, market wizardsBruce Kovnar, Brian Gelber, and Tony Saliba suffered massivelyfrom ill-conceived spreads.
Yet spreads are often the vehicle of choice for commercialtraders (and many floor traders as well):
1. They provide relatively cheap insurance against someunexpected event that was beyond the capability of eventhe most astute commercial trader to anticipate.
You might have been able to anticipate the failed Russiancoup attempt of August 1991 or the Chernobyl incident if youhad a pipeline directly to the CIA. It's possible you could haveanticipated, by observing the mysterious market movement justbefore these events, the sudden devaluation of the dollar by
1 Jack Schwager, Market Wizards (New York: Simon & Schuster, 1989)
139
Chapter Eleven
Nixon in August 1971 or the Fed's shocking move to raise inter-est rates in a big way in November 1978. But if you hadn't andyou were a commercial with large positions in the market, youcould have suffered the loss of millions in a single stroke.
Now, as we've seen before, commercials can make awfullydumb decisions that have nothing to do with reality. But if youstudy all the evidence (I've provided you with just some if itwith those charts in the COT section), you'll agree with me thatthese silly sessions are few and far between. No, the greatestenemy of the commercial is the unexpected event as outlinedabove.
Picture a commercial grain trader in August 1991 long azillion bushels of wheat. Unlike the floor trader or the funds, hedidn't need to worry about position limits even if, strictly speak-ing, he was not hedging his future consumption needs. Priceswere extraordinarily cheap, both after inflation and in nominalterms. The peak of the 18.6-year lunar node cycle (more on thisin a later chapter) was due next year. The last time this cyclepeaked, grain prices went berserk. Next year (1992) was anelection year, and you know that politicians love to reward grainfarmers in an election year—especially a presidential electionyear with all those farm state electoral votes. This commercialgrain trader could anticipate the end of the harvest and thenormal, strong seasonal uptrend in wheat prices. Yes, he couldhave anticipated everything but that a Russian coup attemptwould send wheat prices down 20 cents in a day. SuddenlyRussians were never going to eat wheat again and import ourgrain.
Of course, a commercial could have probably borrowed themoney he needed for the margin call and ridden out the 10 weeksit took the wheat market to recover from this fiasco. Or he couldhave noted how much wheat had already rallied and purchasedsome insurance for a weekend surprise such as the Russian coup.
The margin on a wheat/corn spread never requires moremargin than being net long wheat (usually it's less). He couldhave sold an equal amount of corn without putting out anymore money for margin. Other than commissions (which is
140
Spreads
little more than floor fees for the average commercial), his onlyother cost was if a rally in corn cut slightly into his wheat profits.His only risk was the very, very slight chance that corn wouldgo up faster than wheat in a time when wheat was almost allharvested but the corn harvest was yet to start.
Had he put on this insurance before the Russian coup, hislosses after the coup would have been limited to the differencebetween the fall of wheat (20 cents) and the fall of corn (15 cents),or five cents total. It's likely he wouldn't have had to put in adime more to hold this position. After the dust cleared and sanityreturned to the markets, he could have quietly bought in hiscorn, went back to being net long wheat, and made a bundleover the next few months.
If the Fed chairman were to make some unprecedentedadvance announcement (as has happened) the whole yield curvecould rise 10 basis points (a parallel shift) and the T-bond con-tract could lose 33 points without batting an eye. But if you hadbeen short T-notes at the same time, the 21-point gain wouldhave made up for a lot of that bond loss. And, like the wheat/cornsituation above, putting on the same number of short T-notecontracts as you have long bond contracts cost you nothing newin margin (usually it will cut it in half).
2. Spreads are often an easier way to take profits for thebig commercials.
For professionals, taking losses are far easier than takingprofits. Losses are mainly a mathematical problem—you canonly lose so much based on the size of your account, so you takethe loss. But taking a profit can be agony—who knows how farthe market is going to go in your direction? After all, you'vealready decided that it is the right way it should go. Who areyou to say it can't go any farther than X? Knowing when to takethe profit is an art every professional trader is struggling to getexactly right.
Commercial traders have this problem, and one other be-sides: They are like elephants who have to watch where theystep lest they crush the market. Putting on a spread often seems
141
Chapter Eleven
like the best solution to both problems.Let's push our wheat commercial a few months ahead to
December 1991. He's got big profits and wonders if it is time tosell. Just like the example above, the fundamentals of wheat arestrong and the fundamentals of corn are weak. Rather than sell10 million bushels of wheat outright, it's easier to sell five millionwheat and five million corn at the same time.
In the first place, the commercial can test the market to seehow it handles a large line of selling. If the market handles itwell, he still has part of his wheat position left that shouldcontinue to outpace the short corn he has against it. If the marketdoesn't handle it well, he knows he was right to sell and goesahead to sell the rest of his position, which takes down his shortcorn as well.
He won't make quite as much money being long five mil-lion wheat and short five million corn as he would by being netlong 10 million bushels of wheat if wheat continues to rise. Butif he found out he was right to be nervous about his wheatposition, he got a jump on everyone else and didn't have to tryto get out when the whole world was heading to the exit door.
One variation of this big-position testing process would beto simply sell corn and watch what happened to wheat. Hedoesn't tip his hand that he is nervous about his position andattract further selling. Nor does he overly compromise his po-tential profits as a wheat long. But he still gets to see the tone ofthe overall market.
3. Spreads are technically better than outright net posi-tions.
The public, for the most part, does not look at spreads. Thefunds also consider them a minor vehicle. But any technique youwould use on a bar chart—trend lines, retracements, gaps, etc.—works even better with spreads.
In fact, the herd buying and selling of funds creates tremen-dous spread opportunities. The funds and the public fixate onbuying or selling one or two lead contracts. Thus the spreadsdistort from their true fundamentals. Being spread also enables
142
Spreads
floor traders and commercials to hold onto their core positionsuntil the thundering herd gets done.
4. Changing spreads are one of the best warning indicatorsof a potential top or bottom.
There are three basic spread indicators at tops and bottoms.
a. The weak sister approach. This approach looks for acommodity in a sector (grains, meats, precious metals,etc.) that fails to go up, or goes up much less that therest of the sector. When your analysis says sell thestronger futures, you sell the weak sister instead. Ifyou are wrong, you won't lose much. But if you areright and the whole sector turns around, being shortthe weak sister might give you as many profits asbeing short some of the high flyers. This strategyworks in reverse for a commodity that refuses to fallas fast as other futures in a weak sector.
b. The lost leader approach. Usually one commodity—oreven one month in a commodity—leads the wholesector up or down. When, after a long period of lead-ership (several weeks at least) that leader suddenlyfails to lead that sector on the up or downside, a trendchange is likely for the whole sector.
This leader sometimes can be a leader in a sector for manyyears at a time. For a long while, gold shares have been leadingthe gold bullion market up and down. Utilities have been a goodleading indicator for the direction on bonds. Soybean products(meal and oil) normally move ahead of soybeans (even if thesoybean products movement warning is only a few hours aheadof the beans).
Smaller-volume futures that are dominated by commercialtraders often initiate a move before the bigger members of thecomplex. "As oats go, so goes the grain market" is not true allthe time. But it's true enough that it should be watched. I've alsonoticed palladium will often rally or fall before the other pre-cious metals follow suit.
143

Chapter Eleven
c. Waiting for the end of the limits. Often a sector willbottom or top (usually it's a top) when the last com-modity of a sector comes off its limit and finally beginsto trade after several days of limit moves (up ordown).
Because commercials and floor traders are often spreadbetween two commodities, they hesitate to take profits until bothare freely trading and they can take off their spread as a spread.In addition, smart traders hesitate to move in or out of a positionuntil they can read the spreads.
The Most Common Fallacy about Spreads
The most common fallacy about spreads is that they are not netpositions. No, I'm not being facetious. What I mean by this is thatit is important to calculate spreads in percentage terms and notas absolute numbers.
Look at any spread chart that records the history of spreadsfor several decades. If July beans are 25 cents over Novemberbeans (the July contract is 25 cents higher), and it moves to 50cents over November, recorded in the spread chart history is this25-cent move.
It matters not if this occurred because November beanswere 5.00 and stayed 5.00 while July went from 5.25 to 5.50, orif November beans were 7.00 and went to 10.00 while July wentfrom 7.25 to 10.50. Yet we all know intuitively that these aredifferent situations and shouldn't be viewed the same way.
In the first 25-cent spread move, July went from 5 percentover November to 10 percent. In the second identical move, Julywas 3.57 percent over November and went to 5 percent over.They are not the same.
In the 1950s through the early 1970s, corn traded mainly ina trading range from 1.60 a bushel to a little above a 1.00 a bushel.If we look at a historical corn basis chart (the difference betweenthe closest future and a primary cash market), is a five-cent basisthen the same as a five-cent basis now? But that's what every
144
Spreads
basis chart I've seen implies.One thing is apparent to me. If anyone is going to do
historical spread comparisons, he should use percentage termsrather nominal moves—even though the spread trader is paidoff in nominal terms. Otherwise, how does he know if a spreadmove is normal or not?
You don't suffer from this type of price illusion when youcompare the price history of a single future. A 10.00 to 11.00 movein the nominal charts is the same in 1974 or 1994 (although whatit means after inflation and currency factors are taken into ac-count are another matter altogether).
A 5.00 to 6.00 move is 20 percent, while the same one-dollarmove from 10.00 to 11.00 is only 10 percent, but this distortionis readily adjusted for on the nominal chart through trend linesthat rise and fall at a constant percentage and other similartechnical indicators.
But when it comes to spreads, if you attempt to do researchon them in the exchanges, through commercial vendors of his-torical data, or in books, you see spreads treated the same wayas single futures—the spread price difference is the spread pricedifference is the spread price difference. Any conversion of themto a ratio that is measured by percentages, instead of differencesin the prices, has to be done by you.
What if I told you that the ratio of the Dow to the CRB isthe highest in history, that this ratio is nearly double that of themid-1960s? That's a significant statistic you can understand. Youcan even chart this ratio and use it for some of your long-termdecision making.
But what if I said the Dow-to-CRB spread is +3670? Thatmay be technically correct, but can you use it for comparisons?Does this figure help you in long-term decision making? Yettraders do this all the time in researching data on spreads!
The investment world is full of spreads, only they are called"ratios" when they are not directly traded on some exchange(i.e., the option premium ratio between the premium on callsversus the premium on puts), or the standard put/call ratio andall the variations thereof. These may be called sentiment indica-
145
Chapter Eleven
tors, but they are really spread relationships, ratios that histori-cally have high and low readings. I could go on and on givingexamples of financial spreads.
Now, I believe the media is the best trading indicator thereis, but in accordance with the Psychological Rule of 10/20 Per-cent, I would never base any more than 20 percent of my tradingdecisions on what the media is saying to do in the market.Otherwise I am vulnerable to being overly committed to onecourse of action, refusing to change my opinion and read thechanges in the market, which might even be (ever so slightly)reflected in the media as well. Like Longstreet's trader, I'veentered the Hall of Mirrors: everything I see only encourages meto believe I am a trading genius that has found the secret of thetrading universe.
In regard to the Psychological Rule of 10/20 Percent, aspread is a spread is a spread. If you are using ratios like theput/call, you are still basing your trading decision on a spread.You are still relying on historical relationships between twothings. So be on your guard that you aren't overly committed inyour analysis to spreads. It's an easy thing to do, especially forprofessionals that are constantly looking for another way to lookat data.
As I look over the last few pages, I can see I've spent a lottime warning about the misuse of spreads. I may have inadver-tently given too negative an impression on the use of spreads inyour trading and your analysis.
The fact is, I love to read about and look at spreads. It's thesecond most powerful tool in determining what commercialtraders might be doing. Compared to all the "Trading Secrets ofthe Universe" books out there, little has been written aboutspreads. I advise you to read all the books you can find aboutspreads and spend time looking at their charts. By all means,you should be on the lookout for ratios in the market that fewknow about. Just keep my warning in mind when you do so.
146
Chapter Twelve
Real-World investingIt's Not "All in the
Charts"
According to Commodity Futures Trading: A Biographical Guide,R.N. Elliott was a mystic who believed mathematical relation-ships in an Egyptian pyramid predicted future events and cor-roborated his own wave theory.1 W.D. Gann's books are full ofreferences to numerology and what can only be called a weirdmixture of Bible and astrology.
These two pillars of technical analysis are by no meansunique. Pick up financial publications, especially those special-izing in futures, and you will see advertisements for everythingfrom financial astrology to mind-numbing esoteria like twin-vi-bration vertical-bar backtracking system that needs a computergenius to run and Ph.D. to understand. Whether you call it theSacred Six or Chart Mysticism, the belief that price-only analysisis the key to trading success has captured the overwhelmingmajority of futures traders.
1 James B. Way, Commodity Futures Trading: A Biographical Guide (New York: R. R.Banker, 1976).
Chapter Twelve
My first encounter with this religion was in 1977. It was mysecond job as a broker. I worked for a clearing firm of the ChicagoMercantile Exchange. A computerized charting system had justbeen installed in the bowels of the building that housed the Ex-change. From this specially air-conditioned room (whenever theair conditioning broke down, the computer was shut off), terminalsall over the building received those magical charts. Think of it! Itwas less than 20 years ago, but the average broker was still de-pending on those grimy charts that came out once a week. As forintraday charts, floor traders constructed them by hand from littlenotes they scribbled on their trading cards. It was a big deal to getspread charts from the only service that handled them. Today,virtually every futures trader has all this and more at the stroke ofa key. But I remember how everyone in the office spent hours,totally mesmerized, pouring over the charts and indicators thatcame effortlessly to the screen. Who could possibly lose in thisbrave new world of instant technical analysis?
Sadly, all this computerized technical firepower has notchanged the loss ratio of the average futures trader. Ninety per-cent of them are still losing, a percentage mainly due to thefactors discussed in the second chapter of this book.
But even technicians that have mastered the psychologicaland mathematical pitfalls of trading still have another obstaclein their path. The very price data they depend on is flawed inat least three basic ways:
1. The big money—the major players that move the mar-ket—may be looking at something entirely different thanfutures prices.
In currency it's cross rates, in interest rates it's yields, andin the stock market, decisions are being made based on the cashprices of individual stocks and stock indexes. The carryingcharge factor built into the futures price of both stock indexesand bond futures does cause distortion.
Jim Bianco, Arbor Trading's brilliant analyst, uses the LehmanLong-Treasury Index in his long-term analysis. This index is amarket-weighted index of all Treasury issues between 10 and 30
148
It's Not "All In the Charts*
years and is not distorted by the positive carrying charge offutures nor the on-the-run bonds like a yield chart. No wonderfutures bond trading can be so frustrating technically!
2. The price action of stocks is different than that of futures;a bear market reacts differently than a bull market.
I've discussed this in detail in several previous chapters,but it's worth noting again that most of the classic works oftechnical analysis were designed for stock trading, not for fu-tures.
3. The great technical gurus of the past (Gann, Elliott, An-drews, Edwards and McGee, etc.) operated in a stableenvironment of level prices and fixed currencies.
According to a study by Warren and Pearson, wholesaleprices in 1944 were virtually identical to those in 1793, one yearbefore the start of U.S. gold coinage. This remarkable price sta-bility was marred only by the War of 1812 and the Civil War. Topay for those wars, the Treasury issued fiat currency in the formof Treasury notes and greenbacks. Prices doubled, but soon re-turned to normal when gold and silver coins were minted againafter these wars. All this has changed, due to the followingfactors:
1. Senators are no longer elected by state legislatures, butdirectly by the people. Gradually, the power of stategovernments was eroded to the point that today, theyare becoming mere rubber stamps of the federal govern-ment. (If you don't believe me, just ask your state legis-lator how much of your state's budget is driven byFederal matching funds or mandates.) The ninth andtenth amendments of the Constitution became dead let-ters. States can't issue money, but the federal govern-ment can/Through the Federal Reserve System, this debtcan be "monetized" and inflated away. Thus the federalgovernment has a great incentive to expand, spendmoney, and go into debt—the cost of which is passed onto the American people as a tax called inflation.
149
Chapter Twelve
2. The sixteenth amendment allowing a federal income taxgave the Feds a great tool to expand their tax base, whichwas previously based on the very limited revenues ofcustoms. A big government with a big tax base can main-tain a big debt—which gives the government every in-centive to inflate that big debt away.
3. The founding of the Federal Reserve—a private bank—letthe politicians blame recessions, depressions, and inflationon someone else. No longer would monetary transactionsbe under public scrutiny at the U.S. Treasury.
In 1913, the Fed was required to have a 40 percent goldbacking on the Federal Reserve notes it issued, 35 percent forsystem liabilities. In 1945, this was reduced to 25 percent as theBretton Woods Agreement officially abolished the old goldstandard. In 1965, the Fed was no longer required to have goldbacking on system liabilities. By 1968, all gold-backing require-ments were removed from Federal Reserve notes, and silvercertificates were no longer valid. In August 1971, the last linkwith gold was severed when Nixon suspended balance of pay-ments in gold to overseas' governments and let the dollar float.
After each of these actions, inflation ratcheted upward. To-day, we congratulate ourselves that inflation is only 3 percent—just like we are pleased the federal deficit will only be $200billion or the crime bill was cut from $33 billion to $30 billion,or the dollar rallied a few percentage points after losing half itsvalue in a decade. There is really no sign that inflation, govern-ment spending, or monetary chaos is going to stop.
But most chartists would rather die than admit their sacredcharts need to take account of currency- and inflation-adjustingfundamentals. It's easier to talk about an "unexpected Elliott-Wave extension or Gann number I forgot." The last 50 years haveseen unprecedented inflation and currency fluctuations, yet thesame old charting practices of the 1930s and 1940s are still taughtas gospel. If McGee and Edwards were still writing, they'd useinflation- and currency-adjusted charts!
I could give hundreds of examples of where inflation- and
150
It's Not "All In the Charts"
currency-adjusted charts were more accurate in determining fu-ture price trends than nominal charts. I can only hope the fewexamples I give in this book will somehow jolt you out of thenominal chart orthodoxy and into looking at inflation- and cur-rency-adjusted charts.
One Example of inflation-Adjusted ChartingFigure 12-1 is the "Constant Dollar Dow" put out by MediaGeneral Financial Services of Richmond Virginia. On the top halfyou see the nominal price of the Dow. On the bottom is theinflation-adjusted, Constant Dollar Dow.
The Constant Dollar Dow has been far more accurate incalling Dow tops than standard technical analysis. Few techni-cians were calling for a top in August 1987, but the 1.382 gapobjective in the Constant Dollar Dow chart was almost exactlythe August 1987 top (March 1986 gap of 143.02 minus the August1982 low of 78.01 = 65.01; 65.01 x 1.382 + 143.02 = 232.86). The1987 move also filled a gap made in February 1973 at 228.60.
In January 1994 the Constant Dollar Dow went over 260,filling a gap at 252.71 and reaching the secondary, reaction highof 261.32 of May 1969. A classic five-wave, C-wave Elliott cor-rection was being completed.
But most technicians at the time were saying 4,000 in thenominal Dow would be easily breached. They urged you to buyany small correction. I can still hear the voice of our local TVElliottician: "I just looooove these corrections."
After missing the top in January, most technicians in Aprilwere expecting even lower stock prices. But the next ConstantDollar Dow support level was at the 235-240 level. (We reacheda Constant Dollar Dow low of 238.91 on April 4, 1994.) In thereal world of constant dollars, it was time to buy.
I doubt if these technicians would have been so off if theyhad been looking at real-world, constant dollar charts. Nor is itlikely they'd be so excited at the recent August 1994 technicalbreakout of the stock market if they saw the trend line off the1966 high and the January 1994 high in the Constant Dollar Dow.It's time to sell, not buy.
151
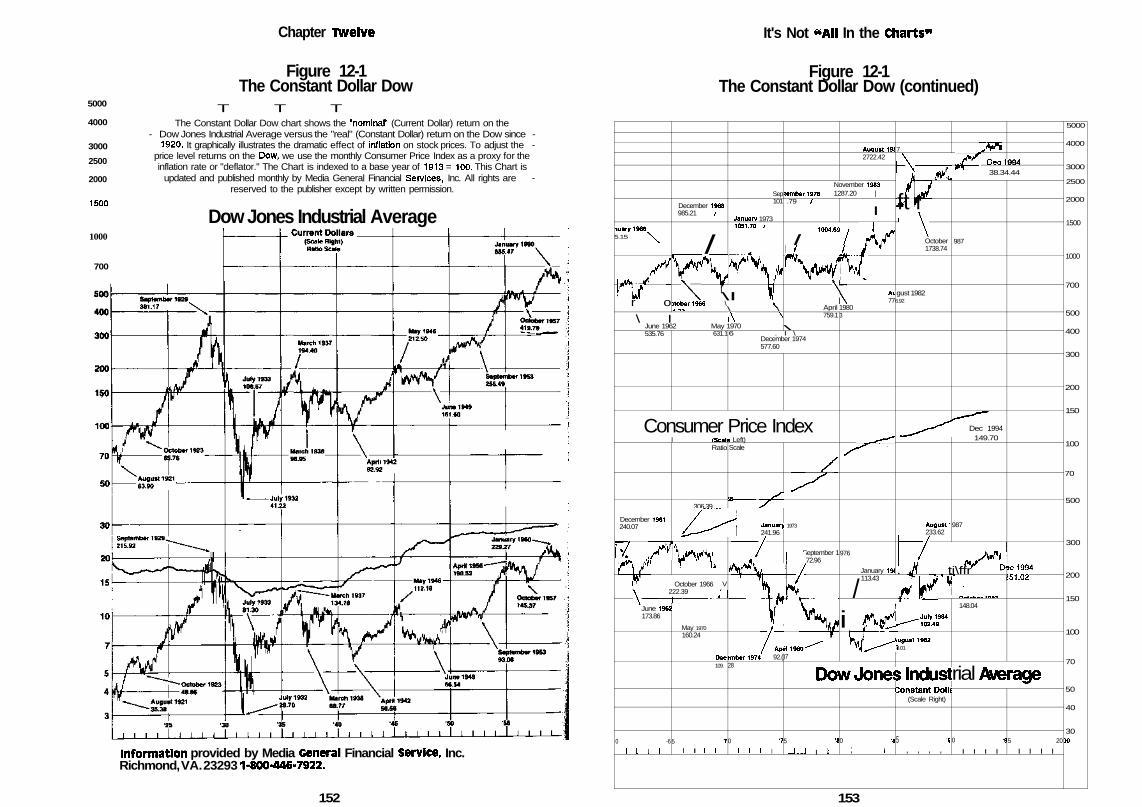
Chapter Twelve
Figure 12-1The Constant Dollar Dow
5000
4000
3000
2500
2000
1500
T T TThe Constant Dollar Dow chart shows the "nominal" (Current Dollar) return on the
- Dow Jones Industrial Average versus the "real" (Constant Dollar) return on the Dow since -1920. It graphically illustrates the dramatic effect of inflation on stock prices. To adjust the -
price level returns on the Dow, we use the monthly Consumer Price Index as a proxy for theinflation rate or "deflator." The Chart is indexed to a base year of 1913 = 100. This Chart is
updated and published monthly by Media General Financial Services, Inc. All rights are -reserved to the publisher except by written permission.
1000
700
Dow Jones Industrial Average
information provided by Media General Financial Service, Inc.Richmond, VA. 23293 1-800-446-7922.
152
It's Not "All In the Charts"
Figure 12-1The Constant Dollar Dow (continued)
nuary19665.15 \y
/*.Ml, ftP
rVr o
December 1968985.21 /
/V"\
\¥
Sep101
January 19731051.70 /
AAr I w\l l
:tober1966 \ \» -»t \ \
\ I i\ N
June 1962 May 1970535.76 631.1
August 19C2722.42
November 1983tember1976 1287.20 |.79 /
I
/ ™7 yVkyi Tv/
\Ai77
April 1980759.1
\6 . I \
December 1974577.60
Consumer Price IndexI (Scale Left)
December 1961240.07
V S*ry
Ratio
306.39
VnP October 1966 V\ 222.39 I
\ —————————————— 'J
June 1962173.86
0 -6
i i i i
May 1970160.24
Dec109.
5 -7I I I I
Scale
* —— 17^~
January241.96
r/iV*'V.•*\i^T
nsmber 1974 92.(28
0 '7
. . ! . .__!_ I I
/
^
1973
September 1172.96k\j
il 1980^ ^)7
3
^_j_^~^
^
976
January 19C
7
^—rk jiVV
jVft r-\
October1738.74
gust 19826.92
-^
August '233.62
>m_/^ Dec1...994r ' 38.34.44
987
^-^Dec 1994
149.70
987
r/ ^. Jl ti\ffr o
113.43 f J" ' |T i
/ |fjy V......i /v^-sor
^DowJonef
5 '«
-J...I I I
i
0 '8; i i i
August 19828.01
>lndustConstant Doll.
(Scale Right)
5 -a, , , ,
148.04
2C1994'61.02
rial Average
0 '9
I I I I
5 20
I I I I
5000
4000
3000
2500
2000
1500
1000
700
500
400
300
200
150
100
70
500
300
200
150
100
70
50
40
30DO
153
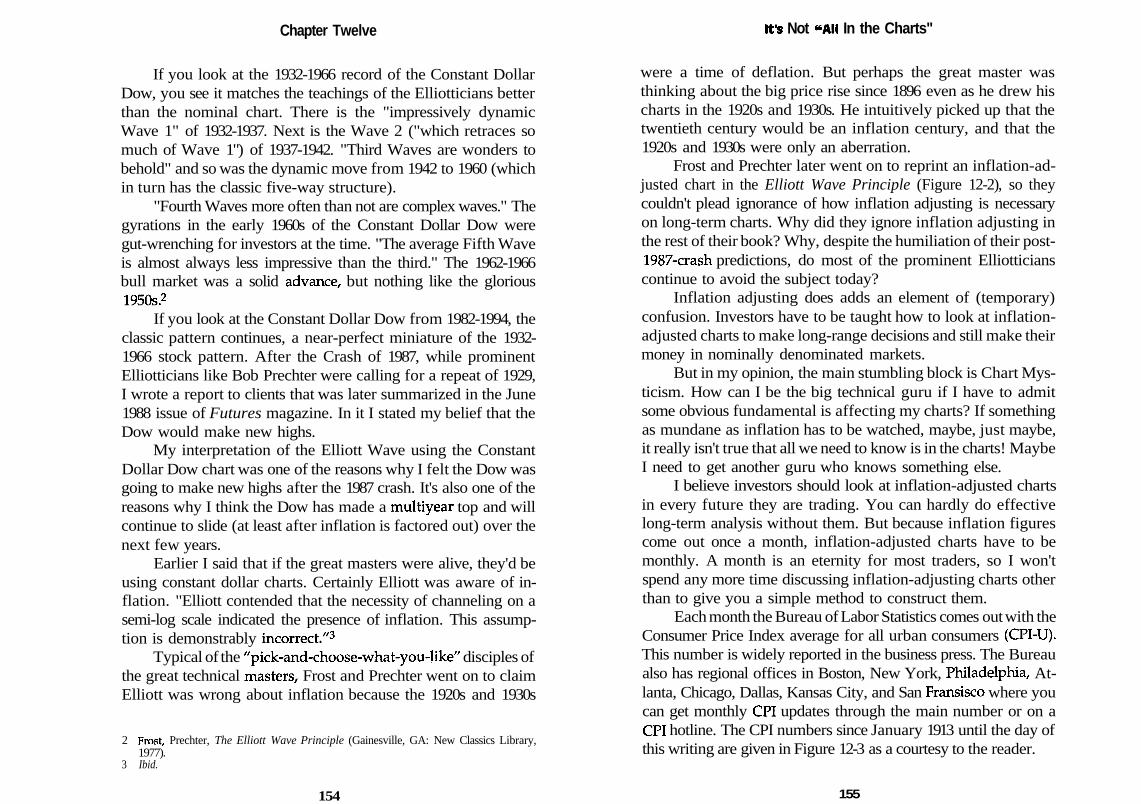
Chapter Twelve
If you look at the 1932-1966 record of the Constant DollarDow, you see it matches the teachings of the Elliotticians betterthan the nominal chart. There is the "impressively dynamicWave 1" of 1932-1937. Next is the Wave 2 ("which retraces somuch of Wave 1") of 1937-1942. "Third Waves are wonders tobehold" and so was the dynamic move from 1942 to 1960 (whichin turn has the classic five-way structure).
"Fourth Waves more often than not are complex waves." Thegyrations in the early 1960s of the Constant Dollar Dow weregut-wrenching for investors at the time. "The average Fifth Waveis almost always less impressive than the third." The 1962-1966bull market was a solid advance, but nothing like the glorious1950s.2
If you look at the Constant Dollar Dow from 1982-1994, theclassic pattern continues, a near-perfect miniature of the 1932-1966 stock pattern. After the Crash of 1987, while prominentElliotticians like Bob Prechter were calling for a repeat of 1929,I wrote a report to clients that was later summarized in the June1988 issue of Futures magazine. In it I stated my belief that theDow would make new highs.
My interpretation of the Elliott Wave using the ConstantDollar Dow chart was one of the reasons why I felt the Dow wasgoing to make new highs after the 1987 crash. It's also one of thereasons why I think the Dow has made a multiyear top and willcontinue to slide (at least after inflation is factored out) over thenext few years.
Earlier I said that if the great masters were alive, they'd beusing constant dollar charts. Certainly Elliott was aware of in-flation. "Elliott contended that the necessity of channeling on asemi-log scale indicated the presence of inflation. This assump-tion is demonstrably incorrect."3
Typical of the "pick-and-choose-what-you-like" disciples ofthe great technical masters, Frost and Prechter went on to claimElliott was wrong about inflation because the 1920s and 1930s
2 Frost, Prechter, The Elliott Wave Principle (Gainesville, GA: New Classics Library,1977).
3 Ibid.
154
It's Not "All In the Charts"
were a time of deflation. But perhaps the great master wasthinking about the big price rise since 1896 even as he drew hischarts in the 1920s and 1930s. He intuitively picked up that thetwentieth century would be an inflation century, and that the1920s and 1930s were only an aberration.
Frost and Prechter later went on to reprint an inflation-ad-justed chart in the Elliott Wave Principle (Figure 12-2), so theycouldn't plead ignorance of how inflation adjusting is necessaryon long-term charts. Why did they ignore inflation adjusting inthe rest of their book? Why, despite the humiliation of their post-1987-crash predictions, do most of the prominent Elliotticianscontinue to avoid the subject today?
Inflation adjusting does adds an element of (temporary)confusion. Investors have to be taught how to look at inflation-adjusted charts to make long-range decisions and still make theirmoney in nominally denominated markets.
But in my opinion, the main stumbling block is Chart Mys-ticism. How can I be the big technical guru if I have to admitsome obvious fundamental is affecting my charts? If somethingas mundane as inflation has to be watched, maybe, just maybe,it really isn't true that all we need to know is in the charts! MaybeI need to get another guru who knows something else.
I believe investors should look at inflation-adjusted chartsin every future they are trading. You can hardly do effectivelong-term analysis without them. But because inflation figurescome out once a month, inflation-adjusted charts have to bemonthly. A month is an eternity for most traders, so I won'tspend any more time discussing inflation-adjusting charts otherthan to give you a simple method to construct them.
Each month the Bureau of Labor Statistics comes out with theConsumer Price Index average for all urban consumers (CPI-U).This number is widely reported in the business press. The Bureaualso has regional offices in Boston, New York, Philadelphia, At-lanta, Chicago, Dallas, Kansas City, and San Fransisco where youcan get monthly CPI updates through the main number or on aCPI hotline. The CPI numbers since January 1913 until the day ofthis writing are given in Figure 12-3 as a courtesy to the reader.
155
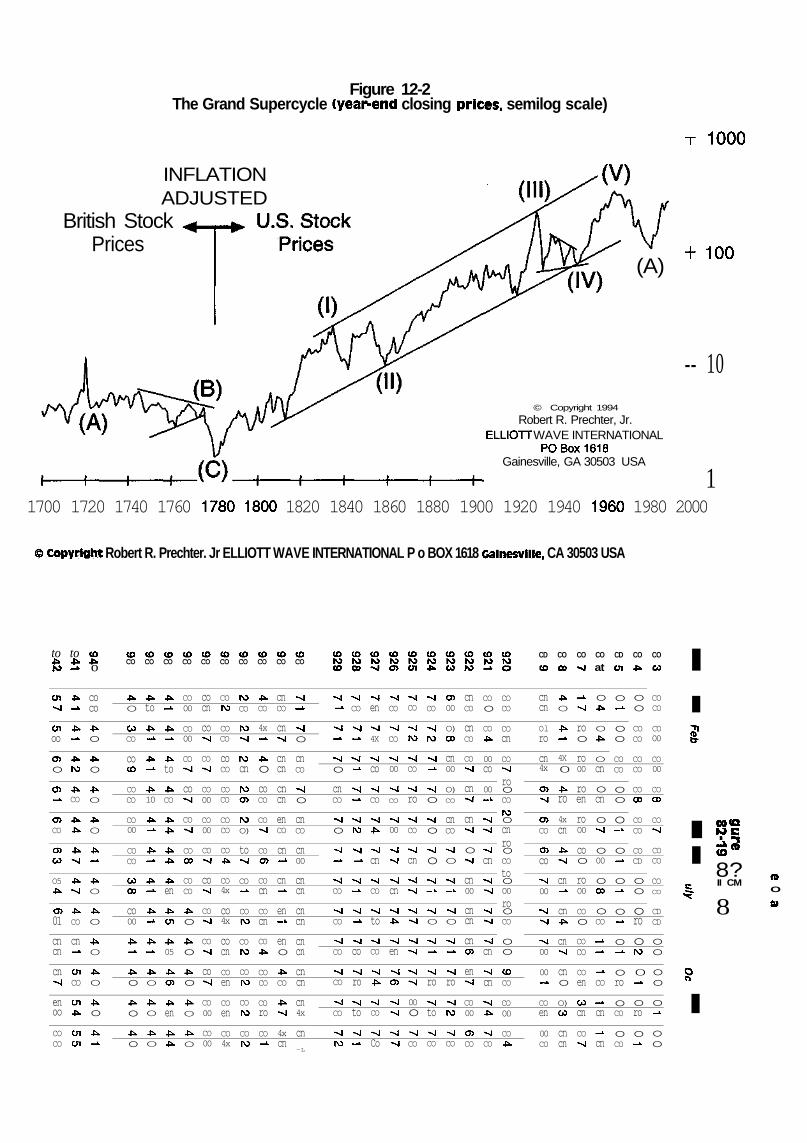
Figure 12-2The Grand Supercycle (year-end closing prices, semilog scale)
T 1000
INFLATIONADJUSTED
British StockPrices
(A)--100
© Copyright 1994
Robert R. Prechter, Jr.ELLIOTT WAVE INTERNATIONAL
PO Box 1618Gainesville, GA 30503 USA
-- 10
11700 1720 1740 1760 1780 1800 1820 1840 1860 1880 1900 1920 1940 1960 1980 2000
©copyright Robert R. Prechter. Jr ELLIOTT WAVE INTERNATIONAL P o BOX 1618 cainesviiie. CA 30503 USA
to to to4* *. 4*10 -» oC O C O C O C O C D C 0 C O C O C O C OCO CO CO CO CO CO CO CO CO CO
C O C D C O C O C O C O C O C O C D C Oi o i o N > r o r o r o i o i o M i oc o o o ^ i o > u i 4 * c o i o - ' o
CD CO CO CO CD CO CO
co oo -vi at en * co
en•-g
O1oo
eno
en-1
o>CO
O)u>
O54>.0)01
cncn
cn-g
enoo
COCO
*.-*
*.-*•
4*10
4s.CO
4*-4*.
*.-si
4*-vl
4».CO
cn-1
enCO
en4*.
enen
coco
4*o
4*o
4vO
4*O
4*.-*
4*O
4*O
4».O
-IXO
-IXo
4*.-
4».O
COCO
coCO
COCO
CO00
COCO
COCO
co00
4*.-1
4».o
4Xo
JXo
4xto
4>.-L
4±
-1
4*.10
4-1
4*-*
4X
-J>
4*-*•
4*_A
4xO
-|xO
4*O
4_^
4x-*
4xto
4*.CO
4x4x
4x4*
4*en
4*.en
4x05
4xcn
4>.en
4».4>-
CO00
CO00
CO->i
co-«i
CO-~J
COCO
COCO
4xo
JX
o
JX
o
4O
4xO
cocn
co~j
CO->i
CO00
CO00
CO~J
co-g
CO-~i
CO-j
co~j
CO00
CO00
CO10
COCO
coCO
COCO
COCO
CO4x
CO4x
co4x
cocn
COen
COen
CO4x
toCO
ro~j
Mcn
too>
toO)
to-vl
CO
—k
CO10
COto
CO10
CO10
CO10
4>.CO
4x-1-
4 .ocoCO
CO~J
CO0)
COcn
COcn
CO4»-
COCO
COro
CO-j.
cnCO
cn--J
cncn
cncn
enCO
cn-L
cn-en
— Leno
4XCO
4x~g
4xcn
-g— *•
»-jo
cnCO
-go
cnCO
cn00
cncn
cncn
cncn
cncn
cn4x
cn—L
->l
^
•Vl
-*
~go
cnCO
jo
-j-*-xl
CO
~JCO
•vlCO
-JCO
•vl
CO
-g10
vlCO
•vl
-1
vj
-1
~gj.
~g10
•vl.
~g»k
~g-1
•vl
co
•-Jro
--jto
~vl— i.
-en
-g4X
-vl
co
-vl
CO
•vi4*>
•vlcn
-viCO
-Jto
-vl
CO
•vl
4*
vj
CO
~gCo
•vl
CO
•vl
CO
-vl
00
-v|
CO
•vl
00
-vl
-~l
•vl
cn
-vlJX
•vl
en
•vl
o>
•vl
•vl
-vl•vl
-vl
CO
-v!IO
-vl
CO
vjro
-vl
CO
-vl
cn
-vl
-vl
-vl
-v|
•vl
-vl
-vl-vl
00o•vj
CO
vjCO
-vl
to
•vl
-1
-vl
o
-vl
o
-vl
o-vl
— k
-siO
-v|
-k
-vl
ro
-v|
to
-vl
CO
o>00
O)CO
cn00
O)CO
cnCO
vgO
-vj
— L
•vl
O
-vl
-1
•vlro
•vlto
-v!CO
cnCO
cnCO
CO-vl
cn-v|
cn-v!
o-vl
cn00
cncn
cnen
en-vl
CO00
o>CO
COo
CO4x
00co
00
— L-vl
vj
-vl
cn
-vl
•vl
-vl
~J
•vl
cn
-vlcn
-vl4*
-vlCO
COCO
COcn
CO-v]
rooCO
toocnrooCO
too00
rooCO
oo
COCO
CO00
CO4x
cncn
Olro
cn4x
o>-g
O)CO
o>co
-vl
00
vg-vl
-vl
00
00
-*
COen
00CO
4xO
4x-••
4X0
4xro4xcn
4>--vl
cn-1
cn4X
cn-v!
cno
O)CO
cncn
_JL-g
roo
ro00
roen
ro00
coo
ro00
COo
COCO
COen
COcn
CO-vl
o4x
O4t
Ocn
ocn
o-vl
o00
oCO
oCO_L
_l
-J.
CO_L
cn
_icn
o-1
oo
COCO
oo
o— L
o-1
o-••
o-1
o-1
oro
oCO
oCO
oo
COCO
COCO
COCO
COCO
COCD
oo
oro
oto
0-1-
oro
o—I
COCO
CO00
CO00
COCO
CO-vl
COCO
COCO
CDCD
oo
oo
o-••
oo
IIi
II•I
00 «QME4'8?II CM
8
(DO
st
sI
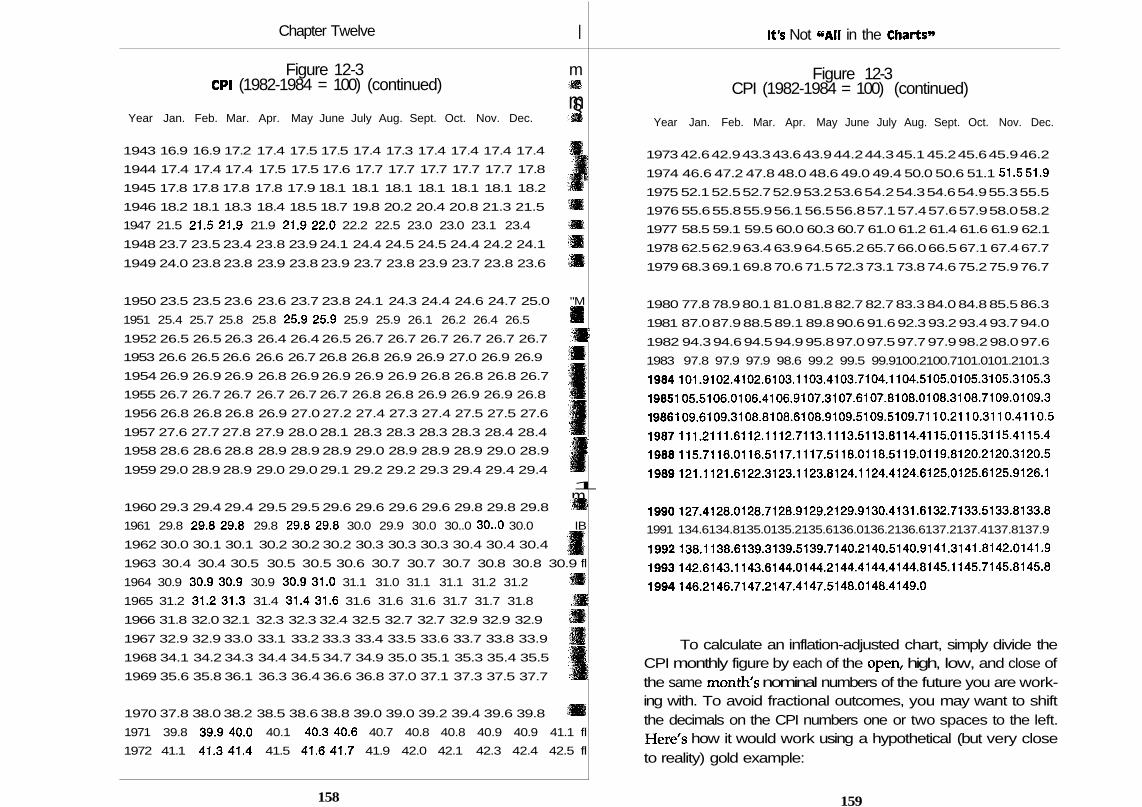
Chapter Twelve |
Figure 12-3 mCPI (1982-1984 = 100) (continued) m
m§Year Jan. Feb. Mar. Apr. May June July Aug. Sept. Oct. Nov. Dec. •••
1943 16.9 16.9 17.2 17.4 17.5 17.5 17.4 17.3 17.4 17.4 17.4 17.4 •
1944 17.4 17.4 17.4 17.5 17.5 17.6 17.7 17.7 17.7 17.7 17.7 17.8 |j
1945 17.8 17.8 17.8 17.8 17.9 18.1 18.1 18.1 18.1 18.1 18.1 18.2 9
1946 18.2 18.1 18.3 18.4 18.5 18.7 19.8 20.2 20.4 20.8 21.3 21.5 •
1947 21.5 21.521.9 21.9 21.922.0 22.2 22.5 23.0 23.0 23.1 23.4 «
1948 23.7 23.5 23.4 23.8 23.9 24.1 24.4 24.5 24.5 24.4 24.2 24.1 •
1949 24.0 23.8 23.8 23.9 23.8 23.9 23.7 23.8 23.9 23.7 23.8 23.6 •
1950 23.5 23.5 23.6 23.6 23.7 23.8 24.1 24.3 24.4 24.6 24.7 25.0 "M
1951 25.4 25.7 25.8 25.8 25.925.9 25.9 25.9 26.1 26.2 26.4 26.5 B
1952 26.5 26.5 26.3 26.4 26.4 26.5 26.7 26.7 26.7 26.7 26.7 26.7 .•
1953 26.6 26.5 26.6 26.6 26.7 26.8 26.8 26.9 26.9 27.0 26.9 26.9 •
1954 26.9 26.9 26.9 26.8 26.9 26.9 26.9 26.9 26.8 26.8 26.8 26.7 JR
1955 26.7 26.7 26.7 26.7 26.7 26.7 26.8 26.8 26.9 26.9 26.9 26.8 •
1956 26.8 26.8 26.8 26.9 27.0 27.2 27.4 27.3 27.4 27.5 27.5 27.6 'JB
1957 27.6 27.7 27.8 27.9 28.0 28.1 28.3 28.3 28.3 28.3 28.4 28.4 B
1958 28.6 28.6 28.8 28.9 28.9 28.9 29.0 28.9 28.9 28.9 29.0 28.9 IB•-fjBK>
1959 29.0 28.9 28.9 29.0 29.0 29.1 29.2 29.2 29.3 29.4 29.4 29.4 •1m
1960 29.3 29.4 29.4 29.5 29.5 29.6 29.6 29.6 29.6 29.8 29.8 29.8 '•
1961 29.8 29.829.8 29.8 29.829.8 30.0 29.9 30.0 30..0 30..0 30.0 IB
1962 30.0 30.1 30.1 30.2 30.2 30.2 30.3 30.3 30.3 30.4 30.4 30.4 jlj
1963 30.4 30.4 30.5 30.5 30.5 30.6 30.7 30.7 30.7 30.8 30.8 30.9 fl
1964 30.9 30.930.9 30.9 30.931.0 31.1 31.0 31.1 31.1 31.2 31.2 •
1965 31.2 31.231.3 31.4 31.431.6 31.6 31.6 31.6 31.7 31.7 31.8 ;•
1966 31.8 32.0 32.1 32.3 32.3 32.4 32.5 32.7 32.7 32.9 32.9 32.9 •
1967 32.9 32.9 33.0 33.1 33.2 33.3 33.4 33.5 33.6 33.7 33.8 33.9 JH
1968 34.1 34.2 34.3 34.4 34.5 34.7 34.9 35.0 35.1 35.3 35.4 35.5 'jB
1969 35.6 35.8 36.1 36.3 36.4 36.6 36.8 37.0 37.1 37.3 37.5 37.7 IB
1970 37.8 38.0 38.2 38.5 38.6 38.8 39.0 39.0 39.2 39.4 39.6 39.8 •
1971 39.8 39.940.0 40.1 40.340.6 40.7 40.8 40.8 40.9 40.9 41.1 fl
1972 41.1 41.341.4 41.5 41.641.7 41.9 42.0 42.1 42.3 42.4 42.5 fl
It's Not "All in the Charts'*
Figure 12-3CPI (1982-1984 = 100) (continued)
Year Jan. Feb. Mar. Apr. May June July Aug. Sept. Oct. Nov. Dec.
1973 42.6 42.9 43.3 43.6 43.9 44.2 44.3 45.1 45.2 45.6 45.9 46.2
1974 46.6 47.2 47.8 48.0 48.6 49.0 49.4 50.0 50.6 51.1 51.5 51.9
1975 52.1 52.5 52.7 52.9 53.2 53.6 54.2 54.3 54.6 54.9 55.3 55.5
1976 55.6 55.8 55.9 56.1 56.5 56.8 57.1 57.4 57.6 57.9 58.0 58.2
1977 58.5 59.1 59.5 60.0 60.3 60.7 61.0 61.2 61.4 61.6 61.9 62.1
1978 62.5 62.9 63.4 63.9 64.5 65.2 65.7 66.0 66.5 67.1 67.4 67.7
1979 68.3 69.1 69.8 70.6 71.5 72.3 73.1 73.8 74.6 75.2 75.9 76.7
1980 77.8 78.9 80.1 81.0 81.8 82.7 82.7 83.3 84.0 84.8 85.5 86.3
1981 87.0 87.9 88.5 89.1 89.8 90.6 91.6 92.3 93.2 93.4 93.7 94.0
1982 94.3 94.6 94.5 94.9 95.8 97.0 97.5 97.7 97.9 98.2 98.0 97.6
1983 97.8 97.9 97.9 98.6 99.2 99.5 99.9100.2100.7101.0101.2101.3
1984101.9102.4102.6103.1103.4103.7104.1104.5105.0105.3105.3105.3
1 985 1 05.51 06.01 06.41 06.91 07.31 07.61 07.81 08.01 08.31 08.71 09.01 09.3
1 986 1 09.61 09.31 08.81 08.61 08.9109.51 09.51 09.71 1 0.21 1 0.31 1 0.41 1 0.5
1987111.2111.6112.1112.7113.1113.5113.8114.4115.0115.3115.4115.4
1988115.7116.0116.5117.1117.5118.0118.5119.0119.8120.2120.3120.5
1989121.1121.6122.3123.1123.8124.1124.4124.6125.0125.6125.9126.1
1990127.4128.0128.7128.9129.2129.9130.4131.6132.7133.5133.8133.8
1991 134.6134.8135.0135.2135.6136.0136.2136.6137.2137.4137.8137.9
1992138.1138.6139.3139.5139.7140.2140.5140.9141.3141.8142.0141.9
1993142.6143.1143.6144.0144.2144.4144.4144.8145.1145.7145.8145.8
1994146.2146.7147.2147.4147.5148.0148.4149.0
To calculate an inflation-adjusted chart, simply divide theCPI monthly figure by each of the open, high, low, and close ofthe same month's nominal numbers of the future you are work-ing with. To avoid fractional outcomes, you may want to shiftthe decimals on the CPI numbers one or two spaces to the left.Here's how it would work using a hypothetical (but very closeto reality) gold example:
158 159
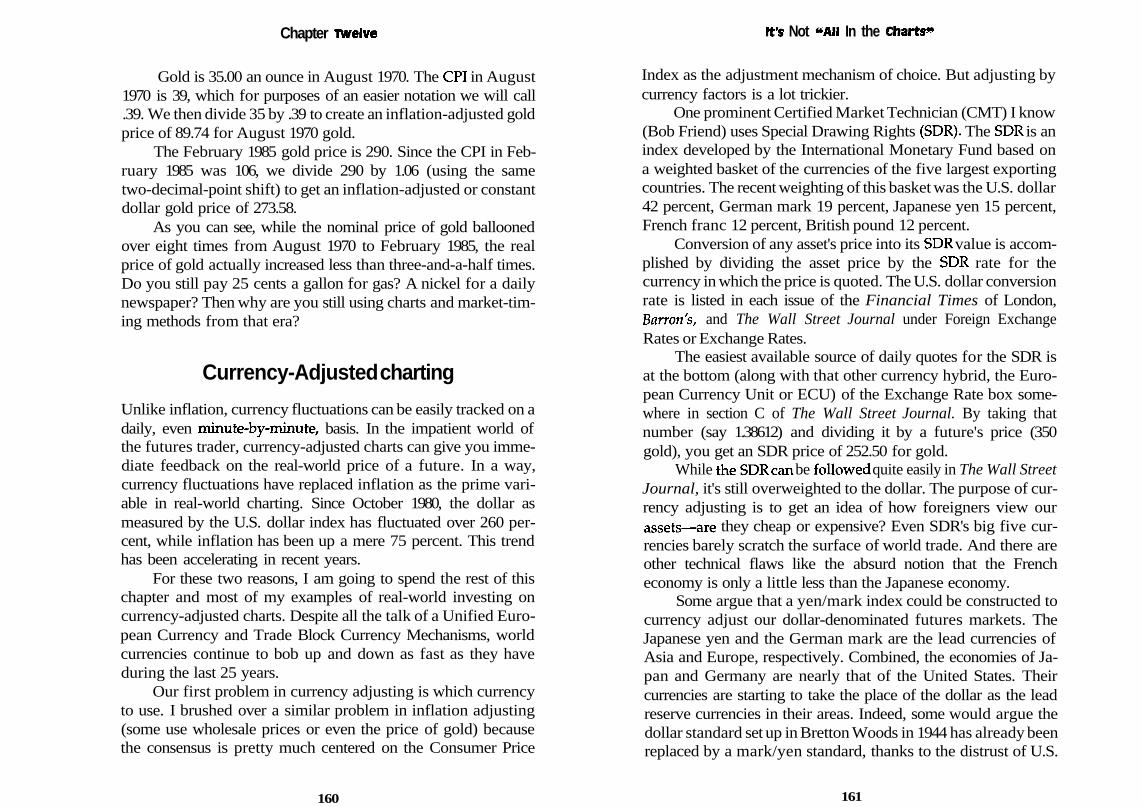
Chapter Twelve
Gold is 35.00 an ounce in August 1970. The CPI in August1970 is 39, which for purposes of an easier notation we will call.39. We then divide 35 by .39 to create an inflation-adjusted goldprice of 89.74 for August 1970 gold.
The February 1985 gold price is 290. Since the CPI in Feb-ruary 1985 was 106, we divide 290 by 1.06 (using the sametwo-decimal-point shift) to get an inflation-adjusted or constantdollar gold price of 273.58.
As you can see, while the nominal price of gold balloonedover eight times from August 1970 to February 1985, the realprice of gold actually increased less than three-and-a-half times.Do you still pay 25 cents a gallon for gas? A nickel for a dailynewspaper? Then why are you still using charts and market-tim-ing methods from that era?
Currency-Adjusted charting
Unlike inflation, currency fluctuations can be easily tracked on adaily, even minute-by-minute, basis. In the impatient world ofthe futures trader, currency-adjusted charts can give you imme-diate feedback on the real-world price of a future. In a way,currency fluctuations have replaced inflation as the prime vari-able in real-world charting. Since October 1980, the dollar asmeasured by the U.S. dollar index has fluctuated over 260 per-cent, while inflation has been up a mere 75 percent. This trendhas been accelerating in recent years.
For these two reasons, I am going to spend the rest of thischapter and most of my examples of real-world investing oncurrency-adjusted charts. Despite all the talk of a Unified Euro-pean Currency and Trade Block Currency Mechanisms, worldcurrencies continue to bob up and down as fast as they haveduring the last 25 years.
Our first problem in currency adjusting is which currencyto use. I brushed over a similar problem in inflation adjusting(some use wholesale prices or even the price of gold) becausethe consensus is pretty much centered on the Consumer Price
160
It's Not "All In the Charts**
Index as the adjustment mechanism of choice. But adjusting bycurrency factors is a lot trickier.
One prominent Certified Market Technician (CMT) I know(Bob Friend) uses Special Drawing Rights (SDK). The SDK is anindex developed by the International Monetary Fund based ona weighted basket of the currencies of the five largest exportingcountries. The recent weighting of this basket was the U.S. dollar42 percent, German mark 19 percent, Japanese yen 15 percent,French franc 12 percent, British pound 12 percent.
Conversion of any asset's price into its SDK value is accom-plished by dividing the asset price by the SDK rate for thecurrency in which the price is quoted. The U.S. dollar conversionrate is listed in each issue of the Financial Times of London,Barren's, and The Wall Street Journal under Foreign ExchangeRates or Exchange Rates.
The easiest available source of daily quotes for the SDR isat the bottom (along with that other currency hybrid, the Euro-pean Currency Unit or ECU) of the Exchange Rate box some-where in section C of The Wall Street Journal. By taking thatnumber (say 1.38612) and dividing it by a future's price (350gold), you get an SDR price of 252.50 for gold.
While the SDR can be followed quite easily in The Wall StreetJournal, it's still overweighted to the dollar. The purpose of cur-rency adjusting is to get an idea of how foreigners view ourassets—are they cheap or expensive? Even SDR's big five cur-rencies barely scratch the surface of world trade. And there areother technical flaws like the absurd notion that the Frencheconomy is only a little less than the Japanese economy.
Some argue that a yen/mark index could be constructed tocurrency adjust our dollar-denominated futures markets. TheJapanese yen and the German mark are the lead currencies ofAsia and Europe, respectively. Combined, the economies of Ja-pan and Germany are nearly that of the United States. Theircurrencies are starting to take the place of the dollar as the leadreserve currencies in their areas. Indeed, some would argue thedollar standard set up in Bretton Woods in 1944 has already beenreplaced by a mark/yen standard, thanks to the distrust of U.S.
161
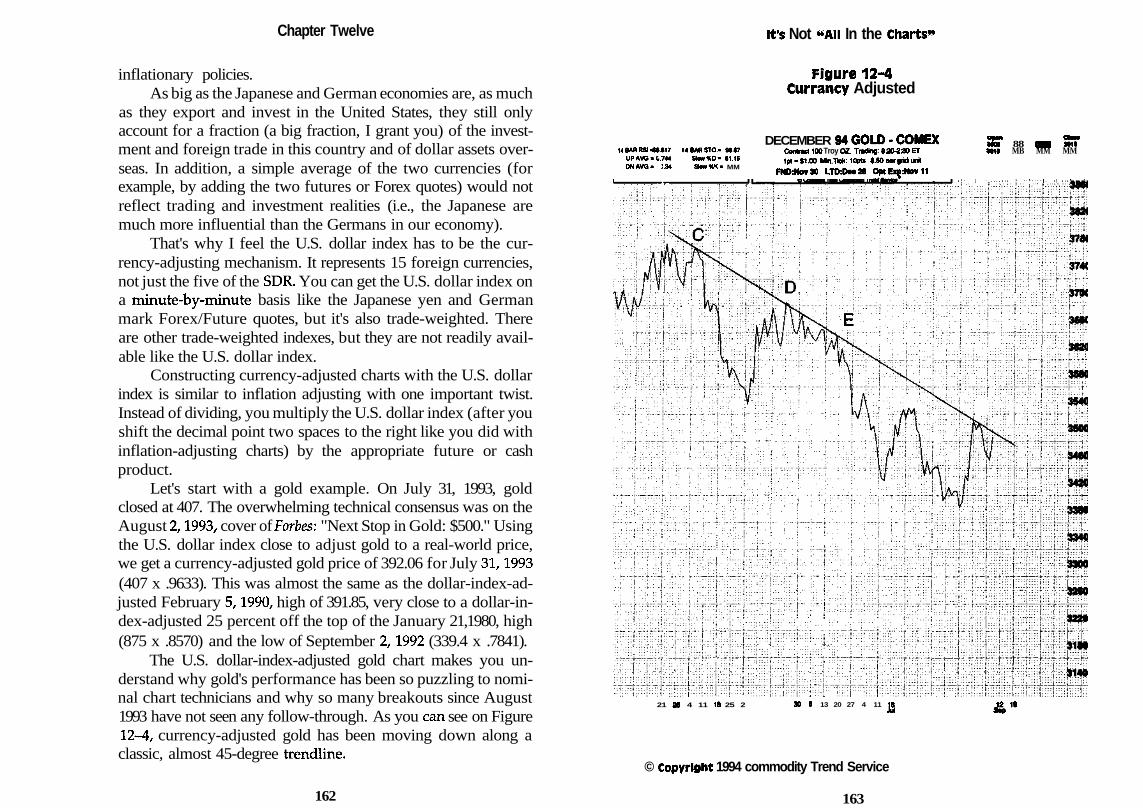
Chapter Twelve
inflationary policies.As big as the Japanese and German economies are, as much
as they export and invest in the United States, they still onlyaccount for a fraction (a big fraction, I grant you) of the invest-ment and foreign trade in this country and of dollar assets over-seas. In addition, a simple average of the two currencies (forexample, by adding the two futures or Forex quotes) would notreflect trading and investment realities (i.e., the Japanese aremuch more influential than the Germans in our economy).
That's why I feel the U.S. dollar index has to be the cur-rency-adjusting mechanism. It represents 15 foreign currencies,not just the five of the SDK. You can get the U.S. dollar index ona minute-by-minute basis like the Japanese yen and Germanmark Forex/Future quotes, but it's also trade-weighted. Thereare other trade-weighted indexes, but they are not readily avail-able like the U.S. dollar index.
Constructing currency-adjusted charts with the U.S. dollarindex is similar to inflation adjusting with one important twist.Instead of dividing, you multiply the U.S. dollar index (after youshift the decimal point two spaces to the right like you did withinflation-adjusting charts) by the appropriate future or cashproduct.
Let's start with a gold example. On July 31, 1993, goldclosed at 407. The overwhelming technical consensus was on theAugust 2,1993, cover of Forbes: "Next Stop in Gold: $500." Usingthe U.S. dollar index close to adjust gold to a real-world price,we get a currency-adjusted gold price of 392.06 for July 31,1993(407 x .9633). This was almost the same as the dollar-index-ad-justed February 5,1990, high of 391.85, very close to a dollar-in-dex-adjusted 25 percent off the top of the January 21,1980, high(875 x .8570) and the low of September 2,1992 (339.4 x .7841).
The U.S. dollar-index-adjusted gold chart makes you un-derstand why gold's performance has been so puzzling to nomi-nal chart technicians and why so many breakouts since August1993 have not seen any follow-through. As you can see on Figure12-4, currency-adjusted gold has been moving down along aclassic, almost 45-degree trendline.
It's Not "All In the Charts"
Figure 12-4Currency Adjusted
U BAR RSI 4M17 14 BAR STO.- M.(7
UPAVQ't.744 Sto*»O- «11SDNAVQ- 1M SooWt- MM
DECEMBER 94 GOLD - COMEXContract 100 Troy OZ. Trading: 820-2:30 ET1p<-$100 Mn.Tfc*: 10pn> t.50 OK grid unit
FNDdtovM LTDAceM OptExfttovU
*B? 88 BB SETMM MB MM MM
21 » 4 11 18 25 2 30 6 13 20 27 4 11 JS 4"
© Copyright 1994 commodity Trend Service
162 163

Chapter twelve
At points A and B on Figures 12-4 and 12-5 both the nomi-nal and currency-adjusted December gold chart followed thesame path. But at point C, where the nominal price of Decembergold broke out, the currency-adjusted chart showed the trendlinestill intact. The same phenomena happened at points D and E.
Figure 12-6 shows a longer-term perspective on the weeklycurrency-adjusted gold chart. This chart was much more bearishthan the nominal weekly gold chart (Figure 12-7). A classicstrong right double-top was already in place when a nearlytwo-year trendline was broken on the currency-adjusted goldchart in late June of 1994.
No wonder the nominal price of gold followed the cur-rency-adjusted chart technical breakdown by moving lower bynearly $20! The dollar is only a fraction of the total world cur-rency situation. To the rest of the world, gold was looking lousyeven though it looked like the long over due breakout here inthe United States.
Crude's recent bottom and subsequent strength has beenalmost totally unexpected by techies (and the media, accordingto the February 28, 1994, Forbes cover). On December 17, 1993,front-month crude closed at 13.91, giving crude a currency-ad-justed price of 13.31 (13.91 x .9567). On February 16, the cur-rency-adjusted crude close was 13.26 (13.93 x .9516), and onMarch 10, it was 13.25 (14.14 x .9371). Any good technicianwould have recognized a classic strong right/lower close rightdouble-bottom on the currency-adjusted crude chart. Wedded tonominal charts, most techies missed it.
Unfortunately, Figure 12-8, the currency-adjusted weeklycrude chart, was plotted with weekly closes only, so the lowerdouble-bottom of late winter in crude oil doesn't show up quiteas well as it would on a daily, closest-to-cash, currency-adjustedcrude chart. But this longer-term perspective does show clearlythat the recent run-up in crude prices was not the breakout ofthe nominal charts (Figure 12-9, "breakout"). On the currency-adjusted Figure 12-8, there is strong overhead resistance, a majortrendline that was never broken, and a 60 percent retracement
sI01
i
ou
£IQ.Ou
164
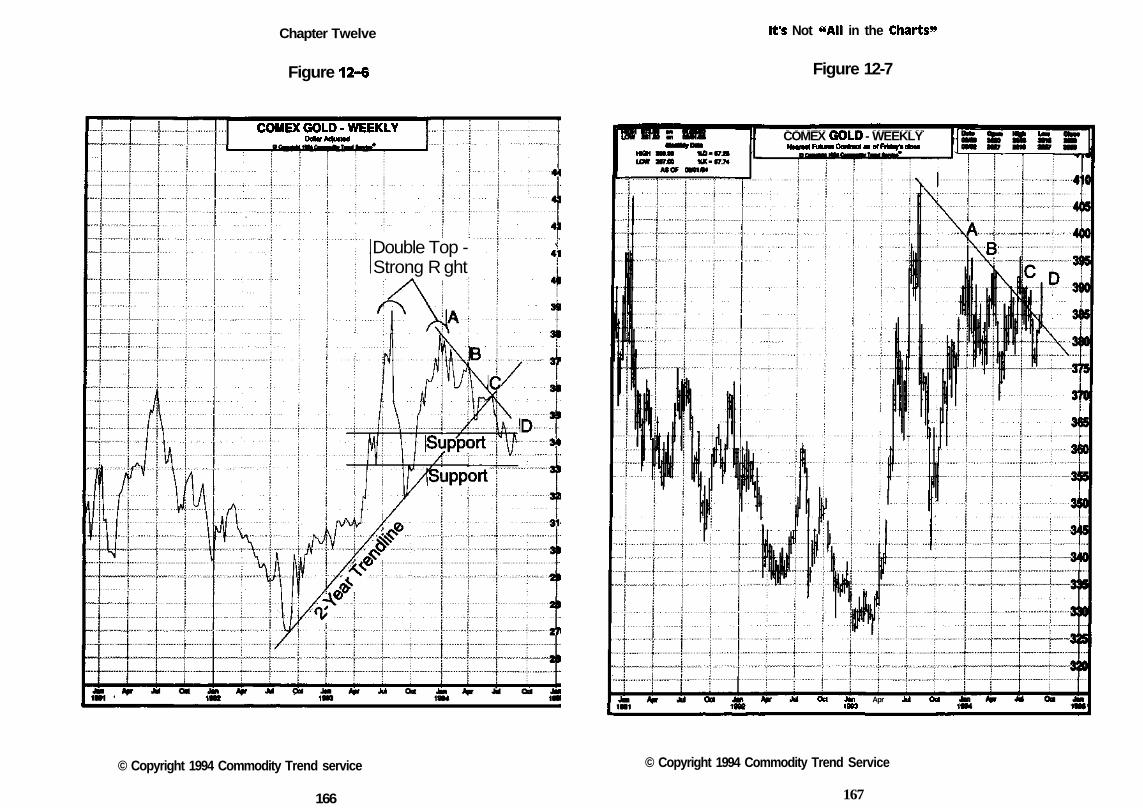
Chapter Twelve It's Not "All in the Charts99
Figure 12-6
COMEX GOLD -WEEKLYDofcrAdfuttod
Double Top -Strong R ght
Figure 12-7
COMEX GOLD - WEEKLYNMTMI RHurat GonMd M of FrU** etow
Oct Jm Apr Jul Ool1903
© Copyright 1994 Commodity Trend service © Copyright 1994 Commodity Trend Service
166 167
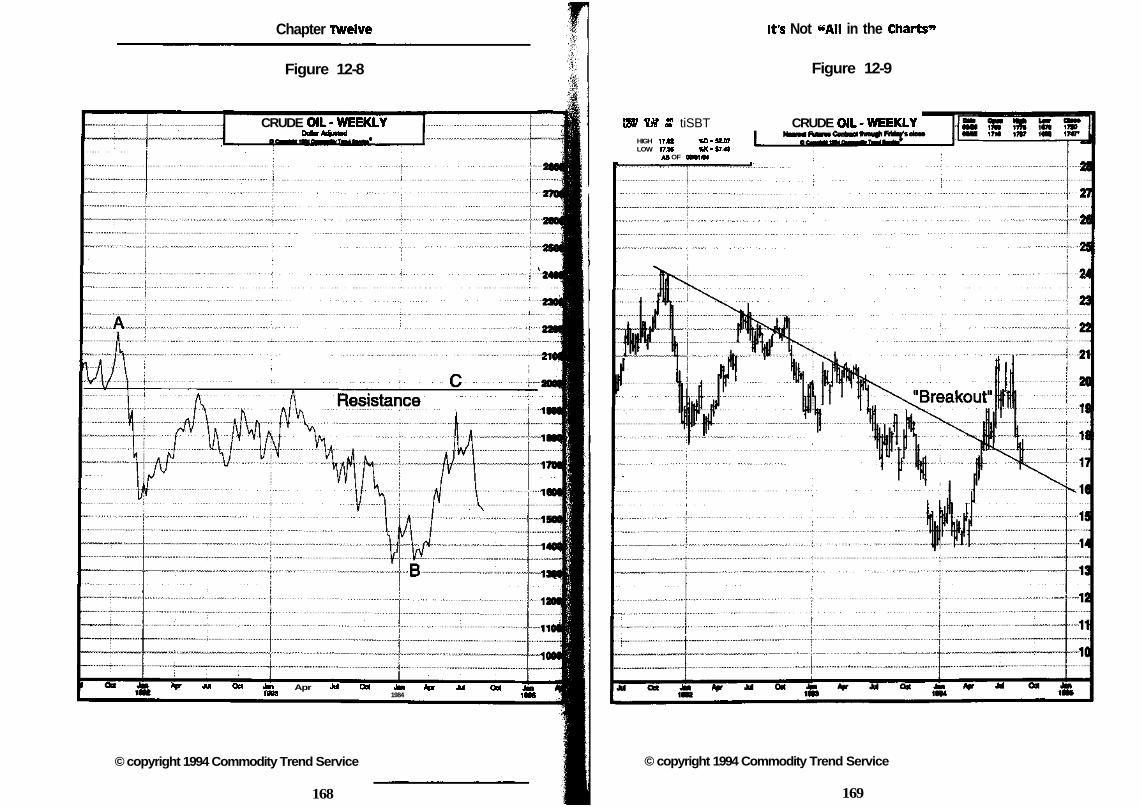
Chapter twelve
Figure 12-8
CRUDE OIL-WEEKLYDdvAd tod
^ •« «t i Apr Jd Od J«n Apr Jul Ort ST1W3 1984 19BB
It's Not -All in the Charts9'
© copyright 1994 Commodity Trend Service
168
Figure 12-9
\SK Y£ £ tiSBTHIGH 17J2 %D-52.07LOW 17.36 %K-57.43
AS OF «01/94
CRUDE OIL-WEEKLY
© copyright 1994 Commodity Trend Service
169
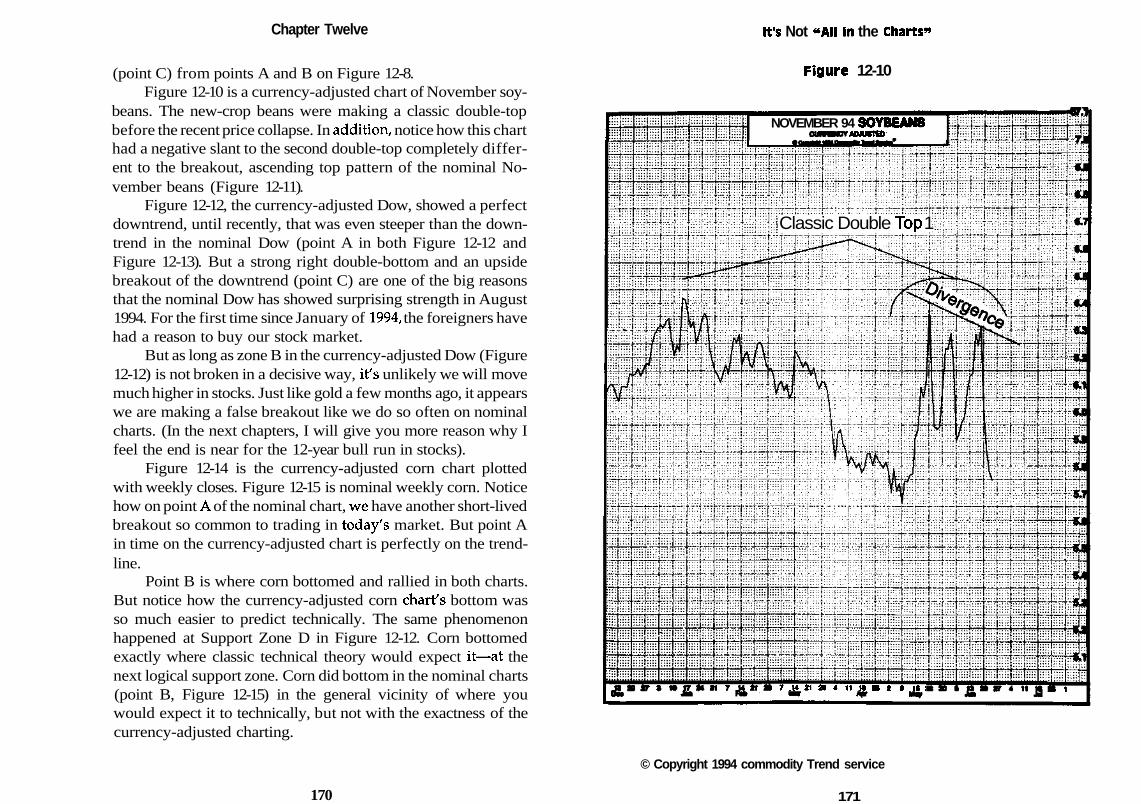
Chapter Twelve
(point C) from points A and B on Figure 12-8.Figure 12-10 is a currency-adjusted chart of November soy-
beans. The new-crop beans were making a classic double-topbefore the recent price collapse. In addition, notice how this charthad a negative slant to the second double-top completely differ-ent to the breakout, ascending top pattern of the nominal No-vember beans (Figure 12-11).
Figure 12-12, the currency-adjusted Dow, showed a perfectdowntrend, until recently, that was even steeper than the down-trend in the nominal Dow (point A in both Figure 12-12 andFigure 12-13). But a strong right double-bottom and an upsidebreakout of the downtrend (point C) are one of the big reasonsthat the nominal Dow has showed surprising strength in August1994. For the first time since January of 1994, the foreigners havehad a reason to buy our stock market.
But as long as zone B in the currency-adjusted Dow (Figure12-12) is not broken in a decisive way, it's unlikely we will movemuch higher in stocks. Just like gold a few months ago, it appearswe are making a false breakout like we do so often on nominalcharts. (In the next chapters, I will give you more reason why Ifeel the end is near for the 12-year bull run in stocks).
Figure 12-14 is the currency-adjusted corn chart plottedwith weekly closes. Figure 12-15 is nominal weekly corn. Noticehow on point A of the nominal chart, we have another short-livedbreakout so common to trading in today's market. But point Ain time on the currency-adjusted chart is perfectly on the trend-line.
Point B is where corn bottomed and rallied in both charts.But notice how the currency-adjusted corn chart's bottom wasso much easier to predict technically. The same phenomenonhappened at Support Zone D in Figure 12-12. Corn bottomedexactly where classic technical theory would expect it—at thenext logical support zone. Corn did bottom in the nominal charts(point B, Figure 12-15) in the general vicinity of where youwould expect it to technically, but not with the exactness of thecurrency-adjusted charting.
It's Not "All in the Charts"
Figure 12-10
NOVEMBER 94 SOYBEANSAOJU8TED
Classic Double Top 1
7 t 4 2 1 2 8 4 1 1 i a a S 2 9 It !
© Copyright 1994 commodity Trend service
170 171
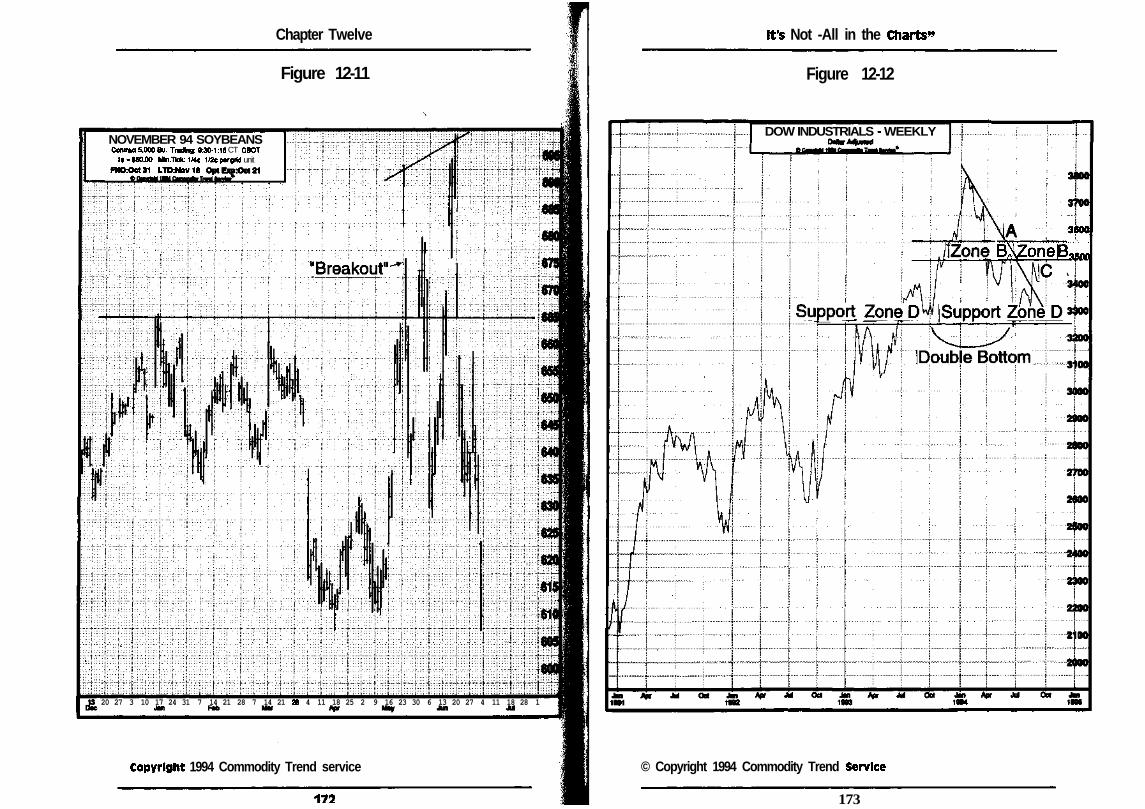
It's Not -All in the Charts'*Chapter Twelve
Figure 12-11 Figure 12-12
DOW INDUSTRIALS - WEEKLYNOVEMBER 94 SOYBEANSConm* 5,000 Bu. Tmdng: 8:30-1:15 CT CBOT
U-ISO.OO Min.lMclMt 1/2t|w grid unitFNOOctSI LTDttovl*
3800
BlZonelBXn
20 27 3 10 17 24 31 7 14 21 28 7 14 21 26 4 11 18 25 2 9 16 23 30 6 13 20 27 4 11 18 28 1
© Copyright 1994 Commodity Trend ServiceCopyright 1994 Commodity Trend service
173
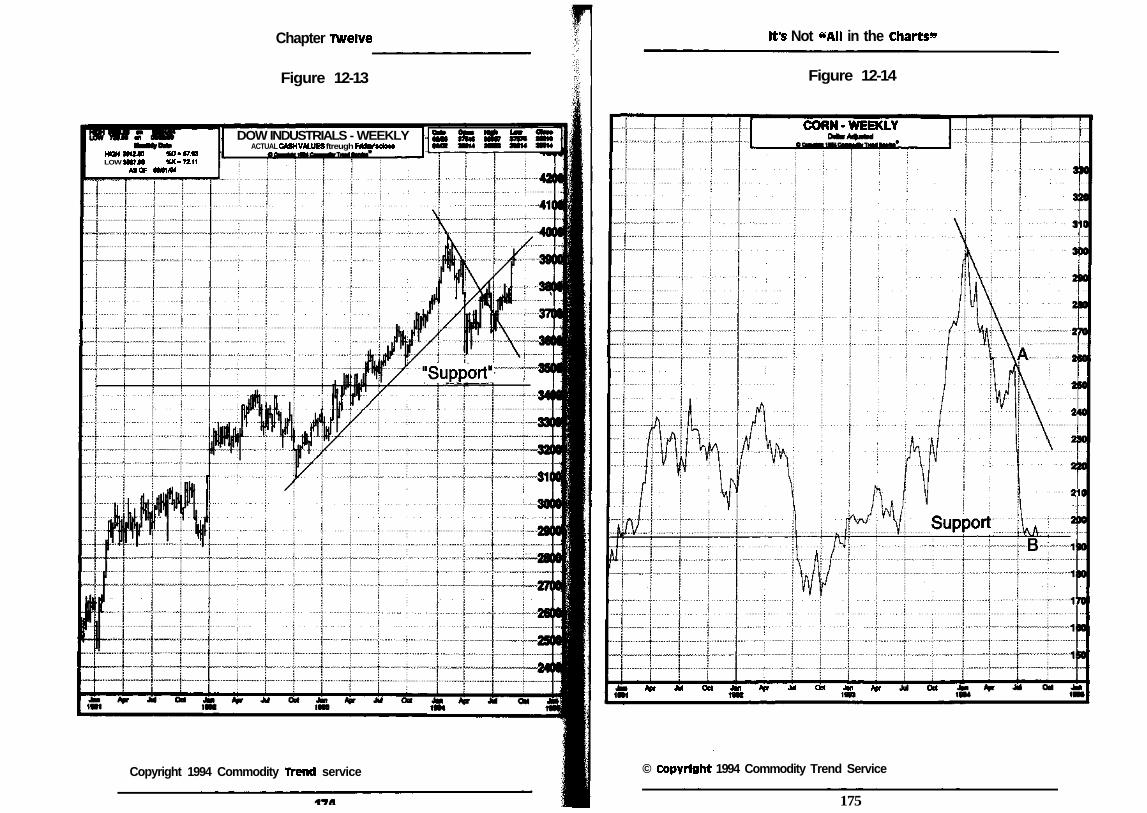
It's Not "All in the Charts"Chapter Twelve
Figure 12-14Figure 12-13
CORN-WEEKLYDOW INDUSTRIALS - WEEKLY
ACTUAL CASH VALUES ftreugh Ri*rt do*HCH 3012JO %D««7.»LOW a«7JO %K-72.11
A80F WQ1/M
A B r J u l O c l J t o A p r J u l O c t . t a n A p r
© Copyright 1994 Commodity Trend ServiceCopyright 1994 Commodity Trend service
175
Chapter Thirteen
Analogous Year
The great futures trader Roy Longstreet used to talk about findingan analogous year—a previous time in the market when circum-stances were similar to those of the present. The idea is to use thecomparison to help shed light on what might happen in thefuture. Many traders see nothing beyond their five-minute barcharts. But commercial firms employ people to do nothing butresearch the past to find parallels with today's markets. If youlook hard enough, you can always find something in the pastthat seems to duplicate today's circumstances. Even the greatinflation of the last fifty years has happened before (when mas-sive imports of silver and gold from the New World inflatedEuropean economies in the sixteenth century).
Finding the Analogous Year
In the fall of 1993, I got a fax from my friend Jim Bianco. Ahousehold-name financial analyst was claiming that the stockmarket was repeating the early Kennedy years. And sure enough,there seemed to be a close relationship between stock marketaction following Kennedy's election and that following Clinton's
179
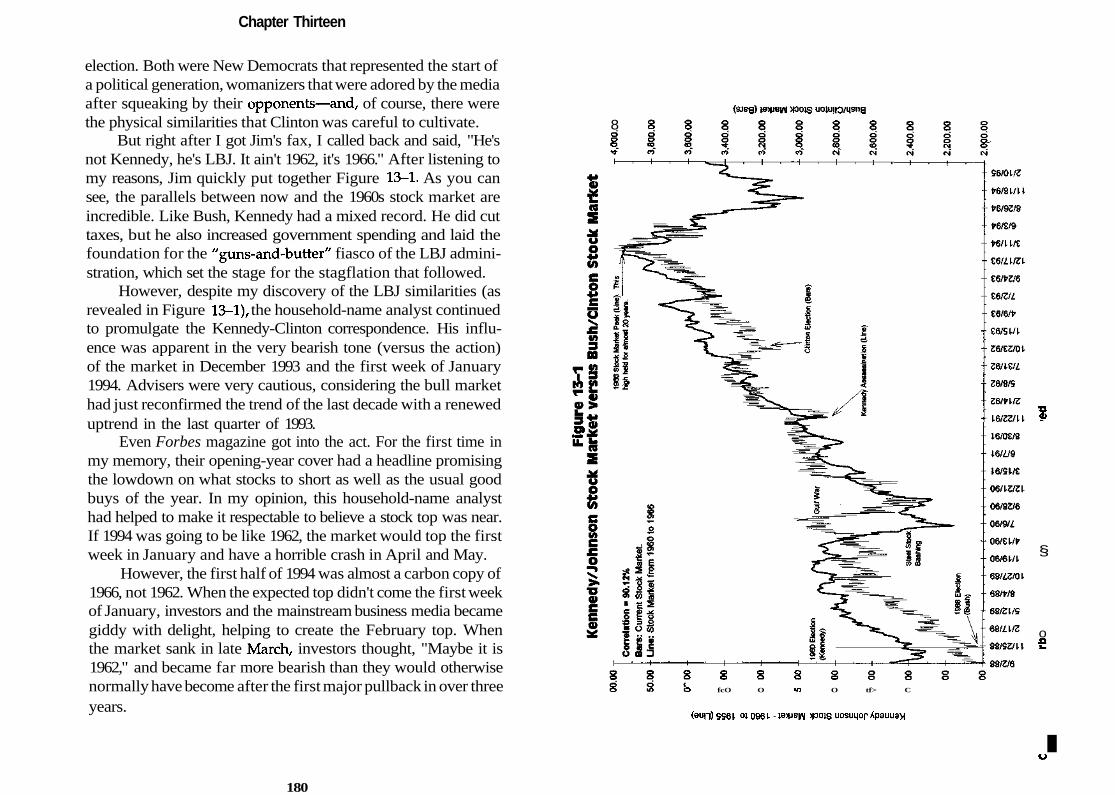
Chapter Thirteen
election. Both were New Democrats that represented the start ofa political generation, womanizers that were adored by the mediaafter squeaking by their opponents—and, of course, there werethe physical similarities that Clinton was careful to cultivate.
But right after I got Jim's fax, I called back and said, "He'snot Kennedy, he's LBJ. It ain't 1962, it's 1966." After listening tomy reasons, Jim quickly put together Figure 13-1. As you cansee, the parallels between now and the 1960s stock market areincredible. Like Bush, Kennedy had a mixed record. He did cuttaxes, but he also increased government spending and laid thefoundation for the "guns-and-butter" fiasco of the LBJ admini-stration, which set the stage for the stagflation that followed.
However, despite my discovery of the LBJ similarities (asrevealed in Figure 13-1), the household-name analyst continuedto promulgate the Kennedy-Clinton correspondence. His influ-ence was apparent in the very bearish tone (versus the action)of the market in December 1993 and the first week of January1994. Advisers were very cautious, considering the bull markethad just reconfirmed the trend of the last decade with a reneweduptrend in the last quarter of 1993.
Even Forbes magazine got into the act. For the first time inmy memory, their opening-year cover had a headline promisingthe lowdown on what stocks to short as well as the usual goodbuys of the year. In my opinion, this household-name analysthad helped to make it respectable to believe a stock top was near.If 1994 was going to be like 1962, the market would top the firstweek in January and have a horrible crash in April and May.
However, the first half of 1994 was almost a carbon copy of1966, not 1962. When the expected top didn't come the first weekof January, investors and the mainstream business media becamegiddy with delight, helping to create the February top. Whenthe market sank in late March, investors thought, "Maybe it is1962," and became far more bearish than they would otherwisenormally have become after the first major pullback in over threeyears.
8
3 fcO O IO O tf> C
(aun) SS61 <n 0961 - ja iem >|oojs uosuqop Apauuax
•DS>
§
oe
Iu
180
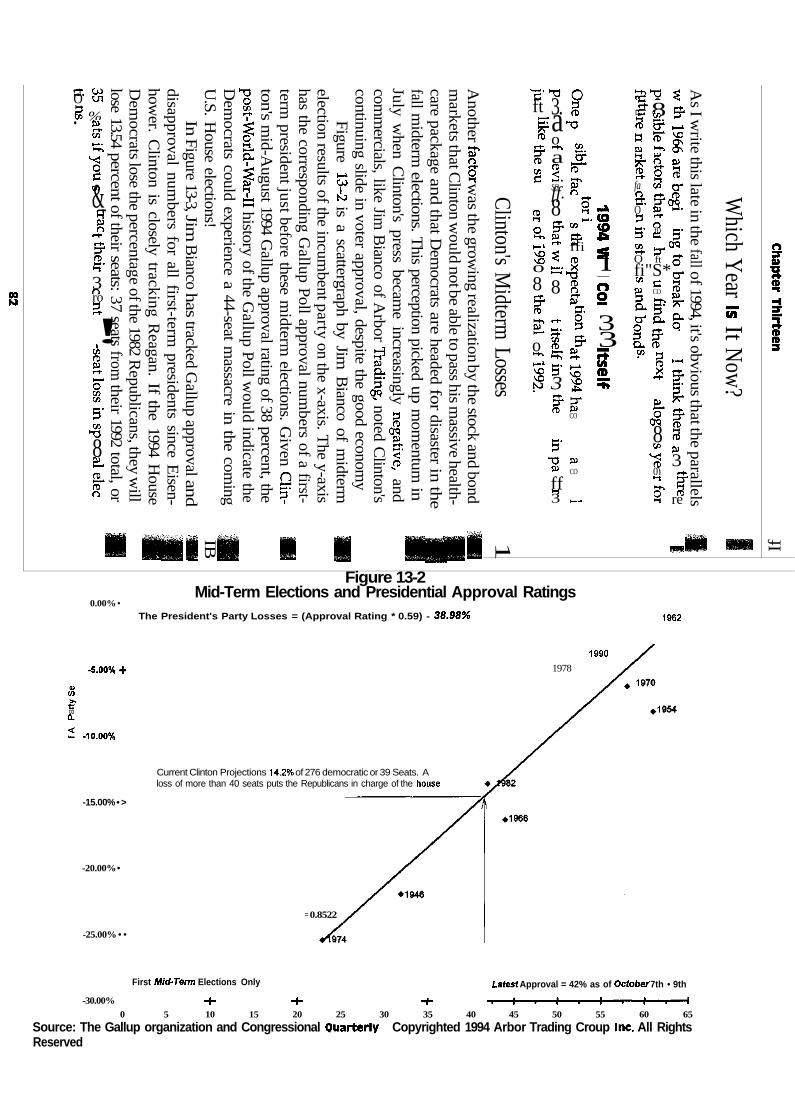
S
nr. wO tn§ %• w
5TH-"fl->
eCfl&1r+
t1-13nro2-
!£&)i-t-o*enen
3'
•S
8B-£•fTn
fall midterm
elections. This perception picked up
mom
entum in
|H
|July w
hen Clinton's press becam
e increasingly negative, andcom
mercials, like Jim
Bianco of A
rbor Trading, noted C
linton'scontinuing slide in voter approval, despite the good econom
yFigure 13-2
is a scattergraph by Jim B
ianco of midterm
1B
|election results of the incum
bent party on the x-axis. The y-axis
has the corresponding Gallup Poll approval num
bers of a first-term
president just before these midterm
elections. Given C
lin- JH
ton's mid-A
ugust 1994 Gallup approval rating of 38 percent, the
post-Wbrld-W
ar-II history of the Gallup Poll w
ould indicate theD
emocrats could experience a 44-seat m
assacre in the com
ing |H
|U
.S. House elections!
IBIn
Figure 13-3, Jim B
ianco has tracked G
allup approval and
••
disapproval numbers for all first-term
presidents since Eisen-
|Hj
hower. C
linton is closely tracking Reagan. If the 1994 H
ouse |B
|D
emocrats lose the percentage of the 1982 R
epublicans, they will
lose 13.54 percent of their seats: 37 seats from their 1992 total, or
j|pj
Another factor w
as the growing realization by the stock and bond
IBi
markets that C
linton would not be able to pass his m
assive health- |H
icare package an
d that D
emocrats are headed fo
r disaster in th
e |J|
Clinton's M
idterm Losses
1
"£'ft
1
?sfD»-i
S,h- '
8o8?£oI-K
h- '
S
t°
*o3.ao>-t->a3.SOff.8?S>«-h
3H— *i—*
8
«-hh^»r-h
£i-*>5'3?
5'»ff1-!3
?T3
1ST
g1
! 3tn (O
S1 *ffi £3 iT3 —a s&) S
1 31 3^ 7^ %vo CDS =Bg"CO
suCO
t— -
£r>i31 85 <»s gQ (D0) *™K
^ f ta ?fa en
a*O SBs -ri— °r*j fl)3 C
S- irO ft
fi"S** JS&> CO
S-S4cr a
If"!
<-t-
&>i_«t
&8en
^0)i-l
£
?i— i
£OND>3
rf<B.
dl'aJ&>?rO-Q
h — 4
g:g.?3v>3
1reISiP
Which Y
ear is It Now
? 1
As I w
rite this late in the fall of 1994, it's obvious that the parallels U
If
uaaj
Jim
. Jd}
dei»
0.00% •
,.oo%.,0}eo£COa.
S -10.00%
-15.00% • >
-20.00% •
-25.00% • •
-30.00%
Figure 13-2Mid-Term Elections and Presidential Approval Ratings
The President's Party Losses = (Approval Rating * 0.59) - 38.38% 1962
1990
1978
Current Clinton Projections 14.2% of 276 democratic or 39 Seats. Aloss of more than 40 seats puts the Republicans in charge of the house
First Mid-Term Elections Only
•4- -H
= 0.8522
-I-
Latest Approval = 42% as of October 7th • 9th
-•——I——•——I——•——I——•——I——•——I0 5 10 15 20 25 30 35 40 45 50 55 60 65
Source: The Gallup organization and Congressional Quarterly Copyrighted 1994 Arbor Trading Croup inc. All RightsReserved
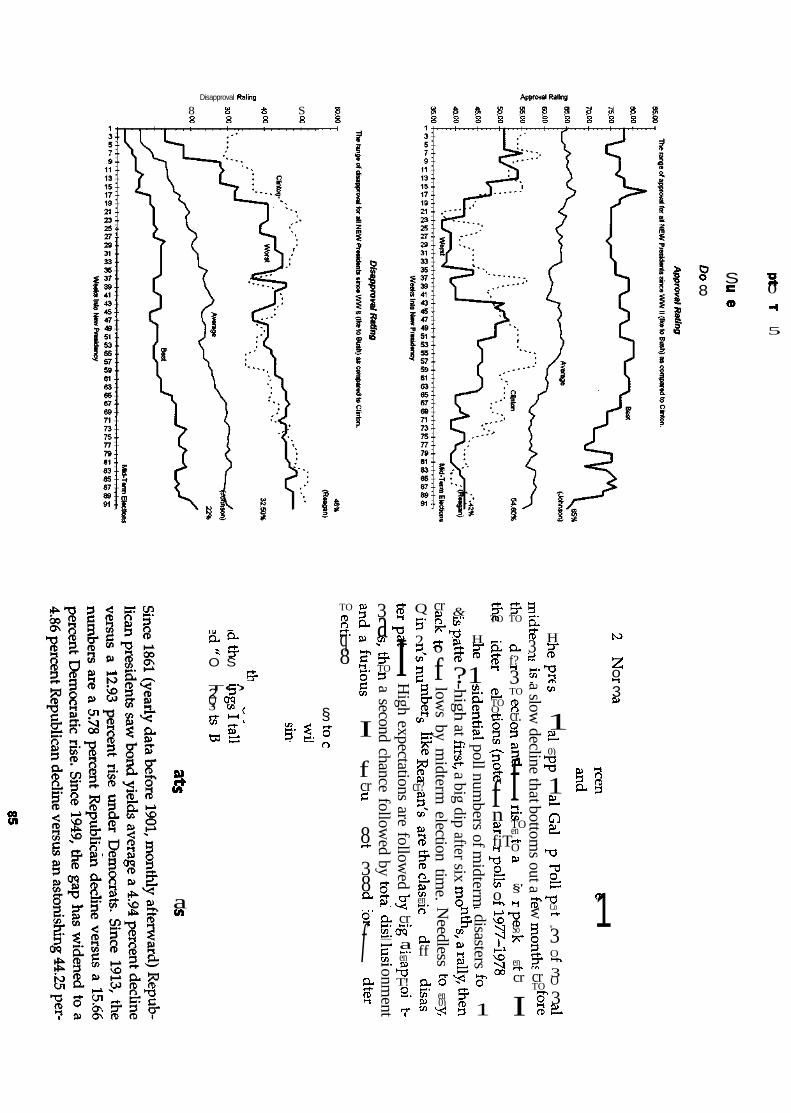
Disapproval Rating
8 S S S8 8 8 8 8 8 8 8 8 8 8 8 8 8
§ S8 =
os0H
5
COUl
»VI
'd &.s fj.
O S
TO 2 »'Q cw3 en (f-i- i—i« r*'
— 5"cfl cs 3-1§Sn
a(A
TO
8rr.q8
sB.»>?H
6'cen
I
fcrc
8«-h
38ao-1-1
fCLS"
3a•»°s-TO3a second chance follow
ed by tota!
&i— »•
B"2.onm
ent
£TT3S-IH
igh expectations are followed b
j
"•H
crI— '•OQaH- 1<enfu
T3T!O.
r-H1
Q5'23_en"
B1en
1
^0>cr?o3_en"a>S
fdgenFT
CLff
a£'fuen
crS£j»-o
flows by m
idterm election tim
e.N
eedless
S-en0)
^
&t— ••Cn
T3JJJ H
9??1-high
at first, a big dip after six mo
1>w
»)
^?13
isidential poll numbers of m
idtermL disasters
3*
1
?TO
olS"JLTOO<-+•
I3"ifnSfiTi-i^as*oi-h1— »v£>
?h- '\OVIoo
?TO
CLf?HI
3TO
8cr.Bos.f2.enTOen«-*•O»
§'HI
^SoK*
enrf
cr
I
goi?? H3 3"p (D
?'1a slow decline that bottom
s out a fe w m
onths
crTO1
en
1£i-0)
T3
1Ei.OOj^
T5
£.|_«4
^3Co!-*•
ff
3O>-n
3O
3Ph—
to
zoHJ
3v
» J3
8.8
fO1
Chapter Thirteen
cent rise under Democrat—graphic evidence that Democraticpoliticians have become more and more liberal, anti-business,and inflationary as this century has progressed.
Since 1913, the average low in yields under Republicanadministrations has been 22.5 months after they start. UnderDemocratic administrations, it has been 7.25 months. Almost allgains in bond yields under Democrats come in the second halfof their administrations. Bond yields rise even faster after bigmidterm Democratic losses (which I expect in 1994). After the1938 and 1946 elections, bond yields rose sharply despite strongyield downtrends before these elections. After the 1966 and 1978defeats, bond rates soared to record levels.
The history of Democratic administrations says the lowestbond yields of the Clinton administration will have been earlySeptember 1993, then an increase of 44 percent by June 1997, orto an 8.3 percent yield (if the recent 5.75 percent bottom holds).Republicans in trouble (like Bush or Ford) continue policies thatlower interest rates. Democrats in trouble (Truman, LBJ, Carter)spend more and pump up the money supply. It is quite normalfor bond yields to go down in the first year of a Democraticadministration. Average monthly yields went down 6.7 percentor more during the first year of Wilson, FDR, Truman, and JFK.Even LBJ's first year saw a slight downtick in bond yields. Buteventually the new Democratic policies overwhelm the anti-in-flation stance of previous Republican administrations.
Democrats increase Government's Share of CDPIn the 1980s, even Sweden cut the percentage of GDP accountedfor by government spending (from 65 percent to 60 percent). TheU.S. federal government's percentage of GDP went from 25.4percent in 1982 to 23 percent in 1989. This small but significantrollback in the share the government accounts for in the worldeconomy is a big reason for the great bond bull market of the1980s.
Big government suppresses economic growth, which in-creases strains on the debt market. Rising government expendi-
186
Analogous Year
tures and regulations are only noninflationary under wartimecontrols or depressions. There is a direct relationship betweenless government and low inflation. It's no accident that Japan,with the lowest percentage of GDP used by the government (32.8percent) of any major nation also has the lowest inflation rate.
The recent increase of the federal government's share in theU.S. economy from 23 percent to 25.4 percent of GDP has beenfunded because U.S. banks have shifted from their traditionallending activities to buying government securities. The slow-down in economic growth has resulted in fewer borrowers over-all; those who are trying to borrow tend to be of a lower creditquality. Since March 1989, banks have increased their holdingsof government securities by about $300 billion while reducingtheir business loans outstanding by around $15 billion. Thisprocess has already hurt government revenues and balloonedthe deficit. It can't continue much longer.
Democrats increase TaxesIncreasing taxes also has a long-term effect of increasing inflationand bond rates because higher taxes raise costs and justify biggergovernment spending. Tax increases (direct or bracket creep)under Theodore Roosevelt, Wilson, Hoover, Eisenhower, LBJ,Nixon, and Carter led to higher interest rates. Decreasing taxesafter the Civil War, under Coolidge, during the early years of FDR(the end of deflation increased the ability to pay taxes), underTruman (by cutting tariffs and war time taxes), and under Reaganled to lower interest rates.
It's worth noting the average monthly bond yields of Janu-ary 1960 (4.42 percent) were only exceeded in January 1966, sixyears later. The anti-inflationary effect of JFK's tax decreases waseventually overwhelmed by LBJ's guns-and-butter policy—justas the (relatively) small Bush tax increase did not prevent lowerinterest rates when the banking system was radically shiftedfrom lending to buying government securities. But as LBJ's poli-cies overwhelmed the policies of Eisenhower and Kennedy, Bushand Clinton are putting a one-two knockout punch to Reagan's
187
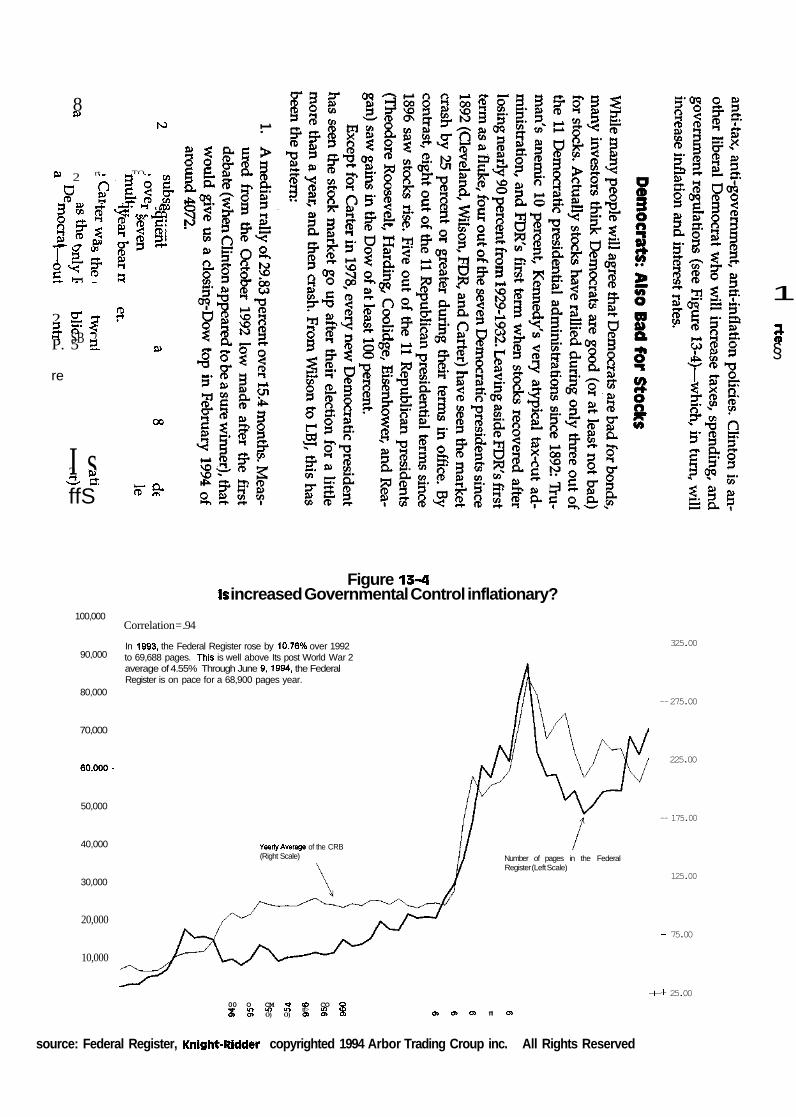
8aiNJ
» 2 rt B TO w
I ililHiis*T § 8 £^ ? g
^ « M I
re
I s2 a>~2x ftffS
(D2 2: 5 r-3. R- sH SB 2P. 5 3. su
oo
s* a-
1
Ȥ
Figure 13-4is increased Governmental Control inflationary?
100,000
90,000
80,000
70,000
60,000-
50,000
40,000
30,000
20,000
10,000
Correlation = .94
In 1993, the Federal Register rose by 10.76% over 1992to 69,688 pages. This is well above Its post World War 2average of 4.55% Through June 9,1994, the FederalRegister is on pace for a 68,900 pages year.
Yearly Average of the CRB(Right Scale) Number of pages in the Federal
Register (Left Scale)
325.00
-- 275.00
225.00
-- 175.00
125.00
-- 75.00
-I-J- 25.0000 O CM •» <O CO O
S U} U> »O tf> IO <OO> O) O) OJ O> Ol O> O> O> ffl O>
source: Federal Register, Knlght-Ridder copyrighted 1994 Arbor Trading Croup inc. All Rights Reserved
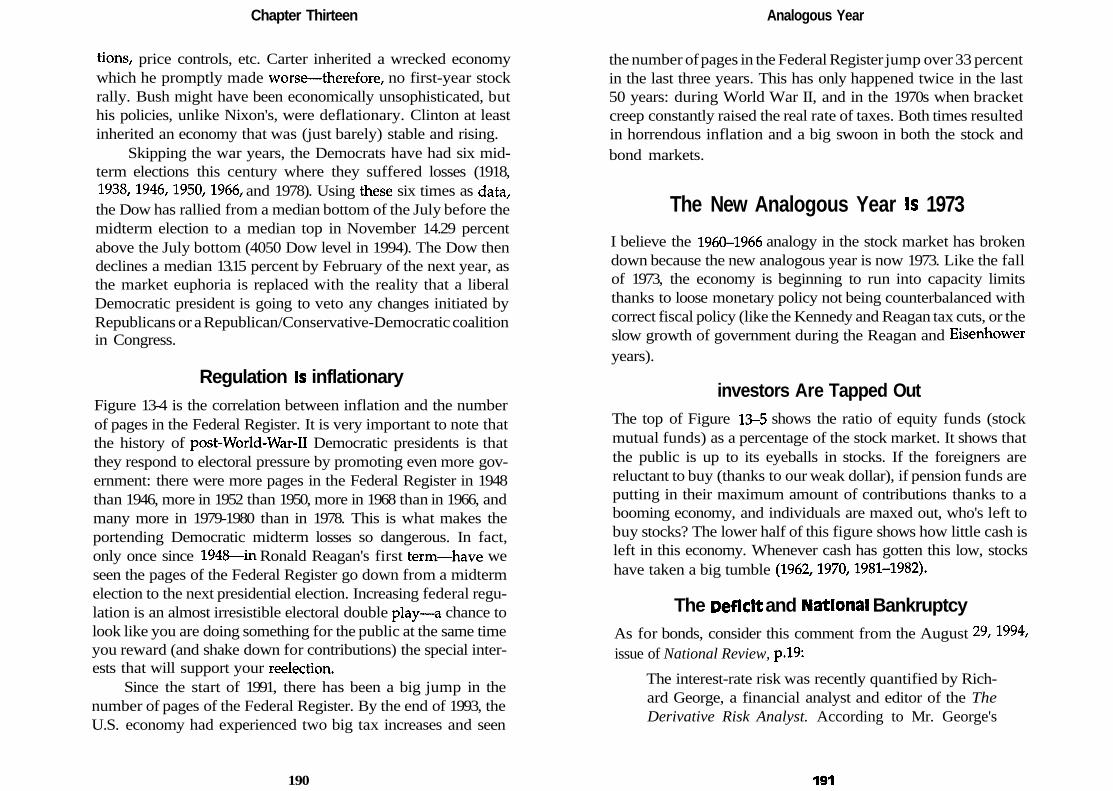
Chapter Thirteen
tions, price controls, etc. Carter inherited a wrecked economywhich he promptly made worse—therefore, no first-year stockrally. Bush might have been economically unsophisticated, buthis policies, unlike Nixon's, were deflationary. Clinton at leastinherited an economy that was (just barely) stable and rising.
Skipping the war years, the Democrats have had six mid-term elections this century where they suffered losses (1918,1938,1946,1950,1966, and 1978). Using these six times as data,the Dow has rallied from a median bottom of the July before themidterm election to a median top in November 14.29 percentabove the July bottom (4050 Dow level in 1994). The Dow thendeclines a median 13.15 percent by February of the next year, asthe market euphoria is replaced with the reality that a liberalDemocratic president is going to veto any changes initiated byRepublicans or a Republican/Conservative-Democratic coalitionin Congress.
Regulation is inflationaryFigure 13-4 is the correlation between inflation and the numberof pages in the Federal Register. It is very important to note thatthe history of post-World-War-II Democratic presidents is thatthey respond to electoral pressure by promoting even more gov-ernment: there were more pages in the Federal Register in 1948than 1946, more in 1952 than 1950, more in 1968 than in 1966, andmany more in 1979-1980 than in 1978. This is what makes theportending Democratic midterm losses so dangerous. In fact,only once since 1948—in Ronald Reagan's first term—have weseen the pages of the Federal Register go down from a midtermelection to the next presidential election. Increasing federal regu-lation is an almost irresistible electoral double play—a chance tolook like you are doing something for the public at the same timeyou reward (and shake down for contributions) the special inter-ests that will support your reelection.
Since the start of 1991, there has been a big jump in thenumber of pages of the Federal Register. By the end of 1993, theU.S. economy had experienced two big tax increases and seen
190
Analogous Year
the number of pages in the Federal Register jump over 33 percentin the last three years. This has only happened twice in the last50 years: during World War II, and in the 1970s when bracketcreep constantly raised the real rate of taxes. Both times resultedin horrendous inflation and a big swoon in both the stock andbond markets.
The New Analogous Year is 1973
I believe the 1960-1966 analogy in the stock market has brokendown because the new analogous year is now 1973. Like the fallof 1973, the economy is beginning to run into capacity limitsthanks to loose monetary policy not being counterbalanced withcorrect fiscal policy (like the Kennedy and Reagan tax cuts, or theslow growth of government during the Reagan and Eisenhoweryears).
investors Are Tapped OutThe top of Figure 13-5 shows the ratio of equity funds (stockmutual funds) as a percentage of the stock market. It shows thatthe public is up to its eyeballs in stocks. If the foreigners arereluctant to buy (thanks to our weak dollar), if pension funds areputting in their maximum amount of contributions thanks to abooming economy, and individuals are maxed out, who's left tobuy stocks? The lower half of this figure shows how little cash isleft in this economy. Whenever cash has gotten this low, stockshave taken a big tumble (1962,1970,1981-1982).
The Deficit and National BankruptcyAs for bonds, consider this comment from the August 29,1994,issue of National Review, p.19:
The interest-rate risk was recently quantified by Rich-ard George, a financial analyst and editor of the TheDerivative Risk Analyst. According to Mr. George's
191
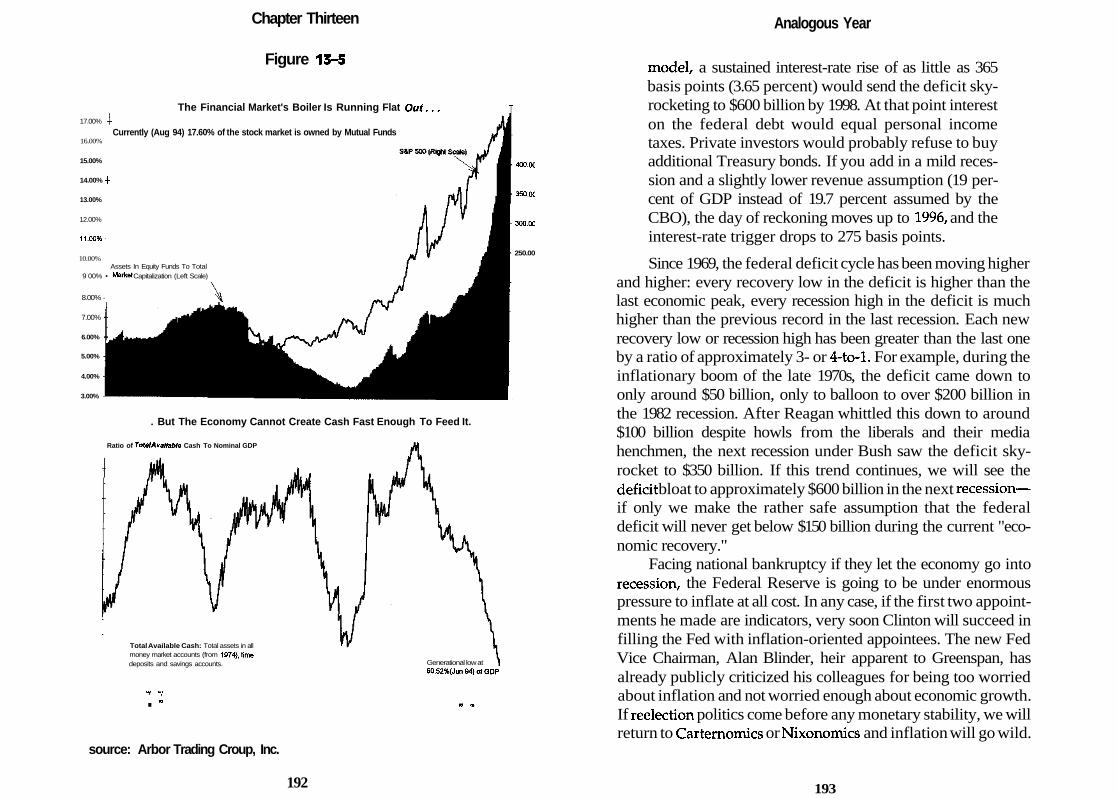
Chapter Thirteen
Figure 15-5
The Financial Market's Boiler Is Running Flat Out...
Currently (Aug 94) 17.60% of the stock market is owned by Mutual Funds17.00% |
16.00%
15.00%
14.00% -f
13.00%
12.00%
11.00%-
10.00%Assets In Equity Funds To Total
9 00% • Market Capitalization (Left Scale)
8.00% -
7.00%
6.00%
5.00%
4.00%
3.00%
400.0C
350.0C
300.0C
250.00
. But The Economy Cannot Create Cash Fast Enough To Feed It.
Ratio of Total Available Cash To Nominal GDP
Total Available Cash: Total assets in allmoney market accounts (from 1974), timedeposits and savings accounts. Generational low at
60.52%(Jun94)ofGDP
T "Y
I ™ » »
source: Arbor Trading Croup, Inc.
192
Analogous Year
model, a sustained interest-rate rise of as little as 365basis points (3.65 percent) would send the deficit sky-rocketing to $600 billion by 1998. At that point intereston the federal debt would equal personal incometaxes. Private investors would probably refuse to buyadditional Treasury bonds. If you add in a mild reces-sion and a slightly lower revenue assumption (19 per-cent of GDP instead of 19.7 percent assumed by theCBO), the day of reckoning moves up to 1996, and theinterest-rate trigger drops to 275 basis points.
Since 1969, the federal deficit cycle has been moving higherand higher: every recovery low in the deficit is higher than thelast economic peak, every recession high in the deficit is muchhigher than the previous record in the last recession. Each newrecovery low or recession high has been greater than the last oneby a ratio of approximately 3- or 4-to-l. For example, during theinflationary boom of the late 1970s, the deficit came down toonly around $50 billion, only to balloon to over $200 billion inthe 1982 recession. After Reagan whittled this down to around$100 billion despite howls from the liberals and their mediahenchmen, the next recession under Bush saw the deficit sky-rocket to $350 billion. If this trend continues, we will see thedeficit bloat to approximately $600 billion in the next recession—if only we make the rather safe assumption that the federaldeficit will never get below $150 billion during the current "eco-nomic recovery."
Facing national bankruptcy if they let the economy go intorecession, the Federal Reserve is going to be under enormouspressure to inflate at all cost. In any case, if the first two appoint-ments he made are indicators, very soon Clinton will succeed infilling the Fed with inflation-oriented appointees. The new FedVice Chairman, Alan Blinder, heir apparent to Greenspan, hasalready publicly criticized his colleagues for being too worriedabout inflation and not worried enough about economic growth.If reelection politics come before any monetary stability, we willreturn to Carternomics or Nixonomics and inflation will go wild.
193
Chapter Thirteen
The Dollar and Grain Pricesover the Next Few Years
There is one last reason to back up the assumption that we areentering (if we haven't already entered) a period like 1973-1974—the collapsing dollar and the near certainty of higher grain prices.
Republicans are not above debasing the dollar (1985-1987under Reagan, 1969-1973 under Nixon), but it's worth notingthere has been no peacetime Democratic administration in thiscentury that has raised the value of the dollar. Democrats are asbad for the dollar as they are for stocks and bonds. As JamesCarville, Clinton's political adviser said, "I looove the stockmarket falling. In the 1980s the stock market rose 300 percentand real incomes fell. Maybe now the stock market will fall andreal incomes will rise."
Over the last 25 years we have had three great debasementsof the dollar: 1969-1973, 1977-1978, and 1986-1987. Each wasfollowed by higher commodity prices and falling bonds andstocks. Even the mini-collapse of 1989-1990 in the dollar wasfollowed by a mini-collapse in bonds and stocks and an uptickin the CRB. In 1994, the dollar plunged to its lowest levels againstthe yen since World War II.
According to Jim Bianco, the CRB index has an .83 correla-tion to bond yields. Since the CRB is about 40 percent in grains,many have criticized it for being too agricultural to be useful asan inflation gauge. But according to Bianco, other indexes likethe Goldman Sachs Commodity Index (GSCI) are far less corre-lated to bonds (.43 for the GSCI).
While we in the U.S. spend only 20-25 percent of our totalincome on food, this percentage is far higher in the rest of theworld. You can turn down the thermostat and even move to acheaper lodging, but there is only so much you can do to scrimpon food. Skyrocketing food prices divert sums that would havebeen invested, shunting off funds that could buy bonds or stocks.
There are five reasons to expect at least a 50 percent increasein the price of grains over the next two years:
194
Analogous Year
1. Presidential politics in an election year usually have abullish effect on prices.
Only about 5 percent of the U.S. population is directlyinvolved in agriculture, but farmers and people who depend onthem have a political clout well beyond their numbers. Farmersare more likely to vote and contribute to political candidates.They disproportionately live in states that are going to be criticalfor Clinton's reelection: Illinois, Ohio, Missouri, Iowa, and Wis-consin. Farm states like South Dakota, North Dakota, and Mon-tana may have only .75 percent of the population of the U.S. butthey have (thanks to their two senators) 1.67 percent of the totalpercentage of the electoral college.
Since 1936, grain prices have suffered big declines onlytwice during a presidential year: 1968 and 1992. It's no accidentthat the incumbent lost both times in a close race. You can besure that Clinton knows that fact. The presidential effect has seencorn gain about 20 percent (15 percent median gain) from theharvest low of the year before the presidential election to thetime of the election itself. One calendar year after the presidentialelection, corn prices have declined 5 percent on average.
2. U.S. agricultural prices are at an all-time low.
In July 1991, the closest-to-cash corn future reached 2.23,beans 5.14, wheat 2.50, and oats 1.035 a bushel. After inflation,these prices are far lower than the Depression lows of 1932, andeven lower than the 1842 lows. They were the lowest agriculturalprices in U.S. history. Three years later in July of 1994, corn wasat 2.14, beans at 5.7125, wheat 3.04, and oats 1.095. Since inflationhas gone up 8.95 percent since then, the equivalent prices todayfor the July 1991 prices would be corn 2.43, beans 5.60 (beansgot below this price in the new-crop November beans), wheat2.72, and oats 1.1275. As you can see, in 1994 some grains werehigher than three years prior, some lower than in 1991 afterinflation adjusting. I think we can safely say that we are makinga classic long-term double-bottom in U.S. grain prices.
195
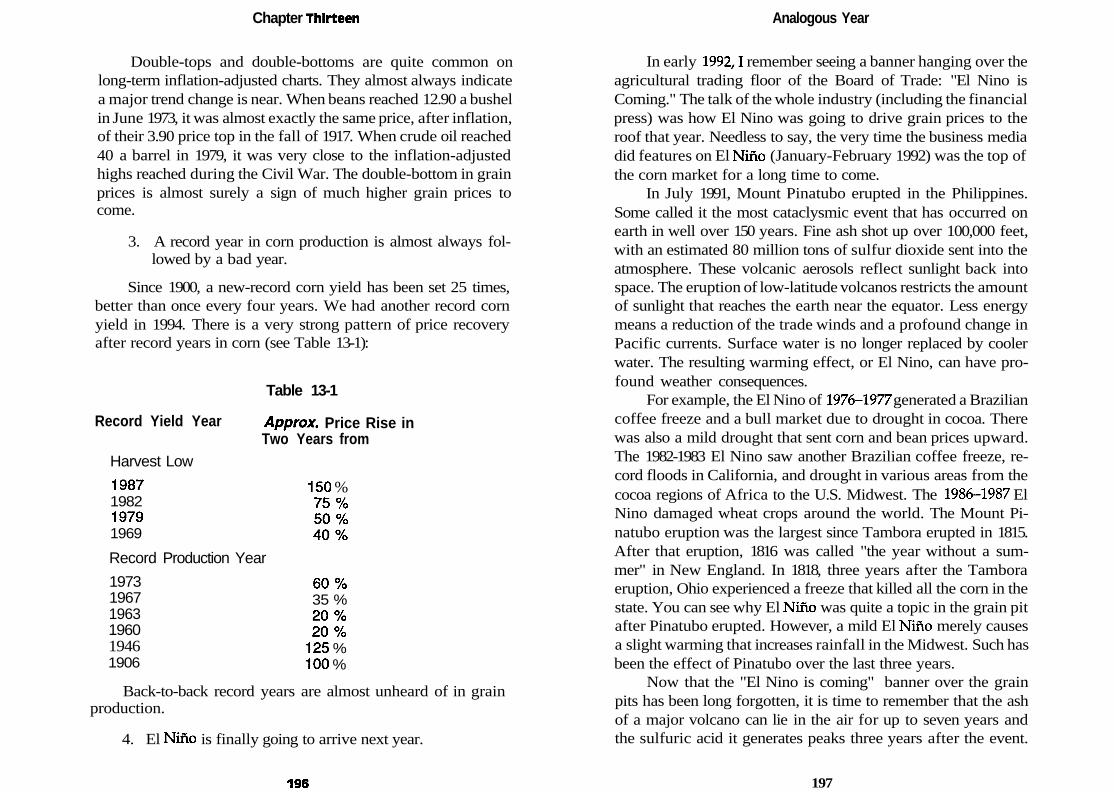
Chapter Thirteen
Double-tops and double-bottoms are quite common onlong-term inflation-adjusted charts. They almost always indicatea major trend change is near. When beans reached 12.90 a bushelin June 1973, it was almost exactly the same price, after inflation,of their 3.90 price top in the fall of 1917. When crude oil reached40 a barrel in 1979, it was very close to the inflation-adjustedhighs reached during the Civil War. The double-bottom in grainprices is almost surely a sign of much higher grain prices tocome.
3. A record year in corn production is almost always fol-lowed by a bad year.
Since 1900, a new-record corn yield has been set 25 times,better than once every four years. We had another record cornyield in 1994. There is a very strong pattern of price recoveryafter record years in corn (see Table 13-1):
Record Yield Year
Harvest Low
1987198219791969
Table 13-1
Approx. Price Rise inTwo Years from
150 %75%50%40%
Record Production Year
197319671963196019461906
60%35 %20%20%
125 %100 %
Back-to-back record years are almost unheard of in grainproduction.
4. El Nino is finally going to arrive next year.
196
Analogous Year
In early 1992,1 remember seeing a banner hanging over theagricultural trading floor of the Board of Trade: "El Nino isComing." The talk of the whole industry (including the financialpress) was how El Nino was going to drive grain prices to theroof that year. Needless to say, the very time the business mediadid features on El Nino (January-February 1992) was the top ofthe corn market for a long time to come.
In July 1991, Mount Pinatubo erupted in the Philippines.Some called it the most cataclysmic event that has occurred onearth in well over 150 years. Fine ash shot up over 100,000 feet,with an estimated 80 million tons of sulfur dioxide sent into theatmosphere. These volcanic aerosols reflect sunlight back intospace. The eruption of low-latitude volcanos restricts the amountof sunlight that reaches the earth near the equator. Less energymeans a reduction of the trade winds and a profound change inPacific currents. Surface water is no longer replaced by coolerwater. The resulting warming effect, or El Nino, can have pro-found weather consequences.
For example, the El Nino of 1976-1977 generated a Braziliancoffee freeze and a bull market due to drought in cocoa. Therewas also a mild drought that sent corn and bean prices upward.The 1982-1983 El Nino saw another Brazilian coffee freeze, re-cord floods in California, and drought in various areas from thecocoa regions of Africa to the U.S. Midwest. The 1986-1987 ElNino damaged wheat crops around the world. The Mount Pi-natubo eruption was the largest since Tambora erupted in 1815.After that eruption, 1816 was called "the year without a sum-mer" in New England. In 1818, three years after the Tamboraeruption, Ohio experienced a freeze that killed all the corn in thestate. You can see why El Nino was quite a topic in the grain pitafter Pinatubo erupted. However, a mild El Nino merely causesa slight warming that increases rainfall in the Midwest. Such hasbeen the effect of Pinatubo over the last three years.
Now that the "El Nino is coming" banner over the grainpits has been long forgotten, it is time to remember that the ashof a major volcano can lie in the air for up to seven years andthe sulfuric acid it generates peaks three years after the event.
197
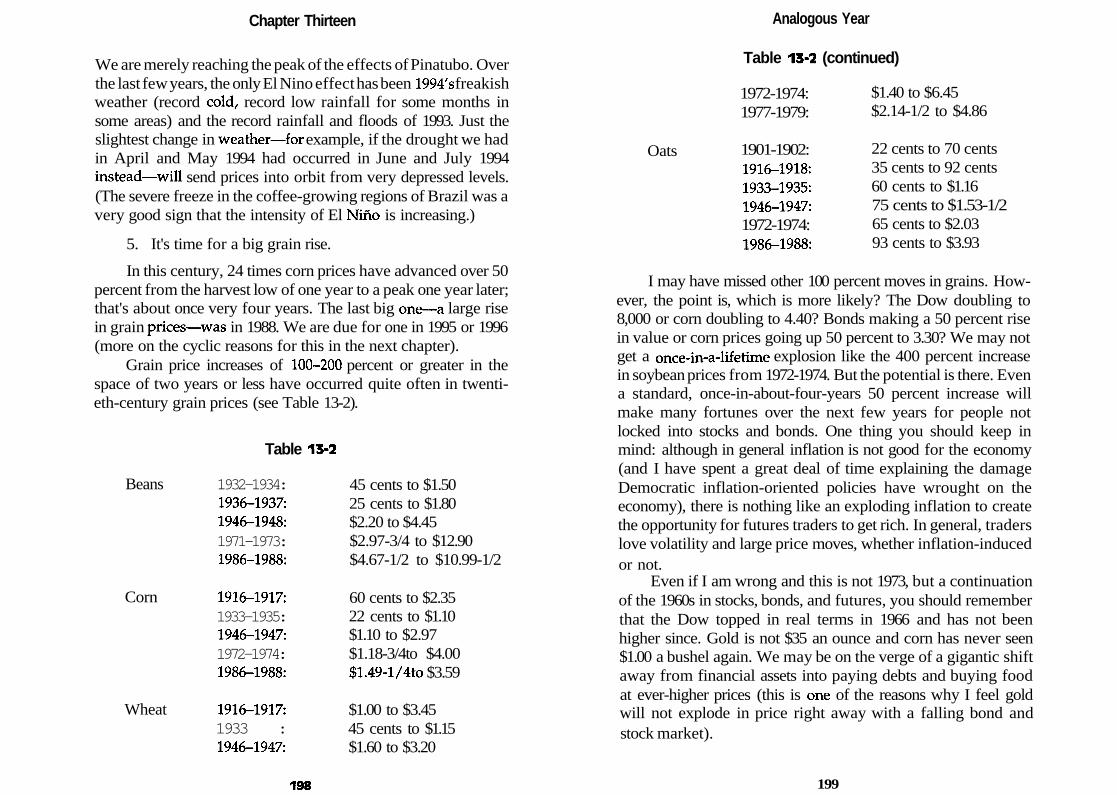
Chapter Thirteen
We are merely reaching the peak of the effects of Pinatubo. Overthe last few years, the only El Nino effect has been 1994's freakishweather (record cold, record low rainfall for some months insome areas) and the record rainfall and floods of 1993. Just theslightest change in weather—for example, if the drought we hadin April and May 1994 had occurred in June and July 1994instead—will send prices into orbit from very depressed levels.(The severe freeze in the coffee-growing regions of Brazil was avery good sign that the intensity of El Nino is increasing.)
5. It's time for a big grain rise.
In this century, 24 times corn prices have advanced over 50percent from the harvest low of one year to a peak one year later;that's about once very four years. The last big one—a large risein grain prices—was in 1988. We are due for one in 1995 or 1996(more on the cyclic reasons for this in the next chapter).
Grain price increases of 100-200 percent or greater in thespace of two years or less have occurred quite often in twenti-eth-century grain prices (see Table 13-2).
Table 13-2
Beans
Corn
Wheat
1932-1934:1936-1937:1946-1948:1971-1973:1986-1988:
1916-1917:1933-1935:1946-1947:1972-1974:1986-1988:
1916-1917:1933 :1946-1947:
45 cents to $1.5025 cents to $1.80$2.20 to $4.45$2.97-3/4 to $12.90$4.67-1/2 to $10.99-1/2
60 cents to $2.3522 cents to $1.10$1.10 to $2.97$1.18-3/4to $4.00$1.49-1/4to $3.59
$1.00 to $3.4545 cents to $1.15$1.60 to $3.20
198
Analogous Year
Table 13-2 (continued)
Oats
1972-1974:1977-1979:
1901-1902:1916-1918:1933-1935:1946-1947:1972-1974:1986-1988:
$1.40 to $6.45$2.14-1/2 to $4.86
22 cents to 70 cents35 cents to 92 cents60 cents to $1.1675 cents to $1.53-1/265 cents to $2.0393 cents to $3.93
I may have missed other 100 percent moves in grains. How-ever, the point is, which is more likely? The Dow doubling to8,000 or corn doubling to 4.40? Bonds making a 50 percent risein value or corn prices going up 50 percent to 3.30? We may notget a once-in-a-lifetime explosion like the 400 percent increasein soybean prices from 1972-1974. But the potential is there. Evena standard, once-in-about-four-years 50 percent increase willmake many fortunes over the next few years for people notlocked into stocks and bonds. One thing you should keep inmind: although in general inflation is not good for the economy(and I have spent a great deal of time explaining the damageDemocratic inflation-oriented policies have wrought on theeconomy), there is nothing like an exploding inflation to createthe opportunity for futures traders to get rich. In general, traderslove volatility and large price moves, whether inflation-inducedor not.
Even if I am wrong and this is not 1973, but a continuationof the 1960s in stocks, bonds, and futures, you should rememberthat the Dow topped in real terms in 1966 and has not beenhigher since. Gold is not $35 an ounce and corn has never seen$1.00 a bushel again. We may be on the verge of a gigantic shiftaway from financial assets into paying debts and buying foodat ever-higher prices (this is one of the reasons why I feel goldwill not explode in price right away with a falling bond andstock market).
199

Chapter Thirteen
Like every other technique, you can't use Analogous Yearmethods to the exclusion of all other techniques. But if you don'tstudy the past you may get trapped in a losing position thatnever gave you a good reversal warning in the charts or withany other technical indicator. It's one more technique you canadd to determine a top or bottom—the areas of trading that havethe most risk but also most of the profit potential.
200
Chapter Fourteen
Long-Term Cycles
In the July/August 1992 issue of Cycles magazine, I wrote anarticle, "The Blowout Stock Top of 1993: Megacycles and the U.S.Election." It was quite an opus—chockful of cycles of all sorts.Several readers called to congratulate me on my work.
I should have known after those congratulatory calls I wason the wrong track. After all, no reader of Futures magazinecalled me about "1987 Was Not 1929," their June 1988 summaryof a report I sent to my clients in early 1988. The prospects of apotential trade are usually inversely proportional to how manyother people like it. That certainly was the case when I was abroker. And it was definitely true for this Cycles article: "Stockslikely will have an enormous advance until mid-1993, partlybecause of a surprising Republican showing in Congress. Late1993 should see a stock and economic collapse, with rising pricesand interest rates." I guess you would call these statements frommy article good prognostication only if you considered a 20percent rise in the Dow an "enormous advance."
The "king" of cycle research, Edward M. Dewey, predictedin his 1947 book Cycles (New York: Hawthorn) that "on the basisof past performance, four major rhythms declining together canpossibly make a very deep economic depression indeed, starting
201
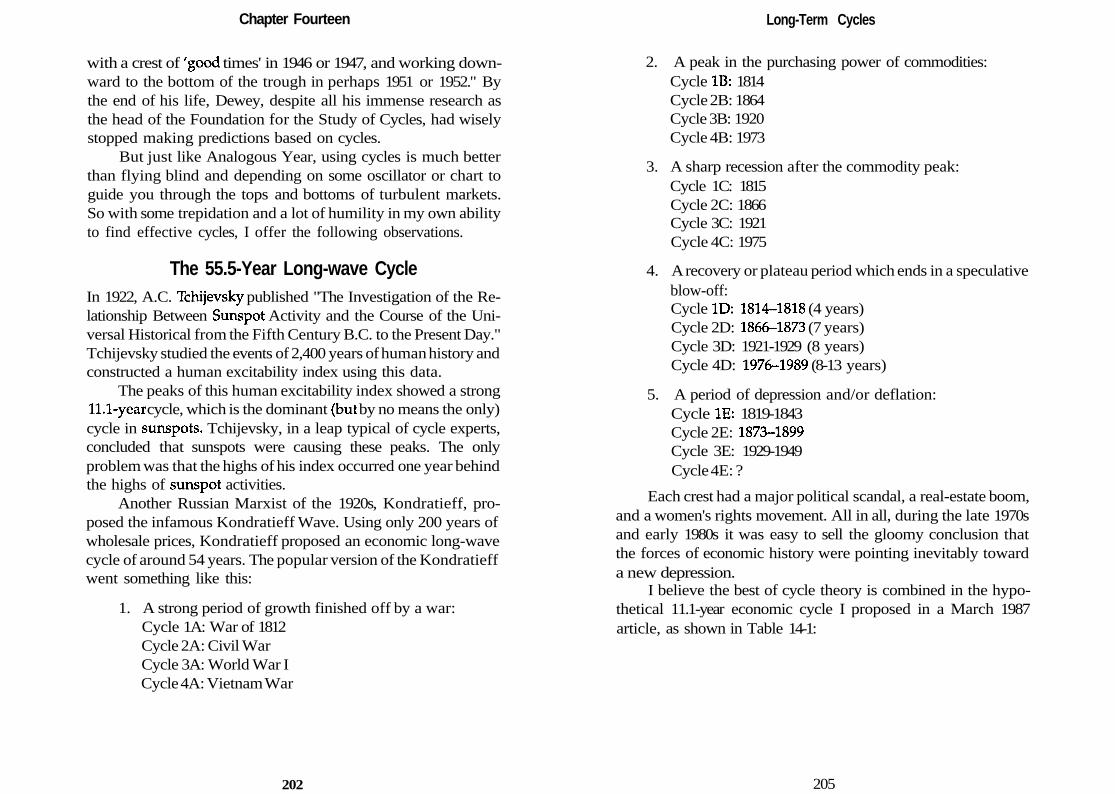
Chapter Fourteen
with a crest of 'good times' in 1946 or 1947, and working down-ward to the bottom of the trough in perhaps 1951 or 1952." Bythe end of his life, Dewey, despite all his immense research asthe head of the Foundation for the Study of Cycles, had wiselystopped making predictions based on cycles.
But just like Analogous Year, using cycles is much betterthan flying blind and depending on some oscillator or chart toguide you through the tops and bottoms of turbulent markets.So with some trepidation and a lot of humility in my own abilityto find effective cycles, I offer the following observations.
The 55.5-Year Long-wave CycleIn 1922, A.C. Tchijevsky published "The Investigation of the Re-lationship Between Sunspot Activity and the Course of the Uni-versal Historical from the Fifth Century B.C. to the Present Day."Tchijevsky studied the events of 2,400 years of human history andconstructed a human excitability index using this data.
The peaks of this human excitability index showed a strong11.1-year cycle, which is the dominant (but by no means the only)cycle in sunspots. Tchijevsky, in a leap typical of cycle experts,concluded that sunspots were causing these peaks. The onlyproblem was that the highs of his index occurred one year behindthe highs of sunspot activities.
Another Russian Marxist of the 1920s, Kondratieff, pro-posed the infamous Kondratieff Wave. Using only 200 years ofwholesale prices, Kondratieff proposed an economic long-wavecycle of around 54 years. The popular version of the Kondratieffwent something like this:
1. A strong period of growth finished off by a war:Cycle 1A: War of 1812Cycle 2A: Civil WarCycle 3A: World War ICycle 4A: Vietnam War
202
Long-Term Cycles
2. A peak in the purchasing power of commodities:Cycle IB: 1814Cycle 2B: 1864Cycle 3B: 1920Cycle 4B: 1973
3. A sharp recession after the commodity peak:Cycle 1C: 1815Cycle 2C: 1866Cycle 3C: 1921Cycle 4C: 1975
4. A recovery or plateau period which ends in a speculativeblow-off:Cycle ID: 1814-1818 (4 years)Cycle 2D: 1866-1873 (7 years)Cycle 3D: 1921-1929 (8 years)Cycle 4D: 1976-1989 (8-13 years)
5. A period of depression and/or deflation:Cycle IE: 1819-1843Cycle 2E: 1873-1899Cycle 3E: 1929-1949Cycle 4E: ?
Each crest had a major political scandal, a real-estate boom,and a women's rights movement. All in all, during the late 1970sand early 1980s it was easy to sell the gloomy conclusion thatthe forces of economic history were pointing inevitably towarda new depression.
I believe the best of cycle theory is combined in the hypo-thetical 11.1-year economic cycle I proposed in a March 1987article, as shown in Table 14-1:
205
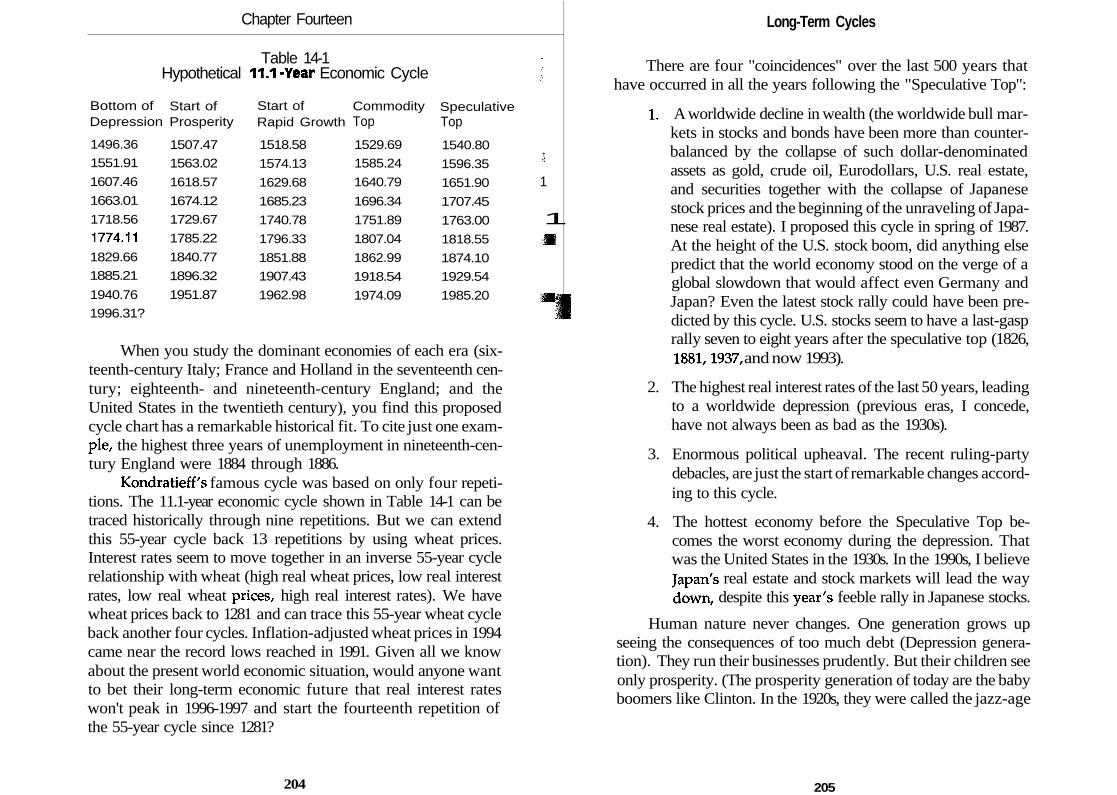
Chapter Fourteen
Table 14-1 iHypothetical 11.1 -Year Economic Cycle I
Bottom ofDepression
1496.36
1551.91
1607.46
1663.01
1718.56
1774.11
1829.66
1885.21
1940.76
1996.31?
Start ofProsperity
1507.47
1563.02
1618.57
1674.12
1729.67
1785.22
1840.77
1896.32
1951.87
Start ofRapid Growth
1518.58
1574.13
1629.68
1685.23
1740.78
1796.33
1851.88
1907.43
1962.98
CommodityTop
1529.69
1585.24
1640.79
1696.34
1751.89
1807.04
1862.99
1918.54
1974.09
SpeculativeTop
1540.80
1596.35
1651.90
1707.45
1763.00
1818.55
1874.10
1929.54
1985.20
1
1
1••H
'H^BIWhen you study the dominant economies of each era (six-
teenth-century Italy; France and Holland in the seventeenth cen-tury; eighteenth- and nineteenth-century England; and theUnited States in the twentieth century), you find this proposedcycle chart has a remarkable historical fit. To cite just one exam-ple, the highest three years of unemployment in nineteenth-cen-tury England were 1884 through 1886.
Kondratieff's famous cycle was based on only four repeti-tions. The 11.1-year economic cycle shown in Table 14-1 can betraced historically through nine repetitions. But we can extendthis 55-year cycle back 13 repetitions by using wheat prices.Interest rates seem to move together in an inverse 55-year cyclerelationship with wheat (high real wheat prices, low real interestrates, low real wheat prices, high real interest rates). We havewheat prices back to 1281 and can trace this 55-year wheat cycleback another four cycles. Inflation-adjusted wheat prices in 1994came near the record lows reached in 1991. Given all we knowabout the present world economic situation, would anyone wantto bet their long-term economic future that real interest rateswon't peak in 1996-1997 and start the fourteenth repetition ofthe 55-year cycle since 1281?
204
Long-Term Cycles
There are four "coincidences" over the last 500 years thathave occurred in all the years following the "Speculative Top":
1. A worldwide decline in wealth (the worldwide bull mar-kets in stocks and bonds have been more than counter-balanced by the collapse of such dollar-denominatedassets as gold, crude oil, Eurodollars, U.S. real estate,and securities together with the collapse of Japanesestock prices and the beginning of the unraveling of Japa-nese real estate). I proposed this cycle in spring of 1987.At the height of the U.S. stock boom, did anything elsepredict that the world economy stood on the verge of aglobal slowdown that would affect even Germany andJapan? Even the latest stock rally could have been pre-dicted by this cycle. U.S. stocks seem to have a last-gasprally seven to eight years after the speculative top (1826,1881,1937, and now 1993).
2. The highest real interest rates of the last 50 years, leadingto a worldwide depression (previous eras, I concede,have not always been as bad as the 1930s).
3. Enormous political upheaval. The recent ruling-partydebacles, are just the start of remarkable changes accord-ing to this cycle.
4. The hottest economy before the Speculative Top be-comes the worst economy during the depression. Thatwas the United States in the 1930s. In the 1990s, I believeJapan's real estate and stock markets will lead the waydown, despite this year's feeble rally in Japanese stocks.
Human nature never changes. One generation grows upseeing the consequences of too much debt (Depression genera-tion). They run their businesses prudently. But their children seeonly prosperity. (The prosperity generation of today are the babyboomers like Clinton. In the 1920s, they were called the jazz-age
205
Chapter Fourteen
generation). These children borrow and speculate up to the hiltbecause they think prosperity is forever.
Eventually the bubble bursts. (In 1929 it was a stock crash.Today I believe we will see a collapse in the bond market.) Thewhole debt mountain comes down like a ton of bricks. Eachdepression is worse than the last because the debt mountain is piledhigher because of the expanding nature of fiat money.
Like Herbert Hoover, Bill Clinton is the political wonder-child of his age. He believes his economic policies will ensureprosperity continues forever, and his answer is more govern-ment. Clinton will continue to borrow, tax, and manipulate,oblivious to the need to ease the governmental burden on JoeAverage who is staggering under a massive load of private andpublic debt.
Cold and Bonds after the Speculative TopIf you ask the average investor what does well in depressions, hewould reply, government bonds and gold. Leaving aside the verypertinent question of whether the U.S. government can pay itsbills over the long term, this answer is still not quite true. Thosewho held gold and U.S. bonds throughout the Great Depressiondid well. But during the early part of the crisis, gold fell from ayearly average price of 20.67 an ounce in 1928 to 17.06 in 1931.U.S. bonds fell 20 percent from January 1931 to July 1932. Baa-rated bonds went from an average yield of 7.5 percent in August1931 to 11.6 percent six months later. From the middle of 1931 tothe middle of 1932, railroad bonds lost 36 percent, foreign bonds45 percent, and many issues lost even more.
As far as I can tell (records are pretty scanty before 1700),this phenomenon has always happened near the start of theperiod between the Speculative Top and the Depression Bottom.Here are three examples:
Long-Term cycles
206
* English bonds had a big fall from 1818 to 1820, whilegold fell in English commodity terms over 11 percentfrom 1820 to 1825. There was also a sharp fall in the dollarprice of gold during this period.
* According to Warren and Pearson's classic study1 of thehistory of prices, gold in English commodity terms fell20 percent from 1878 to 1882, only to climb 80 percent incommodity terms over the next decade and a half.
* U.S. bonds fell from 1874 to 1879, only to reboundstrongly over the next two decades.
History says that falling gold and bond prices often accom-pany the start of hard times as investors attempt to pay off debtsand prop up their businesses by liquidating assets. As the de-pression gathers strength despite this liquidation, panic sets inand people begin to horde gold and government bonds, sendingprices up.
I expect the same thing in our coming depression with thisone twist: The massive government of today will undoubtedlyintervene by trying to prop up the economy by inflating it—either directly by having the Fed monetize U.S. government debtor indirectly by letting the dollar fall. Until the crisis gets full-blown, I expect gold (after inflation is factored out) to underper-form other commodity assets like grains.
As for U.S. government bonds, one has to remember thatthe real U.S. debt is not the official $5 trillion or so, but $20-$25trillion in unfunded pensions (like the Social Security for babyboomers), loan guarantees (everything from Fannie Mae to pro-tecting the solvency of the top 200 banks), plus every sort ofsubsidy like crop and flood insurance. The bond market is goingto take a triple hit of rising inflation, a private credit crunch, plusthe likelihood (when the deficit rises to $600 billion and interestpayments take all the revenue generated by the income tax) ofsome sort of government game with interest payments.
;," Macmillan, 1933
207
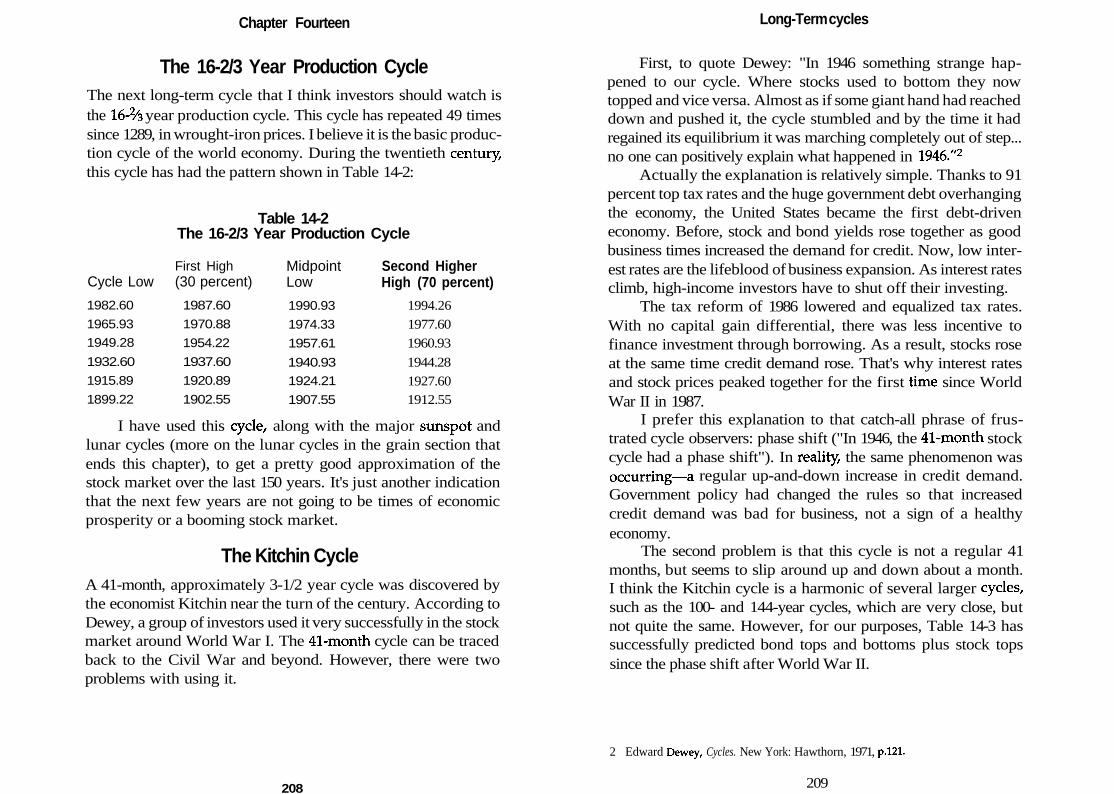
Chapter Fourteen
The 16-2/3 Year Production CycleThe next long-term cycle that I think investors should watch isthe 16-2/3 year production cycle. This cycle has repeated 49 timessince 1289, in wrought-iron prices. I believe it is the basic produc-tion cycle of the world economy. During the twentieth century,this cycle has had the pattern shown in Table 14-2:
Table 14-2The 16-2/3 Year Production Cycle
Second HigherHigh (70 percent)
1994.26
1977.60
1960.93
1944.28
1927.601912.55
I have used this cycle, along with the major sunspot andlunar cycles (more on the lunar cycles in the grain section thatends this chapter), to get a pretty good approximation of thestock market over the last 150 years. It's just another indicationthat the next few years are not going to be times of economicprosperity or a booming stock market.
The Kitchin CycleA 41-month, approximately 3-1/2 year cycle was discovered bythe economist Kitchin near the turn of the century. According toDewey, a group of investors used it very successfully in the stockmarket around World War I. The 41-month cycle can be tracedback to the Civil War and beyond. However, there were twoproblems with using it.
Cycle Low
1982.60
1965.93
1949.28
1932.60
1915.89
1899.22
First High(30 percent)
1987.60
1970.88
1954.22
1937.60
1920.89
1902.55
MidpointLow
1990.93
1974.33
1957.61
1940.93
1924.21
1907.55
208
Long-Term cycles
First, to quote Dewey: "In 1946 something strange hap-pened to our cycle. Where stocks used to bottom they nowtopped and vice versa. Almost as if some giant hand had reacheddown and pushed it, the cycle stumbled and by the time it hadregained its equilibrium it was marching completely out of step...no one can positively explain what happened in 1946."2
Actually the explanation is relatively simple. Thanks to 91percent top tax rates and the huge government debt overhangingthe economy, the United States became the first debt-driveneconomy. Before, stock and bond yields rose together as goodbusiness times increased the demand for credit. Now, low inter-est rates are the lifeblood of business expansion. As interest ratesclimb, high-income investors have to shut off their investing.
The tax reform of 1986 lowered and equalized tax rates.With no capital gain differential, there was less incentive tofinance investment through borrowing. As a result, stocks roseat the same time credit demand rose. That's why interest ratesand stock prices peaked together for the first ti,me since WorldWar II in 1987.
I prefer this explanation to that catch-all phrase of frus-trated cycle observers: phase shift ("In 1946, the 41-month stockcycle had a phase shift"). In reality, the same phenomenon wasoccurring—a regular up-and-down increase in credit demand.Government policy had changed the rules so that increasedcredit demand was bad for business, not a sign of a healthyeconomy.
The second problem is that this cycle is not a regular 41months, but seems to slip around up and down about a month.I think the Kitchin cycle is a harmonic of several larger cycles,such as the 100- and 144-year cycles, which are very close, butnot quite the same. However, for our purposes, Table 14-3 hassuccessfully predicted bond tops and bottoms plus stock topssince the phase shift after World War II.
2 Edward Dewey, Cycles. New York: Hawthorn, 1971, p.121.
209
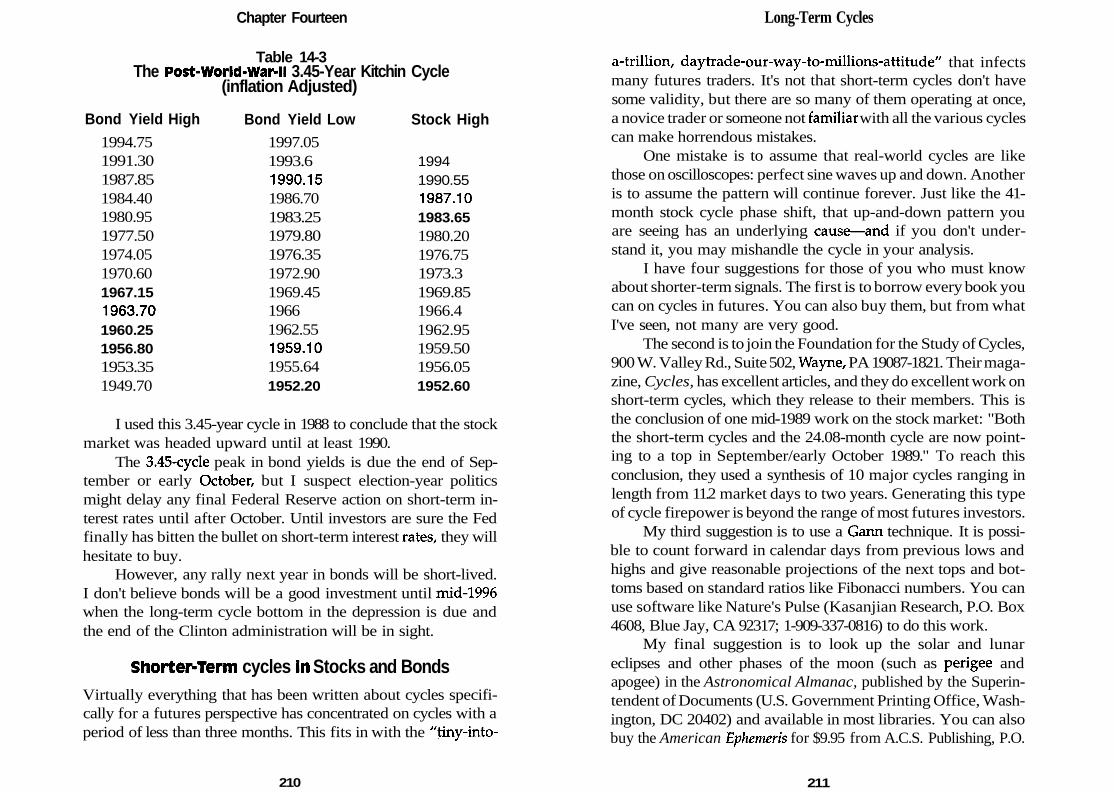
Chapter Fourteen
Table 14-3The Post-World-War-ll 3.45-Year Kitchin Cycle
(inflation Adjusted)
Bond Yield High1994.751991.301987.851984.401980.951977.501974.051970.601967.151963.701960.251956.801953.351949.70
Bond Yield Low1997.051993.61990.151986.701983.251979.801976.351972.901969.4519661962.551959.101955.641952.20
Stock High
19941990.551987.101983.651980.201976.751973.31969.851966.41962.951959.501956.051952.60
I used this 3.45-year cycle in 1988 to conclude that the stockmarket was headed upward until at least 1990.
The 3.45-cycle peak in bond yields is due the end of Sep-tember or early October, but I suspect election-year politicsmight delay any final Federal Reserve action on short-term in-terest rates until after October. Until investors are sure the Fedfinally has bitten the bullet on short-term interest rates, they willhesitate to buy.
However, any rally next year in bonds will be short-lived.I don't believe bonds will be a good investment until mid-1996when the long-term cycle bottom in the depression is due andthe end of the Clinton administration will be in sight.
Shorter-Term cycles In Stocks and BondsVirtually everything that has been written about cycles specifi-cally for a futures perspective has concentrated on cycles with aperiod of less than three months. This fits in with the "tiny-into-
210
Long-Term Cycles
a-trillion, daytrade-our-way-to-millions-attitude" that infectsmany futures traders. It's not that short-term cycles don't havesome validity, but there are so many of them operating at once,a novice trader or someone not familiar with all the various cyclescan make horrendous mistakes.
One mistake is to assume that real-world cycles are likethose on oscilloscopes: perfect sine waves up and down. Anotheris to assume the pattern will continue forever. Just like the 41-month stock cycle phase shift, that up-and-down pattern youare seeing has an underlying cause—and if you don't under-stand it, you may mishandle the cycle in your analysis.
I have four suggestions for those of you who must knowabout shorter-term signals. The first is to borrow every book youcan on cycles in futures. You can also buy them, but from whatI've seen, not many are very good.
The second is to join the Foundation for the Study of Cycles,900 W. Valley Rd., Suite 502, Wayne, PA 19087-1821. Their maga-zine, Cycles, has excellent articles, and they do excellent work onshort-term cycles, which they release to their members. This isthe conclusion of one mid-1989 work on the stock market: "Boththe short-term cycles and the 24.08-month cycle are now point-ing to a top in September/early October 1989." To reach thisconclusion, they used a synthesis of 10 major cycles ranging inlength from 11.2 market days to two years. Generating this typeof cycle firepower is beyond the range of most futures investors.
My third suggestion is to use a Gann technique. It is possi-ble to count forward in calendar days from previous lows andhighs and give reasonable projections of the next tops and bot-toms based on standard ratios like Fibonacci numbers. You canuse software like Nature's Pulse (Kasanjian Research, P.O. Box4608, Blue Jay, CA 92317; 1-909-337-0816) to do this work.
My final suggestion is to look up the solar and lunareclipses and other phases of the moon (such as perigee andapogee) in the Astronomical Almanac, published by the Superin-tendent of Documents (U.S. Government Printing Office, Wash-ington, DC 20402) and available in most libraries. You can alsobuy the American Ephemeris for $9.95 from A.C.S. Publishing, P.O.
211
Chapter Fourteen
Box 34487, San Diego, CA 92613-4487; 1-800-888-9983.Any astronomical extreme is important in determining a
potential top or bottom in the various markets—parallels to thecelestial equator and ecliptic among the suns and planets, com-binations like solstices and perigees of the moon, etc. Frankly,the complexities of astronomy are beyond me, and I suspect theyare beyond the average investor. But I do think a knowledge ofwhat is going on with the moon is worth the extra effort.
In 1993, Burton Pugh proposed that the price of wheatmoved higher on the full moon and lower on the new moon.Moon trading has also been advocated by Larry Williams andothers. Our word lunacy comes from luna, Latin for moon. Of allthe celestial bodies, the moon seems to have the most powerfulinfluence on human behavior. Since our bodies are 90 percentwater, the phases of human behavior seem to move up and downwith the moon, just like the tides. Dewey cites a study that 17percent more babies were born during the waxing periods of themoon than during the waning periods. In some years, that figurewas 25 percent!
The sun is 26 million times larger than the moon but it is359 times farther away from earth. Therefore, the moon exertstwo-and-a-half times the gravitational force on us than the sun.The moon's orbit is an ellipse that moves it closer or further awayfrom the earth. All planets move in ellipses, so the sun's gravi-tational power does fluctuate with its distance to earth, but notevery 28 days as with the moon apogee/perigee cycle.
Cycles should be checked for currency and inflation adjust-ments. This is just as important in my opinion as detrending,averaging to take out randomness, and other standard tech-niques to find cycles.
3.72- and 7.43-Year Cycles In currencies and GrainsEvery 22.29 years, sunspots complete a cycle of two waves. Sun-spots travel in magnetized pairs. In one wave, positively chargedspots lead in the sun's northern hemisphere, while negative spotslead in the sun's southern hemisphere. In the next wave, thispattern is reversed.
212
Long-Term Cycles
The orbit of the moon is not exactly the same plane as theorbit of the earth around the sun. It is inclined five degrees.When the moon crosses the plane of the earth (the ecliptic), thisis a called a node. The planes become the same (relative to thepositions of the stars) every 18.6 years (to be exact, every 6,585.36days. In other words, every 18.61 years the node makes a com-plete revolution around the zodiac).
Both cycles topped in the summer of 1973, a peak for grainsin purchasing power that hasn't been equaled since. The follow-ing one-third subcycle of the 22.29 sunspot cycle and the one-fifth cycle of the 18.6-year lunar cycle correlate almost exactly tograin tops:
1. 7.43-year cycle grain tops: 1973.6,1981.04,1988.46, andnow 1995.89?
2. 3.72-year cycle grain tops: 1973.6, 1977.32, 1981.04,1984.76, 1988.48, 1992.20 (remember the time of the ElNino banner?), and now 1995.92?
The conjunction of these two cycles creates the biggest bullmarkets in grains. The target date of 1995.92 also agrees withour Analogous Year analysis that grains are due for a priceincrease over the next one to two years.
These cycles also seem to be connected to the dollar. Asinflation fears peak with the price of grains (7.43-year cyclepeak), dollar holders look for more stable currencies or to pre-cious metals:
* 1958.64: Despite a U.S. recession, gold begins to flow outof the U.S. This was the start of the chronic balance-of-payments crisis we are still suffering. The weak Canadiandollar and British pound were strong during this period,while hard currencies like the Swiss franc and the deut-sche mark began to inch up against the dollar from theirpost-World-War-II fixed price.
# 1966.17: The U.S. begins to liquidate silver in a desperateattempt to control inflation and prevent the break up of
213
Chapter Fourteen
Bretton Woods. It was also the last year of a stable Britishpound.
* 1973.6: The U.S. dollar was nearing the end of a sickeningplunge, saved later on in the year by rising oil prices.
* 1981.03: Inflation peaks, and the U.S. dollar is beginningto rise from historic lows. Peak of short-term interestrates.
* 1988.46: Dollar doom at its height. There was an almostuniversal consensus that the U.S. dollar would renew itsrecent slide against most foreign currencies.
Conversely, the middle of the 7.43-year cycle (which corre-sponds to the tops of the 3.72-year grain cycle) has seen a fairlystrong dollar within the context of a long-term fall of the dollarsince the mid-1960s:
* 1962.45: British pound under pressure, along with Cana-dian dollar.
* 1969.45: Despite Vietnam inflation, the U.S. dollar seesits last days of relative stability for a very long time.French franc at a low against the dollar.
* 1977.31: The peak of the Carter years, before the longslide down.
* 1984.74: The beginning of the surge that would carry thedollar to post-war highs in the blow-off top created bythe international euphoria that followed Reagan's reelec-tion. Gust track what happens to the dollar when a U.S.president proposes a tax cut versus tax increase, or whena president acts tough or spends more on defense vs. theopposite.)
* 1992.17: A peak during the awful Bush years. Thosewho knew Bush best (foreigners) liked him even lessthan American voters did in 1992. The dollar made arecord low in late August/early September 1992 whenforeigners thought that Bush might have a chance tobe reelected (Bush's poll numbers after the Republican
214
Long-Term Cycles
convention were almost even with Clinton's).
Mild inflation (the middle of the 7.43-year cycle) helps re-source-producers like the United States. Heavy inflation createspanic and a flight out of the dollar. Along with a cycle top ingrains, I expect a major low in the dollar to come in late 1995 orearly 1996.
Large currency fluctuations began in 1958, but the same7.43-year pattern in the dollar can be traced back through thenineteenth century using inflation and what the price of goldbought in the way of a basket of commodities. For example, thedollar reached a peak against major currencies like the poundnear the time the 7.43-year cycle predicted would be a period ofstrength: 1932.72.
These last two cycles are a perfect example of the synergy orresonation you must use to make long-term cycle predictions. Bythemselves, the 3.72-year and 7.43-year cycles in grains are inter-esting, but they become even more validated when you realizecurrency fluctuations are moving along the same lines.
Virtually every long-term cycle agrees with our other indi-cators (like Analagous Year) that 1994 is a time to sell stocks andbonds and buy commodities, especially grains. If you know themarket bias of the next few years—securities (especially stocks)down, commodities (especially grains) up—you have an im-mense advantage over the average investor. Even a strict tech-nician must adjust his chart patterns and indicators to the shiftfrom a bull to a bear market and vice versa. If I am close to beingright in the above predictions, this will be worth many times theprice of this book even if you never use any specific techniquein your trading.
215
Chapter Fifteen
The Media: The BestTrading indicator
Back when I worked for what I later found out was a phonyeconometric firm, I had a conversation with one of its principals,whom I'll call "Stan." Stan used to trade on the floor of the Comexin the silver pit. He told me two things I'll never forget.
Before the opening or when trading was dull, he used tochit-chat with all the filling brokers who executed trades for themajor stock houses and discount firms. His patter would gosomething like this: "Hi, Ira. How's the wife and kids? Did youhave a good weekend? How many to sell at 95?" The last sen-tence was a request for the number of December silver contractsell-stop orders at 6.95 Ira had in his deck. Of course this issupposed to be illegal and maybe floor traders now aren't asblatant as Stan used to be. But floor traders have other ways offinding out where the stops are. They've got the same indicatorsand charts. All the major newsletters and hotlines are upstairsat the exchange library. They can send their clerks to read everyone of them and tell them where the stops are.
Stan told me one other thing that started me down the pathof writing this chapter. "Whenever I was too long silver andneeded to get out, I'd just call up the commodity reporter at The
917
Chapter Fifteen
Wall Street Journal and give him every reason for being longsilver." The reporter would write the story, the story wouldappear in The Journal, the orders would flow into the pits fromthousands of traders all over the country, and Stan and hisbuddies would get out of their long silver positions and go short.
I have said it before and it bears repeating: reporters getpaid $50,000 a year to generate stories. If one comes gift-wrappedand ready to print from a reputable source like Stan the FloorTrader, why shouldn't that reporter save some time and print itas is?
After all, there is always a long for every short in the futuresmarket. At any given moment, there's always a case for the bullsand a case for the bears. Whatever side the newspaper prints isan editorial judgment. If someone else is willing to take the riskof putting his name on a market call, so much the better. Any-body who's angry can call up Stan the Floor Trader and complainto him. Don't blame The Wall Street Journal for printing someoneelse's opinion!
When I was a futures broker, I saw other brokers use a WallStreet Journal article to sell a trade dozens of times (for stocksand bonds as well as futures). Even when the trade lost (thenormal result), there was less anger and resentment among theclients. Didn't we see it in the great Wall Street Journal? "At leastI went down with the best information available," the clientwould rationalize.
I often tell the story of Stan the Floor Trader at seminars.Then I usually ask, "Do you think it is routine for market insidersto feed the media stories?" Only a few hands go up in theroom—usually the ones from Europe. For some reason Europe-ans have no trouble with the concept of a manipulated media,but Americans are determined to believe that everything theyread is on the up-and-up.
After I wrote an article about media trading for TechnicalAnalysis of Stocks and Commodities magazine, people called fromaround the world, begging me to give them more information.
218
The Media: The Best Trading indicator
I always felt bad when I had to tell foreigners I'd only doneresearch on American business media. The ones that wantedhelp the most were the ones I could help the least.
Besides a reluctance to disbelieve what they read, Americanfutures traders also don't like a method you can't put in a com-puter. Yes, I've done word studies using headlines in the businesspress. There is a difference in market action between use of theword plunge in the headline rather than/a//. And I do share theseresults with clients. But learning how to read the media is an art.It's very hard, if not impossible, to computerize everything. Forexample, the position of the story is very important. You canask the computer to find the word plunge on the C-l page of TheWall Street Journal. But how do you tell it to look for plunge inthe headline that leads the top right-hand column? Is there achart? Is plunge in smaller type in a secondary sentence?
I really feel that the greatest reason why media trading is nota standard technique is the fact that it cannot be computerized oreasily predigested. Of course, a lot of firms don't want to bite thehand that feeds them. Why antagonize the paper that runs yourads by telling everyone how lousy their advice is? But it really isamazing how little discussion of media trading there is when youconsider how many big names like Richard Band, Ned Davis, PaulMacrae Montgomery, etc., have advocated using the business pressas a contrary opinion indicator.
Even Gann talked about the effects of the media in Truth ofthe Stock Tape (Pomeroy, Washington: Lambert-Gann, 1976). AndReminiscences of a Stock Operator has a whole section on how thenameless operator used the effects of a news article to unloadhis massive long position in cotton over the space of a fewminutes.
I've even seen one of Richard Dennis' famous turtles dis-cuss media trading in his newsletter! Dennis is a technical trad-ing legend who decided to teach a select group (the turtles) someof his methods. If one of Dennis' disciples can take his eyes offthe Sacred Six long enough to say, "I think newspaper headlinesare a great thing to fade," perhaps you should fade them, too!
219
Chapter Fifteen
The Basics of Media Trading
Since media trading has to be somewhat of an art rather than anexact science, there are many things about it that can never beprecisely pinned down. There are at least three basic problemsthat face every media trader no matter how long he has studiedthe subject and used media trading techniques in making histrading decisions.
1. Determining what's important: is it news or is it emo-tional bias?
2. Judging the signal's intensity.
3. Is the signal long, intermediate, or short term?
I will spend the rest of the chapter discussing these issues.But before I get to those three basic problems, there is one mediatrading problem that isn't really a problem at all.
A Problem That isn't a Problemwhen Reading the Media
The answer to the question, "How long does the effect of an articleor TV program last on the markets?" is simply our old Rule ofThree working with the 3/21-Day Memory Law.
Just like any market event, a media story—whether printor electronic—has the most impact during the first three hoursafter someone has seen it. Over the next three days, 80 percentof the contents of that story will slip from the memory. Afterthree weeks, only 3 percent of that article will be remembered.It will then become part of the permanent memory. This memorywill not normally be triggered unless a similar event occurs: "Isee beans were up the limit on a drought scare. Didn't the Journalrun a drought story a month ago on beans?"
In dealing with a print article, the maximum impact of thatarticle will be on the morning it comes out. Most people readtheir paper every morning. Just like the opening routines of themarket, if an article fails (a bullish story does not lead to a market
220
The Media: The Best Trading Indicator
reversal down by the end of the day, or vice versa for a bearishstory), we can anticipate another three days of market action inthe direction (bullish or bearish) of the article. If, after three days,there is another failure (no market reversal in the directionagainst the thrust of the article), then we can expect three weeksof market action in the direction of that story leading to a majortop or bottom.
Few people videotape or take notes of their favorite busi-ness TV show. The vast majority of those who watch TV businessshows don't do either. In my opinion, the impact of all TVbusiness shows, even celebrated ones like "Wall Street Week,"does not extend much beyond three days.
You should keep a diary of the business articles you readand the business TV shows you see. It will increase your faithin media trading as you see how the media was always scream-ingly bullish at major tops and obviously bearish at major bot-toms. So by all means, keep anything you've written down forfuture reference. But as far as market decisions are concerned,you don't need to refer to any media comment more than fourweeks old.
The Logistics of Media TradingOne of the problems of trading is the sheer logistics of it: 90percent of your most important trading decisions are made before10:00 A.M. It can be overwhelming. No wonder so many go to ablack-box system that tells them exactly what to do 15 minutesafter the previous close.
But if you are going to use something besides a pure me-chanical approach in your trading, the media system actuallysaves time. You don't need to refer to anything but the last threeto four weeks of media commentary. The rest can go into storagefor leisurely study. The headlines of the media tell you whichmarket you should look at to trade. You don't have to calculateexpected range, etc., for every market; you need to figure onlythe ones the media says you should consider.
In fact, media trading is one of the few trading approachesI know where you don't have to have a computer and fancy
221
Chapter Fifteen
software (although having a computer does cut down the drudg-ery time). A subscription to The Wall Street Journal provides youwith virtually every market quote, including most cash markets.Add in the other national dailies and your own regional paper,a trip to the library for all the weekly business periodicals, andyou are set.
Because that's far cheaper than $750 a month for the quotes,software, and seminars routine of black-box trading, you havea chance to survive by not violating the Mathematics of Invest-ing. Because it's easier to trade longer term with the media (youcan ignore the smaller movements until the media blares at you,"This is a top," or "This is a bottom"), you don't have to be aquote-machine slave. You can work another job until you knowthat you are good enough to trade full time.
Media trading teaches you discipline and patience. Youlearn to wait until all the conditions are right. Unless the media"speaks," you stay in your winning positions even though youremotions are screaming, "Take profits! Take profits!" You avoidgetting prematurely into positions and, most importantly, youlearn how to reverse yourself completely when conditions war-rant it.
Media trading is the answer to a small trader's prayer. Heneeds something that is cheap to operate and will force him tobe careful when entering positions and patient with his winners.He also needs something that doesn't bore him into overtrading.Reading the media every day is like an adventure—you don'tknow what to expect but you know you will never be bored.Even if there is no signal trading-wise, the circus of humanexistence (politics, sports, etc.) is there on the printed page toentertain you, even if there is nothing to do in the markets.
Determining What's important:is it News or is it Emotional Bias?
The first problem in any media trading system is to determinewhat is actually important for your trading, what is routine andunimportant, and what should make you stand up and takenotice.
222
The Media: The Best Trading indicator
The first step is to determine what you can afford to read.Ideally, you should get four papers each business day before thetrading day (you can go to the library for the weekend editions):The Wall Street Journal, the New York Times, U.S.A. Today, and yourbiggest local regional paper.
I'm fortunate that my local paper, the Chicago Tribune, is themost prominent regional paper for trading futures—it reachesmore Midwestern farmers than any other paper and has specialcoverage of the local futures markets. If grain trading is yourspecialty, you should make every effort to get the Tribune. Backin rain-soaked July 1993—the very day the grain markettopped—The Wall Street Journal ran a story on page A-l, topright-hand column, on the destruction of the soybean crop dueto excess rain. That gave a powerful media sell signal. But theicing on the cake, the story that really steeled the trading back-bone to go short, was a simultaneous front-page story in theTribune about the same topic.
But even if your biggest local regional paper is not theTribune but the Detroit Free Press, the St. Louis Post-Dispatch, theMiami Herald, the Atlanta Constitution, etc., it is still a valuabletrading tool, especially for stock and bond trading. If some mar-ket makes the headlines of your local paper, it is a very powerfulmedia signal.
If you get these four daily papers now, so much the better.But if you don't, then you must treat any additional subscriptionas a business decision. You must use Dull-but-Successful TradingRule #1 (see p. 27) If you have a $5,000 account and the interestyou generate on the account is 4 percent a year, or $200, youreally don't have much room to maneuver. If your account sizeleaves you a little short, then here is the order in which I wouldadd additional papers:
1. The Wall Street Journal: It's the premier business paper inthe country and the only readily available source for allmarket quotes, including the cash markets.
2. Theano
j next paper you get depends on whether you have>ther reason to trade besides speculation, i.e., whether
223
Chapter Fifteen
you are a bona fide hedger. If you are a grain farmer,you should get the Chicago Tribune if it is readily availablein your area. If you are a jeweler or a fuel-oil distributoror some other dealer in a future that is traded in NewYork, you should get the New York Times.
3. If you are not a bona fide hedger, the order I suggest foradding new papers after The Journal is the New YorkTimes, U.S.A. Today, then your local major regional paperand Investor's Business Daily.
I live in an area that has many libraries. Even if one libraryis missing a copy of a weekend edition of a paper or a weeklyperiodical, I can always go to another library that is close by. Butif you live in an area with inadequate libraries, you may haveto, as your account size grows, pay to get these weekly peri-odicals in this order of priority:
1. Barren's
2. Forbes
3. U.S. News & World Report
4. The Economist (from the U.K.)
5. Business Week
6. Fortune
7. Futures
8. Time
9. Newsweek
10. Weekend editions of your regional paper and the NewYork Times.
If you look at all the assets you own, you may find out youare really trading a lot more in the futures market than you think;your trading position includes personal assets like gold andstocks, a variable-rate mortgage, etc. Then you can justify spend-
224
The Media: The Best Trading indicator
ing more on your futures trading account than Dull-but-Success-ful Trading Rule #1 would justify. You can count part of the$6,000 or so you are making in dividends with $200,000 in stockstoward what you can spend on quotes, newspapers, etc., in yourfutures account.
Nearly everyone has a TV and can watch such free programsas the "Nightly Business Report," network news, and "Wall StreetWeek." TV programs are often your best indicator of a near-termtop or bottom because TV's impact is so limited in terms of time.Most people get cable. If you don't have cable, you should considergetting it for the quotes and comments on CNBC's daytime finan-cial program. CNBC's weekend roundtable program of variousfinancial pundits is also a great way to find out the market con-sensus, a consensus that is almost always wrong.
There are two major disadvantages of media trading. Oneis the cost of buying all these periodicals if you don't have anadequate library. And you can't get periodicals, let alone dailypapers, if you live on a mountaintop somewhere.
All of life is choices. If you want to daytrade, you reallyshould move to Chicago or New York and learn how to do it inthe proper venue—the exchange floor. If you want to live in thewilderness, far from any sizable town, you are going to have torely on the price quotes and commentary that comes over yoursatellite dish. If you want the added dimension of media trading,you can't just live anywhere.
Remember the Tribune and The Wall Street Journal article thatoccurred at the very top of the 1993 bean market? If you were afarmer with 100,000 bushels of beans (20 contracts) to sell, itwould have been a very expensive proposition if you got thesepapers only in the mail. Those stories occurred on Friday, July23, 1993. The opening on the August beans was 7.35 a bushelthat day. The following Monday's opening was 7.17. The nextday's opening was 7.095—the highest opening for months tocome. Depending on what time you got the papers in the mail,you could have been up to 25 cents a bushel behind the originalmedia trading signal. A $25,000 difference ain't hay!
A farmer with 100,000 bushels of, soybeans growing in the
225
Chapter Fifteen
field or stored in his elevator has $700,000 (at 7.00 a bushel for cashsoybeans) tied up in inventory. If he sold his growing or storedcrop in the cash-forward market to the local grain elevator, heshould be able to pay his bills and still have plenty of money to golong or short the equivalent amount of beans on the futures market,20 contracts. The margin on 20 contracts of bean futures would beonly around $30,000. Wouldn't it have been better for that farmerto lose the whole $30,000 than to watch his 100,000 bushels of beansdrop $100,000 as the price fell from 7.00 to 6.00 on the cash market,as it did later in 1993?
After getting the number of periodicals appropriate to yourcircumstances, the next step is to learn how to read them. Somethings are obvious. You can read the sports and entertainmentsections later. If you are reading four papers in the morning, youreally only have about 10 minutes for each one before you runinto the all-important openings and the first trading decisionsof the day.
It would be nice to read every pertinent article all the waythrough, but that's not necessary. A lot of people who read TheWall Street Journal, the New York Times, etc., are in the same boatyou are. They are only going to be able to skim the headlinesand the major stories of the day. It's their quick, emotional re-sponse to the news that puts in the tops and bottoms of markets.All you are really looking for is the headlines of stories and thecharts and pictures that accompany them. As the trite-but-truecliche has it, "A picture is worth a thousand words." The bodyof the story may have all the boring details that contradict theheadline and the charts at the front of the story, but few peoplehave the time or the energy to read everything carefully.
There are two styles of newspaper. The Wall Street Journalunder its "What's News" column summarizes most of that pa-per's major stories. The New York Times has the traditional layoutwhere any story summaries are on the second page or the frontof each section, like the business section. This leads us to the firstof my media trading rules:
1. Every important investment turning point gets put on thefront page or the front cover.
226
The Media: The Best Trading indicator
Every important move in the futures market will end up inthe front page of some national newspaper or the front cover ofa major business magazine. Even relatively minor markets likecoffee can get to the front page, as it did recently in the July 11,1994, U.S.A. Today, two days before coffee topped (at least so farin 1994).
2. In all markets, every important top (and most bottoms) getsprominent mention by more than one national media source.
I keep a weekly diary of headlines from the various mediasources segregated into one page each for the trillion-dollarmarkets: currencies, interest rates, stocks, metals, crude complex,and agricultural markets. My sheets for the stock market for theweeks March 28-April 1,1994, and April 2-8, 1994, look like awar zone. I can hardly fit all the references on a single page. Itdoesn't take a genius to see the message the media were sendingout: "Hey, dummy, your stocks are down 10 percent. Don't youthink you'd better do something to protect yourself (like sellout)?" If you have the patience and wait for these obvious signs(front-page headlines, a market featured by every news sourcein a prominent way), you will be well rewarded.
You can, if you wish, weight each story by the size andprestige of the publication, where in the publication it is, etc., tocome up with a media index that will give you the intensity ofeach story. This will also help the more experienced media tradersharpen his or her skills. But the more I see of the media, themore I think this isn't necessary, especially for the novice trader.Just like Pavlov's dogs, the media ring the bell loud and clear attops and bottoms. Your biggest problem is not to be swept upin the emotion and ignore the signal.
For example, I am not thrilled with long-term prospects ofthe stock market. But the media signal of the last week in Marchand the first week of April was so strong you had to go with it.It was an intermediate bottom in the stock market that a futurestrader had to respect, even if the long-term, multiyear trend hadturned down.
3. A media signal is inversely proportional to the extravagance
Chapter Fifteen
of the language used to describe a market event.
Some exaggerated media language is easy to see—like"Bonds Bask in Best of All Worlds" (in the current yield sectionof the January 31,1994, edition of Barren's), or "Like Old Times—An Era of Low Inflation Changes the Calculus for Buyers andSellers," a page A-l headline of the January 14,1994, Wall StreetJournal. But extravagant language goes on all the time in themedia. To check for it, I like to use one paper as a measuringstick.
Many people ask me if there are any common media outletsyou don't fade—investment publications whose headlines aren'talways or usually bad trading advice. My reply is, "If yourlibrary has it displayed in your reading room, you can usually'fade' what it says." If there are any exceptions to this rule, theEconomist magazine of England and Investor's Business Daily arethose exceptions.
I discuss the Economist later in this chapter, but Investor'sBusiness Daily is a very good illustration of Rule #3 above. Thispaper's headlines are usually very precise and accurate, andtypically there is an attempt to get both sides (bull and bear) ofany market—if not in the headlines of one day, at least with aseries of articles over time. Most of the regular features makesense—the futures that rose or fell the most are featured on thefutures page, the bond page is a very accurate description ofwhat moved the bond market that day, etc. Investor's makes agood contrast with the other national and regional papers. Ofcourse, in the rare times it does feature market predictions, In-vestor's is normally as bad as anyone on the street. But it under-stands that its main mission is not to patronize its readers withinvestment pontifications.
4. The more unexpected a headline, the greater the media signal.
If The Wall Street Journal puts soybeans on the front pages,that's unexpected. If the New York Times or U.S.A. Today has abanner headline about stocks on its front page, you can expectat least a minor trend change in stocks usually within three days.On the other hand, if a big stock movement doesn't make the
228
The Media: The Best Trading indicator
front page of The Wall Street Journal the next day (as happened theMonday following a near-100-point drop on Friday February 4,1994), mat's significant. Instead, the Journal had a soothing C-larticle that read, "Most Expect Stock Market to Rebound." To me,this negated the usual long-term implications of a front-page NewYork Times headline on a Dow plunge (this headline also occurredon Saturday, which has a much weaker market impact).
It's pretty rare, but when the media make a howling, obvi-ous error, you can expect a countermove to begin. The headlinesof the June 22, 1994, Wall Street Journal commodity page read:"Gold Hits Highest Levels in 10 months." Any way you look atit—closest-to-cash gold future or the afternoon London gold fix;closing basis or high of the day—gold prices were not at a10-month high. They were several dollars below their January1994 highs. You could blame this on midsummer madness oranother sneak attack of Stan the Floor Trader. In any case, thiswas a top that held for several months.
One of the strongest media signals you can get—because itis so unexpected—is the warning. By warning I don't mean theusual commodity bashing or the attacks on the "barbarous relic,"gold. But if a leading media outlet starts to warn you about thehigh price of either stocks or bonds, it's a sign that a top is faraway. In August 1993, The Wall Street Journal went on a campaignto convince everyone that the bond market was a lousy place tobe. On August 10,1993, an A-l column 6 headline (the strongestthey could run) screamed "Portfolio Surprise: Many AmericansRun Hidden Financial Risk from Derivatives." Then, on August17, another A-l right-hand column: "Managing Risk: CorporateTreasurers Adopt Hedging Plans With Some Wariness." Andfinally, an August 30 A-l right-hand headline: "Inverse Relation-ship: Despite Risks, Many Investors Keep Buying Bond Funds."The lead of the third paragraph read, "Those risks are huge;today, in fact, bonds may be riskier than stocks." Bonds riskierthan stocks! I can't remember a similar statement being made byany leading business publication!
In my opinion, it was no accident this campaign started onAugust 10, just about three weeks before its peak on August 30.
229
Chapter Fifteen
Nor is it a coincidence that bond prices went higher for the nextthree weeks and ultimately peaked six weeks later in October.What are tops made of? Premature bears and angry baby bulls!Nothing was better calculated to send a market higher than theAugust campaign of warnings. Low-capitalized shorts were en-couraged to enter only to be squeezed out. Cautious bulls thatrefrained from buying in August due to the warnings angrilybought twice as much in September and October, furious thatthey had missed a great move and determined not to miss an-other one.
I have a theory of August/early September versus late Sep-tember/early October. The brain of the average investor reachesits most susceptible state in late August/early September. If heisn't on an actual vacation, his reactions have been dulled bylying around in the sun all summer. He is easy prey to sugges-tions, especially those from the media. Then, like a startled sleep-walker, he snaps awake around the fall equinox. His first reactionis to make up for the lethargy of summer with a frenzied burstof action. Since the natural tendency of the investor is to buy,that's what he does.
Gann supposedly claimed that capital and commodity mar-kets tended to top on or around September 22 more often thanany day of the year (a thing to keep in mind as we watch the1994 stock market making a double-top). I don't know whetheror not Gann actually said this, but there is significant evidencethat this is true. On or about September 22, all of the followingoccurred:
* All-time highs in corn (1974), cotton (1973), and gold andsilver stocks (many oil stocks made a peak at the sametime in 1980).
* Peak of Dow-Jones utility index in 1929.
* Secondary peak of gold in 1980, stocks in 1987.
* Major top in soybeans, 1983.
* Date of major devaluation of the pound (1931 and 1992)and major devaluation of the dollar (Plaza Accord of1985).
230
The Media: The Best Trading indicator
# Peak in the bond market for many years (1993).
5. Even when the media tell you the truth about a market, it'snever at the best time to take action.
When The Journal issued its August 1993 warnings aboutthe bond market, it was absolutely correct in pointing the fingerat the derivative market as the primary source of danger in anymarket turnaround. But this correct warning was buried underthe big rise in bonds during September and October, never to beremembered again.
On May 27,1994, The Wall Street Journal commodity pageheadline blared, "Cattle Prices Jump Daily Limit, Bouncing Backfrom a Sharp Drop that May Have Hit Bottom." The next tradingday, the following Tuesday, May 31, cattle hit a top that held forthe next month and a half. But it was true that cattle prices wereonly a few weeks away from what looks now like a multiyearbottom.
On March 28, 1994, the Foreign Exchange section of TheWall Street Journal had a headline of "Antagonism Toward DollarMay Be Due to Fundamentals, Not Fleeting Factors." I think thatwas and is still true, but three days after this report, the U.S.dollar index began a 2.5-basis-point move upward.
The June 1993 Futures magazine printed this very goodpiece of long-term advice: "Commodity Indexes Hint Return ofInflation." Two of the subheadlines were, "Commodity priceshave hit rock bottom," and "My assumption is the downtrendin commodity prices that began in 1980 ended in February 1993."In my opinion, both these statements were true, but it took aboutthree weeks after Futures hit the newsstands and the mailboxesbefore the CRB finally bottomed out for the month and renewedits climb upward.
6. What the media expect almost never happens.
Now we have seen from the last three examples that occa-sionally the media bumble into making a good long-term call.But by far the usual process is just awful market predictions. For
231
Chapter Fifteen
example, the February 18, 1994, Wall Street Journal commoditypage headline was, "Grain Traders Are Anticipating a SpringRally"—a rally that was two months away and which in anycase never exceeded the February 1994 highs in corn.
One more example of failed media expectations appearedon April 1, 1994, with The Wall Street Journal commodity head-line, "Corn Prices Likely to Rise in Wake of Report That FarmersPlan to Plant Less Than Expected"—well, that was a real AprilFooler!
On January 13,1994, The Wall Street Journal commodity pageheadline read, "Grain Prices Are Expected to Shoot Up as USDAReleases Even Bleaker Estimate." This headline came with a cornchart. Of all the grains they could have picked, they ran the chartof the grain that was going to be the weakest of the whole year.Coincidence? Well, you can believe what you want but, as I saidbefore, floor traders pay for their million-dollar exchange seatswith coincidences.
I could have chosen many, many other examples frommany, many other publications, but I am picking on The WallStreet Journal commodity page for a reason. In October 1989 myarticle "The Best Trading Indicator—The Media" came out inTechnical Analysis of Stocks and Commodities magazine. About ayear later, full-page ads began to run advertising a daytradesystem with wonderful profits, low drawdowns, high accuracy,and the simplicity of needing only a newspaper (no charts, nocomputers and software). There are a zillion sure-thing systemsadvertised in every issue of every futures-oriented magazine,but this one caught my eye because it used a quote from myarticle: "If I had only five minutes a day to read one publication,it would be the commodity page of The Wall Street Journal."Intrigued and somewhat annoyed, I politely wrote and asked ifI could see the system since my quote was being used in a waythat implied my endorsement.
I never got a response, but I finally did get a photocopyfrom a friend. Mass copying is the fate of all sure-thing systems.I felt justified in getting a photocopy since my quote had prob-ably sold quite a few systems. Here's what you got for $279:
232
The Media: The Best Trading Indicator
Look at the commodity headline from The Wall StreetJournal. If it was "Gold Rallies Three Dollars on Rus-sian Fears," you sold gold. If it was "Cattle Plunges,"you bought cattle on the opening. To offset the trade,you simply closed out your position on the close.
This is dangerously simplistic and definitely not worth $279(In my humble opinion, you are going to get a lot more fromthis chapter). But the amazing thing was, if you took the worstopening and closing prices (highest opening prices if buying,vice versa for selling) and threw in a $30 commission, the blastedthing about broke even.
7. The indicator the media attack as inaccurate is the indicatoryou should watch. What the media say you should watch, youcan ignore.
During 1994, there has been a continuous chatter from themedia how the CPI overstates inflation and the CRB is a "fickle"gauge of inflation" (in the words of a C-l New York Times articlethat appeared May 25, 1994). The CPI, like every governmentstatistic, is flawed. Alan Greenspan admitted recently that he isfrustrated with the increasingly inaccurate statistics put out bythe government. Many blame this on budget cuts inspired byRonald Reagan.
This free marketer thinks it's the natural consequence of anincreasingly complex modern economy being measured byhorse-and-buggy economists in the Labor Department. Be thatas it may, it's the best indicator we've got, and it does move themarkets. I never saw anybody complain that the CPI overstatedthe downward move of inflation during the bond rallies of the1980s!
8. If there is a "but" in the headline, the market trend continues.
There is one media maxim you can easily check out with acomputer hook-up to media headline data. If you see somethinglike, "Bonds Advance, but...," bonds are going to continue toadvance. If the media excuses away a market action with some
233
Chapter Fifteen
contradictory evidence, it's a strong sign that the market willcontinue in the same direction. "Stocks climb the wall of worry,"is the old market adage. You could also say, "Stocks trip downthe staircase of bullish excuses."
The intensity of the SignalIf what to look at is the first basic problem of media trading, thenthe second major problem is how to judge the intensity of eachmedia signal. Let's use The Wall Street Journal to illustrate intensityin an individual print source.
The following quotes are from Jerry Rosenberg's book Insidethe Wall Street Journal: (NewYork: Macmillan, 1982).
Without question the most widely read portion of TheJournal is the double-column space on its front pagetitled "What's News." The feature had probably led tomore paper sales than any other.... "What's News"takes up two of the six columns on the front page....[The subheadings] "World Wide" and "Business andFinance" have proved to be a boon to busy executives.A quick perusal is sufficient to keep them abreast ofworld events [that The Journal thinks they shouldknowl—G-N.).
Columns one and six and the back-page feature arecalled "leaders...." The demand [is for] 506 leaders ayear.... At vacation times, in early August and earlySeptember, for example, the editors often sweat to getthe leader columns filled. Two weeks later [around thefall equinoxl—G.N.] they may be faced with a horribleglut.
Vermont Royster, who retired from The Journal in1971 [after being their lead editorial writer—G.N.]...madesome interesting comments apropos of the "leader"concept: "I think the newspaper business is alreadymoving in the direction of interpretive reporting.When we first started our leader-type stories, we wereinnovators.... [Now] large metropolitan newspapers
234
The Media: The Best Trading indicator
have adopted this technique.... One of the tasks ofjournalism in the future is to devise ways and meansof backing off a bit from these immediate day-to-daycrises and trying to give them some perspective."[Newspapers have followed the lead of The Wall StreetJournal by shifting from reporting the maximumamount of facts and letting the reader decide theirsignificance to dressing up their editorial bias asnews.—G.N.]
Column six is the weightiest column...generally re-garded as the most important feature...by the page onestaff.... A story that appears in column four...tends tobe lightweight, sometimes given to sheer frivolity.
The fifth column [to those who remember theirhistory, this column is aptly named!—G.N.] of The Jour-nal's front page carries the "special reports..."
The format of The Wall Street Journal is similar to that of allother major newspapers. The top headlines are the most impor-tant—you can almost skip the "What's News" headlines afterthe first article summary. Anything on the right-hand side hasthe strongest impact, while those headlines in the middle are theweakest. Weakest of all are the headlines below the fold in theC-l section—those headlines you have to fold out the newspaperto full length to see at all.
In my weekly diary of headlines of each specific trillion-dollar market, I abbreviate these positions (TR is top right, BLwould be below left, etc.) along with its position in the paper(Com. for commodity page, Forex for the foreign exchange page,etc.). Just start doing it—you'll be amazed how the subtlestshades of headline positioning and wording affects the markets.No formula I can give you, even if it existed, could replace theconfidence and skill you get by seeing how, day after day, themedia give you amazing insight into the strength and directionof the markets.
Originally I thought it would be simple to construct a mediaindex to use as a trading signal. There is something to this
235
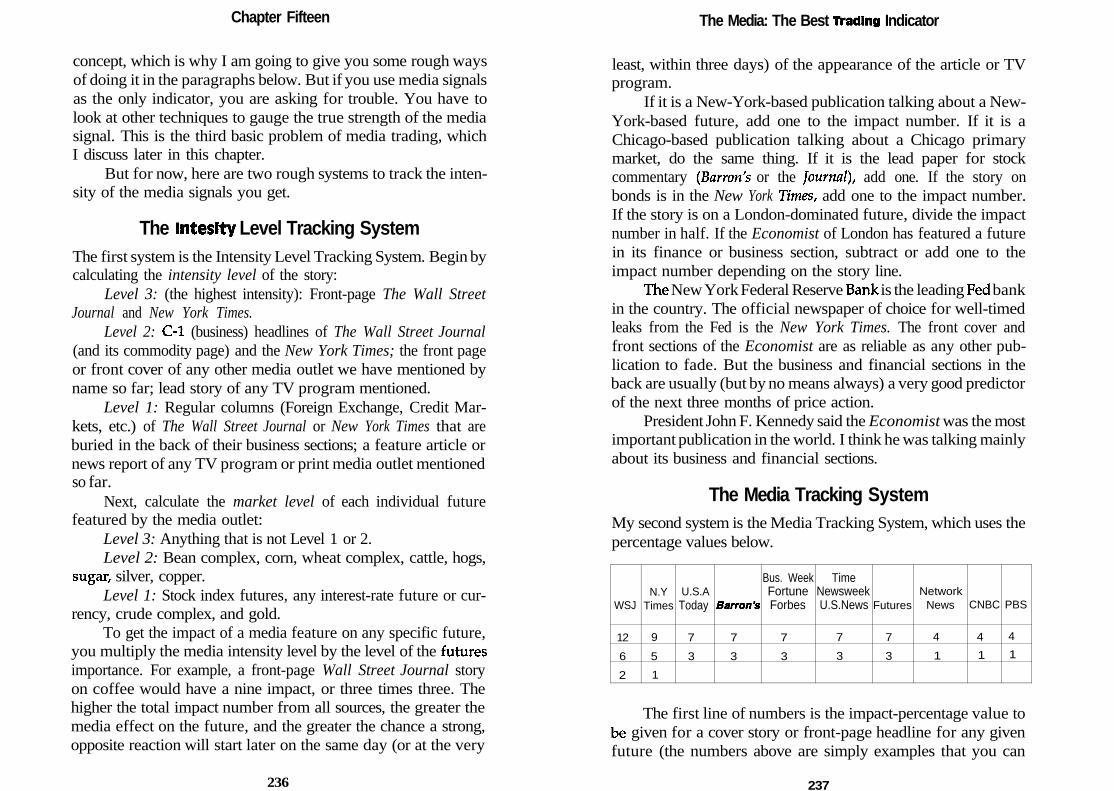
Chapter Fifteen
concept, which is why I am going to give you some rough waysof doing it in the paragraphs below. But if you use media signalsas the only indicator, you are asking for trouble. You have tolook at other techniques to gauge the true strength of the mediasignal. This is the third basic problem of media trading, whichI discuss later in this chapter.
But for now, here are two rough systems to track the inten-sity of the media signals you get.
The inteslty Level Tracking SystemThe first system is the Intensity Level Tracking System. Begin bycalculating the intensity level of the story:
Level 3: (the highest intensity): Front-page The Wall StreetJournal and New York Times.
Level 2: C-l (business) headlines of The Wall Street Journal(and its commodity page) and the New York Times; the front pageor front cover of any other media outlet we have mentioned byname so far; lead story of any TV program mentioned.
Level 1: Regular columns (Foreign Exchange, Credit Mar-kets, etc.) of The Wall Street Journal or New York Times that areburied in the back of their business sections; a feature article ornews report of any TV program or print media outlet mentionedso far.
Next, calculate the market level of each individual futurefeatured by the media outlet:
Level 3: Anything that is not Level 1 or 2.Level 2: Bean complex, corn, wheat complex, cattle, hogs,
sugar, silver, copper.Level 1: Stock index futures, any interest-rate future or cur-
rency, crude complex, and gold.To get the impact of a media feature on any specific future,
you multiply the media intensity level by the level of the futuresimportance. For example, a front-page Wall Street Journal storyon coffee would have a nine impact, or three times three. Thehigher the total impact number from all sources, the greater themedia effect on the future, and the greater the chance a strong,opposite reaction will start later on the same day (or at the very
236
The Media: The Best Trading Indicator
least, within three days) of the appearance of the article or TVprogram.
If it is a New-York-based publication talking about a New-York-based future, add one to the impact number. If it is aChicago-based publication talking about a Chicago primarymarket, do the same thing. If it is the lead paper for stockcommentary (Barren's or the Journal), add one. If the story onbonds is in the New York Times, add one to the impact number.If the story is on a London-dominated future, divide the impactnumber in half. If the Economist of London has featured a futurein its finance or business section, subtract or add one to theimpact number depending on the story line.
The New York Federal Reserve Bank is the leading Fed bankin the country. The official newspaper of choice for well-timedleaks from the Fed is the New York Times. The front cover andfront sections of the Economist are as reliable as any other pub-lication to fade. But the business and financial sections in theback are usually (but by no means always) a very good predictorof the next three months of price action.
President John F. Kennedy said the Economist was the mostimportant publication in the world. I think he was talking mainlyabout its business and financial sections.
The Media Tracking SystemMy second system is the Media Tracking System, which uses thepercentage values below.
WSJ
12
6
2
N.YTimes
9
5
1
U.S.AToday
7
3
Barren's
7
3
Bus. WeekFortuneForbes
7
3
TimeNewsweekU.S.News
7
3
Futures
7
3
NetworkNews
4
1
CNBC
4
1
PBS
4
1
The first line of numbers is the impact-percentage value tobe given for a cover story or front-page headline for any givenfuture (the numbers above are simply examples that you can
237
Chapter Fifteen
fine-tune for each future) for the media outlet above. The secondline is the impact percentage for a major feature article or TVstory after the headlines (for example, a C-l feature in the Journalor Times'). The final line is the impact percentage for a regularfeature of the Times or Journal buried in the back, such as ForeignExchange or Credit Markets. The closer the totals are to 100percent, the greater the media impact.
The Intensity Level System has the virtue of simplicity,while the Media Tracking System can be fine-tuned with eachfuture and where the story is positioned in the media outlet (topright, below middle, is there a chart or picture?, etc.). Have funplaying with the numbers!
Media watching can get overwhelming with all the peri-odicals, but it pays off. Even the New York Times bestseller list(for books) is a great indicator. If the Depression of 1990 is toppingthe list, it's time to load up on stocks and bonds. When Bank-ruptcy 1995 finally drops off the bestseller list (as it did in August1993), a bond top was at the door. The federal government goingbankrupt? Not with Clinton the budget-cutter! Not with thebiggest bull market in bonds in a generation!
In the book News and the Market (Chicago: Regnery, 1974),authors Klein and Prestbo used the following system to weightstories in The Wall Street Journal:
The system we decided upon gave a score of three tothe lead, or top story in both "What's News" columns;a score of two to stories that appear above the fold thatdivides the paper in half horizontally; and a score ofone to stories below the fold. All items in the "What'sNews" columns were graded except the daily statisti-cal summaries of the previous day's market activityand the "Company Notes" items....
The Wall Street Journal carries three feature stories onits daily front page.... Features we deemed potentiallymarket affecting...were given a value of three, the sameas the lead items in the "What's News" columns. Thesystem we used...was simple: stories that seemed to
238
The Media: The Best Trading indicator
be...bullish—were give a plus...bearish stories got a mi-nus...stories that were neutral or indifferent got azero....
Before we embarked on our grading process, we solic-ited the advice of stockbrokers, security analysts, fel-low business journalists, economists, and otherobservers.... We described our grading system to themin general and told them to evaluate (six) items solelyfor their potential impact on stocks....
Of the 146 gradable items in the six issues, our evalu-ations matched the majority of the stockmarket proson 114, or 78 percent. Of the 32 items on which we andthe pros differed, all but three were either scored aszero by our panelists and either plus or minus by us.(pp. 54-55)
Using this system, they tracked the news in The Wall StreetJournal and the 1972 stock market. "The News Index (had)...themost intense and good news coming from late October throughmid-November, when the DJIA posted its most dramatic gains."(p. 98)
The peak of the good-news campaign of 1972 was abouttwo months before the market top in mid-January 1973. Bank-ruptcy 1995 dropped out of the bestseller two months before the1993 top of bonds. The Wall Street Journal's anti-bond campaignstarted two months before the 1993 bond top.
Two months before the 1993 bond top, Jim Bianco sent me anAugust 18,1993, report entitled, "It Wasn't Like This in the 1970s."In it were dozens of price-war stories in the media over the pre-vious six weeks. I guess the idea of the investment firm was toshow how wonderful everything was with inflation. Both Jim andI looked at the report and said, "It's a top (for bonds)."
I could also add that the NASDAQ high was made abouttwo months after the media euphoria ("New Era, Best of AllPossible Worlds") of January 1994.1 guess this two-month mediarule can be considered an offshoot of the three-month segmentof the Rule of Three.
239
Chapter Fifteen
is the signal Long, intermediate, or Short Term?Richard Band, in his wonderful chapter, "I saw it in the New YorkTimes" from his book Contrary Investing for the '90s (New York:St. Martin, 1989), stated that the hardest problem in judging amedia signal is to distinguish primary from intermediate, inter-mediate from short. We can use the Rule of Three, the intensityof the signal, etc., to give us some idea of where a media signalis taking the market. But, at best, that gives us only the outlookfor the next three weeks.
Three weeks is an eternity for most futures traders, butlooking ahead for the next three months or even the next threeyears is necessary to trade effectively. In any case, the Psycho-logical Law of 10/20 Percent says we can't base any more than20 percent of our trading decisions on the media, no matter howgood a signal it is.
So we must fall back on other techniques like AnalogousYear, First through the Even, Inflation- and Currency-AdjustedCharts, etc., to get this longer-term perspective. Let me give youexamples of some of the real-life problems you run into withmedia trading.
The August 31,1987, U.S. News & World Report had a coverof a bucking bull and the caption, "The Bull Market—Time toGet Out?" But in August 1987, U.S. News was the least influentialnews weekly of the three major news weeklies (way below Timeand Newsweek in terms of prestige and readership. In its August10,1987, issue the far more influential Barren's cover had a bullrunning away from a lot of overweight business types with thecaption: "Memo to the Pros: In Case You Haven't Noticed, theBull Market Is Beating the Pants Off You." U.S. News & WorldReport was virtually alone in its warning on stocks.
Today, U.S. News & World Report is probably the leadingnews weekly, now that Time has become more politically cor-rect. Under the leadership of the very-well-connected MortonZuckerman, U.S. News is right on top of the pack: a cover storyof the "Best Mutual Funds" in the February 7,1994, issue anda June 14, 1994, article entitled, "Why Market Bulls AreHeaded for Trouble."
240
The Media: The Best Trading indicator
I've discussed how the February 4, 1994, Saturday front-page headline of the "Plunging Dow" in the New York Times wasmore than negated by the nonchalant way The Wall Street Journaltreated a 96-point Dow drop the following Monday. Investor'sDaily had a small, below-the-fold, front-page article just beforethis Dow collapse talking about how the market might be over-valued. Newsweek in its February 15 issue ran an article "Bewarethe Baby Bull."
But Newsweek has now taken the place of the August 1987U.S. News & World Report as today's least influential newsweekly. And they didn't run it as a cover story, either. At long-term tops in the trillion-dollar markets, you often get a smallminority opinion that is telling you to watch out. But thatshouldn't stop you from using the main media thrust for yoursignal.
In fact, that's one way you can tell what Richard Band callsa primary top from an intermediate top. At primary tops (whichusually aren't a spiked-V, blow-out top), you get some diversityof opinion. At intermediate tops or bottoms (there was an exam-ple of one in stocks during the first week of April 1994), everymedia outlet seems to be leaning one way.
Originally, I was going to end this book with a field trial onhow I would combine the techniques of this book under actualmarket conditions. But now, I think that would be counterproduc-tive. The whole point of this book is to get you to think and getaway from black-box or "my-guru-told-me-to-do-it" trading.
Face it: There are no shortcuts to successful trading. You aregoing to have study hard and then learn (cautiously) by doing.You are going to have to look at the totality of the evidence andmake those lonely trading decisions yourself. If somehow I'vemade that job easier for you, every minute of every hour I spentwriting was worth it to me, whether this book becomes a bigseller or not.
241
index
A-BAmerican Ephemeris, 211analogous year, 179-200, 202Astronomical Almanac, 211Baldwin, Tom, 38, 40,123Band, Richard, 240Barren's, 130,133,161, 224, 237basis, 5bear market, 4, 5Bianco, Jim, 127,130,135,148,179,
182,194Bibliography and Information Source
List, 31bid/ask spread, 20-21Bollinger Bands, 110bonds, 1, 3, 9,10, 20, 84, 85, 86, 87,
89,118,130,135-136,185-186,206, 207, 210
Bureau of Labor Statistics, 155Bush, President, 180,187Business Week, 224
candlestick charts, 60capital appreciation, 1carrying charges, 84-85Carter, President, 185,187,188,190casino mentality, 19
Certified Market Technician (CMT),161
Chart Mysticism, 147,155charts and charting systems, 147-177
currency-adjusted, 160-177inflation-adjusted, 151-160
Chicago Board of Trade, 8,18, 31,32, 46, 47, 55
Chicago Mercantile Exchange, 8,18,31,148
Chicago Tribune, 223, 224, 225clearing firms, 8, 9,10, 31Cleveland, President, 188Clinton, President, 179,180,182,
185,186,187,188,190,193,194,195, 206
closing range, 58. See also Theory ofthe Opening.
CNBC, 119, 225Comex, 31, 84, 92, 217commercial traders, 121-126,135-
137,140-144Commitment of Traders (COT) report,
125,126,127-137Commodity Boot Camp, 55Commodity Futures Trading, a Bio-
graphical Guide, 147Commodity Futures Trading Com-
mission (CFTC), 152Commodity Research Bureau (CRB)
index
index, 125,194Commodity Trend Service, 132commissions, 2, 5, 20, 32, 36compound interest, 40concept investing, 18Constant Dollar Dow, 151,154Consumer Price Index, 155,160Contrary Investing for the '90s, 240Coolidge, President, 187,188corn, 140,141,142,143,144,195,
196,198,199crashes, 3Crash of 1987, 4, 9,16, 32,154currencies, 148,150,151,160-177,
212, 215cycles, 201-214Cycles (book), 201Cycles magazine, 201, 211
D-Edeficit, national bankruptcy and,
191,193Democrats, 180,182,185-188,190Dennis, Richard, 16, 32, 219Dewey, Edward M., 201, 202, 208,
209dividends, 1, 5DTN Wall Street, 119econometrics, 121-122Economist, The (magazine), 224, 228,
237Eisenhower, President, 187,188,191Elliott, R. N., 147,149Elliott Wave Principle, 155Elliott Waves, 150,154,155El Nino, 196-197,198End-of-the-Month Commission
Rule, 82, 83European Currency Unit (ECU), 161expected range, 103-110,118
Federal Register, 190-191Federal Reserve, 150,193Fib Times, 45,111-120
determining, 114-115other routines and, 116
Financial Times of London, 161First American Brokerage, 119floor traders, 7, 25, 35-43, 45-54,
217, 218. See also commitmentof traders report; routine ofthe market; spreads; Theory ofthe Opening.
commercial traders and, 121-126expected range and, 103-110,118fib times and, 111-120
Forbes magazine, 180, 224Fortune magazine, 224Foundation for the Study of Cycles,
202, 211four quadrants, 108-110futures and futures trading, 2, 4, 5,
6, 7, 8. See also floor traders,analogous year and, 179-200charting systems and, 147-177computerized trading and, 37-38cycles and, 201-214expected range and, 103-110media and, 217-241opening systems and, 61-77psychology and, 16,18-19, 22-26,
27-32, 77routine of the market and, 77-100spreads and, 139-146trading systems and, 13-33, 40, 41,
61-63, 64-66zero sum game of, 8
Futures Industry, 38, 40Futures Industry Institute (FII), 132Futures magazine, 41,119,154, 201,
224, 231
Gann, W. D., 147,148, 219, 230gap analysis, 62GDP, 186-187Gelber, Brian, 139Globex, 113gold, 1, 62, 81, 84, 85, 92,100,134,
135,159-160,164, 206, 207gold bugs, 19Goldman Sachs Commodity Index
(GSCI), 194"Great Con Game, The," 13-15
H-I-JHadady, R. Earl, 59Harding, President, 188Hoover, President, 187,188
244
index
index funds, 2inflation, 2, 3,150,151,154,155,
159,190, 215Infoline, 119Initial-Maintenance Opening Rule,
67, 68, 71, 74, 86Inside the Wall Street Journal, 234International Monetary Fund, 161Investor's Business Daily, 224, 228,
241Johnson, Lyndon (LBJ), 187,188July 1st Crop Conditions Report, 87
JC-LKennedy, President (JFK), 179,180,
187,188,191, 237Kitchin cycle, 72, 208-210Kondratieff Wave, 202-203, 204Kovner, Bruce, 52,113,139LeBeau, Charles, 29, 30Lefevre, Edwin, 47, 48, 50, 51, 52, 53Lehman Long-Treasury Index, 148-
149Listen Only Systems, 42Longstreet, Roy, 47, 48, 49, 50, 52, 54lunar cycle, 208, 211, 212Lynch, Peter, 18
moving averages, 108-109moving average system, 21, 29, 30mutual funds, 17
N-ONational Futures Association
(NFA), 132Newsweek, 224, 241New York Stock Exchange, 3, 8New York Times, 223,224, 226, 228,
236, 237, 238, 240Nixon, President, 187,188,194noon balloon, 62, 111OEX option contract, 37Opening Price Statistical Data, 60opening range, 58. See also opening
systems; Theory of the Open-ing.
opening systems, 61-63initial-maintenance opening indica-
tor, 66-67, 69, 71split opening, 63, 65-66
open to the down, 74open to the up, 71, 72, 74options (puts), 4-5, 9, 20, 31order book, 7order filler, 7
M
Marcus, Michael, 51margin, 8, 9, 67margin requirements, 6market advisers, 26market maker, 7Market Wizards, 47, 51,52,139mathematics of investing, 4, 20-21,
103,118,120media trading, 217-219
basics of, 220-221determining what's important,
222-234intensity of signal and, 234-236logistics of, 221-222media tracking system and, 237-
240MidAmerica Exchange, 31, 32,103,
113Montgomery, Paul, 136monthly brokerage effect, 82-83Mount Pinatubo, 197
P-Rpanic formation, 89, 90, 97panics, 3Pinnacle Data, 133pivot point (Pivot), 105-108Prechter, Bob, 154,155premium, 5, 20price-only analysis, 147price stability, 149Producer Price Index, 87Psychological Law of 10/20 Per-
cent, 22, 56,146psychological profile, 27-32public time, 62Pugh, Burton, 212Reagan, President, 187,188,191,
193,194, 233real estate, 1, 3Reminiscences of a Stock Operator, 47,
48, 50, 51, 52, 53Republicans, 185,186,188,194return on investment. See also stocks.
index
Ritchie, Mark, 41Roosevelt, Franklin (FOR), 188Roosevelt, Theodore, 187,188Rosenberg, Jerry, 234routine of the market, 77-78
bull and bear markets and, 83-84carrying charges and, 84-85days and, 80first through the even, 90, 92-93,
97,100,106major reports, 87-90monthly, 80monthly brokerage effect, 82-83quarterly, 80, 81-82Rule of Doubles and, 85-86seasonal patterns, 78, 80time and, 111-120
Rule of Doubles, 85,107Rule of 72, 86Rule of Three, 71, 97,107, 220
return on investment and, 1-4versus options, 4-11volatility and, 6
sugar, 83, 87sunspot cycle, 208, 212
taxes, 2, 7, 22-23,150,187Tchijevsky, A. C, 202Technical Analysis of Stocks and Com-
modities magazine, 218, 232Technical Trader Bulletin, 29"Texas hedge," 62Theory of the Opening, 45, 55-75The 3/21-Day Memory Law, 24, 25-
26, 71, 220Time magazine, 224, 240transaction costs, 2"Tricks of the Trader" seminars, 55Truth of the Stock Tape, 219
Saliba, Tony, 139S&P 500,1, 2, 6, 20, 30, 42, 83,117,
119Schwager, Jack, 47, 48short-selling, 4, 5Smith, Gary, 119,120Social Security effect, 81software, futures, 122,133, 211Soros, George, 124soybeans, 61, 63, 65, 67, 69, 72, 74,
87-88, 93,170Special Drawing Rights (SDR), 161specialists, 7, 8, 20, 25, 35Speculative Top, 205split opening. See opening systems,spreads, 139-146spy satellites, 123Steinhardt, Michael, 48stockbrokers, 1,17Stocks & Commodities magazine, 117stocks and stock market, 20, 35, 36,
37,188,190, 210
ir-v-w-xU.S.A. Today, 223, 224, 228USDA Pig Crop Report, 87U.S. dollar index, 162U.S. News & World Report, 224, 240Viewpoints of a Commodity Trader, 47,
49, 50, 52, 54Wall Street Journal, The, 30, 97,123,
130,133,134,161, 218, 219,222, 223, 225, 226, 228, 229,231, 232, 233, 234, 235, 236,237, 238, 239, 241
Wal-Mart, 18weak hands formation, 89, 90Weintraub, Neal, 18, 32, 48, 55, 81,
119wheat, 140-142Wilson, President, 187,188,188Wright, Charles, 118Xerox, 18
246
Cashing InOn the
WinningStrategies of
Floor Traders,Commercials
& MarketInsiders Grant Noble
The Trader's Edge(lash in on the winning strategies of floor traders, commercials,
and market insiders.
Above all else, one fact is clear in the futures industry: a
small group of traders regularly win. while the vast majority
regularly lose. Indeed, the How of money to winners from
losers is so consistent that it's as if the losers pay ''salaries"
to the winners.
Wouldn't you like to know why winners win and losers lose?
Equipped with this knowledge, wouldn't trading be a lot
The Trader's Edge tells you exactly that.
Written by veteran futures trader Grant Noble, the book
identifies the three groups of traders who consistently win :
floor traders, commercials, and market insiders. As Noble
e x p l a i n s , the th ree groups share one impor tant
characteristic besides being winners: they all have an edge
that gives them a competitive advantage over the majority
of other traders. Showing you how to replicate that "edge"
is what The Trader's Edge is all about.
Filled with techniques used by real winners. 77ic Trader's
Edge wi l l show you:
How floor traders exploit the routines ol the markets.
How to track the activity of big commercial traders.
Discover the sources of "inside" information.
How to use spreads to reduce risk, just like the biggest
traders.
Understand why the opening is the most critical part ol
the trading day.
D i s c o v e r how to j u d i c i o u s l y "fade" media hype.
The Trader's Edge is filled wi th nuggets of inside, practical
information that are derived from actual market act ivi ty .