terrestrial laser scanner and close range photogrammetry ... · the error! reference source not...
TRANSCRIPT
Terrestrial Laser Scanner and Close Range Photogrammetry point clouds
accuracy assessment for the structure deformations monitoring
Gian Luigi DEIANA, Andrea DESSI’, Fausto MISTRETTA, Giannina SANNA, Flavio
STOCHINO, Enrico URRU, Giuseppina VACCA, Monica VALDES,
ITALY
Key words: Terrestrial laser scanner, close range photogrammetry, displacements, SfM, point
clouds modelling
SUMMARY
In this paper we show the results of several tests carried out using methods and instrumentation
typical of an architectural survey, along with a set of metrological instrumentation, on a
Reinforced Concrete (RC) beam subjected to increasing loads. The goal was to assess the
accuracy in the displacements estimated by a medium quality terrestrial laser scanner (TLS)
Focus 3d from Faro Technologies, and the low-cost digital camera Canon PowerShot S110 used
in a Close Range Photogrammetry (CRP) survey. The software used for scan-data and point
clouds processing was Reconstructor JRC Software v. 3.1.0, maintained by Gexcel Ltd, while
the images processing was performed with the software Photoscan from Agisoft, which
implements Structure from Motion (SfM) approach. Two processing strategies were used in the
point clouds comparison: mesh2mesh and modelling the beam behavior fitting the contours of
the beam with second order polynomials.
Comparisons between the TLS and CRP techniques and the metrological equipment used in
parallel highlighted the limits and potentialities of the two geomatic techniques used. It has
been shown that modeling the behavior of the beam leads to significantly better results than
using the mesh2mesh comparison. For the CRP the increase in accuracy was in the order of
40%, while for the TLS of 50%.
Terrestrial Laser Scanner and Close Range Photogrammetry point clouds accuracy assessment for the structure
deformations monitoring (10113)
Giuseppina Vacca and Giannina Sanna (Italy)
FIG Working Week 2019
Geospatial information for a smarter life and environmental resilience
Hanoi, Vietnam, April 22–26, 2019
Terrestrial Laser Scanner and Close Range Photogrammetry point clouds
accuracy assessment for the structure deformations monitoring
Gian Luigi DEIANA, Andrea DESSI’, Fausto MISTRETTA, Giannina SANNA, Flavio
STOCHINO, Enrico URRU, Giuseppina VACCA, Monica VALDES,
ITALY
1. INTRODUCTION
The recent event of the “Ponte Morandi” collapse raised again the need in Italy for the
monitoring of road infrastructures or even old historical structures to save the assets and ensure
adequate safety levels. In the same way the last earthquake near Amatrice made ruins of
hundreds of houses leaving a couple of firemen with the task of declare accessible the houses
still standing.
In order to handle the problem, we need to make accessible, to more engineers than a few high
skilled technicians, instrumentation and surveying methods able to estimate structural
deformation with enough reliability to guarantee a correct interpretation of structures behavior.
To this end we wonder if the new surveying instrumentations, as ultimate Terrestrial Laser
Scanners (TLS), together with user friendly new software based on Structure from Motion
(SfM) algorithms, used in Close Range Photogrammetry (CRP), able to return the 3d model of
even very complex compounds [1], could be used not only to generate realistic 3d model, but
even to give information as overall damage, cracks aperture or amount of displacements. The
last information, indeed, spanning from a few tenths of a millimeter to several millimeters or
even few centimeters, is more in the field of metrology, or in the specialized high precision
geodetic surveying then in architectural surveying [2]. Nevertheless, in this paper we put the
question “What confidence can we put on the metrical component of 3d models?” or “is it
possible to infer information about the stability of a building picking some points on the 3d
model and comparing them with a reference state or a CAD model?” The answer is highly
dependent on the combination of instrumentation used to make measurements, the specific
software and the strategy applied in displacement assessment [3].
To give an answer we did several tests using methods and instrumentation typical of an
architectural survey, along with a set of metrological instrumentation, on a Reinforced Concrete
beam subjected to increasing loads. The goal was to assess the accuracy in the displacements
estimated by a medium quality terrestrial laser scanner Focus 3d from Faro Technologies, and
the low-cost digital camera Canon PowerShot S110. Both equipment return dense point clouds
from which information can be retrieved. The software used for scan-data processing was
Reconstructor JRC Software v. 3.1.0, maintained by Gexcel Ltd, while the images processing
was performed with the software Photoscan [4] from Agisoft, which implements Structure from
Motion (SfM) approach [5].
2. INSTRUMENTATION
The aim of this work is to test the accuracy and precision achieved with a Terrestrial Laser
Scanner (TLS) and a low-cost CRP system, for the measurements of structure displacements.
Terrestrial Laser Scanner and Close Range Photogrammetry point clouds accuracy assessment for the structure
deformations monitoring (10113)
Giuseppina Vacca and Giannina Sanna (Italy)
FIG Working Week 2019
Geospatial information for a smarter life and environmental resilience
Hanoi, Vietnam, April 22–26, 2019
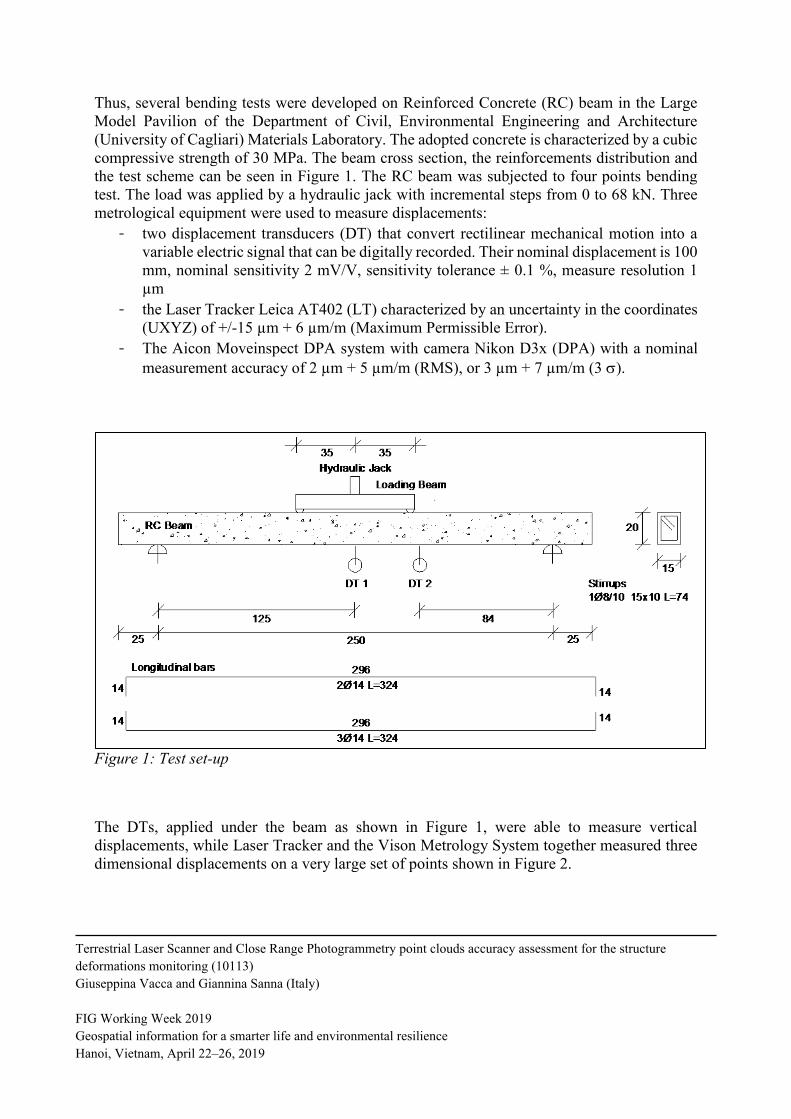
Thus, several bending tests were developed on Reinforced Concrete (RC) beam in the Large
Model Pavilion of the Department of Civil, Environmental Engineering and Architecture
(University of Cagliari) Materials Laboratory. The adopted concrete is characterized by a cubic
compressive strength of 30 MPa. The beam cross section, the reinforcements distribution and
the test scheme can be seen in Figure 1. The RC beam was subjected to four points bending
test. The load was applied by a hydraulic jack with incremental steps from 0 to 68 kN. Three
metrological equipment were used to measure displacements:
- two displacement transducers (DT) that convert rectilinear mechanical motion into a
variable electric signal that can be digitally recorded. Their nominal displacement is 100
mm, nominal sensitivity 2 mV/V, sensitivity tolerance ± 0.1 %, measure resolution 1
µm
- the Laser Tracker Leica AT402 (LT) characterized by an uncertainty in the coordinates
(UXYZ) of +/-15 µm + 6 µm/m (Maximum Permissible Error).
- The Aicon Moveinspect DPA system with camera Nikon D3x (DPA) with a nominal
measurement accuracy of 2 µm + 5 µm/m (RMS), or 3 µm + 7 µm/m (3 ).
Figure 1: Test set-up
The DTs, applied under the beam as shown in Figure 1, were able to measure vertical
displacements, while Laser Tracker and the Vison Metrology System together measured three
dimensional displacements on a very large set of points shown in Figure 2.
Terrestrial Laser Scanner and Close Range Photogrammetry point clouds accuracy assessment for the structure
deformations monitoring (10113)
Giuseppina Vacca and Giannina Sanna (Italy)
FIG Working Week 2019
Geospatial information for a smarter life and environmental resilience
Hanoi, Vietnam, April 22–26, 2019
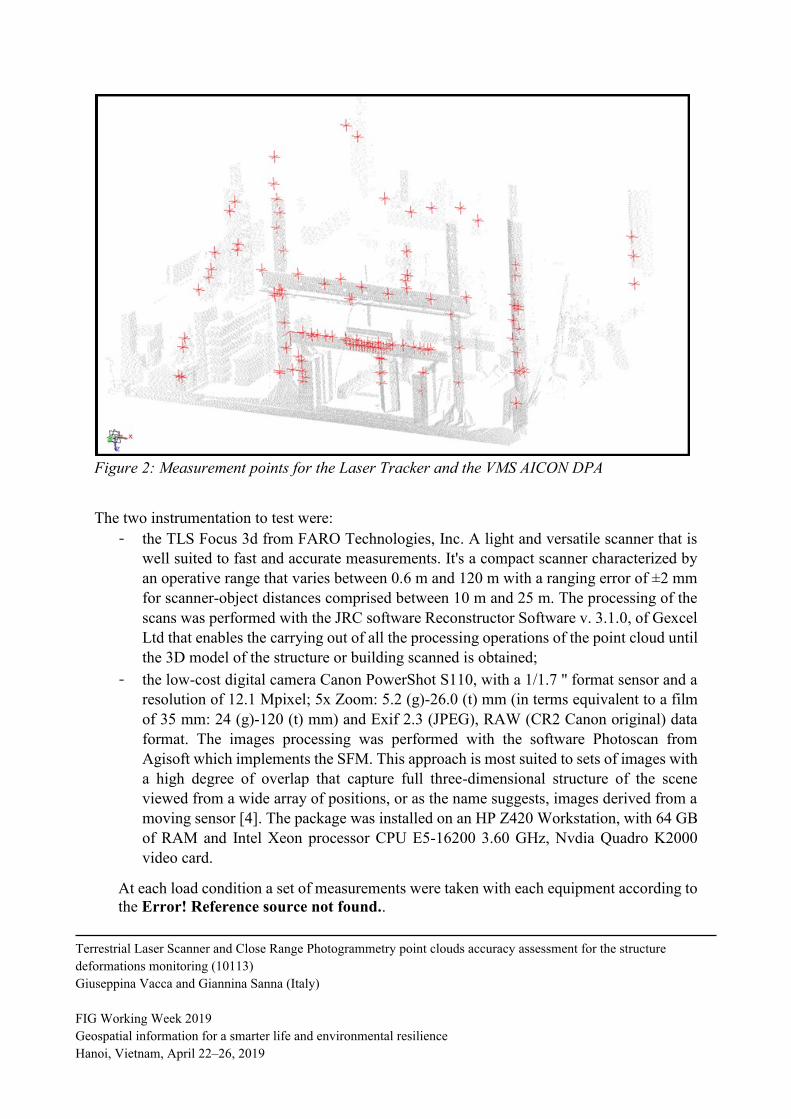
Figure 2: Measurement points for the Laser Tracker and the VMS AICON DPA
The two instrumentation to test were:
- the TLS Focus 3d from FARO Technologies, Inc. A light and versatile scanner that is
well suited to fast and accurate measurements. It's a compact scanner characterized by
an operative range that varies between 0.6 m and 120 m with a ranging error of ±2 mm
for scanner-object distances comprised between 10 m and 25 m. The processing of the
scans was performed with the JRC software Reconstructor Software v. 3.1.0, of Gexcel
Ltd that enables the carrying out of all the processing operations of the point cloud until
the 3D model of the structure or building scanned is obtained;
- the low-cost digital camera Canon PowerShot S110, with a 1/1.7 '' format sensor and a
resolution of 12.1 Mpixel; 5x Zoom: 5.2 (g)-26.0 (t) mm (in terms equivalent to a film
of 35 mm: 24 (g)-120 (t) mm) and Exif 2.3 (JPEG), RAW (CR2 Canon original) data
format. The images processing was performed with the software Photoscan from
Agisoft which implements the SFM. This approach is most suited to sets of images with
a high degree of overlap that capture full three-dimensional structure of the scene
viewed from a wide array of positions, or as the name suggests, images derived from a
moving sensor [4]. The package was installed on an HP Z420 Workstation, with 64 GB
of RAM and Intel Xeon processor CPU E5-16200 3.60 GHz, Nvdia Quadro K2000
video card.
At each load condition a set of measurements were taken with each equipment according to
the Error! Reference source not found..
Terrestrial Laser Scanner and Close Range Photogrammetry point clouds accuracy assessment for the structure
deformations monitoring (10113)
Giuseppina Vacca and Giannina Sanna (Italy)
FIG Working Week 2019
Geospatial information for a smarter life and environmental resilience
Hanoi, Vietnam, April 22–26, 2019
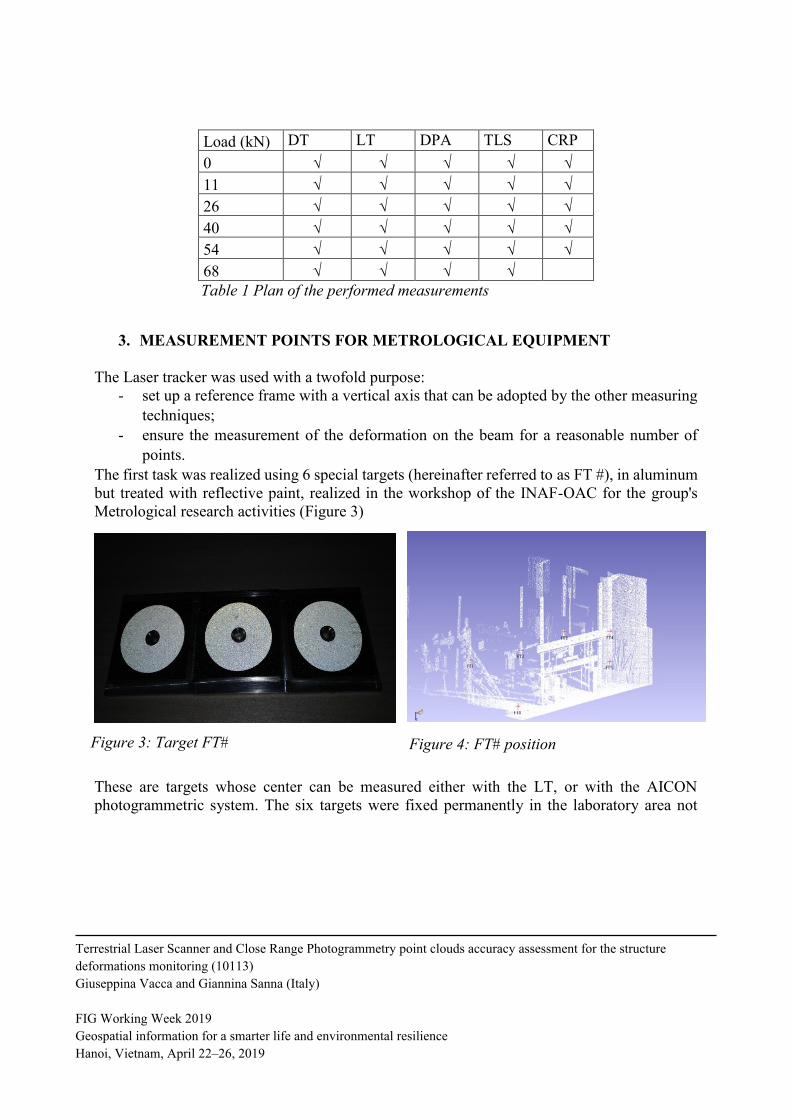
Load (kN) DT LT DPA TLS CRP
0 √ √ √ √ √
11 √ √ √ √ √
26 √ √ √ √ √
40 √ √ √ √ √
54 √ √ √ √ √
68 √ √ √ √ Table 1 Plan of the performed measurements
3. MEASUREMENT POINTS FOR METROLOGICAL EQUIPMENT
The Laser tracker was used with a twofold purpose:
- set up a reference frame with a vertical axis that can be adopted by the other measuring
techniques;
- ensure the measurement of the deformation on the beam for a reasonable number of
points.
The first task was realized using 6 special targets (hereinafter referred to as FT #), in aluminum
but treated with reflective paint, realized in the workshop of the INAF-OAC for the group's
Metrological research activities (Figure 3)
These are targets whose center can be measured either with the LT, or with the AICON
photogrammetric system. The six targets were fixed permanently in the laboratory area not
Figure 3: Target FT# Figure 4: FT# position
Terrestrial Laser Scanner and Close Range Photogrammetry point clouds accuracy assessment for the structure
deformations monitoring (10113)
Giuseppina Vacca and Giannina Sanna (Italy)
FIG Working Week 2019
Geospatial information for a smarter life and environmental resilience
Hanoi, Vietnam, April 22–26, 2019
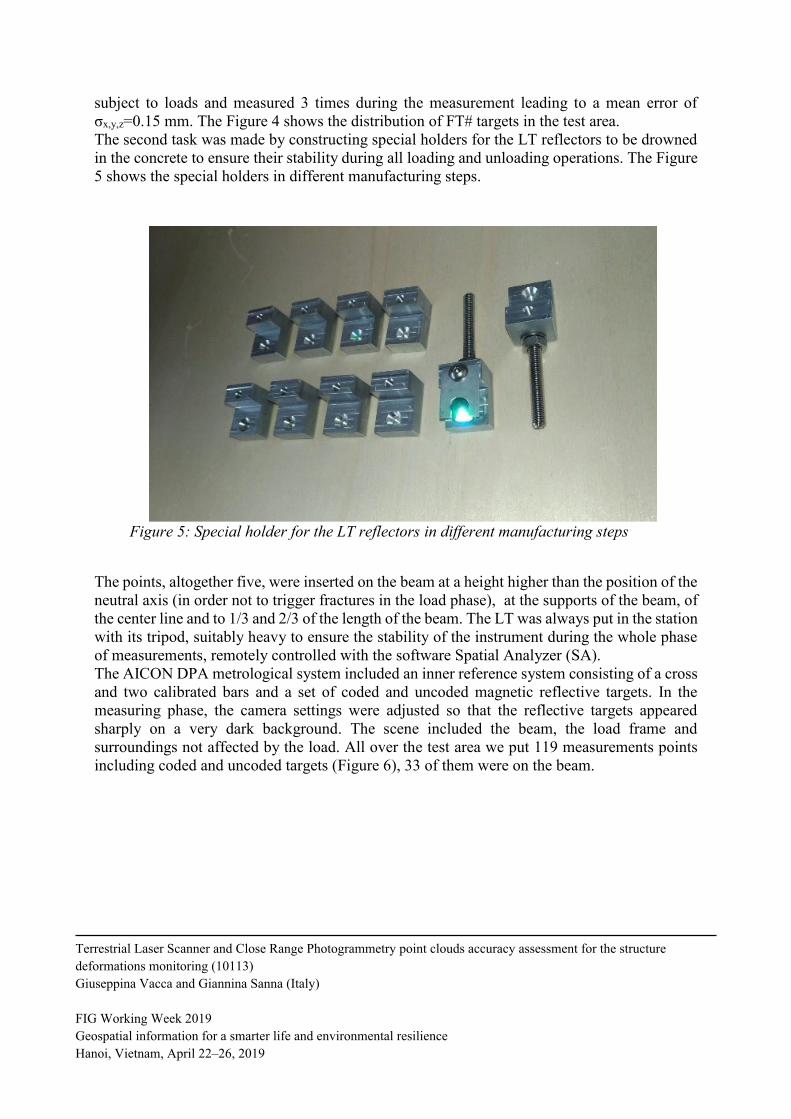
subject to loads and measured 3 times during the measurement leading to a mean error of
σx,y,z=0.15 mm. The Figure 4 shows the distribution of FT# targets in the test area.
The second task was made by constructing special holders for the LT reflectors to be drowned
in the concrete to ensure their stability during all loading and unloading operations. The Figure
5 shows the special holders in different manufacturing steps.
The points, altogether five, were inserted on the beam at a height higher than the position of the
neutral axis (in order not to trigger fractures in the load phase), at the supports of the beam, of
the center line and to 1/3 and 2/3 of the length of the beam. The LT was always put in the station
with its tripod, suitably heavy to ensure the stability of the instrument during the whole phase
of measurements, remotely controlled with the software Spatial Analyzer (SA).
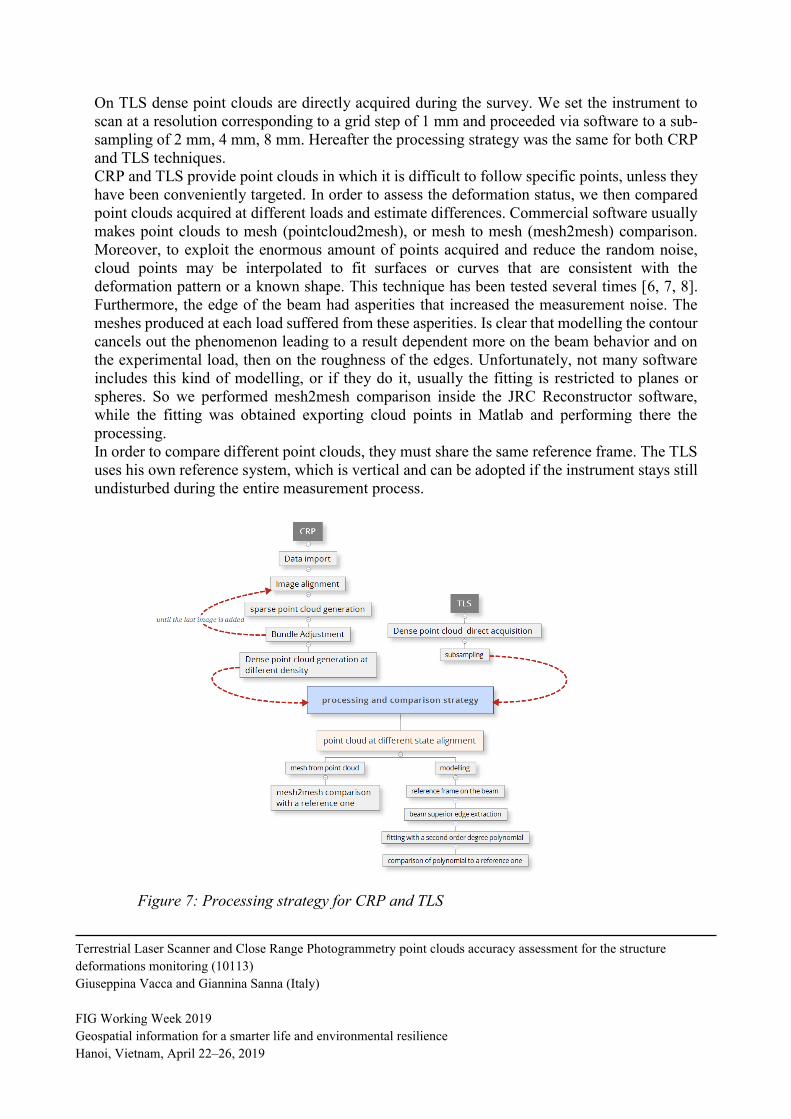
The AICON DPA metrological system included an inner reference system consisting of a cross
and two calibrated bars and a set of coded and uncoded magnetic reflective targets. In the
measuring phase, the camera settings were adjusted so that the reflective targets appeared
sharply on a very dark background. The scene included the beam, the load frame and
surroundings not affected by the load. All over the test area we put 119 measurements points
including coded and uncoded targets (Figure 6), 33 of them were on the beam.
Figure 5: Special holder for the LT reflectors in different manufacturing steps
Terrestrial Laser Scanner and Close Range Photogrammetry point clouds accuracy assessment for the structure
deformations monitoring (10113)
Giuseppina Vacca and Giannina Sanna (Italy)
FIG Working Week 2019
Geospatial information for a smarter life and environmental resilience
Hanoi, Vietnam, April 22–26, 2019
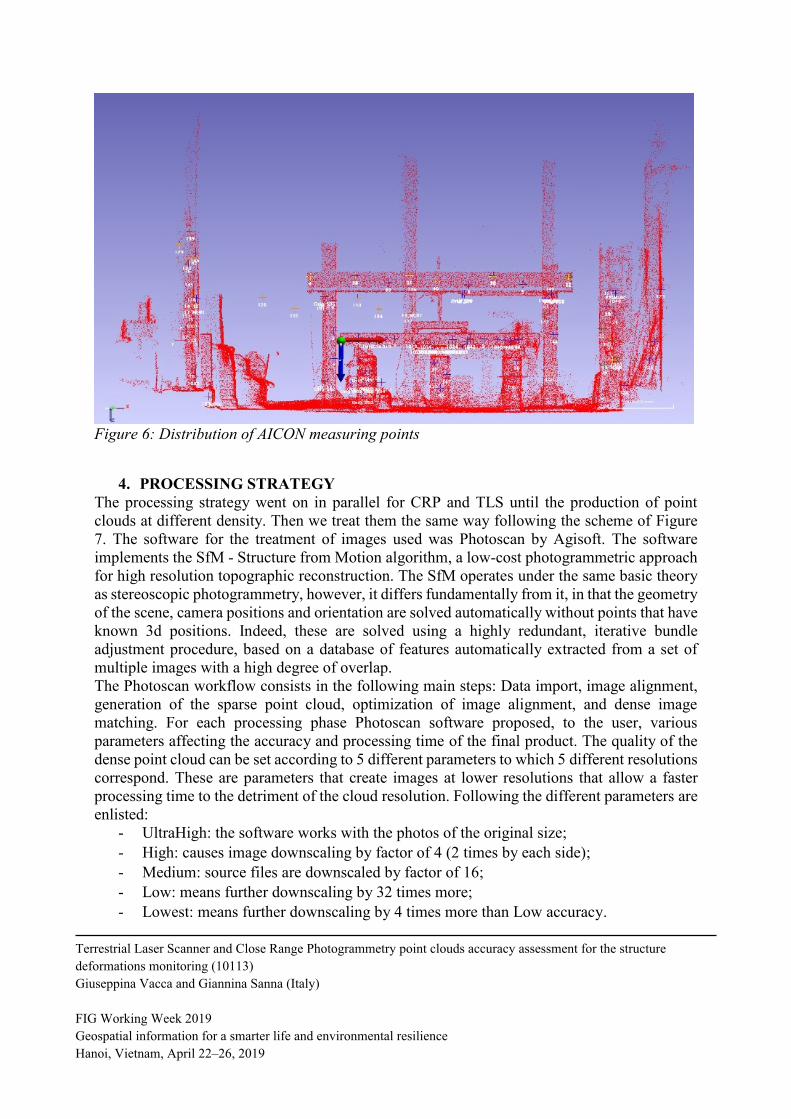
Figure 6: Distribution of AICON measuring points
4. PROCESSING STRATEGY
The processing strategy went on in parallel for CRP and TLS until the production of point
clouds at different density. Then we treat them the same way following the scheme of Figure
7. The software for the treatment of images used was Photoscan by Agisoft. The software
implements the SfM - Structure from Motion algorithm, a low-cost photogrammetric approach
for high resolution topographic reconstruction. The SfM operates under the same basic theory
as stereoscopic photogrammetry, however, it differs fundamentally from it, in that the geometry
of the scene, camera positions and orientation are solved automatically without points that have
known 3d positions. Indeed, these are solved using a highly redundant, iterative bundle
adjustment procedure, based on a database of features automatically extracted from a set of
multiple images with a high degree of overlap.
The Photoscan workflow consists in the following main steps: Data import, image alignment,
generation of the sparse point cloud, optimization of image alignment, and dense image
matching. For each processing phase Photoscan software proposed, to the user, various
parameters affecting the accuracy and processing time of the final product. The quality of the
dense point cloud can be set according to 5 different parameters to which 5 different resolutions
correspond. These are parameters that create images at lower resolutions that allow a faster
processing time to the detriment of the cloud resolution. Following the different parameters are
enlisted:
- UltraHigh: the software works with the photos of the original size;
- High: causes image downscaling by factor of 4 (2 times by each side);
- Medium: source files are downscaled by factor of 16;
- Low: means further downscaling by 32 times more;
- Lowest: means further downscaling by 4 times more than Low accuracy.
Terrestrial Laser Scanner and Close Range Photogrammetry point clouds accuracy assessment for the structure
deformations monitoring (10113)
Giuseppina Vacca and Giannina Sanna (Italy)
FIG Working Week 2019
Geospatial information for a smarter life and environmental resilience
Hanoi, Vietnam, April 22–26, 2019
On TLS dense point clouds are directly acquired during the survey. We set the instrument to
scan at a resolution corresponding to a grid step of 1 mm and proceeded via software to a sub-
sampling of 2 mm, 4 mm, 8 mm. Hereafter the processing strategy was the same for both CRP
and TLS techniques.
CRP and TLS provide point clouds in which it is difficult to follow specific points, unless they
have been conveniently targeted. In order to assess the deformation status, we then compared
point clouds acquired at different loads and estimate differences. Commercial software usually
makes point clouds to mesh (pointcloud2mesh), or mesh to mesh (mesh2mesh) comparison.
Moreover, to exploit the enormous amount of points acquired and reduce the random noise,
cloud points may be interpolated to fit surfaces or curves that are consistent with the
deformation pattern or a known shape. This technique has been tested several times [6, 7, 8].
Furthermore, the edge of the beam had asperities that increased the measurement noise. The
meshes produced at each load suffered from these asperities. Is clear that modelling the contour
cancels out the phenomenon leading to a result dependent more on the beam behavior and on
the experimental load, then on the roughness of the edges. Unfortunately, not many software
includes this kind of modelling, or if they do it, usually the fitting is restricted to planes or
spheres. So we performed mesh2mesh comparison inside the JRC Reconstructor software,
while the fitting was obtained exporting cloud points in Matlab and performing there the
processing.
In order to compare different point clouds, they must share the same reference frame. The TLS
uses his own reference system, which is vertical and can be adopted if the instrument stays still
undisturbed during the entire measurement process.
Figure 7: Processing strategy for CRP and TLS
Terrestrial Laser Scanner and Close Range Photogrammetry point clouds accuracy assessment for the structure
deformations monitoring (10113)
Giuseppina Vacca and Giannina Sanna (Italy)
FIG Working Week 2019
Geospatial information for a smarter life and environmental resilience
Hanoi, Vietnam, April 22–26, 2019
Otherwise the following procedure could be adopted:
- Extraction, from point clouds, of portions relative to test areas not subject to movement;
- co-registering of all these portions with respect to one fixed as reference;
- application of the rotation matrix to the whole scene.
Point clouds generated by photogrammetric measurements instead come with an arbitrary
reference frame and an arbitrary scale of the model. We used, as control points, the same 6
points used to fix the reference frame for the DPA measurements which provided both reference
frame and model scale. When acquiring images for 3d models, control points are measured with
a total station or GNSS instrumentation, so the scale of the model, which is crucial when
assessing deformations, is affected by an uncertainty depending on the precision of the
topographic survey, which is certainly lower that that obtained in our experiment. To reduce
the error on scale factor two or more calibrated bars can be used on the field, improving the
reference frame fixing using the same strategy we suggested for TLS scans.
As already said, on point clouds two kind of processing were investigated:
- mesh2mesh comparison;
- modelling of the profile of the beam at each load with second order polynomials and
comparison of the curve.
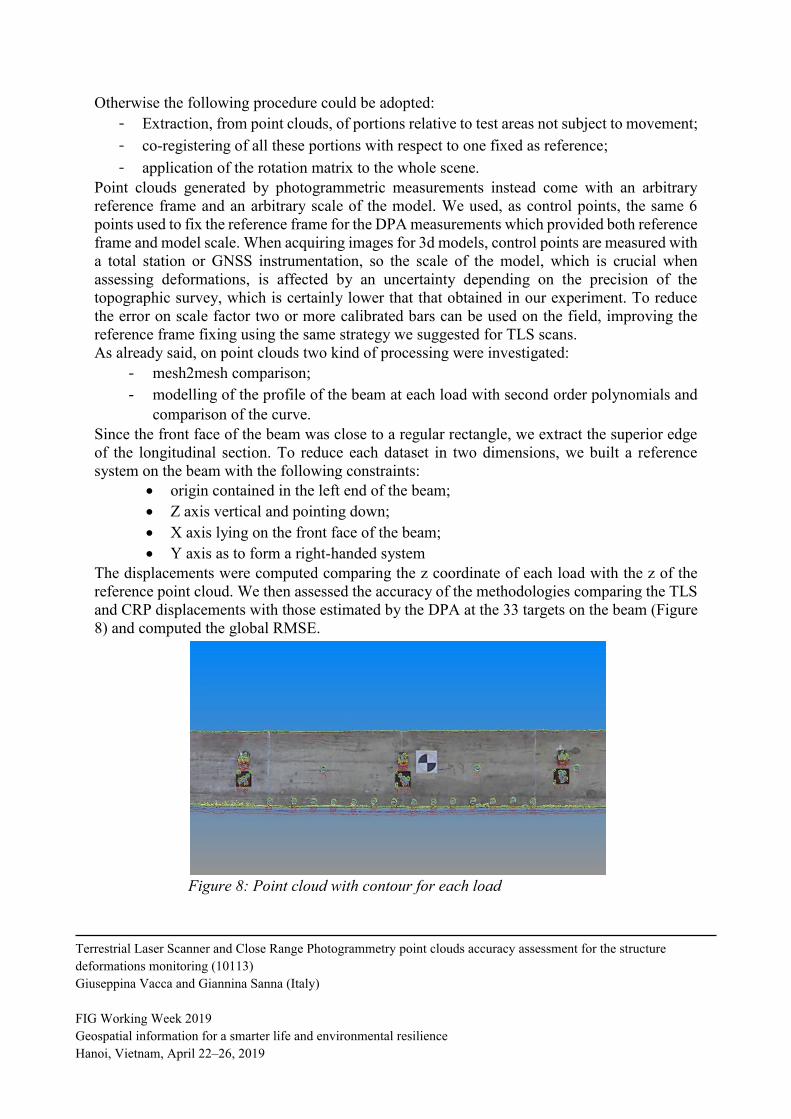
Since the front face of the beam was close to a regular rectangle, we extract the superior edge
of the longitudinal section. To reduce each dataset in two dimensions, we built a reference
system on the beam with the following constraints:
• origin contained in the left end of the beam;
• Z axis vertical and pointing down;
• X axis lying on the front face of the beam;
• Y axis as to form a right-handed system
The displacements were computed comparing the z coordinate of each load with the z of the
reference point cloud. We then assessed the accuracy of the methodologies comparing the TLS
and CRP displacements with those estimated by the DPA at the 33 targets on the beam (Figure
8) and computed the global RMSE.
Figure 8: Point cloud with contour for each load
Terrestrial Laser Scanner and Close Range Photogrammetry point clouds accuracy assessment for the structure
deformations monitoring (10113)
Giuseppina Vacca and Giannina Sanna (Italy)
FIG Working Week 2019
Geospatial information for a smarter life and environmental resilience
Hanoi, Vietnam, April 22–26, 2019
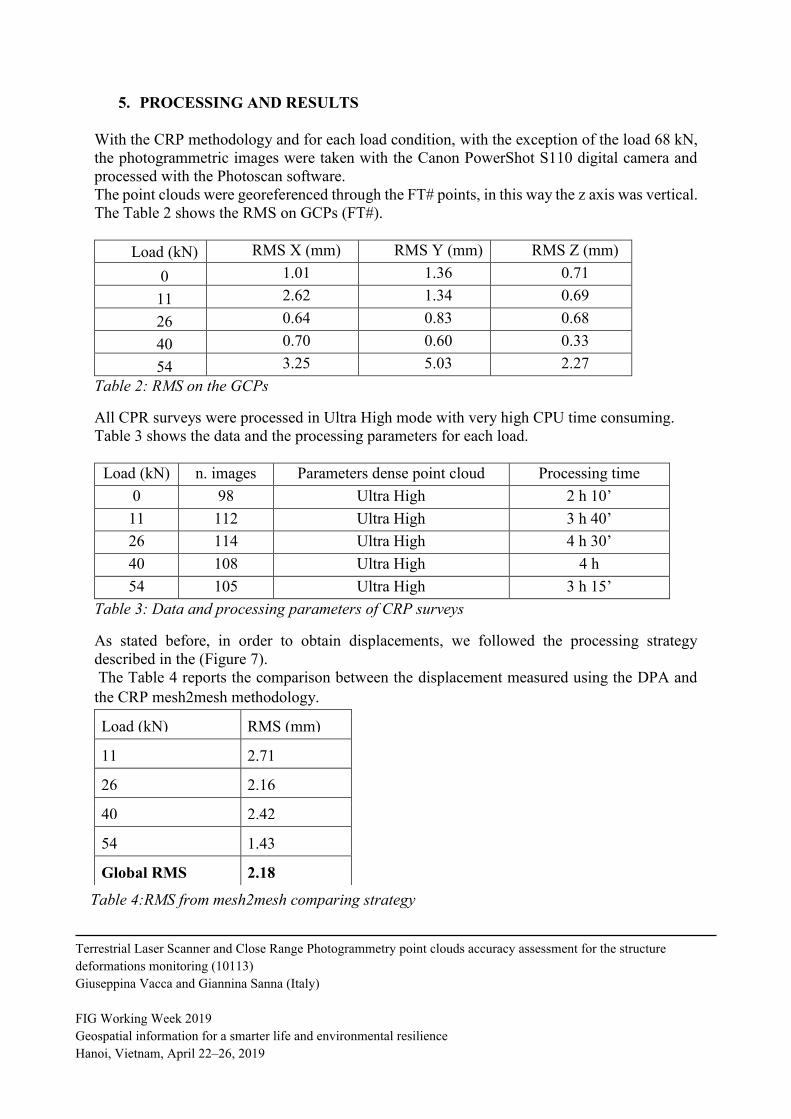
5. PROCESSING AND RESULTS
With the CRP methodology and for each load condition, with the exception of the load 68 kN,
the photogrammetric images were taken with the Canon PowerShot S110 digital camera and
processed with the Photoscan software.
The point clouds were georeferenced through the FT# points, in this way the z axis was vertical.
The Table 2 shows the RMS on GCPs (FT#).
Load (kN) RMS X (mm) RMS Y (mm) RMS Z (mm)
0 1.01 1.36 0.71
11 2.62 1.34 0.69
26 0.64 0.83 0.68
40 0.70 0.60 0.33
54 3.25 5.03 2.27
Table 2: RMS on the GCPs
All CPR surveys were processed in Ultra High mode with very high CPU time consuming.
Table 3 shows the data and the processing parameters for each load.
Load (kN) n. images Parameters dense point cloud Processing time
0 98 Ultra High 2 h 10’
11 112 Ultra High 3 h 40’
26 114 Ultra High 4 h 30’
40 108 Ultra High 4 h
54 105 Ultra High 3 h 15’
Table 3: Data and processing parameters of CRP surveys
As stated before, in order to obtain displacements, we followed the processing strategy
described in the (Figure 7).
The Table 4 reports the comparison between the displacement measured using the DPA and
the CRP mesh2mesh methodology.
Load (kN) RMS (mm)
11 2.71
26 2.16
40 2.42
54 1.43
Global RMS 2.18
Table 4:RMS from mesh2mesh comparing strategy
Terrestrial Laser Scanner and Close Range Photogrammetry point clouds accuracy assessment for the structure
deformations monitoring (10113)
Giuseppina Vacca and Giannina Sanna (Italy)
FIG Working Week 2019
Geospatial information for a smarter life and environmental resilience
Hanoi, Vietnam, April 22–26, 2019
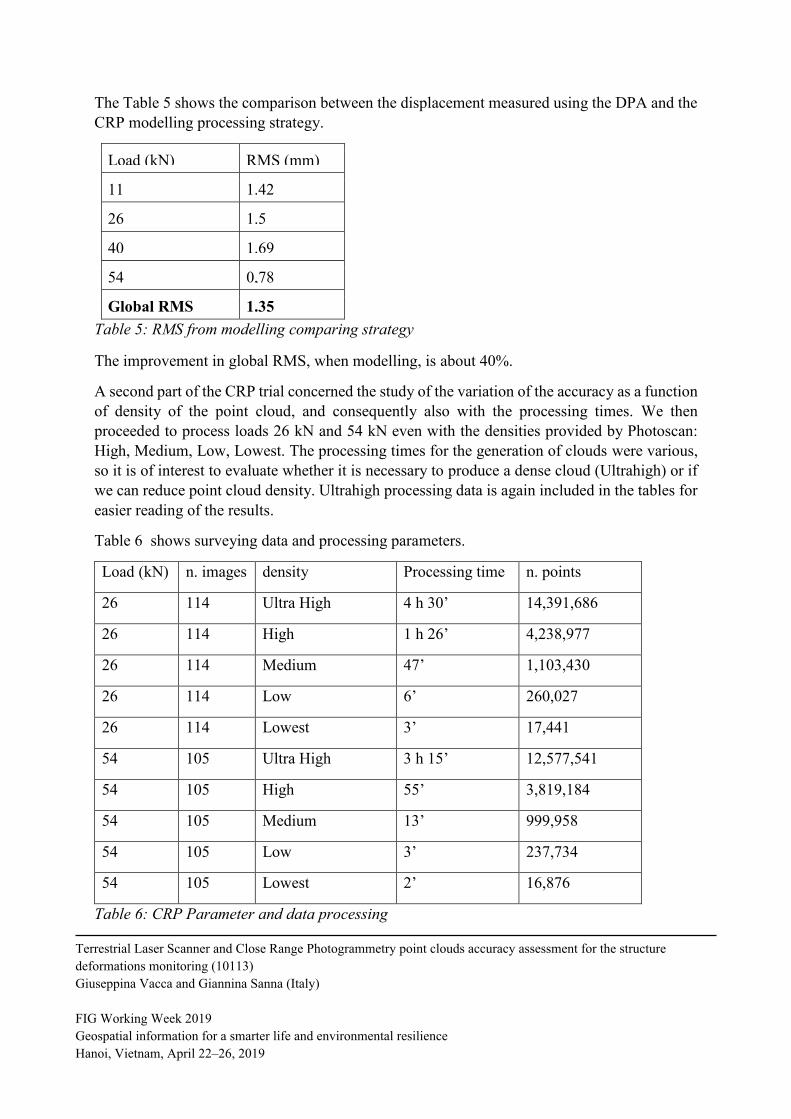
The Table 5 shows the comparison between the displacement measured using the DPA and the
CRP modelling processing strategy.
Load (kN) RMS (mm)
11 1.42
26 1.5
40 1.69
54 0,78
Global RMS 1.35
Table 5: RMS from modelling comparing strategy
The improvement in global RMS, when modelling, is about 40%.
A second part of the CRP trial concerned the study of the variation of the accuracy as a function
of density of the point cloud, and consequently also with the processing times. We then
proceeded to process loads 26 kN and 54 kN even with the densities provided by Photoscan:
High, Medium, Low, Lowest. The processing times for the generation of clouds were various,
so it is of interest to evaluate whether it is necessary to produce a dense cloud (Ultrahigh) or if
we can reduce point cloud density. Ultrahigh processing data is again included in the tables for
easier reading of the results.
Table 6 shows surveying data and processing parameters.
Load (kN) n. images density Processing time n. points
26 114 Ultra High 4 h 30’ 14,391,686
26 114 High 1 h 26’ 4,238,977
26 114 Medium 47’ 1,103,430
26 114 Low 6’ 260,027
26 114 Lowest 3’ 17,441
54 105 Ultra High 3 h 15’ 12,577,541
54 105 High 55’ 3,819,184
54 105 Medium 13’ 999,958
54 105 Low 3’ 237,734
54 105 Lowest 2’ 16,876
Table 6: CRP Parameter and data processing
Terrestrial Laser Scanner and Close Range Photogrammetry point clouds accuracy assessment for the structure
deformations monitoring (10113)
Giuseppina Vacca and Giannina Sanna (Italy)
FIG Working Week 2019
Geospatial information for a smarter life and environmental resilience
Hanoi, Vietnam, April 22–26, 2019
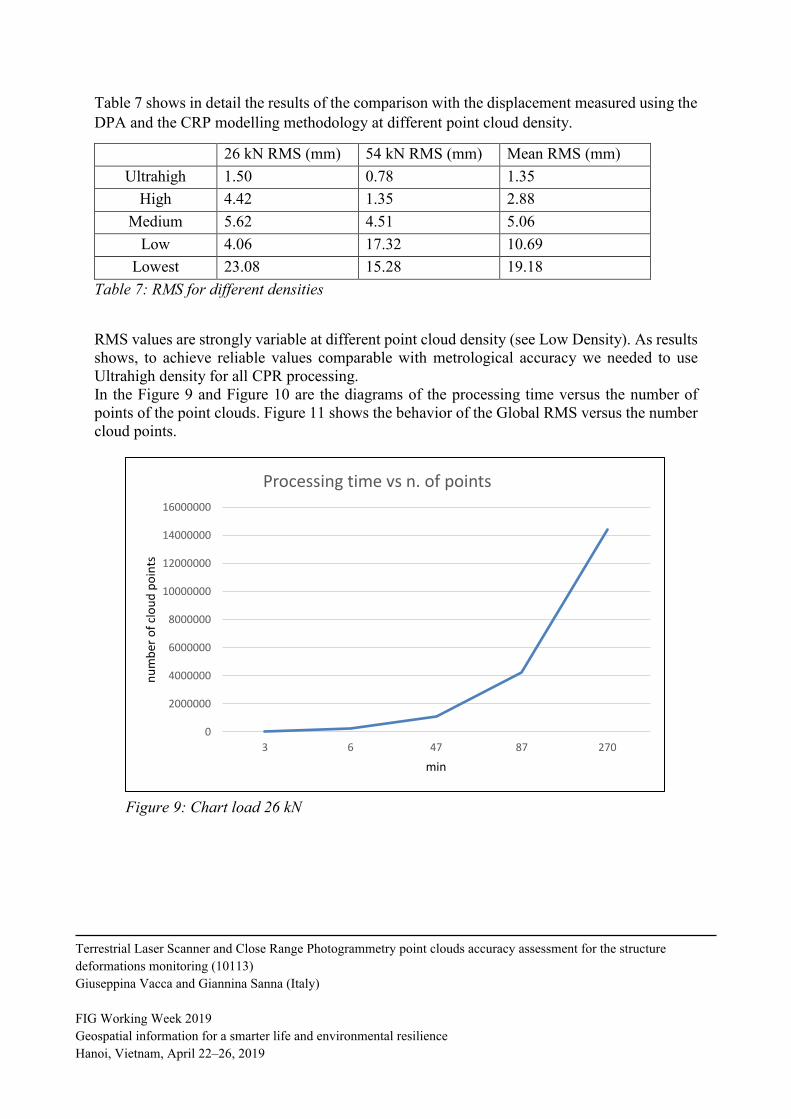
Table 7 shows in detail the results of the comparison with the displacement measured using the
DPA and the CRP modelling methodology at different point cloud density.
26 kN RMS (mm)
RMS (mm)
54 kN RMS (mm)
RMS (mm)
Mean RMS (mm)
Ultrahigh 1.50
0.78 1.35
High 4.42 1.35 2.88
Medium 5.62 4.51 5.06
Low 4.06 17.32 10.69
Lowest 23.08 15.28 19.18
Table 7: RMS for different densities
RMS values are strongly variable at different point cloud density (see Low Density). As results
shows, to achieve reliable values comparable with metrological accuracy we needed to use
Ultrahigh density for all CPR processing.
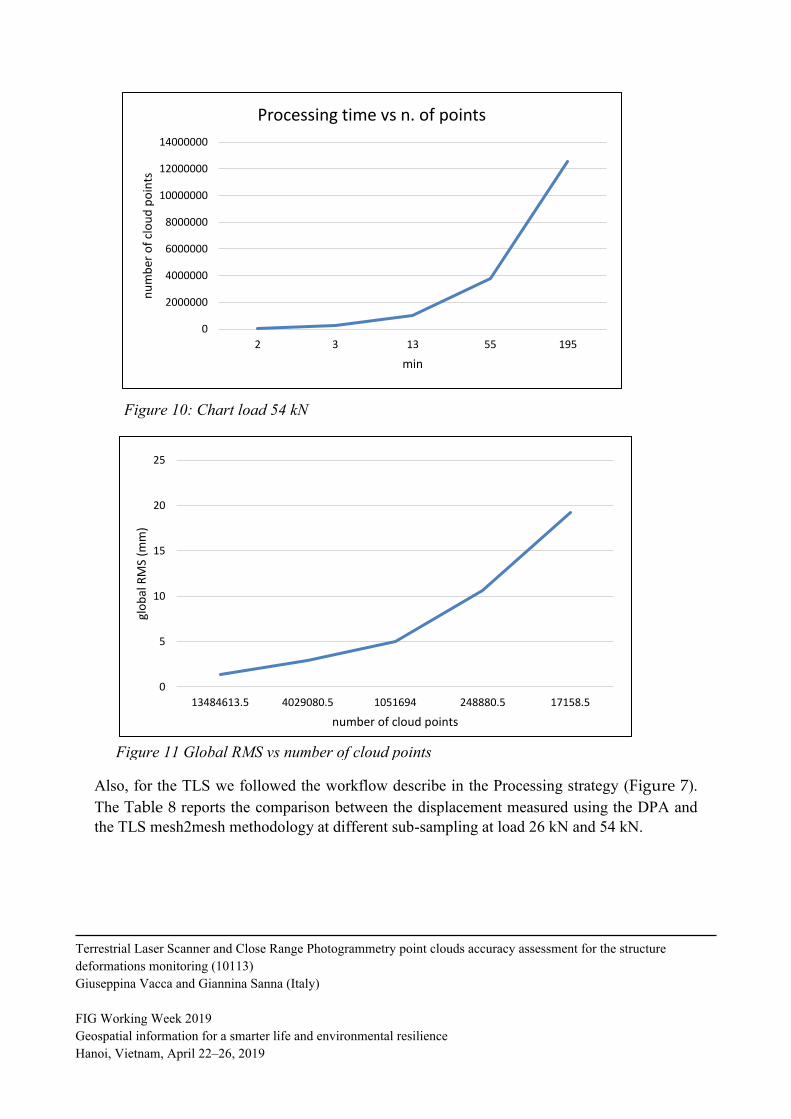
In the Figure 9 and Figure 10 are the diagrams of the processing time versus the number of
points of the point clouds. Figure 11 shows the behavior of the Global RMS versus the number
cloud points.
0
2000000
4000000
6000000
8000000
10000000
12000000
14000000
16000000
3 6 47 87 270
nu
mb
er o
f cl
ou
d p
oin
ts
min
Processing time vs n. of points
Figure 9: Chart load 26 kN
Terrestrial Laser Scanner and Close Range Photogrammetry point clouds accuracy assessment for the structure
deformations monitoring (10113)
Giuseppina Vacca and Giannina Sanna (Italy)
FIG Working Week 2019
Geospatial information for a smarter life and environmental resilience
Hanoi, Vietnam, April 22–26, 2019
Also, for the TLS we followed the workflow describe in the Processing strategy (Figure 7).
The Table 8 reports the comparison between the displacement measured using the DPA and
the TLS mesh2mesh methodology at different sub-sampling at load 26 kN and 54 kN.
0
2000000
4000000
6000000
8000000
10000000
12000000
14000000
2 3 13 55 195
nu
mb
er o
f cl
ou
d p
oin
ts
min
Processing time vs n. of points
Figure 10: Chart load 54 kN
Figure 11 Global RMS vs number of cloud points
0
5
10
15
20
25
13484613.5 4029080.5 1051694 248880.5 17158.5
glo
bal
RM
S (m
m)
number of cloud points
Terrestrial Laser Scanner and Close Range Photogrammetry point clouds accuracy assessment for the structure
deformations monitoring (10113)
Giuseppina Vacca and Giannina Sanna (Italy)
FIG Working Week 2019
Geospatial information for a smarter life and environmental resilience
Hanoi, Vietnam, April 22–26, 2019
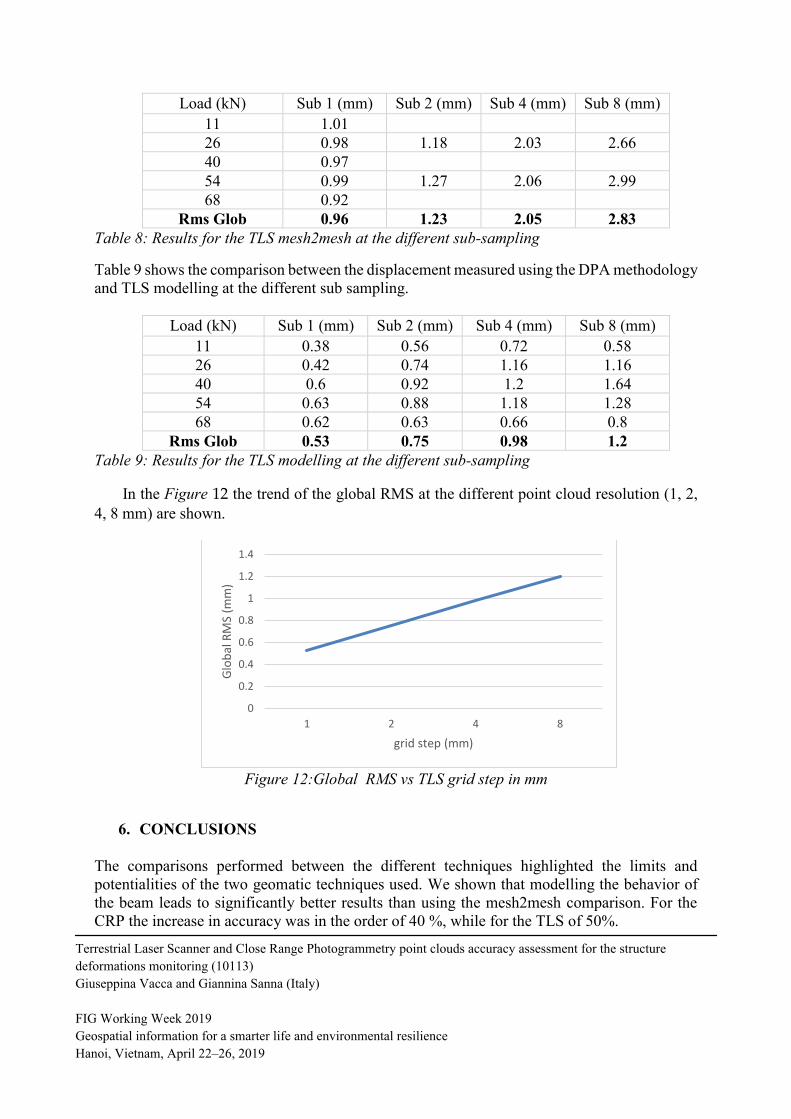
Load (kN) Sub 1 (mm) Sub 2 (mm) Sub 4 (mm) Sub 8 (mm)
11 1.01
26 0.98 1.18 2.03 2.66
40 0.97
54 0.99 1.27 2.06 2.99
68 0.92
Rms Glob 0.96 1.23 2.05 2.83
Table 8: Results for the TLS mesh2mesh at the different sub-sampling
Table 9 shows the comparison between the displacement measured using the DPA methodology
and TLS modelling at the different sub sampling.
Load (kN) Sub 1 (mm) Sub 2 (mm) Sub 4 (mm) Sub 8 (mm)
11 0.38 0.56 0.72 0.58
26 0.42 0.74 1.16 1.16
40 0.6 0.92 1.2 1.64
54 0.63 0.88 1.18 1.28
68 0.62 0.63 0.66 0.8
Rms Glob 0.53 0.75 0.98 1.2
Table 9: Results for the TLS modelling at the different sub-sampling
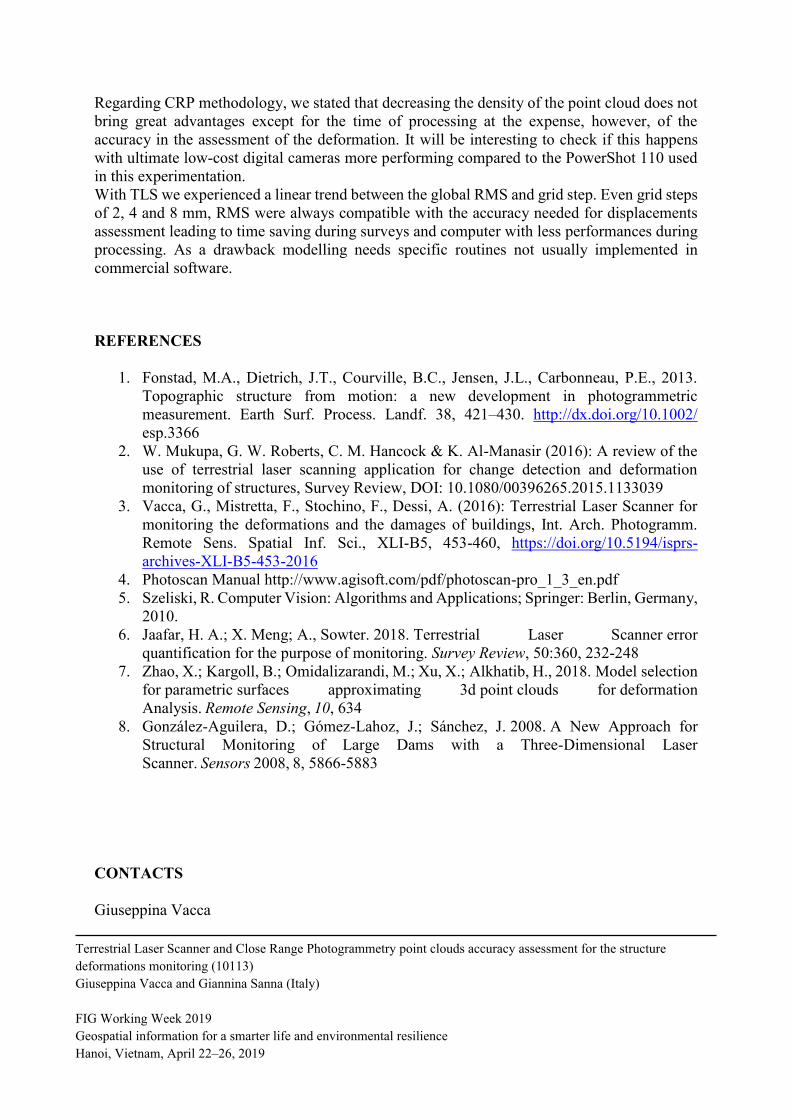
In the Figure 12 the trend of the global RMS at the different point cloud resolution (1, 2,
4, 8 mm) are shown.
Figure 12:Global RMS vs TLS grid step in mm
6. CONCLUSIONS
The comparisons performed between the different techniques highlighted the limits and
potentialities of the two geomatic techniques used. We shown that modelling the behavior of
the beam leads to significantly better results than using the mesh2mesh comparison. For the
CRP the increase in accuracy was in the order of 40 %, while for the TLS of 50%.
0
0.2
0.4
0.6
0.8
1
1.2
1.4
1 2 4 8
Glo
bal
RM
S (m
m)
grid step (mm)
Terrestrial Laser Scanner and Close Range Photogrammetry point clouds accuracy assessment for the structure
deformations monitoring (10113)
Giuseppina Vacca and Giannina Sanna (Italy)
FIG Working Week 2019
Geospatial information for a smarter life and environmental resilience
Hanoi, Vietnam, April 22–26, 2019
Regarding CRP methodology, we stated that decreasing the density of the point cloud does not
bring great advantages except for the time of processing at the expense, however, of the
accuracy in the assessment of the deformation. It will be interesting to check if this happens
with ultimate low-cost digital cameras more performing compared to the PowerShot 110 used
in this experimentation.
With TLS we experienced a linear trend between the global RMS and grid step. Even grid steps
of 2, 4 and 8 mm, RMS were always compatible with the accuracy needed for displacements
assessment leading to time saving during surveys and computer with less performances during
processing. As a drawback modelling needs specific routines not usually implemented in
commercial software.
REFERENCES
1. Fonstad, M.A., Dietrich, J.T., Courville, B.C., Jensen, J.L., Carbonneau, P.E., 2013.
Topographic structure from motion: a new development in photogrammetric
measurement. Earth Surf. Process. Landf. 38, 421–430. http://dx.doi.org/10.1002/
esp.3366
2. W. Mukupa, G. W. Roberts, C. M. Hancock & K. Al-Manasir (2016): A review of the
use of terrestrial laser scanning application for change detection and deformation
monitoring of structures, Survey Review, DOI: 10.1080/00396265.2015.1133039
3. Vacca, G., Mistretta, F., Stochino, F., Dessi, A. (2016): Terrestrial Laser Scanner for
monitoring the deformations and the damages of buildings, Int. Arch. Photogramm.
Remote Sens. Spatial Inf. Sci., XLI-B5, 453-460, https://doi.org/10.5194/isprs-
archives-XLI-B5-453-2016
4. Photoscan Manual http://www.agisoft.com/pdf/photoscan-pro_1_3_en.pdf
5. Szeliski, R. Computer Vision: Algorithms and Applications; Springer: Berlin, Germany,
2010.
6. Jaafar, H. A.; X. Meng; A., Sowter. 2018. Terrestrial Laser Scanner error
quantification for the purpose of monitoring. Survey Review, 50:360, 232-248
7. Zhao, X.; Kargoll, B.; Omidalizarandi, M.; Xu, X.; Alkhatib, H., 2018. Model selection
for parametric surfaces approximating 3d point clouds for deformation
Analysis. Remote Sensing, 10, 634
8. González-Aguilera, D.; Gómez-Lahoz, J.; Sánchez, J. 2008. A New Approach for
Structural Monitoring of Large Dams with a Three-Dimensional Laser
Scanner. Sensors 2008, 8, 5866-5883
CONTACTS
Giuseppina Vacca
Terrestrial Laser Scanner and Close Range Photogrammetry point clouds accuracy assessment for the structure
deformations monitoring (10113)
Giuseppina Vacca and Giannina Sanna (Italy)
FIG Working Week 2019
Geospatial information for a smarter life and environmental resilience
Hanoi, Vietnam, April 22–26, 2019

University of Cagliari
P.zza D'Armi
09123
Cagliari (Italy)
phone 00390706755436
e mail [email protected]
Terrestrial Laser Scanner and Close Range Photogrammetry point clouds accuracy assessment for the structure
deformations monitoring (10113)
Giuseppina Vacca and Giannina Sanna (Italy)
FIG Working Week 2019
Geospatial information for a smarter life and environmental resilience
Hanoi, Vietnam, April 22–26, 2019