use of terrestrial 3d laser scanner in cartographing...
TRANSCRIPT
Chapter 3
© 2012 Romanescu et al., licensee InTech. This is an open access chapter distributed under the terms of the Creative Commons Attribution License (http://creativecommons.org/licenses/by/3.0), which permits unrestricted use, distribution, and reproduction in any medium, provided the original work is properly cited.
Use of Terrestrial 3D Laser Scanner in Cartographing and Monitoring Relief Dynamics and Habitation Space from Various Historical Periods
Gheorghe Romanescu, Vasile Cotiugă and Andrei Asăndulesei
Additional information is available at the end of the chapter
http://dx.doi.org/10.5772/47776
1. Introduction
Nowadays, modern cartography employs various techniques and methods, which were deemed inconceivable just two decades ago. The GIS technology is particularly important among these, a technology that advanced cartography to the highest standards of graphical (visual) representation. 3D laser scanning is one of the most notable new cartography techniques that is part of this "new wave". This instrument, specifically a Leica LIDAR scanner, capable of monitoring land dynamics with an accuracy of 1 mm/1 mm from a distance of 300 m, as well as its use, are the subject of the present paper. In the field of physical geography and geo-archaeology, the 3D laser scanner can be used to map and monitor soil degradation processes (ravine-creation, surface erosion, landslides, etc.), the erosion and aggradation of a river's channel and valley, shore and slope processes, beaches and escarpments, dunes, caves and man-made excavations (including salt mines), iceberg dynamics, archaeological sites and the spatial position of the archaeological finds, heritage buildings and structures, works of art (sculptures, reliefs, etc.) etc.
Even though the 3D laser scanning technique is relatively old, i.e. from the '90s, it has enjoyed increased use in physical geography and in geo-archaeology only during the last few years. Most of the cartography projects employing the 3D laser scanner focus on the morphology and dynamics of the slope geomorphological processes, as well as on river bed and shoreline dynamics. Up until the advances in technology allowed the 3D scanners to become widely available and practical enough for cartographic use, countless attempts to use "modern" cartographic methods were made, but, in most cases, they proved to be inexact and cumbersome. Therefore, most of the studies employed the
Cartography – A Tool for Spatial Analysis 50
classical, rudimentary, methods which rely on wooden or metal markers and analog data collecting.
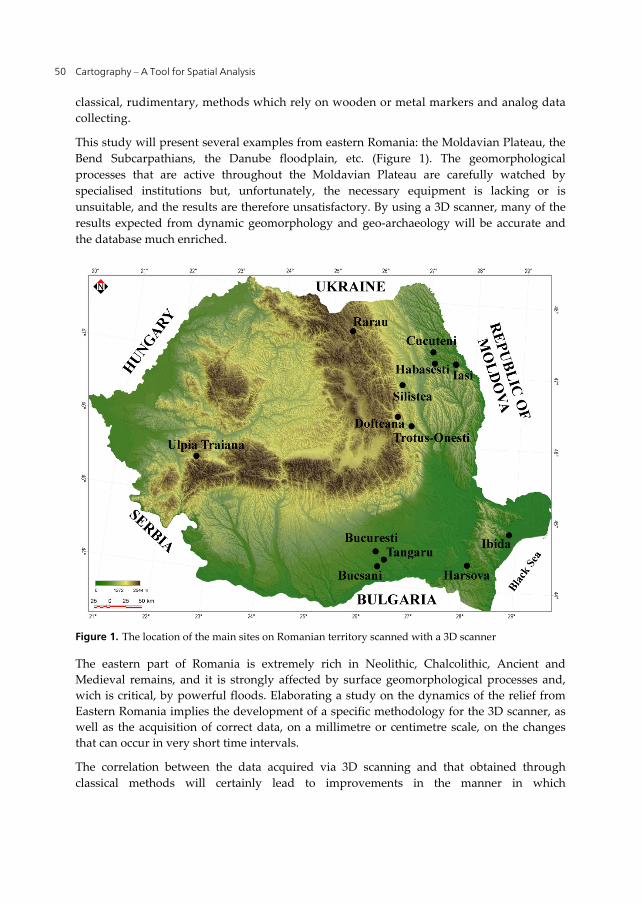
This study will present several examples from eastern Romania: the Moldavian Plateau, the Bend Subcarpathians, the Danube floodplain, etc. (Figure 1). The geomorphological processes that are active throughout the Moldavian Plateau are carefully watched by specialised institutions but, unfortunately, the necessary equipment is lacking or is unsuitable, and the results are therefore unsatisfactory. By using a 3D scanner, many of the results expected from dynamic geomorphology and geo-archaeology will be accurate and the database much enriched.
Figure 1. The location of the main sites on Romanian territory scanned with a 3D scanner
The eastern part of Romania is extremely rich in Neolithic, Chalcolithic, Ancient and Medieval remains, and it is strongly affected by surface geomorphological processes and, wich is critical, by powerful floods. Elaborating a study on the dynamics of the relief from Eastern Romania implies the development of a specific methodology for the 3D scanner, as well as the acquisition of correct data, on a millimetre or centimetre scale, on the changes that can occur in very short time intervals.
The correlation between the data acquired via 3D scanning and that obtained through classical methods will certainly lead to improvements in the manner in which
Use of Terrestrial 3D Laser Scanner in Cartographing and Monitoring Relief Dynamics and Habitation Space from Various Historical Periods 51
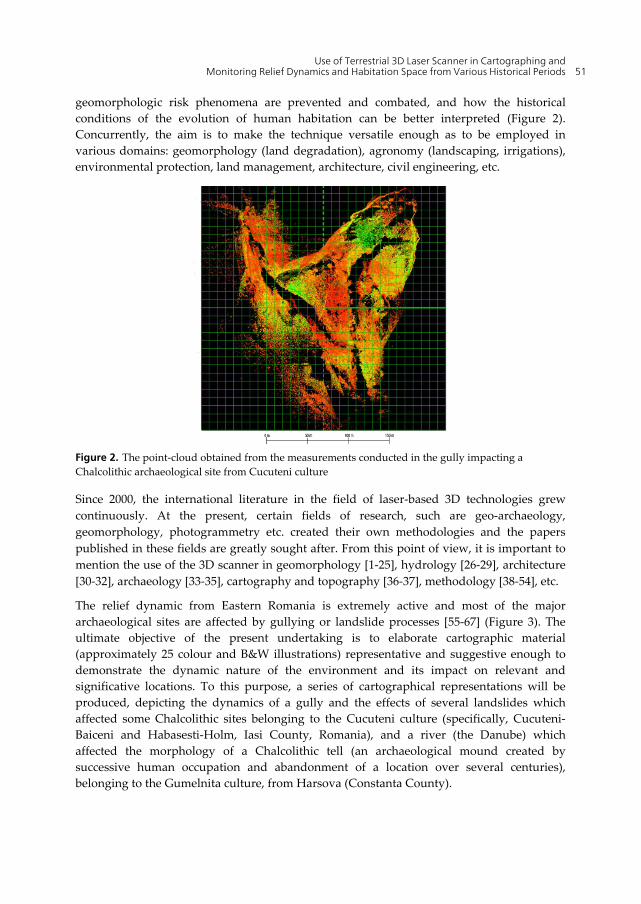
geomorphologic risk phenomena are prevented and combated, and how the historical conditions of the evolution of human habitation can be better interpreted (Figure 2). Concurrently, the aim is to make the technique versatile enough as to be employed in various domains: geomorphology (land degradation), agronomy (landscaping, irrigations), environmental protection, land management, architecture, civil engineering, etc.
Figure 2. The point-cloud obtained from the measurements conducted in the gully impacting a Chalcolithic archaeological site from Cucuteni culture
Since 2000, the international literature in the field of laser-based 3D technologies grew continuously. At the present, certain fields of research, such are geo-archaeology, geomorphology, photogrammetry etc. created their own methodologies and the papers published in these fields are greatly sought after. From this point of view, it is important to mention the use of the 3D scanner in geomorphology [1-25], hydrology [26-29], architecture [30-32], archaeology [33-35], cartography and topography [36-37], methodology [38-54], etc.
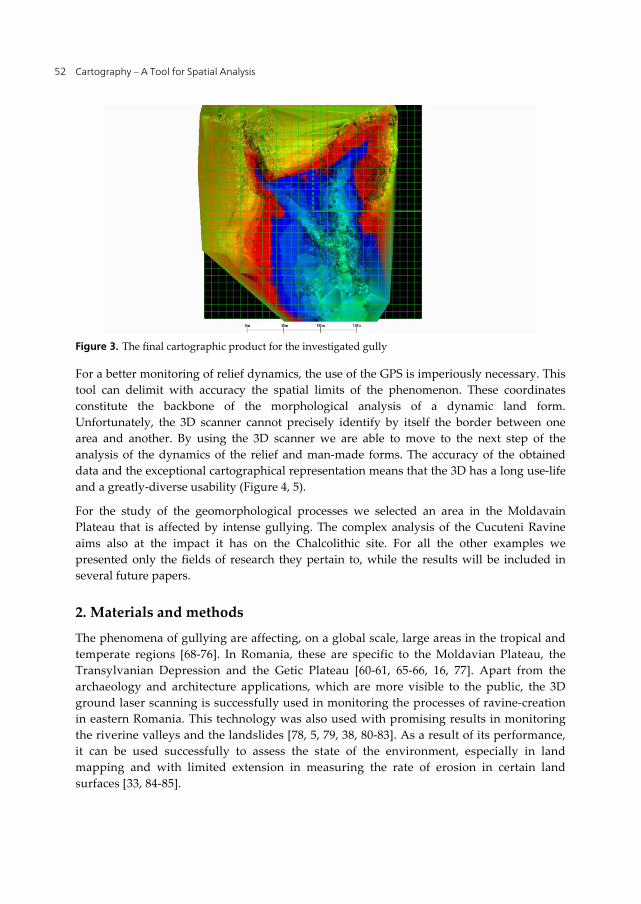
The relief dynamic from Eastern Romania is extremely active and most of the major archaeological sites are affected by gullying or landslide processes [55-67] (Figure 3). The ultimate objective of the present undertaking is to elaborate cartographic material (approximately 25 colour and B&W illustrations) representative and suggestive enough to demonstrate the dynamic nature of the environment and its impact on relevant and significative locations. To this purpose, a series of cartographical representations will be produced, depicting the dynamics of a gully and the effects of several landslides which affected some Chalcolithic sites belonging to the Cucuteni culture (specifically, Cucuteni-Baiceni and Habasesti-Holm, Iasi County, Romania), and a river (the Danube) which affected the morphology of a Chalcolithic tell (an archaeological mound created by successive human occupation and abandonment of a location over several centuries), belonging to the Gumelnita culture, from Harsova (Constanta County).
Cartography – A Tool for Spatial Analysis 52
Figure 3. The final cartographic product for the investigated gully
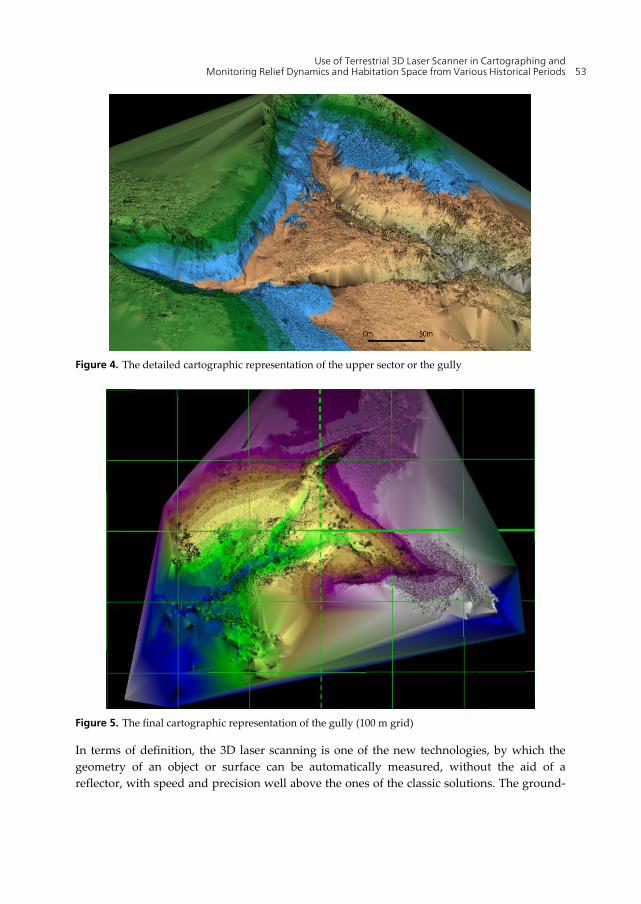
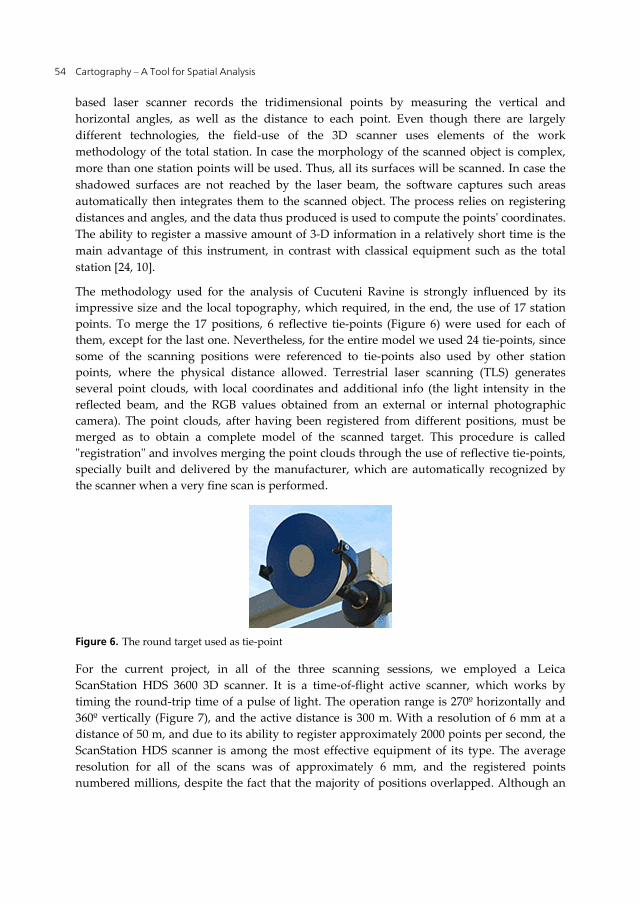
For a better monitoring of relief dynamics, the use of the GPS is imperiously necessary. This tool can delimit with accuracy the spatial limits of the phenomenon. These coordinates constitute the backbone of the morphological analysis of a dynamic land form. Unfortunately, the 3D scanner cannot precisely identify by itself the border between one area and another. By using the 3D scanner we are able to move to the next step of the analysis of the dynamics of the relief and man-made forms. The accuracy of the obtained data and the exceptional cartographical representation means that the 3D has a long use-life and a greatly-diverse usability (Figure 4, 5).
For the study of the geomorphological processes we selected an area in the Moldavain Plateau that is affected by intense gullying. The complex analysis of the Cucuteni Ravine aims also at the impact it has on the Chalcolithic site. For all the other examples we presented only the fields of research they pertain to, while the results will be included in several future papers.
2. Materials and methods
The phenomena of gullying are affecting, on a global scale, large areas in the tropical and temperate regions [68-76]. In Romania, these are specific to the Moldavian Plateau, the Transylvanian Depression and the Getic Plateau [60-61, 65-66, 16, 77]. Apart from the archaeology and architecture applications, which are more visible to the public, the 3D ground laser scanning is successfully used in monitoring the processes of ravine-creation in eastern Romania. This technology was also used with promising results in monitoring the riverine valleys and the landslides [78, 5, 79, 38, 80-83]. As a result of its performance, it can be used successfully to assess the state of the environment, especially in land mapping and with limited extension in measuring the rate of erosion in certain land surfaces [33, 84-85].
Use of Terrestrial 3D Laser Scanner in Cartographing and Monitoring Relief Dynamics and Habitation Space from Various Historical Periods 53
Figure 4. The detailed cartographic representation of the upper sector or the gully
Figure 5. The final cartographic representation of the gully (100 m grid)
In terms of definition, the 3D laser scanning is one of the new technologies, by which the geometry of an object or surface can be automatically measured, without the aid of a reflector, with speed and precision well above the ones of the classic solutions. The ground-
Cartography – A Tool for Spatial Analysis 54
based laser scanner records the tridimensional points by measuring the vertical and horizontal angles, as well as the distance to each point. Even though there are largely different technologies, the field-use of the 3D scanner uses elements of the work methodology of the total station. In case the morphology of the scanned object is complex, more than one station points will be used. Thus, all its surfaces will be scanned. In case the shadowed surfaces are not reached by the laser beam, the software captures such areas automatically then integrates them to the scanned object. The process relies on registering distances and angles, and the data thus produced is used to compute the points' coordinates. The ability to register a massive amount of 3-D information in a relatively short time is the main advantage of this instrument, in contrast with classical equipment such as the total station [24, 10].
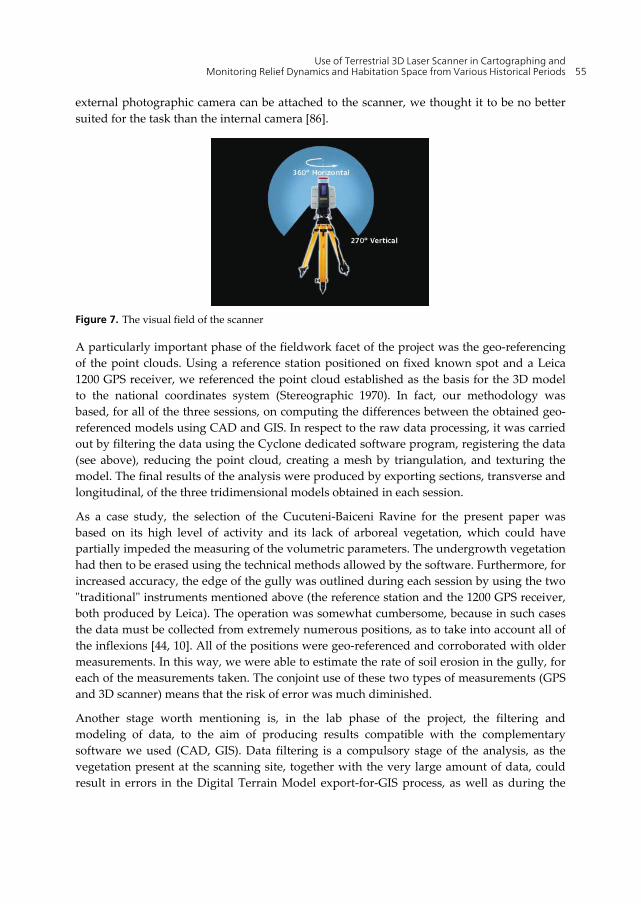
The methodology used for the analysis of Cucuteni Ravine is strongly influenced by its impressive size and the local topography, which required, in the end, the use of 17 station points. To merge the 17 positions, 6 reflective tie-points (Figure 6) were used for each of them, except for the last one. Nevertheless, for the entire model we used 24 tie-points, since some of the scanning positions were referenced to tie-points also used by other station points, where the physical distance allowed. Terrestrial laser scanning (TLS) generates several point clouds, with local coordinates and additional info (the light intensity in the reflected beam, and the RGB values obtained from an external or internal photographic camera). The point clouds, after having been registered from different positions, must be merged as to obtain a complete model of the scanned target. This procedure is called "registration" and involves merging the point clouds through the use of reflective tie-points, specially built and delivered by the manufacturer, which are automatically recognized by the scanner when a very fine scan is performed.
Figure 6. The round target used as tie-point
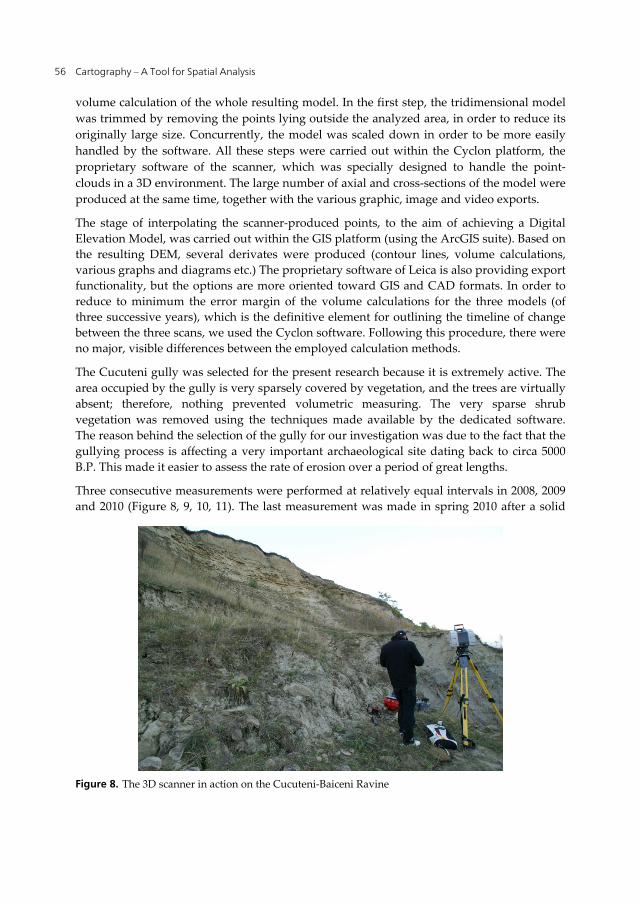
For the current project, in all of the three scanning sessions, we employed a Leica ScanStation HDS 3600 3D scanner. It is a time-of-flight active scanner, which works by timing the round-trip time of a pulse of light. The operation range is 270º horizontally and 360º vertically (Figure 7), and the active distance is 300 m. With a resolution of 6 mm at a distance of 50 m, and due to its ability to register approximately 2000 points per second, the ScanStation HDS scanner is among the most effective equipment of its type. The average resolution for all of the scans was of approximately 6 mm, and the registered points numbered millions, despite the fact that the majority of positions overlapped. Although an
Use of Terrestrial 3D Laser Scanner in Cartographing and Monitoring Relief Dynamics and Habitation Space from Various Historical Periods 55
external photographic camera can be attached to the scanner, we thought it to be no better suited for the task than the internal camera [86].
Figure 7. The visual field of the scanner
A particularly important phase of the fieldwork facet of the project was the geo-referencing of the point clouds. Using a reference station positioned on fixed known spot and a Leica 1200 GPS receiver, we referenced the point cloud established as the basis for the 3D model to the national coordinates system (Stereographic 1970). In fact, our methodology was based, for all of the three sessions, on computing the differences between the obtained geo-referenced models using CAD and GIS. In respect to the raw data processing, it was carried out by filtering the data using the Cyclone dedicated software program, registering the data (see above), reducing the point cloud, creating a mesh by triangulation, and texturing the model. The final results of the analysis were produced by exporting sections, transverse and longitudinal, of the three tridimensional models obtained in each session.
As a case study, the selection of the Cucuteni-Baiceni Ravine for the present paper was based on its high level of activity and its lack of arboreal vegetation, which could have partially impeded the measuring of the volumetric parameters. The undergrowth vegetation had then to be erased using the technical methods allowed by the software. Furthermore, for increased accuracy, the edge of the gully was outlined during each session by using the two "traditional" instruments mentioned above (the reference station and the 1200 GPS receiver, both produced by Leica). The operation was somewhat cumbersome, because in such cases the data must be collected from extremely numerous positions, as to take into account all of the inflexions [44, 10]. All of the positions were geo-referenced and corroborated with older measurements. In this way, we were able to estimate the rate of soil erosion in the gully, for each of the measurements taken. The conjoint use of these two types of measurements (GPS and 3D scanner) means that the risk of error was much diminished.
Another stage worth mentioning is, in the lab phase of the project, the filtering and modeling of data, to the aim of producing results compatible with the complementary software we used (CAD, GIS). Data filtering is a compulsory stage of the analysis, as the vegetation present at the scanning site, together with the very large amount of data, could result in errors in the Digital Terrain Model export-for-GIS process, as well as during the
Cartography – A Tool for Spatial Analysis 56
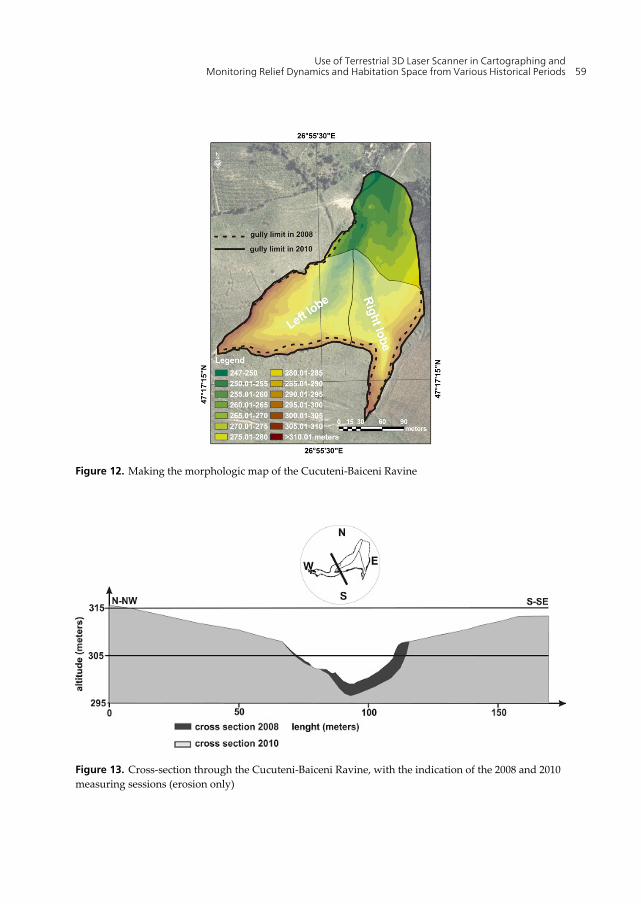
volume calculation of the whole resulting model. In the first step, the tridimensional model was trimmed by removing the points lying outside the analyzed area, in order to reduce its originally large size. Concurrently, the model was scaled down in order to be more easily handled by the software. All these steps were carried out within the Cyclon platform, the proprietary software of the scanner, which was specially designed to handle the point-clouds in a 3D environment. The large number of axial and cross-sections of the model were produced at the same time, together with the various graphic, image and video exports.
The stage of interpolating the scanner-produced points, to the aim of achieving a Digital Elevation Model, was carried out within the GIS platform (using the ArcGIS suite). Based on the resulting DEM, several derivates were produced (contour lines, volume calculations, various graphs and diagrams etc.) The proprietary software of Leica is also providing export functionality, but the options are more oriented toward GIS and CAD formats. In order to reduce to minimum the error margin of the volume calculations for the three models (of three successive years), which is the definitive element for outlining the timeline of change between the three scans, we used the Cyclon software. Following this procedure, there were no major, visible differences between the employed calculation methods.
The Cucuteni gully was selected for the present research because it is extremely active. The area occupied by the gully is very sparsely covered by vegetation, and the trees are virtually absent; therefore, nothing prevented volumetric measuring. The very sparse shrub vegetation was removed using the techniques made available by the dedicated software. The reason behind the selection of the gully for our investigation was due to the fact that the gullying process is affecting a very important archaeological site dating back to circa 5000 B.P. This made it easier to assess the rate of erosion over a period of great lengths.
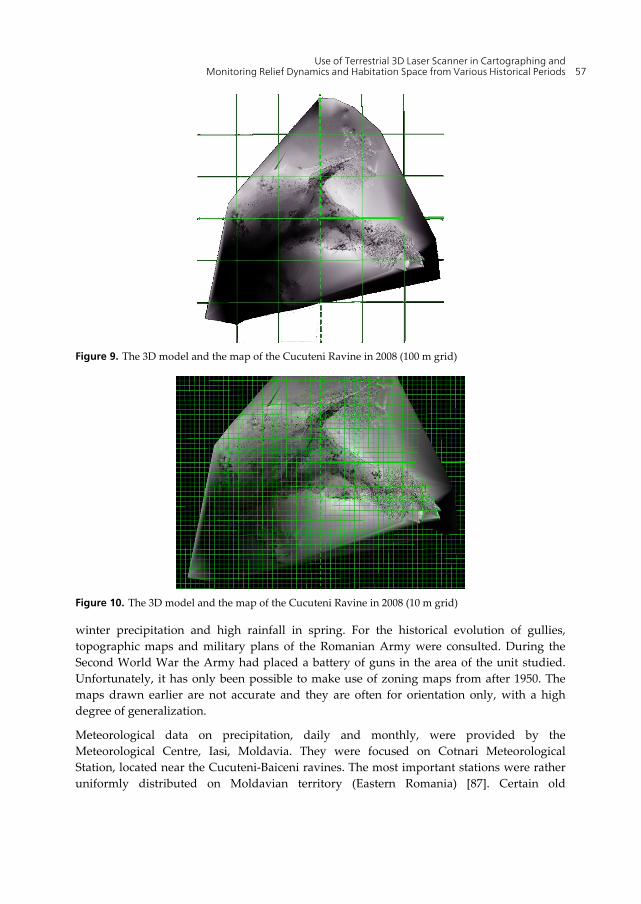
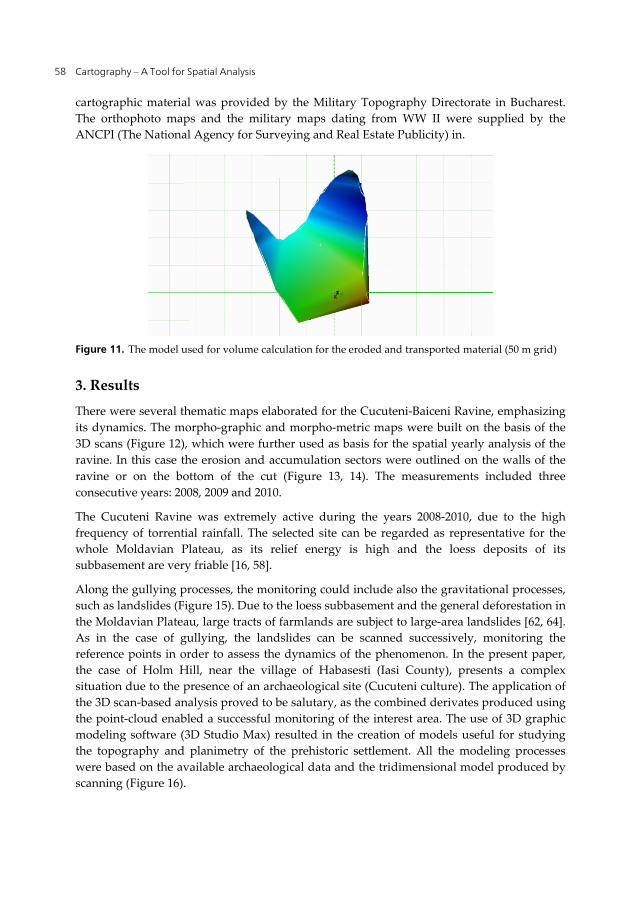
Three consecutive measurements were performed at relatively equal intervals in 2008, 2009 and 2010 (Figure 8, 9, 10, 11). The last measurement was made in spring 2010 after a solid
Figure 8. The 3D scanner in action on the Cucuteni-Baiceni Ravine
Use of Terrestrial 3D Laser Scanner in Cartographing and Monitoring Relief Dynamics and Habitation Space from Various Historical Periods 57
Figure 9. The 3D model and the map of the Cucuteni Ravine in 2008 (100 m grid)
Figure 10. The 3D model and the map of the Cucuteni Ravine in 2008 (10 m grid)
winter precipitation and high rainfall in spring. For the historical evolution of gullies, topographic maps and military plans of the Romanian Army were consulted. During the Second World War the Army had placed a battery of guns in the area of the unit studied. Unfortunately, it has only been possible to make use of zoning maps from after 1950. The maps drawn earlier are not accurate and they are often for orientation only, with a high degree of generalization.
Meteorological data on precipitation, daily and monthly, were provided by the Meteorological Centre, Iasi, Moldavia. They were focused on Cotnari Meteorological Station, located near the Cucuteni-Baiceni ravines. The most important stations were rather uniformly distributed on Moldavian territory (Eastern Romania) [87]. Certain old
Cartography – A Tool for Spatial Analysis 58
cartographic material was provided by the Military Topography Directorate in Bucharest. The orthophoto maps and the military maps dating from WW II were supplied by the ANCPI (The National Agency for Surveying and Real Estate Publicity) in.
Figure 11. The model used for volume calculation for the eroded and transported material (50 m grid)
3. Results
There were several thematic maps elaborated for the Cucuteni-Baiceni Ravine, emphasizing its dynamics. The morpho-graphic and morpho-metric maps were built on the basis of the 3D scans (Figure 12), which were further used as basis for the spatial yearly analysis of the ravine. In this case the erosion and accumulation sectors were outlined on the walls of the ravine or on the bottom of the cut (Figure 13, 14). The measurements included three consecutive years: 2008, 2009 and 2010.
The Cucuteni Ravine was extremely active during the years 2008-2010, due to the high frequency of torrential rainfall. The selected site can be regarded as representative for the whole Moldavian Plateau, as its relief energy is high and the loess deposits of its subbasement are very friable [16, 58].
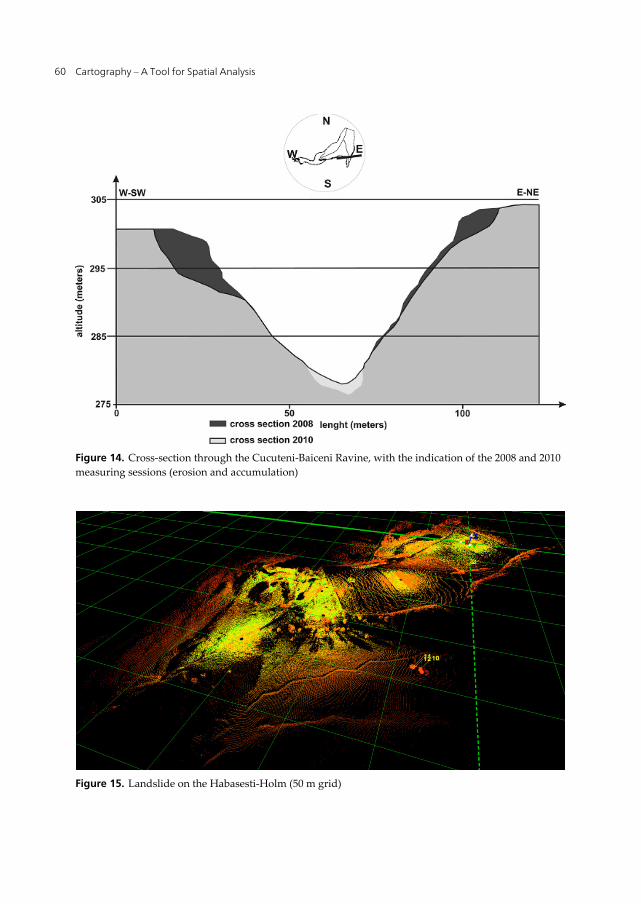
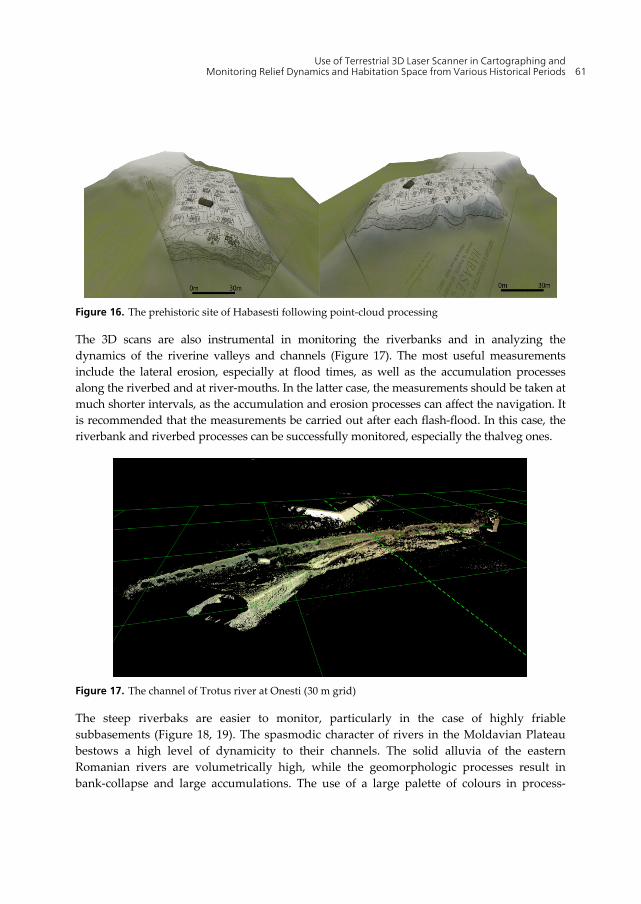
Along the gullying processes, the monitoring could include also the gravitational processes, such as landslides (Figure 15). Due to the loess subbasement and the general deforestation in the Moldavian Plateau, large tracts of farmlands are subject to large-area landslides [62, 64]. As in the case of gullying, the landslides can be scanned successively, monitoring the reference points in order to assess the dynamics of the phenomenon. In the present paper, the case of Holm Hill, near the village of Habasesti (Iasi County), presents a complex situation due to the presence of an archaeological site (Cucuteni culture). The application of the 3D scan-based analysis proved to be salutary, as the combined derivates produced using the point-cloud enabled a successful monitoring of the interest area. The use of 3D graphic modeling software (3D Studio Max) resulted in the creation of models useful for studying the topography and planimetry of the prehistoric settlement. All the modeling processes were based on the available archaeological data and the tridimensional model produced by scanning (Figure 16).
Use of Terrestrial 3D Laser Scanner in Cartographing and Monitoring Relief Dynamics and Habitation Space from Various Historical Periods 59
Figure 12. Making the morphologic map of the Cucuteni-Baiceni Ravine
Figure 13. Cross-section through the Cucuteni-Baiceni Ravine, with the indication of the 2008 and 2010 measuring sessions (erosion only)
Cartography – A Tool for Spatial Analysis 60
Figure 14. Cross-section through the Cucuteni-Baiceni Ravine, with the indication of the 2008 and 2010 measuring sessions (erosion and accumulation)
Figure 15. Landslide on the Habasesti-Holm (50 m grid)
Use of Terrestrial 3D Laser Scanner in Cartographing and Monitoring Relief Dynamics and Habitation Space from Various Historical Periods 61
Figure 16. The prehistoric site of Habasesti following point-cloud processing
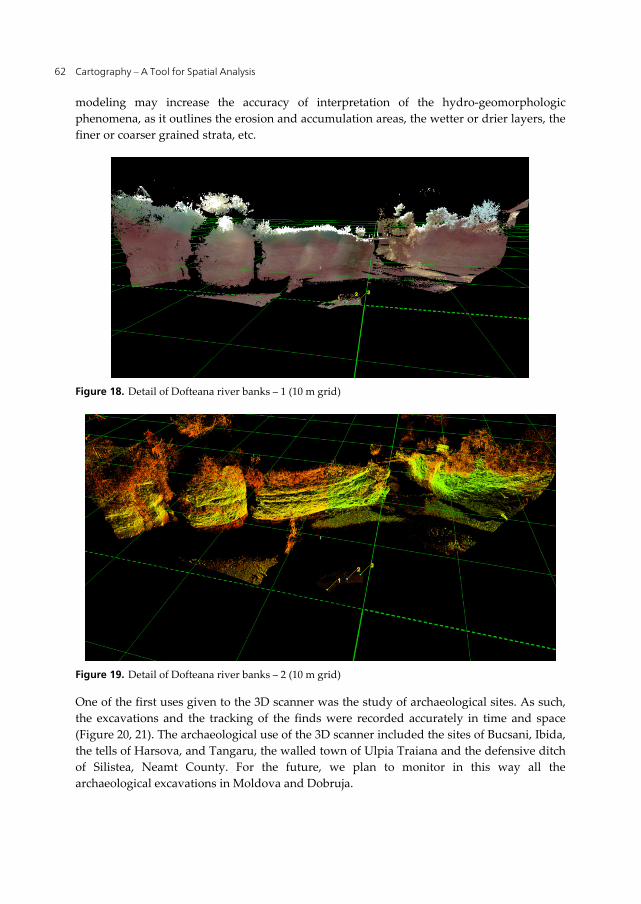
The 3D scans are also instrumental in monitoring the riverbanks and in analyzing the dynamics of the riverine valleys and channels (Figure 17). The most useful measurements include the lateral erosion, especially at flood times, as well as the accumulation processes along the riverbed and at river-mouths. In the latter case, the measurements should be taken at much shorter intervals, as the accumulation and erosion processes can affect the navigation. It is recommended that the measurements be carried out after each flash-flood. In this case, the riverbank and riverbed processes can be successfully monitored, especially the thalveg ones.
Figure 17. The channel of Trotus river at Onesti (30 m grid)
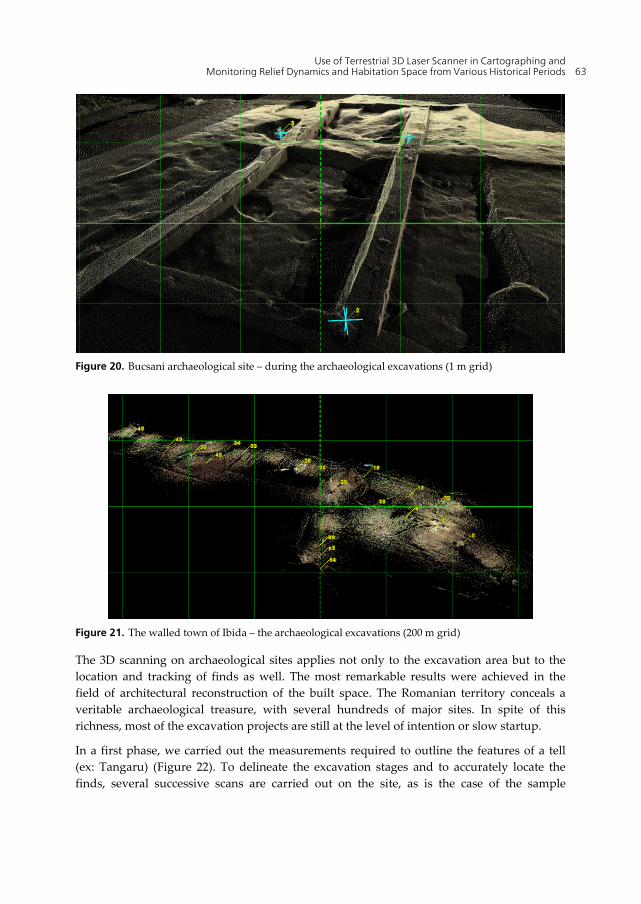
The steep riverbaks are easier to monitor, particularly in the case of highly friable subbasements (Figure 18, 19). The spasmodic character of rivers in the Moldavian Plateau bestows a high level of dynamicity to their channels. The solid alluvia of the eastern Romanian rivers are volumetrically high, while the geomorphologic processes result in bank-collapse and large accumulations. The use of a large palette of colours in process-
Cartography – A Tool for Spatial Analysis 62
modeling may increase the accuracy of interpretation of the hydro-geomorphologic phenomena, as it outlines the erosion and accumulation areas, the wetter or drier layers, the finer or coarser grained strata, etc.
Figure 18. Detail of Dofteana river banks – 1 (10 m grid)
Figure 19. Detail of Dofteana river banks – 2 (10 m grid)
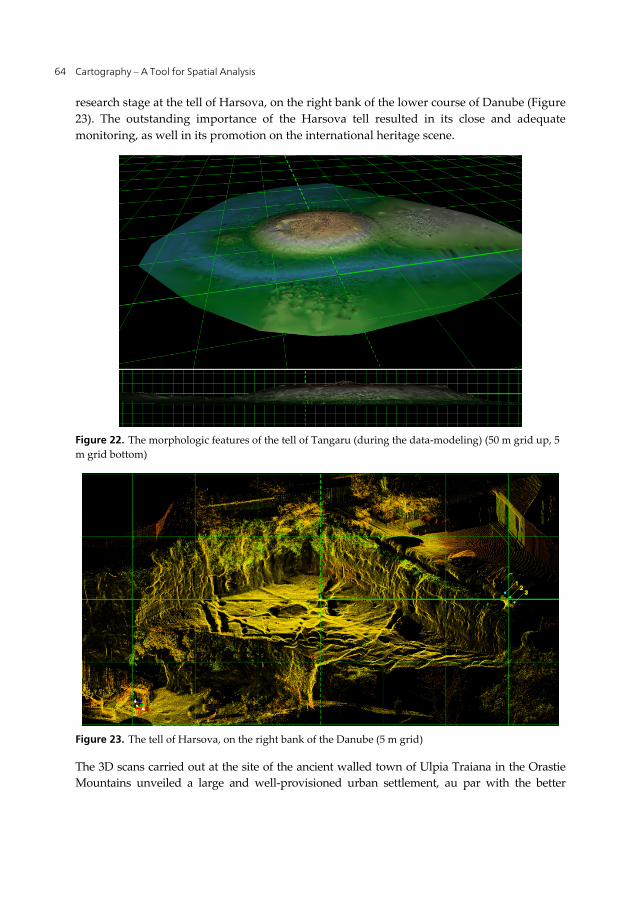
One of the first uses given to the 3D scanner was the study of archaeological sites. As such, the excavations and the tracking of the finds were recorded accurately in time and space (Figure 20, 21). The archaeological use of the 3D scanner included the sites of Bucsani, Ibida, the tells of Harsova, and Tangaru, the walled town of Ulpia Traiana and the defensive ditch of Silistea, Neamt County. For the future, we plan to monitor in this way all the archaeological excavations in Moldova and Dobruja.
Use of Terrestrial 3D Laser Scanner in Cartographing and Monitoring Relief Dynamics and Habitation Space from Various Historical Periods 63
Figure 20. Bucsani archaeological site – during the archaeological excavations (1 m grid)
Figure 21. The walled town of Ibida – the archaeological excavations (200 m grid)
The 3D scanning on archaeological sites applies not only to the excavation area but to the location and tracking of finds as well. The most remarkable results were achieved in the field of architectural reconstruction of the built space. The Romanian territory conceals a veritable archaeological treasure, with several hundreds of major sites. In spite of this richness, most of the excavation projects are still at the level of intention or slow startup.
In a first phase, we carried out the measurements required to outline the features of a tell (ex: Tangaru) (Figure 22). To delineate the excavation stages and to accurately locate the finds, several successive scans are carried out on the site, as is the case of the sample
Cartography – A Tool for Spatial Analysis 64
research stage at the tell of Harsova, on the right bank of the lower course of Danube (Figure 23). The outstanding importance of the Harsova tell resulted in its close and adequate monitoring, as well in its promotion on the international heritage scene.
Figure 22. The morphologic features of the tell of Tangaru (during the data-modeling) (50 m grid up, 5 m grid bottom)
Figure 23. The tell of Harsova, on the right bank of the Danube (5 m grid)
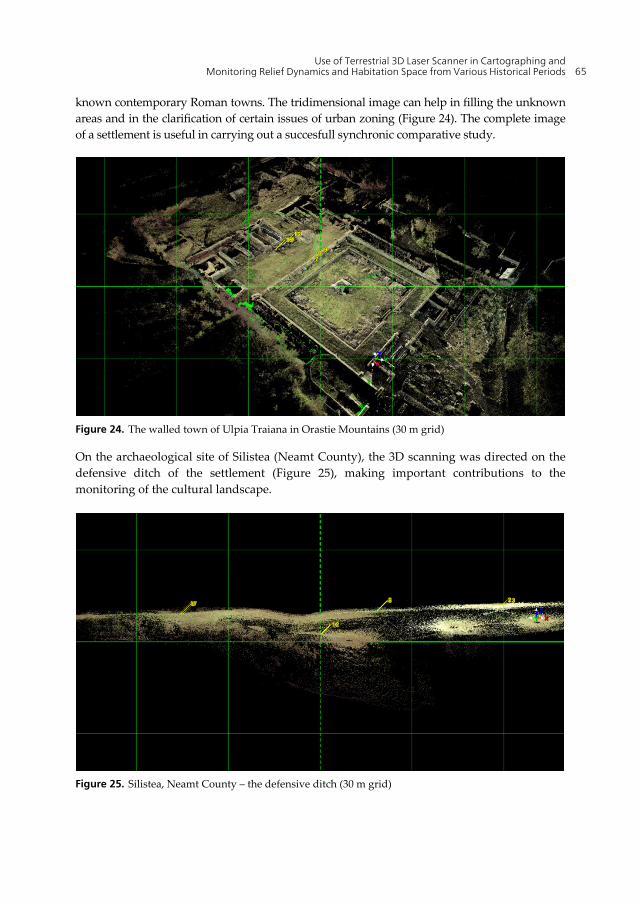
The 3D scans carried out at the site of the ancient walled town of Ulpia Traiana in the Orastie Mountains unveiled a large and well-provisioned urban settlement, au par with the better
Use of Terrestrial 3D Laser Scanner in Cartographing and Monitoring Relief Dynamics and Habitation Space from Various Historical Periods 65
known contemporary Roman towns. The tridimensional image can help in filling the unknown areas and in the clarification of certain issues of urban zoning (Figure 24). The complete image of a settlement is useful in carrying out a succesfull synchronic comparative study.
Figure 24. The walled town of Ulpia Traiana in Orastie Mountains (30 m grid)
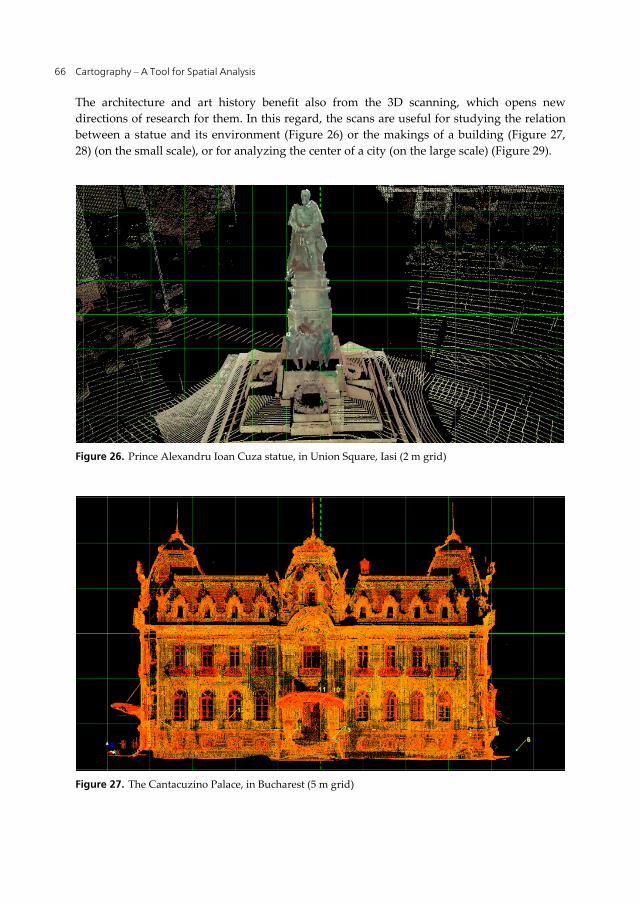
On the archaeological site of Silistea (Neamt County), the 3D scanning was directed on the defensive ditch of the settlement (Figure 25), making important contributions to the monitoring of the cultural landscape.
Figure 25. Silistea, Neamt County – the defensive ditch (30 m grid)
Cartography – A Tool for Spatial Analysis 66
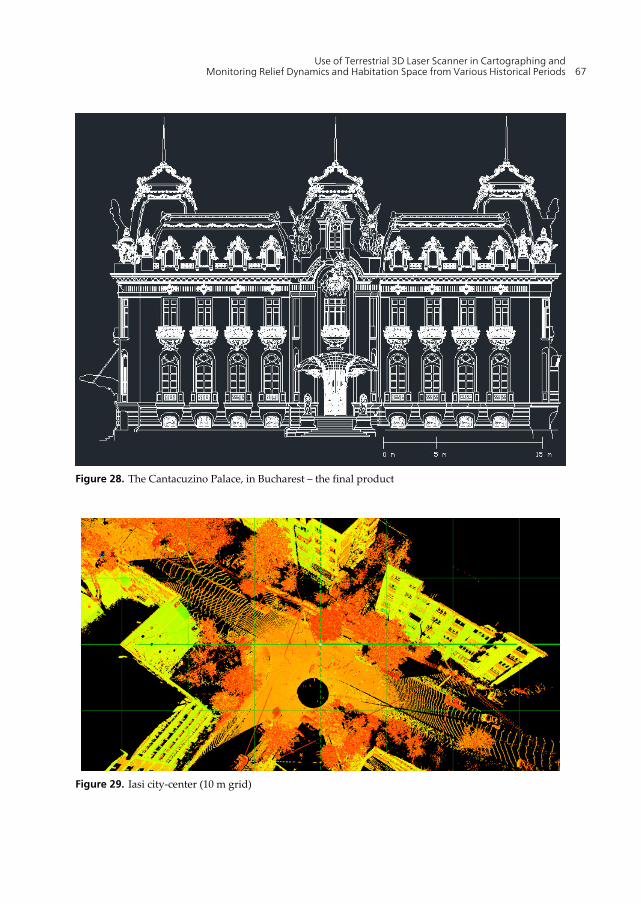
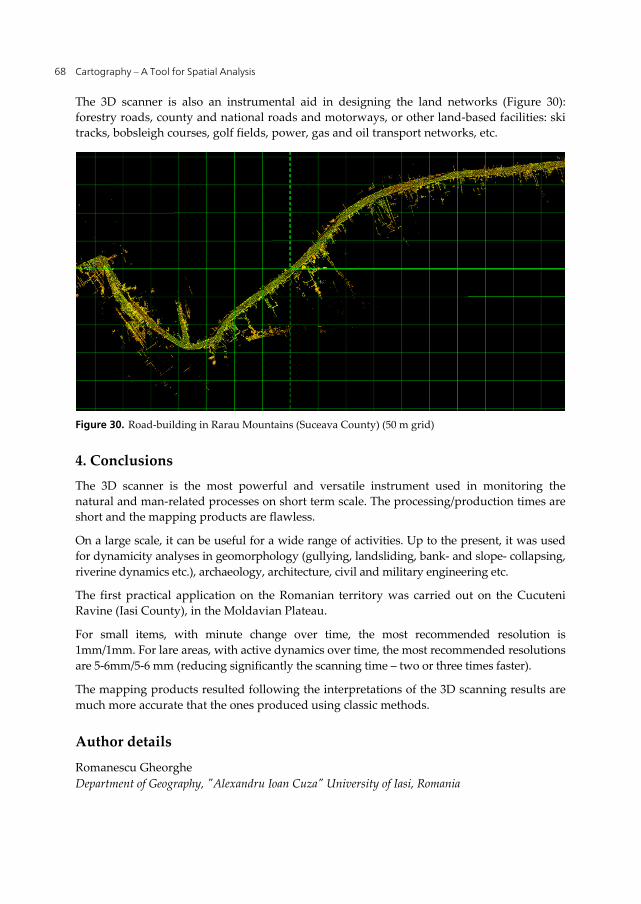
The architecture and art history benefit also from the 3D scanning, which opens new directions of research for them. In this regard, the scans are useful for studying the relation between a statue and its environment (Figure 26) or the makings of a building (Figure 27, 28) (on the small scale), or for analyzing the center of a city (on the large scale) (Figure 29).
Figure 26. Prince Alexandru Ioan Cuza statue, in Union Square, Iasi (2 m grid)
Figure 27. The Cantacuzino Palace, in Bucharest (5 m grid)
Use of Terrestrial 3D Laser Scanner in Cartographing and Monitoring Relief Dynamics and Habitation Space from Various Historical Periods 67
Figure 28. The Cantacuzino Palace, in Bucharest – the final product
Figure 29. Iasi city-center (10 m grid)
Cartography – A Tool for Spatial Analysis 68
The 3D scanner is also an instrumental aid in designing the land networks (Figure 30): forestry roads, county and national roads and motorways, or other land-based facilities: ski tracks, bobsleigh courses, golf fields, power, gas and oil transport networks, etc.
Figure 30. Road-building in Rarau Mountains (Suceava County) (50 m grid)
4. Conclusions The 3D scanner is the most powerful and versatile instrument used in monitoring the natural and man-related processes on short term scale. The processing/production times are short and the mapping products are flawless.
On a large scale, it can be useful for a wide range of activities. Up to the present, it was used for dynamicity analyses in geomorphology (gullying, landsliding, bank- and slope- collapsing, riverine dynamics etc.), archaeology, architecture, civil and military engineering etc.
The first practical application on the Romanian territory was carried out on the Cucuteni Ravine (Iasi County), in the Moldavian Plateau.
For small items, with minute change over time, the most recommended resolution is 1mm/1mm. For lare areas, with active dynamics over time, the most recommended resolutions are 5-6mm/5-6 mm (reducing significantly the scanning time – two or three times faster).
The mapping products resulted following the interpretations of the 3D scanning results are much more accurate that the ones produced using classic methods.
Author details
Romanescu Gheorghe Department of Geography, "Alexandru Ioan Cuza" University of Iasi, Romania
Use of Terrestrial 3D Laser Scanner in Cartographing and Monitoring Relief Dynamics and Habitation Space from Various Historical Periods 69
Cotiugă Vasile Departament of History, "Alexandru Ioan Cuza" University of Iasi, Romania
Asăndulesei Andrei ARHEOINVEST Platform, "Alexandru Ioan Cuza" University of Iasi, Romania
Acknowledgement
We extend our thanks to the Geo-archaeology Laboratory within the Faculty of Geography and Geology, ”Alexandru Ioan Cuza” University of Iasi, which provided the instruments and carried out the data-processing.
5. References [1] Abellan A, Vilaplana JM, Martinez J (2006) Application of a long-range terrestrial laser
scanner to a detailed rockfall study at Vall de Nuria (Eastern Pyrenees, Spain). Eng. Geol. 88(3-4): 136-148.
[2] Abellan A, Jaboyedoff M, Oppikofer T, Vilaplann JM (2009) Detection of millimeric deformation using a terrestrial laser scanner: experiment and application to a rockfall event. Natural Hazards and Earth System Sciences 9: 365-372.
[3] Barnett T, Chalmers A, Diaz-Andreu M, Ellis G, Longhurst P, Sharpe K, Trinks I (2005) 3D Laser Scanning for Recording and Monitoring Rock Art Erosion. International Newsletter an Rock Art (INORA) 41: 25-29.
[4] Bauer A, Paar G, Kaltenbock A (2005) Mass Movement Monitoring Using Terrestrial Laser Scanner for rock Fall Management. In: van Oosterom P, Zlatanova S, Fendel E M, editors. Geo-information for Disaster Management. Berlin: Springer. pp. 393-406.
[5] Bitelli G, Dubbini M, Zanutta A (2004) Terrestrial laser scanning and digital photogrammetry techniques to monitor landslide bodies. In: Altan M O, editor. Proceeding of the XXth ISPRS Congress Geo-Imagery Bridging Continents. Istanbul: ISPRS. pp. 246-251.
[6] Bouike M, Viles H, Nicoli J, Lyew-Ayee P, Ghent R, Holmlund J (2008) Innovative applications of laser scanning and rapid prototype printing to rock breakdown experiments. Earth Surface Processes and Landforma 33: 1614-1621.
[7] Bryer A (2003) Technologie pour le leve des mouvements historiques. La photogrammetrie digitale comparee au laser Scanner 3D. Levee de l’Arc d’Auguste, a Aoste, en Italie, Memoire pour le titre d’ingenieur diplome par l’etat en batiments et travaux publics, geometrie et topographie. Paris: Conservatoire National des Arts et Metiers. 81 p. Available: http://www.esgt.cnam.fr/documents/dpe/ memoires/03_Bryer_mem.pdf. Accessed 2011 Nov 23.
[8] Kottke J (2009) An Investigation of Quantifying and Monitoring Stone Surface Deterioration Using Three Dimensional Laser Scanning. University of Pennsylvania Scholarly Commons. Available: http://repository.upenn.edu/cgi/viewcontent.cgi?article=1126&context=hp_theses. Accessed 2011 Nov 6.
Cartography – A Tool for Spatial Analysis 70
[9] Kwong A K L, Tham L G, King B A (2005) Application of 3D Laser Scanning Technique to Slope Movement Monitoring. Journal of Testing and Evaluation 33(4): 266-273.
[10] Milan D G, Heritage G L, Hetherington D (2007) Application of a 3Dlaser scanner in the assessment of erosion and deposition volumes and channel change in a proglacial river. Earth Surface Processes and Landforma 32: 1657-1674.
[11] Nagihara S, Mulligan K R, Xiong W (2004) Use of a three-dimensional laser scanner to digitally capture the topography of sand dunes in high spatial resolution. Earth Surface Processes and Landforms 29: 391-398.
[12] Nasermoaddeli M H, Pasche E (2008) Application of terrestrial 3D laser scanner in quantification of the riverbank erosion and deposition. In: Altinakar M S, Kokpinar M A, Aydin I, Cokgar S, Kirkgoz S, editors. River flow 2008, Proceedings of International Conference on fluvial Hydraulics, Cesme-Ismir, Turkey, Sep. 3-5, 2008. Ankara: Kubaba Congress Department and Travel Services. pp. 2407-2416.
[13] Oppikofer T, Jaboyedoff M, Blikra L H, Derren M H (2008) Characterization and monitoring of the Aknes rockslide using terrestrial laser scanning. In: Locat J, Perret D, Turmel D, Demers D, Leroueil S, editors. Proceedings of the 4th Canadian Conference on Geohazards: Forum Causes to Management. Quebec: Press de l’Universite Laval. pp. 211-218.
[14] Perroy R L, Bookhagen B, Asner G P, Chadwick O A (2010) Comparison of gully erosion estimates using airborne and ground-based LiDAR on Santa Cruz Island, California. Geomorphology 118(3-4): 288-300.
[15] Poulton C V L, Lee J R, Hobbs P R N, Jones L, Hall M (2006) Preliminary investigation into monitoring coastal erosion using terrestrial laser scanning: case study at Happisburgh, Norfolk. Bulletin of the Geological Society of Norfolk 56: 45-64.
[16] Romanescu G, Cotiuga V, Asandulesei A, Stoleriu C (2011) Use of the 3-D scanner in mapping and monitoring the dynamic degradation of soils. Case study of the Cucuteni-Baiceni Gully on the Moldavian Plateau (Romania). Hydrology and Earth System Sciences 16(3): 953-966.
[17] Rosser N J, Petley D N, Lim M, Dunning S A, Allison R J (2005) Terrestrial laser scanning for monitoring the processes of hard rock coastal cliff erosion. Quarterly Journal of Engineering Geology and Hydrogeology 38(4): 363-375.
[18] Schaefer M, Inkpen R (2010) Towards a protocol for laser scanning of rock surface. Earth Surface Processes and Landforms 35(4): 147-423.
[19] Sui L, Wang X, Zhoo D, Qu J (2008) Application of 3D laser scanner for monitoring of landslide hazards. International Archives of the Photogrammetry, Remote Sensing and Spatial Information Science 37: 277-281.
[20] Teza G, Galgaro A, Zaltron N, Genevois R (2007) Terrestrial laser scanner to detect landslide displacement fields: a new approach. International Journal of Remote Sensing, 28(16): 3425-3446.
[21] Thoma D P, Gupta S C, Bauer M A (2001) Quantifying River Bank Erosion with Scanning Laser Altimetry. International Archives of Photogrammetry and Remote Sensing, Annapolis, MD. XXXIV-3/W4: 169-174.
[22] Thoma D P, Gupta S C, Bauer M A, Kirchoff C E (2005) Airborne laser scanning for riverbank erosion assessment. Remote Sensing of Environment 95:493-501.
Use of Terrestrial 3D Laser Scanner in Cartographing and Monitoring Relief Dynamics and Habitation Space from Various Historical Periods 71
[23] Travelletti J, Oppikofer T, Delacourt C, Malet J P, Jaboyedoff M (2008) Monitoring landslide displacements during a controlled rain experiment using a long-range terrestrial laser scanning (TLS). International Archives of the Photogrammetry, Remote Sensing and Spatial Information Science 37: 485-490.
[24] Wasklewicz T, Stanley D, Volker H, Whitley D S (2005) Terrestrial 3D laser scanning: A new method for recording rock art. INORA 41: 16-25.
[25] Ylmaz H M, Yakar M, Yildiz F, Karabork H, Kavurmaci M M, Mutlouoglu O, Goktepe A (2010). Determining rates of erosion of an earth pillar by terrestrial laser scanning. The Arabian Journal for Science and Engineering 35(2A): 163-172.
[26] Alba M, Giussani A, Roncoroni F, Scaioni M, Valgoi P (2006) Geometric Modelling of a Large Dam by Terrestrial Laser Scanning, Shaping the Change. In: Shaping the change: XXIII International FIG Congress, 8-13 October 2006, Munich, Germany: proceedings. Copenhagen: FIG. pp. 1-15.
[27] Alba M, Fregonese L, Prandi F, Scaroni M, Valgoi P (2006) Structural Monitoring of a Large Dam by Terrestrial Lasser Scanning. International Archives of the Photogrammetry, Remote Sensing and Spatial Information Science 36(5): 1-6.
[28] Playan E, Zapata N, Burguete J, Salvador R, Serreta A (2010) Application of a topographic 3D scanner to irrigation research. Irrigation Science 28(3): 245-256.
[29] Schneider D (2006). Terrestrial Laser Scanning for Area Based Deformation Analysis of Towers and Water Dams. In: Proceedings 3rd IAG / 12th FIG Symposium, Baden, May 22-24, 2006. 10 p. Available: http://www.fig.net/commission6/baden_2006/PDF/LS2/Schneider.pdf. Accessed 2011 Nov 11.
[30] Barber D M, Ross W A D, Jon P M (2006) Laser Scanning for Architectural Conservation. Journal of Architectural Conservation 12(1): 35-52.
[31] Chang J R, Chang KT, Chen D H (2006) Application of 3D Laser Scanning on Measuring Pavement Roughness. Journal of Testing and Evaluation 34(2): 83-91.
[32] Ioanidis C, Valani A, Georgopoulos A, Tsiligiris E (2006) 3D Model Generation of Deformation Analysis using Laser Scanning Data of a Cooling Tower. 3rd IAG / 12th FIG Symposium, Baden, May 22-24, 2006. 10 p. Available: http://www.fig.net/commission6/baden_2006/PDF/LS2/ Ioannidis.pdf. Accessed 2011 Nov 11.
[33] Böhler W, Marbs A (2006) 3D Scanning Instruments; CIPA, Heritage Documentation - International Workshop on Scanning for Cultural Heritage Recording, Corfu, Greece. Available: http://www.i3mainz.fh-mainz.de/publicat/korfu/p05_Boehler.pdf. Accessed 2011 Nov 11.
[34] Böehler W, Marbs A (2006) Investigating laser scanner accuracy. Available: http://www.uagp. net/images/stories/news/2007/10/PDF/1.pdf. Accessed 2011 Nov 11.
[35] Wang D Z, Edirisinghe M J, Jayasinghe S N (2007) A novel 3D pattering technique for forming advance ceramics. Key Engineering Materials 336-338(11): 977-979.
[36] Vaaja M, Hyyppa J, Kukko A, Kaartinen H, Hyyppa H, Alho P (2011) Mapping Topography Changes and Elevation Accuracies Using a Mobile Laser Scanner. Remote Sensing 3: 587-600.
Cartography – A Tool for Spatial Analysis 72
[37] Zhou Y, Cui M, Yang L (2009) Application of 3D laser Scanner in topographic change monitor and analysis. In: Electronic Measurement & Instruments, 2009. ICEMI '09. 9th International Conference on. pp. 382-385.
[38] Bornaz L, Rinaudo F (2004) Terrestrial laser scanner data processing. Available: http://citeseerx.ist.psu.edu/viewdoc/download?doi=10.1.1.64.8938&rep=rep1&type=pdf. Accessed 2011 Nov 8.
[39] Bu L, Zhang Z (2008) Application of point clouds from terrestrial 3D Laser Scanner for deformation measurements. In: The International Archives of the Photogrammetry, Remote Sensing and Spatial Information Sciences. Vol. XXXVII. Part B5. Beijing. pp. 545-548. Available: http://www.isprs.org/proceedings/XXXVII/congress/5_pdf/95.pdf. Accessed 2011 Nov 8.
[40] Carlson W D (2006) Three-dimensional imaging of earth and planetary materials. Earth and Planetary Science Letters 249(3-4): 133-147.
[41] Gordon S J, Lichti D D (2004) Terrestrial laser scanners with a narrow field of view: the effect on 3-D reaction solutions. Survey Review 37(292): 22.
[42] Guarnieri A, Pirotti F, Pontin M, Vettore A (2006) 3D Surveying for Structural analysis Applications, In: Proceedings 3rd IAG / 12th FIG Symposium, Baden, May 22-24, 2006. Available: http://www.fig.net/commission6/baden_2006/PDF/LS1/Guarnieri.pdf. Accessed 2011 Nov 01.
[43] Kaasalainen S, Krooks A, Kukko A, Kaartinen H (2009) Radiometric Calibration of Terrestrial Laser Scanners with External Reference Targets. Remote Sensing 1(3): 144-158.
[44] Kern F (2002) Precise Determination of Volume with Terrestrial 3D-Laser scanner. In: Kahmen H. Niemeier W, Retscher G, editors. 2nd Symposium on Geodesy for Geotechnical and Structural Engineering: papers presnted at the symposium in Berlin, Germany, May 21-24, 2002. Vienna: Department of Applied and Engineering Geodesy, Institute of Geodesy and Geophysics, Vienna University of Technology. pp. 531-534.
[45] Lichti D D, Goerdon S J, Steward M P (2002) Groundbased laser scanners: operations, systems and applications. Geomatica 56: 21-33.
[46] MacMillan R A, Martin T C, Earle T J, McNabb D H (2003) Automated analysis and classification of landform using high-resolution digital elevation data: applications and issues. Canadian Journal of Remote Sensing 29: 592-606.
[47] Monserrat O, Crosetto M (2008) Deformation measurement using terrestrial laser scanning data and least squares 3 D surface matching, ISPRS Journal of Photogrammetry and Remote Sensing 63(1): 142-154.
[48] Pfeifer N, Lichti D D (2004) Terrestrial Laser Scanning. GIM International 12: 50-53. [49] Pflipsen B (2006) Volume Computation - a comparison of total station versus laser
scanner and different software. Master’s Thesis in Geomatics. Available: http://hig.diva-portal.org/smash/ get/diva2:120447/FULLTEXT01. Accessed 2011 Nov 3.
[50] Schmid T, Schack-Kirchner H, Hildebrand E (2004) A case study of terrestrial laser-scanning in erosion research: calculation of roughness indices and volume balance at a logged forest site International Archives of Photogrammetry, Remote Sensing and Digital Information Sciences 36: 114-118.
Use of Terrestrial 3D Laser Scanner in Cartographing and Monitoring Relief Dynamics and Habitation Space from Various Historical Periods 73
[51] Slob S, Hack H R G K (2004) 3-D Terrestrial Laser Scanning a New Field Measurement and Monitoring Technique. In: Hack R, Azzam R, Charlier R, editors. Engineering Geology for Infrastructure Planning in Europe. A European Perspective. Berlin, New York: Springer. pp. 179-190.
[52] Soudarissanane S, Lindenbergh R, Gorte B (2008) Reducing the error in terrestrial laser scanning by optimizing the measurement set-up. In: Chen J, Jiang J, Maas H-G, editors. The International Archives of the Photogrammetry, Remote Sensing and Spatial Information Sciences. Vol. XXXVII. Part B5. Beijing 2008. Beijing. pp. 615-620. Available: http://www.isprs.org/proceedings/XXXVII/ congress/5_pdf/182.pdf. Accessed 2011 Nov 5.
[53] Tsakiri M, Lichti D, Pfeifer N (2006). Terrestrial Laser Scanning for Deformation Monitoring, In: Proceedings 3rd IAG / 12th FIG Symposium, Baden, May 22-24, 2006. Available: http://www.fig.net/commission6/baden_2006/PDF/LS2/Tsakiri.pdf. Accessed 2011 Nov 23.
[54] Voegtle T, Schwab I, Landes T (2008) Influences of different materials on the measurement of a Terrestrial Laser Scanner (TLS). In: Chen J, Jiang J, Maas H-G, editors. The International Archives of the Photogrammetry, Remote Sensing and Spatial Information Sciences. Vol. XXXVII. Part B5. Beijing 2008. Beijing. pp. 1061-1066. Available: http://www.isprs.org/proceedings/XXXVII/ congress/5_pdf/107.pdf. Accessed 2011 Nov 5.
[55] Bacauanu V (1968) Campia Moldovei. Studiu geomorphologic. București: Editura Academiei. 220 p.
[56] Bacauanu V, Barbu N, Pantazica M, Ungureanu A, Chiriac D (1980) Podisul Moldovei. Natura, om, economie. Bucuresti: Editura Stiintifica si Enciclopedica. 350 p.
[57] Boghian D (2004) Comunitatile cucuteniene din bazinul Bahlui. Suceava: Editura Bucovina Istorica. 246 p.
[58] Branzila M (1999) Geologia partii sudice a Campiei Moldovei. Iasi: Editura Corson. 221 p. [59] Cotiuga V, Cotoi O (2004) Parcul arheologic experimental de la Cucuteni. In: Petrescu-
Dimbovita, Valeanu M C. Cucuteni-Cetatuie. Monografie arheologică. Piatra Neamt: Editura Constantin Matasa. pp. 337-351.
[60] Ionita I (2000) Geomorfologie aplicata. Iasi: Editura Universitatii “Al.I.Cuza”. 230 p. [61] Ionita I (2006) Gully development in the Moldavian Plateau of Romania. Catena 68(2-3):
133-140. [62] Motoc M, Taloescu I, Negut N (1979) Estimarea ritmului de dezvoltare a ravenelor.
Buletinul Informativ ASAS 8: 183-193. [63] Pantazica M (1974) Hidrografia Cimpiei Moldovei. Iasi: Editura Junimea. 319 p. [64] Poghirc P (1972) Satul din Colinele Tutovei. Bucuresti: Editura Stiintifica. 240 p. [65] Radoane M, Ichim I, Radoane N (1995) Gully distribution and development in
Moldavia, Romania. Catena 24: 127-146. [66] Radoane M, Radoane N, Ichim I, Surdeanu V (1999) Ravenele. Forme, procese, evolutie.
Cluj-Napoca: Editura Presa Universitara Clujeana. 266 p. [67] Romanescu G, Romanescu G, Stoleriu C, Ursu A (2008) Inventarierea si tipologia
zonelor umede si apelor adanci din Podisul Moldovei. Iasi: Editura Terra Nostra. 242 p. [68] Barnolas M, Rigo T, Llasat M C (2010) Characteristics of 2-D convective structures in
Catalonia (NE Spain): an analysis using radar data and GIS. Hydrology and Earth System Science 14: 129–139. Doi:10.5194/hess-14-129-2010.
Cartography – A Tool for Spatial Analysis 74
[69] Xie H, Jia H (2010) The Development of 3D Laser Scanning Technique and Its Applications in Land Reclamation. Information Engineering and Electronic Commerce 2: 1-4. Doi:10.1109/IEEC.2010.5533250.
[70] Rinaudo F, Nex F (2011) LIDAR e Fotogrammetria Digitale verso una nuova integrazione. Geomedia 3: 14-22.
[71] Lee I, Schenk T (2001) 3D Perceptual Organization of Laser Altimetry Data. International Archives of Photogrammetry and Remote Sensing 34(3/W4): 119-127.
[72] Marzolff I, Poesen J (2009) The potential of 3D gully monitoring with GIS using high-resolution aerial photography and a digital photogrammetry system. Geomorphology 111(1-2): 48-60.
[73] Mikoš M, Vidmar A, Brilly M (2005) Using a laser measurement sydtem for monitoring morphological changes on the Strug rock fall, Slovenia. Natural Hazards and Earth System Sciences 5: 143-153.
[74] Bretar F, Chauve A, Bailly J-S, Mallet C, Jacome A (2009) Terrain surfaces and 3-D land10 cover classification from small footprint full-waveform lidar data: application to badlands. Hydrology and Earth System Science 13: 1531–1544. Ddoi:10.5194/hess-13-1531-2009.
[75] Leica HDS3000 data sheet. 2006. Available: http://www.leica-geosystems.com/hds/en/ lgs_5574.htm. Accessed 2011 Apr 22.
[76] James T D, Carbonneau P E, Lane S N (2007) Investigating the effects of DEM error in scaling analysis. Photogrammetric engineering and remote sensing 73(1): 67–78.
[77] Erhan E (2001) Consideratii privind resursele climatice ale Moldovei. Lucrarile Seminarului Geografic “Dimitrie Cantemir” 19-20: 211-226.
[78] Blong R J, Graham O P, Veness J A (1982) The role of side wall processes in gully development; some N.S.W. examples. Earth Surface Processes and Landforms 7: 381-385.
[79] Bradford J M, Piest R F, Spomer R G (1978) Failure sequence of gully headwalls in Western Iowa. Soil Science Society of America Journal 42(2): 323-328.
[80] Bull W B (1997) Gully processes and modeling. Progress in Physical Geography 21(3): 354-374.
[81] De Oliveira M A T (1990) Slope geometry and gully erosion development: Bananal, Sao Paulo, Brazil. Zeitschrift. für Geomorphology N.F. 34(4): 423-434.
[82] Harvey A M (1992) Process interactions, temporal scales and the development of hillslope gully system: Howgill Fells, northwest England. Geomorphology 5: 323-344.
[83] Heede, B.H. 1976. Gully development and Control: The Status of our Knowledge. Fort Collins, Colo.: Rocky Mountain Forest and Range Experiment Station. 42 p.
[84] Heritage G, Hetherington D (2007) Towards a protocol for laser scanning in fluvial geomorphology. Earth Surface Processes and Landforms 32: 66-74.
[85] Piest R F, Bradford J M, Wyatt G M (1975) Soil Erosion and Sediment transport from gully. Journal of the Hydraulics Division 101(1): 65-80.
[86] Vandaele K, Poesen J, Govers G, Wesenael van B (1996) Geomorphic threshold conditions for ephemeral gully incision. Geomorphology 16(2): 161-173.
[87] Ursulescu N (2006) Donées récentes concernant l’histoire des communautés énéolithique de la civilisation Cucuteni. Acta Terrae Septemcastrensis 5: 79-113.