landslide monitoring using terrestrial laser scanner: georeferencing and … · 2012-08-01 ·...
TRANSCRIPT

LANDSLIDE MONITORING USING TERRESTRIAL LASER SCANNER:
GEOREFERENCING AND CANOPY FILTERING ISSUES IN A CASE STUDY
M. Barbarella a,, M. Fiani b
a DICAM, Università di Bologna, Viale Risorgimento 2, 40136 Bologna, Italy – [email protected]
b DICIV, Università di Salerno, Via Ponte Don Melillo 1 Fisciano (SA), Italy – [email protected]
Commission V, WG V/3
KEY WORDS: LIDAR, TLS, Monitoring, Landslide, DEM/DTM, Reliability, Accuracy
ABSTRACT:
In order to define a methodology that faces the major critical issues, we used a Terrestrial Laser Scanner to monitor a large landslide
that caused significant disruptions both to an important state road and to a major railway line in Italy. To survey the landslide we
used three different models of Terrestrial Laser Scanners, including a "full wave form" one, potentially useful for filtering vegetation
from the data. The output of each measurement campaign is a Digital Surface Model referred to a unique reference system. Starting
from the DSMs we produced the Digital Terrain Models, one for each survey. The use of different models of TLS together with the
software packages recommended by the companies for data processing, allowed us to compare the surveys and to evaluate the
reliability and the accuracy of results. The comparison of data has been useful in order to identify and analyse over time the areas of
greatest deformation and the directions of landslide movement and it also gives us some elements about the validity of the technique
in this kind of applications. The laser surveys have shown a strong dynamic of the slope but have also highlighted some difficulties
in order to efficiently filtering the data. Using two different kinds of TLS, full wave form and mono eco, on the same portion of
landslide allows us to make comparisons between the two methodologies for landslide monitoring in a real-world context.
1. INTRODUCTION
In the analysis of landslides (predicting, monitoring and alerting
for early warning, monitoring for change detection, etc.) a
variety of geomatic techniques may be used, going from the
most effective established techniques (use of RT GNSS
receivers, Total Station and levelling surveys when applicable )
to the most innovative ones like SAR interferometry (Pieraccini
et Al., 2006) Airborne Laser Scanning, remote sensing.
All of them present some critical aspects and strengths as far as
landslide monitoring applications are concerned. Some
difficulties in surveying a landslide can be caused by the area
orientation, the slope gradient, the presence of canopy and the
visibility from the stable points.
In order to detect large surfaces one should use a variety of
techniques, from the most efficient ones for a global
representation of the whole area to those that enable high-
precision measurements of single points or areas. For repeated
measurements of small areas some methodologies are
nevertheless very ineffective. Among the suitable techniques,
the Terrestrial Laser Scanner (TLS) is one of the most
promising and most generally applicable (Prokop and
Panholzer, 2009). The Terrestrial Laser Scanners allow us to
survey in a very fast, efficient and precise way a number of
buildings and industrial structures, which have a well-defined
geometry and which can eventually be modelled to a known
shape. They are very useful because of their ability to describe
in details the geometry of objects, and are also used for
surveying statues and archaeological sites.
In the case of terrain surveys (for example landslides and
quarries) characterized by a very complex shape and which are
not mathematically modelled, however, one can encounter
problems both in the surveying and in the raw data processing.
The visibility between the instrument and the ground is often
limited due to terrain morphology (vertical and horizontal
undulations, steps), making it difficult to identify the laser
station points. In addition, the soil is often covered with
vegetation and trees: the latter create shadow zones of the
ground making them more difficult to detect. The presence of
low vegetation and grass makes it very difficult to distinguish
the true ground surface within the laser point clouds.
It can be therefore troublesome to extract the DTM from the
DSM: this reduces the reliability and the accuracy of the survey.
This problem can have negative effects on the reliability of the
survey especially in the case of the monitoring of ground
deformation, performed through the comparison of repeated
surveys carried out at regular intervals. To estimate the shape
change of a landslide or of a quarry and which portion has
remained stable, and to determine the amount of material that
has moved or has been removed is here a problem.
The comparison is performed on the surfaces reconstructed by
interpolating the point clouds; we suppose that such surfaces
represent the shape of the ground at the time of that particular
survey. If the vegetation filtering has not been successful and
the DTM has not been properly rebuilt, the comparison is not
reliable because it takes into account the change in vegetation
occurred in the period between the two surveys.
Another problem which is not always adequately considered
and solved is the need for a reference system that remains very
stable over time, where the point positions measured in repeated
surveys may be framed. In order to compare two surveys carried
out at different times it is mandatory that both surveys have
been framed in the same reference system; if this does not
remain stable over time, the movement of the reference points
leads to a wrong estimate of the positions of the laser station
and of the point clouds. The reconstructed surface will be
traslated with respect to what it should be.
The comparison of the surfaces coming from the two surveys
will show fictitious strong variations. Nevertheless the LiDAR
technique could be a viable alternative to the traditional
surveying methods in surveying large areas and producing a 3D
model of the landslide slope in a direct way.
International Archives of the Photogrammetry, Remote Sensing and Spatial Information Sciences, Volume XXXIX-B5, 2012 XXII ISPRS Congress, 25 August – 01 September 2012, Melbourne, Australia
157

When we apply the technique to a real case a lot of difficulties
arise, due to the nature of sites, to the large size of the area to
survey, to the great distance of the station points from the
sliding slope, to the presence of canopy and finally to the need
to establish a reference frame for surveys that is stable in time.
2. SURVEYING METHODOLOGIES
The numerical modelling of a landslide from a point cloud
obtained with a terrestrial laser scanner can be difficult in
presence of vegetation: for example trees can hide the ground
for an extent that depends on the beam inclination with respect
to the landslide surface: this makes difficult the reconstruction.
Grass and shrubs also make difficult to distinguish the ground
surface from the vegetation. The morphology of the terrain
(slope, ripples) limits the areas where you can set up the TLS.
Often the laser beam is slightly tilted with respect to the ground
surface with dangerous effects on the perspective one obtains.
When planning the survey the choice of best tool depends
essentially on the maximum distance between the instrument
and the ground: the minimum step of the angular increases and
the acquisition frequency are less important, since all the
modern instruments offer excellent performances.
The number of points acquired for surveying in a fast way vast
areas is very high, and can cause problems during processing:
often the first process step is thus thinning the point clouds. The
choice of a wide range instrument is not a problem since some
vendors offer TLS normally with a range of several hundred
meters and even of one or two kilometres. With regard to the
choice of the level of performance of the instrument, a
significant improvement can instead be given by using a "full
wave" instrument (Mallet and Bretar, 2009) , that discretizes the
TLS return waveform in order to identify the various obstacles
hiding the course of the laser beam in a given direction at
different distances: this helps filtering the noise introduced by
the vegetation using the appropriate software tools. We have
used three different TLS instruments, one of which “full wave”,
to verify whether in a medium distance terrestrial survey it
could give some advantages over other instruments in filtering
data. When the purpose of a TLS survey is to monitor ground
deformations it is essential to identify a set of points that are
stable in time and can form the fixed reference system in which
a number of repeated measurements made at different moments
time can be framed. Such fixed points (we will refer to them as
"near reference ") should be placed outside the monitoring area,
far enough not feel the effects of the phenomenon one is
studying, but close enough to make easy and accurate the
connection between them and both the laser station and the
target points.The laser station must be placed as close as
possible to the surveying area, in a frontal position, and it must
be completely visible full. Because of this it cannot be always
set up on a stable area: this is even more true for the targets that
are used for recording and georeferencing the data. Therefore,
in each survey we have measured both the positions of station
points and the target ones. The well-materialized points, stable
in time, that implement the “near reference”, can be placed at a
larger distance: they do not need to be visible from the
surveying area. The connection with all or some of the targets
and station points it is generally possible by means of GPS
receivers. If some targets are in a position that does not allow
the GPS survey (for example close to a steep slope), their
position can be measured using a Total Station, starting from
the station points (from which they are certainly visible),
oriented in the direction of other points measured with the GPS.
The connection between the “near reference” points and the
landslide ones can also be done using Real Time Kinematic
(RTK) methodology, which assures a higher execution speed
and a precision that, even if is lower than the one achievable
with static GPS baselines, can be surely an acceptable survey
methodology. Given the importance of ensuring the stability of
the reference system used in the surveys done at different times
it is also appropriate that the points of the "near reference" are
themselves monitored. In order to keep the cost down and to
achieve high accuracies one should connect these points with
permanent GNSS stations, which are now widespread on Italian
territory, on these “near reference” points (this is done in
addition to the use of GPS receivers).
The baselines between the reference points and the Permanent
Stations (PS) are determined by measurements of long duration
taken on the reference points: this is also needed when
surveying a landslide site. The data needed to characterize the
PS data are generally free for post processing. The time one
needs to station on the reference points depends on the distance
between them and the PS: typically it is appropriate to leave the
receiver on a reference point for the full working day, even
when the measurements related to the landslide site are shorter.
This solution also involves the choice of a geodetic system.
The PS are generally defined in a Terrestrial Reference System
such as the ITRS (current frame ITRF08). In this reference
system their coordinates vary over time due to the motion of the
plate to which they belong; in Europe the Euro-Asian plate
moves about 2 cm/y with respect to the ITRS. To make the PS
coordinates more stable over time, a Geodetic System defined
exclusively by reference stations materialized on stable part of
the plate (in Europe this is the ETRS89) should be used.
We can conclude that the geodetic system ETRF89 (the current
frame is the ETRF2000), that guarantees over time very small
movements (a few mm/y) of the reference stations used for the
laser scanner survey, should be used for monitoring purposes.
With regard to the coordinate system to be adopted for laser
data processing, it should be noted that more TLS stations are
often needed in case of vast areas, and it may be necessary to
take into account the curvature of the earth.
In TLS survey each station refers to a set of three dimensional
orthogonal Cartesian system where the coordinates of the points
belonging to the clouds are calculated starting from the
measured 3d polar coordinates (azimuthal and zenital angles,
radial distance). This triad has an axis (Z) along the vertical
direction and the local XY plane on the horizontal plane. For
point clouds georeferencing we must then perform a
transformations between the geocentric system where GPS
measurements are defined and the instrumental system. Since a
geocentric system is not adequate to describe in a immediately
intuitive way the altimetric trend of the ground, it may be
suitable to use a cartographical representation for the
planimetric component and the ellipsoidal height for altimetry
position of the points.
In case of ground deformation monitoring is not necessary to
apply the geoid undulation in order to express the data as
orthometric heights, since the correction is constant in time.
In our tests we have implemented a number of software tools
for the transformation of the points of the clouds from a type of
coordinates to another one (geocentric, ellipsoidal, local
geodetic, cartographic). In order to define a methodology that
could overcome the major critical issues, we used a TLS to
monitor a large landslide (more than 10 ha) that caused
significant disruptions both to an important state road and to a
major railway line in Italy. As far as the surveying methodology
is concerned, in the attempt to filter as effectively as possible
the vegetation, we used three different models of Terrestrial
Laser Scanner: we selected two long range models (Optech
ILRIS 36D and Riegl VZ-400) and a 150m range one (Leica
C10) that we used in the lower part of the landslide, where the
International Archives of the Photogrammetry, Remote Sensing and Spatial Information Sciences, Volume XXXIX-B5, 2012 XXII ISPRS Congress, 25 August – 01 September 2012, Melbourne, Australia
158
distance between the station point and the
smaller. One of them is a "full wave" instrument
used to test whether this technology is able to
improvements. In the inferior part of the landslide
same campaign, we used in rapid succession
and the Leica C10 in order to make a direct comparison
between the two instruments.
As for the survey frame:
- the target and the TLS stations have been surveyed by
baselines referred to the “near reference”;
- the “near reference” consists in two pillars
concrete wall in the stable area located at walking
the survey one;
- the two pillars were themselves connected
belonging to a NRTK Network (Network Real
for real time surveying service of the Campania
(Castellabate) and 38 (Sapri) km away from
In view of the distance between the landslide area
we made continuous GPS observations during two
days. We show the scheme of the “stable frame”
Figure 1. RTK Permanent GNSS Stations (
Once the coordinates of the permanent stations
ETRF2000 system, we calculated the adjusted
two pillars (we used the mean value of
Starting from these two pillars, which are considered as fixed
we finally calculated the coordinates both of the
station points, always in the European System
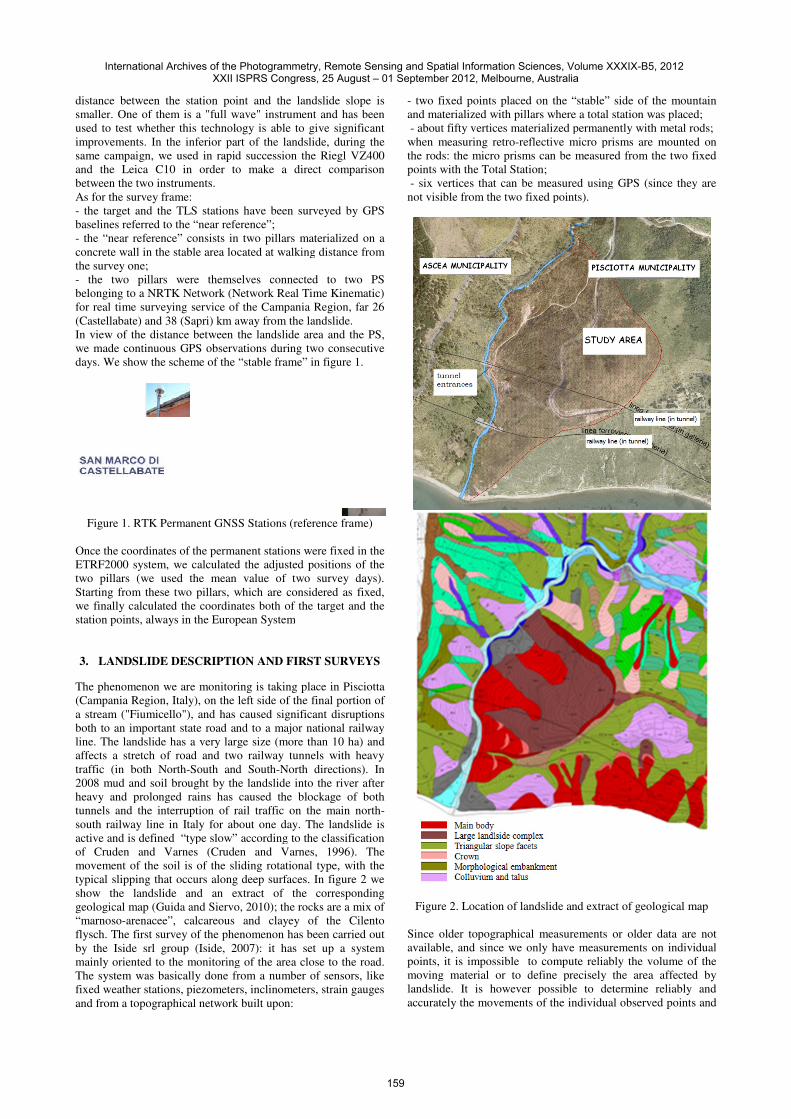
3. LANDSLIDE DESCRIPTION AND FIRST SURVEY
The phenomenon we are monitoring is taking place in Pisciotta
(Campania Region, Italy), on the left side of the final portion of
a stream ("Fiumicello"), and has caused significant disruptions
both to an important state road and to a major national railway
line. The landslide has a very large size (more than 10 ha) and
affects a stretch of road and two railway tunnels with heavy
traffic (in both North-South and South-North directions). In
2008 mud and soil brought by the landslide into the river after
heavy and prolonged rains has caused the blockage of both
tunnels and the interruption of rail traffic on the main north
south railway line in Italy for about one day.
active and is defined “type slow” according
of Cruden and Varnes (Cruden and Varnes,
movement of the soil is of the sliding rotational type, with the
typical slipping that occurs along deep surfaces. In figure
show the landslide and an extract of the correspondi
geological map (Guida and Siervo, 2010); the rocks are a mix of
“marnoso-arenacee”, calcareous and clayey of the Cilento
flysch. The first survey of the phenomenon has been carried out
by the Iside srl group (Iside, 2007): it has set up a system
mainly oriented to the monitoring of the area close to the road.
The system was basically done from a number of sensors, like
fixed weather stations, piezometers, inclinometers, strain gauges
and from a topographical network built upon:
the landslide slope is
instrument and has been
is able to give significant
of the landslide, during the
succession the Riegl VZ400
in order to make a direct comparison
been surveyed by GPS
pillars materialized on a
located at walking distance from
connected to two PS
Real Time Kinematic)
Campania Region, far 26
the landslide.
between the landslide area and the PS,
GPS observations during two consecutive
“stable frame” in figure 1.
RTK Permanent GNSS Stations (reference frame)
stations were fixed in the
the adjusted positions of the
mean value of two survey days).
are considered as fixed,
coordinates both of the target and the
European System
AND FIRST SURVEYS
The phenomenon we are monitoring is taking place in Pisciotta
(Campania Region, Italy), on the left side of the final portion of
a stream ("Fiumicello"), and has caused significant disruptions
and to a major national railway
(more than 10 ha) and
a stretch of road and two railway tunnels with heavy
North directions). In
lide into the river after
heavy and prolonged rains has caused the blockage of both
tunnels and the interruption of rail traffic on the main north-
south railway line in Italy for about one day. The landslide is
active and is defined “type slow” according to the classification
Cruden and Varnes (Cruden and Varnes, 1996). The
sliding rotational type, with the
typical slipping that occurs along deep surfaces. In figure 2 we
landslide and an extract of the corresponding
; the rocks are a mix of
arenacee”, calcareous and clayey of the Cilento
The first survey of the phenomenon has been carried out
: it has set up a system
monitoring of the area close to the road.
The system was basically done from a number of sensors, like
fixed weather stations, piezometers, inclinometers, strain gauges
upon:
- two fixed points placed on the “stable” side of the mountain
and materialized with pillars where a total station was placed;
- about fifty vertices materialized permanently with metal
when measuring retro-reflective micro prisms are mounted
the rods: the micro prisms can be measured from the two fixe
points with the Total Station;
- six vertices that can be measured using GPS (since they are
not visible from the two fixed points).
Figure 2. Location of landslide and
Since older topographical measurements or older data are not
available, and since we only have measurements on individual
points, it is impossible to compute reliably the volume of the
moving material or to define precisely the area affecte
landslide. It is however possible to determine reliably and
accurately the movements of the individual observed points and
two fixed points placed on the “stable” side of the mountain
and materialized with pillars where a total station was placed;
about fifty vertices materialized permanently with metal rods;
reflective micro prisms are mounted on
the rods: the micro prisms can be measured from the two fixed
six vertices that can be measured using GPS (since they are
not visible from the two fixed points).
and extract of geological map
Since older topographical measurements or older data are not
available, and since we only have measurements on individual
points, it is impossible to compute reliably the volume of the
moving material or to define precisely the area affected by
t is however possible to determine reliably and
accurately the movements of the individual observed points and
International Archives of the Photogrammetry, Remote Sensing and Spatial Information Sciences, Volume XXXIX-B5, 2012 XXII ISPRS Congress, 25 August – 01 September 2012, Melbourne, Australia
159
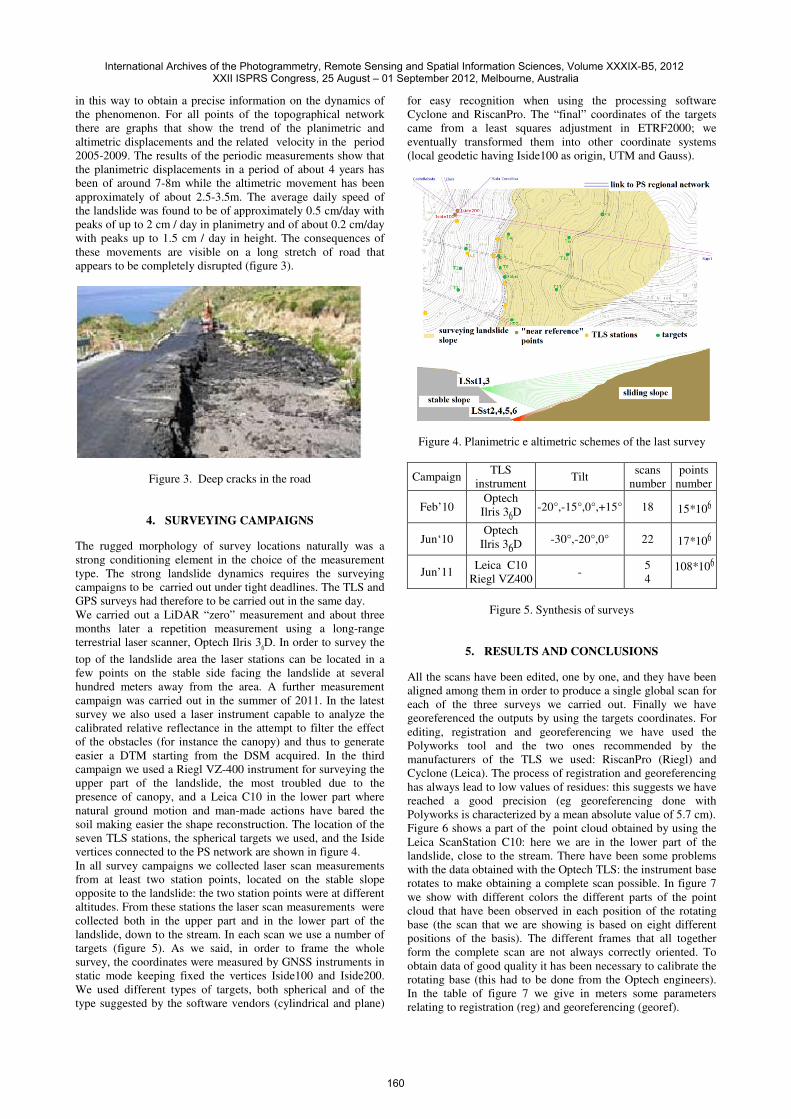
in this way to obtain a precise information on the dynamics of
the phenomenon. For all points of the topographical network
there are graphs that show the trend of the planimetric and
altimetric displacements and the related velocity in the period
2005-2009. The results of the periodic measurements show that
the planimetric displacements in a period of about 4 years has
been of around 7-8m while the altimetric movement has been
approximately of about 2.5-3.5m. The average daily speed of
the landslide was found to be of approximately 0.5 cm/day with
peaks of up to 2 cm / day in planimetry and of about 0.2 cm/day
with peaks up to 1.5 cm / day in height. The consequences of
these movements are visible on a long stretch of road that
appears to be completely disrupted (figure 3).
Figure 3. Deep cracks in the road
4. SURVEYING CAMPAIGNS
The rugged morphology of survey locations naturally was a
strong conditioning element in the choice of the measurement
type. The strong landslide dynamics requires the surveying
campaigns to be carried out under tight deadlines. The TLS and
GPS surveys had therefore to be carried out in the same day.
We carried out a LiDAR “zero” measurement and about three
months later a repetition measurement using a long-range
terrestrial laser scanner, Optech Ilris 36D. In order to survey the
top of the landslide area the laser stations can be located in a
few points on the stable side facing the landslide at several
hundred meters away from the area. A further measurement
campaign was carried out in the summer of 2011. In the latest
survey we also used a laser instrument capable to analyze the
calibrated relative reflectance in the attempt to filter the effect
of the obstacles (for instance the canopy) and thus to generate
easier a DTM starting from the DSM acquired. In the third
campaign we used a Riegl VZ-400 instrument for surveying the
upper part of the landslide, the most troubled due to the
presence of canopy, and a Leica C10 in the lower part where
natural ground motion and man-made actions have bared the
soil making easier the shape reconstruction. The location of the
seven TLS stations, the spherical targets we used, and the Iside
vertices connected to the PS network are shown in figure 4.
In all survey campaigns we collected laser scan measurements
from at least two station points, located on the stable slope
opposite to the landslide: the two station points were at different
altitudes. From these stations the laser scan measurements were
collected both in the upper part and in the lower part of the
landslide, down to the stream. In each scan we use a number of
targets (figure 5). As we said, in order to frame the whole
survey, the coordinates were measured by GNSS instruments in
static mode keeping fixed the vertices Iside100 and Iside200.
We used different types of targets, both spherical and of the
type suggested by the software vendors (cylindrical and plane)
for easy recognition when using the processing software
Cyclone and RiscanPro. The “final” coordinates of the targets
came from a least squares adjustment in ETRF2000; we
eventually transformed them into other coordinate systems
(local geodetic having Iside100 as origin, UTM and Gauss).
Figure 4. Planimetric e altimetric schemes of the last survey
Campaign TLS
instrument Tilt
scans
number
points
number
Feb’10 Optech
Ilris 36D -20°,-15°,0°,+15° 18 15*106
Jun‘10 Optech
Ilris 36D -30°,-20°,0° 22 17*106
Jun’11 Leica C10
Riegl VZ400 -
5
4 108*106
Figure 5. Synthesis of surveys
5. RESULTS AND CONCLUSIONS
All the scans have been edited, one by one, and they have been
aligned among them in order to produce a single global scan for
each of the three surveys we carried out. Finally we have
georeferenced the outputs by using the targets coordinates. For
editing, registration and georeferencing we have used the
Polyworks tool and the two ones recommended by the
manufacturers of the TLS we used: RiscanPro (Riegl) and
Cyclone (Leica). The process of registration and georeferencing
has always lead to low values of residues: this suggests we have
reached a good precision (eg georeferencing done with
Polyworks is characterized by a mean absolute value of 5.7 cm).
Figure 6 shows a part of the point cloud obtained by using the
Leica ScanStation C10: here we are in the lower part of the
landslide, close to the stream. There have been some problems
with the data obtained with the Optech TLS: the instrument base
rotates to make obtaining a complete scan possible. In figure 7
we show with different colors the different parts of the point
cloud that have been observed in each position of the rotating
base (the scan that we are showing is based on eight different
positions of the basis). The different frames that all together
form the complete scan are not always correctly oriented. To
obtain data of good quality it has been necessary to calibrate the
rotating base (this had to be done from the Optech engineers).
In the table of figure 7 we give in meters some parameters
relating to registration (reg) and georeferencing (georef).
International Archives of the Photogrammetry, Remote Sensing and Spatial Information Sciences, Volume XXXIX-B5, 2012 XXII ISPRS Congress, 25 August – 01 September 2012, Melbourne, Australia
160

Figure 6. Point clouds, third survey
Survey
campaing
Max error
(m)
Min error
(m)
St Dev
(m)
1 0.3 -0.3 0.08
0.015 0,007 0.004
2 0.2 -0.2 0.03
0.062 0.033 0.011
Figure 7. A single point cloud acquired with Optech
Once these steps have been done a number of DTMs of the
landslide are available. Since all surveys have been framed in
the same reference system, it is possible to compare the DTMs
obtained at different times, by interpolating the point clouds on
a grid: this allows to identify and analyse how the areas with
largest deformation evolve in time, and to estimate the
directions of landslide movement.
In order to obtain a detailed comparison between different
epochs, we have worked on small portions of the area
made the computational problem far easier to deal with.
different portions have been selected by assuming geological
homogeneity of the terrain but also the presence of useful
details (probably) stable over time: we expect that
upstream and the downstream railways tunnels, clearly visible
on the scans, should not have moved significantly in the time
elapsed between the two surveys.
The comparison of data coming from the first two campaigns
gives us some elements about the validity o
this kind of applications. The laser surveys have shown a strong
dynamic of the slope. Figure 8 shows an example of the
analysis: the magnitude of the deplacment is represented in a
chromatic scale. We have found that the displacement am
two successive surveys can reach the value of 50 cm. This
estimate is in agreement with what measured at individual
points by Total Station from the ISIDE group (Iside, 2007) in
previous years (2004-2009), and indicates a stable trend, that
continues regularly. The laser scanner survey allows to map the
behavior of different areas, provides a much more complete and
distributed information and facilitates the interpretation of the
local geo morphology.
, third survey (2011)
St Dev
(m) Operation
0.08 reg
0.004 georef
0.03 reg
0.011 georef
ingle point cloud acquired with Optech
Once these steps have been done a number of DTMs of the
all surveys have been framed in
the same reference system, it is possible to compare the DTMs
obtained at different times, by interpolating the point clouds on
this allows to identify and analyse how the areas with
largest deformation evolve in time, and to estimate the
In order to obtain a detailed comparison between different
epochs, we have worked on small portions of the area: this has
made the computational problem far easier to deal with. The
different portions have been selected by assuming geological
homogeneity of the terrain but also the presence of useful
details (probably) stable over time: we expect that both the
ream and the downstream railways tunnels, clearly visible
on the scans, should not have moved significantly in the time
The comparison of data coming from the first two campaigns
gives us some elements about the validity of the technique in
The laser surveys have shown a strong
Figure 8 shows an example of the
analysis: the magnitude of the deplacment is represented in a
We have found that the displacement among
two successive surveys can reach the value of 50 cm. This
estimate is in agreement with what measured at individual
group (Iside, 2007) in
2009), and indicates a stable trend, that
The laser scanner survey allows to map the
behavior of different areas, provides a much more complete and
distributed information and facilitates the interpretation of the
Figure 8. Comparison between two successive
We have also been able to compare the performances of
different instruments. In figures 9, 10 and 11
clouds detected by C10 and VZ400 on the same area, and the
difference obtained by considering the residuals of the points of
a first scan with respect to the surface obtained by interpolation
of the cloud measured in a second scan.
perfect, but already at the scale of the figure we can see that in
areas with poor or no vegetation (the lower part of the la
on east side and along the road) the height differences are very
regular, while in the higher part, where there is more vegetation,
the differences vary irregularly and have to be considered not
significant before of a detailed editing of the v
The presence of vegetation is not the only one problem of the
data. Figure 12 shows an effect not yet fully explained, which
leads to errors that are very clear close to the tunnel: the laser
stations were placed exactly at the tunnel entrance,
response of the internal part of the tunnel, not optically visible,
produces signals which are interpreted by the software of both
instruments as points located at a completely wrong height.
effect is not present in the first two surveys, whe
stations were placed slightly aside the tunnel entrance, not in
axis with the tracks.
Figure 9. Leica
Comparison between two successive surveys
have also been able to compare the performances of
9, 10 and 11 we show the point
clouds detected by C10 and VZ400 on the same area, and the
difference obtained by considering the residuals of the points of
first scan with respect to the surface obtained by interpolation
of the cloud measured in a second scan. Data editing is not yet
perfect, but already at the scale of the figure we can see that in
areas with poor or no vegetation (the lower part of the landslide
on east side and along the road) the height differences are very
regular, while in the higher part, where there is more vegetation,
the differences vary irregularly and have to be considered not
significant before of a detailed editing of the vegetation.
The presence of vegetation is not the only one problem of the
data. Figure 12 shows an effect not yet fully explained, which
leads to errors that are very clear close to the tunnel: the laser
stations were placed exactly at the tunnel entrance, and the
response of the internal part of the tunnel, not optically visible,
produces signals which are interpreted by the software of both
instruments as points located at a completely wrong height. This
effect is not present in the first two surveys, when the TLS
stations were placed slightly aside the tunnel entrance, not in
Leica survey
International Archives of the Photogrammetry, Remote Sensing and Spatial Information Sciences, Volume XXXIX-B5, 2012 XXII ISPRS Congress, 25 August – 01 September 2012, Melbourne, Australia
161

Figure 10. Riegl survey
Figure 11. Comparison between Riegl and Leica
The TLS allows to acquire in a short time the position of a huge
amount of points of the ground and therefore makes possible to
describe the entire surface of interest and not only some isolated
points. It is very important to link the survey to a frame that is
stable in time: this allows to monitor the variation of the shape
of the landslide.
The link to Permanent GNSS Stations and the use of a Geodetic
Reference Frame like ETRF2000 allows to solve the problem
without a significant increase of field work.
The editing of the data to reduce noise, first among
induced by the vegetation, requires a large amount of work:
without this it is not possible to use the data for a quantitative
precise analysis of the situation. There are also some
are difficult to explain as only determined from the shape of the
ground, although they can be filtered out easily due to their size.
survey
Comparison between Riegl and Leica point clouds
the position of a huge
amount of points of the ground and therefore makes possible to
describe the entire surface of interest and not only some isolated
It is very important to link the survey to a frame that is
or the variation of the shape
and the use of a Geodetic
Reference Frame like ETRF2000 allows to solve the problem
a to reduce noise, first among all the one
induced by the vegetation, requires a large amount of work:
without this it is not possible to use the data for a quantitative
There are also some effects that
xplain as only determined from the shape of the
ground, although they can be filtered out easily due to their size.
Riegl
Leica
Figure 12. An unexplained effect of
References
Cruden, D.M., Varnes, D.J., 1996.
Processes. Landslides: Investigation and Mitigation
A.K. & Schuster R.L. Eds., Transportation Research Board
Special Report 247. National Academy Press, WA, pp.36
Guida D., Siervo, V., 2010. In:
Structurally Complex Formations, Geologist Regional Ass.
Salerno.
Iside S.r.l., 2007. Servizio di monitoraggio dei corpi franosi
insistenti sulla ex s.s. n. 447 tra km 70 e 72 nel comune di
Pisciotta. http://www.centroiside.net
Mallet C., Bretar, F., 2009. Full-waveform topographic L
State-of-the-art. ISPRS Journal of Photogrammetry and Remote
Sensing, 64, pp 1-16.
Pieraccini, M. , Noferini, L. , Mecatti,
Galgaro, A., Zaltron, N., 2006.
Interferometry and Laser Scanning for Remote Monitoring of an
Urban Site Built on a Sliding Slope
Geoscience and Remote Sensing, 44
Prokop, A., Panholzer, H., 2009.
terrestrial laser scanning for monitoring slow moving
landslides. Nat Hazard Earth Sys, 9,
Acknowledgements
We thanks Giovanni Abate from Leica Instruments for Leica
C10 ScanStation lending and for the support they gave us in
2011 surveying campaign.
An unexplained effect of the railways
References
Cruden, D.M., Varnes, D.J., 1996. Landslides Types and
Landslides: Investigation and Mitigation, Turner
A.K. & Schuster R.L. Eds., Transportation Research Board
Special Report 247. National Academy Press, WA, pp.36-75.
Guida D., Siervo, V., 2010. In: Seminar on Landslides in
, Geologist Regional Ass. in
Servizio di monitoraggio dei corpi franosi
insistenti sulla ex s.s. n. 447 tra km 70 e 72 nel comune di
. http://www.centroiside.net (accessed 20 Apr. 2012).
waveform topographic Lidar:
ISPRS Journal of Photogrammetry and Remote
Mecatti, D. , Atzeni, C. , Teza, G.,
, N., 2006. Integration of Radar
Interferometry and Laser Scanning for Remote Monitoring of an
Urban Site Built on a Sliding Slope. IEEE Transactions on
44(9).
, H., 2009. Assessing the capability of
er scanning for monitoring slow moving
, 9, pp. 1921–1928.
Acknowledgements
We thanks Giovanni Abate from Leica Instruments for Leica
C10 ScanStation lending and for the support they gave us in
International Archives of the Photogrammetry, Remote Sensing and Spatial Information Sciences, Volume XXXIX-B5, 2012 XXII ISPRS Congress, 25 August – 01 September 2012, Melbourne, Australia
162