assessment of terrestrial laser scanner against different
TRANSCRIPT
C: 40 MANSOURA ENGINEERING JOURNAL, (MEJ), VOL. 46, ISSUE 1, MARCH 2021
Mansoura University
Faculty of Engineering
Mansoura Engineering Journal
(Ser. No. BFEMU-2011-1073)
Received: (14 November, 2020) - Revised: (4 January, 2021) - Accepted:
(2 February, 2021) Correspondence Author Ahmed M. Abd-Elmaaboud, Demonstrator,
Public Works Department, Ain Shams University, Faculty of Engineering,
Cairo, Egypt. (Email: [email protected]) Mohamed E. El-Tokhey, Professor of Surveying and Geodesy, Public
Works Department, Ain Shams University, Faculty of Engineering, Cairo,
Egypt. (Email: [email protected])
Ahmed E. Ragheb, Associate professor of Surveying and Geodesy, Public
Works Department, Ain Shams University, Faculty of Engineering, Cairo,
Egypt. (Email: [email protected])
Yasser M. Mogahed, Associate professor of Surveying and Geodesy, Public Works Department, Ain Shams University, Faculty of Engineering,
Cairo, Egypt. (Email: [email protected])
Ahmed M. Abd-Elmaaboud, Mohamed E. El-Tokhey, Ahmed E. Ragheb and Yasser M. Mogahed
KEYWORDS:
Terrestrial laser
scanner, RTK-GPS,
Total station, Accuracy.
Abstract— Terrestrial Laser Scanner (TLS) has become a familiar
instrument to be used in wide range of engineering application. It can be used
for the rapid capture of accurate and highly detailed 3D point cloud datasets.
The advantage of laser scanner is that it can record huge number of points in a
short period of time. The main idea in this contribution assesses the accuracy of
TLS relative to other traditional surveying instruments. This is done throughout
four different case studies. In all case studies the 3D coordinates, obtained using
total station (TS) are assumed the reference coordinates. First, a control point
network, that consists of nine points, is measured using TS, TLS, and real time
kinematic global navigation satellite system (RTK-GPS). The precision of each
instrument is investigated considering the standard deviation (SD) of
measurements. In addition, the accuracy of TLS and RTK-GPS is investigated
considering the measurements RMS. Secondly, a grid levelling for a 30,000m2
ground terrain was performed using TS and TLS. After words, the RMS of TLS
measurements is computed and a grid of 5mx5m is generated from both
surfaces; formed using TS and TLS measurements. Thirdly, the effect of
incidence angle on TLS measurements is assessed by measuring fifty-six points
fixed on a building façade using different incident angles. Those points were
measured using both TS and TLS, and then the absolute height differences
between TS and TLS measurements were calculated to figure out the effect of
decreasing the incidence angle on measurements. In the fourth case study, the
accuracy of TLS on steep-vertical cut measurements is investigated by surveying
a downhill area of 500m2 by both TS and TLS, the RMS of TLS measurements
was calculated. Finally, based on the obtained results, it was found that TLS
produces a higher vertical accuracy than RTK-GPS in measuring control point
networks. The RMS of TLS measurements was about 5cm. Moreover, TLS
incidence angle is not preferable to be less than 45 degrees as the accuracy
degrades significantly after this value. In steep-vertical cut measurements, TLS
obtained RMS almost of 6mm discrepancies with a lower measurement period.
Eventually, despite the fact that TLS is more expensive than traditional
surveying techniques, it is more beneficial in terms of time and effort saving. In
addition, it can figure out acceptable accuracy ranges with more detailed
surveyed data.
Assessment of Terrestrial Laser Scanner against
Different Surveying Techniques
AHMED M. ABD-ELMAABOUD, MOHAMED E. EL-TOKHEY, AHMED E. RAGHEB AND YASSER M. MOGAHED C: 41
I INTRODUCTION
N surveying, specifically in engineering projects, more
sophisticated instruments are employed such as, total
station, laser scanner and GPS, in order to improve the
efficiency and accuracy. Specific surveying techniques has
been commonly used throughout the history of surveying to
collect data from field measurements for various applications
with different accuracy capabilities and requirements. During
the past year a significant development of surveying
techniques has revolutionized the way of performing different
surveying tasks, resulted in enabling surveying professionals
to reach high accuracy and precision levels [1] .
Nowadays, surveying plays a vital role in almost every
engineering field in order to ensure an accurate engineering
work. Generally, the term accuracy is widely used in different
fields to express the quality of observations, measurements
or/and calculations. Surveying professionals -as well as those
who are involved in technical or scientific fields-differentiate
between accuracy and precision. Basically, accuracy can be
defined as a measurement of how closely the observations are
to a certain (true) value as observations are always subjected
to different errors. However, precision concerns about
measuring how a group of certain repeated observations are
close to one another. Talking about TLS, its accuracy is
dependent on the angle of sight and distance from the object to
be scanned [1] . As a result, each method has its own merits
and demerits in terms of accuracy that could be reached, time
consumption, effort, and expenditures. Thus, our aim in this
research is to assess the different accuracies that could be
reached using different techniques to figure out the optimum
approach for performing different surveying tasks.
II LITRATURE REVIEW
In the contribution given in [2] , a 50-hectare area was
surveyed with RTK-GPS, with four established reference
points and a base station. RTK-GPS method gave an accuracy
of 1cm in horizontal coordinate, while the less accuracy in
vertical direction.
Another experiment to assess the accuracy between RTK-
GPS and TS was carried out by Lin [3] . The results showed a
horizontal accuracy of 14mm using RTK-GPS, while TS was
capable of providing up to 16mm positional accuracy. According to Solomon [1] , accuracy, precision and time
consumption of different surveying instruments were assessed
and compared to each other, once between TS versus RTK-
GPS on the reference network and then TS versus TLS on the
façade of an L-shape building. The reference network was
established using a TS with a precision of 1mm standard
deviation for horizontal and vertical coordinates. RTK-GPS
technique was applied to the same network and the obtained
coordinates had a precision of 8mm and 1.5cm in the
horizontal and vertical directions, respectively. The accuracy
of the RTK-GPS measurements was expressed by its RMS
reaching 9mm in horizontal and 2.2cm in vertical coordinates.
Precision of the TS observations on the façade was determined
with a maximum standard deviation of 8mm in horizontal and
4mm in vertical coordinates. In addition, coordinates of the
fixed points on the façade were extracted from the TLS
measurements, with standard deviations of 1.6cm and 1.2cm
in horizontal and vertical coordinates were reached
respectively. The RMS for both horizontal and vertical
coordinates were 4mm and 7mm respectively.
III TERRESTRIAL LASER SCANNER
Laser scanning is a method where a surface is scanned or
sampled using laser technology [4] . It collects data on the
object’s shape and its appearance. Data collected can then be
used to establish digital 2D drawings or 3D models which can
be used widely in various applications. The power of laser
scanning techniques is that it can capture a great number of
points with high accuracy level in a relatively short time frame
[1] . It can be said that laser scanning is like taking a photo
with depth information [5] .
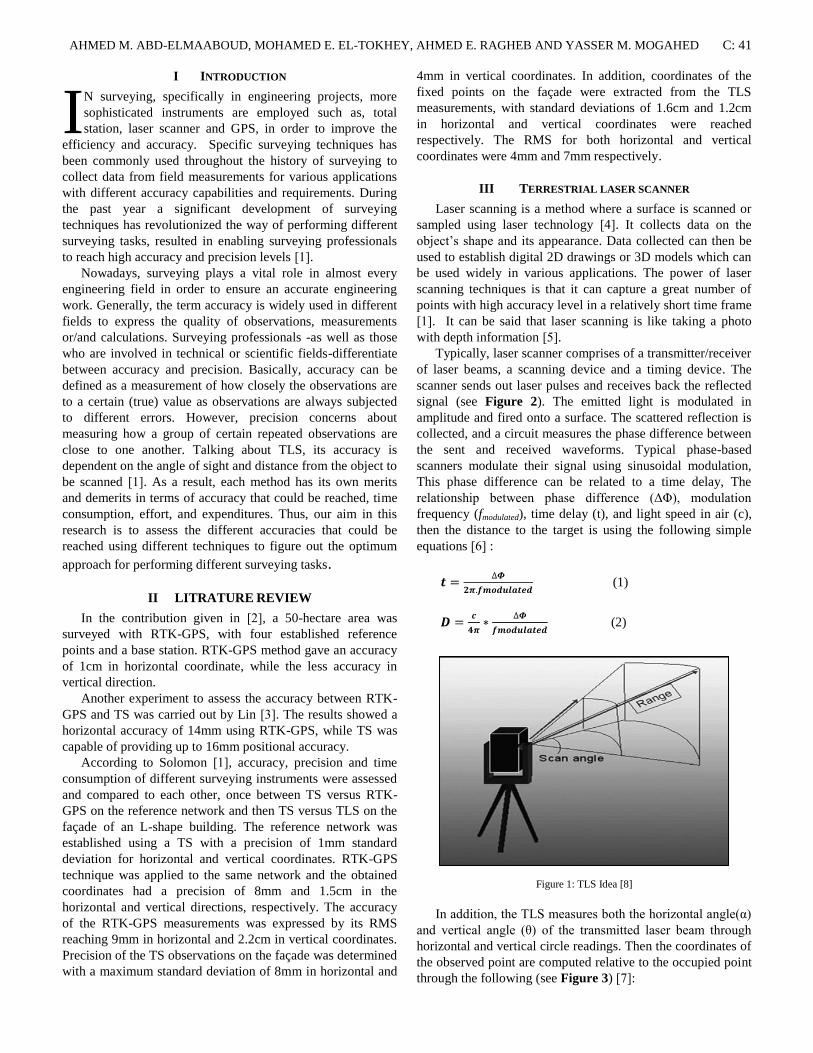
Typically, laser scanner comprises of a transmitter/receiver
of laser beams, a scanning device and a timing device. The
scanner sends out laser pulses and receives back the reflected
signal (see Figure 2). The emitted light is modulated in
amplitude and fired onto a surface. The scattered reflection is
collected, and a circuit measures the phase difference between
the sent and received waveforms. Typical phase-based
scanners modulate their signal using sinusoidal modulation,
This phase difference can be related to a time delay, The
relationship between phase difference (ΔΦ), modulation
frequency (fmodulated), time delay (t), and light speed in air (c),
then the distance to the target is using the following simple
equations [6] :
(1)
(2)
Figure 1: TLS Idea [8]
In addition, the TLS measures both the horizontal angle(α)
and vertical angle (θ) of the transmitted laser beam through
horizontal and vertical circle readings. Then the coordinates of
the observed point are computed relative to the occupied point
through the following (see Figure 3) [7] :
I
C: 42 MANSOURA ENGINEERING JOURNAL, (MEJ), VOL. 46, ISSUE 1, MARCH 2021
X= D cos θ. cos α (3)
Y= D cos θ. sin α (4)
Z= D sin θ (5)
Figure 2: Phase Shift TLS Principle [5]
Figure 3: Measurement TLS Principle [7]
Registration is the process of integrating the Scan Worlds
into a single coordinate system [1] . Each scan is referenced to
a specific local coordinate system. After that, all scans are
registered depending on the common targets that are pre-
established for this purpose using checker boards and spheres
(see Figure 4) [5] .
Figure 4: Registration of Two Scan Positions] [5
IV METHODOLOGY AND RESULTS
In order to figure out the accuracy of TLS compared to
other traditional surveying instruments; four different
approaches were performed in this research. In the following
lines each method will be further explained, and the concluded
results will be provided.
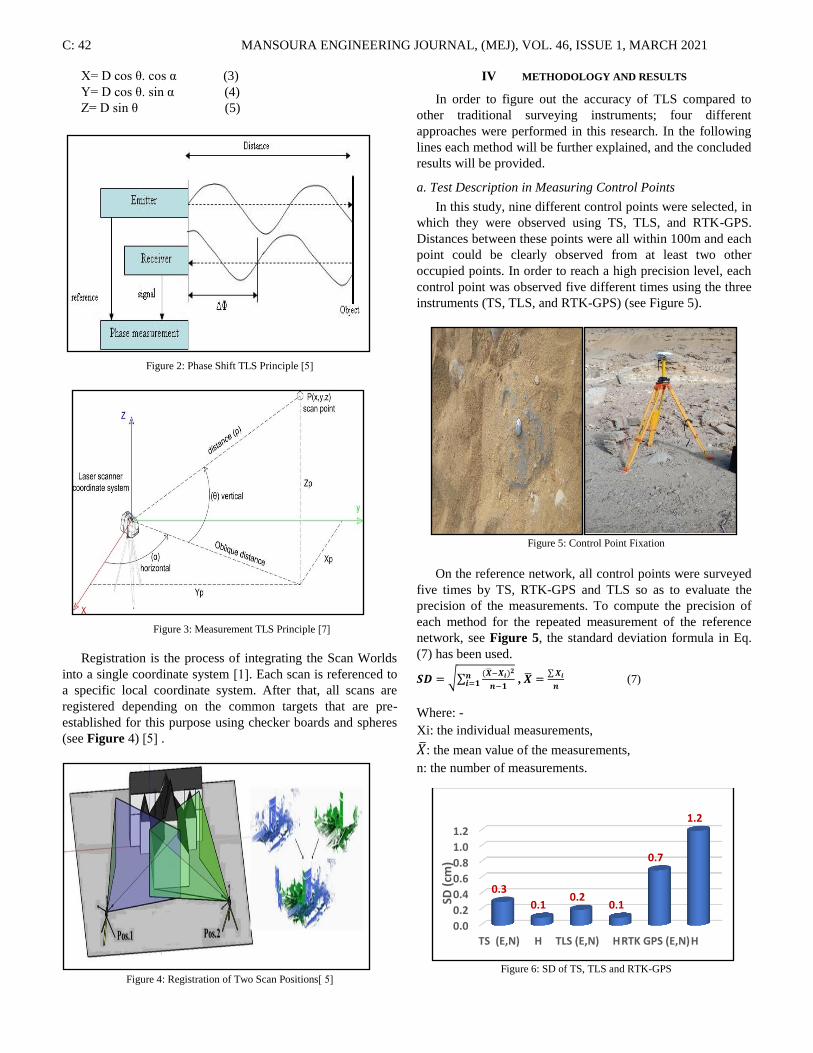
a. Test Description in Measuring Control Points
In this study, nine different control points were selected, in
which they were observed using TS, TLS, and RTK-GPS.
Distances between these points were all within 100m and each
point could be clearly observed from at least two other
occupied points. In order to reach a high precision level, each
control point was observed five different times using the three
instruments (TS, TLS, and RTK-GPS) (see Figure 5).
Figure 5: Control Point Fixation
On the reference network, all control points were surveyed
five times by TS, RTK-GPS and TLS so as to evaluate the
precision of the measurements. To compute the precision of
each method for the repeated measurement of the reference
network, see Figure 5, the standard deviation formula in Eq.
(7) has been used.
√∑
,
∑
(7)
Where: -
Xi: the individual measurements,
: the mean value of the measurements,
n: the number of measurements.
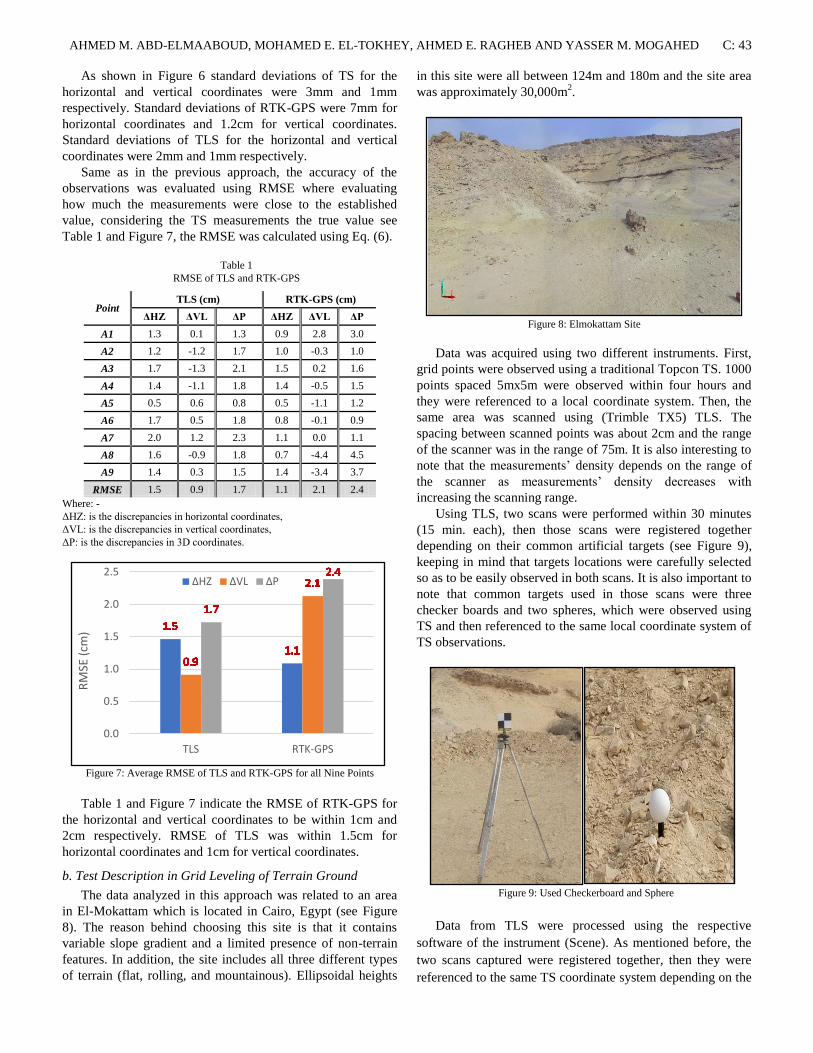
Figure 6: SD of TS, TLS and RTK-GPS
0.0
0.2
0.4
0.6
0.8
1.0
1.2
TS (E,N) H TLS (E,N) HRTK GPS (E,N)H
0.3
0.1 0.2
0.1
0.7
1.2
SD (
cm)
AHMED M. ABD-ELMAABOUD, MOHAMED E. EL-TOKHEY, AHMED E. RAGHEB AND YASSER M. MOGAHED C: 43
As shown in Figure 6 standard deviations of TS for the
horizontal and vertical coordinates were 3mm and 1mm
respectively. Standard deviations of RTK-GPS were 7mm for
horizontal coordinates and 1.2cm for vertical coordinates.
Standard deviations of TLS for the horizontal and vertical
coordinates were 2mm and 1mm respectively.
Same as in the previous approach, the accuracy of the
observations was evaluated using RMSE where evaluating
how much the measurements were close to the established
value, considering the TS measurements the true value see
Table 1 and Figure 7, the RMSE was calculated using Eq. (6).
Table 1
RMSE of TLS and RTK-GPS
Point TLS (cm) RTK-GPS (cm)
ΔHZ ΔVL ΔP ΔHZ ΔVL ΔP
A1 1.3 0.1 1.3 0.9 2.8 3.0
A2 1.2 -1.2 1.7 1.0 -0.3 1.0
A3 1.7 -1.3 2.1 1.5 0.2 1.6
A4 1.4 -1.1 1.8 1.4 -0.5 1.5
A5 0.5 0.6 0.8 0.5 -1.1 1.2
A6 1.7 0.5 1.8 0.8 -0.1 0.9
A7 2.0 1.2 2.3 1.1 0.0 1.1
A8 1.6 -0.9 1.8 0.7 -4.4 4.5
A9 1.4 0.3 1.5 1.4 -3.4 3.7
RMSE 1.5 0.9 1.7 1.1 2.1 2.4
Where: -
ΔHZ: is the discrepancies in horizontal coordinates,
ΔVL: is the discrepancies in vertical coordinates,
ΔP: is the discrepancies in 3D coordinates.
Figure 7: Average RMSE of TLS and RTK-GPS for all Nine Points
Table 1 and Figure 7 indicate the RMSE of RTK-GPS for
the horizontal and vertical coordinates to be within 1cm and
2cm respectively. RMSE of TLS was within 1.5cm for
horizontal coordinates and 1cm for vertical coordinates.
b. Test Description in Grid Leveling of Terrain Ground
The data analyzed in this approach was related to an area
in El-Mokattam which is located in Cairo, Egypt (see Figure
8). The reason behind choosing this site is that it contains
variable slope gradient and a limited presence of non-terrain
features. In addition, the site includes all three different types
of terrain (flat, rolling, and mountainous). Ellipsoidal heights
in this site were all between 124m and 180m and the site area
was approximately 30,000m2.
Figure 8: Elmokattam Site
Data was acquired using two different instruments. First,
grid points were observed using a traditional Topcon TS. 1000
points spaced 5mx5m were observed within four hours and
they were referenced to a local coordinate system. Then, the
same area was scanned using (Trimble TX5) TLS. The
spacing between scanned points was about 2cm and the range
of the scanner was in the range of 75m. It is also interesting to
note that the measurements’ density depends on the range of
the scanner as measurements’ density decreases with
increasing the scanning range.
Using TLS, two scans were performed within 30 minutes
(15 min. each), then those scans were registered together
depending on their common artificial targets (see Figure 9),
keeping in mind that targets locations were carefully selected
so as to be easily observed in both scans. It is also important to
note that common targets used in those scans were three
checker boards and two spheres, which were observed using
TS and then referenced to the same local coordinate system of
TS observations.
Figure 9: Used Checkerboard and Sphere
Data from TLS were processed using the respective
software of the instrument (Scene). As mentioned before, the
two scans captured were registered together, then they were
referenced to the same TS coordinate system depending on the
0.0
0.5
1.0
1.5
2.0
2.5
TLS RTK-GPS
RM
SE (
cm)
ΔHZ ΔVL ΔP
C: 44 MANSOURA ENGINEERING JOURNAL, (MEJ), VOL. 46, ISSUE 1, MARCH 2021
coordinates of the checker boards. The 3D point cloud created
from Scene was used within AutoCAD Civil3D application to
build a 3D surface using the traditional triangulated irregular
network (TIN). After which, points observed by TS were
imported into Civil3D and their observed levels were
compared to the TLS surface levels at the same location.
In order to assess the accuracy of the TLS measurements,
RMSE method was used, considering the TS observations as
the true value, the RMSE was calculated using the following
equation:
√∑
(6)
Where:
X: is the true value.
Xi: the individual measurements.
n: the number of observations.
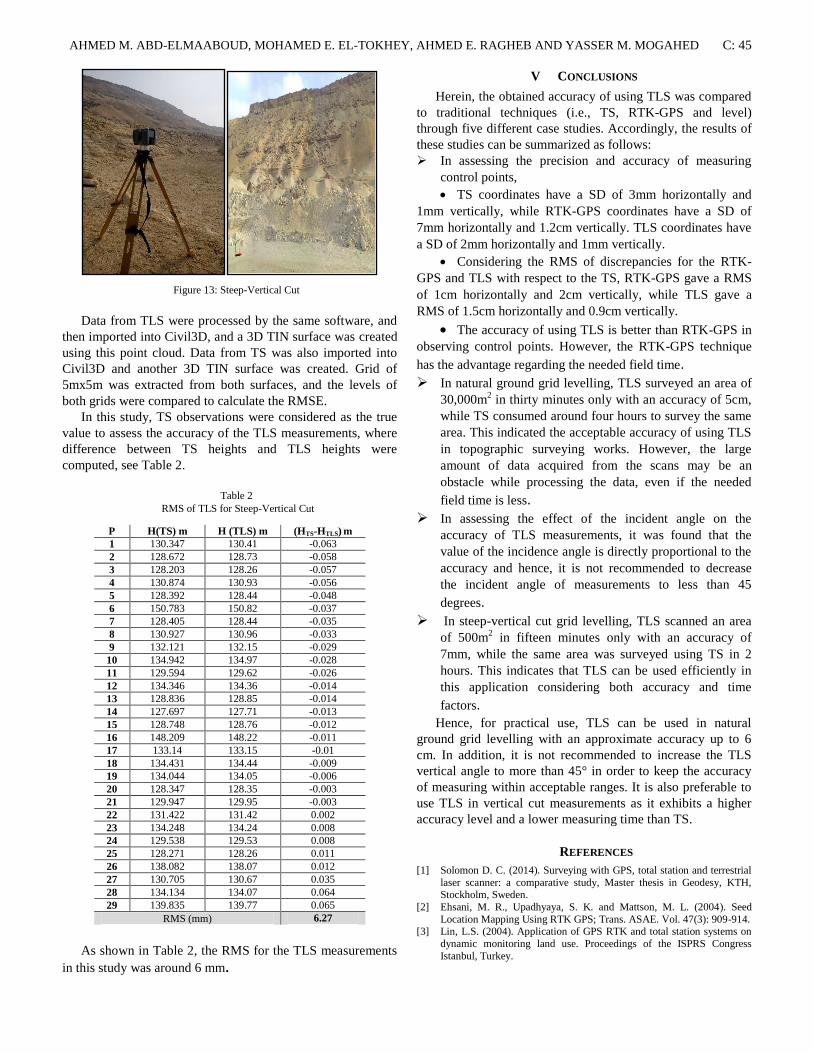
Figure 7 shows the vertical accuracy of TLS, considering
the TS observations as the true value.
Figure 10: Statistics of Vertical Component Differences
As shown in Figure 10 the height differences were
computed with maximum error of 10cm, minimum error zero,
mean error 4cm and mean of absolute errors 5cm, in addition
with RMSE 6cm.
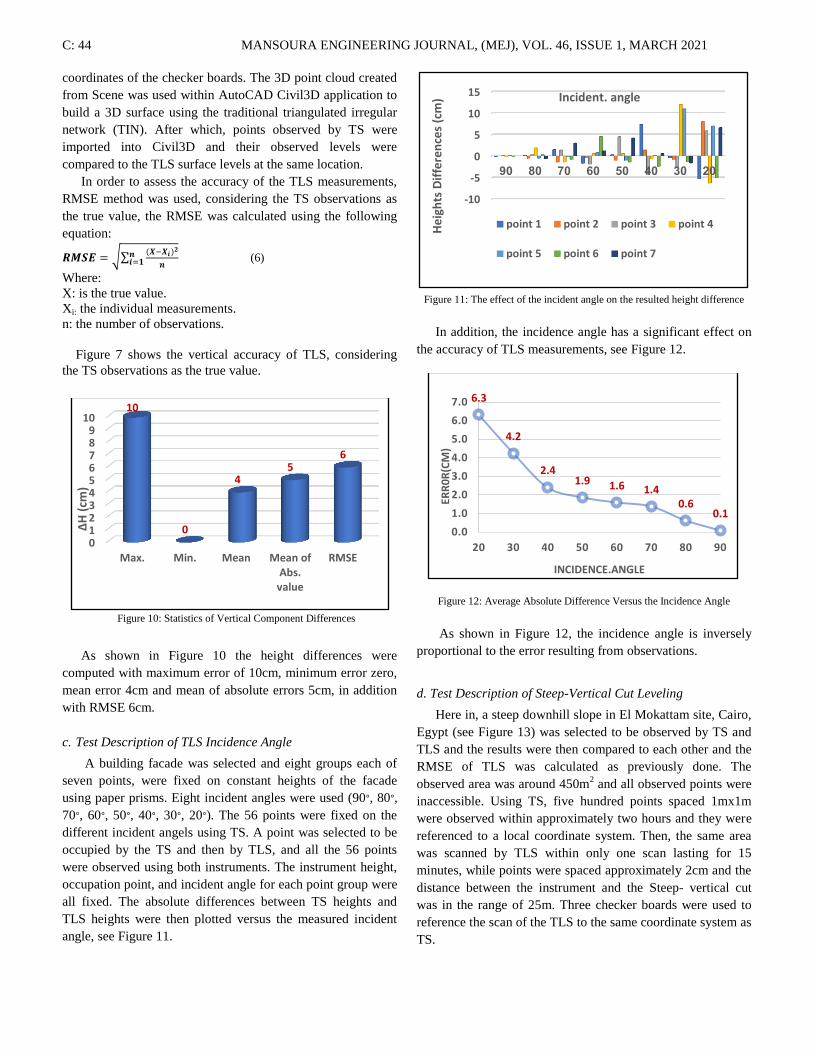
c. Test Description of TLS Incidence Angle
A building facade was selected and eight groups each of
seven points, were fixed on constant heights of the facade
using paper prisms. Eight incident angles were used (90∘, 80∘,
70∘, 60∘, 50∘, 40∘, 30∘, 20∘). The 56 points were fixed on the
different incident angels using TS. A point was selected to be
occupied by the TS and then by TLS, and all the 56 points
were observed using both instruments. The instrument height,
occupation point, and incident angle for each point group were
all fixed. The absolute differences between TS heights and
TLS heights were then plotted versus the measured incident
angle, see Figure 11.
Figure 11: The effect of the incident angle on the resulted height difference
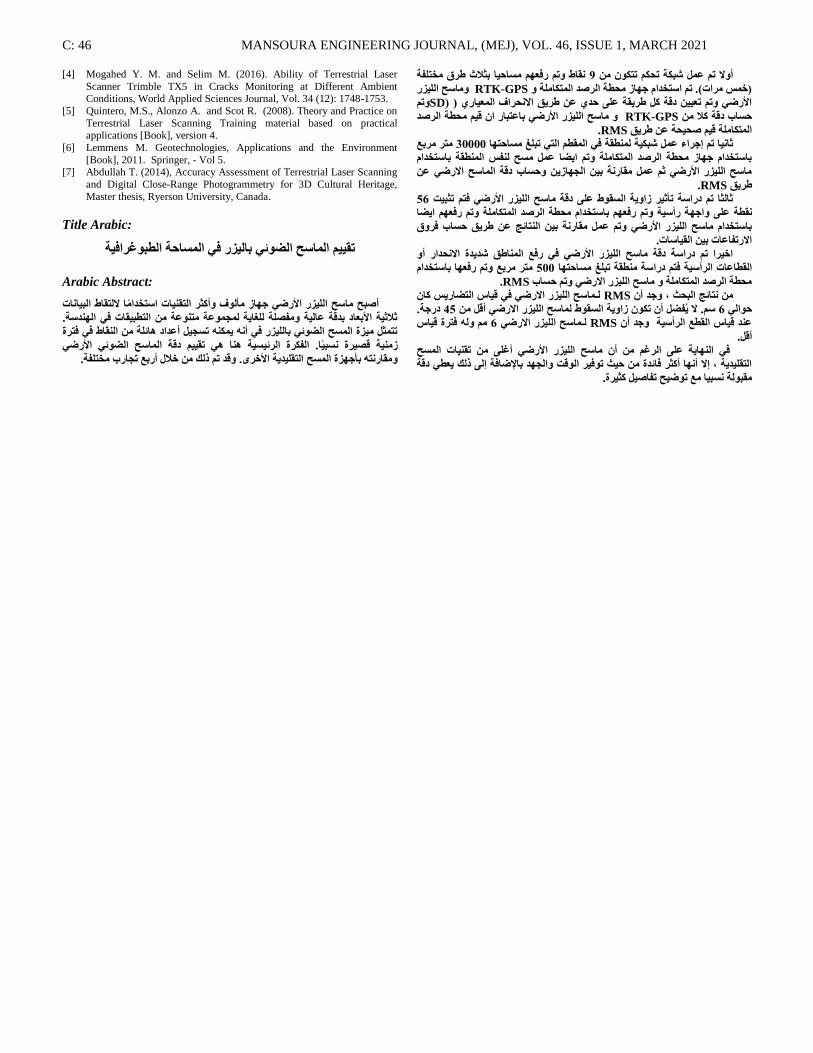
In addition, the incidence angle has a significant effect on
the accuracy of TLS measurements, see Figure 12.
Figure 12: Average Absolute Difference Versus the Incidence Angle
As shown in Figure 12, the incidence angle is inversely
proportional to the error resulting from observations.
d. Test Description of Steep-Vertical Cut Leveling
Here in, a steep downhill slope in El Mokattam site, Cairo,
Egypt (see Figure 13) was selected to be observed by TS and
TLS and the results were then compared to each other and the
RMSE of TLS was calculated as previously done. The
observed area was around 450m2 and all observed points were
inaccessible. Using TS, five hundred points spaced 1mx1m
were observed within approximately two hours and they were
referenced to a local coordinate system. Then, the same area
was scanned by TLS within only one scan lasting for 15
minutes, while points were spaced approximately 2cm and the
distance between the instrument and the Steep- vertical cut
was in the range of 25m. Three checker boards were used to
reference the scan of the TLS to the same coordinate system as
TS.
0123456789
10
Max. Min. Mean Mean ofAbs.
value
RMSE
10
0
4 5
6
ΔH
(cm
)
-10
-5
0
5
10
15
90 80 70 60 50 40 30 20
He
igh
ts D
iffe
ren
ces
(cm
) Incident. angle
point 1 point 2 point 3 point 4
point 5 point 6 point 7
0.1 0.6
1.4 1.6 1.9 2.4
4.2
6.3
0.0
1.0
2.0
3.0
4.0
5.0
6.0
7.0
20 30 40 50 60 70 80 90
ERR
0R
(CM
)
INCIDENCE.ANGLE
AHMED M. ABD-ELMAABOUD, MOHAMED E. EL-TOKHEY, AHMED E. RAGHEB AND YASSER M. MOGAHED C: 45
Figure 13: Steep-Vertical Cut
Data from TLS were processed by the same software, and
then imported into Civil3D, and a 3D TIN surface was created
using this point cloud. Data from TS was also imported into
Civil3D and another 3D TIN surface was created. Grid of
5mx5m was extracted from both surfaces, and the levels of
both grids were compared to calculate the RMSE.
In this study, TS observations were considered as the true
value to assess the accuracy of the TLS measurements, where
difference between TS heights and TLS heights were
computed, see Table 2.
Table 2
RMS of TLS for Steep-Vertical Cut
P H(TS) m H (TLS) m (HTS-HTLS) m
1 130.347 130.41 -0.063
2 128.672 128.73 -0.058
3 128.203 128.26 -0.057
4 130.874 130.93 -0.056
5 128.392 128.44 -0.048
6 150.783 150.82 -0.037
7 128.405 128.44 -0.035
8 130.927 130.96 -0.033
9 132.121 132.15 -0.029
10 134.942 134.97 -0.028
11 129.594 129.62 -0.026
12 134.346 134.36 -0.014
13 128.836 128.85 -0.014
14 127.697 127.71 -0.013
15 128.748 128.76 -0.012
16 148.209 148.22 -0.011
17 133.14 133.15 -0.01
18 134.431 134.44 -0.009
19 134.044 134.05 -0.006
20 128.347 128.35 -0.003
21 129.947 129.95 -0.003
22 131.422 131.42 0.002
23 134.248 134.24 0.008
24 129.538 129.53 0.008
25 128.271 128.26 0.011
26 138.082 138.07 0.012
27 130.705 130.67 0.035
28 134.134 134.07 0.064
29 139.835 139.77 0.065
RMS (mm) 6.27
As shown in Table 2, the RMS for the TLS measurements
in this study was around 6 mm.
V CONCLUSIONS
Herein, the obtained accuracy of using TLS was compared
to traditional techniques (i.e., TS, RTK-GPS and level)
through five different case studies. Accordingly, the results of
these studies can be summarized as follows:
In assessing the precision and accuracy of measuring
control points,
TS coordinates have a SD of 3mm horizontally and
1mm vertically, while RTK-GPS coordinates have a SD of
7mm horizontally and 1.2cm vertically. TLS coordinates have
a SD of 2mm horizontally and 1mm vertically.
Considering the RMS of discrepancies for the RTK-
GPS and TLS with respect to the TS, RTK-GPS gave a RMS
of 1cm horizontally and 2cm vertically, while TLS gave a
RMS of 1.5cm horizontally and 0.9cm vertically.
The accuracy of using TLS is better than RTK-GPS in
observing control points. However, the RTK-GPS technique
has the advantage regarding the needed field time.
In natural ground grid levelling, TLS surveyed an area of
30,000m2 in thirty minutes only with an accuracy of 5cm,
while TS consumed around four hours to survey the same
area. This indicated the acceptable accuracy of using TLS
in topographic surveying works. However, the large
amount of data acquired from the scans may be an
obstacle while processing the data, even if the needed
field time is less. In assessing the effect of the incident angle on the
accuracy of TLS measurements, it was found that the
value of the incidence angle is directly proportional to the
accuracy and hence, it is not recommended to decrease
the incident angle of measurements to less than 45
degrees.
In steep-vertical cut grid levelling, TLS scanned an area
of 500m2 in fifteen minutes only with an accuracy of
7mm, while the same area was surveyed using TS in 2
hours. This indicates that TLS can be used efficiently in
this application considering both accuracy and time
factors. Hence, for practical use, TLS can be used in natural
ground grid levelling with an approximate accuracy up to 6
cm. In addition, it is not recommended to increase the TLS
vertical angle to more than 45° in order to keep the accuracy
of measuring within acceptable ranges. It is also preferable to
use TLS in vertical cut measurements as it exhibits a higher
accuracy level and a lower measuring time than TS.
REFERENCES
[1] Solomon D. C. (2014). Surveying with GPS, total station and terrestrial
laser scanner: a comparative study, Master thesis in Geodesy, KTH,
Stockholm, Sweden.
[2] Ehsani, M. R., Upadhyaya, S. K. and Mattson, M. L. (2004). Seed
Location Mapping Using RTK GPS; Trans. ASAE. Vol. 47(3): 909-914. [3] Lin, L.S. (2004). Application of GPS RTK and total station systems on
dynamic monitoring land use. Proceedings of the ISPRS Congress
Istanbul, Turkey.
C: 46 MANSOURA ENGINEERING JOURNAL, (MEJ), VOL. 46, ISSUE 1, MARCH 2021
[4] Mogahed Y. M. and Selim M. (2016). Ability of Terrestrial Laser
Scanner Trimble TX5 in Cracks Monitoring at Different Ambient
Conditions, World Applied Sciences Journal, Vol. 34 (12): 1748-1753.
[5] Quintero, M.S., Alonzo A. and Scot R. (2008). Theory and Practice on
Terrestrial Laser Scanning Training material based on practical applications [Book], version 4.
[6] Lemmens M. Geotechnologies, Applications and the Environment
[Book], 2011. Springer, - Vol 5. [7] Abdullah T. (2014), Accuracy Assessment of Terrestrial Laser Scanning
and Digital Close-Range Photogrammetry for 3D Cultural Heritage,
Master thesis, Ryerson University, Canada.
Title Arabic:
حمى اناضح انضىئ بانسر ف انطاحت انطبىغرافت
Arabic Abstract:
أصبح ياضح انهسر الأرض جهاز يأنىف وأكزر انخماث اضخخذايا لانخماط انبااث
رلارت الأبعاد بذلت عانت ويفصهت نهغات نجىعت يخىعت ي انخطبماث ف انهذضت.
حخزم يسة انطح انضىئ بانهسر ف أه كه حطجم أعذاد هائهت ي انماط ف فخرة
زيت لصرة طبا. انفكرة انرئطت ها ه حمى دلت اناضح انضىئ الأرض
انخمهذت الأخري. ولذ حى رنك ي خلال أربع حجارب يخخهفت. ويمارخه بأجهسة انطح
ماط وحى رفعهى يطاحا بزلاد طرق يخخهفت 9أولا حى عم شبكت ححكى حخكى ي
وياضح انهسر RTK-GPS)خص يراث(. حى اضخخذاو جهاز يحطت انرصذ انخكايهت و
وحى SDالأرض وحى حع دلت كم طرمت عه حذ ع طرك الاحراف انعار ) )
و ياضح انهسر الأرض باعخبار ا لى يحطت انرصذ RTK-GPSحطاب دلت كلا ي
.RMSانخكايهت لى صححت ع طرك
يخر يربع 03333راا حى إجراء عم شبكت نطمت ف انمطى انخ حبهغ يطاحخها
باضخخذاو جهاز يحطت انرصذ انخكايهت وحى اضا عم يطح نفص انطمت باضخخذاو
ياضح انهسر الأرض رى عم يمارت ب انجهاز وحطاب دلت اناضح الارض ع
.RMSطرك
67رانزا حى دراضت حأرر زاوت انطمىط عه دلت ياضح انهسر الأرض فخى حزبج
ت رأضت وحى رفعهى باضخخذاو يحطت انرصذ انخكايهت وحى رفعهى اضا مطت عه واجه
باضخخذاو ياضح انهسر الأرض وحى عم يمارت ب انخائج ع طرك حطاب فروق
الارحفاعاث ب انماضاث.
اخرا حى دراضت دلت ياضح انهسر الأرض ف رفع اناطك شذذة الاحذار أو
يخر يربع وحى رفعها باضخخذاو 633ضت يطمت حبهغ يطاحخها انمطاعاث انرأضت فخى درا
.RMSيحطت انرصذ انخكايهت و ياضح انهسر الارض وحى حطاب
نـاضح انهسر الارض ف لاش انخضارص كا RMSي خائج انبحذ ، وجذ أ
. درجت 56ضى. لا فضم أ حكى زاوت انطمىط ناضح انهسر الارض ألم ي 7حىان
يى ونه فخرة لاش 7نـاضح انهسر الارض RMSعذ لاش انمطع انرأضت وجذ أ
ألم.
ف انهات عه انرغى ي أ ياضح انهسر الأرض أغه ي حماث انطح
انخمهذت ، إلا أها أكزر فائذة ي حذ حىفر انىلج وانجهذ بالإضافت إن رنك عط دلت
حفاصم كزرة.يمبىنت طبا يع حىضح