an attempt at using a terrestrial laser scanner for ... · fs 3d - tls application ii andrzej...
TRANSCRIPT
FS 3D - TLS Application II Andrzej Dumalski and Karolina Hejbudzka An Attempt at Using a Terrestrial Laser Scanner for Detecting Minimal Displacement and Objects' Deformation FIG Congress 2010 Facing the Challenges – Building the Capacity Sydney, Australia, 11-16 April 2010
1
An Attempt at Using a Terrestrial Laser Scanner for Detecting Minimal Displacement and Objects’ Deformations
Andrzej DUMALSKI, Karolina HEJBUDZKA , Poland
Key words: terrestrial laser scanner, minimal detected movements SUMMARY Observations of geodetic market and new measuring instruments show that the difference in the accuracy of measurements with instruments which use the reflector and the reflectorless ones disappears. The range of reflectorless measurements is still shorter then those with the use of prism but the possibility of recording inaccessible places is, without doubt, an advantage of reflectorless instruments. Laser scanners may serve as an example of such instruments which for a few years have been in the scope of interest of engineers all over the world. The aim of this paper is to compare the displacement of the High Definition Survey targets measured with a terrestrial laser scanner assigned to intended intervals. The displacement was search for three directions (X,Y,Z coordinate axes). The experiment was conducted for five different intervals (0,001m, 0,003m, 0,005m, 0,010m, 0,020m) and several distances finally reaching the maximum range of the scanner. The data was processed using Cyclone and Matlab software and compared to theoretical intervals. The analysis of the obtained results seems to be interesting and creates new possibility for using laser scanner for precise measurements to define minimal displacement and deformation of objects.
FS 3D - TLS Application II Andrzej Dumalski and Karolina Hejbudzka An Attempt at Using a Terrestrial Laser Scanner for Detecting Minimal Displacement and Objects' Deformation FIG Congress 2010 Facing the Challenges – Building the Capacity Sydney, Australia, 11-16 April 2010
2
An Attempt at Using a Terrestrial Laser Scanner for Detecting Minimal Displacement and Objects’ Deformations
Andrzej DUMALSKI, Karolina HEJBUDZKA , Polska
1. INTRODUCTION In engineering geodesy, especially in the field of displacement and deformation measurements, the traditional methods of measuring dominate. They use well checked classical measuring instruments such as theodolites, levelling instruments and total stations. These instruments required immediate contact of an engineer with the surveyed site. The distance was determined using traditional measuring methods with prism. The use of reflectorless techniques of measuring was a breakthrough which enabled to record the measurements of engineering elements inaccessible until then. This innovative technology has been used in the most advanced measuring instruments: terrestrial laser scanners (further TLS) which have been developing rapidly for a few years. Despite quite expensive measuring instruments, the technology of laser scanning, especially the terrestrial one, conquers numerous areas of life. Without doubt, the advantages of a laser scanner include speed and enormous amount of obtained data called in literature point clouds. Also the accuracy achieved by this method is close to that achieved with total station. No doubt, the numerous advantages of laser scanners made them suitable for different uses. Except for typical geodetic uses they appeared indispensable to make an inventory of architecture, archaeological sites, industrial plants (refinery), building sites or to record road accidents or in criminology. During the recent years many publications on laser scanning and its application have appeared. Terrestrial laser scanners are especially popular with geodetic engineers particularly for detecting displacement and deformation of engineering constructions. Thanks to a huge number of points measured they enable the analysis of not only separate elements but also the whole area. Loves et al (2008) among others has described the use of laser scanning for the measurement of displacement and deformation of the bridge over the Danube. The authors state that due to its accuracy, the laser measurements can only supplement the traditional measurements. The collected data can serve as an additional material for numerous analyses. The attention has been drawn to the usefulness of laser scanner for detecting deformation (Lijing Bu et al, 2008) and its helpfulness for building incredibly accurate model DTM which can be further developed by future investors. The results obtained while detecting the deformation of a lock on the Danube during its filling with water (Schafer et al, 2004) are really interesting. In the research work the results obtained with laser scanner have been compared to those obtained with total station. The similarity between the measures amounted to 3 mm. The technique for measurement presented in this work as well as data processing and accuracy achieved offer prospects for wider and wider use of laser scanning for measurements of displacement and deformation. To find the extent of displacement and deformation of engineering construction it is necessary to know what minimal figures indicating displacement can be achieved with the use of a scanner. One technique to complete this task is to compare the actual data to the theoretically
FS 3D - TLS Application II Andrzej Dumalski and Karolina Hejbudzka An Attempt at Using a Terrestrial Laser Scanner for Detecting Minimal Displacement and Objects' Deformation FIG Congress 2010 Facing the Challenges – Building the Capacity Sydney, Australia, 11-16 April 2010
3
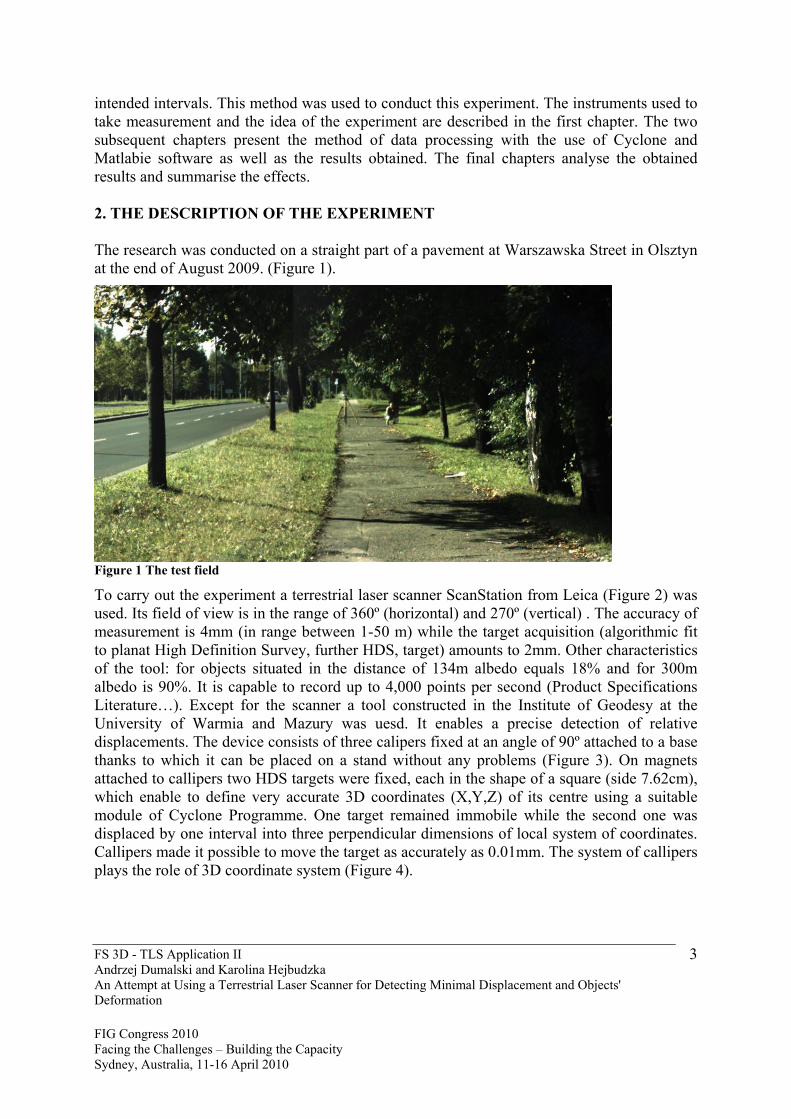
intended intervals. This method was used to conduct this experiment. The instruments used to take measurement and the idea of the experiment are described in the first chapter. The two subsequent chapters present the method of data processing with the use of Cyclone and Matlabie software as well as the results obtained. The final chapters analyse the obtained results and summarise the effects. 2. THE DESCRIPTION OF THE EXPERIMENT The research was conducted on a straight part of a pavement at Warszawska Street in Olsztyn at the end of August 2009. (Figure 1).
Figure 1 The test field
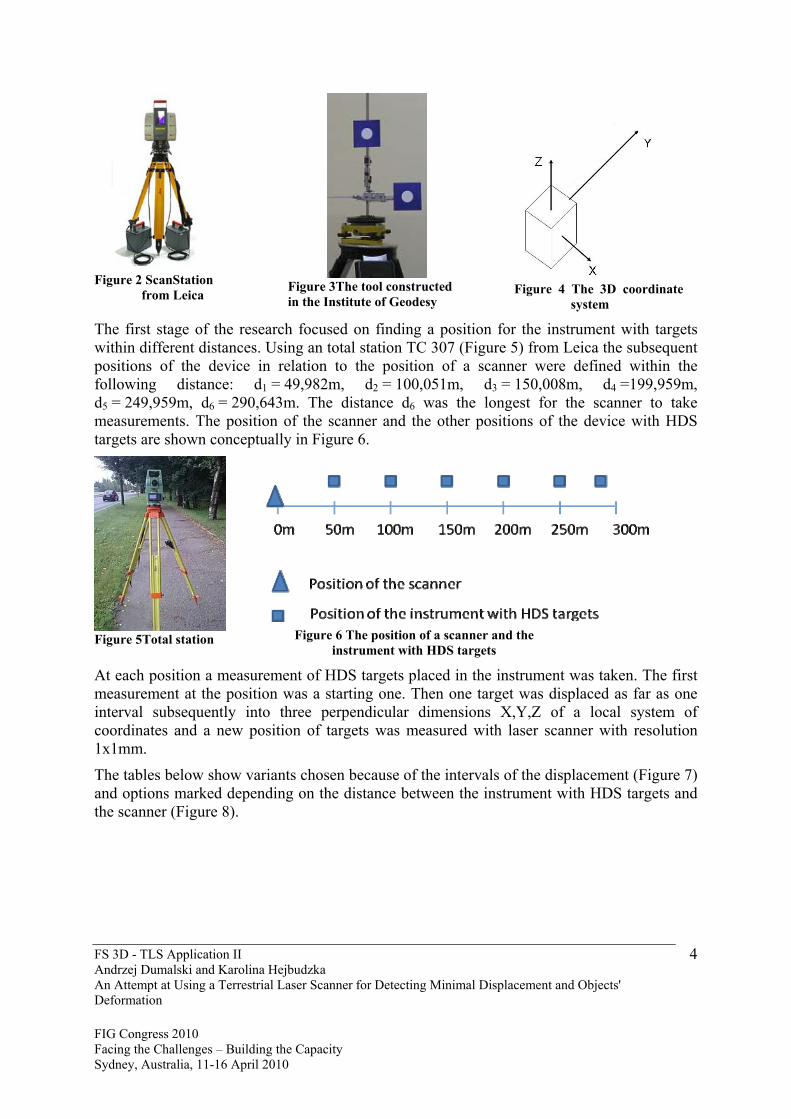
To carry out the experiment a terrestrial laser scanner ScanStation from Leica (Figure 2) was used. Its field of view is in the range of 360º (horizontal) and 270º (vertical) . The accuracy of measurement is 4mm (in range between 1-50 m) while the target acquisition (algorithmic fit to planat High Definition Survey, further HDS, target) amounts to 2mm. Other characteristics of the tool: for objects situated in the distance of 134m albedo equals 18% and for 300m albedo is 90%. It is capable to record up to 4,000 points per second (Product Specifications Literature…). Except for the scanner a tool constructed in the Institute of Geodesy at the University of Warmia and Mazury was uesd. It enables a precise detection of relative displacements. The device consists of three calipers fixed at an angle of 90º attached to a base thanks to which it can be placed on a stand without any problems (Figure 3). On magnets attached to callipers two HDS targets were fixed, each in the shape of a square (side 7.62cm), which enable to define very accurate 3D coordinates (X,Y,Z) of its centre using a suitable module of Cyclone Programme. One target remained immobile while the second one was displaced by one interval into three perpendicular dimensions of local system of coordinates. Callipers made it possible to move the target as accurately as 0.01mm. The system of callipers plays the role of 3D coordinate system (Figure 4).
FS 3D - TLS Application II Andrzej Dumalski and Karolina Hejbudzka An Attempt at Using a Terrestrial Laser Scanner for Detecting Minimal Displacement and Objects' Deformation FIG Congress 2010 Facing the Challenges – Building the Capacity Sydney, Australia, 11-16 April 2010
4
Figure 2 ScanStation
from Leica
Figure 3The tool constructed in the Institute of Geodesy
Figure 4 The 3D coordinate
system
The first stage of the research focused on finding a position for the instrument with targets within different distances. Using an total station TC 307 (Figure 5) from Leica the subsequent positions of the device in relation to the position of a scanner were defined within the following distance: d1 = 49,982m, d2 = 100,051m, d3 = 150,008m, d4 =199,959m, d5 = 249,959m, d6 = 290,643m. The distance d6 was the longest for the scanner to take measurements. The position of the scanner and the other positions of the device with HDS targets are shown conceptually in Figure 6.
Figure 5Total station
Figure 6 The position of a scanner and the
instrument with HDS targets
At each position a measurement of HDS targets placed in the instrument was taken. The first measurement at the position was a starting one. Then one target was displaced as far as one interval subsequently into three perpendicular dimensions X,Y,Z of a local system of coordinates and a new position of targets was measured with laser scanner with resolution 1x1mm.
The tables below show variants chosen because of the intervals of the displacement (Figure 7) and options marked depending on the distance between the instrument with HDS targets and the scanner (Figure 8).
FS 3D - TLS Application II Andrzej Dumalski and Karolina Hejbudzka An Attempt at Using a Terrestrial Laser Scanner for Detecting Minimal Displacement and Objects' Deformation FIG Congress 2010 Facing the Challenges – Building the Capacity Sydney, Australia, 11-16 April 2010
5
variant’s number
Theoretical interval of target’s displacement [m]
1 0,001
2 0,003
3 0,005
4 0,010
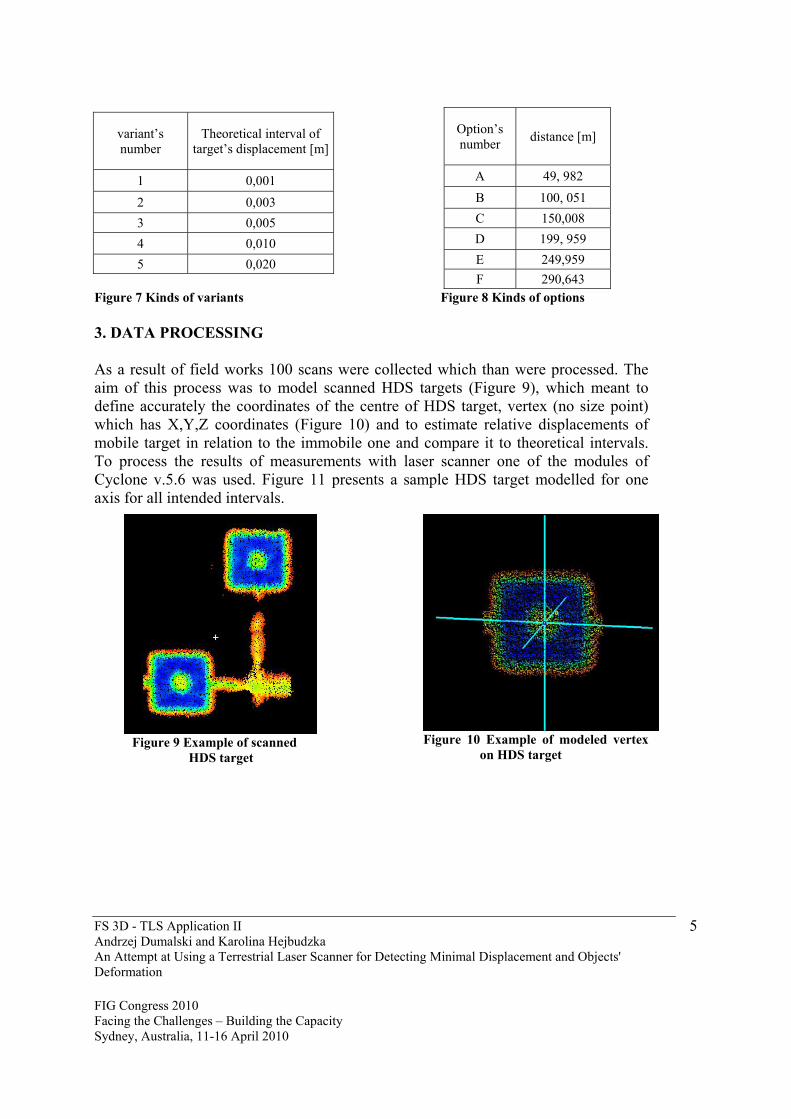
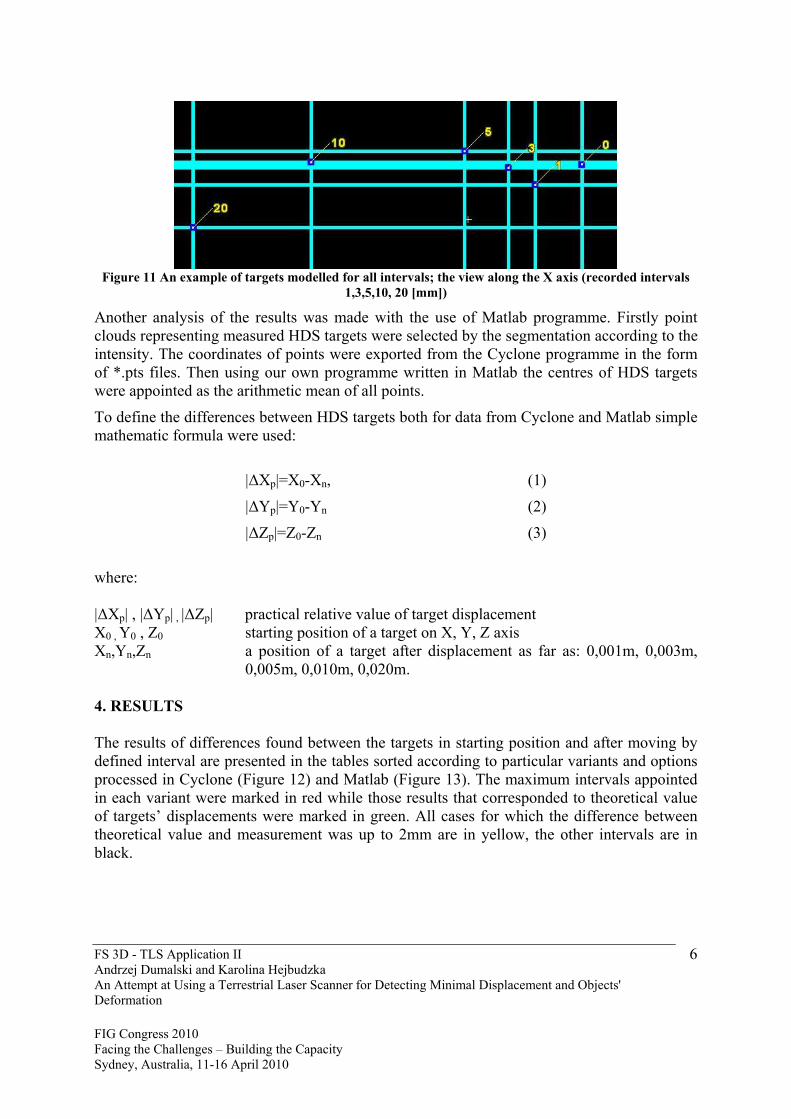
5 0,020 Figure 7 Kinds of variants Figure 8 Kinds of options 3. DATA PROCESSING As a result of field works 100 scans were collected which than were processed. The aim of this process was to model scanned HDS targets (Figure 9), which meant to define accurately the coordinates of the centre of HDS target, vertex (no size point) which has X,Y,Z coordinates (Figure 10) and to estimate relative displacements of mobile target in relation to the immobile one and compare it to theoretical intervals. To process the results of measurements with laser scanner one of the modules of Cyclone v.5.6 was used. Figure 11 presents a sample HDS target modelled for one axis for all intended intervals.
Figure 9 Example of scanned
HDS target
Figure 10 Example of modeled vertex
on HDS target
Option’s number
distance [m]
A 49, 982
B 100, 051
C 150,008
D 199, 959
E 249,959
F 290,643
FS 3D - TLS Application II Andrzej Dumalski and Karolina Hejbudzka An Attempt at Using a Terrestrial Laser Scanner for Detecting Minimal Displacement and Objects' Deformation FIG Congress 2010 Facing the Challenges – Building the Capacity Sydney, Australia, 11-16 April 2010
6
Figure 11 An example of targets modelled for all intervals; the view along the X axis (recorded intervals
1,3,5,10, 20 [mm])
Another analysis of the results was made with the use of Matlab programme. Firstly point clouds representing measured HDS targets were selected by the segmentation according to the intensity. The coordinates of points were exported from the Cyclone programme in the form of *.pts files. Then using our own programme written in Matlab the centres of HDS targets were appointed as the arithmetic mean of all points.
To define the differences between HDS targets both for data from Cyclone and Matlab simple mathematic formula were used:
|ΔXp|=X0-Xn, (1)
|ΔYp|=Y0-Yn (2)
|ΔZp|=Z0-Zn (3)
where: |ΔXp| , |ΔYp| , |ΔZp| practical relative value of target displacement X0 , Y0 , Z0 starting position of a target on X, Y, Z axis Xn,Yn,Zn a position of a target after displacement as far as: 0,001m, 0,003m,
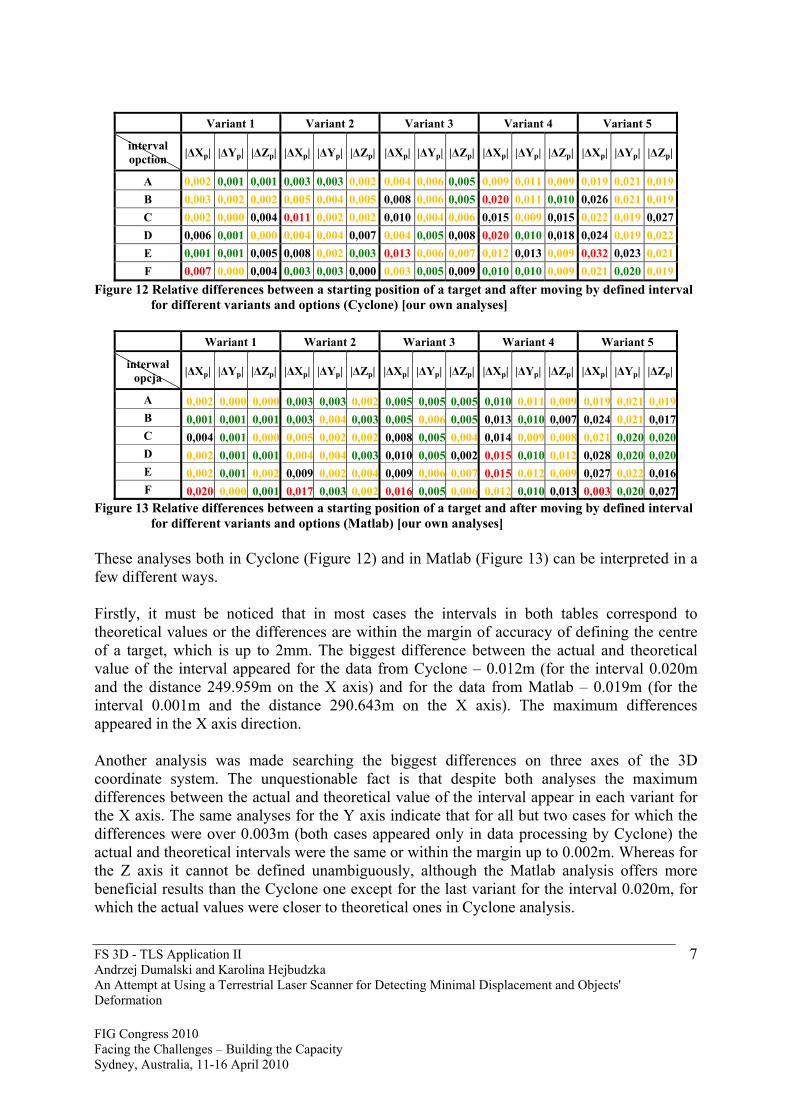
0,005m, 0,010m, 0,020m. 4. RESULTS The results of differences found between the targets in starting position and after moving by defined interval are presented in the tables sorted according to particular variants and options processed in Cyclone (Figure 12) and Matlab (Figure 13). The maximum intervals appointed in each variant were marked in red while those results that corresponded to theoretical value of targets’ displacements were marked in green. All cases for which the difference between theoretical value and measurement was up to 2mm are in yellow, the other intervals are in black.
FS 3D - TLS Application II Andrzej Dumalski and Karolina Hejbudzka An Attempt at Using a Terrestrial Laser Scanner for Detecting Minimal Displacement and Objects' Deformation FIG Congress 2010 Facing the Challenges – Building the Capacity Sydney, Australia, 11-16 April 2010
7
Variant 1 Variant 2 Variant 3 Variant 4 Variant 5
interval opction
|ΔXp| |ΔYp| |ΔZp| |ΔXp| |ΔYp| |ΔZp| |ΔXp| |ΔYp| |ΔZp| |ΔXp| |ΔYp| |ΔZp| |ΔXp| |ΔYp| |ΔZp|
A 0,002 0,001 0,001 0,003 0,003 0,002 0,004 0,006 0,005 0,009 0,011 0,009 0,019 0,021 0,019
B 0,003 0,002 0,002 0,005 0,004 0,005 0,008 0,006 0,005 0,020 0,011 0,010 0,026 0,021 0,019
C 0,002 0,000 0,004 0,011 0,002 0,002 0,010 0,004 0,006 0,015 0,009 0,015 0,022 0,019 0,027
D 0,006 0,001 0,000 0,004 0,004 0,007 0,004 0,005 0,008 0,020 0,010 0,018 0,024 0,019 0,022
E 0,001 0,001 0,005 0,008 0,002 0,003 0,013 0,006 0,007 0,012 0,013 0,009 0,032 0,023 0,021
F 0,007 0,000 0,004 0,003 0,003 0,000 0,003 0,005 0,009 0,010 0,010 0,009 0,021 0,020 0,019
Figure 12 Relative differences between a starting position of a target and after moving by defined interval for different variants and options (Cyclone) [our own analyses]
Wariant 1 Wariant 2 Wariant 3 Wariant 4 Wariant 5
interwał opcja
|ΔXp| |ΔYp| |ΔZp| |ΔXp| |ΔYp| |ΔZp| |ΔXp| |ΔYp| |ΔZp| |ΔXp| |ΔYp| |ΔZp| |ΔXp| |ΔYp| |ΔZp|
A 0,002 0,000 0,000 0,003 0,003 0,002 0,005 0,005 0,005 0,010 0,011 0,009 0,019 0,021 0,019B 0,001 0,001 0,001 0,003 0,004 0,003 0,005 0,006 0,005 0,013 0,010 0,007 0,024 0,021 0,017C 0,004 0,001 0,000 0,005 0,002 0,002 0,008 0,005 0,004 0,014 0,009 0,008 0,021 0,020 0,020D 0,002 0,001 0,001 0,004 0,004 0,003 0,010 0,005 0,002 0,015 0,010 0,012 0,028 0,020 0,020E 0,002 0,001 0,002 0,009 0,002 0,004 0,009 0,006 0,007 0,015 0,012 0,009 0,027 0,022 0,016F 0,020 0,000 0,001 0,017 0,003 0,002 0,016 0,005 0,006 0,012 0,010 0,013 0,003 0,020 0,027
Figure 13 Relative differences between a starting position of a target and after moving by defined interval for different variants and options (Matlab) [our own analyses]
These analyses both in Cyclone (Figure 12) and in Matlab (Figure 13) can be interpreted in a few different ways. Firstly, it must be noticed that in most cases the intervals in both tables correspond to theoretical values or the differences are within the margin of accuracy of defining the centre of a target, which is up to 2mm. The biggest difference between the actual and theoretical value of the interval appeared for the data from Cyclone – 0.012m (for the interval 0.020m and the distance 249.959m on the X axis) and for the data from Matlab – 0.019m (for the interval 0.001m and the distance 290.643m on the X axis). The maximum differences appeared in the X axis direction. Another analysis was made searching the biggest differences on three axes of the 3D coordinate system. The unquestionable fact is that despite both analyses the maximum differences between the actual and theoretical value of the interval appear in each variant for the X axis. The same analyses for the Y axis indicate that for all but two cases for which the differences were over 0.003m (both cases appeared only in data processing by Cyclone) the actual and theoretical intervals were the same or within the margin up to 0.002m. Whereas for the Z axis it cannot be defined unambiguously, although the Matlab analysis offers more beneficial results than the Cyclone one except for the last variant for the interval 0.020m, for which the actual values were closer to theoretical ones in Cyclone analysis.
FS 3D - TLS Application II Andrzej Dumalski and Karolina Hejbudzka An Attempt at Using a Terrestrial Laser Scanner for Detecting Minimal Displacement and Objects' Deformation FIG Congress 2010 Facing the Challenges – Building the Capacity Sydney, Australia, 11-16 April 2010
8
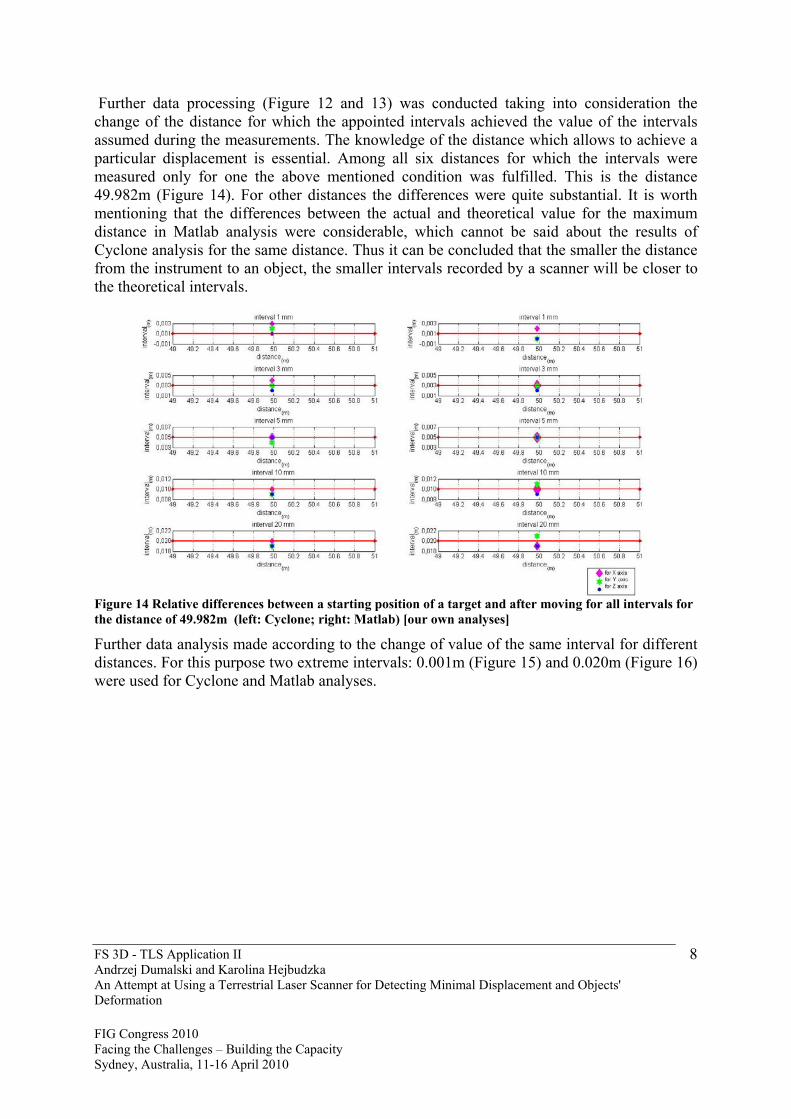
Further data processing (Figure 12 and 13) was conducted taking into consideration the change of the distance for which the appointed intervals achieved the value of the intervals assumed during the measurements. The knowledge of the distance which allows to achieve a particular displacement is essential. Among all six distances for which the intervals were measured only for one the above mentioned condition was fulfilled. This is the distance 49.982m (Figure 14). For other distances the differences were quite substantial. It is worth mentioning that the differences between the actual and theoretical value for the maximum distance in Matlab analysis were considerable, which cannot be said about the results of Cyclone analysis for the same distance. Thus it can be concluded that the smaller the distance from the instrument to an object, the smaller intervals recorded by a scanner will be closer to the theoretical intervals.
Figure 14 Relative differences between a starting position of a target and after moving for all intervals for the distance of 49.982m (left: Cyclone; right: Matlab) [our own analyses]
Further data analysis made according to the change of value of the same interval for different distances. For this purpose two extreme intervals: 0.001m (Figure 15) and 0.020m (Figure 16) were used for Cyclone and Matlab analyses.

FS 3D - TLS Application II Andrzej Dumalski and Karolina Hejbudzka An Attempt at Using a Terrestrial Laser Scanner for Detecting Minimal Displacement and Objects' Deformation FIG Congress 2010 Facing the Challenges – Building the Capacity Sydney, Australia, 11-16 April 2010
9
Figure 15 Relative differences between a starting position of a target and after moving for the 1 mm
interval for all distances [our own analyses]
Figure 16 Relative differences between a starting position of a target and after moving for the 20 mm
interval for all distances [our own analyses]
Both for minimal and maximum intervals the appointed interval is close to the theoretical one for the first distance and the further the distance the bigger differences appear. It is particularly clear for the X axis. Thus it can be concluded that the bigger the distance the bigger the difference between the actual intervals measured by scanner and the theoretical one, which Figures 15 and 16 illustrate.
FS 3D - TLS Application II Andrzej Dumalski and Karolina Hejbudzka An Attempt at Using a Terrestrial Laser Scanner for Detecting Minimal Displacement and Objects' Deformation FIG Congress 2010 Facing the Challenges – Building the Capacity Sydney, Australia, 11-16 April 2010
10
5. CONCLUSION Nowadays the technology of laser scanning is applied to more and more fields. Thanks to its numerous benefits former methods of measuring became laborious, expensive and inefficient. However, to make good use of technology it is necessary get familiar with its capabilities and limitations which we are bound to face using the terrestrial laser scanner or processing the data. This paper dealt with the use of TLS for detecting the minimal displacement of objects. In conclusion, during the research two programmes were used, Cyclone and Matlab, which allowed more objective interpretation of the results. Data analysis shows unquestionably that for the distance of 49.982m the maximum difference between measured and theoretical intervals was 2mm for all supposed intervals. In Alba et al (2008) paper it was noticed that the errors in measurements of dislocations can result from the faults of Cyclone software which automatically appoints the centre of HDS sign (vertex). This could prove the fact that, according to tables 12 and 13, up to the distance of 290.643m more beneficial results were obtained from Matlab and not Cyclone software. The relation between the distance and the accurate finding of the centre of HDS sign was also proved. This interdependence is directly proportional. Another conclusion is that maximum differences between theoretical and actual values appear sporadically. Without doubt, it needs to be noticed that the characteristic feature of the differences defined for the Y axis in any variant is minimal difference between theoretical value of displacement and the actual one resulting from measurements. Taking into consideration the directions of the 3D coordinate system, the least beneficial results were obtained for the X axis and the most beneficial for the Y axis for results analyses with either software. Maximum deviation of actual intervals from their theoretical values might result from air turbulences caused by traffic, which might lead to instability of a instrument in direction of the X axis. The conducted research should be continued in several directions. One of them is the recurrence of the obtained results, which means making a few similar tests whose results would show unambiguously the capacity of defining the deformation by the TLS. The next stage would be the use, during the analyses, of other algorithms which allow to find the point we are interested in, in this case the centres of HDS targets. REFERENCES Alba M., Roncoroni F., Scaioni M., 2008.Investigations about the accuracy of target
measurement for deformation monitoring. The International Archives of the Photogrammetry, Remote Sensing and Spatial Information Sciences. Vol. XXXVII. Part B5. Beijing
Leica Geosystems HDS 2500/3000 and Cyclone Training Course, HDS Training Manual Lijing Bu, Zhengpeng Zhang, 2008. Application of point clouds from terrestrial 3D laser
scanner for deformation measurements. The International Archives of the Photogrammetry, Remote Sensing and Spatial Information Sciences. Vol. XXXVII. Part B5. Beijing
FS 3D - TLS Application II Andrzej Dumalski and Karolina Hejbudzka An Attempt at Using a Terrestrial Laser Scanner for Detecting Minimal Displacement and Objects' Deformation FIG Congress 2010 Facing the Challenges – Building the Capacity Sydney, Australia, 11-16 April 2010
11
Lovas T., Barsi A., Detrekoi A., Dunai L., Csak Z., Polgar A., Berenyi A., Kibedy Z., Szocs
K. 2008. Terrestrial laser scanning in deformation measurements of structures. The International Archives of the Photogrammetry, Remote Sensing and Spatial Information Sciences. Vol. XXXVII. Part B5. Beijing
Product Specifications Literature Leica ScanStation na dzień 05.02.2009
http://www.glaheinc.com/news_events/ScanStation_datasheet_en.pdf Schäfer, T., Weber, T., Kyrinovič, P., and Zámečniková, M., 2004. Deformation measurement
using terrestrial laser scanning at the hydropower station Gabčíkovo. In Proceedings of the INGEO 2004 and FIG regional central and European conference on engineering surveying, Bratislava,Slovakia
FS 3D - TLS Application II Andrzej Dumalski and Karolina Hejbudzka An Attempt at Using a Terrestrial Laser Scanner for Detecting Minimal Displacement and Objects' Deformation FIG Congress 2010 Facing the Challenges – Building the Capacity Sydney, Australia, 11-16 April 2010
12
BIOGRAPHICAL NOTES Andrzej Dumalski is a Doctor in Department of Geodesy and Land Management in University of Warmia and Mazury in Olsztyn. Karolina Hejbudzka* is a PhD student. She studied Geodesy and Spatial Information Systems at the University of Warmia and Mazury in Olsztyn (Poland) from 2002-2007. From October 1st, 2007 she started her PhD research on using terrestrial laser scanner to detect the minimal building deformation in the Institute of Geodesy at the University of Warmia and Mazury in Olsztyn. From 1st September 2009 she is working as a guest PhD student at OLRS Faculty of Aerospace Engineering Delft University of Technology under the supervision of dr. Roderik Lindenbergh.
…… .
* SUPPORTED BY THE EUROPEAN UNION WITHIN THE EUROPEAN SOCIAL FUND
CONTACTS dr inż. Andrzej Dumalski Instytut Geodezji Wydział Geodezji i Gospodarki Przestrzennej Uniwersytet Warmińsko-Mazurski w Olsztynie 10-718 Olsztyn POLAND Tel. +48 89 523 45 42 Fax. +48 89 523 47 86 e-mail: [email protected] mgr inż. Karolina Hejbudzka Instytut Geodezji Wydział Geodezji i Gospodarki Przestrzennej Uniwersytet Warmińsko-Mazurski w Olsztynie 10-718 Olsztyn POLAND Tel. +48 89 523 48 70 e-mail: [email protected]