applied terrestrial laser scanner in active volcano crater ... · applied terrestrial laser scanner...
TRANSCRIPT
27-05-2015
FIG Working Week 2015 1
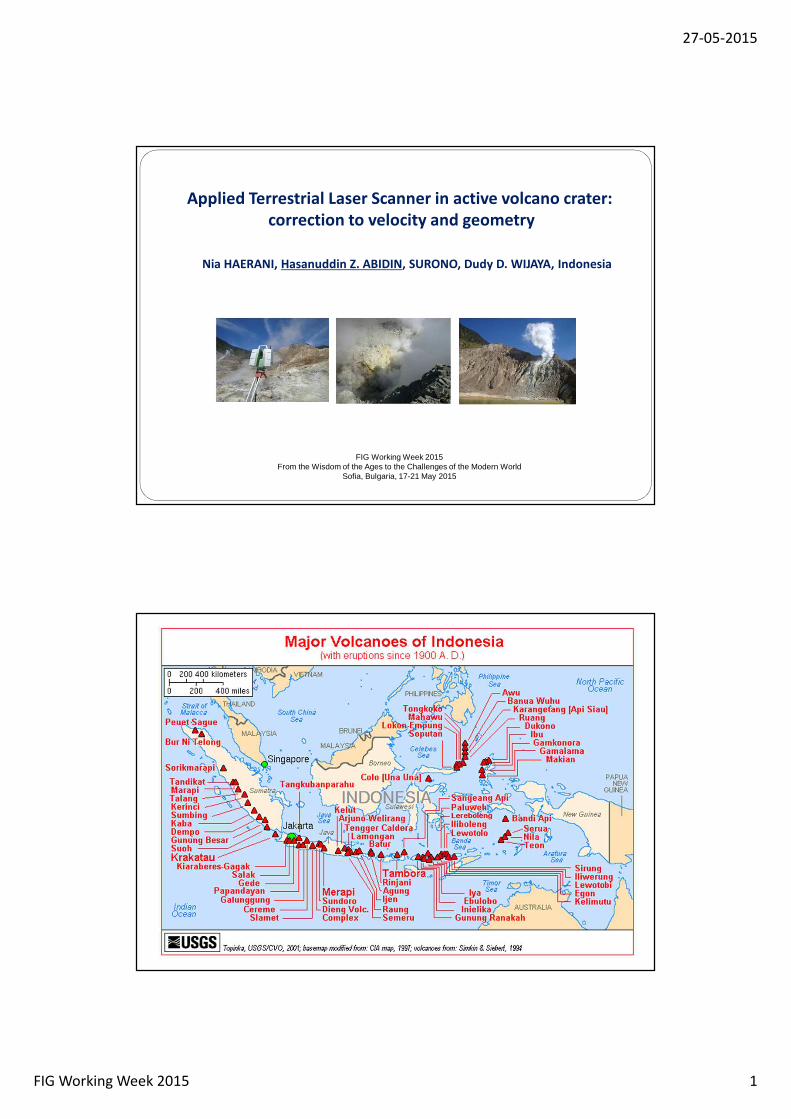
Applied Terrestrial Laser Scanner in active volcano crater:
correction to velocity and geometry
Nia HAERANI, Hasanuddin Z. ABIDIN, SURONO, Dudy D. WIJAYA, Indonesia
FIG Working Week 2015From the Wisdom of the Ages to the Challenges of the Modern World
Sofia, Bulgaria, 17-21 May 2015
27-05-2015
FIG Working Week 2015 2
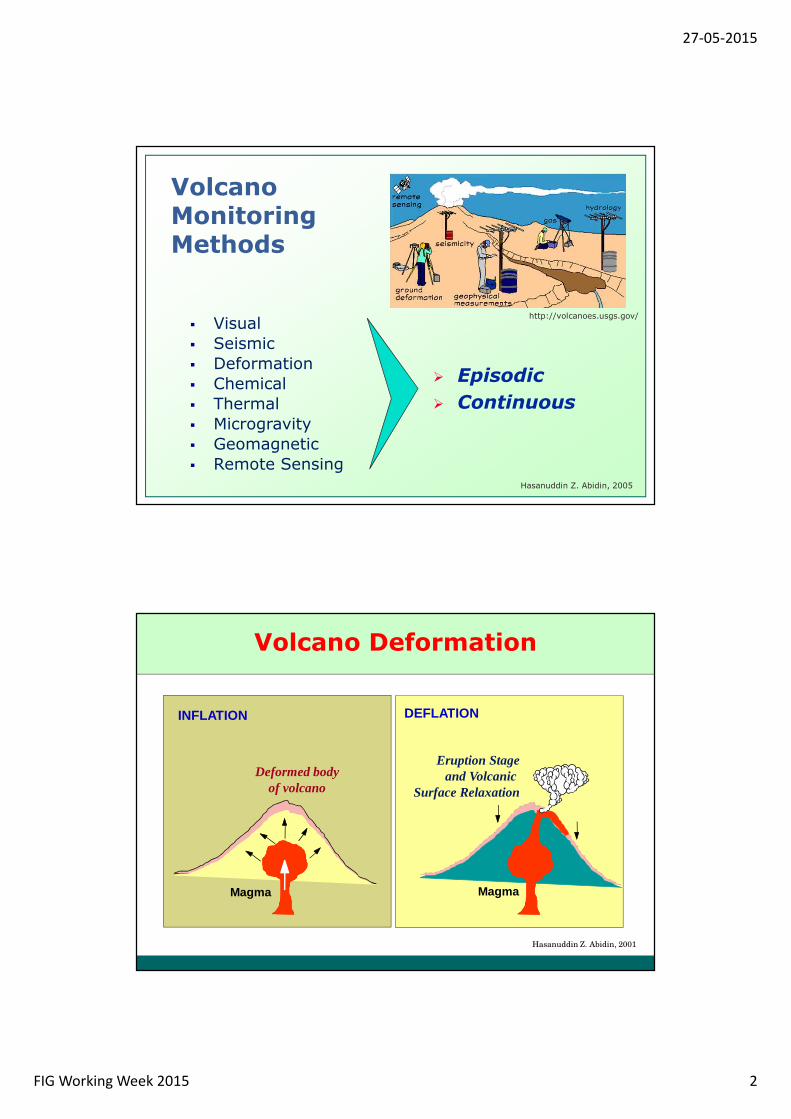
Volcano Monitoring Methods
� Visual
� Seismic
� Deformation
� Chemical
� Thermal
� Microgravity
� Geomagnetic
� Remote SensingHasanuddin Z. Abidin, 2005
http://volcanoes.usgs.gov/
� Episodic
� Continuous
Volcano Deformation
INFLATION
Magma
Deformed bodyof volcano
DEFLATION
Magma
Eruption Stageand Volcanic
Surface Relaxation
Hasanuddin Z. Abidin, 2001
27-05-2015
FIG Working Week 2015 3
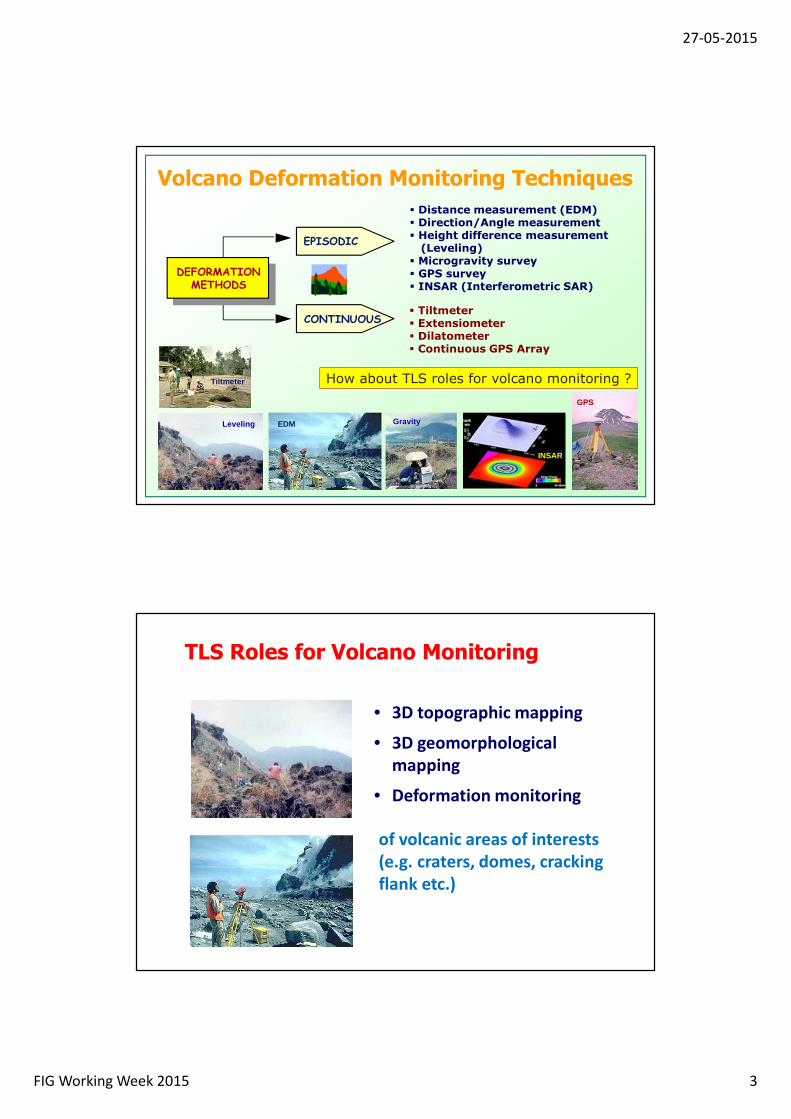
Volcano Deformation Monitoring Techniques
GPS
INSAR
Tiltmeter
EDMLeveling Gravity
EPISODIC
� Distance measurement (EDM)� Direction/Angle measurement� Height difference measurement (Leveling)
� Microgravity survey� GPS survey� INSAR (Interferometric SAR)
� Tiltmeter� Extensiometer� Dilatometer� Continuous GPS Array
CONTINUOUS
DEFORMATION
METHODS
How about TLS roles for volcano monitoring ?
TLS Roles for Volcano Monitoring
• 3D topographic mapping
• 3D geomorphological
mapping
• Deformation monitoring
of volcanic areas of interests
(e.g. craters, domes, cracking
flank etc.)
27-05-2015
FIG Working Week 2015 4
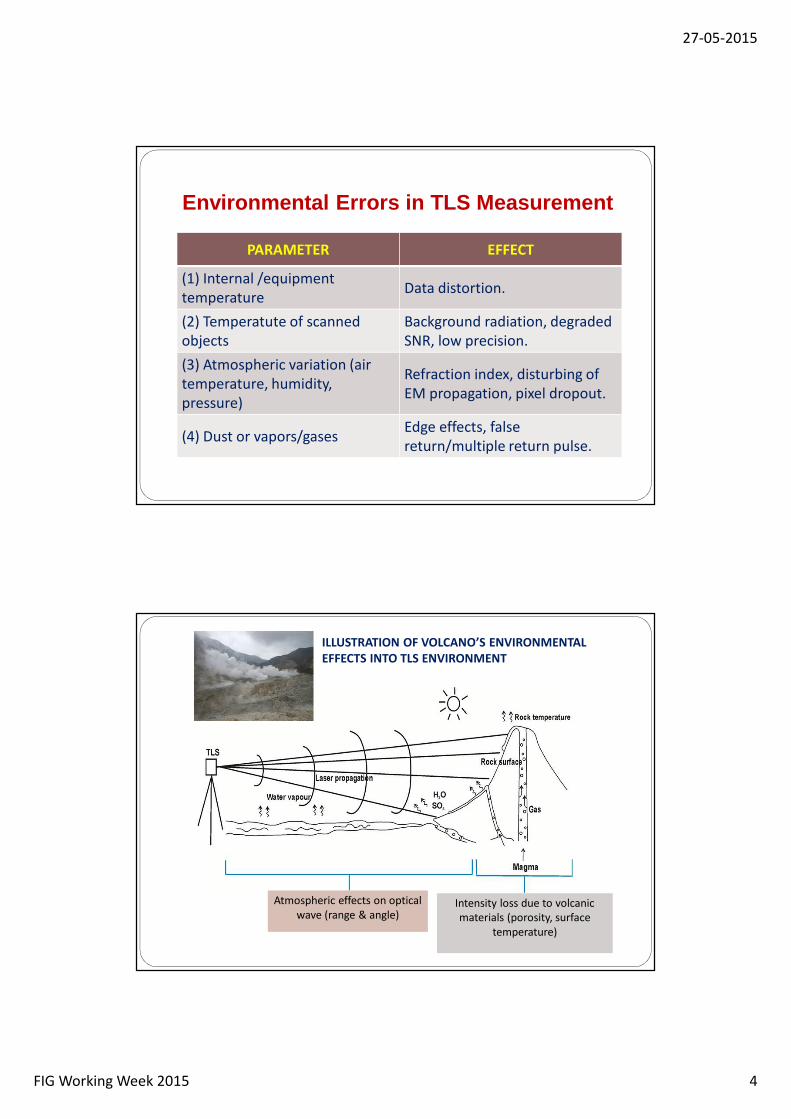
Environmental Errors in TLS Measurement
PARAMETER EFFECT
(1) Internal /equipment
temperatureData distortion.
(2) Temperatute of scanned
objects
Background radiation, degraded
SNR, low precision.
(3) Atmospheric variation (air
temperature, humidity,
pressure)
Refraction index, disturbing of
EM propagation, pixel dropout.
(4) Dust or vapors/gasesEdge effects, false
return/multiple return pulse.
Atmospheric effects on optical
wave (range & angle)Intensity loss due to volcanic
materials (porosity, surface
temperature)
ILLUSTRATION OF VOLCANO’S ENVIRONMENTAL
EFFECTS INTO TLS ENVIRONMENT
27-05-2015
FIG Working Week 2015 5
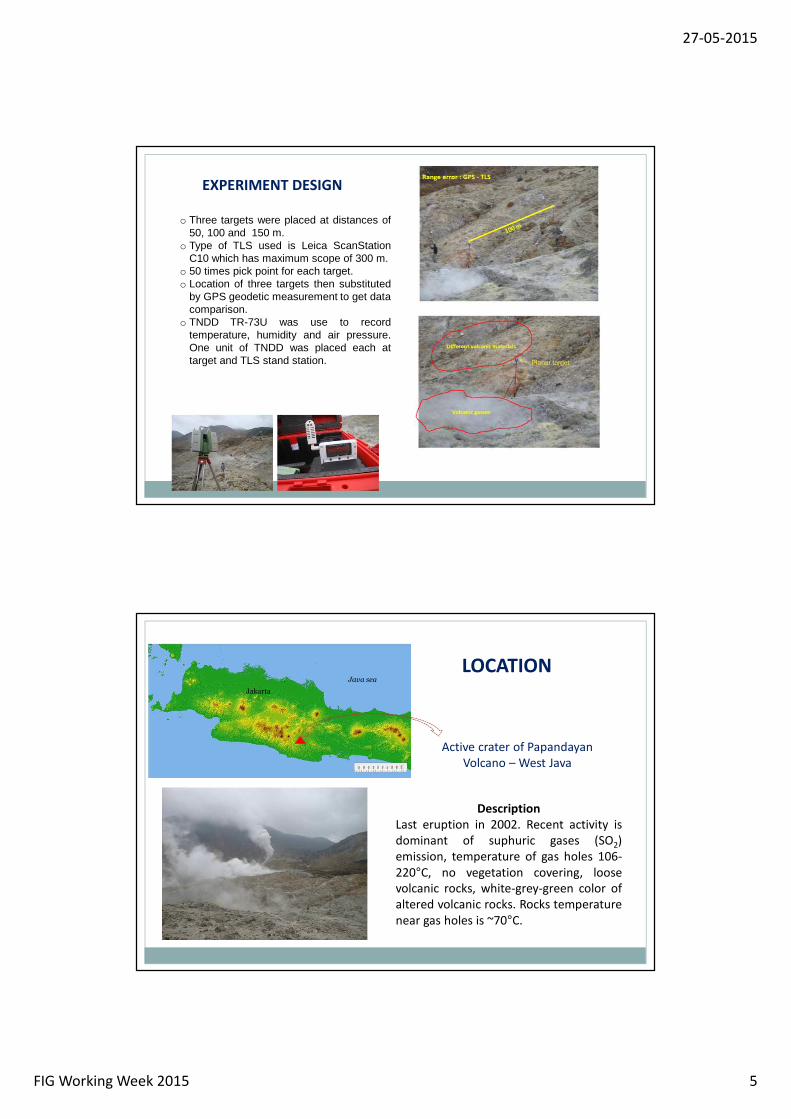
EXPERIMENT DESIGN
o Three targets were placed at distances of 50, 100 and 150 m.
o Type of TLS used is Leica ScanStation C10 which has maximum scope of 300 m.
o 50 times pick point for each target.o Location of three targets then substituted
by GPS geodetic measurement to get data comparison.
o TNDD TR-73U was use to record temperature, humidity and air pressure. One unit of TNDD was placed each at target and TLS stand station. Planar target
LOCATION
Description
Last eruption in 2002. Recent activity is
dominant of suphuric gases (SO2)
emission, temperature of gas holes 106-
220°C, no vegetation covering, loose
volcanic rocks, white-grey-green color of
altered volcanic rocks. Rocks temperature
near gas holes is ~70°C.
Active crater of Papandayan
Volcano – West Java
Jakarta
Java sea
27-05-2015
FIG Working Week 2015 6
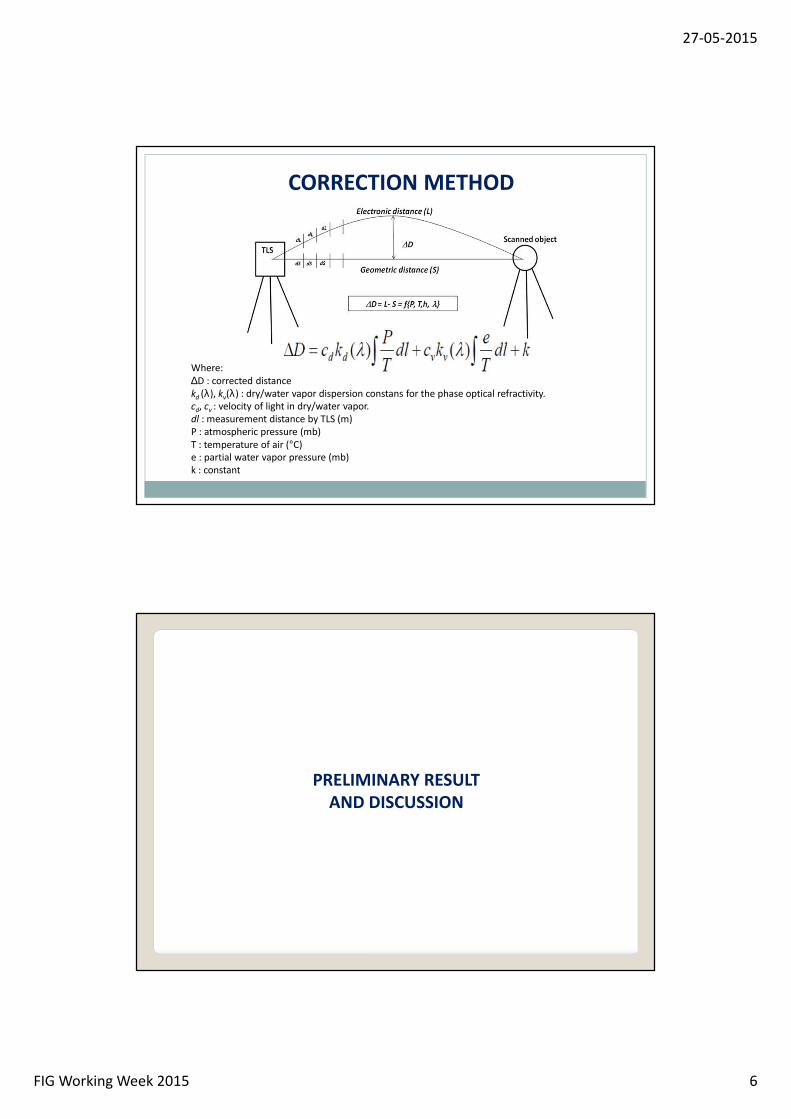
CORRECTION METHOD
Where:
∆D : corrected distance
kd
(λ), kv(λ) : dry/water vapor dispersion constans for the phase optical refractivity.
cd, c
v: velocity of light in dry/water vapor.
dl : measurement distance by TLS (m)
P : atmospheric pressure (mb)
T : temperature of air (°C)
e : partial water vapor pressure (mb)
k : constant
PRELIMINARY RESULT
AND DISCUSSION
27-05-2015
FIG Working Week 2015 7
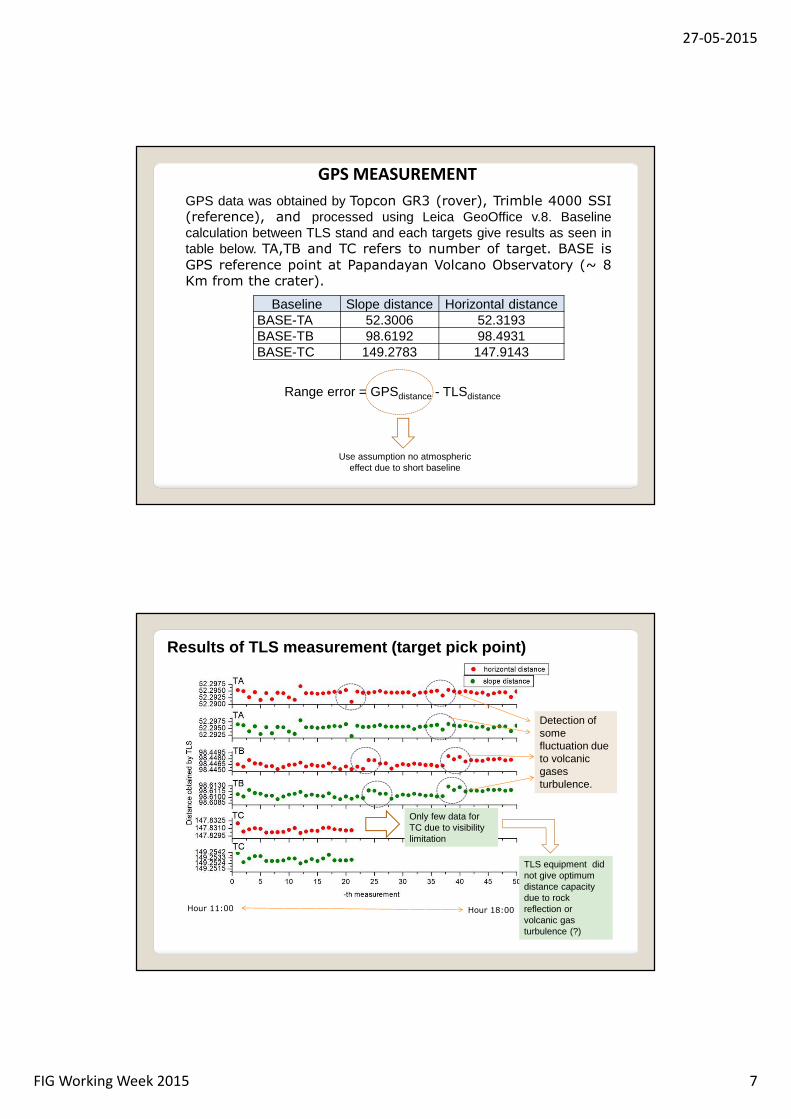
GPS MEASUREMENT
GPS data was obtained by Topcon GR3 (rover), Trimble 4000 SSI (reference), and processed using Leica GeoOffice v.8. Baseline calculation between TLS stand and each targets give results as seen in table below. TA,TB and TC refers to number of target. BASE is
GPS reference point at Papandayan Volcano Observatory (~ 8 Km from the crater).
Baseline Slope distance Horizontal distanceBASE-TA 52.3006 52.3193BASE-TB 98.6192 98.4931BASE-TC 149.2783 147.9143
Range error = GPSdistance - TLSdistance
Use assumption no atmospheric effect due to short baseline
Results of TLS measurement (target pick point)
Only few data for TC due to visibility limitation
Detection of some fluctuation due to volcanic gases turbulence.
TLS equipment did not give optimum distance capacity due to rock reflection or volcanic gas turbulence (?)
Hour 11:00 Hour 18:00
27-05-2015
FIG Working Week 2015 8
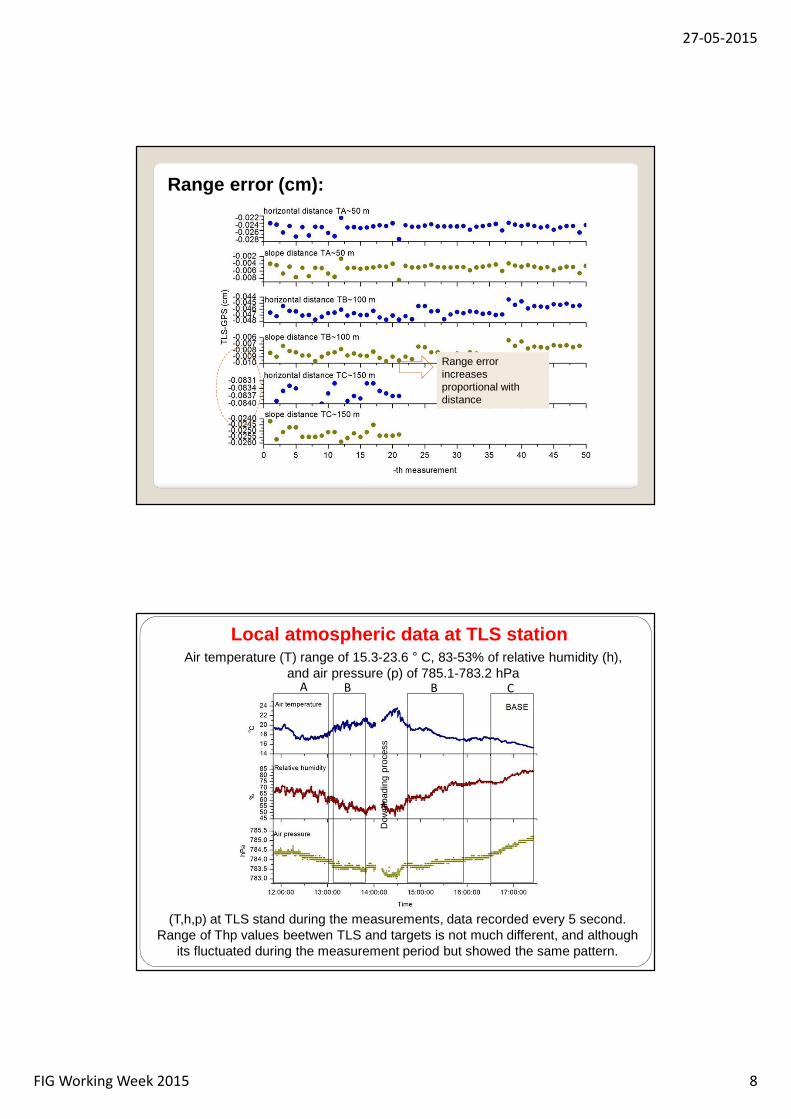
Range error (cm):
Range error increases proportional with distance
Local atmospheric data at TLS station
A BB C
(T,h,p) at TLS stand during the measurements, data recorded every 5 second. Range of Thp values beetwen TLS and targets is not much different, and although
its fluctuated during the measurement period but showed the same pattern.
Air temperature (T) range of 15.3-23.6 ° C, 83-53% of relative humidity (h), and air pressure (p) of 785.1-783.2 hPa
Dow
nloa
ding
pro
cess
27-05-2015
FIG Working Week 2015 9
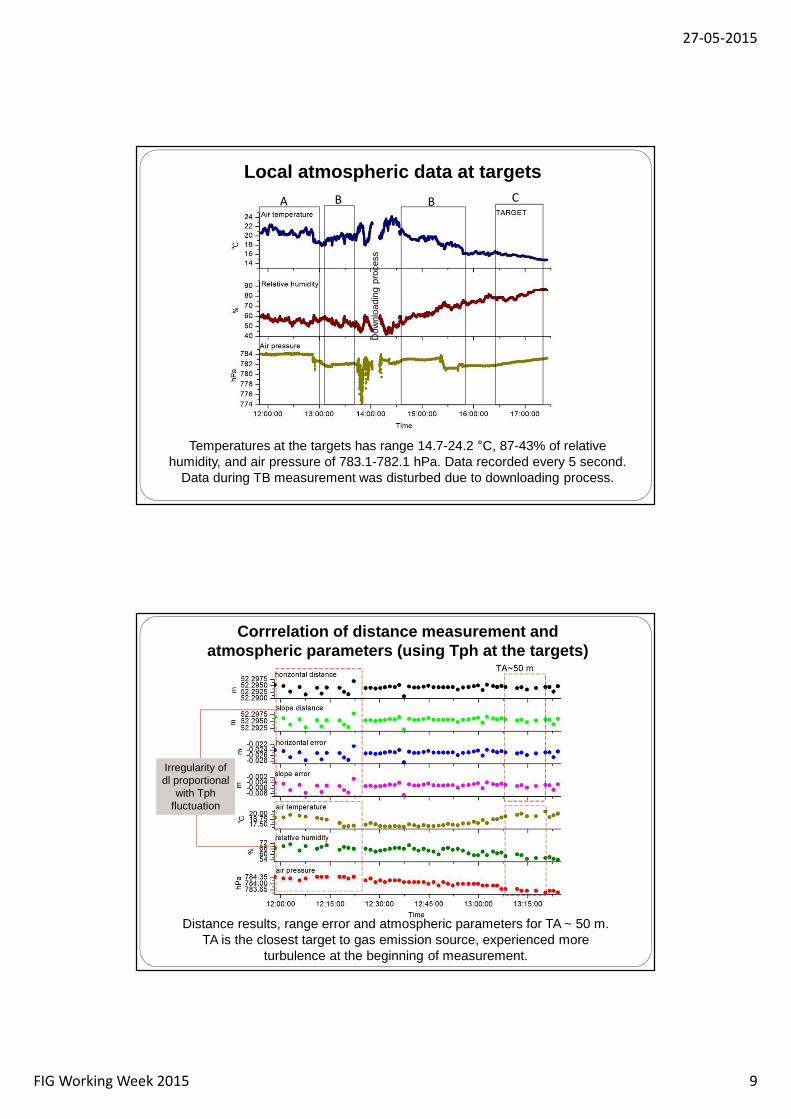
Local atmospheric data at targetsA BB C
Temperatures at the targets has range 14.7-24.2 °C, 87-43% of relative humidity, and air pressure of 783.1-782.1 hPa. Data recorded every 5 second.
Data during TB measurement was disturbed due to downloading process.
Dow
nloa
ding
pro
cess
Corrrelation of distance measurement and atmospheric parameters (using Tph at the targets)
Distance results, range error and atmospheric parameters for TA ~ 50 m.TA is the closest target to gas emission source, experienced more
turbulence at the beginning of measurement.
Irregularity of dl proportional
with Tph fluctuation
27-05-2015
FIG Working Week 2015 10
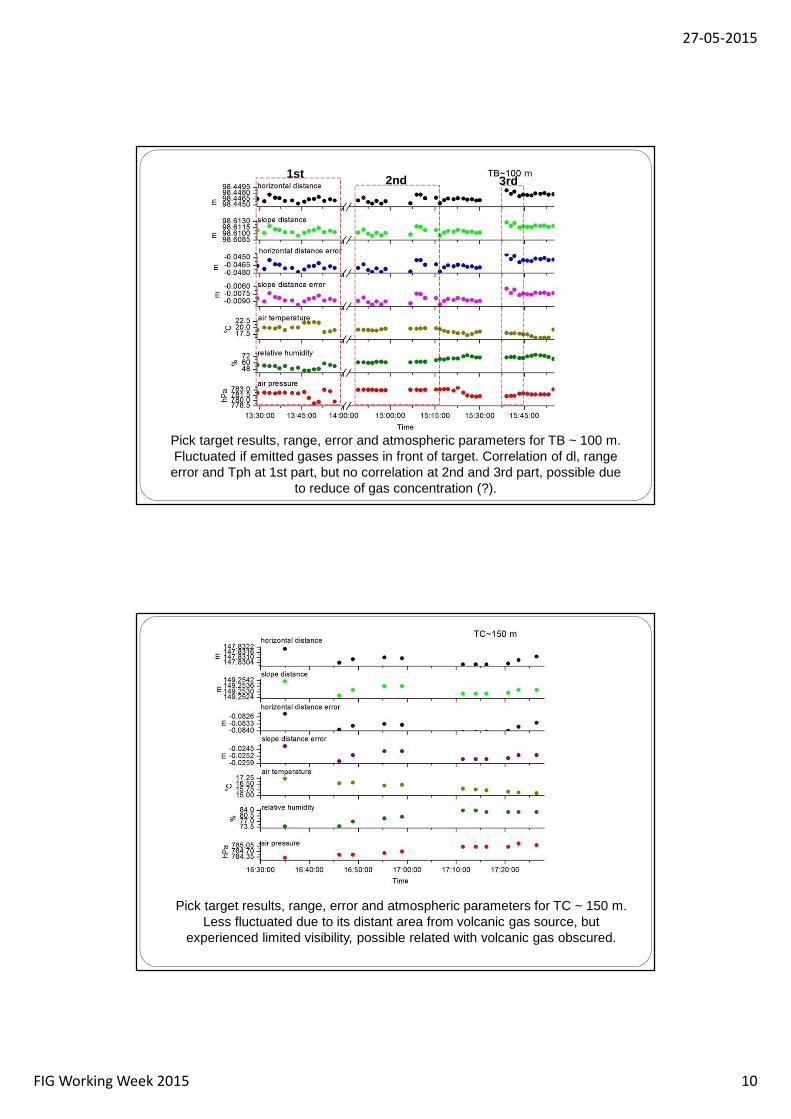
1st 2nd 3rd
Pick target results, range, error and atmospheric parameters for TB ~ 100 m.Fluctuated if emitted gases passes in front of target. Correlation of dl, range error and Tph at 1st part, but no correlation at 2nd and 3rd part, possible due
to reduce of gas concentration (?).
Pick target results, range, error and atmospheric parameters for TC ~ 150 m.Less fluctuated due to its distant area from volcanic gas source, but
experienced limited visibility, possible related with volcanic gas obscured.
27-05-2015
FIG Working Week 2015 11
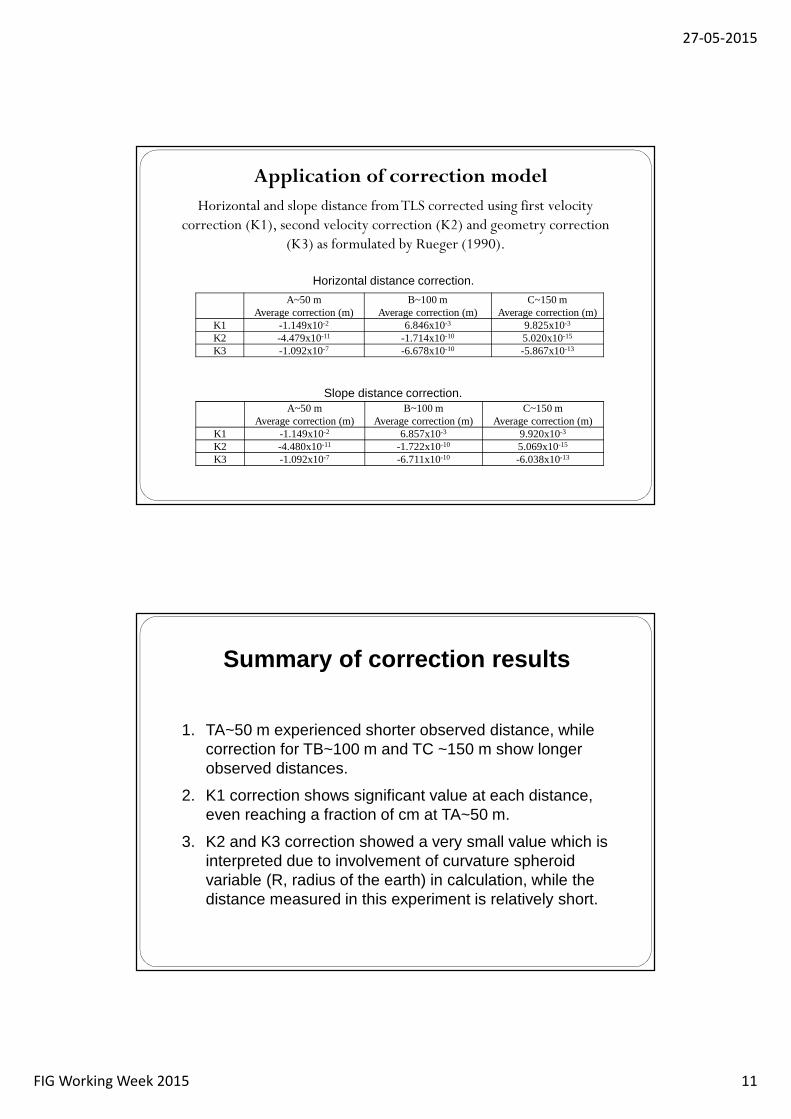
Application of correction model
Horizontal and slope distance from TLS corrected using first velocity correction (K1), second velocity correction (K2) and geometry correction
(K3) as formulated by Rueger (1990).
A~50 mAverage correction (m)
B~100 mAverage correction (m)
C~150 mAverage correction (m)
K1 -1.149x10⁻² 6.846x10⁻³ 9.825x10⁻³
K2 -4.479x10⁻¹¹ -1.714x10⁻¹⁰ 5.020x10⁻¹⁵
K3 -1.092x10⁻⁷ -6.678x10⁻¹⁰ -5.867x10⁻¹³
A~50 mAverage correction (m)
B~100 mAverage correction (m)
C~150 mAverage correction (m)
K1 -1.149x10⁻² 6.857x10⁻³ 9.920x10⁻³
K2 -4.480x10⁻¹¹ -1.722x10⁻¹⁰ 5.069x10⁻¹⁵
K3 -1.092x10⁻⁷ -6.711x10⁻¹⁰ -6.038x10⁻¹³
Slope distance correction.
Horizontal distance correction.
1. TA~50 m experienced shorter observed distance, while correction for TB~100 m and TC ~150 m show longer observed distances.
2. K1 correction shows significant value at each distance, even reaching a fraction of cm at TA~50 m.
3. K2 and K3 correction showed a very small value which is interpreted due to involvement of curvature spheroid variable (R, radius of the earth) in calculation, while the distance measured in this experiment is relatively short.
Summary of correction results
27-05-2015
FIG Working Week 2015 12
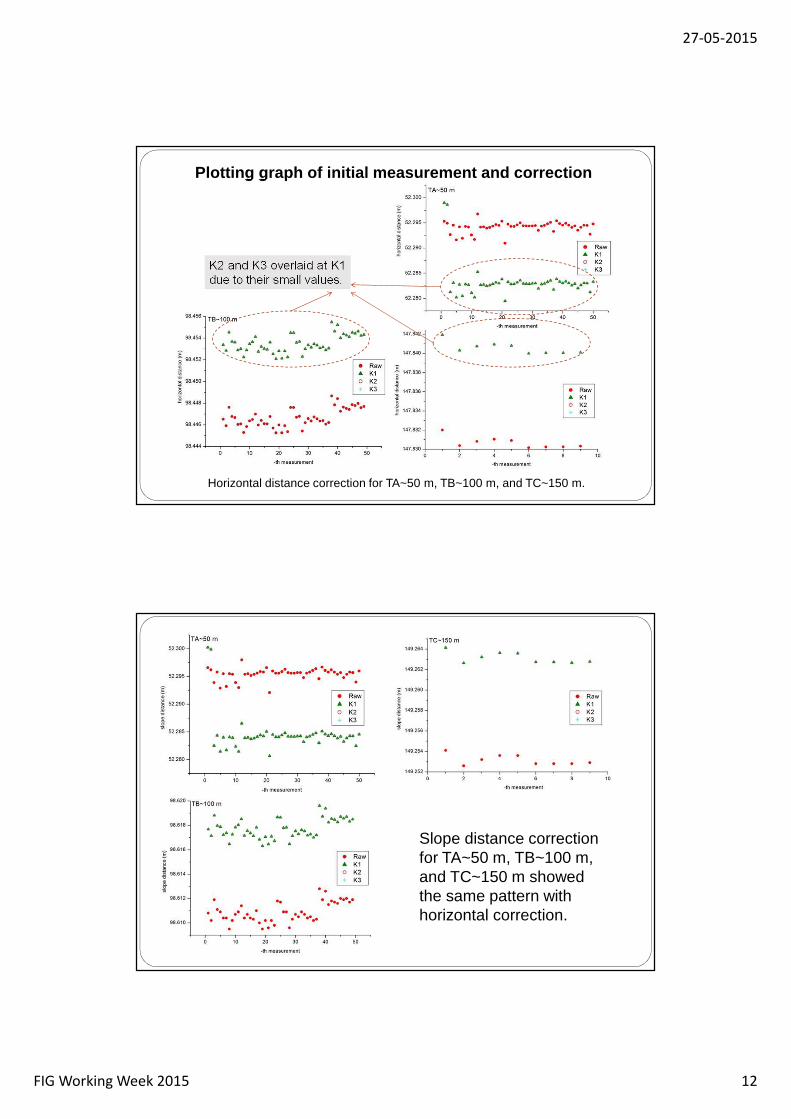
Plotting graph of initial measurement and correction
K2 and K3 overlaid at K1 due to their small values.
Horizontal distance correction for TA~50 m, TB~100 m, and TC~150 m.
Slope distance correction for TA~50 m, TB~100 m, and TC~150 m showed the same pattern with horizontal correction.
27-05-2015
FIG Working Week 2015 13
Preliminary results of this research do not show the expected one, especially in correction results. K2 and K3 is not
significant, possible due to some factors: short baseline, small elevation gradients, and insignificant Thp value between target
and TLS stand.
Correction models of Rueger (1990) using Thp standard, and only involves CO2 in the air. In this research, gas component is more varied (volcanic gases generally consist of a compound
H2O, N2, CH4, CO, CO2, SO2, H2S, HCl, NH3 and H2O) that have different characteristics, so they have not been
accommodated in this model.
Preliminary Notes
From preliminary analysis we drawn some conclusions as follows:
1) Activity of volcanic gases and local atmospheric conditions of active volcano crater effect distance value obtained by TLS measurement, and has significant error value proportional with increasing of distance.
2) Correction of distance measurement only significant for first velocity correction, while second velocity correction and geometric correction is not significant.
CONCLUSION
27-05-2015
FIG Working Week 2015 14
FUTURE WORKS
1) Apply Zenith Hydrostatic Delay (Saastamoinen, 1972).2) Compared and reviewed to determine the most
suitable model. evaluate design of measurement 3) Deploy the same method at normal/non volcanic
environment. Result from volcanic and normal environment will be compare to see some possible solutions.
4) Looking for another correction model also essential to get better result or if necessary create new correction formula.
- THANK YOU -