commodity research report 20 february 2017 ways2capital
TRANSCRIPT

E
BULLION METALS OUTLOOK -
GOLD - Last week, spot gold prices rose marginally by 0.1 percent to close at $1235.2 per ounce as
the dollar weakened after a 10-day winning streak and investors took the opportunity to buy bullion as
a hedge against political uncertainty in the United States and Europe. On the MCX, gold prices rose by
0.6 percent to close at Rs.29360 per 10 gms. Concern over U.S. President Donald Trump's policies, as
well as elections in the Netherlands, France and Germany this year, have fueled gold's rise to a peak of
$1,244.67 on Feb. 8. But the prospect of a higher dollar and U.S. Treasury yields after U.S. Federal
Reserve Chair Janet Yellen said that U.S. interest rates may need to be raised in March pushed gold to
$1,216.41 on Wednesday, its lowest since Feb. 3. We expect gold prices to trade higher as uncertainty
continues to haunt investor’s flight towards safe haven, while weak dollar index would also be
supportive for gold prices. On the MCX, gold prices are expected to trade higher,
Gold in MCX Futures inched higher to close at 0.84%, prices opened higher on Monday above its key
level of Rs.29211. Gold prices made a fresh high at Rs.29278. Prices trading little lower on Friday
below Rs.29400 and expect prices to trade little sideways around Rs.29200 to Rs.29400 levels. As per
medium term perspective, the second wave of upside started from Rs.29100 and could extend its rally
till Rs.29600 to Rs.29700 levels..
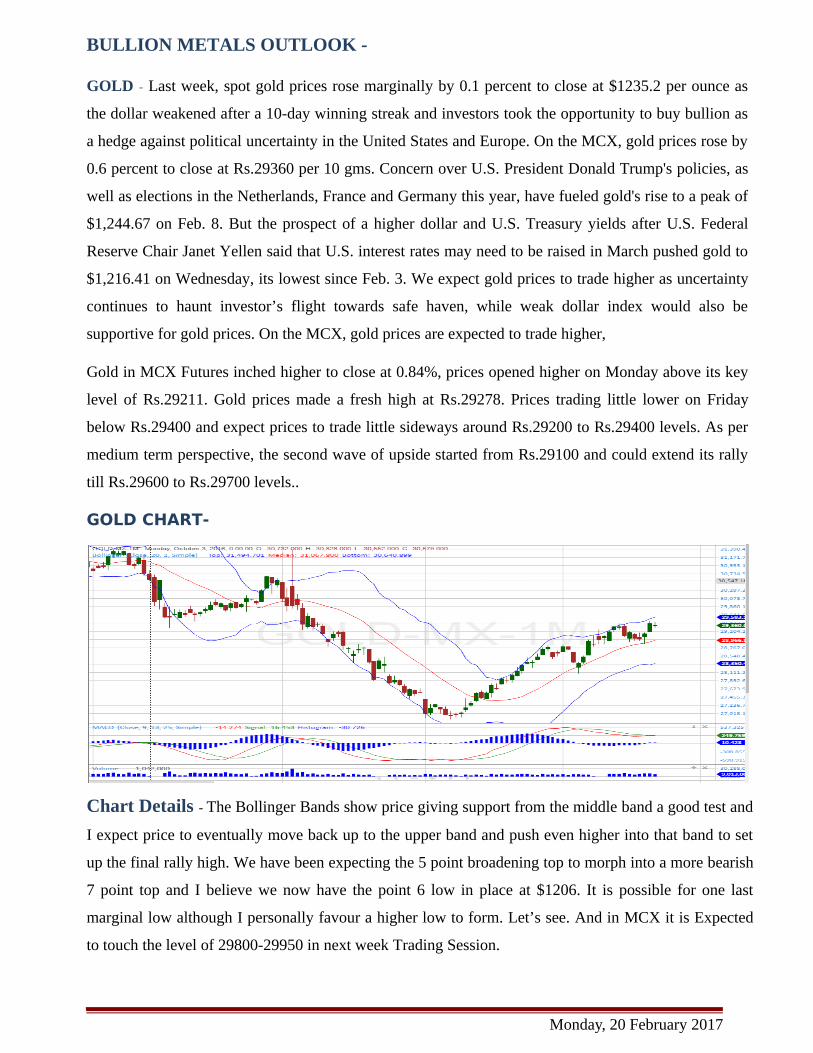
GOLD CHART-
Chart Details - The Bollinger Bands show price giving support from the middle band a good test and
I expect price to eventually move back up to the upper band and push even higher into that band to set
up the final rally high. We have been expecting the 5 point broadening top to morph into a more bearish
7 point top and I believe we now have the point 6 low in place at $1206. It is possible for one last
marginal low although I personally favour a higher low to form. Let’s see. And in MCX it is Expected
to touch the level of 29800-29950 in next week Trading Session.
Monday, 20 February 2017
SILVER - Spot silver prices rose by 0.1 percent to close at $18 per ounce in linen with rise in gold
prices, however, stronger dollar index capped the rally. On the MCX, silver prices rose by 0.84 percent
to close at Rs.42937 per kg. Silver prices trading above its key resistance of $18 but it may find its
another near - term hurdle at $18.1 to $18.2 levels, a break in which prices could extend its medium term
bull trend till $18.5. Silver in MCX Futures rallied higher on Monday to the high of Rs.42731. We can
expect this rally to continue in coming sessions till Rs.43500 to Rs.44000 levels. Silver expected to
hover around its high’s for short term.
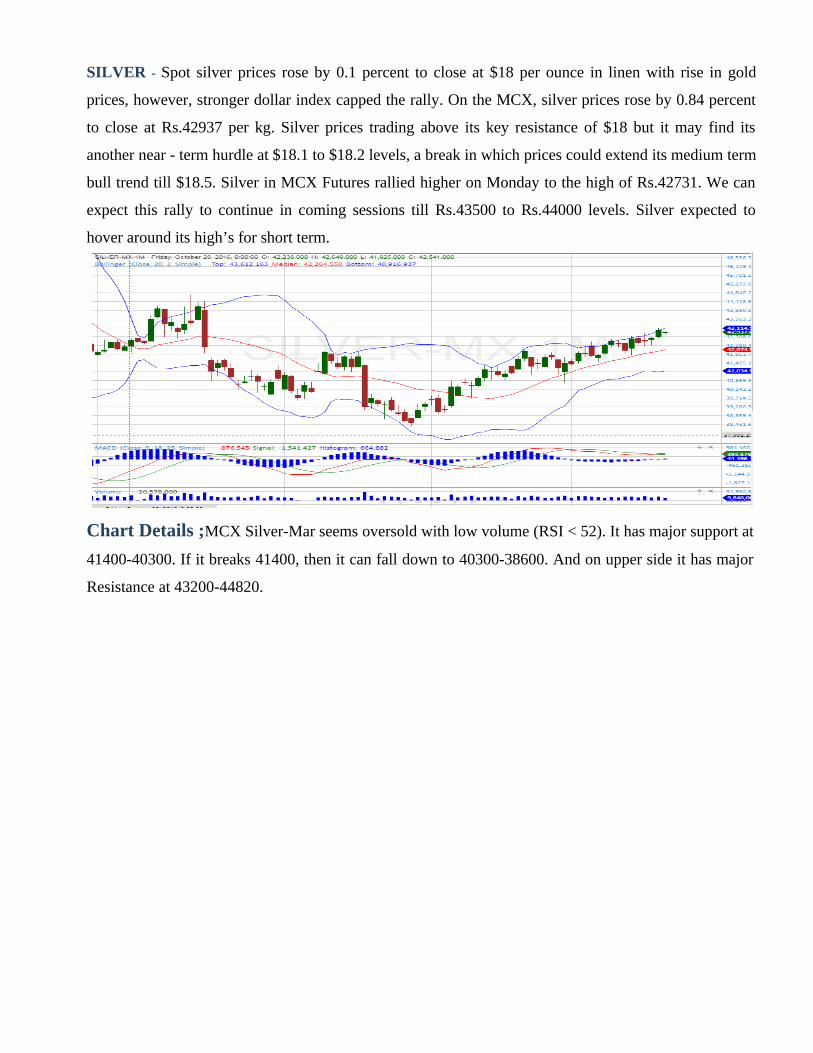
Chart Details ;MCX Silver-Mar seems oversold with low volume (RSI < 52). It has major support at
41400-40300. If it breaks 41400, then it can fall down to 40300-38600. And on upper side it has major
Resistance at 43200-44820.

MCX DAILY LEVELS ✍
DAILY EXPIRY DATE R4 R3 R2 R1 PP S1 S2 S3 S4
ALUMINIUM 30-DEC-2016 131 129 127 126 125 124 123 121 119
COPPER 28-FEB-2016 417 411 405 403 399 397 393 387 381
CRUDE OIL 19-OCT-2016 3691 3651 3611 3595 3571 3555 3531 3491 3451
GOLD 03-FEB-2016 29811 29664 29517 29439 29370 29292 29223 29076 28929
LEAD 30-DEC-2016 160 157 154 153 151 150 148 145 142
NATURAL GAS 27-DEC-2015 204 200 196 193 192 189 188 184 180
NICKEL 30-DEC-2016 780 765 750 744 735 729 720 705 690
SILVER 03-MARCH-2016 43557 43340 43123 43030 42906 42813 42689 42472 42255
ZINC 30-DEC-2016 207 201 195 191 189 185 183 177 171
MCX WEEKLY LEVELS ✍
DAILY EXPIRY DATE R4 R3 R2 R1 PP S1 S2 S3 S4
ALUMINIUM 30-DEC-2016 138 134 130 127 126 123 122 118 114
COPPER 28-FEB-2016 457 439 421 411 403 393 385 367 349
CRUDE OIL 19-OCT-2016 3813 3733 3653 3616 3573 3537 3493 3413 3333
GOLD 03-FEB-2016 31078 30465 29852 29606 29239 28993 28626 28013 27400
LEAD 30-DEC-2016 200 185 170 161 155 146 140 125 110
NATURAL GAS 27-DEC-2015 230 218 206 199 194 187 182 170 158
NICKEL 30-DEC-2016 814 786 758 749 730 721 702 674 646
SILVER 03-MARCH-2016 45490 44581 43672 43305 42763 42396 41854 40945 40036
ZINC 30-DEC-2016 230 217 204 196 191 183 178 165 152
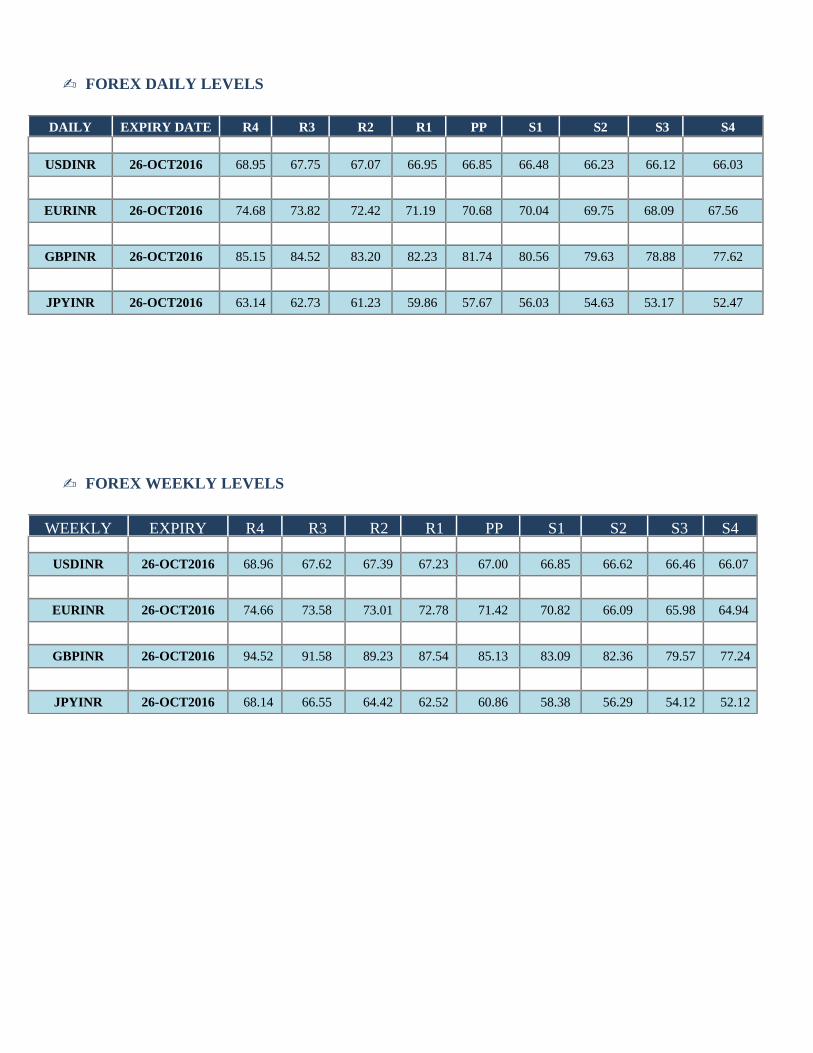
FOREX DAILY LEVELS ✍
DAILY EXPIRY DATE R4 R3 R2 R1 PP S1 S2 S3 S4
USDINR 26-OCT2016 68.95 67.75 67.07 66.95 66.85 66.48 66.23 66.12 66.03
EURINR 26-OCT2016 74.68 73.82 72.42 71.19 70.68 70.04 69.75 68.09 67.56
GBPINR 26-OCT2016 85.15 84.52 83.20 82.23 81.74 80.56 79.63 78.88 77.62
JPYINR 26-OCT2016 63.14 62.73 61.23 59.86 57.67 56.03 54.63 53.17 52.47
FOREX WEEKLY LEVELS✍
WEEKLY EXPIRY R4 R3 R2 R1 PP S1 S2 S3 S4
USDINR 26-OCT2016 68.96 67.62 67.39 67.23 67.00 66.85 66.62 66.46 66.07
EURINR 26-OCT2016 74.66 73.58 73.01 72.78 71.42 70.82 66.09 65.98 64.94
GBPINR 26-OCT2016 94.52 91.58 89.23 87.54 85.13 83.09 82.36 79.57 77.24
JPYINR 26-OCT2016 68.14 66.55 64.42 62.52 60.86 58.38 56.29 54.12 52.12

NCDEX DAILY LEVELS✍
DAILY EXPIRY
DATE
R4 R3 R2 R1 PP S1 S2 S3 S4
SYOREFIDR 20-JAN-2016 684 682 680 679 678 677 676 674 672
SYBEANIDR 20-JAN-2016 3091 3027 2963 2929 2899 2865 2835 2771 2707
RMSEED 20-JAN-2016 3883 3850 3817 3803 3784 3770 3751 3718 3685
JEERAUNJHA 20-JAN-2016 17827 17582 17337 17233 17092 16988 16847 16602 16357
GUARSEED10 20-JAN-2016 3398 3356 3314 3295 3272 3253 3230 3188 3146
TMC 20-APR-2016 7171 7065 6959 6897 6853 6791 6747 6641 6535
NCDEX WEEKLY LEVELS✍
WEEKLY EXPIRY
DATE
R4 R3 R2 R1 PP S1 S2 S3 S4
SYOREFIDR 20-JAN-2016 757 733 709 694 685 670 661 637 613
SYBEANIDR 20-JAN-2016 3285 3163 3041 2967 2919 2845 2797 2675 2553
RMSEED 20-JAN-2016 3963 3906 3849 3819 3792 3762 3735 3678 3621
JEERAUNJHA 20-JAN-2016 18307 17882 17457 17293 17032 16868 16607 16182 15757
GUARSEED10 20-JAN-2016 3606 3486 3366 3321 3246 3201 3126 3006 2886
TMC 20-APR-2016 7671 7411 7151 6993 6891 6733 6631 6371 6111

MCX - WEEKLY NEWS LETTERS
INTERNATIONAL UPDATES ( BULLION & ENERGY )✍
Gold prices fell on Friday as the stronger dollar outweighed concerns about uncertainty surrounding
U.S. policy and upcoming elections in Europe. Gold for February delivery settled down 0.46% at
$1,235.85 on the Comex division of the New York Mercantile Exchange. The U.S. dollar index, which
measures the greenback’s strength against a trade-weighted basket of six major currencies, rose 0.44%
to 100.89 late Friday, reversing Thursday’s 0.72% drop and leaving it up 0.16% for the week. A strong
dollar is typically bearish for gold, which is denominated in dollars and struggles to compete with yield-
bearing assets when borrowing costs rise. The precious metal still notched up a weekly gain of 0.35% as
uncertainty over the policies of U.S. President Donald Trump spurred safe haven demand for bullion.
Elsewhere in precious metals trading, silver was at $ 17.97 a troy ounce late Friday, and ended the week
with gains of 0.25%. In the holiday shortened week ahead, the Fed is to publish the minutes of its
February meeting on Wednesday, which will be scrutinized for clues on the timing of the next rate hike.
Investors will be looking to U.S. housing data in order to see whether the rise in consumer spending and
inflation is translating into higher house prices and a pick-up in home sales. Markets will also be
watching survey data on private sector activity in the euro zone on Tuesday. Ahead of the coming week,
Investing.com has compiled a list of these and other significant events likely to affect the markets.
Monday February 20
Financial markets in the U.S. will be closed for the Presidents Day holiday.
Canada is to release data on wholesale sales.
Tuesday, February 21
The Reserve Bank of Australia is to publish the minutes of its latest monetary policy meeting, giving
investors insight into how officials view the economy and their policy options.
The euro zone is to release survey data on private sector business activity.
The UK is to report on public sector borrowing.
Minneapolis Fed President Neel Kashkari is to speak at an event in Minnesota and Philadelphia Fed
head Patrick Harker is to speak at an event in Pennsylvania.

Wednesday, February 22
RBA Governor Philip Lowe is to speak at an event in Sydney.
Australia is to release data on completed construction work and the wage price index.
The Ifo Institute is to report on German business climate.
The UK is to release revised figures on fourth quarter growth.
Canada is to publish data on retail sales.
The U.S. is to release industry data on existing home sales and later the Fed is to publish the minutes
of its February policy meeting.
Thursday, February 23
Australia is to report on private capital expenditure.
The U.S. is to release the weekly report in initial jobless claims.
Friday, February 24
RBA Governor Philip Lowe is to speak at an event in Sydney.
Canada is to publish figures on inflation.
The U.S. is to round up the week with data on new home sales and a revised report on consumer
sentiment.
Gold prices eased on Friday but notched a weekly gain as investors opted for the safe-haven qualities of
bullion due to uncertainty about U.S. and European politics as well as the direction of stock markets.
Global equity markets lost momentum after setting record highs in the previous two sessions, partly due
to disquiet about the policies of U.S. President Donald Trump. is close to its recent multimonth high
despite the strong dollar, due to an increase in volatility on the equity markets and more uneasiness on
the political front, which is supporting the search for safe-haven assets. Spot gold XAU= was 0.14
percent lower at $1,237 per ounce by 2:44 p.m. EST, while U.S. gold futures GCcv1 ended the session
down 0.2 percent at $1,239.10. Concern over Trump's policies, as well as elections in the Netherlands,
France and Germany this year, fueled gold's rise to a peak of $1,244.67 on Feb. 8, the strongest in
nearly three months. Gold, on track for a third week of gains, has risen nearly 8 percent in 2017. Early

in the week, gold prices fell after Fed Chair Janet Yellen said U.S. interest rates may need to be raised
in March. "On balance, we still don't think that the Fed will raise interest rates at the March FOMC
meeting, but the 0.6 percent month-on-month surge in consumer prices in January could prompt the Fed
to move sooner than we anticipate," Capital Economics analysts said in a note. Gold prices recovered by
Wednesday after strong U.S. data showed U.S. inflation was picking up. is highly sensitive to rising
U.S. interest rates, as these increase the opportunity cost of holding non-yielding bullion, while boosting
the dollar, in which it is priced.
The dollar index .DXY rose 0.5 percent to 100.93 on Friday, recovering from a one-week low of 100.41
the day before. Holdings of SPDR Gold, the world's largest gold-backed exchange-traded fund, have
risen 5.6 percent so far this month, the most since June 2016. "The market seems to be quite supported
by investment inflows into the ETFs and I think this will be the most important factor through the year
as we expect investors to keep pouring money into gold ETFs," Weinberg added.
Gold started trading at a discount to official prices in India on Friday for the first time in seven weeks,
and buyers elsewhere in Asia held back purchases, waiting for rallying bullion prices to ease. Gold
XAU= crept higher on Friday as investors opted for its relative safety given uncertainty about U.S. and
European politics and the direction of stock markets. Gold, on track for a third week of gains, has risen
about 7.5 percent in 2017. "The physical side has been very weak still, as people are hesitant in buying
at these levels. "We are seeing only those who are buying for investment purposes since Donald Trump
came in January. rest of them aren't buying and waiting for prices to come down."
Dealers in India, the world's second-largest gold consumer, were offering a discount of up to $1 an
ounce this week from official domestic prices, compared to a premium of $3 last week. The domestic
price includes a 10 percent import tax. "The market is losing momentum due to the price rise. Prices
need to come down below 28,500 rupees to boost demand,"Gold MAUc1 was trading around 29,400
rupees per 10 grams on Friday, after falling to 26,862 rupees in December, the lowest level since Feb. 2,
2016. Gold demand in India will be muted this year after dropping to multi-year lows in 2016, as the
government pushes to make the market more transparent and brings in a new tax, the World Gold
Council said. has been falling after remaining robust for the past two-three weeks," said Daman Prakash
Rathod, a director at MNC Bullion, a wholesaler based in Chennai in southern India. "Retail buyers are
waiting for (a) price correction. Even jewellers have stopped re-stocking," he said. India's gold imports
in January fell 30 percent from a year ago to $2.04 billion. in China, the top consumer, were quoted $10
over international spot prices XAU= .
Hong Kong and Singapore premiums dropped slightly to 70 cents to $1.10 from last week's 80 cents-
$1.20. Prices in Japan were at a discount of 50 cents to $1, said a Tokyo-based trader.

Gold prices rose to a one-week high on Thursday, as the U.S. dollar pulled back from its strongest level
in more than a month, supporting demand for the yellow metal. Gold for April delivery on the Comex
division of the New York Mercantile Exchange inched up $4.05, or about 0.3%, to $1,237.15 a troy
ounce by 3:15AM ET. It rose to $ 1,238.00 during Asian hours, the strongest level since February 9.
Prices gained $ 7.70, or about 0.6%, on Wednesday, snapping a four-session losing streak. The dollar
index was down around 0.2% at 100.92 in early London morning trade. Upbeat U.S. inflation and retail
sales data on Wednesday reinforced expectations of a near-term rate hike by the Federal Reserve,
sending the index to 101.75, its strongest level since January 12. On Tuesday, Fed Chair Janet Yellen
raised market expectations for a March rate hike after saying it would be "unwise" for the central bank
to wait too long. Fed fund futures priced in around a 27% chance of a rate hike in March, according to
Investing.com’s Fed Rate Monitor Tool, up from less than 10% at the start of the week. Odds of a June
increase was seen at around 74%. The precious metal is sensitive to moves in U.S. rates, which lift the
opportunity cost of holding non-yielding assets such as bullion, while boosting the dollar in which it is
priced. On the data front, the U.S. will publish data on weekly jobless claims, housing starts, building
permits and Philadelphia Fed manufacturing, all due at 8:30 AM ET. Also on the Comex, silver futures
for March delivery inched up 2.4 cents, or 0.1%, to $ 17.98 a troy ounce. Meanwhile, platinum gained
0.5% to $ 1,015.20, while palladium tacked on 0.4%, to $789.42 an ounce. Elsewhere in metals trading,
copper futures slipped 1.1 cents, or about 0.4%, to $ 2.729 a pound. Prices of the red metal pulled back
from a 20-month peak of $ 2.822 touched on Monday as talks renewed between striking workers and
management at Chile's Escondida copper mine. The mine, which is owned by BHP Billiton, produced
over 1 million tonnes of copper, about 5% of the world's total in 2016.
Gold prices were little changed in European morning trade on Wednesday, as investors looked ahead to
a batch of U.S. economic data and more comments from Federal Reserve Chair Janet Yellen for further
clues on the pace of the central bank's interest rate increases. Gold for April delivery on the Comex
division of the New York Mercantile Exchange inched up $1.65, or about 0.2%, to $ 1,227.05 a troy
ounce by 4:10AM ET, after losing 40 cents a day earlier. The yellow metal was on the back foot after
Fed Chair Yellen left the door open to an interest rate increase at the central bank's March policy
meeting. In testimony to the U.S. Senate on Tuesday, Yellen said that waiting too long to raise interest
rates would be "unwise" as economic growth continues and inflation rises. Investors raised their outlook
on a faster pace of U.S. rate increases following her comments. Fed fund futures priced in around a 20%
chance of a rate hike in March, according to Investing.com’s Fed Rate Monitor Tool, up from less than
10% at the start of the week. Odds of a June increase was seen at around 70%. Yellen is scheduled to
appear before the House of Representatives Financial Services Committee at 10:00AM ET on
Wednesday. The Fed has previously indicated that it could hike rates three times this year. The precious
metal is sensitive to moves in U.S. rates, which lift the opportunity cost of holding non-yielding assets
such as bullion, while boosting the dollar in which it is priced. On the data front, the U.S. will publish
January inflation figures at 8:30AM ET Wednesday. Market analysts expect consumer prices to ease up
0.3%, while core inflation is forecast to increase 0.2%. On a yearly base, core CPI is projected to climb

2.1%. The Fed usually tries to aim for 2% core inflation or less. Rising inflation would be a catalyst to
push the U.S. central bank toward raising interest rates. At the same time, the U.S. will also publish data
on January retail sales, amid expectations for a gain of 0.1% last month, after rising 0.6% in December.
Besides the inflation and retail sales reports, Wednesday's calendar also features U.S. data on industrial
production and a survey on manufacturing conditions in the New York region. The dollar index was up
around 0.2% at 101.40 in early London morning hours. It rose to 101.43 earlier, its strongest level since
January 20. Also on the Comex, silver futures for March delivery was little changed at $ 17.89 a troy
ounce, after rising to a three-month high of $ 18.09 on Tuesday. Meanwhile, platinum was flat at
$1,001.95, while palladium was steady at $781.25 an ounce.
Gold came off its highs on Tuesday, as the dollar advanced after U.S. Federal Reserve Chair Janet
Yellen said the central bank will likely need to raise interest rates at an upcoming meeting with the
economy expanding further. The Federal Reserve chair struck a more hawkish tone than investors had
expected, although she did flag considerable uncertainty over economic policy under the new
administration.
U.S. President Donald Trump's national security adviser Michael Flynn resigned on Tuesday over
revelations that he had discussed U.S. sanctions against Moscow with the Russian ambassador before
Trump took office. gold XAU= traded 0.4 percent higher at $ 1,229.49 an ounce by 2:36 p.m. EST,
while U.S. gold futures GCcv1 settled down 0.03 percent at $ 1,225.40. The dollar index .DXY reached
the highest in more than three weeks following Yellen's prepared remarks before the Senate Banking
Committee, while Wall Street rose to a record. "Yellen is trying to nudge the expectations for a rate hike
in March higher. This doesn't mean they will move in March, but the Fed wants to have the option to
move. Gold is highly sensitive to rising U.S. interest rates, which increase the opportunity cost of
holding non-yielding bullion while boosting the dollar, in which it is priced. "There's a nod to further
tightening ahead and the risks of waiting too long, and there is a reference to the need at upcoming
meetings to evaluate if the economy is evolving in a way that makes further hikes appropriate."Note the
use of the plural on 'meetings,' so there was no specific allusion to a March hike in the statement, and
Yellen also emphasized that any hikes will be 'gradual.'" Ahead of the testimony, Richmond Fed
President Jeffrey Lacker said the U.S. central bank will likely have to raise rates faster than financial
markets currently expect given any new policies by the Trump administration, while uncertain, will
force the central bank's hand. the upside for gold, holdings of SPDR Gold Trust GLD , the world's
largest gold-backed exchange-traded fund, rose 0.49 percent to 840.87 tonnes on Monday. Gold has
rallied nearly 10 percent since touching 10-month lows in December. In other precious metals, spot
silver XAG= rose 1 percent to $ 17.97, having hit its highest since Nov. 11 above $ 18 earlier.
Palladium XPD= gained 1 percent to $ 782.40 while platinum XPT= was up 0.6 percent at $ 1,001.20.
"Platinum also saw noticeable ETF inflows of 8,900 ounces.
Gold prices were slightly lower in European morning trade on Monday, as recent actions by U.S.
President Donald Trump helped soothe investor worries about uncertainty surrounding the new

administration’s controversial policies. Gold for April delivery on the Comex division of the New York
Mercantile Exchange dipped $ 3.90, or about 0.3%, to $ 1,232.00 a troy ounce by 3:15AM ET. Prices of
the yellow metal rallied to a three-month high of $ 1,246.60 last week amid growing concerns over
political risks in Europe and economic uncertainty in the U.S. But futures pulled back as markets shifted
focus back on Trump's efforts to boost economic growth after the president said his administration
would be announcing "something phenomenal in terms of tax" over "the next two or three weeks"
during a meeting with airline executives last Thursday. Meanwhile, a closely watched two-day U.S.-
Japan summit held over the weekend was seen to have ended smoothly, further supporting sentiment.
Trump and Japanese Prime Minister Shinzo Abe appeared to have established a quick friendship,
allaying investor fears of the meeting ending acrimoniously with Trump talking tough on trade,
currency and security issues.
The market's near-term focus was on Federal Reserve Chair Janet Yellen's congressional testimony
scheduled for Tuesday and Wednesday. Her comments will be monitored closely for any new insight on
policy and the timing of when it might raise interest rates. Investors will also keep an eye out on a
number of U.S. economic reports in the week ahead, including the January producer price index on
Tuesday, the January consumer price index and retail sales on Wednesday and housing-related data on
Thursday. The Fed left borrowing costs unchanged earlier this month and gave no firm signal on the
timing of its next rate hike. Fed fund futures are pricing in a less than 15% chance of a rate hike in
March, according to Investing.com’s Fed Rate Monitor Tool. However, odds of a June increase was
seen at more than 65%. The U.S. central bank has previously projected three rate increases this year.
However, traders remained unconvinced, with markets continuing to price in just two rate hikes during
the course of this year. Also on the Comex, silver futures for March delivery tacked on 2.0 cents, or
0.1%, to $17.95 a troy ounce after rising to $18.01 earlier, the most since November 11. Meanwhile,
platinum added 0.2% to $1,013.85, while palladium shed 0.2% to $ 781.48 an ounce.
Elsewhere in metals trading, copper futures jumped 2.0 cents, or about 0.7%, to $2.789 a pound. Prices
of the red metal rallied to a 20-month peak of $2.822 earlier amid concerns over an ongoing strike at the
Escondida copper mine in Chile, the largest in the world. The mine produces roughly 5% of the world's
total copper supply.
Gold prices steadied on Friday, but remained below the week’s three-month highs as the dollar pared
back some of the gains made in the wake of U.S. President Donald Trump's promise of a major tax
announcement. Gold for February delivery settled down 0.15% at $ 1,235.0 on the Comex division of
the New York Mercantile Exchange. The precious metal was still 1.3% higher for the week. On
Wednesday, gold reached its highest level since mid-November at $ 1,243.9. The U.S. dollar index,
which measures the greenback’s strength against a trade-weighted basket of six major currencies, was at
100.71 not far from the eleven-day highs of 101.02 set earlier Friday. The index ended the week with
gains of 0.95%, the largest weekly percentage gain since mid-December after remarks from Trump
indicted that his administration would soon reform tax policy. Trump said Thursday he would be

announcing something over the next two or three weeks that would be “phenomenal” in terms of tax. A
strong dollar is typically bearish for gold, which is denominated in dollars and struggles to compete
with yield-bearing assets when borrowing costs rise. Elsewhere in precious metals trading, silver was at
$17.95 a troy ounce late Friday, and ended the week with gains of 2.69%. Copper was up 4.65% at $
2.777 a pound and ended the week up 6.03% amid fears over a supply disruption. Workers at BHP
Billiton Escondida in Chile, the world's largest copper mine, went on strike on Thursday, bringing
production to a standstill. Platinum was down 0.77% at $1,014.3 late Friday. In the week ahead, the
U.S., the UK and China are to release what will be closely watched data on inflation. Meanwhile,
Federal Reserve Chair Janet Yellen is due to testify to Congress for the first time since Donald Trump
entered the White House. Ahead of the coming week, Investing.com has compiled a list of these and
other significant events likely to affect the markets.
Gold steadied on Friday, but remained below this week's three-month top as the U.S. dollar and
Treasury yields came off their highs after the currency initially jumped on U.S. President Donald
Trump's promise of a major tax announcement. Spot gold XAU= was up 0.02 percent at $ 1,230.78 an
ounce by 2:24 p.m. EST, while U.S. gold futures GCv1 for April delivery settled down 0.07 percent at $
1,235.90. On Wednesday, spot gold reached its highest since mid-November at $ 1,244.67. Gold prices
were on track for a second weekly gain, up 1 percent from late last Friday. The dollar .DXY pared gains
against a currency basket on Friday after earlier strength from U.S. President Donald Trump's pledge to
announce a major tax plan within weeks cooled some market nerves, reinvigorating dollar bulls. Wall
Street hit record highs for a second day on hopes of the business-friendly tax cuts. "The dollar puts a
little pressure on gold however the strength in the equity markets and the strength in the other precious
metals is lifting gold up. "It's really the intermarket relationship that's stabilizing gold right now." Silver
XAG= was up 1.5 percent at $17.91 an ounce, after tapping $17.99, the highest since Nov. 11.
Palladium XPD= rose 1.6 percent to $782, after rising to $786.40, the highest since Jan. 25. "Both silver
and palladium are up on the day as an improving China signals a better global economy and gives
support to the more industrial metals of the group, "Earlier in the session, however, gold prices were
lower. "The Trumpflation trade is back on the agenda, which is negative for gold. U.S. economic data
has also stoked talk that the Federal Reserve would press ahead with U.S. interest rate hikes sooner
rather than later. U.S. import prices rose more than expected in January, while initial jobless claims
dropped unexpectedly last week to the lowest in nearly 43 years. is highly sensitive to rising U.S.
interest rates, which increase the opportunity cost of holding non-yielding bullion while boosting the
dollar, in which it is priced. The major physical markets in Asia were mixed this week as Indian
jewelers stocked up for wedding season, while rising prices sidelined buyers elsewhere.
Gold prices tumbled on Friday, as the U.S. dollar remained broadly supported following recent
comments by U.S. President Donald Trump on tax reform and an upbeat jobless claims report added to
optimism over the strength of the U.S. economy. On the Comex division of the New York Mercantile
Exchange, gold futures for April delivery were down 1.12% at $ 1,223.00, the lowest since February 6.

The April contract ended Thursday’s session 0.22% lower at $ 1,236.80 an ounce.
Futures were likely to find support at $ 1,206.20, the low of February 3 and resistance at $ 1,243.50,
Thursday’s high. The dollar strengthened after U.S. President Donald Trump said on Thursday that he
would announce the most ambitious tax reform plan since the Reagan era in the next few weeks. During
a meeting with airline CEOs on Thursday, Trump promised a “phenomenal” tax plan, without giving
any specific details of the plan. The comments came after the U.S. Department of Labor said initial
jobless claims decreased by 12,000 to 234,000 in the week ending February 4. Analysts had expected
jobless claims to rise by 4,000. The U.S. dollar index, which measures the greenback’s strength against
a trade-weighted basket of six major currencies, was steady at 100.69, just off a two-week high of
100.75 hit overnight. Elsewhere in metals trading, silver futures for March delivery lost 1.01% to $
17.562 a troy ounce, while copper futures for March delivery gained 0.77% to $ 2.675 a pound.
ENERGY✍
Oil prices rose on Monday, but gains were minimal as investors gauged whether an increase in U.S.
drilling and record stockpiles would undermine efforts by producers to cut output and bring the market
into balance. Brent futures LCOc1 were up 1 cent at $ 55.82 a barrel at 0050 GMT, while U.S. West
Texas Intermediate crude CLc1 rose 3 cents to $ 53.43 a barrel. U.S. energy companies added oil rigs
for a fifth consecutive week, Baker Hughes said on Friday, extending a nine-month recovery with
producers encouraged by higher crude prices, which have traded mostly over $50 a barrel since late
November. The Organization of the Petroleum Exporting Countrie and other producers, including
Russia, agreed last year to cut output almost 1.8 million barrels per day during the first half of 2017.
Estimates indicate compliance with the cuts is at around 90 percent, while Reuters reported last week
that OPEC could extend the pact or apply deeper cuts from July if global crude inventories fail to drop
enough. But rising U.S. output helped boost crude and gasoline inventories to record highs last week,
amid faltering demand growth for the motor fuel. Hedge funds and other money managers raised their
net long U.S. crude futures and options positions in the week to Feb.14 to a new record high, data from
the U.S. Commodity Futures Trading Commission showed on Friday. The increase in long positions
leaves the market vulnerable to a downward correction, analysts have said. The U.S. market will be
closed on Monday for the Presidents Day holiday.
Oil futures added a few pennies on Friday, but posted their first weekly decline in five weeks as
concerns over rising production and swelling stockpiles in the U.S. offset efforts by major producers to
cut enough output to reduce a global glut. On the New York Mercantile Exchange, crude oil for delivery
in March inched up 4 cents, or less than 0.1%, to end at $53.86 a barrel by close of trade Friday. For the
week, New York-traded oil futures slumped 46 cents, or nearly 0.9%. snapping a four-week win streak.
Elsewhere, on the ICE Futures Exchange in London, Brent oil for April delivery tacked on 16 cents, or
about 0.3%, to settle at $56.70 a barrel by close of trade. London-traded Brent futures scored a loss of

89 cents, or around 1.6%, on the week, the second straight weekly decline.
Concerns that the ongoing rebound in U.S. shale production could derail efforts by other major
producers to rebalance global oil supply and demand pressured crude prices. Data from oilfield services
provider Baker Hughes on Friday revealed that the number of active U.S. rigs drilling for oil rose by six
last week, the fifth weekly increase in a row. That brought the total count to 597, the most since
November 2015.
Meanwhile, the U.S. Energy Information Administration said on Wednesday that crude supplies rose by
9.5 million barrels last week to an all-time high of 518.0 million barrels. Gasoline stocks rose 2.8
million barrels, pushing inventories of the fuel to a record at 259.0 million barrels. Futures have been
trading in a narrow range around the lower-to-mid-$ 50s over the past two months as sentiment in oil
markets has been torn between expectations of a rebound in U.S. shale production and hopes that
oversupply may be curbed by output cuts announced by major global producers. OPEC and non-OPEC
countries have made a strong start to lowering their oil output under the first such pact in more than a
decade. Latest data showed the group’s production in January declined by 890,000 barrels a day from
the previous month to 32.14 million barrels a day. The drop indicates a 90% compliance level so far by
producers who had agreed to curtail their output. January 1 marked the official start of the deal agreed
by OPEC and non-OPEC member countries such as Russia in November last year to reduce output by
almost 1.8 million barrels per day to 32.5 million for the next six months. OPEC could extend its oil
supply-reduction pact with non-members or even apply deeper cuts from July if global crude inventories
fail to drop to a targeted level, OPEC sources said on Thursday. Elsewhere on Nymex, gasoline futures
for March shed 0.8 cents, or about 0.5% to $1.516 on Friday, the lowest since February 8. It ended
down about 4.6% for the week. March heating oil added 0.7 cents, or 0.5%, to finish at $1.636 a gallon.
For the week, the fuel lost almost 1.8%. Natural gas futures for March delivery sank 2.0 cents, or almost
0.7%, to a three-month low of $ 2.834 per million British thermal units. It posted a weekly loss of
around 7%. In the week ahead, market participants will eye fresh weekly information on U.S. stockpiles
of crude and refined products on Wednesday and Thursday to gauge the strength of demand in the
world’s largest oil consumer. The reports come out one day later than usual due to Monday's President's
Day holiday.
Meanwhile, traders will also continue to pay close attention to comments from global oil producers for
further evidence that they are complying with their agreement to reduce output this year. Ahead of the
coming week, Investing.com has compiled a list of these and other significant events likely to affect the
markets.
Monday, February 20
Markets in the U.S. will remain closed for President’s Day.

Wednesday, February 22
The American Petroleum Institute, an industry group, is to publish its weekly report on U.S. oil
supplies.
Thursday, February 23
The U.S. Energy Information Administration is to release weekly data on oil and gasoline stockpiles.
The U.S. government is also to produce a weekly report on natural gas supplies in storage.
Friday, February 24
Baker Hughes will release weekly data on the U.S. oil rig count.
Oil prices ended largely steady on Friday but lower on the week, with U.S. crude notching its first
weekly decline in five weeks, as rising U.S. drilling and record stockpiles faced efforts by major
producers to cut output to reduce a global glut. U.S. energy companies added oil rigs for a fifth straight
week, Baker Hughes said, extending a nine-month recovery as drillers take advantage of crude prices
that have held mostly over $50 a barrel since OPEC agreed to cut supplies in late November. The
Organization of the Petroleum Exporting Countries and other producers, including Russia, agreed to cut
output almost 1.8 million barrels per day during the first half of 2017. Estimates suggest compliance by
OPEC is around 90 percent, and Reuters reported on Thursday that OPEC could extend the pact or even
apply deeper cuts from July if global crude inventories fail to drop to a targeted level. encouraging that
it may not be a six-month deal but one of the issues is if you look at OPEC and other members basically
reducing their supply and U.S. shale producers profiting from it, that's going to produce some turmoil.
"At some point, it's going to be difficult for that agreement to stay in place when member countries can
drill more and make more money." Brent futures LCOc1 settled 16 cents, or 0.3 percent, firmer at
$55.81 a barrel, while U.S. West Texas Intermediate crude CLc1 settled up 4 cents at $53.40 a barrel.
Book squaring in the WTI contract for March delivery ahead of its expiration on Tuesday weighed on
prices, traders said. The U.S. market will be closed on Monday for the Presidents Day holiday. Both
benchmarks ended the week lower - WTI with a 1 percent decline and Brent 2 percent weaker.
Oil prices, however, were holding within an average band of about $1.30 per barrel so far this year, one
of the most range-bound periods since the price slump began in mid-2014.
Oil was lower Friday, extending losses in what looked to be its first weekly decline in five weeks. U.S.

crude was down 27 cents, or 0.51%, at $53.09 at 8:18 ET, while Brent crude slipped 34 cents, or 0.61%,
to $55.31. Oil chalked up losses this week as the Energy Information Administration said Wednesday
that U.S. stockpiles of crude and gasoline hit record highs. Oil prices have been stuck in a narrow range
around the lower-to-mid-$50s over the past two months as investors weigh the impact of cuts in supply
from the historic OPEC/non-OPEC agreement against record stockpiles of crude and increased drilling
activity in the United States. On that last note, investors also looked ahead to the Baker Hughes U.S. rig
count data for the latest week.
The number of rigs operating in the U.S. in the prior week increased by 8 last week, the 14th gain in 15
weeks.
Oil prices edged up on Friday, lifted by a report that producer club OPEC could extend an output cut
aimed at reining in a global fuel supply overhang. Brent crude futures LCOc1 , the international
benchmark for oil prices, were trading at $ 55.73 per barrel at 0125 GMT, up 8 cents from their last
close. U.S. West Texas Intermediate crude futures CLc1 , were up 7 cents at $ 53.43 per barrel.
The Organization of the Petroleum Exporting Countries and other producers including Russia have
agreed to cut output by almost 1.8 million barrels per day during the first half of 2017, and estimates
suggest compliance by OPEC is around 90 percent. production cuts are aimed at curbing global
oversupply that has dogged markets since 2014. Yet despite action so far, inventories remain bloated
and supplies high, especially in the United States. To help rebalance the market, OPEC sources told
Reuters that the supply reduction pact could be extended or deepened if all major producers showed
"effective cooperation". said that until more clarity on a potential extension of production cuts was
achieved, oil prices would be capped. "Despite the headlines, the massive inventory glut in both oil and
gasoline continues to thwart any upward momentum. U.S. crude oil and gasoline inventories soared to
record highs last week as refineries cut output and gasoline demand softened, the Energy Information
Administration said on Wednesday. Crude inventories USOILC=ECI rose by 9.5 million barrels in the
week ended Feb. 10, nearly triple analysts' expectations, boosting commercial stocks to an all-time
record at 518 million barrels. Gasoline stocks USOILG=ECI rose 2.8 million barrels, compared with
analysts' expectations in a Reuters poll for a 752,000-barrel drop. That pushed inventories of the fuel to
a record 259 million barrels. The bloated stocks come as U.S. crude oil production C-OUT-T-EIA has
risen 6.5 percent since mid-2016 to 8.98 million bpd.
Oil prices rose on Thursday after OPEC sources said the group could extend its oil supply-reduction
pact with non-members and might even apply deeper cuts if global crude inventories failed to drop to a
targeted level. OPEC and other exporters including Russia agreed last year to cut output by 1.8 million
barrels per day to reduce a price-sapping glut. The deal took effect on Jan. 1 and lasts six months.
producers appear to be sticking to the deal so far but it is unclear how much impact the supply
reductions are having on world oil inventories that are close to record highs. The supply pact could be

extended by May if all major producers showed "effective cooperation", an OPEC source told. a good
chance and high odds that the group decides that they want to continue this process," Energy Aspects
analyst Richard Mallinson said. Benchmark Brent crude LCOc1 was up 30 cents at $ 56.05 a barrel by
1430 GMT. U.S. light crude CLc1 gained 30 cents to $ 53.41 a barrel. Global inventories are bloated
and supplies high, especially in the United States. U.S. crude and gasoline inventories soared to record
levels last week as refineries cut output and gasoline demand softened, the Energy Information
Administration said on Wednesday. Crude inventories USOILC=ECI jumped 9.5 million barrels in the
week to Feb. 10, nearly three times more than forecasts, boosting commercial stocks to a record 518
million barrels. Gasoline stocks USOILG=ECI rose by 2.8 million barrels to a record 259 million
barrels. U.S. crude production, meanwhile C-OUT-T-EIA , has risen 6.5 percent since mid-2016 to 8.98
million bpd. Analysts say the oil market is balanced between these twin pressures: OPEC cuts and rising
U.S. inventories and production. Brent and U.S. crude futures have traded within a $5 per barrel range
since the start of the year. "Prices have not seen this kind of stability for several years. "However, if
crude prices are to break out of their recent range in the next few weeks, the risk is to the downside."
Gavin Wendt, founding director and senior resource analyst at commodity research firm MineLife, said:
"The world oil market is very much in wait-and-see mode, which is why the price has remained in the
mid-$50s per barrel range since mid-December."
Oil prices held steady on Thursday, supported by ongoing supply cuts led by producer group OPEC,
although rising fuel inventories and crude production in the United States weighed on sentiment. Brent
crude futures LCOc1 were trading at $ 55.73 per barrel at 0209 GMT, down just 2 cents from their last
close. U.S. West Texas Intermediate crude futures CLc1 , were down 4 cents at $53.07 per barrel. The
Organization of the Petroleum Exporting Countries and other producers including Russia have agreed to
cut output by almost 1.8 million barrels per day during the first half of 2017, and estimates suggest
compliance by OPEC is around 90 percent. production cuts are aimed at reining in a global fuel supply
overhang that has dogged markets for over two years.
Yet despite action so far, inventories remain bloated and supplies high, especially in the United States.
U.S. crude oil and gasoline inventories soared to record highs last week as refineries cut output and
gasoline demand softened, the Energy Information Administration said on Wednesday. Crude
inventories USOILC=ECI rose 9.5 million barrels in the week ended Feb. 10, nearly three times more
than analysts' expectations, boosting commercial stocks to an all-time record at 518 million barrels.
Gasoline stocks USOILG=ECI rose 2.8 million barrels, compared with analysts' expectations in a
Reuters poll for a 752,000-barrel drop. That pushed inventories of the fuel to a record at 259 million
barrels. The bloated stocks come as U.S. crude oil production C-OUT-T-EIA has risen 6.5 percent since
mid-2016 to 8.98 million bpd. Because of the conflicting price drivers of OPEC's cuts and rising U.S.
inventories and production. "Brent oil looks neutral in a range of $55.38-$56.44 per barrel. Brent and
WTI crude futures have traded within a $5 per barrel price range since the start of the year.
Oil dipped on Thursday as rising fuel inventories and crude production in the United States dragged on

prices although ongoing supply cuts led by producer group OPEC prevented the market from slumping
further.
Brent crude futures LCOc1 were trading at $ 55.69 per barrel at 0751 GMT, down 6 cents from their
last close. U.S. West Texas Intermediate crude futures CLc1 dropped 10 cents to $ 53.01 per barrel. The
Organization of the Petroleum Exporting Countries and other producers including Russia have agreed to
cut output by almost 1.8 million barrels per day during the first half of 2017, and estimates suggest
compliance by OPEC is around 90 percent. Production cuts are aimed at reining in a global fuel supply
overhang that has dogged markets for over two years. Despite this, inventories remain bloated and
supplies high, especially in the United States. U.S. crude oil and gasoline inventories soared to record
highs last week as refineries cut output and gasoline demand softened, the Energy Information
Administration said on Wednesday. Crude inventories USOILC=ECI rose 9.5 million barrels in the
week ended Feb. 10, nearly three times more than analyst expectations, boosting commercial stocks to
an all-time record at 518 million barrels. Gasoline stocks USOILG=ECI rose 2.8 million barrels,
compared with analyst expectations in a Reuters poll for a 752,000-barrel drop. That pushed inventories
of the fuel to a record at 259 million barrels. The bloated stocks come as U.S. crude oil production C-
OUT-T-EIA has risen 6.5 percent since mid-2016 to 8.98 million bpd. Because of the conflicting price
drivers of OPEC's cuts and rising U.S. inventories and production, analysts said that prices were largely
moving sideways. Both Brent and WTI crude futures have traded within a $ 5 per barrel price range
since the start of the year. "There's no doubt that the world oil market is very much in wait-and-see
mode, which is why the price has remained in the mid-$ 50s per barrel range since mid-December. "The
biggest factor is what might happen with U.S. shale production. adding that rising shale output had the
potential to damage oil price stability.
Oil prices held steady on Thursday, supported by ongoing supply cuts led by producer group OPEC,
although rising fuel inventories and crude production in the United States weighed on sentiment. Brent
crude futures LCOc1 were trading at $ 55.73 per barrel at 0209 GMT, down just 2 cents from their last
close. U.S. West Texas Intermediate crude futures CLc1 , were down 4 cents at $ 53.07 per barrel. The
Organization of the Petroleum Exporting Countries and other producers including Russia have agreed to
cut output by almost 1.8 million barrels per day during the first half of 2017, and estimates suggest
compliance by OPEC is around 90 percent. production cuts are aimed at reining in a global fuel supply
overhang that has dogged markets for over two years.
Yet despite action so far, inventories remain bloated and supplies high, especially in the United States.
U.S. crude oil and gasoline inventories soared to record highs last week as refineries cut output and
gasoline demand softened, the Energy Information Administration said on Wednesday. Crude
inventories USOILC=ECI rose 9.5 million barrels in the week ended Feb. 10, nearly three times more
than analysts' expectations, boosting commercial stocks to an all-time record at 518 million barrels.
Gasoline stocks USOILG=ECI rose 2.8 million barrels, compared with analysts' expectations in a
Reuters poll for a 752,000-barrel drop. That pushed inventories of the fuel to a record at 259 million
barrels. The bloated stocks come as U.S. crude oil production C-OUT-T-EIA has risen 6.5 percent since
mid-2016 to 8.98 million bpd. Because of the conflicting price drivers of OPEC's cuts and rising U.S.
inventories and production, analysts said that prices were largely moving sideways. "Brent oil looks
neutral in a range of $ 55.38-$56.44 per barrel.
Oil prices fell slightly on Wednesday as record high U.S. crude and gasoline inventories fed concerns
about a glut, but trade was choppy and losses were limited by evidence that OPEC and other producing
countries were complying with agreed-upon supply cuts. U.S. crude stocks soared by 9.5 million barrels
last week, the U.S. Energy Information Administration said, nearly three times more than forecast. Late
Tuesday, a trade group also reported a larger-than-expected build.
U.S. crude inventories hit a peak at 518.12 million barrels, the EIA said. Gasoline stocks also touched a
record, rising 2.8 million barrels to 259.1 million barrels. crude LCOc1 futures fell 19 cents to $ 55.78 a
barrel while U.S. crude CLc1 futures dipped 11 cents to $ 53.09 a barrel. Prices had whipsawed after the
EIA data. Gasoline futures RBc1 were down 0.2 percent to $ 1.5439 a gallon by 1:24 p.m. EST after
falling by as much as 0.8 percent. "The U.S. witnessed yet another week of higher-than-expected stock
builds; nonetheless, the build was less than last week's, which helped prices recoup some of the earlier
losses. "A build in gasoline stock is in tandem with seasonal norms and further builds are expected in
the coming weeks as demand for the fuel remains low." Gasoline inventories have surged 10 percent
since the end of 2016, EIA data showed. Last week, stockpiles of the fuel swelled to a record at 259
million barrels. The dollar weakened, which also helped support greenback-denominated oil. To support
prices, the Organization of the Petroleum Exporting Countries and other producers, including Russia,
are cutting output by almost 1.8 million barrels per day in the first half of 2017. OPEC in January
delivered record compliance of over 90 percent with its output curbs, according to estimates from the
International Energy Agency and figures collected by OPEC's headquarters. OPEC's second-biggest
producer, "could prove problematic to group cohesion." Also, Russia and the other non-OPEC
producers have delivered smaller cutbacks. The oil minister of Oman, one of the participating non-
OPEC countries, said he expected compliance to improve. GRAPHIC: Oil prices vs U.S.-dollar.
U.S. crude stocks rose more than expected in the latest week, official data showed Wednesday. The EIA
said crude inventories rose by 9.527 mn barrels after a rise of 13.830 million barrels the previous week.
Crude inventories were forecast to rise by 3.513 million barrels. Gasoline stocks rose by 2.846 million
barrels after a fall of 869,000 barrels the previous week. Gasoline inventories were expected to fall by
752,000 barrels. U.S. crude was off 0.45% at $52.96 after data release.
Oil slipped further below $ 56 a barrel on Wednesday as an industry report showing a large rise in U.S.
crude inventories signalled ample supply, even as OPEC achieves record compliance with its supply-cut
accord. U.S. inventories rose by a larger-than-expected 9.9 million barrels last week, the American
Petroleum Institute trade group said on Tuesday, ahead of the Energy Information Administration's
official supply report. this figure be confirmed by the EIA later today, U.S. crude stocks will have risen
to a fresh record high. Brent crude LCOc1 was down 34 cents at $ 55.63 by 0949 GMT, half its level of

mid-2014, when a global glut started a collapse in prices. U.S. crude CLc1 fell 39 cents to $52.81. To
support prices, the Organization of the Petroleum Exporting Countries and other producers including
Russia are cutting output by almost 1.8 million barrels per day in the first half of 2017. Although OPEC
has made a strong start in complying with the cuts, rising U.S. stocks and a revival of U.S. oil output
have limited the price rise.
Analysts expect U.S. crude inventories to have risen by 3.5 million barrels, the sixth straight week of
gains, in the EIA report scheduled to be released at 1530 GMT. OPEC in January delivered record
compliance of over 90 percent with its output curbs, according to estimates from the International
Energy Agency and figures collected by OPEC's headquarters. Within OPEC, adherence is mixed. Top
exporter Saudi Arabia, keen to make the deal work, said it cut output by more than the amount called
for by the agreement. compliance rate of just 40 percent by Iraq, OPEC's second-biggest producer,
"could prove problematic to group cohesion" as others will have to go beyond their targets to meet the
overall goal. Russia and the other non-OPEC producers have so far delivered smaller cutbacks. The oil
minister of Oman, one of the participating non-OPEC countries, said he expected Russia's compliance
to be better in February and March. "Russia told us since the beginning the cut will take some time,"
Mohammad bin Hamad al-Rumhy told reporters in Kuwait.
Oil prices dipped on Wednesday over concerns that producer club OPEC would not be able to maintain
its high compliance so far with output cuts aimed at reining in a global fuel supply overhang. Brent
crude futures LCOc1 were trading at $ 55.80 per barrel at 0115 GMT, down 17 cents from their last
close. U.S. West Texas Intermediate crude futures CLc1 , were down 20 cents at $53 per barrel. The
Organization of the Petroleum Exporting Countries and other producers including Russia have agreed to
cut output by almost 1.8 million barrels per day (bpd) during the first half of 2017. BMI Research said
that, based on a calculated compliance of 92.8 percent by OPEC with its planned production cuts,
production was down 1.08 million bpd from the agreed upon reference levels. But it warned that a much
lower compliance rate of just 40 percent by Iraq, OPEC's second biggest producer, "could prove
problematic to group cohesion" as other members of the producer club will have to go beyond their
targets in order to meet the overall target of 1.2 million bpd in the first half of 2017. Some traders said
upcoming oil field maintenance across the Middle East might help the group achieve production cuts.
Yet overall, analysts said that oil markets remain well supplied despite the OPEC-led cuts, thanks in
part due to a 6.5 percent rise in U.S. oil production since mid-2016 to 8.98 million bpd. U.S. bank Citi
said that it was lowering its 2Q 2018 and 4Q 2018 oil price forecasts by $ 1 a barrel. "Our ICE Brent
forecasts for 2Q'18 will now be $63 per barrel and for 4Q'18 will be $58 per barrel to give a calendar
average of $60 per barrel. Outside physical oil markets, a rising correlation between crude futures and
the U.S.-dollar .DXY has caught market attention. Oil prices and the dollar are typically in a so-called
inverse correlation, since a strong greenback weighs on crude as it makes fuel purchases more
expensive, potentially crimping demand. A weaker dollar supports oil as it makes fuel imports cheaper.
Yet that inverse correlation has been upended, and the price link between Brent and the dollar is now at

its highest since 2005, Thomson Reuters Eikon data shows. This has come as oil was lifted by the
production cuts, while the dollar received support from rising interest rates. Should a strong dollar and
rising oil prices persist, traders say that would be a driver for higher inflation.
Oil prices pared gains after the settlement Tuesday, as evidence of surging U.S. crude oil stockpiles
underscored concerns that shale production might limit the effectiveness of an OPEC-led effort to cut
global output. Brent crude LCOc1 traded at $ 55.73 a barrel at 4:39 p.m. Eastern, off the settlement of $
55.97 a barrel, which was up 38 cents but well off the session high of $ 56.46 a barrel. U.S. light crude
CLc1 traded at $ 52.94 a barrel following the inventory report by a trade group, after settling up 27
cents at $ 53.20. After settlement, the American Petroleum Institute said U.S. crude inventories rose 9.9
million barrels in the week to Feb. 10, far exceeding analysts' expectations for an increase of 3.5 million
barrels. Gasoline and diesel stockpiles also rose, the API's weekly report said. U.S. government is
scheduled to release its weekly data on stockpiles Wednesday morning. On Monday, both benchmarks
fell 2 percent. Both are near the middle of $ 5-per-barrel trading ranges seen since early December. The
Organization of the Petroleum Exporting Countries and other exporters including Russia have agreed to
cut crude output by almost 1.8 million barrels per day during the first half of 2017. The market has
largely priced in these production cuts OPEC and other producers agreed to in November. "It would
take either a supply outage or serious cuts to move it. "The first month, obviously, OPEC is going to do
the best it can, but after that, let's see what the second and third month bring." Meanwhile, U.S. crude
output is up 6.5 percent since mid-2016 to 8.98 million bpd, its highest since April last year. On
Monday, government data showed U.S. shale oil production for March is expected to rise by the most in
five months to 4.87 million bpd. just appears to be caught in a range at the moment and mainly focused
on those supply considerations. Investors also wonder how long OPEC countries will stick to their
agreed production cuts. producers want the market to believe they will stick" to the cuts. But lessons
from the past have made the market deeply suspicious." Many analysts say oil producers must cut
production more quickly. "Based on OPEC's own numbers the message is loud and clear. "Improve on
compliance, cut production further and extend the deal for the second half of the year if you want to
avoid yet another year of global oil inventory builds."
Saudi Arabia could face a dilemma over the time frame for agreed output cuts. OPEC members agreed
to cut output by some 1.2 million barrels in the first half of this year. OPEC's monthly report Monday
showed the cartel's production fell by 890,000 barrels a day to 32.14 million. But the report also warned
that Non-OPEC output is expected to rise this year on an increase in U.S. drilling activity. The output
cut agreement marked a shift in Saudi policy away from increasing market share. But enhanced
technology has made North American shale producers more efficient at lower price levels. Saudi Arabia
Energy Minister Khalid Al-Falih expects the oil market to re-balance in the first half. He has said the
time frame for the agreed cuts would only be extended if necessary. The question is whether Saudi has
targeted a price for oil that adequately shores up its financial situation. But an extension of the time
frame could be counterproductive by ushering in even more shale production.
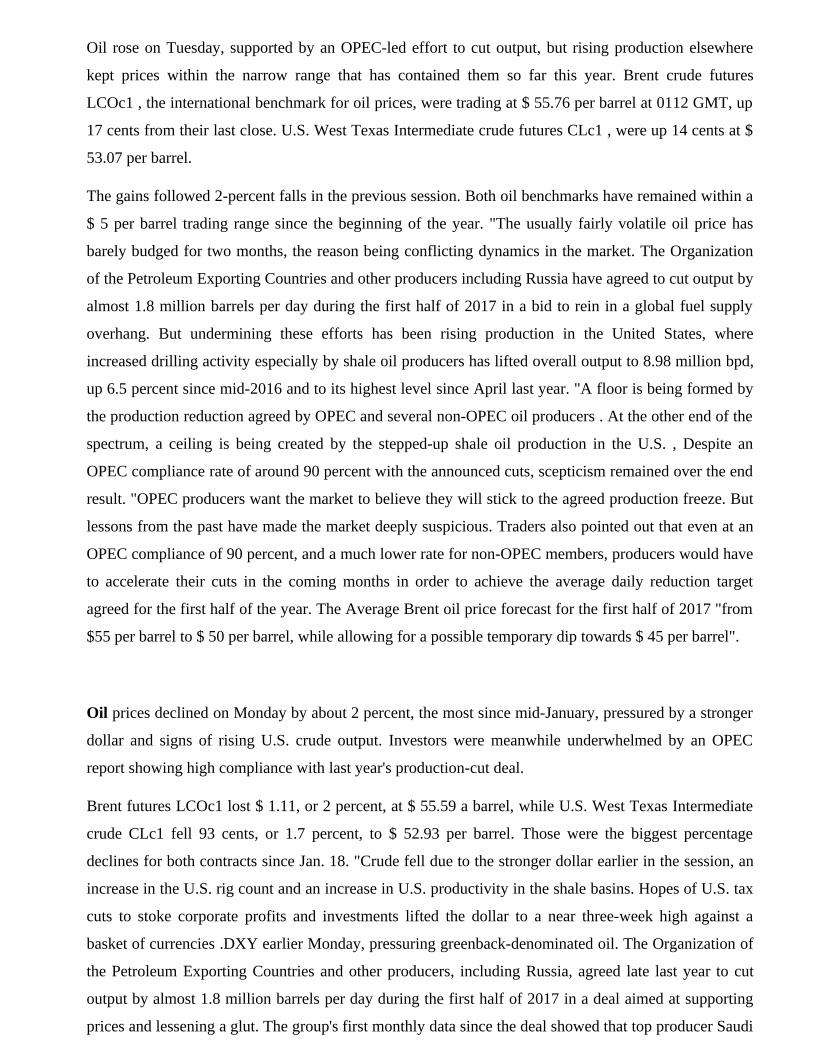
Oil rose on Tuesday, supported by an OPEC-led effort to cut output, but rising production elsewhere
kept prices within the narrow range that has contained them so far this year. Brent crude futures
LCOc1 , the international benchmark for oil prices, were trading at $ 55.76 per barrel at 0112 GMT, up
17 cents from their last close. U.S. West Texas Intermediate crude futures CLc1 , were up 14 cents at $
53.07 per barrel.
The gains followed 2-percent falls in the previous session. Both oil benchmarks have remained within a
$ 5 per barrel trading range since the beginning of the year. "The usually fairly volatile oil price has
barely budged for two months, the reason being conflicting dynamics in the market. The Organization
of the Petroleum Exporting Countries and other producers including Russia have agreed to cut output by
almost 1.8 million barrels per day during the first half of 2017 in a bid to rein in a global fuel supply
overhang. But undermining these efforts has been rising production in the United States, where
increased drilling activity especially by shale oil producers has lifted overall output to 8.98 million bpd,
up 6.5 percent since mid-2016 and to its highest level since April last year. "A floor is being formed by
the production reduction agreed by OPEC and several non-OPEC oil producers . At the other end of the
spectrum, a ceiling is being created by the stepped-up shale oil production in the U.S. , Despite an
OPEC compliance rate of around 90 percent with the announced cuts, scepticism remained over the end
result. "OPEC producers want the market to believe they will stick to the agreed production freeze. But
lessons from the past have made the market deeply suspicious. Traders also pointed out that even at an
OPEC compliance of 90 percent, and a much lower rate for non-OPEC members, producers would have
to accelerate their cuts in the coming months in order to achieve the average daily reduction target
agreed for the first half of the year. The Average Brent oil price forecast for the first half of 2017 "from
$55 per barrel to $ 50 per barrel, while allowing for a possible temporary dip towards $ 45 per barrel".
Oil prices declined on Monday by about 2 percent, the most since mid-January, pressured by a stronger
dollar and signs of rising U.S. crude output. Investors were meanwhile underwhelmed by an OPEC
report showing high compliance with last year's production-cut deal.
Brent futures LCOc1 lost $ 1.11, or 2 percent, at $ 55.59 a barrel, while U.S. West Texas Intermediate
crude CLc1 fell 93 cents, or 1.7 percent, to $ 52.93 per barrel. Those were the biggest percentage
declines for both contracts since Jan. 18. "Crude fell due to the stronger dollar earlier in the session, an
increase in the U.S. rig count and an increase in U.S. productivity in the shale basins. Hopes of U.S. tax
cuts to stoke corporate profits and investments lifted the dollar to a near three-week high against a
basket of currencies .DXY earlier Monday, pressuring greenback-denominated oil. The Organization of
the Petroleum Exporting Countries and other producers, including Russia, agreed late last year to cut
output by almost 1.8 million barrels per day during the first half of 2017 in a deal aimed at supporting
prices and lessening a glut. The group's first monthly data since the deal showed that top producer Saudi

Arabia made a large cut in its crude output in January, helping boost compliance with the group's
supply-reduction deal to a record high of 93 percent. Arabia told OPEC that it made an even bigger cut
than estimated by the secondary sources, reducing January output by more than 700,000 bpd to 9.748
million bpd - lower than called for under the OPEC deal. But high compliance had been expected and
the report failed to push oil prices into positive territory. "The good compliance rate of OPEC seems to
be priced in. The U.S. rig count from Friday is weighing, the numbers support the shale comeback story.
U.S. shale oil production for March is expected to rise by the most in five months, government data
showed on Monday, as energy companies boost drilling on the back of oil prices that are hovering over
$ 50 a barrel. the past month, U.S. oil drillers have added the most drilling rigs since 2012, bringing the
total to 591 rigs, the highest since October 2015, oil services company Baker Hughes said in a weekly
report. cut net long positions on Brent last week by 10,000 contracts, weekly ICE data showed,
highlighting investor concerns about rising U.S. production. The Organization Petroleum Exporting
Countries production cuts delivering higher oil prices, and reduced Brent forecasts for the first half of
this year to $ 50 from $55 a barrel.
Oil was lower Monday as OPEC's monthly report indicated a high compliance level with the cartel's
agreed output cuts in January. Brent crude was off 47 cents, or 0.83%, at $ 56.23 at 08:30 ET. U.S.
crude shed 38 cents, or 0.71%, to $ 53.48. OPEC cited secondary sources as estimating a cut of 890,000
barrels in January to 32.14 million barrels a day. OPEC began implementing cuts of 1.16 million barrels
per day at the start of this year for a period of six months. The International Energy Agency last week
estimated a record compliance level with the cuts in January by OPEC. Non-OPEC members led by
Russia have also agreed to reduce production by 558,000 barrels a day. Baker Hughes U.S. rig count
figures Friday showed an increase of 8 to 591. That was the highest level since November 2015. OPEC
estimated higher non-OPEC output this year on increased U.S. drilling activity.
OPEC Monday estimated the cartel's output fell an estimated 890,000 barrels in January to 32.14 mb/d.
OPEC began implementing cuts of 1.2 mb/d at the start of this year for a period of six months. In its
monthly report, OPEC indicated all members cut output except Nigeria and Libya which were exempt
from the accord. The IEA last week estimated OPEC compliance with the agreed cuts in January of over
90%. Citing secondary sources, OPEC said Saudi Arabia cut its output by 496,000 b/d from December
to 9.946 mb/d, more than agreed. Non-OPEC producers led by Russia have agreed to cut by 558,000
b/day. World supply in January fell by 1.29 mb/day, according to OPEC's report. OPEC forecast global
demand to increase by 1.2 mb/d in 2017 to 95.81 mb/d. Non-OPEC output is expected to increase this
year due to higher U.S. drilling activity.
Oil prices dipped on Monday on signs that global fuel markets remained bloated despite OPEC-led
crude production cuts that have been more successful than most initially expected. Brent crude futures
LCOc1 were trading at $56.55 per barrel at 0035 GMT, down 15 cents from their previous close. West
Texas Intermediate crude futures CLc1 were down 12 cents at $ 53.74 a barrel. The Organization of the
Petroleum Exporting Countries and other producers including Russia have agreed to cut output by

almost 1.8 million barrels per day during the first half of 2017 in a bid to rein in a global fuel supply
overhang. There was widespread scepticism that all producers would actually make the promised cuts,
but compliance with the announced reductions is now estimated to be around 90 percent. will be keenly
awaiting the release today of OPEC's monthly report. If production cuts are coming through as
suggested, we should see oil prices push higher. While traders said that crude was well supported in the
lower to mid- $ 50s per barrel due to the curbs, they pointed to a host of reasons that were preventing
prices from rising further unless production is cut deeper or for a longer period. In the United States,
rising drilling activity is pushing up production and undermining OPEC's efforts to reduce output.
Drillers added eight oil rigs in the week to Feb. 10, bringing the total U.S. count to 591, the most since
October 2015. During the same week last year, when prices were around $ 30 per barrel, there were just
439 active oil rigs. Russia, which is participating in the cuts, there are signs that output may be falling
but that exports remain high, as its producers shield their core export markets at the cost of lower
domestic supplies or by cutting into inventories. these trends, analysts say that OPEC might have to
extend its cuts for a longer period than the currently planned first half of 2017. since global oil demand
is expected to rise be between 1.3 million bpd and 1.5 million bpd in 2017, OPEC's conundrum is that
the longer and deeper it cuts, the more it cedes market share to competitors, as seen in the two world's
biggest oil consuming markets. In the United States, OPEC is facing the rising flood of shale driven
production. In China, OPEC's de-facto leader Saudi Arabia has already been overtaken by Russia as the
biggest oil supplier.
BASE METAL’S OUTLOOK :
BASE METAL GUIDE -
Trading Ideas:
Nickel trading range for the day is 720.6-749.8.
Nickel prices recovered from lows on mounting concerns about supplies after the suspension of
mines in top ore producer the Philippines.
The Philippines this week ordered the cancellation of 75 mineral production-sharing agreements as
developing them would threaten water supply.
Stocks of nickel in LME-approved warehouses stand at around 380,000 tonnes, while those in
SHFE-warehouses total’s at 89,000 tonnes.
ZINC

Zinc trading range for the day is 183.7-193.7.
Zinc prices ended with losses as increase in availability dampened recent price moves higher.
The global zinc market was balanced in December after a deficit of 45,400 tons in November, the
ILZSG said.
Korea Zinc said it plans to cut its refined zinc production by 7.7% to 599,937 tons this year, citing
tightening supply.
COPPER
Copper trading range for the day is 393.5-405.9.
Copper dropped as prices pulled back below 6000 level on LME as talks renewed between striking
workers and management at Chile's Escondida copper mine.
Indonesia's ministry said it has issued a recommendation that is expected to allow the local unit of
Freeport McMoRan Inc to resume copper concentrate exports.
The announcement comes after a more than one-month stoppage which push global copper prices to
21-month highs this week.
BASE METAL
✍ COPPER
Copper was down 0.39% at $2.708 a pound and ended the week down 2.55% amid profit taking, but
prices looked set to remain supported amid concerns over supply disruptions. A strike at BHP Billiton
Escondida in Chile, the world's largest copper mine, has boosted sentiment as has an output halt at
Freeport-McMoRan's giant Grasberg mine in Indonesia.
Even as strikes cripple output at the world's two biggest copper mines, Asia's copper industry is pretty
relaxed, sitting atop metal stockpiles that have grown by nearly two-thirds since the end of January.
Copper inventories tied to China's Shanghai Futures Exchange have surged 61 per cent since the week of
Jan. 20 to 277,659 tonnes, the most since May 2016, the latest data shows. Stockpiles held in bonded
warehouses in China have edged above 500,000 tonnes, from around 450,000 tonnes in November,
according to consultants CRU Group.
ZINC ✍
Zinc prices drifted lower by 0.37 per cent to Rs 176.35 per kg in futures trade as traders engaged in
trimming their positions, taking negative cues from spot market on fall in demand from consuming

industries. At the Multi Commodity Exchange, zinc for delivery in January declined by 65 paise, or 0.37
per cent, to Rs 176.35 per kg in a business turnover of 477 lots. In a similar fashion, the metal for delivery
in February shed 40 paise, or 0.23 per cent, to Rs 176.85 per kg in 2 lots. Market analysts said offloading
of positions by participants owing to slackened demand from consuming industries in the spot market,
kept zinc prices down at futures trade.
NICKEL ✍
Nickel prices were up by 0.56 per cent to Rs 720.50 per kg in futures trade today on pick up in demand
from consuming industries in the spot market amid a firm global trend. Nickel for delivery in March
moved up by Rs 4, or 0.56 per cent, to Rs 720.50 per kg in business turnover of 38 lots at the Multi
Commodity Exchange. Also, the metal for delivery in current month gained Rs 3.90, or 0.55 per cent to
Rs 714.70 per kg in 853 lots. Market analysts said besides pick-up in demand from consuming industries,
particularly alloy-makers, a firm trend in base metals in the global market, led to rise in nickel prices at
futures trade here.
LEAD ✍
Lead futures rose by 1.21 per cent to Rs 163.25 per kg today on the back of strong demand in spot market
and a firming trend overseas. At Multi Commodity Exchange, lead for delivery this month traded higher
by Rs 1.95, or 1.21 per cent, at Rs 163.25 per kg with a turnover of 407 lots. Metal for delivery in far-
month March also gained Rs 1.75, or 1.09 per cent to Rs 162.95 per kg in 11 lots. Marketmen said pick-up
in domestic demand, particularly from battery-makers, and a firming trend in base metal pack at the
London Metal Exchange (LME), supported the upside in lead futures here.
COPPER ✍
Copper futures rose 1.13 per cent today to Rs 412.75 per kg as participants enlarged positions, taking
positive cues from overseas markets and a pickup in spot demand. At the Multi Commodity Exchange,
copper for delivery in current month was trading higher by Rs 4.60, or 1.13 per cent, to Rs 412.75 per kg,
with a turnover of 1,541 lots. Similarly, the metal for delivery in far-month April contract was up by Rs
4.50, or 1.09 per cent, at Rs 416.75 per kg, with a trade volume of 57 lots. Market analysts attributed the
rise in copper futures trade to a firming trend in metal at the London Metal Exchange , extending Friday's
jump that was the largest since 2013. Globally, copper for delivery in three-month rose 1.1 per cent at the
LME.
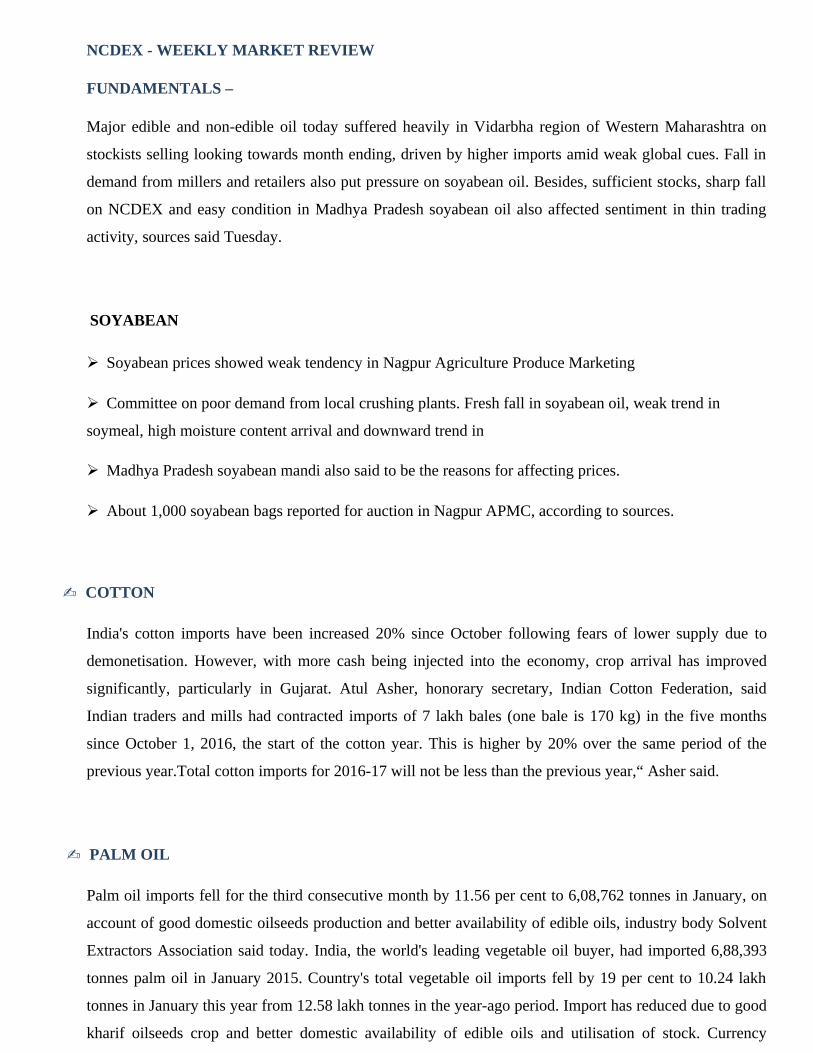
NCDEX - WEEKLY MARKET REVIEW
FUNDAMENTALS –
Major edible and non-edible oil today suffered heavily in Vidarbha region of Western Maharashtra on
stockists selling looking towards month ending, driven by higher imports amid weak global cues. Fall in
demand from millers and retailers also put pressure on soyabean oil. Besides, sufficient stocks, sharp fall
on NCDEX and easy condition in Madhya Pradesh soyabean oil also affected sentiment in thin trading
activity, sources said Tuesday.
SOYABEAN
Soyabean prices showed weak tendency in Nagpur Agriculture Produce Marketing
Committee on poor demand from local crushing plants. Fresh fall in soyabean oil, weak trend in
soymeal, high moisture content arrival and downward trend in
Madhya Pradesh soyabean mandi also said to be the reasons for affecting prices.
About 1,000 soyabean bags reported for auction in Nagpur APMC, according to sources.
COTTON ✍
India's cotton imports have been increased 20% since October following fears of lower supply due to
demonetisation. However, with more cash being injected into the economy, crop arrival has improved
significantly, particularly in Gujarat. Atul Asher, honorary secretary, Indian Cotton Federation, said
Indian traders and mills had contracted imports of 7 lakh bales (one bale is 170 kg) in the five months
since October 1, 2016, the start of the cotton year. This is higher by 20% over the same period of the
previous year.Total cotton imports for 2016-17 will not be less than the previous year,“ Asher said.
PALM OIL ✍
Palm oil imports fell for the third consecutive month by 11.56 per cent to 6,08,762 tonnes in January, on
account of good domestic oilseeds production and better availability of edible oils, industry body Solvent
Extractors Association said today. India, the world's leading vegetable oil buyer, had imported 6,88,393
tonnes palm oil in January 2015. Country's total vegetable oil imports fell by 19 per cent to 10.24 lakh
tonnes in January this year from 12.58 lakh tonnes in the year-ago period. Import has reduced due to good
kharif oilseeds crop and better domestic availability of edible oils and utilisation of stock. Currency

crunch due to demonetization has slowed down the purchases by end consumers also affected the demand
and import to some extent," SEA said in a statement.
Australian grain exports likely surged to an all-time monthly high of more than 4 million tonnes last
month, smashing the previous record by a third on strong demand from Saudi Arabia, China and India and
lower prices amid a bumper crop. Exports hit 4.0-4.3 million tonnes in January compared with 3 million
tonnes sold in first month of 2012, according to estimates from grain traders and analysts surveyed by
Reuters. The estimated jump comes as Australia churns out more wheat and barley than ever before on
near-perfect growing conditions. On the back of a domestic output shortfall, India's wheat imports largest
have jumped to their highest in a decade, created additional demand for Australian crops. Meanwhile
Saudi Arabia and China are snapping up products such as barley and canola, traders said.
Robusta coffee eased on Friday as a firm dollar pressured prices and Brazil underwhelmed with modest
plans for imports, while arabica fell on a slowdown in speculator buying.
COFFEE
May robusta coffee LRCc2 eased $15, or 0.69 percent, to$2,164 per tonne by 1254 GMT, after
gaining 1.4 percent in the previous session.
The market was pressured by a firm dollar and news that Brazil would import beans from Vietnam,
but would allow just 1 million 60-kg bags to be imported under a quota that would run until the end of
May. Dealers remained sceptical, saying the details were still "murky" and the quota would have limited
impact on the global coffee market, as it seems mostly designed for the solubles industry.
"One million bags of arabica with a tariff - I don't think that was the statement the market was
looking for," one said.
May arabica coffee KCc2 was also lower, down 1.00 cent, or 0.67 percent, at $1.474 per lb,
pressured by less activity from speculators rolling positions forward.
COCOA
New York May cocoa CCc2 fell $7, or 0.34 percent, to$2,035 per tonne, after gaining 7.2 percent
over the course of the last two sessions.
The rally was driven by short-covering after prices hit 8-1/2 year lows on selling related to a wave of
defaults in top grower Ivory Coast.
Dealers said this was now running out of steam, with the market beginning to consolidate from this
week's sharp swings.

We did seem to lose some momentum and we have pared some gains and come back a bit," said one
dealer. "I think we're in the early stages of some consolidation-based action."
May London cocoa LCCc2 also fell 3 pounds, or 0.18 percent, at 1,650 pounds per tonne, after
gaining 2.4 percent in the previous session.
SUGAR
Raw sugar eased further, with the May contract SBc2 down 0.11 cent, or 0.54 percent, at 20.25 cents
per lb.
May white sugar LSUc1 was $3.20, or 0.58 percent, lower at $548.50 per tonne.
The market remained focused on India, which is widely expected to start importing white sugar,
although a decision is not expected until after the results of state elections in the country next month.
SOYBEAN ✍
Indian soybean futures fell to a more than 2-year low on Friday on low demand and high domestic supply.
The most-actively traded March soybean futures NSBH7 fell 1.5 percent to 2956 rupees per 100 kg on the
National Commodity & Derivatives Exchange Ltd. March soyoil futures NSOH7 were down 0.9 percent
at 664.70 rupees per 10 kg as of 1302 GMT due to weak overseas sentiment and low demand. March
soybean oil contract on the Chicago Board of Trade fell 1.4 percent, while May soybean oil contract on
the Dalian Commodity Exchange DBYcv1 was down 0.9 percent. Malaysian palm oil futures fell to their
lowest in nearly three months on Thursday. April rapeseed contract NRSJ7 closed 0.1 percent lower at
3,788 rupees per 100 kg, while the March corn futures NMZFH7 dropped 0.5 percent to 1,422 rupees per
100 kg.
SOYABEAN OIL ✍
The slide in sunflower refined and linseed oil prices continued unabated in Vidarbha region of Western
Maharashtra for third day today on persistent selling by stockists amid good supply from producing
regions and weak trends in producing region. Trading activity in major edible oils reported thin as no
trader was in mood for any commitment because of fresh fall in international edible oils and easy
condition on NCDEX in soyabean oil, according to sources.
COCOA✍
Cocoa futures on ICE rallied on Thursday, extending the prior session's bounce up from multi-year lows
and oversold territory as the markets corrected higher, while robusta coffee rose as Brazil appeared to
move closer to allowing imports.
Sugar prices fell.
New York May cocoa CCc2 settled up $55, or 2.8 percent, at $2,042 per tonne, extending gains after
the prior session's 4.3 percent surge that lifted prices above the lowest in more than eight years.
The market was still viewed as bearish due to selling related to a wave of defaults in top producer
Ivory Coast and expectations for a global surplus. Dealers said the rise continued to be driven by short-
covering, although the upside was limited due to ample supplies.
The forecast is still very good, the weather is very favorable. And the industry is still well-covered so
they're not going to chase the market up," one dealer said.
May London cocoa LCCc2 settled up 39 pounds, or 2.4 percent, at 1,653 pounds per tonne.
"Our view is that the export defaults have the potential to weigh on cocoa farm income in Cote
d'Ivoire through lower farmgate prices for the mid crop and/or future seasons. This will provide lower
incentives for farmers to increase output," said Alexandre Andrey, commodities analyst for BMI
Research, pointing to greater risks for lower production in the next few years.
COFFEE
May robusta coffee futures LRCc2 settled up $31, or 1.4 percent, at $2,179 per tonne.
Dealers said the market was supported by positive chart-based buy signals after the market bounced
up from a six-week low on Wednesday.
The market has been monitoring the possibility that Brazil could import robusta after a technical
group linked to its Foreign Trade Chamber committee approved it, though approval from an executive
management committee is still required. If ratified next week, it will be the first time Brazil has
imported robusta in decades, although dealers said the market remains cautious ahead of a final
decision.
May arabica coffee KCc2 settled up 1.45 cent, or 1 percent, at $1.484 per lb, with dealers noting
earlier strength in Brazil's currency BRL= .

SUGAR
Raw sugar eased but remained in its recent trading range.
May raw sugar futures SBc2 settled down 0.13 cent, or 0.6 percent, at 20.3 cents per lb.
May white sugar LSUc1 settled down $1.80, or 0.3 percent, at $551.70 per tonne.
GUAR GUM ✍
US President Donald Trump’s move to encourage oil drilling in the US has given a boost to the Indian
guar gum industry, which has been languishing for two years. Price of guar gum has moved up 8% since
November and industry executives feel exports will rise 25% to 3.25 lakh tonnes this fiscal. “Revival of
oil drilling activity in North America has resulted in exports moving up. Also, Opec’s decision to cut
crude oil production has added momentum to guar gum exports from India,” Rajesh Kedia, director, Jai
Bharat Gum & Chemicals told ET. Guar gum price has risen to Rs 67 per kg from Rs 62 per kg in early
November. Last year, guar production fell as farmers shifted to other crops like pulses for better returns.
SUGAR✍
The government may not be comfortable with sugar prices hovering around Rs 40/kg, but the industry is
hell-bent on seeing that there are no imports of the sweetener. Imports would be disastrous for the industry
and farmers, they said. Even as traders and refiners are mounting pressure on the government to import
sugar and the government is trying to assess the likely fall in production, sugar millers say they are afraid
that imports would hit the industry and farmers. The Indian Sugar Mills Association, which represents
private sugar millers, has already stated that the country will have sufficient sugar stocks to take care of its
domestic needs in 2016-17.
PALM OIL✍
Palm oil imports fell for the third consecutive month by 11.56 per cent to 6,08,762 tonnes in January, on
account of good domestic oilseeds production and better availability of edible oils, industry body Solvent
Extractors Association said today. India, the world's leading vegetable oil buyer, had imported 6,88,393
tonnes palm oil in January 2015. Country's total vegetable oil imports fell by 19 per cent to 10.24 lakh
tonnes in January this year from 12.58 lakh tonnes in the year-ago period. Import has reduced due to good
kharif oilseeds crop and better domestic availability of edible oils and utilisation of stock. Currency
crunch due to demonetization has slowed down the purchases by end consumers also affected the demand
and import to some extent," SEA said in a statement.

SUGAR ✍
The food ministry has written to the finance ministry to continue the sugar subsidy of Rs 4,500 crore
under the public distribution system , which was scrapped in Union Budget 2017-18. We have written a
letter to the finance ministry and waiting for the response. We are hopeful that the funds will be given in
the supplementary grant,“ said a senior government official.
COTTON ✍
India's cotton imports have been increased 20% since October following fears of lower supply due to
demonetisation. However, with more cash being injected into the economy, crop arrival has improved
significantly, particularly in Gujarat. Atul Asher, honorary secretary, Indian Cotton Federation, said
Indian traders and mills had contracted imports of 7 lakh bales (one bale is 170 kg) in the five months
since October 1, 2016, the start of the cotton year. This is higher by 20% over the same period of the
previous year.Total cotton imports for 2016-17 will not be less than the previous year,“ Asher said.
LEGAL DISCLAIMER
This Document has been prepared by Ways2Capital (A Division of High Brow Market Research
Investment Advisor Pvt Ltd). The information, analysis and estimates contained herein are based on
Ways2Capital Equity/Commodities Research assessment and have been obtained from sources believed
to be reliable. This document is meant for the use of the intended recipient only. This document, at best,
represents Ways2Capital Equity/Commodities Research opinion and is meant for general information
only. Ways2Capital Equity/Commodities Research, its directors, officers or employees shall not in any
way to be responsible for the contents stated herein. Ways2Capital Equity/Commodities Research
expressly disclaims any and all liabilities that may arise from information, errors or omissions in this
connection. This document is not to be considered as an offer to sell or a solicitation to buy any
securities or commodities.
All information, levels & recommendations provided above are given on the basis of technical &
fundamental research done by the panel of expert of Ways2Capital but we do not accept any liability for
errors of opinion. People surfing through the website have right to opt the product services of their own
choices.
Any investment in commodity market bears risk, company will not be liable for any loss done on these
recommendations. These levels do not necessarily indicate future price moment. Company holds the right
to alter the information without any further notice. Any browsing through website means acceptance of
disclaimer.
DISCLOSURE
High Brow Market Research Investment Advisor Pvt. Ltd. or its associates does not do business with
companies covered in research report nor is associated in any manner with any issuer of products/
securities, this ensures that there is no actual or potential conflicts of interest. To ensure compliance with

the regulatory body, we have resolved that the company and all its representatives will not make any
trades in the market.
Clients are advised to consider information provided in the report as opinion only & make investment
decision of their own. Clients are also advised to read & understand terms & conditions of services
published on website. No litigations have been filed against the company since the incorporation of the
company.
Disclosure Appendix:
The reports are prepared by analysts who are employed by High Brow Market Research Investment
Advisor Pvt. Ltd. All the views expressed in this report herein accurately reflects personal views about the
subject company or companies & their securities and no part of compensation was, is or will be directly or
indirectly related to the specific recommendations or views contained in this research report.
Disclosure in terms of Conflict of Interest:
(a) High Brow Market Research Pvt. Ltd. or his associate or his relative has no financial interest in the
subject company and the nature of such financial interest;
(b) High Brow Market Research Pvt. Ltd. or its associates or relatives, have no actual/beneficial
ownership of one percent or more in the securities of the subject company,
(c) High Brow Market Research Pvt. Ltd. or its associate has no other material conflict of interest at the
time of publication of the research report or at the time of public appearance;
Disclosure in terms of Compensation:
High Brow Market Research Investment Advisor Pvt. Ltd. policy prohibits its analysts, professionals
reporting to analysts from owning securities of any company in the analyst's area of coverage.
Analyst compensation: Analysts are salary based permanent employees of High Brow Market Research
Pvt. Ltd.
Disclosure in terms of Public Appearance:
(a) High Brow Market Research Pvt. Ltd. or its associates have not received any compensation from the
subject company in the past twelve months;
(b) The subject company is not now or never a client during twelve months preceding the date of
distribution of the research report.
(c) High Brow Market Research Pvt. Ltd. or its associates has never served as an officer, director or
employee of the subject company;
(d) High Brow Market Research Pvt. Ltd. has never been engaged in market making activity for the
subject company.