commodity research report 13 february 2017 ways2capital
TRANSCRIPT


E
BULLION METALS OUTLOOK -
GOLD - Gold prices traded lower on last week on the account of profit booking at higher levels while
strengthening dollar index will further lower gold prices in the near term. The Gold is on an upward
trajectory as investors look for a safe haven in an increasingly uncertain world. Despite the strength of
the dollar. Gold typically rises when there is fear and uncertainty in stock markets. But the stock market
has not been following its typical relationship to gold by selling off. Since Trump’s presidential win in
early November. We have had a bit of a triple-top development in gold over the last three days, just
below 29525-29680 – that is the level that’s going to offer some resistance. “We still think that the gold
market is targeting 30900-31000 level to the upside so long as we stay above 28890-29050 support.”
The precious Metal is Expected to trade in positive note in this week the crucial levels for Gold is 29580
is up side and 27800 is Down side
GOLD CHART-
Chart Details - The Bollinger Bands show price giving support from the middle band a good test and
I expect price to eventually move back up to the upper band and push even higher into that band to set
up the final rally high. We have been expecting the 5 point broadening top to morph into a more bearish
7 point top and I believe we now have the point 6 low in place at 29700-29880. It is possible for one last
marginal low although I personally favour a higher low to form. Let’s see. The MCX Gold it is Expected
to touch the level of 30900 in next week Trading Session.
Monday, 13 February 2017
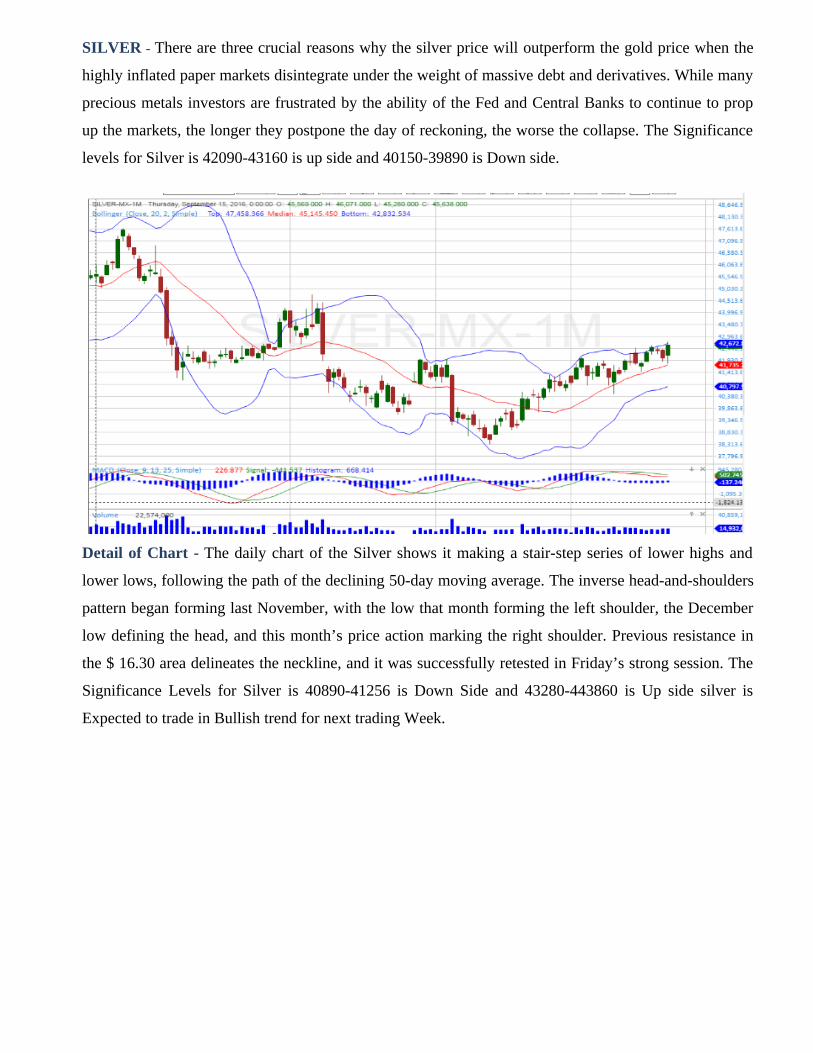
SILVER - There are three crucial reasons why the silver price will outperform the gold price when the
highly inflated paper markets disintegrate under the weight of massive debt and derivatives. While many
precious metals investors are frustrated by the ability of the Fed and Central Banks to continue to prop
up the markets, the longer they postpone the day of reckoning, the worse the collapse. The Significance
levels for Silver is 42090-43160 is up side and 40150-39890 is Down side.
Detail of Chart - The daily chart of the Silver shows it making a stair-step series of lower highs and
lower lows, following the path of the declining 50-day moving average. The inverse head-and-shoulders
pattern began forming last November, with the low that month forming the left shoulder, the December
low defining the head, and this month’s price action marking the right shoulder. Previous resistance in
the $ 16.30 area delineates the neckline, and it was successfully retested in Friday’s strong session. The
Significance Levels for Silver is 40890-41256 is Down Side and 43280-443860 is Up side silver is
Expected to trade in Bullish trend for next trading Week.

MCX DAILY LEVELS ✍
DAILY EXPIRY DATE R4 R3 R2 R1 PP S1 S2 S3 S4
ALUMINIUM 30-DEC-2016 129 127 125 125 123 123 121 119 117
COPPER 28-FEB-2016 456 438 420 414 402 396 384 366 348
CRUDE OIL 19-OCT-2016 3827 3748 3669 3639 3590 3560 3511 3432 3353
GOLD 03-FEB-2016 30077 29733 29389 29230 29045 28886 28701 28357 28013
LEAD 30-DEC-2016 174 169 164 163 159 158 154 149 144
NATURAL GAS 27-DEC-2015 222 216 210 207 204 201 198 192 186
NICKEL 30-DEC-2016 767 746 725 718 704 697 683 662 641
SILVER 03-MARCH-2016 45204 44261 43318 42958 42375 42015 41432 40489 39546
ZINC 30-DEC-2016 215 208 201 198 194 191 187 180 173
MCX WEEKLY LEVELS ✍
DAILY EXPIRY DATE R4 R3 R2 R1 PP S1 S2 S3 S4
ALUMINIUM 30-DEC-2016 132 129 126 125 123 122 120 117 114
COPPER 28-FEB-2016 461 441 421 415 401 395 381 361 341
CRUDE OIL 19-OCT-2016 4120 3936 3752 3681 3568 3497 3384 3200 3016
GOLD 03-FEB-2016 30638 30149 29660 29416 29171 28927 28682 28193 27704
LEAD 30-DEC-2016 180 173 166 163 159 156 152 145 138
NATURAL GAS 27-DEC-2015 242 230 218 211 206 199 194 182 170
NICKEL 30-DEC-2016 783 756 729 720 702 693 675 648 621
SILVER 03-MARCH-2016 45204 44261 43318 42958 42375 42015 41432 40489 39546
ZINC 30-DEC-2016 228 216 204 200 192 188 180 168 156

FOREX DAILY LEVELS ✍
DAILY EXPIRY DATE R4 R3 R2 R1 PP S1 S2 S3 S4
USDINR 26-OCT 2016 70.95 69.85 68.64 67.67 66.42 65.49 66.12 65.88 65.06
EURINR 26-OCT 2016 78.26 76.27 74.52 72.35 71.04 70.98 69.71 68.05 67.79
GBPINR 26-OCT 2016 90.25 88.24 86.38 84.02 80.08 79.01 77.98 75.58 73.18
JPYINR 26-OCT 2016 63.28 60.74 59.34 57.78 56.86 56.04 55.69 55.06 54.88
FOREX WEEKLY LEVELS✍
WEEKLY EXPIRY DATE R4 R3 R2 R1 PP S1 S2 S3 S4
USDINR 26-OCT2016 73.98 72.46 68.44 68.12 66.52 66.04 65.15 64.38 63.17
EURINR 26-OCT2016 79.48 77.51 75.82 73.95 70.68 69.25 68.01 67.64 65.59
GBPINR 26-OCT2016 98.56 96.74 92.34 88.82 82.26 80.08 78.28 76.28 74.88
JPYINR 26-OCT2016 69.84 67.98 65.17 63.28 59.44 57.34 55.75 53.88 51.03

NCDEX DAILY LEVELS✍
DAILY EXPIRY
DATE
R4 R3 R2 R1 PP S1 S2 S3 S4
SYOREFIDR 20-JAN-2016 735 725 715 709 705 699 695 685 675
SYBEANIDR 20-JAN-2016 3102 3069 3036 3016 3003 2983 2970 2937 2904
RMSEED 20-JAN-2016 3927 3893 3859 3838 3825 3804 3791 3757 3723
JEERAUNJHA 20-JAN-2016 17938 17668 17398 17247 17128 16977 16858 16588 16318
GUARSEED10 20-JAN-2016 3362 3319 3276 3251 3233 3208 3190 3147 3104
TMC 20-APR-2016 7155 7045 6935 6869 6828 6759 6715 6605 6495
NCDEX WEEKLY LEVELS✍
WEEKLY EXPIRY
DATE
R4 R3 R2 R1 PP S1 S2 S3 S4
SYOREFIDR 20-JAN-2016 758 741 724 713 707 696 690 673 656
SYBEANIDR 20-JAN-2016 3216 3194 3082 3038 3015 2971 2948 2881 2814
RMSEED 20-JAN-2016 3980 3929 3878 3848 3827 3797 3776 3725 3674
JEERAUNJHA 20-JAN-2016 19338 18648 17958 17527 17268 16837 16578 15888 15198
GUARSEED10 20-JAN-2016 3558 3456 3354 3291 3252 3189 3150 3048 2946
TMC 20-APR-2016 7481 7261 7041 6923 6821 6703 6601 6381 6161

MCX - WEEKLY NEWS LETTERS
INTERNATIONAL UPDATES ( BULLION & ENERGY )✍
Gold prices steadied on Friday, but remained below the week’s three-month highs as the dollar pared
back some of the gains made in the wake of U.S. President Donald Trump's promise of a major tax
announcement. Gold for February delivery settled down 0.15% at $ 1,235.0 on the Comex division of the
New York Mercantile Exchange. The precious metal was still 1.3% higher for the week. On Wednesday,
gold reached its highest level since mid-November at $ 1,243.9. The U.S. dollar index, which measures
the greenback’s strength against a trade-weighted basket of six major currencies, was at 100.71 not far
from the eleven-day highs of 101.02 set earlier Friday. The index ended the week with gains of 0.95%, the
largest weekly percentage gain since mid-December after remarks from Trump indicted that his
administration would soon reform tax policy. Trump said Thursday he would be announcing something
over the next two or three weeks that would be “phenomenal” in terms of tax. A strong dollar is typically
bearish for gold, which is denominated in dollars and struggles to compete with yield-bearing assets when
borrowing costs rise.
Elsewhere in precious metals trading, silver was at $ 17.95 a troy ounce late Friday, and ended the week
with gains of 2.69% . Copper was up 4.65% at $ 2.777 a pound and ended the week up 6.03% amid fears
over a supply disruption. Workers at BHP Billiton Escondida in Chile, the world's largest copper mine,
went on strike on Thursday, bringing production to a standstill. Platinum was down 0.77% at $1,014.3
late Friday. In the week ahead, the U.S., the UK and China are to release what will be closely watched
data on inflation. Meanwhile, Federal Reserve Chair Janet Yellen is due to testify to Congress for the first
time since Donald Trump entered the White House. Ahead of the coming week, Investing.com has
compiled a list of these and other significant events likely to affect the markets.
Monday, February 13
Japan is to publish preliminary data on fourth quarter economic growth.
Tuesday, February 14
China is to release data on consumer and producer price inflation.
Germany is to put out a preliminary estimate of fourth quarter growth, while the euro zone is to release a
revised estimate of fourth quarter growth.
The ZEW Institute is to report on German economic sentiment.
The U.K. is to publish data on consumer price inflation.
The U.S. is to release data on producer price inflation.

Fed Chair Janet Yellen is due to appear before the Senate Banking Committee, in Washington to testify
on the bank’s latest monetary policy report.
Separately, Dallas Fed President Robert Kaplan is to speak at an event in Houston.
Wednesday, February 15
The U.K. is to publish its latest employment report.
The U.S. is to release a raft of economic data, including reports on inflation, retail sales, industrial
production and manufacturing activity in the New York region.
Fed Chair Janet Yellen is due to testify on the bank’s latest monetary policy report to the House Banking
Committee, in Washington.
Thursday, February 16
Australia is to publish its latest jobs report.
The European Central Bank is to publish the minutes of its latest meeting.
The U.S. is to publish reports on building permits, housing starts, jobless claims and manufacturing
activity in the Philadelphia region.
Friday, February 17
New Zealand is to publish a report on retail sales.
The U.K. is also to report on retail sales.
Canada is to round up the week with figures on foreign securities purchases.
Gold steadied on Friday, but remained below this week's three-month top as the U.S. dollar and Treasury
yields came off their highs after the currency initially jumped on U.S. President Donald Trump's promise
of a major tax announcement. Spot gold XAU= was up 0.02 percent at $1,230.78 an ounce by 2:24 p.m.
EST (1924 GMT), while U.S. gold futures GCv1 for April delivery settled down 0.07 percent at
$1,235.90. On Wednesday, spot gold reached its highest since mid-November at $1,244.67. Gold prices
were on track for a second weekly gain, up 1 percent from late last Friday. The dollar .DXY pared gains
against a currency basket on Friday after earlier strength from U.S. President Donald Trump's pledge to
announce a major tax plan within weeks cooled some market nerves, reinvigorating dollar bulls. Wall
Street hit record highs for a second day on hopes of the business-friendly tax cuts. "The dollar puts a little
pressure on gold however the strength in the equity markets and the strength in the other precious metals
is lifting gold up. gold prices moved into positive territory. "It's really the intermarket relationship that's

stabilizing gold right now." Silver XAG= was up 1.5 percent at $17.91 an ounce, after tapping $ 17.99,
the highest since Nov. 11. Palladium XPD= rose 1.6 percent to $ 782, after rising to $786.40, the highest
since Jan. 25. "Both silver and palladium are up on the day as an improving China signals a better global
economy and gives support to the more industrial metals of the group," said aid Miguel Perez-Santalla,
vice president of Heraeus Metal Management in New York. Earlier in the session, however, gold prices
were lower. "The Trumpflation trade is back on the agenda, which is negative for gold. U.S. economic
data has also stoked talk that the Federal Reserve would press ahead with U.S. interest rate hikes sooner
rather than later. U.S. import prices rose more than expected in January, while initial jobless claims
dropped unexpectedly last week to the lowest in nearly 43 years. is highly sensitive to rising U.S. interest
rates, which increase the opportunity cost of holding non-yielding bullion while boosting the dollar, in
which it is priced. The major physical markets in Asia were mixed this week as Indian jewelers stocked
up for wedding season, while rising prices sidelined buyers elsewhere.
Platinum XPT= was down 0.6 percent at $1,006.10.
Gold prices tumbled on Friday, as the U.S. dollar remained broadly supported following recent comments
by U.S. President Donald Trump on tax reform and an upbeat jobless claims report added to optimism
over the strength of the U.S. economy. On the Comex division of the New York Mercantile Exchange,
gold futures for April delivery were down 1.12% at $1,223.00, the lowest since February 6. The April
contract ended Thursday’s session 0.22% lower at $ 1,236.80 an ounce.
Futures were likely to find support at $ 1,206.20, the low of February 3 and resistance at $1,243.50,
Thursday’s high. The dollar strengthened after U.S. President Donald Trump said on Thursday that he
would announce the most ambitious tax reform plan since the Reagan era in the next few weeks. During a
meeting with airline CEOs on Thursday, Trump promised a “phenomenal” tax plan, without giving any
specific details of the plan. The comments came after the U.S. Department of Labor said initial jobless
claims decreased by 12,000 to 234,000 in the week ending February 4. Analysts had expected jobless
claims to rise by 4,000. The U.S. dollar index, which measures the greenback’s strength against a trade-
weighted basket of six major currencies, was steady at 100.69, just off a two-week high of 100.75 hit
overnight. Elsewhere in metals trading, silver futures for March delivery lost 1.01% to $17.562 a troy
ounce, while copper futures for March delivery gained 0.77% to $2.675 a pound. Copper prices remained
under pressure however, as workers at the Escondida copper mine in Chile, the largest in the world,
launched a strike on Thursday. The workers union has warned that the strike could be lengthy, potentially
affecting global supplies.
Chile is the world’s biggest producer of the red metal, providing almost a third of the world's supply.
Asian gold demand was mixed this week with Indian jewellers stocking up for the wedding season while
rising prices kept buyers on the sidelines elsewhere. After delaying purchases last month in anticipation of
an import duty cut in the federal budget, jewellers in India have started rebuilding inventories on the back
of an uptick in retail demand due to the wedding season. "The uncertainty over the duty cut is over.
Jewellers are building inventory. Last week, the Indian government presented its budget for the 2017/18

financial year, but didn't change the import duty on gold. bullion industry had urged the government to
reduce the duty to combat smuggling, which has increased since India raised it to 10 percent in August
2013 in an effort to narrow a gaping current account deficit. "Retail demand has been improving due to
the wedding season. Prices in the world market have jumped in the last few weeks, but comparatively,
Indian prices rose less due to an appreciation in the rupee. In the local market, gold MAUc1 was trading
around 28,952 rupees per 10 gram on Friday, after falling to 26,862 rupees in December, the lowest since
Feb. 2, 2016. Dealers in the world's second-largest consumer of the metal were charging a premium of up
to $3 an ounce this week over official domestic prices, compared with a premium of $ 2 last week. The
domestic price includes the 10 percent import tax. "Demand for coins and bars is still weak. Investors are
more interested in equities," said a Mumbai-based dealer with a private bank. Meanwhile, rising prices
took the sheen off gold in other regions of Asia. "The physical side is still is very slow as people have to
adjust to prices at this level. There was not much buying from China too.
Premiums in China, the top consumer, were $7-$8 over international spot prices, while premiums in Hong
Kong and Singapore dropped slightly to 80 cents to $1.20 from last week's $1-$1.40. In Japan, prices
were at a discount of 75 cents, due to increasing selling volume, said a Tokyo-based trader.
Gold slipped on Thursday from a three-month high in the previous session after robust U.S. economic
data pointed to a stronger economy, increasing the likelihood that the Federal Reserve will raise U.S.
interest rates. The data showing rising U.S. wholesale inventories and an unexpectedly low number of
Americans filing for unemployment benefits also pushed up the dollar .DXY and U.S. bond yields
US10YT=RR . A stronger dollar makes gold more expensive for holders of other currencies, while higher
yields increase the opportunity cost of holding non-yielding bullion. Higher interest rates would lift yields
further. Spot gold XAU= was down 0.85 percent at $1,231.03 an ounce by 3:53 p.m. EST , while U.S.
gold futures GCcv1 settled down 0.2 percent at $1,236.80. "If people were betting on the Fed being more
relaxed and rates being lower for longer, this has muddied that picture. Still, Chicago Fed President
Charles Evans, a voter on policy this year, told reporters it is reasonable to expect the Fed to raise rates
three times this year. gold striking $1,244.67, its highest since Nov. 11, on Wednesday, some investors
had turned cautious and were cashing in their bets on higher prices. Gold has risen about 10 percent from
a mid-December low as political risk in Europe and the United States has driven demand for bullion as a
safe haven. Those worries were fueled on Thursday by official data that showed Germany's trade surplus
climbed to a record high in 2016, setting the scene for conflict between Berlin and Washington after
Trump's top trade adviser last week accused Berlin of exploiting a "grossly undervalued" euro to gain
trading advantage. about a possible trade and currency war therefore seem justified and are likely to keep
demand for gold at a high level. Adding support to prices, SPDR Gold Trust, the world's largest gold-
backed exchange-traded fund, increased its bullion holdings for a sixth day on Wednesday. "We see gold
as relatively underpriced, given the rally in commodities and high level of political uncertainty. In other
precious metals, platinum XPT= was down 0.2 percent at $1,012.99 an ounce. The metal used in jewelry
and autocatalysts touched $1,028.50, its highest since Oct. 3, earlier in the session. Spot silver XAG= fell

by 0.9 percent to $17.62 an ounce, while palladium XPD= was up 0.2 percent at $770.
Gold rose to a three-month peak on Wednesday, as political risks posed by elections in Europe and
worries over U.S. President Donald Trump's policies stoked safe haven demand. Investors are concerned
about the strong showing in the French presidential race of far-right candidate Marine Le Pen, who has
promised to take France out of the euro zone and to hold a referendum on European Union membership.
The euro EUR= recovered after falling against the dollar on political risks, as the single currency gained
from investors' wariness over Trump's protectionism and immigration policy and his hints that he would
prefer a weaker dollar. There's underlying demand for gold as a hedge against political uncertainties on
both sides of the Atlantic.Retracements have been quite shallow the past couple of weeks, especially the
signal that gold wasn't going down when the dollar started going up. Spot gold XAU= rose 0.5 percent at
$ 1,239.27 an ounce by 2:45 p.m. EST, after rising to its highest since Nov. 11 at $ 1,244.67. "This
discussion over the immigration ban and the court fight is leaving investors in a realm of uncertainty
which is also leaving room for them to take on new gold positions or to reduce their shorts. U.S. gold
futures GCcv1 settled up 0.3 percent at $ 1,239.50. Indicating heightened worries over the French
elections, the gap between French 10-year government bond yields and their low-risk German equivalents
was at its widest since November 2012. "Gold prices will continue to rise until mid-February on
uncertainties in the U.S. and Europe. But once January CPI data is released, it will give an idea about the
possibility of a rate hike in March.
Holdings of SPDR Gold Trust GLD , the world's largest gold-backed exchange-traded fund, rose for a
fifth straight session on Tuesday. Spot silver XAG= rose 0.3 percent to $ 17.76 an ounce, after marking
its highest since Nov. 11 at $ 17.87.
Gold prices were little changed in European morning trade on Tuesday, holding steady near the prior
session's three-month high as investors sought the perceived safety of the yellow metal amid growing
concerns over political risks in Europe and around the globe. Gold for April delivery on the Comex
division of the New York Mercantile Exchange tacked on 25 cents, or less than 0.1%, to $1,232.45 a troy
ounce by 5:30AM ET, after rallying $ 11.30, or almost 1%, a day earlier. Prices of the yellow metal
touched $ 1,237.50 on Monday, the most since November 11. Investors were largely focused on French
politics, as far-right National Front leader Marine Le Pen launched her presidential bid over the weekend,
vowing to fight globalization and take France out of the euro zone. Apart from France, market players
also have to factor in elections in other parts of the European Union this year. Dutch elections are in
March followed by Germany in September. In Italy, another presidential election looms, even as former
Italian prime minister Matteo Renzi said he was willing to shelve his push for early voting. Traders also
eyed political risk elements in the U.S., with President Donald Trump's administration on the back foot
over its immigration and other policies. Headlines from Washington will continue to dictate market
sentiment as traders focus on Trump for further details on his promises of tax reform, infrastructure
spending and deregulation as well as trade policies. Investors often buy gold as a refuge against economic
and political uncertainty. Gains were limited due to a stronger U.S. dollar, as dollar-priced commodities

become more expensive to investors holding other currencies when the greenback gains. The U.S. dollar
index, which measures the greenback’s strength against a trade-weighted basket of six major currencies,
was up 0.8 % at 100.62 in early trade, pulling away from last week's two-month low of 99.19. Fed fund
futures priced in a less than 10% chance of a rate hike in March. However, odds of a June increase was
seen at more than 60 %. The Fed, which raised rates in December, has forecast three rate increases this
year. However, traders remained unconvinced, with markets continuing to price in just two rate hikes
during the course of this year. Also on the Comex, silver futures for March delivery shed 8.1 cents, or
0.5%, to $ 17.61 a troy ounce. Meanwhile, platinum dipped 0.3% to $ 1,011.00, while palladium dropped
around 1.8% to $ 760.65 an ounce. Elsewhere in metals trading, copper futures inched down 1.8 cents, or
0.7%, to $ 2.634 a pound.
Gold prices gained in European morning trade on Monday, rising toward the highest level in about 12
weeks as investors scaled back expectations for a more aggressive pace of rate hikes from the Federal
Reserve this year. Gold for April delivery on the Comex division of the New York Mercantile Exchange
rose to a session peak of $1,227.00 a troy ounce, the most since November 16. It was last at $1,225.45 by
3:15AM ET, up $ 4.55, or around 0.4%. Prices of the yellow metal climbed 2.4% last week, its best
weekly gain in seven months. The latest U.S. employment report showed that jobs growth beat
expectations, but wage growth remained tepid, which will likely prompt the Fed to adopt a more cautious
approach on raising interest rates this year. The U.S. economy added 227,000 jobs in January from the
prior month, the Labor Department said Friday, while the unemployment rate ticked up to 4.8% from
4.7% in December, as more Americans joined the workforce. But average hourly earnings rose just 0.1%
in January from a year earlier, below expectations for a 0.3% rise and slowing from 0.2% in December.
The small gain lowered the year-on-year increase in earnings to 2.5% from 2.8% in December.
The weak wage growth was seen as weakening the case for near-term interest rate hikes. Fed fund futures
priced in a less than 10% chance of a rate hike in March after the jobs data on Friday, according to
Investing.com’s Fed Rate Monitor Tool. Odds of a June increase was seen at more than 60%. The Fed,
which raised rates in December, has forecast three rate increases this year. However, traders remained
unconvinced, with markets continuing to price in just two rate hikes during the course of this year. The
U.S. dollar index, which measures the greenback’s strength against a trade-weighted basket of six major
currencies, was at 99.85 in early European trade, not far from last week's two-month low of 99.19. The
greenback has been under pressure amid growing concern about the potential impact of the Trump
Administration’s protectionist stance. Headlines from Washington will continue to dictate market
sentiment as traders focus on Trump for further details on his promises of tax reform, infrastructure
spending and deregulation as well as trade policies. Also on the Comex, silver futures for March delivery
jumped 9.9 cents, or 0.6%, to $17.57 a troy ounce.
Gold ended slightly higher on Friday, after the latest U.S. jobs report showing weak wage growth last
month dampened expectations for a faster rate of interest rate hikes this year. Gold for April delivery
settled up 0.2% at $1,221.85 on the Comex division of the New York Mercantile Exchange. The Labor

Department said the U.S. economy added 227,000 jobs in January from the prior month, while the
unemployment rate ticked up to 4.8% from 4.7% in December, as more Americans joined the workforce.
But average hourly earnings rose 2.5% in January from a year earlier, slowing from 2.8% in December.
The slowdown in wage growth prompted speculation that the Fed will avoid hiking interest rates too
quickly. In its latest monetary policy statement on Wednesday the Fed stuck to its view that the economy
is strengthening, but gave no clear signal on the timing of its next rate hike as officials wait to assess the
possible economic impact of the Trump administration’s protectionist policies and recent remarks about
currencies. The precious metal was 2.14% higher for the week, as the dollar remained under pressure
amid concerns over Donald Trump's presidential style and a lack of clarity on rate hikes. Both a strong
dollar and higher interest rates are typically bearish for gold, which is denominated in dollars and
struggles to compete with yield-bearing assets when borrowing costs rise. Elsewhere in precious metals
trading, silver was at $17.51 a troy ounce late Friday and ended the week with gains of 1.7%. Copper was
trading at $ 2.61 a pound late Friday and ended the week down 2.86%, and platinum was up 0.73% on the
day at $ 1,006.85 an ounce. In the coming week, China is to release data on service sector activity and
trade, while a report on German factory orders will be in focus in the euro zone. The U.S. is to release
monthly trade figures in what will be a thin week for economic data. Ahead of the coming week,
Investing.com has compiled a list of these and other significant events likely to affect the markets.
✍ ENERGY
Oil prices dipped on Monday on signs that global fuel markets remained bloated despite OPEC-led crude
production cuts that have been more successful than most initially expected. Brent crude futures LCOc1
were trading at $ 56.55 per barrel at 0035 GMT, down 15 cents from their previous close. West Texas
Intermediate crude futures CLc1 were down 12 cents at $ 53.74 a barrel. The Organization of the
Petroleum Exporting Countries and other producers including Russia have agreed to cut output by almost
1.8 million barrels per day during the first half of 2017 in a bid to rein in a global fuel supply overhang.
There was widespread scepticism that all producers would actually make the promised cuts, but
compliance with the announced reductions is now estimated to be around 90 percent. will be keenly
awaiting the release today of OPEC's monthly report. If production cuts are coming through as suggested,
we should see oil prices push higher. While traders said that crude was well supported in the lower to
mid-$ 50s per barrel due to the curbs, they pointed to a host of reasons that were preventing prices from
rising further unless production is cut deeper or for a longer period. In the United States, rising drilling
activity is pushing up production and undermining OPEC's efforts to reduce output.
Drillers added eight oil rigs in the week to Feb. 10, bringing the total U.S. count to 591, the most since
October 2015, Baker Hughes BHI.N said on Friday. During the same week last year, when prices were
around $30 per barrel, there were just 439 active oil rigs. Russia, which is participating in the cuts, there
are signs that output may be falling but that exports remain high, as its producers shield their core export
markets at the cost of lower domestic supplies or by cutting into inventories. these trends, analysts say
that OPEC might have to extend its cuts for a longer period than the currently planned first half of 2017.
since global oil demand is expected to rise be between 1.3 million bpd and 1.5 million bpd in 2017,
OPEC's conundrum is that the longer and deeper it cuts, the more it cedes market share to competitors, as
seen in the two world's biggest oil consuming markets. In the United States, OPEC is facing the rising
flood of shale driven production. In China, OPEC's de-facto leader Saudi Arabia has already been
overtaken by Russia as the biggest oil supplier.
Oil futures finished sharply higher on Friday, as traders cheered signs that global supply was beginning to
tighten in wake of a planned agreement by major crude producers to cut output. But prices barely logged a
weekly gain, pressured by expectations for further growth in U.S. crude production. On the ICE Futures
Exchange in London, Brent oil for April delivery jumped $1.07, or about 2%, to settle at $56.70 a barrel
by close of trade Friday. Despite Friday's strong gains, London-traded Brent futures scored a loss of 11
cents, or around 0.2%, on the week. Elsewhere, on the New York Mercantile Exchange, crude oil for
delivery in March rose 86 cents, or about 1.6%, to end at $53.86 a barrel by close of trade. For the week,
New York-traded oil futures gained 3 cents, or less than 0.1%. OPEC has delivered more than 90% of
pledged oil output curbs in January, according to figures the exporter group uses to monitor its supply,
making a strong start to implementation of its first production cut in eight years. Supply from the 11
OPEC members with production targets under the deal has fallen to 29.92 million barrels per day last
month. That amounts to 92% compliance, far higher than the initial 60% compliance with a 2009 OPEC
deal. January 1 marked the official start of the deal agreed by OPEC and non-OPEC member countries
such as Russia in November last year to reduce output by a combined 1.8 million barrels per day to 32.5
million for the next six months. The deal, if carried out as planned, should reduce global supply by about
2%. OPEC is scheduled to publish its first assessment of its January production based on the secondary
sources in its monthly oil market report on Monday. Futures have been trading in a narrow range around
the low-to-mid-$ 50s over the past month as sentiment in oil markets has been torn between hopes that
oversupply may be curbed by output cuts announced by major global producers and expectations of a
rebound in U.S. shale production.
Oilfield services provider Baker Hughes said Friday that the number of rigs drilling for oil in the U.S.
increased by 8 last week, the 134h gain in 15 weeks. That brought the total count to 591, the most since
November 2015. The data raised concerns that the ongoing rebound in U.S. shale production could derail
efforts by other major producers to rebalance global oil supply and demand. Elsewhere on Nymex,
gasoline futures for March rose 1.9 cents, or nearly 1.3% to $1.589 a gallon, the highest since January 17.
It ended up about 2.3% for the week. March heating oil added 2.4 cents, or 1.5%, to finish at $1.665 a
gallon. For the week, the fuel gained less than 0.1%. Natural gas futures for March delivery sank 10.7
cents, or almost 3.5%, to an 11-week low of $ 3.034 per million British thermal units. It posted a weekly
loss of around 1%. In the week ahead, market participants will eye fresh weekly information on U.S.
stockpiles of crude and refined products on Tuesday and Wednesday to gauge the strength of demand in
the world’s largest oil consumer. Meanwhile, investors will keep an eye out for the Organization of

Petroleum Exporting Counties monthly report on Monday to gauge global supply and demand levels.
Traders will also continue to pay close attention to comments from global oil producers for further
evidence that they are complying with their agreement to reduce output this year. Ahead of the coming
week, Investing.com has compiled a list of these and other significant events likely to affect the markets.
Monday, February 13
The Organization of Petroleum Exporting Counties will publish its monthly assessment of oil markets.
Later in the day, the U.S. Energy Information Administration will release its monthly update on domestic
oil and natural-gas shale output.
Tuesday, February 14
The American Petroleum Institute, an industry group, is to publish its weekly report on U.S. oil supplies.
Wednesday, February 15
The EIA is to release weekly data on oil and gasoline stockpiles.
Thursday, February 16
The U.S. government is to produce a weekly report on natural gas supplies in storage.
Friday, February 17
Baker Hughes will release weekly data on the U.S. oil rig count.
Oil prices rose on Friday after reports that OPEC members delivered more than 90 percent of the output
cuts they pledged in a landmark deal that took effect in January. Supply from the 11 members of the
Organization of the Petroleum Exporting Countries with production targets under the deal fell to 29.92
million barrels per day, according to the average assessments of the six secondary sources OPEC uses to
monitor output, or 92 percent compliance. International Energy Agency - one of OPEC's six sources -
said the cuts in January equated to 90 percent of the agreed reductions in output, far higher than the initial
60 percent compliance with a 2009 OPEC deal. producers, notably Saudi Arabia, appearing to cut by
more than required," the agency said in a report. Global benchmark Brent crude LCOc1 settled up $1.07,
or 1.9 percent, at $56.70 a barrel. It touched a session high of $56.88.
U.S. West Texas Intermediate crude futures CLc1 settled up 86 cents, or 1.6 percent, at $53.86 a barrel.
Another increase in U.S. oil rigs limited gains in the afternoon. Drillers added eight oil rigs in the week to
Feb. 10, bringing the total count up to 591, the most since October 2015, energy services firm Baker
Hughes Inc BHI.N said. "From a psychological viewpoint, a big number to close above would be $54, and
the rig count probably made that a little less likely, Crude has benefited from recent strength in gasoline

prices RBC1 as a glut seems to be gradually eroding. EIA/S futures 1RBc1 rose 1.3 percent on Friday to
$1.59 a gallon. The IEA, which advises industrial nations on energy policy, said if current compliance
levels hold, the global oil stocks overhang that has weighed on prices should fall by about 600,000 barrels
per day (bpd) in the next six months. The agency also raised global oil demand growth expectations for
2017 to 1.4 million bpd, up 100,000 bpd from its previous estimate. Nevertheless, producers will probably
have to extend the production cuts beyond six months if they want to achieve their goal of balancing the
oil market.
China's crude imports in January rose 27.5 percent from a year earlier to the third-highest volume ever,
suggesting robust demand to fill storage and to make up the shortfall as domestic production continues to
fall. The country is a key importer of West African oil. OPEC has delivered more than 90 percent of
pledged oil output curbs in January, according to figures the exporter group uses to monitor its supply,
making a strong start to implementation of its first production cut in eight years. Italy's Eni has lifted force
majeure on Brass River crude oil exports from Nigeria, leaving only the Forcados crude oil grade under
force majeure. Several Nigerian cargoes had traded, leaving roughly 20 remaining for March loading.
Just one export grade, Forcados, was now under force majeure after ENI lifted the declaration against
Brass River.
Loading delays have plagued other grades, including Exxon's Qua Iboe, though the major was pressing
offers for it as high as $1.50 per barrel above dated Brent.
Nigeria's vice president met leaders in the oil-producing Delta region in an effort to reach a lasting
peace deal with militants whose attacks had pushed output below 20-year lows in 2016.
ANGOLA
Just two cargoes, a Sangos and a Pazflor, were left to trade for March loading, sources said.
Most of the focus had turned to the April loading plan, which was scheduled for release by the middle
of next week.
India's IOC this week took a total of 3 million barrels of Nigerian crude, and one cargo of Angolan.
Shell placed a cargo of EA, Glencore a cargo of Nigerian Okwuibome and Total a cargo of Akpo and
Angola's CLOV into the tender, which sought crude for April 1-10 loading.
Eleven non-OPEC oil producers that joined a global deal to cut output to boost prices have delivered 40
percent of promised curbs in January, two OPEC sources said. The sources cited OPEC calculations based

on data from the International Energy Agency. OPEC's figures, reported earlier on Friday by Reuters, put
its own compliance at 92 percent. Organization of the Petroleum Exporting Countries, Russia and other
producers agreed to cut oil production by a combined 1.8 million bpd in the first half of 2017 to boost
prices and get rid of a supply glut.
The lower compliance figure for non-OPEC to date is partly due to the phased implementation of the deal
by Russia, the largest non-producer cooperating with OPEC. Russia said it would phase in its share of the
cut gradually rather than in the first month of the agreement and in January lowered supply by 100,000
bpd. Moscow pledged to reduce output by 300,000 bpd in the agreement. An OPEC and non-OPEC
technical committee due to meet in Vienna on Feb. 22 will look further at how to assess compliance with
the deal. Non-OPEC delivers 40 pct of pledged oil curbs in January - OPEC sources.
OPEC has delivered over 90 percent of pledged oil output curbs in January, according to figures the
exporter group uses to monitor its supply, making a strong start in implementing its first production cut in
eight years. The Organization of the Petroleum Exporting Countries is cutting its crude output by about
1.2 million barrels per day from Jan. 1 to prop up oil prices LCOc1 and reduce a supply glut. Supply from
the 11 OPEC members with production targets under the deal in January has fallen to 29.921 million bpd,
according to the average assessments of the six secondary sources OPEC uses to monitor its output seen
by Reuters. This amounts to 92 percent compliance, according to an OPEC calculation. Compliance of 92
percent comfortably exceeds the initial 60 percent achieved when OPEC's previous deal to cut was
implemented in 2009, and the OPEC figures add to indications that adherence so far has been high. OPEC
is scheduled to publish its first assessment of January production based on the secondary-source figures in
its monthly oil market report on Monday. The figures could be revised before they are published, sources
said.
Oil prices were stable early on Friday, with OPEC-led production cuts supporting the market while
soaring U.S. fuel inventories were weighing on crude. U.S. West Texas Intermediate crude futures CLc1
were trading at $53.08 per barrel at 0106 GMT, up 8 cents from their last settlement. Brent crude futures
LCOc1 , the international benchmark for oil prices, were up 3 cents at $ 55.66 a barrel. Both crude futures
have traded within a $5 range since the beginning of the year, and traders said this was due to competing
price drivers. "Oil prices continue to struggle to break out of the current range.. "The push and pull
between competing forces in the crude oil market continued overnight. Despite the stronger U.S.-dollar
.DXY and lingering concerns about U.S. inventories, traders returned their focus to the OPEC production
cuts being implemented at the moment. The Organization of the Petroleum Exporting Countries and other
producers including Russia have agreed to cut output by almost 1.8 million barrels per day during the first
half of 2017 in a bid to rein in a global fuel supply overhang. There was widespread scepticism that all
producers would actually make the promised cuts, but compliance with the announced reductions is now
estimated to be between 80 and 90 percent as especially OPEC's de-facto leader Saudi Arabia has
enforced sharp production cuts.
And this is likely to remain until the release of OPEC data next week.

Despite this, oil markets remain bloated as inventories especially in the United States are brimming and
rising U.S. drilling activity is pushing up production there as well. As a result, WTI and Brent crude oil
futures are 4 to 5 percent below their early January peaks.
Oil prices rose on Thursday, boosted by an unexpected draw in U.S. gasoline inventories, although
bloated crude supplies meant that fuel markets remain under pressure. Brent crude futures LCOc1 , the
international benchmark for oil prices, were trading at $ 55.41 per barrel at 0515 GMT, up 29 cents, or 0.5
percent, from their last close. U.S. West Texas Intermediate crude CLc1 was up 26 cents, or 0.5 percent,
at $ 52.60 a barrel. The U.S. Energy Information Administration said on Wednesday that gasoline stocks
fell by 869,000 barrels last week to 256.2 million barrels, versus analyst expectations for a 1.1 million-
barrel gain. Traders said that this surprise increase in U.S. gasoline inventories had helped push up crude,
although most added that fuel markets were still bloated and that this would likely prevent further big
price rises. "We remain highly sceptical of the overnight price action," U.S. commercial crude inventories
soared by 18.8 million barrels to 508.6 million barrels, according to the EIA. The high fuel inventories as
well as rising U.S. crude production mean that oil markets will remain over-supplied for some time. "The
4Q16 global oil market surplus led to further rises in global inventories in January, and as a result the
draws that we expect will start from a high base. "U.S. production has also rebounded faster than our rig
modelling suggested ... and we view the faster shale rebound as creating downside risk to our 2018 WTI
price forecast of $ 55 per barrel, but not to our expectation that the global oil market will shift into deficit
in 1H17," . high inventories undermine efforts by the Organization of the Petroleum Exporting Countries
and other producers including Russia to cut output by almost 1.8 million bpd during the first half of this
year in order to prop up prices and rebalance the market. As a result, both Brent and WTI are down
around 5 percent since early January, when the OPEC-led cuts started to be implemented. "Our 2017
Brent outlook is broadly neutral, with a $ 57.0 per barrel average forecast for the year. "Agreed
production cuts by OPEC and Russia are supporting prices, but heavy refinery maintenance, and
production growth in Libya, Nigeria and the Permian will cap gains," it added.
Oil prices stabilised on Thursday, boosted by an unexpected draw in U.S. gasoline inventories, although
bloated crude supplies meant that fuel markets remained under pressure. Brent crude futures LCOc1 , the
international benchmark for oil prices, were trading at $ 55.27 per barrel at 0137 GMT, up 15 cents from
their last close. U.S. West Texas Intermediate crude CLc1 was up 14 cents at $ 52.48 a barrel. The U.S.
Energy Information Administration said on Wednesday that gasoline stocks fell by 869,000 barrels last
week to 256.2 million barrels, versus analyst expectations for a 1.1 million-barrel gain. Traders said that
this surprise increase in U.S. gasoline inventories had helped push up crude, though most added that fuel
markets were still bloated and that this would likely prevent further big price rises. "We remain highly
sceptical of the overnight price action. U.S. commercial crude inventories soared by 18.8 million barrels
to 508.6 million barrels, according to the EIA. The high fuel inventories as well as rising U.S. crude
production mean that oil markets will remain over-supplied for some time. "The 4Q16 global oil market
surplus led to further rises in global inventories in January, and as a result the draws that we expect will

start from a high base. "U.S. production has also rebounded faster than our rig modelling suggested..and
we view the faster shale rebound as creating downside risk to our 2018 WTI price forecast of $55 per
barrel, but not to our expectation that the global oil market will shift into deficit in 1H17," High
inventories undermine efforts by the Organization of the Petroleum Exporting Countries and other
producers including Russia to cut output by almost 1.8 million bpd during the first half of this year in
order to prop up prices and rebalance the market. As a result, both Brent and WTI are down around 5
percent since early January, when the OPEC-led cuts started to be implemented.
Oil prices slid on Wednesday, extending falls from the previous session, as a big increase in U.S. crude
inventories and a slump in Chinese demand implied too much global supply despite OPEC-led efforts to
cut output. International Brent crude futures LCOc1 were trading at $ 54.69 per barrel at 1501 GMT,
down 36 cents from their previous close. U.S. West Texas Intermediate crude CLc1 was at $ 51.71 a
barrel, down 46 cents. The declines came on the back of unexpectedly big increases in U.S. fuel
inventories, as reported by the American Petroleum Institute on Tuesday. Crude inventories rose by 14.2
million barrels in the week to February 3 to 503.6 million barrels, compared with analysts expectations in
a Reuters poll for a 2.5 million barrel increase. "If the official data from the U.S. Department of Energy
were to show a similar inventory build ... U.S. crude oil stocks would be catapulted to almost a record
level," The U.S. Energy Information Administration publishes its official data later on Wednesday.
Gasoline stocks rose by 2.9 million barrels, compared with expectations for a 1.1-million-barrel gain. The
data pointed to "U.S. gasoline demand falling sharply by 460,000 barrels per day year on year in January,
with such declines only previously (seen) during recessions." The EIA said on Tuesday it expects U.S.
crude production to grow by 100,000 bpd to 8.98 million barrels this year, 0.3 percent less than previously
forecast, but expects production to jump by 550,000 bpd in 2018. U.S. supplies undermine a deal led by
the Organization of the Petroleum Exporting Countries to curb output and support prices. But OPEC, for
the time being at least, is not greatly concerned with rising U.S. output. "The market is gradually
accommodating for shale oil as well as shale gas - the demand is healthy. With that continuous demand
increase I think all available oils are going to be accommodated," Qatari Energy Minister Mohammed al-
Sada told Reuters on Wednesday. also came under pressure from signs of slowing demand from the
world's biggest energy consumer. China's 2016 oil demand grew at its slowest pace in at least three years,
Reuters calculations based on official data showed. China's implied oil demand growth eased to 2.5
percent in 2016, down from 3.1 percent in 2015 and 3.8 percent in 2014, led by a sharp drop in diesel
consumption and as gasoline usage eased from double-digit growth.
Oil prices dropped on Wednesday to extend falls from the previous day, as a massive increase in U.S. fuel
inventories and a slump in Chinese demand implied that global crude markets remain oversupplied
despite OPEC-led efforts to cut output. Brent crude futures LCOc1 , the international benchmark for oil
prices, were trading at 54.53 per barrel at 0111 GMT, down 52 cents, or 0.94 percent, from their previous
close. U.S. West Texas Intermediate crude futures CLc1 were at $51.52 a barrel, down 65 cents, or 1.25
percent. The slumps on Wednesday came after over 1-percent falls the previous day. He said that the

sharp declines came on the back of unexpectedly big increases in U.S. crude and refined product
inventories, as reported by the American Petroleum Institute on Tuesday. Crude inventories rose by 14.2
million barrels in the week to Feb. 3 to 503.6 million barrels, compared with analysts' expectations for an
increase of 2.5 million barrels. Gasoline stocks rose by 2.9 million barrels, compared with analyst
expectations in a Reuters poll for a 1.1-million barrel gain. "Weekly data points to U.S. gasoline demand
falling sharply by 460,000 barrels per day year-on-year in January, with such declines only previously
during recessions. However, the U.S. bank said that "this data vastly overstates a likely modest year-on-
year decline in gasoline demand," and that its "outlook for global strong demand growth remains
unchanged". Outside the United States, there were other signs of market weakness. China's 2016 oil
demand grew at the slowest pace in at least three years, Reuters calculations based on official data
showed. China's implied oil demand growth eased to 2.5 percent in 2016, down from 3.1 percent in 2015
and 3.8 percent in 2014, led by a sharp drop in diesel consumption and as gasoline usage eased from
double-digit growth. slowing occurred as the economy expanded by only 6.7 percent in 2016, the slowest
pace in 26 years. Slowing demand and ongoing high inventories undermine efforts by the Organization of
the Petroleum Exporting Countries and other producers including Russia to cut output by almost 1.8
million bpd during the first half of this year in order to prop up prices and rebalance the market. Despite
this, both Brent and WTI are down over 6 percent since early January, when the cuts started to be
implemented.
The American Petroleum Institute on Tuesday said crude oil inventories jumped 14.23 million barrels at
the end of last week, according to sources. Gasoline inventories rose 2.9 million barrels, while distillate
stocks gained by 1.37 million barrels, highlighting continued builds in refined products seen as an
overhang on the market. The Cushing oil hub recorded a build of 624,000 barrels, the first increase in five
weeks. The figures are followed on Wednesday by official data from the U.S. Energy Information
Administration. Analysts expect a crude build of 2.38 million barrels at the end of last week.
Oil prices fell on Tuesday, pressured by sluggish demand and evidence of a burgeoning revival in U.S.
shale production that could complicate efforts by OPEC and other producers to reduce a supply glut.
Benchmark Brent crude LCOc1 was down 80 cents at $ 54.92 a barrel by 11:31 EST. On Monday, the
Brent futures contract closed down $ 1.09 a barrel. U.S. crude CLc1 was 96 cents lower at $52.05 after
closing down 82 cents on Monday. Gasoline futures RBc1 fell 2.66 cents or 1.77 percent to $ 1.4837 a
gallon. "It's a supply-driven setback ... We are within 2 million barrels of the record in U.S. gasoline
stocks that we saw last February, "A strong build in inventory reports could weigh on gasoline in a
seasonal time frame where gasoline demand is weak." Inventory estimates from trade group the American
Petroleum Institute are due on Tuesday afternoon. U.S. government data is reported Wednesday. Gasoline
futures fell below the 200 day moving average on a continuous chart, Headrick noted, adding that if they
close below that level, it could further pressure crude. Prices have been supported for two months as the
Organization of the Petroleum Exporting Countries and other exporters have tried to cut output by almost
1.8 million barrels per day in the first half of 2017. OPEC and Russia have together cut at least 1.1 million

bpd so far. But market players are concerned that rising U.S. production and signs of slowing demand
growth could offset these efforts. "The general perception is that OPEC is cutting production, which is
supporting prices, but high stock levels, rising rig counts and growing U.S. production are capping gains"
Societe Generale oil analyst Michael Wittner said U.S. shale oil output was recovering faster than
expected. Rig counts are increasing at an accelerating pace, and given the technological advances of the
past three years, this should translate into significant supply. "U.S. shale is coming back, and it's coming
back strong." Chinese oil demand grew in 2016 at the slowest pace in at least three years, Reuters
calculations showed, the latest sign of slower demand from the world's largest energy consumer. think
U.S. gasoline demand is stalling. Gasoline stockpiles rose by almost 21 million barrels in the first 27 days
of 2017, more than double the average increase of less than 12 million barrels at the same time of year
during the previous decade, official inventory data showed.
Oil edged lower Tuesday as the focus turned to U.S. stockpile data.Brent crude was off 27 cents, or
0.48%, at $ 55.45 at 08:00 ET. U.S. crude shed 26 cents, or 0.49%, to $ 52.75. The market was
underpinned by fresh sanctions imposed on Iran by the U.S. after ballistic missile testing by Tehran.
Increased U.S. drilling could derail the impact of agreed cuts by other major producers. OPEC and non-
OPEC producers have agreed to cut production by 1.8 million barrels a day in the first half of this year.
American Petroleum Institute U.S. inventory figures are due out later in the session. These will be
followed Wednesday by official Energy Information Administration inventories. U.S. crude stocks are
forecast to have increased by 2.38 million barrels in the latest reporting week.
Oil was stable on Tuesday after falls the previous session, with markets torn between mixed price
indicators that have kept crude range-bound for much of the year. Brent crude futures LCOc1 , the
international benchmark for oil prices, were trading at $ 55.77 per barrel at 0753 GMT, up 5 cents from
the last close. U.S. West Texas Intermediate crude futures CLc1 were up 4 cents at $53.05 a barrel. The
more stable prices came after WTI and Brent fell 1.5 to 2 percent the previous day.
Since the beginning of the year, both crude futures benchmarks have remained within a $ 5 per barrel
price range, suggesting a lack of strong directional price indicators. "$55 per barrel is quite obviously the
pivot point in this market... and it has been for some time. Traders said key price support was coming
from an effort by the Organization of the Petroleum Exporting Countries and other producers to cut output
by almost 1.8 million barrels per day in the first half of 2017. While OPEC and Russia have together cut
at least 1.1 million bpd so far, rising output elsewhere as well as signs of slowing demand growth threaten
to undermine these efforts, traders said. "The number of oil rigs in the U.S. (is) now at the highest level in
14 months, having risen over 20 percent since the OPEC production cut agreement was reached. There are
also concerns that U.S. gasoline consumption, a key pillar for crude oil demand, is stalling. Gasoline
stockpiles rose by almost 21 million barrels during the first 27 days of 2017, compared with an average
increase of less than 12 million barrels at the same time of year during the previous decade, according to
official inventory data, implying either stalling demand or ongoing oversupply. China, which is
challenging the United States as the world's biggest oil consumer, This week crude oil import demand

would soften during the first half of the year as refinery maintenance results in less demand and as
independent refiners were given a lower annual crude import quota. In a sign of a bloated fuel market,
China's refined oil product exports are soaring."China's oil product exports continued to surge for its third
year in 2016, by 34 percent year-on-year to 48.3 million tonnes. "At the same time, China's oil product
imports have been sliding downwards, falling about 7 percent year-on-year in 2016 to 27.9 million tonnes.
Oil fell on Monday as ample U.S. supplies and excess speculative length outweighed OPEC output curbs
and rising tensions between the United States and Iran. Brent LCOc1 futures fell $ 1.09, or 1.9 percent, to
settle at $ 55.72 a barrel, while U.S. West Texas Intermediate crude CLc1 lost 82 cents, or 1.5 percent, to
close at $ 53.01. That was the lowest close for both contracts since Jan. 31. The Brent premium over WTI
WTCLc1-LCOc1 narrowed to $2.09 a barrel at the close, its smallest since Jan. 19. "We feel that the bulk
of the price decline related to the larger-than-expected increase in net WTI speculative length as well as
another hefty increase in the oil rig count. Ritterbusch and others also said the crude decline was
associated with weakness in gasoline futures. U.S. gasoline futures RBc1 fell 2.8 percent on Monday.
Hedge funds and other speculators boosted their bullish bets in U.S. crude futures and options in the week
to Jan. 31 to the highest level on record, the U.S. Commodity Futures Trading Commission said on
Friday. are a lot of longs in the market, and if we don't see prices rise those longs will get discouraged and
exit the market as fast as they entered over the past few weeks. Oil prices, while supported by the
Organization of the Petroleum Exporting Countries' supply cuts since the start of the year and a new spike
in tension between Iran and the United States, are struggling for new direction. The Trump
administration's new sanctions against Iran, though not affecting oil output, raised concern about the
potential for further developments that could hinder export growth in OPEC's third-largest producer.
Tension between Tehran and Washington has risen since an Iranian missile test that prompted the United
States to impose sanctions on individuals and entities linked to the Revolutionary Guards. U.S. Energy
Information Administration said last week that U.S. crude inventories have built sharply for four straight
weeks, while data on Friday showed that the number of U.S. oil drilling rigs rose to the highest level since
October 2015. EIA/S likely going to see U.S. rigs keep increasing and as the months go on U.S.
production will ramp up and mitigate a lot of the OPEC cuts.
Oil edged lower Monday after earlier gains on ongoing tensions between the U.S. and Iran. Investors were
also weighing up the possible impact of a rise in the number of rigs operating in the U.S. Brent crude was
off 18 cents, or 0.32%, at $ 56.63 at 08:00 ET. U.S. crude shed 2 cents, or 0.04%, to $ 53.81. The U.S.
imposed fresh sanctions on Iranian companies in response to ballistic missile testing by Tehran. Baker
Hughes figures Friday showed an increase in the U.S. rig count of 17 to 583. That was the highest level
since October 2015. Increased North American shale activity could offset the impact of agreed cuts by
other major producers. OPEC and non-OPEC producers have agreed to cut output by 1.8 million barrels a
day in the first half of this year.
Oil futures finished higher on Friday, logging a weekly gain, as traders cheered signs that global supply
was beginning to tighten in wake of a planned agreement by major crude producers to cut output. News

that the U.S. imposed fresh sanctions on some Iranian individuals and entities, days after the White House
put Tehran "on notice" over a ballistic missile test, further supported gains. On the ICE Futures Exchange
in London, Brent oil for April delivery tacked on 25 cents, or about 0.5%, to settle at $ 56.81 a barrel by
close of trade Friday. Prices climbed to a four-week high of $ 57.45 in the prior session. London-traded
Brent futures scored a gain of $ 1.36, or approximately 2.4%, on the week.
Elsewhere, on the New York Mercantile Exchange, crude oil for delivery in March rose 29 cents, or
around 0.6%, to end at $53.83 a barrel by close of trade. On Thursday, Nymex futures touched a high of
$54.34, a level not seen since January 3. For the week, New York-traded oil futures gained 66 cents, or
about 1.2%, the third straight weekly rise. Oil was boosted after Russian Energy Minister Alexander
Novak said that crude producers had cut their output as agreed under a deal with OPEC, adding to signs of
compliance with a global pact to scale back production. Novak said that Russian companies might cut oil
production more quickly than required by its deal with late last year. He added that 1.4 million barrels per
day was already cut from global oil output last month as part of the deal. January 1 marked the official
start of the deal agreed by OPEC and non-OPEC member countries such as Russia in November last year
to reduce output by almost 1.8 million barrels per day to 32.5 million for the next six months. The deal, if
carried out as planned, should reduce global supply by about 2%. Futures have been trading in a narrow
range around the mid-$50s over the past month as sentiment in oil markets has been torn between hopes
that oversupply may be curbed by output cuts announced by major global producers and expectations of a
rebound in U.S. shale production. Oilfield services provider Baker Hughes said late Friday that the
number of rigs drilling for oil in the U.S. increased by 17 last week, the 13th gain in 14 weeks.
That brought the total count to 583, the most since November 2015.
The data raised concerns that the ongoing rebound in U.S. shale production could derail efforts by other
major producers to rebalance global oil supply and demand. Elsewhere on Nymex, gasoline futures for
March rose 2.0 cents, or nearly 1.4% to $ 1.553 a gallon. It ended up about 1.8% for the week. March
heating oil added 1.3 cents, or 0.8%, to finish at $ 1.665 a gallon. For the week, the fuel gained around
2.9%.
Natural gas futures for March delivery slipped 12.4 cents, or almost 4%, to $ 3.063 per million British
thermal units. It posted a weekly loss of around 9.7%. In the week ahead, market participants will eye
fresh weekly information on U.S. stockpiles of crude and refined products on Tuesday and Wednesday to
gauge the strength of demand in the world’s largest oil consumer. Traders will also continue to pay close
attention to comments from global oil producers for further evidence that they are complying with their
agreement to reduce output this year. Ahead of the coming week, Investing.com has compiled a list of
these and other significant events likely to affect the markets.
Tuesday, February 7

The American Petroleum Institute, an industry group, is to publish its weekly report on U.S. oil supplies.
Wednesday, February 8
The U.S. Energy Information Administration is to release weekly data on oil and gasoline stockpiles.
Thursday, February 9
The U.S. EIA is to produce a weekly report on natural gas supplies in storage.
Friday, February 10
Baker Hughes will release weekly data on the U.S. oil rig count.
Oil prices edged up on Monday on fears that new U.S. sanctions against Iran could be extended to start
affecting crude supplies, but markets were capped by further signs of growing U.S. production. Tensions
between Tehran and Washington have risen since a recent Iranian ballistic missile test which prompted
U.S. President Donald Trump's administration to impose sanctions on individuals and entities linked to
the Revolutionary Guards. crude futures LCOc1 , the international benchmark for oil prices, were trading
at $56.86 per barrel at 0037 GMT, up 5 cents from their last close. U.S. West Texas Intermediate futures
CLc1 were up 5 cents at $ 53.88 a barrel. Traders said the strain between Tehran and the United States
raised concerns that U.S. sanctions could be tightened further to impact Iranian oil exports, which were
only allowed to return to normal last year. "The move by the U.S. to impose new restrictions on Iran for
testing a ballistic missile ... does raise the risk of further tensions disrupting supply This was countered
somewhat by data showing another strong rise in rig activity in the U.S.," it added. U.S. energy companies
added oil rigs for a 13th week in the last 14, extending a nine-month recovery as drillers take advantage of
crude prices that have held mostly over $50 a barrel since OPEC agreed to cut supplies in late November.
Drillers added 17 oil rigs in the week to Feb. 3, bringing the total count up to 583, the most since October
2015, energy services firm Baker Hughes Inc BHI.N said on Friday. rising U.S. production, led by shale
drillers, dims efforts led by the Organization of the Petroleum Exporting Countries and other producers
like Russia to end global oversupply by cutting their output by a planned average of almost 1.8 million
barrels per day during the first half of the year. OPEC's efforts to shield its biggest and fastest growing
markets in Asia from the cuts are also undermining a rebalancing of the market, traders have said, as
OPEC cuts exports to regions in Europe and North America where demand growth is slower or where
other suppliers are more dominant. over efforts so far to re-balance the market is reflected in price
movements this year. Despite the OPEC-led cuts being enacted from the beginning of 2017, Brent crude
futures are 2.6 percent below their peaks in early January.

BASE METAL’S OUTLOOK :
BASE METAL GUIDE -
Trading Ideas:
NICKEL✍
Nickel trading range for the day is 684.3-725.9.
Nickel gained as investors piled into risky assets after U.S. President Trump calmed international
tensions by affirming the "one-China" policy.
Nickel was said to be in a supply deficit last year of 209,000 metric tons and is projected to remain in
deficit this year to the tune of 188,000 mt.
Nickel ore inventories at seven major Chinese ports tumbled in the week ending February 10 when
compared with the level before the 2017 Chinese New Year holiday.
ZINC✍
Zinc trading range for the day is 187-201.4.
Zinc gained on prospects for rising demand from China's steel industry after the country reported a
near-record volume of iron ore imports in January.
Prices were also boosted after China reported better-than-expected trade data for January as demand
picked up both at home and abroad.
Combined zinc inventories in Shanghai, Tianjin and Guangdong added 15,300 to 295,000 tonnes this
past week.
COPPER ✍
Copper trading range for the day is 384.8-420.4.
Copper prices rallied as LME prices jumped above $6000 on talk of BHP Billiton declaring force
majeure on shipments from its Escondida mine in Chile.
Freeport had said that it would scale back output at Grasberg, but Indonesia's mining ministry said the
company could apply immediately to restart exports that were stopped on Jan. 12.

China reported better-than-expected trade data for January as demand picked up both at home and
abroad, an encouraging start to 2017
BASE METAL
✍ ZINC
The base metal traded higher by 0.74 per cent to Rs 190.45 per kg as traders enlarged positions following
uptick in demand in the spot markets coupled with a firm trend at the London Metal Exchange. At the
Multi Commodity Exchange, zinc for delivery in March traded higher by Rs 1.40, or 0.74 per cent, to Rs
190.45 per kg, in a business turnover of 101 lots. Likewise, the metal for delivery in February edged up
by Rs 1.35, or 0.72 per cent, to Rs 190.10 per kg in 2,540 lots. Market analysts attributed the rise in zinc
futures to a firm trend at spot market on pick up in demand from consuming industries and a firming trend
in the base metals pack overseas.
LEAD ✍
Amid a firming trend at the spot market on rising demand from battery makers, lead rose 0.70 per cent to
Rs 157.35 per kg in futures trade as speculators built up positions. Furthermore, a firming trend in base
metals overseas supported the upside in metal prices. At the Multi Commodity Exchange, lead for
delivery in March was up Rs 1.10, or 0.70 per cent, at Rs 157.35 per kg, in a business turnover of one lot.
Likewise, the metal for delivery in current month traded up by Rs 1.05, or 0.67 per cent, at Rs 156.80 per
kg in 332 lots. According to market analysts, rising demand from battery makers at spot markets and
strength in base metals at the London Metal Exchange helped lead futures trade higher.
NICKEL ✍
Prices moved up by Rs 6.40 to Rs 692.70 per kg in futures market as speculators raised their bets amid a
firming trend overseas and spot demand. At the Multi Commodity Exchange, nickel for delivery in
February gained Rs 6.40, or 0.93 per cent, to Rs 692.70 per kg, in a business turnover of 1,326 lots. The
metal for delivery in March also rose by a similar margin to trade at Rs 698.10 per kg in 38 lots. Analysts
said apart from increased domestic demand from alloy-makers, firmness in copper and other base metals
at the London Metal Exchange, influenced nickel prices at futures trade.
COPPER ✍
Copper futures traded 0.28 per cent higher at Rs 391.70 per kg on the back of a firm overseas trend and
increased domestic demand. At the Multi Commodity Exchange, copper for delivery in February traded

higher by Rs 1.10, or 0.28 per cent, to Rs 391.70 per kg, in a business turnover of 667 lots. The metal for
delivery in far-month April edged up by 90 paise, or 0.23 per cent, to Rs 395.75 per kg in 12 lots.
Globally, copper for delivery in three months advanced 1.7 per cent to settle at USD 5,895 per tonne at
the London Metal Exchange in yesterday's trade. Market analysts said besides increased demand from
consuming industries, a firm trend in base metals at the LME as strengthening prospects of disruptions at
the world's two largest mines threatened to send the market into a global shortage, mainly influenced
copper prices at futures trade.
ALUMINIUM ✍
To safeguard the interests of domestic aluminium industry, the government may soon take some steps
including imposing of anti-dumping duties or minimum import price in wake of rising imports of
downstream aluminium products in the country. "Aluminium industry has faced a lot of stress in the last
one year. I believe aluminium has huge potential in India. Our neighbouring countries are giving 13 per
cent subsidy to downstream aluminium products and helping them to dump those in India," Power, Coal
and Mines Minister Piyush Goyal said on Friday. "I have had a conversation with the aluminium industry.
I found the imports of downstream products in India has gone up, which impacts both the primary
manufacturers and the entire industry.
ZINC ✍
Zinc prices drifted lower by 0.37 per cent to Rs 176.35 per kg in futures trade as traders engaged in
trimming their positions, taking negative cues from spot market on fall in demand from consuming
industries. At the Multi Commodity Exchange, zinc for delivery in January declined by 65 paise, or 0.37
per cent, to Rs 176.35 per kg in a business turnover of 477 lots. In a similar fashion, the metal for delivery
in February shed 40 paise, or 0.23 per cent, to Rs 176.85 per kg in 2 lots. Market analysts said offloading
of positions by participants owing to slackened demand from consuming industries in the spot market,
kept zinc prices down at futures trade.
NCDEX - WEEKLY MARKET REVIEW
FUNDAMENTALS –
SUGAR ✍
Sugar prices climbed up by Rs. 60 per quintal to trade at nearly six-year high at the wholesale market in
the national capital today following tight stocks positions amid speculative buying by stockists and bulk
consumers. Marketmen said apart from tight stocks position in the market following pause in supplies by
mills, robust demand from bulk consumers and stockists, lifted the sweetener prices to almost six-year

high. Moreover, lower output estimates by Indian Sugar Merchant Association (ISMA), too fulled surge
in sugar prices, they added.
CHANA ✍
Rabi crop planting is 6% higher than last year, official data show, signalling a bumper harvest, moderate
prices and lesser dependence on imports if the weather remains favourable. Farmers have planted wheat in
318 lakh hectares, 7% higher than last year, which can raise output close to a record, officials said. Cargill
India chairman Siraj Chaudhry said higher planting shows the situation is returning to normal after a good
monsoon. “Dependence on imports of pulses and wheat was triggered due to failure of planting and crop
loss due to drought. That should not happen this year,“ he said.
SOYABEAN ✍
Steady conditions persisted in major edible oils in Vidarbha region of Western Maharashtra as oil prices
hovered around previous day's level on small bouts of trading. Absence of buying interest and easy
condition on Madhya Pradesh oil market mainly kept prices unchanged. A majority of traders adopted
wait and watch move because of weak international edible oil prices, sources said Monday.
Barring a sharp fall in rapeseed oil, major edible oil prices today generally ruled flat in the Vidarbha
region of Western Maharashtra in the absence of any worthwhile trading activity. Slackness in demand
from millers and retailers against adequate stocks mainly pulled rapeseed oil prices down. Release of
stock from stockists also pushed down this oil. Trading activity in major edible oils reported weak as no
trader was in mood for any commitment because of good rise in international oil prices, sources said
Wednesday.
WHEAT ✍
Indian wheat futures fell for a second day this week on Tuesday, as data released on Friday showed higher
planting compared with last year. Winter wheat planting in India this year was up about 7 percent at 31.78
million hectares as of Friday, government data showed. February wheat futures NWTG7 settled 0.6
percent lower on the National Commodity & Derivatives Exchange Ltd at 1,771 rupees on Tuesday.
The March sugar futures NSMH7 , which rose to its highest level in 2017 on Monday, fell 0.8 percent in
light trading to 3,899 rupees as of 1220 GMT.
COTTON ✍

Indian cotton exporters have cancelled orders for around 25,000 bales and postponed shipments of about
200,000 bales by up to a month after a supply shortage pushed up local prices, industry officials told
Reuters.
The move by the world's biggest cotton producer is likely to help rival suppliers like Brazil, the United
States and some African countries boost exports, with some India textile mills even starting to import
cheaper fibre from overseas. "Exporters had signed contracts at around 75 cents (per lb) in December and
January. Now (local) prices have shot up to 84 cents. They could not fulfill the orders," said an exporter
based in Mumbai, adding that contracts to export nearly 25,000 bales to Pakistan and Bangladesh have
been cancelled. Raw cotton supplies usually peak in India between December and February, pushing
down prices. This year, local prices MCOTc2 have jumped more than 10 percent over the past two
months, with farmers now delaying cotton sales in expectation of further price rises. "Limited supplies in
spot markets forced some exporters to delay shipments. They are delaying shipments by 15 days to one
month," said Chirag Patel, chief executive of Indian exporter Jaydeep Cotton Fibers.
WHEAT ✍
U.S. wheat supplies were seen shrinking below market estimates as the export outlook brightened despite
ample global stocks and a firm dollar that had been seen as a brake on overseas demand, the U.S.
Agriculture Department said on Thursday. Domestic corn stocks also were seen falling below the
government's previous outlook as ethanol makers ramped up production, USDA said in its monthly
supply and demand report. U.S. wheat ending stocks for the 2016/17 marketing year were pegged at 1.139
billion bushels, down from the January estimate of 1.186 billion bushels and below market forecasts that
ranged from 1.145 billion to 1.211 billion bushels. Domestic corn ending stocks were lowered to 2.320
billion bushels from 2.355 billion. The USDA left its outlook for 2016/17 domestic soybean ending stocks
unchanged at 420 million bushels. It also held its forecast for U.S. soy exports steady at 2.050 billion
bushels despite a fast pace of shipments through January.
"Competition from expected record South American exports will limit U.S. shipments to well below last
year's record level this summer," USDA said in the report.
MENTHA OIL✍
Mentha oil prices fell by 0.42 per cent to Rs 1,028 per kg in futures trade as speculators trimmed their
positions, driven by a sluggish demand from consuming industries at the spot market. At the Multi
Commodity Exchange, mentha oil for delivery this month declined by Rs 4.40, or 0.42 per cent, to Rs
1,028 per kg, in a business turnover of 209 lots. On similar lines, the oil for delivery in March traded
lower by Rs 4.20, or 0.40 per cent, to Rs 1,038.60 per kg in 48 lots. Analysts said offloading of positions
by participants on the back of subdued demand from consuming industries in spot market against ample

stocks position on higher supplies from Chandausi in Uttar Pradesh mainly led to the decline in mentha
oil prices at futures trade.
CRUDE PALM OIL✍
Crude palm oil prices were up by 0.22 per cent to Rs 583.40 per 10 kg in futures trade as speculators
indulged in enlarging positions, driven by a firm demand at the spot market. Besides, a firming trend in
overseas markets supported the uptrend. At the Multi Commodity Exchange, crude palm oil for delivery
in February rose by Rs 1.30, or 0.22 per cent, to Rs 583.40 per 10 kg, in a business turnover of 208 lots.
Similarly, the oil for delivery in March went up by Rs 1.10, or 0.19 per cent, to Rs 573.20 per 10 kg in 24
lots. Analysts said widening of positions by participants driven by pick up in demand in the spot market
against tight stocks position on restricted supplies from producing regions mainly kept crude palm oil
prices higher at futures trade.
CARDAMOM✍
Cardamom futures fell by one per cent to Rs 1,479.50 per kg as traders trimmed their holdings amid
sluggish spot demand. Besides, adequate stocks position following increased arrivals from producing
regions also fuelled the downtrend. At the Multi Commodity Exchange, cardamom for delivery in March
eased by Rs 14.90, or one per cent, to Rs 1,479.50 per kg, in a business turnover of 56 lots. The spice for
delivery in April was down by Rs 10.80, or 0.72 per cent, to Rs 1,495 per kg, with a trading volume of
just two lots. Analysts said offloading of positions by participants owing to a weak trend at spot market on
subdued demand mainly put pressure on cardamom prices at futures trade.
SOYABEAN✍
The slide in rapeseed oil in non-edible section, continued unabated in Vidarbha region of Western
Maharashtra for second day today on persistent selling by stockists amid good supply from producing
regions and weak trends in producing regions. Sentiment turned bearish because of release of stock from
stockists. Trading activity in other edible reported weak because of healthy rise in overseas oil prices,
according to sources.
WHEAT ✍
Bangladesh's state grains buyer expects to import a total of around 250,000 tonnes wheat in the 2016/17
financial year ending June, about half the quantity it expected to import earlier. It has already agreed to
ship in 200,000 tonnes in its first government-to-government deal with Russia, with the first cargo of

55,000 tonnes arriving next week, the agency's head said on Friday. Bangladesh, South Asia's top wheat
buyer, has turned to the Black Sea region for wheat as supply from India dwindled. grains agency is also
looking to take delivery of another 50,000 tonnes that was bought in an earlier tender. "After this ... we
don't need to procure more wheat from international markets," Badrul Hasan, the head of the state grains
agency told Reuters, adding that this was due to stable local prices. No tender for wheat purchases will be
floated over the next few months, he said. Typically, the government imports more wheat to replenish
stockpiles, as it increases market supply whenever prices go up. Such procurement is crucial for the South
Asian nation to feed its poor and keep domestic prices stable. Bangladesh's rice and wheat reserves have
fallen to nearly 900,000 tonnes as of end-January, from 1.5 million tonnes during the same period a year
ago, due to less imports.
The government is also handing out cash instead of wheat or rice to the poor as part of some welfare
schemes, Hasan said, implying lower imports of the grains.
COTTON✍
Indian cotton exporters have cancelled orders for around 25,000 bales and postponed shipments of about
200,000 bales by up to a month after a supply shortage pushed up local prices, industry officials told
Reuters. The move by the world's biggest cotton producer is likely to help rival suppliers like Brazil, the
United States and some African countries boost exports, with some India textile mills even starting to
import cheaper fibre from overseas. "Exporters had signed contracts at around 75 cents in December and
January. Now prices have shot up to 84 cents. They could not fulfil the orders," said an exporter based in
Mumbai, adding that contracts to export nearly 25,000 bales to Pakistan and Bangladesh have been
cancelled. Raw cotton supplies usually peak in India between December and February, pushing down
prices. This year, local prices MCOTc2 have jumped more than 10 percent over the past two months, with
farmers now delaying cotton sales in expectation of further price rises. "Limited supplies in spot markets
forced some exporters to delay shipments. They are delaying shipments by 15 days to one month.
SUGAR ✍
Sugar prices climbed up by Rs 60 per quintal to trade at nearly six-year high at the wholesale market in
the national capital today following tight stocks positions amid speculative buying by stockists and bulk
consumers. Marketmen said apart from tight stocks position in the market following pause in supplies by
mills, robust demand from bulk consumers and stockists, lifted the sweetener prices to almost six-year
high. Moreover, lower output estimates by Indian Sugar Merchant Association, too fulled surge in sugar
prices, they added.

LEGAL DISCLAIMER
This Document has been prepared by Ways2Capital (A Division of High Brow Market Research
Investment Advisor Pvt Ltd). The information, analysis and estimates contained herein are based on
Ways2Capital Equity/Commodities Research assessment and have been obtained from sources believed
to be reliable. This document is meant for the use of the intended recipient only. This document, at best,
represents Ways2Capital Equity/Commodities Research opinion and is meant for general information
only. Ways2Capital Equity/Commodities Research, its directors, officers or employees shall not in any
way to be responsible for the contents stated herein. Ways2Capital Equity/Commodities Research
expressly disclaims any and all liabilities that may arise from information, errors or omissions in this
connection. This document is not to be considered as an offer to sell or a solicitation to buy any securities
or commodities.
All information, levels & recommendations provided above are given on the basis of technical &
fundamental research done by the panel of expert of Ways2Capital but we do not accept any liability for
errors of opinion. People surfing through the website have right to opt the product services of their own
choices.
Any investment in commodity market bears risk, company will not be liable for any loss done on these
recommendations. These levels do not necessarily indicate future price moment. Company holds the right
to alter the information without any further notice. Any browsing through website means acceptance of
disclaimer.
DISCLOSURE

High Brow Market Research Investment Advisor Pvt. Ltd. or its associates does not do business with
companies covered in research report nor is associated in any manner with any issuer of products/
securities, this ensures that there is no actual or potential conflicts of interest. To ensure compliance with
the regulatory body, we have resolved that the company and all its representatives will not make any
trades in the market.
Clients are advised to consider information provided in the report as opinion only & make investment
decision of their own. Clients are also advised to read & understand terms & conditions of services
published on website. No litigations have been filed against the company since the incorporation of the
company.
Disclosure Appendix:
The reports are prepared by analysts who are employed by High Brow Market Research Investment
Advisor Pvt. Ltd. All the views expressed in this report herein accurately reflects personal views about the
subject company or companies & their securities and no part of compensation was, is or will be directly or
indirectly related to the specific recommendations or views contained in this research report.
Disclosure in terms of Conflict of Interest:
(a) High Brow Market Research Pvt. Ltd. or his associate or his relative has no financial interest in the
subject company and the nature of such financial interest;
(b) High Brow Market Research Pvt. Ltd. or its associates or relatives, have no actual/beneficial
ownership of one percent or more in the securities of the subject company,
(c) High Brow Market Research Pvt. Ltd. or its associate has no other material conflict of interest at the
time of publication of the research report or at the time of public appearance;
Disclosure in terms of Compensation:
High Brow Market Research Investment Advisor Pvt. Ltd. policy prohibits its analysts, professionals
reporting to analysts from owning securities of any company in the analyst's area of coverage.
Analyst compensation: Analysts are salary based permanent employees of High Brow Market Research
Pvt. Ltd.
Disclosure in terms of Public Appearance:
(a) High Brow Market Research Pvt. Ltd. or its associates have not received any compensation from the
subject company in the past twelve months;
(b) The subject company is not now or never a client during twelve months preceding the date of
distribution of the research report.
(c) High Brow Market Research Pvt. Ltd. or its associates has never served as an officer, director or
employee of the subject company;
(d) High Brow Market Research Pvt. Ltd. has never been engaged in market making activity for the
subject company.