part 4 quantitative risk assessment - … · part 4 quantitative risk assessment ... § where/when...
TRANSCRIPT

innovative ● entrepreneurial ● globalwww.utm.my
PART 4 QUANTITATIVE RISK ASSESSMENT
Prof. Arshad AhmadEmail: [email protected]

innovative ● entrepreneurial ● globalwww.utm.my
Content
§ QRA Procedure§ Consequence & Impact Analysis§ Risk Computation§ Tolerability Criteria§ Risk Mitigation & Management
2

innovative ● entrepreneurial ● globalwww.utm.my innovative ● entrepreneurial ● globalwww.utm.my
QRA Procedures
innovative ● entrepreneurial ● globalwww.utm.my
What is QRA
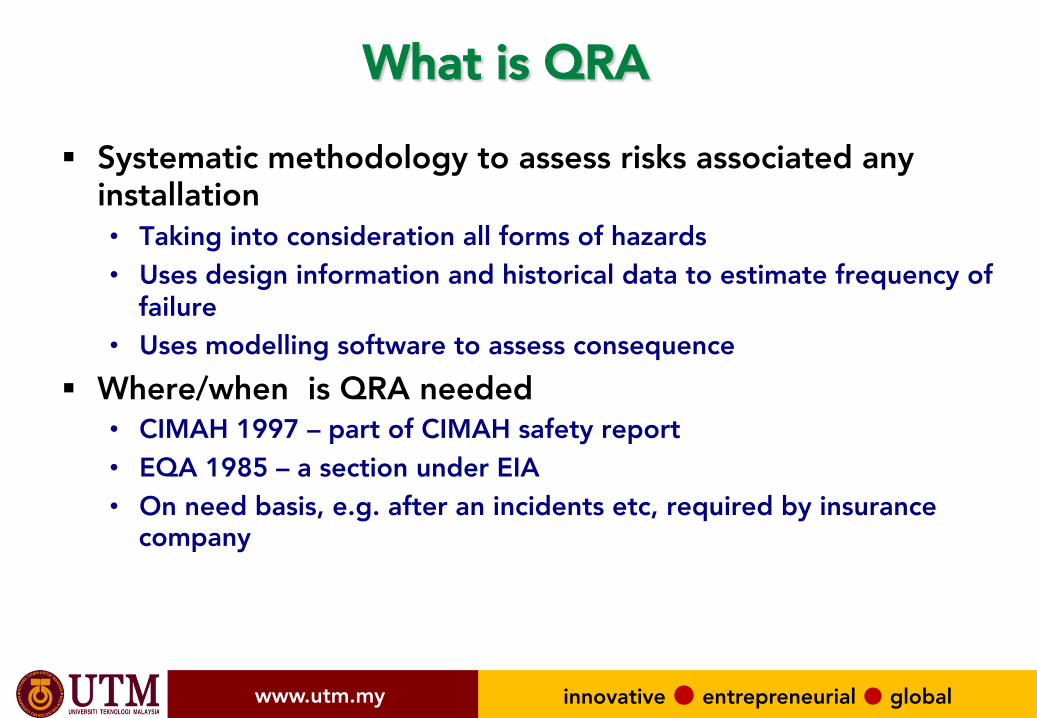
§ Systematic methodology to assess risks associated any installation• Taking into consideration all forms of hazards• Uses design information and historical data to estimate frequency of
failure• Uses modelling software to assess consequence
§ Where/when is QRA needed• CIMAH 1997 – part of CIMAH safety report• EQA 1985 – a section under EIA• On need basis, e.g. after an incidents etc, required by insurance
company

innovative ● entrepreneurial ● globalwww.utm.my
Definition of Risks
Risk = Severity x Likelihood
• Extent of Damage• Fatality • Injuries• Losses
• Analysis based on design and modeling equations
• Likelihood of event• Based of failure frequency of process components
• Analysis based on manufacturer’s and historical data

innovative ● entrepreneurial ● globalwww.utm.my
QRA General MethodologyHazard Identification
Frequency Analysis
Consequence Analysis
Risk Estimation and Evaluation
Risk Management
innovative ● entrepreneurial ● globalwww.utm.my
1 - Hazard Identification
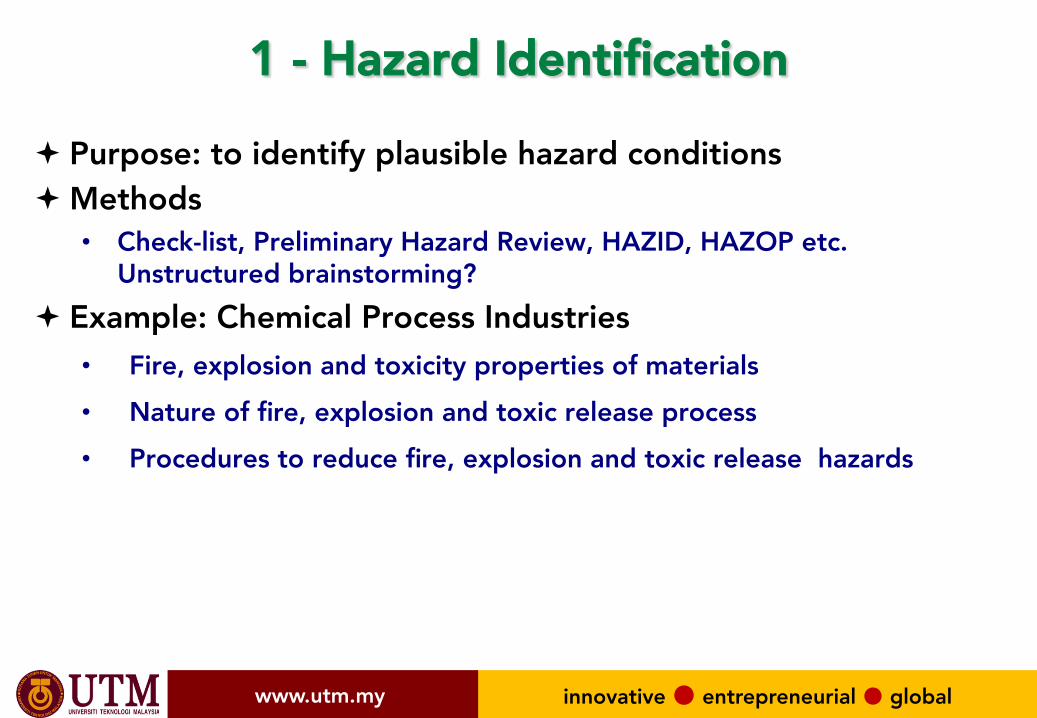
ª Purpose: to identify plausible hazard conditions ª Methods
• Check-list, Preliminary Hazard Review, HAZID, HAZOP etc. Unstructured brainstorming?
ª Example: Chemical Process Industries• Fire, explosion and toxicity properties of materials • Nature of fire, explosion and toxic release process • Procedures to reduce fire, explosion and toxic release hazards
innovative ● entrepreneurial ● globalwww.utm.my
2 - Frequency Analysisª Purpose: To estimate the likelihood for a hazard scenario to
occurª Methods
• Fault Tree Analysis, Event Tree Analysis
innovative ● entrepreneurial ● globalwww.utm.my
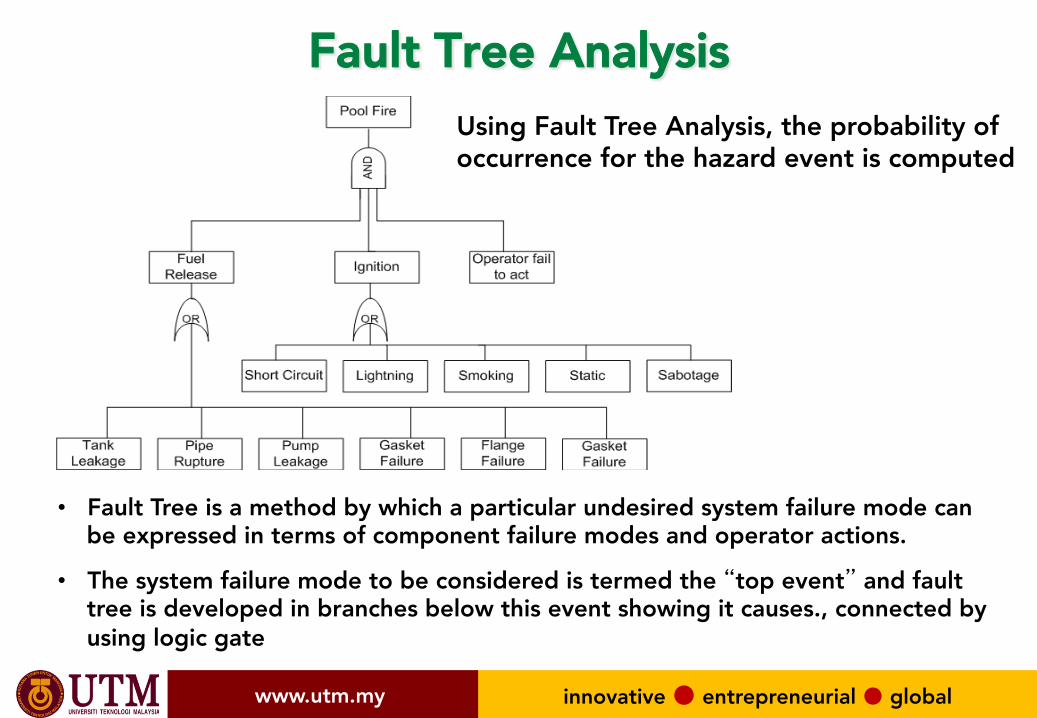
Fault Tree AnalysisUsing Fault Tree Analysis, the probability of occurrence for the hazard event is computed
• Fault Tree is a method by which a particular undesired system failure mode can be expressed in terms of component failure modes and operator actions.
• The system failure mode to be considered is termed the “top event” and fault tree is developed in branches below this event showing it causes., connected by using logic gate
innovative ● entrepreneurial ● globalwww.utm.my
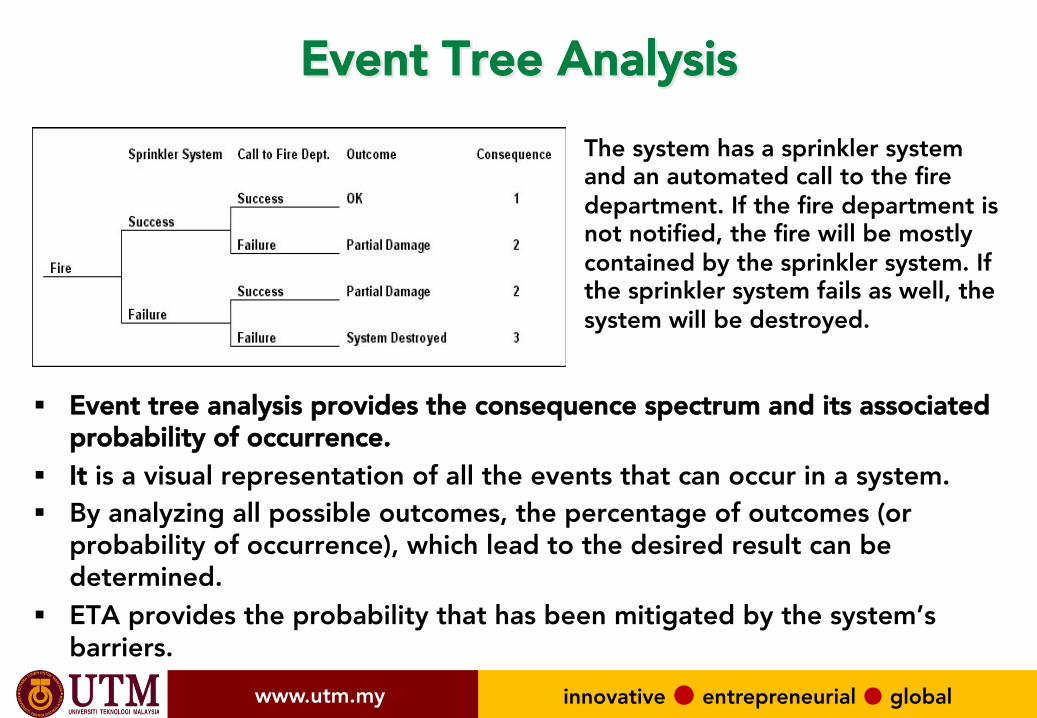
Event Tree Analysis
§ Event tree analysis provides the consequence spectrum and its associated probability of occurrence.
§ It is a visual representation of all the events that can occur in a system.§ By analyzing all possible outcomes, the percentage of outcomes (or
probability of occurrence), which lead to the desired result can be determined.
§ ETA provides the probability that has been mitigated by the system’s barriers.
The system has a sprinkler system and an automated call to the fire department. If the fire department is not notified, the fire will be mostly contained by the sprinkler system. If the sprinkler system fails as well, the system will be destroyed.
innovative ● entrepreneurial ● globalwww.utm.my
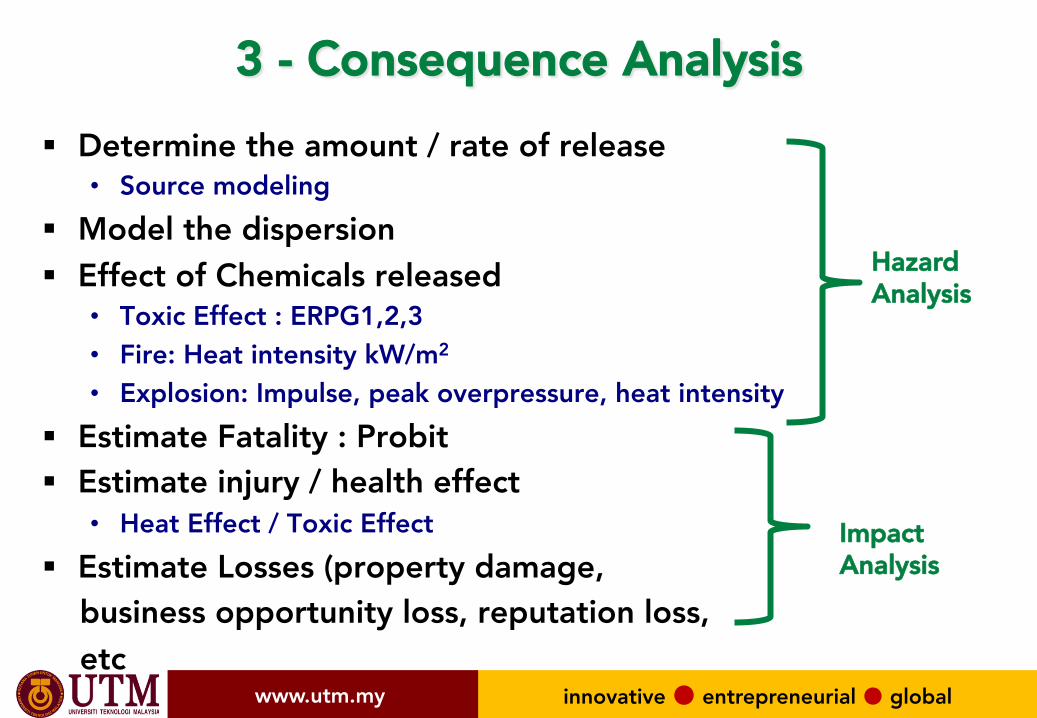
3 - Consequence Analysis§ Determine the amount / rate of release
• Source modeling§ Model the dispersion§ Effect of Chemicals released
• Toxic Effect : ERPG1,2,3• Fire: Heat intensity kW/m2
• Explosion: Impulse, peak overpressure, heat intensity§ Estimate Fatality : Probit§ Estimate injury / health effect
• Heat Effect / Toxic Effect§ Estimate Losses (property damage, business opportunity loss, reputation loss, etc
Hazard Analysis
Impact Analysis
innovative ● entrepreneurial ● globalwww.utm.my
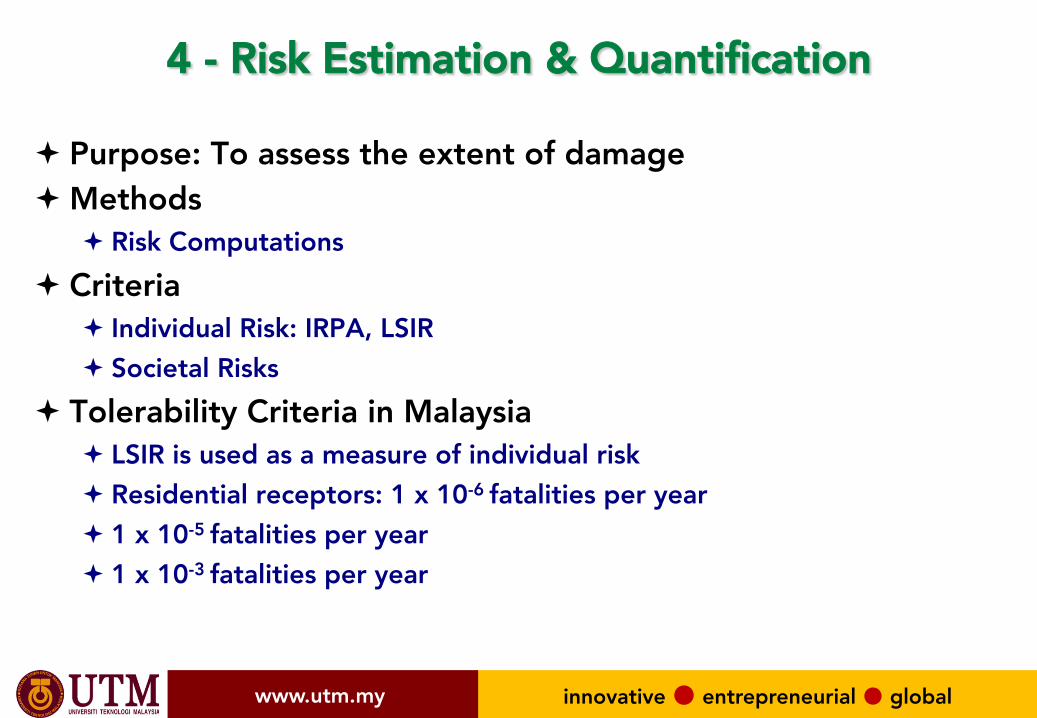
4 - Risk Estimation & Quantification
ª Purpose: To assess the extent of damageª Methods
ª Risk Computationsª Criteria
ª Individual Risk: IRPA, LSIRª Societal Risks
ª Tolerability Criteria in Malaysiaª LSIR is used as a measure of individual riskª Residential receptors: 1 x 10⁻⁶ fatalities per yearª 1 x 10⁻⁵ fatalities per yearª 1 x 10⁻³ fatalities per year
innovative ● entrepreneurial ● globalwww.utm.my
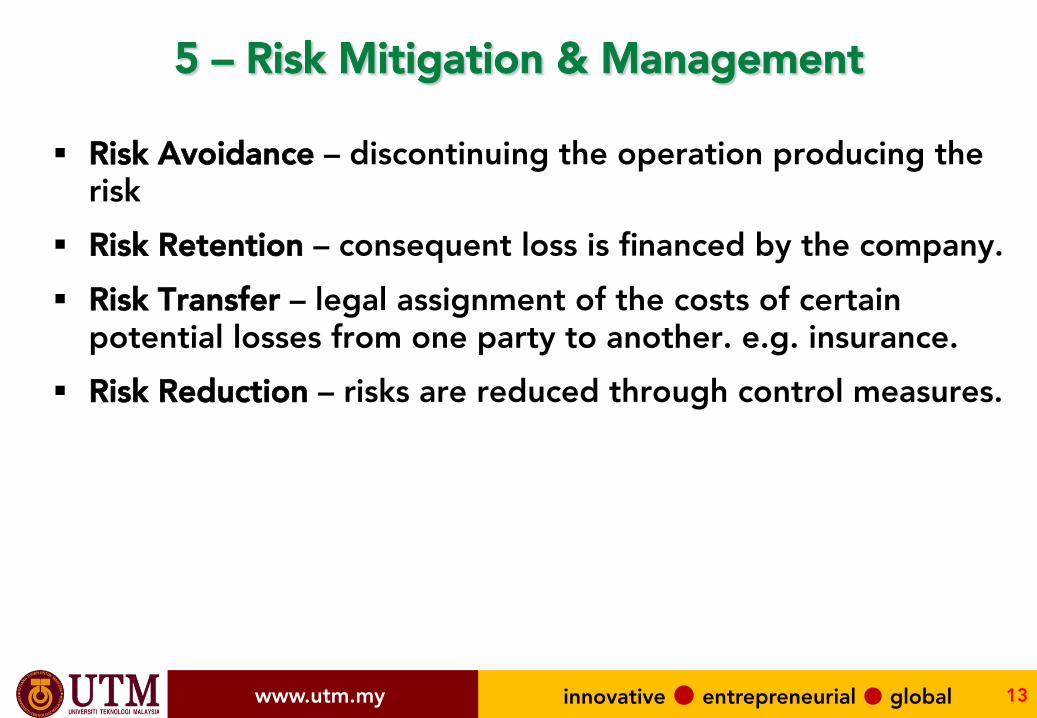
5 – Risk Mitigation & Management
§ Risk Avoidance – discontinuing the operation producing the risk
§ Risk Retention – consequent loss is financed by the company. § Risk Transfer – legal assignment of the costs of certain
potential losses from one party to another. e.g. insurance.§ Risk Reduction – risks are reduced through control measures.
13

innovative ● entrepreneurial ● globalwww.utm.my innovative ● entrepreneurial ● globalwww.utm.my
CONSEQUENCE & IMPACT ANALYSIS

innovative ● entrepreneurial ● globalwww.utm.my
Dose-Response Analysis
§ Dose response relationships has been used to estimate the impact of a precurser
§ It is widely used to estimate effect of drugs on biological system§ It has also been used to estimate fatality or damages caused by undesired
events
15

innovative ● entrepreneurial ● globalwww.utm.my
Probit Analysis§ The dose level of the various hazard events against fatality, or
other consequences can be conveniently determined using Probit Analysis.
§ It is a graphical and Look-up Table approach to determine probability of fatality
§ The probit variable Y is computed from:
Y = k1 + k2 ln V§ Values of constants k1, k2 and causative variable V
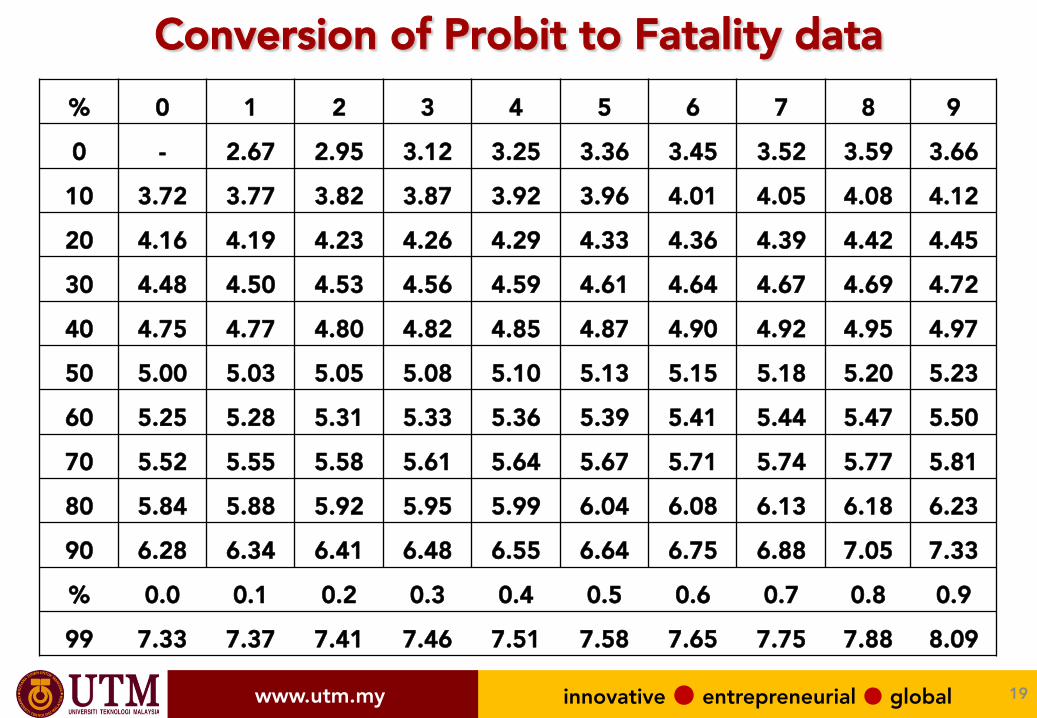
(representing the dose) are given in table§ Once the probit is obtained, it can be converted into %
fatality
16

innovative ● entrepreneurial ● globalwww.utm.my
Probit: Toxic Release
17
Causative variable, (C is concentration in ppm, T is time in minutes)
Probit Parameters
Type of Injury a k1 k2
Ammonia Death 2.0 -35.9 1.85Carbon Monoxide Death 1.0 -37.98 3.7Chlorine Death 2.0 -8.29 0.92Ethylene Oxide Death 1.0 -6.19 1.0Hydrogen Chloride Death 1.0 -16.85 2.0Nitrogen Dioxide Death 2.0 -13.79 1.4Phosgene Death 1.0 -19.27 3.69Propylene Oxide Death 2.0 -7.42 0.51Sulfur Dioxide Death 1.0 -15.67 1.0Toluene 2.5 -6.79 0.41
V = Ca∑ T

innovative ● entrepreneurial ● globalwww.utm.my
Probit: Fire and ExplosionType of injury or damage Causative
variable (V)
Probit parameters
k1 k2
Fire
Burn deaths from flash fire
Burn deaths from pool burning
Explosion
Deaths from lung haemorrhage
Eardrum ruptures
Deaths from impact
Injuries from impact
Injuries from flying fragments
Structural damages
Glass breakage
po
po
J
J
J
p0
p0
-14.9
-14.9
-77.1
-15.6
-46.1
-39.1
-27.1
-23.8
-18.1
2.56
2.56
6.91
1.93
4.82
4.45
4.26
2.92
2.79
18
Here, te is the effective time duration (s), t is the time duration of pool burning (sec), Ie is the effective radiation intensity (W/m2), I is the radiation intensity from pool burning (W/m2), te is the effective time duration (s), po is peak overpressure (N/m2), J is impulse (Ns/m2), C is concentration (ppm) and T is time interval (min).
teIe4 / 3 /104
t Ie4 / 3 /104
innovative ● entrepreneurial ● globalwww.utm.my
Conversion of Probit to Fatality data
19
% 0 1 2 3 4 5 6 7 8 9
0 - 2.67 2.95 3.12 3.25 3.36 3.45 3.52 3.59 3.66
10 3.72 3.77 3.82 3.87 3.92 3.96 4.01 4.05 4.08 4.12
20 4.16 4.19 4.23 4.26 4.29 4.33 4.36 4.39 4.42 4.45
30 4.48 4.50 4.53 4.56 4.59 4.61 4.64 4.67 4.69 4.72
40 4.75 4.77 4.80 4.82 4.85 4.87 4.90 4.92 4.95 4.97
50 5.00 5.03 5.05 5.08 5.10 5.13 5.15 5.18 5.20 5.23
60 5.25 5.28 5.31 5.33 5.36 5.39 5.41 5.44 5.47 5.50
70 5.52 5.55 5.58 5.61 5.64 5.67 5.71 5.74 5.77 5.81
80 5.84 5.88 5.92 5.95 5.99 6.04 6.08 6.13 6.18 6.23
90 6.28 6.34 6.41 6.48 6.55 6.64 6.75 6.88 7.05 7.33
% 0.0 0.1 0.2 0.3 0.4 0.5 0.6 0.7 0.8 0.9
99 7.33 7.37 7.41 7.46 7.51 7.58 7.65 7.75 7.88 8.09

innovative ● entrepreneurial ● globalwww.utm.my
Thermal Dose for Fire Exposure
Thermal Dose (kJ/m2)
Type of Injury
40 Threshold of pain
100 Sunburn (first degree burn)
150 Blisters (Second-degree burn)
250 1 % fatal (third degree burn)
500 50 % fatal (third degree burn)
1200 99 % fatal (third degree burn)

innovative ● entrepreneurial ● globalwww.utm.my
Effect of Thermal Radiation on Structures (TNO, 1992)
Type of Damage Damage Level 1 (radiation intensity, kW/
m2)
Damage Level 2 (radiation intensity, kW/
m2)
Steel 100 25
Wood 15 2
Synthetic Materials
15 2
Glass 4 -
Damage Level 1 – Surfaces of exposed materials catch fire and structural elements collapse or rupture Damage Level 2 - Surfaces of exposed experience serious decoloration as well as peeling and structural elements undergo substantial deformation

innovative ● entrepreneurial ● globalwww.utm.my
Thermal Radiation Limits on Structure (Lees, 1996)
Radiation intensity (kW/m2)
Limit Description (Design Guidance by Dinneno, 1982)
30 Spontaneous ignition of wood
20 Ignition of No 2 fuel oil in 40 seconds
10 Ignition of No 2 fuel oil in 120 second
18-20 Cable insulation degrades
12 Plastic melts
37.5 Equipment damage
9 Equip. damage (conservative value used in flare design)
innovative ● entrepreneurial ● globalwww.utm.my
Toxic Effect Criteria
§ What Concentration are considered dangerous? • PEL, TLV etc designed for workers are overly conservative – designed
for long-term exposure, not for short-term, emergency condition
§ For design of ERP, the ERPG, SPEGL, AEGL are directly relevant for general public

innovative ● entrepreneurial ● globalwww.utm.my
Protective Action CriteriaAcute Exposure Guideline Levels (AEGLs)
§ Estimate the concentrations at which most people (including sensitive individuals) begin to experience health effects if they are exposed to a hazardous chemical for a specific length of time
§ In November 2011, the National Advisory Committee for AEGLs was eliminated and the AEGL development process was modified
§ Future development work on the AEGLs will focus on finalizing interim AEGLs through the National Academy of Sciences
§ Derived from extensive reviews of animal and human studies§ As of early 2012, about 70 substances have final AEGLs and nearly 200
substances have interim AEGLs§ Three tiers are developed for five exposure periods: 10 minutes, 30
minutes, 60 minutes, 4 hours, and 8 hours
innovative ● entrepreneurial ● globalwww.utm.my
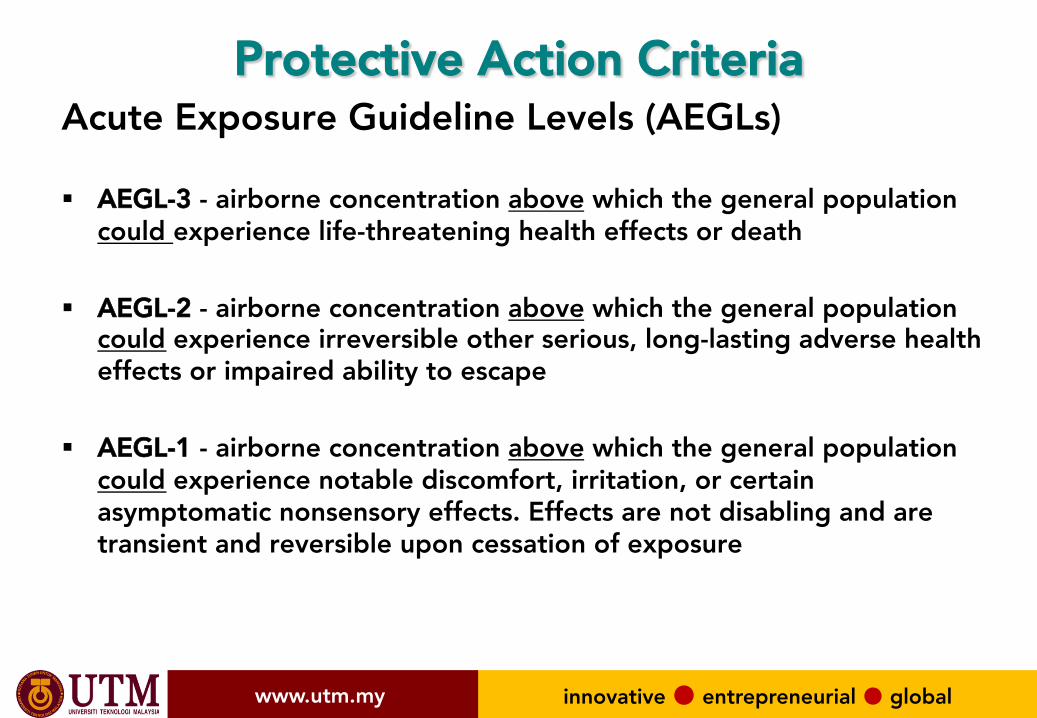
Protective Action CriteriaAcute Exposure Guideline Levels (AEGLs)
§ AEGL-3 - airborne concentration above which the general population could experience life-threatening health effects or death
§ AEGL-2 - airborne concentration above which the general population could experience irreversible other serious, long-lasting adverse health effects or impaired ability to escape
§ AEGL-1 - airborne concentration above which the general population could experience notable discomfort, irritation, or certain asymptomatic nonsensory effects. Effects are not disabling and are transient and reversible upon cessation of exposure

innovative ● entrepreneurial ● globalwww.utm.my
Protective Action CriteriaEmergency Response Planning Guidelines (ERPGs)
§ Estimate the concentrations at which most people (excluding sensitive individuals) will begin to experience health effects if they are exposed to a hazardous airborne chemical for 1 hour
§ Developed by the Emergency Response Planning committee of the American Industrial Hygiene Association
§ Derived from extensive reviews of animal and human studies
§ As of early 2012, about 145 chemicals have ERPGs
innovative ● entrepreneurial ● globalwww.utm.my
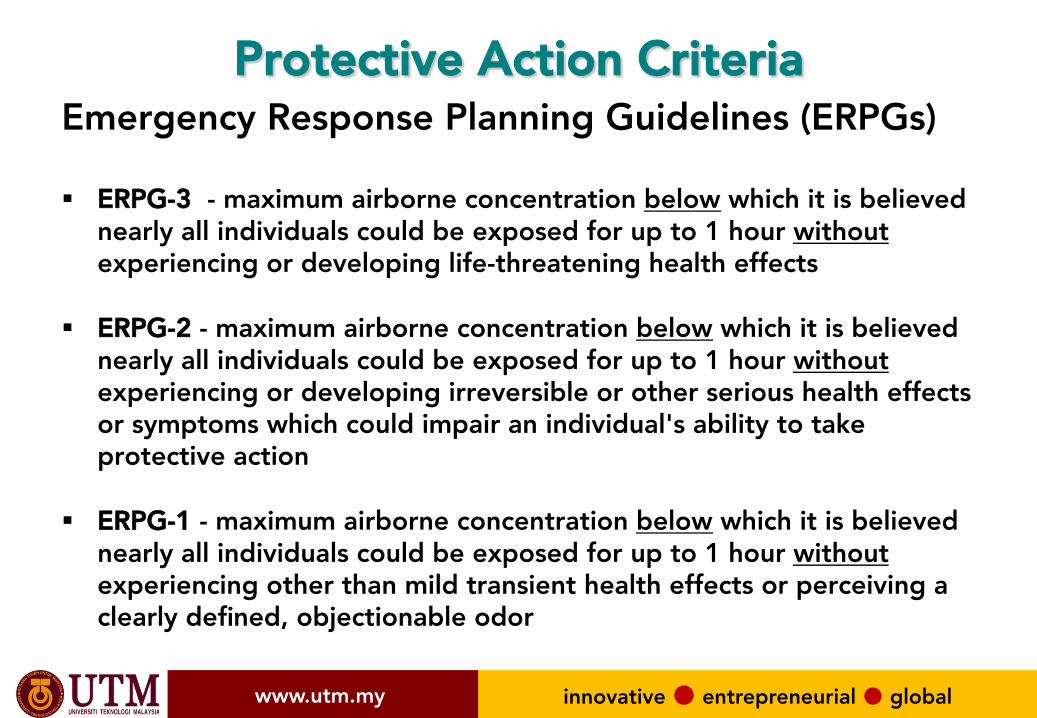
Protective Action CriteriaEmergency Response Planning Guidelines (ERPGs)
§ ERPG-3 - maximum airborne concentration below which it is believed nearly all individuals could be exposed for up to 1 hour without experiencing or developing life-threatening health effects
§ ERPG-2 - maximum airborne concentration below which it is believed nearly all individuals could be exposed for up to 1 hour without experiencing or developing irreversible or other serious health effects or symptoms which could impair an individual's ability to take protective action
§ ERPG-1 - maximum airborne concentration below which it is believed nearly all individuals could be exposed for up to 1 hour without experiencing other than mild transient health effects or perceiving a clearly defined, objectionable odor
innovative ● entrepreneurial ● globalwww.utm.my
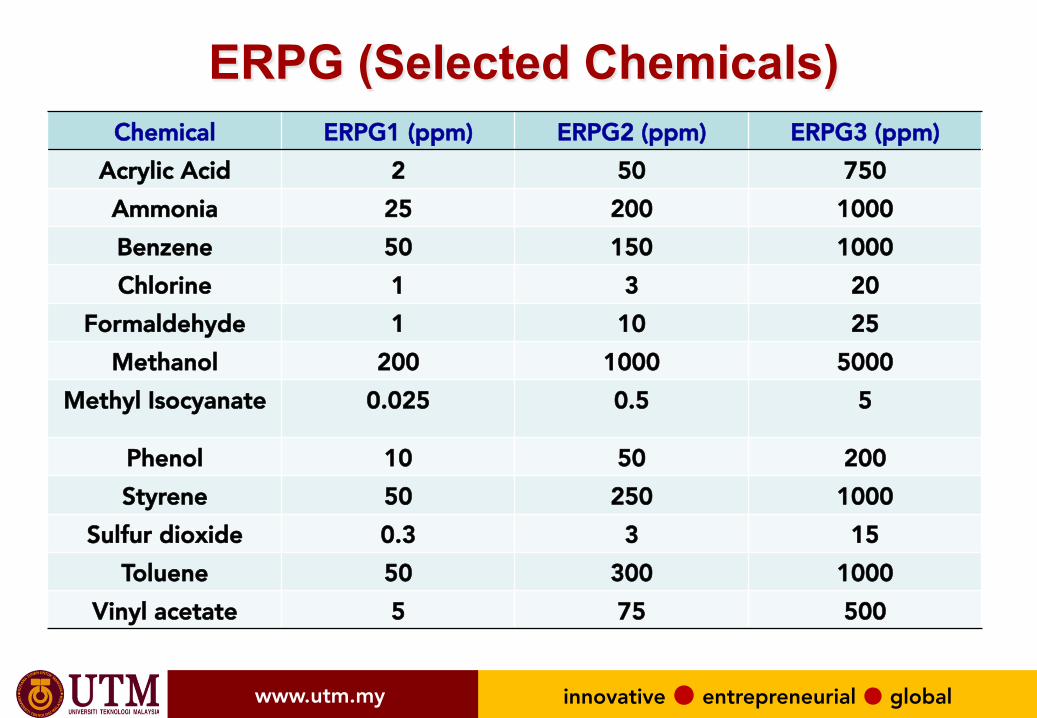
ERPG (Selected Chemicals) Chemical ERPG1 (ppm) ERPG2 (ppm) ERPG3 (ppm)
Acrylic Acid 2 50 750Ammonia 25 200 1000Benzene 50 150 1000Chlorine 1 3 20
Formaldehyde 1 10 25Methanol 200 1000 5000
Methyl Isocyanate 0.025 0.5 5
Phenol 10 50 200Styrene 50 250 1000
Sulfur dioxide 0.3 3 15Toluene 50 300 1000
Vinyl acetate 5 75 500

innovative ● entrepreneurial ● globalwww.utm.my
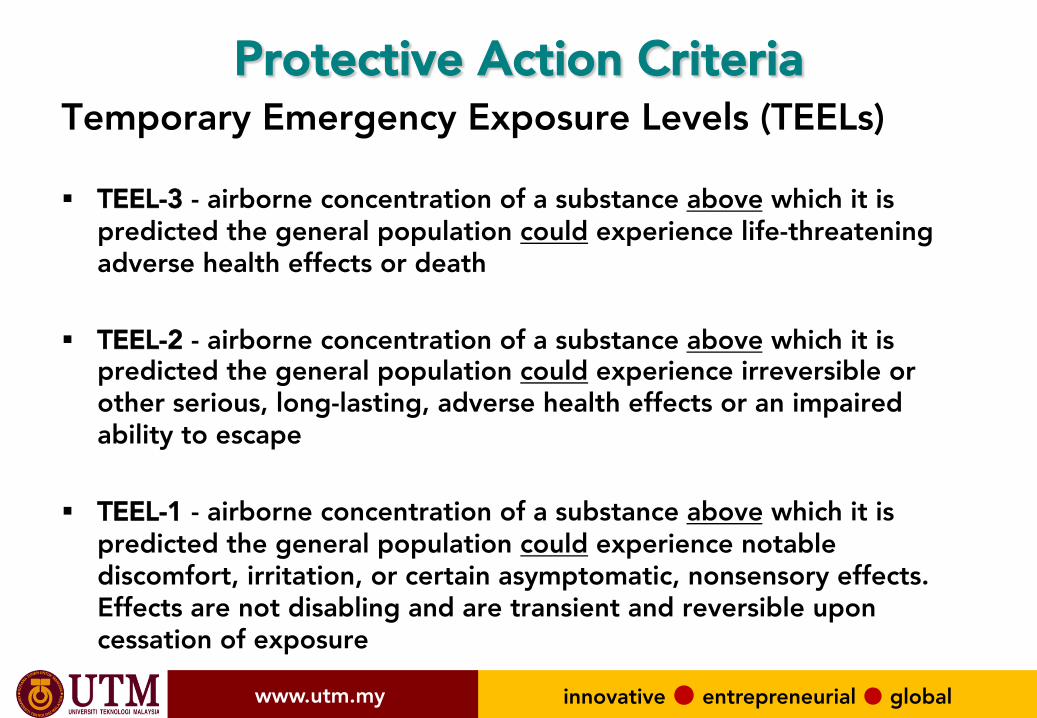
Protective Action CriteriaTemporary Emergency Exposure Levels (TEELs)
§ Estimate the concentrations at which most people (including sensitive individuals) will begin to experience health effects if they are exposed to a hazardous airborne chemical for a given duration
§ Derived by the U.S. Department of Energy Subcommittee on Consequence Assessment and Protective Actions (SCAPA) according to a specific, standard methodology
§ Development methodology uses available levels of concern and manipulates current data using a peer-reviewed, approved procedure in order to establish the TEELs
§ More than 3,000 chemicals have TEELs
innovative ● entrepreneurial ● globalwww.utm.my
Protective Action CriteriaTemporary Emergency Exposure Levels (TEELs)
§ TEEL-3 - airborne concentration of a substance above which it is predicted the general population could experience life-threatening adverse health effects or death
§ TEEL-2 - airborne concentration of a substance above which it is predicted the general population could experience irreversible or other serious, long-lasting, adverse health effects or an impaired ability to escape
§ TEEL-1 - airborne concentration of a substance above which it is predicted the general population could experience notable discomfort, irritation, or certain asymptomatic, nonsensory effects. Effects are not disabling and are transient and reversible upon cessation of exposure

innovative ● entrepreneurial ● globalwww.utm.my
Protective Action Criteria SummaryAEGL ERPG TEEL
Sensitive Individuals Yes No Yes
Publishing Agency National Academy of Sciences AIHA DOE
Airborne Concentration Above Below Above
Health Effects Could Without Could Values Published 70 145 >3,000
Release Duration 10 min, 30 min, 60 min, 4 hr, 8 hr 60 min 60 min
ALOHA Model Default Available Only if no AEGL or ERPG
Note: Based on Data, ERPG-3/TEEL-3 is more conservative. AEGL-3 shows lower concentration at a closer distance

innovative ● entrepreneurial ● globalwww.utm.my innovative ● entrepreneurial ● globalwww.utm.my
Risk Computation

innovative ● entrepreneurial ● globalwww.utm.my
Population at risk
Individual RiskIndividual risk is the risk of fatality or injury to any identifiable (named) individual who lives within the zone impacted by a hazard, or follows a particular pattern of life, that might subject him or her to the consequences of a hazard.
Societal RiskSocietal risk is the risk of multiple fatalities or injuries in the society as a whole, and where society would have to carry the burden of a hazard causing a number of deaths, injury, financial, environmental, and other losses.

innovative ● entrepreneurial ● globalwww.utm.my
Individual Risk
§ Individual risk is defined formally (by Institution of Chemical Engineering, UK) as the frequency at which an individual may be expected to sustain a given level of harm from the realization of specified hazards. It is usually taken to be the risk of death, and usually expressed as a risk per year.
§ The term ‘individual’ may be a member of a certain group of workers on a facility, or a member of the public, or anything as defined by the QRA.
innovative ● entrepreneurial ● globalwww.utm.my
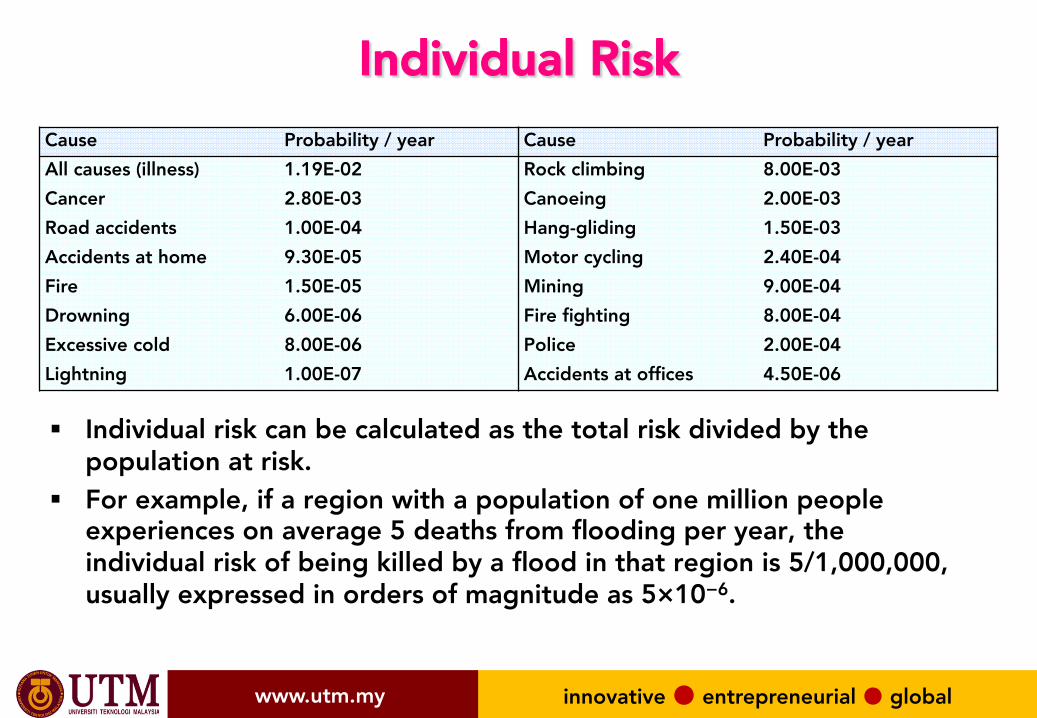
Individual RiskCause Probability / year Cause Probability / year All causes (illness) 1.19E-02 Rock climbing 8.00E-03 Cancer 2.80E-03 Canoeing 2.00E-03 Road accidents 1.00E-04 Hang-gliding 1.50E-03 Accidents at home 9.30E-05 Motor cycling 2.40E-04 Fire 1.50E-05 Mining 9.00E-04 Drowning 6.00E-06 Fire fighting 8.00E-04 Excessive cold 8.00E-06 Police 2.00E-04 Lightning 1.00E-07 Accidents at offices 4.50E-06 § Individual risk can be calculated as the total risk divided by the
population at risk. § For example, if a region with a population of one million people
experiences on average 5 deaths from flooding per year, the individual risk of being killed by a flood in that region is 5/1,000,000, usually expressed in orders of magnitude as 5×10⁻⁶.

innovative ● entrepreneurial ● globalwww.utm.my
Example: Risk of Fatality in Road Accident
§ What is the risk from driving an automobile?§ Suppose that there are 1 million accidents per year and there are 30
million people. 1 in 200 results in death.
!Life!time!Risk =1.67!x!1014 death!
person.year x!70!years =0.0117!(1!in!86!people)!death!per!person
!!Societal!Risk = 1,000,000!accidentyear x 1!death!
200!accident =5,000death!year
!Individual!Risk = 5000!death/year
30,000,000!people =1.67!x!10>4 death!person.year
§ Suppose that the average life of a person is 70 years

innovative ● entrepreneurial ● globalwww.utm.my
Location Specific Individual Risk
§ IRx,y,i is the individual risk at location (x,y) due to event i, § pi is the probability of fatality due to incident i at location (x,y). This is
normally determined by impact analysis techniques such as using Probit Analysis fi is the frequency of incident outcome case i, (per year). This value can be determined by FTA and ETA
iiiyx fpIR =,,
∑=
=n
iiyxyx IRIR
1,,,
When there are more than one release events, the cumulative risk at location (x,y) is given by equation

innovative ● entrepreneurial ● globalwww.utm.my
Average Individual Risk / Individual Risk Per Annum
§ The average individual risk is the average of all individual risk estimates over a defined or exposed population. This is useful for example in estimating the average risk of workers in reference with existing population. Average individual risk over exposed population is given by CCPS (1989) as
∑∑
=
yxyx
yxyxyx
AV P
PIRIR
,,
,,,
Here, IRAV is the average individual risk in the exposed population (probability of fatality per year) and P x, y is the number of people at location x, y

innovative ● entrepreneurial ● globalwww.utm.my
Example of LSIR Contour for Proposed Chemical Plant
innovative ● entrepreneurial ● globalwww.utm.my
Societal Risk
§ Societal risk measures the risk to a group of people. It is an estimation of risk in term of both the potential size and likelihood of incidents with multiple consequences.
§ The risk can be represented by Frequency-Number (F-N) Curve.

innovative ● entrepreneurial ● globalwww.utm.my
F-N Curves
Example: F-N curves showing the number of Fatalities against annual frequency. For natural and man-made hazards

innovative ● entrepreneurial ● globalwww.utm.my
Determination of Societal Risk§ To calculate the number of fatalities resulting from each
incident outcome case, the following equation is used:
Here, Ni is number of fatalities resulting from Incident Outcome case i, pf,i is the probability of fatality and Px,y is the number of population.
§ The cumulative frequency is then calculated using the following equation:
∑=i
iN FF
ifyx
yxi pPN ,,
,∑=
Here, FN is the frequency of all incident outcome cases affecting N or more people, per year and Fi= is the frequency of incident outcome case i per year.
innovative ● entrepreneurial ● globalwww.utm.my
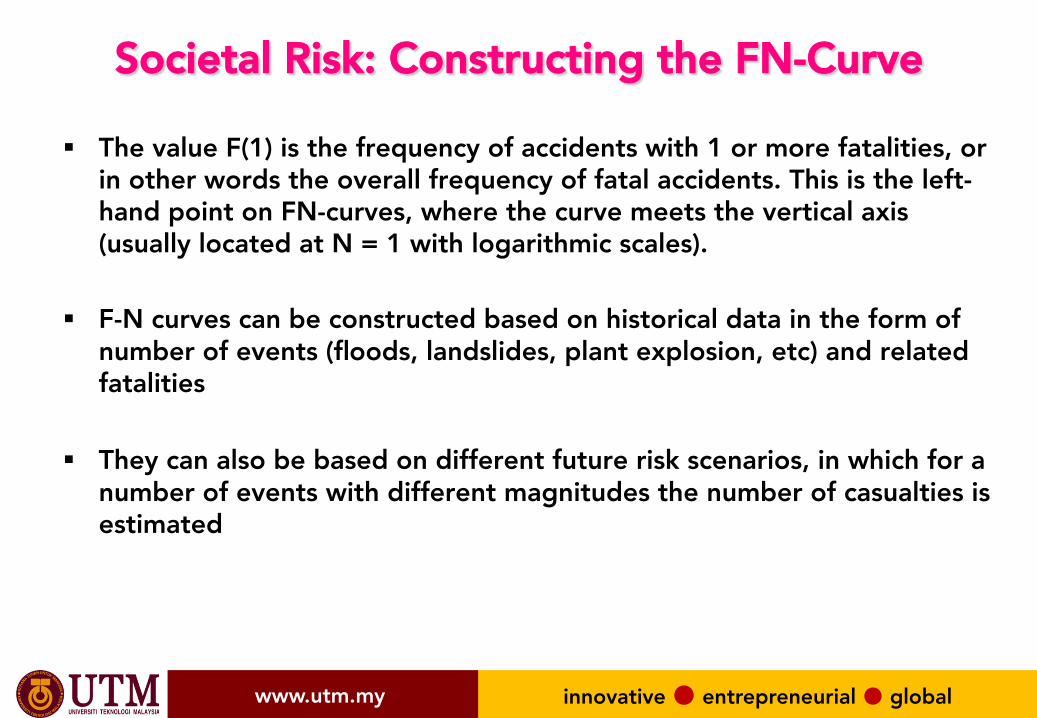
Societal Risk: Constructing the FN-Curve
§ The value F(1) is the frequency of accidents with 1 or more fatalities, or in other words the overall frequency of fatal accidents. This is the left-hand point on FN-curves, where the curve meets the vertical axis (usually located at N = 1 with logarithmic scales).
§ F-N curves can be constructed based on historical data in the form of number of events (floods, landslides, plant explosion, etc) and related fatalities
§ They can also be based on different future risk scenarios, in which for a number of events with different magnitudes the number of casualties is estimated
innovative ● entrepreneurial ● globalwww.utm.my
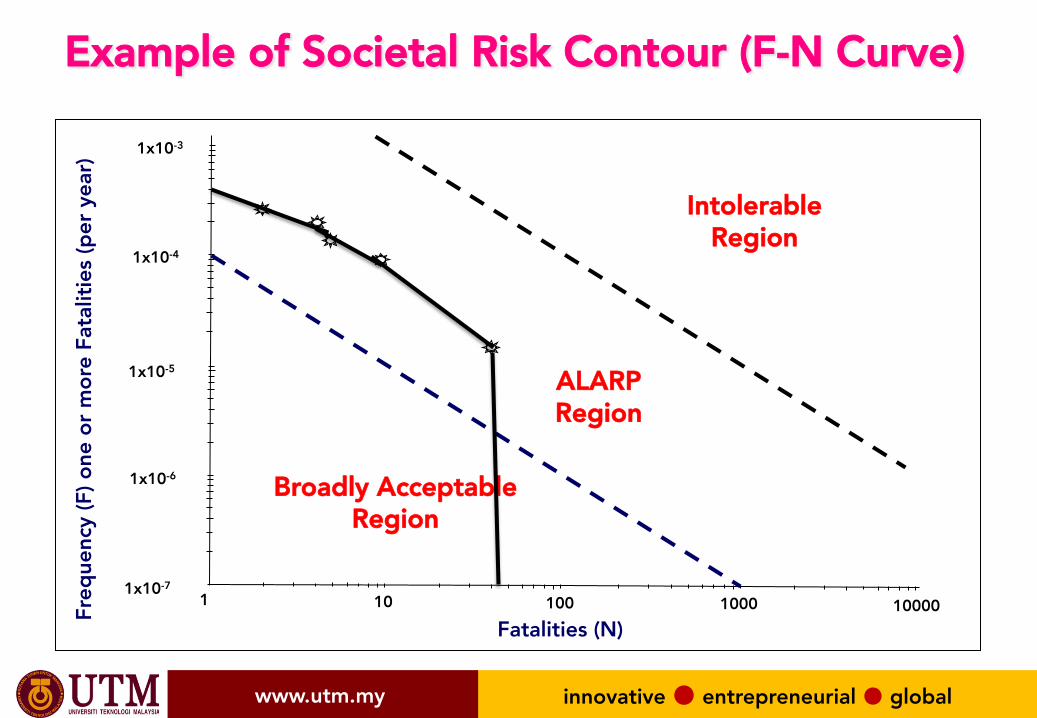
Example of Societal Risk Contour (F-N Curve)
1 10 100 1000 100001x10-7
1x10⁻³
1x10⁻⁴
1x10⁻⁵
1x10⁻⁶
ALARPRegion
IntolerableRegion
Broadly Acceptable Region
Fatalities (N)
Freq
uenc
y (F
) one
or m
ore
Fata
litie
s (p
er y
ear)

innovative ● entrepreneurial ● globalwww.utm.my 45
Example: Fatality due to Transport Accidents in Europe: Rail and Aviation (1967-2001), Road (1969-2001)
Fatality Road Rail Aviation Fatality Road Rail Aviation1 151722 2284 330 32 1 0 02 9350 78 178 35 0 1 03 1612 16 50 43 0 1 04 443 9 46 45 0 0 15 138 6 7 47 0 0 16 39 3 10 48 0 0 17 9 3 1 49 0 1 08 5 0 2 55 0 0 19 6 2 0 63 0 0 2
10 5 2 1 66 0 0 111 0 1 2 72 0 0 112 0 1 1 80 0 0 113 5 1 1 104 0 0 117 0 0 1 112 0 0 120 1 0 1 118 0 0 131 0 2 0 146 0 0 1
Total 163336 2411 644

innovative ● entrepreneurial ● globalwww.utm.my 46
• First calculate the total number of fatalities for road, railroad and aviation accidents by multiplying the number of events with the fatality class. Also calculate the average number of fatalities per year.
• Then calculate the cumulative number of events, starting with the lowest one in the table (related to 146 fatalities) and summing them up upwards.
• Then calculate the cumulative frequency of events per year, by dividing the cumulative number by the number of years.
Example: Europe Transportation Accidents

innovative ● entrepreneurial ● globalwww.utm.my 47
Example: Europe Transportation AccidentsNumber of EVENTS Fatalities Cummulative No. of Events Cummulative Frequency per year
Fatality Road Rail Aviation Road Rail Aviation Road Rail Aviation Road Rail Aviation1 151722 2284 330 151722 2284 330 163336 2411 644 4.95E+03 7.31E+01 1.95E+012 9350 78 178 18700 156 356 11614 127 314 3.52E+02 3.85E+00 9.52E+003 1612 16 50 4836 48 150 2264 49 136 6.86E+01 1.48E+00 4.12E+004 443 9 46 1772 36 184 652 33 86 1.98E+01 1.00E+00 2.61E+005 138 6 7 690 30 35 209 24 40 6.33E+00 7.27E-01 1.21E+006 39 3 10 234 18 60 71 18 33 2.15E+00 5.45E-01 1.00E+007 9 3 1 63 21 7 32 15 23 9.70E-01 4.55E-01 6.97E-018 5 0 2 40 0 16 23 12 22 6.97E-01 3.64E-01 6.67E-019 6 2 0 54 18 0 18 12 20 28 5.45E-01 3.64E-01 6.06E-01
10 5 2 1 50 20 10 12 10 20 3.64E-01 3.03E-01 6.06E-0111 0 1 2 0 11 22 7 8 19 2.12E-01 2.42E-01 5.76E-0112 0 1 1 0 12 12 7 7 17 2.12E-01 2.12E-01 5.15E-0113 5 1 1 65 13 13 7 6 16 2.12E-01 1.82E-01 4.85E-0117 0 0 1 0 0 17 2 5 15 6.06E-02 1.52E-01 4.55E-0120 1 0 1 20 0 20 2 5 14 6.06E-02 1.52E-01 4.24E-0131 0 2 0 0 62 0 1 5 13 3.03E-02 1.52E-01 3.94E-0132 1 0 0 32 0 0 1 3 13 3.03E-02 9.09E-02 3.94E-0135 0 1 0 0 35 0 0 3 13 0.00E+00 9.09E-02 3.94E-0143 0 1 0 0 43 0 0 2 13 0.00E+00 6.06E-02 3.94E-0145 0 0 1 0 0 45 0 1 13 0.00E+00 3.03E-02 3.94E-0147 0 0 1 0 0 47 0 1 12 0.00E+00 3.03E-02 3.64E-0148 0 0 1 0 0 48 0 1 11 0.00E+00 3.03E-02 3.33E-0149 0 1 0 0 49 0 0 1 10 0.00E+00 3.03E-02 3.03E-0155 0 0 1 0 0 55 0 0 10 0.00E+00 0.00E+00 3.03E-0163 0 0 2 0 0 126 0 0 9 0.00E+00 0.00E+00 2.73E-0166 0 0 1 0 0 66 0 0 7 0.00E+00 0.00E+00 2.12E-0172 0 0 1 0 0 72 0 0 6 0.00E+00 0.00E+00 1.82E-0180 0 0 1 0 0 80 0 0 5 0.00E+00 0.00E+00 1.52E-01
104 0 0 1 0 0 104 0 0 4 0.00E+00 0.00E+00 1.21E-01112 0 0 1 0 0 112 0 0 3 0.00E+00 0.00E+00 9.09E-02118 0 0 1 0 0 118 0 0 2 0.00E+00 0.00E+00 6.06E-02146 0 0 1 0 0 146 0 0 1 0.00E+00 0.00E+00 3.03E-02
TOTAL 163336 2411 644 178278 2856 2251 PER YEAR 4949.6 68.9 18.4 5402.4 81.6 64.3

innovative ● entrepreneurial ● globalwww.utm.my 48
Example: Europe Transportation Accidents
§ Plot these values in the graph indicated at the bottom of the spreadsheet in a log-log manner, with Fatalities (N) or the X-axis, and the cumulative frequency per year on the Y-Axis.
§ Compare the results. What can you conclude on the:• Severity of the accident type• Frequency of the accident type

innovative ● entrepreneurial ● globalwww.utm.my 49
Example: Europe Transportation Accidents Number of Fatality
Cum
ulat
ive
Freq
uenc
y
Slope = -1 Line
innovative ● entrepreneurial ● globalwww.utm.my innovative ● entrepreneurial ● globalwww.utm.my
Tolerability Criteria

innovative ● entrepreneurial ● globalwww.utm.my Page 51
• Risk cannot be eliminated entirely. • At some point in the design stage someone needs to
decide if the risks are “tolerable".• One tolerability criteria in the UK is "as low as reasonable
practicable" (ALARP) concept formalized in 1974 by United Kingdom Health and Safety at Work Act.
• Serious consideration must be made to decide on tolerability based on ALARP
Tolerable Risk

innovative ● entrepreneurial ● globalwww.utm.my
Origin of Reasonably Practicable
“Reasonably practicable is a narrower term than “physically possible” and implies that a computation must be made in which the quantum of risk is placed in one scale and the sacrifice, whether in money, time or trouble, involved in the measures necessary to avert the risk is placed in the other; and that, if it be shown that there is a gross disproportion between them, the risk being insignificant in relation to the sacrifice, the person upon whom the duty is laid discharges the burden of proving that compliance was not reasonably practicable”
Edward Vs National Coal Board [1949] (British Court)
Risk Sacrifice (time, money, trouble)

innovative ● entrepreneurial ● globalwww.utm.my
ALARP Criteria
BROADLY ACCEPTABLE REGION
Control measures must be introduced for the risk in this region to drive the risk towards the broadly acceptable region.
If risks remain in this region and society desires the benefit of the activities the risk is tolerable only if further risk reduction is impracticable, or requires actions that is grossly disproportionate in time, trouble, effort to the reduction in risks achieved.
THE ALARP REGION (Risk is undertaken if benefit is desired
UNACCEPTABLE REGION
Risk cannot be justified except for extraordinary ground
Level of risks regarded as insignificant and further reduction of risks not likely to be required as resources required to reduce risks is likely to be grossly disproportionate to gained achieved.In
crea
sing
Indi
vidu
al R
isk a
nd S
ocie
tal R
isk
innovative ● entrepreneurial ● globalwww.utm.my
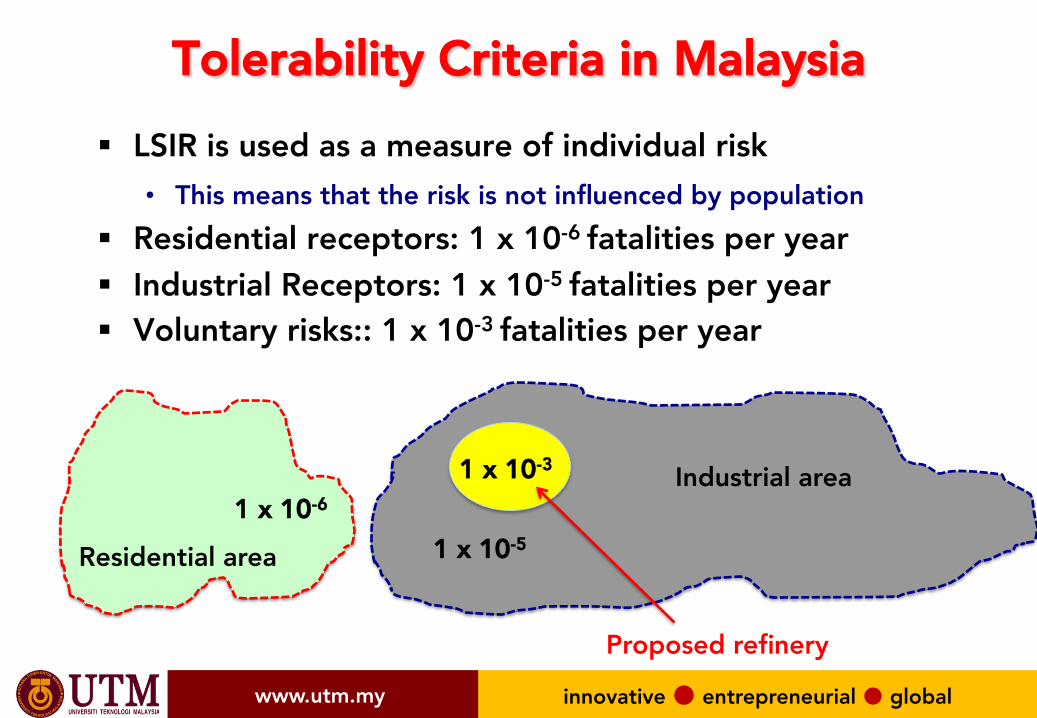
Tolerability Criteria in Malaysia§ LSIR is used as a measure of individual risk
• This means that the risk is not influenced by population§ Residential receptors: 1 x 10⁻⁶ fatalities per year§ Industrial Receptors: 1 x 10⁻⁵ fatalities per year§ Voluntary risks:: 1 x 10⁻³ fatalities per year
1 x 10⁻³
1 x 10⁻⁶
1 x 10⁻⁵ Residential area
Proposed refinery
Industrial area
innovative ● entrepreneurial ● globalwww.utm.my Page 55
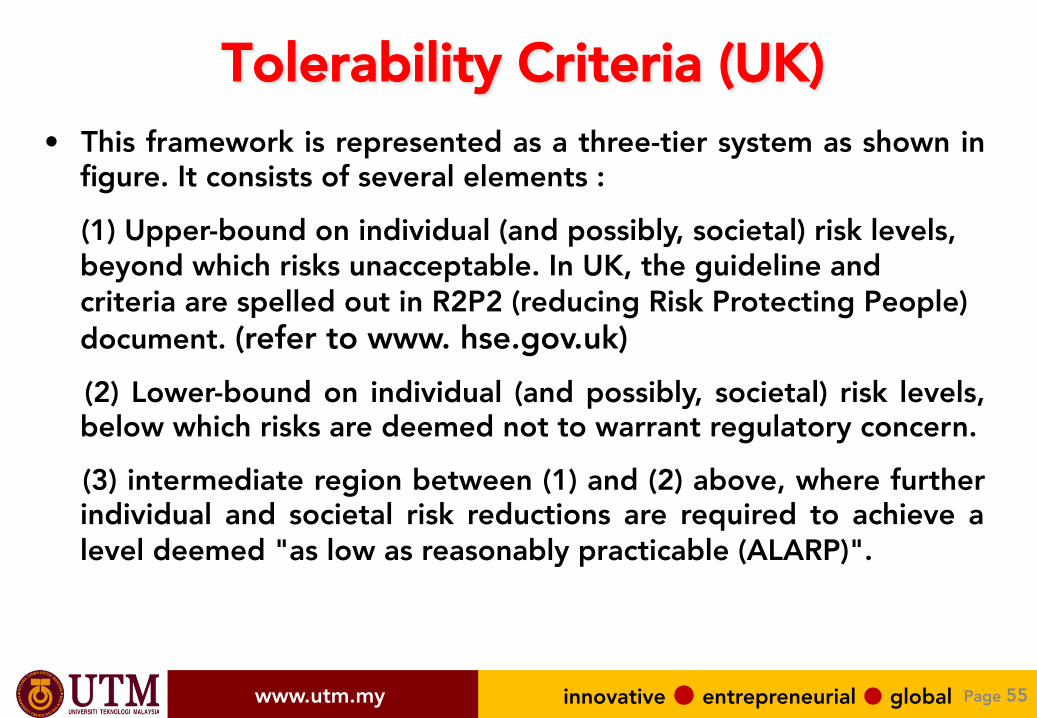
• This framework is represented as a three-tier system as shown in figure. It consists of several elements :
(1) Upper-bound on individual (and possibly, societal) risk levels, beyond which risks unacceptable. In UK, the guideline and criteria are spelled out in R2P2 (reducing Risk Protecting People) document. (refer to www. hse.gov.uk) (2) Lower-bound on individual (and possibly, societal) risk levels, below which risks are deemed not to warrant regulatory concern.
(3) intermediate region between (1) and (2) above, where further individual and societal risk reductions are required to achieve a level deemed "as low as reasonably practicable (ALARP)".
Tolerability Criteria (UK)

innovative ● entrepreneurial ● globalwww.utm.my
Tolerability Criteria (UK)
Dotted line – general public
Solid line - workers
innovative ● entrepreneurial ● globalwww.utm.my
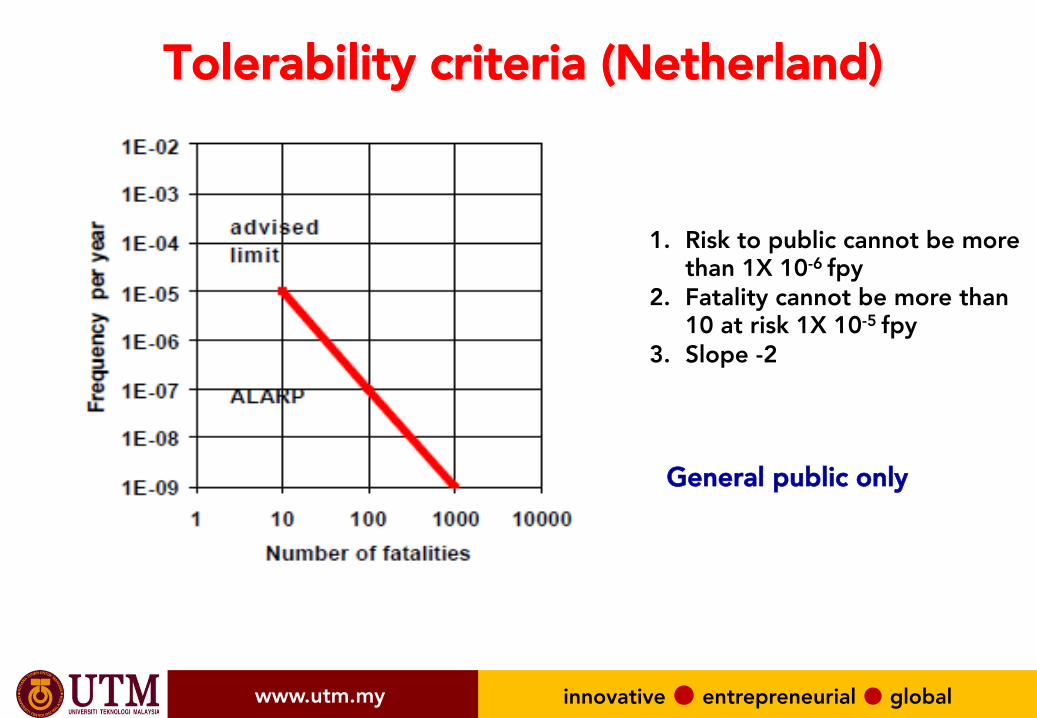
Tolerability criteria (Netherland)
1. Risk to public cannot be more than 1X 10⁻⁶ fpy
2. Fatality cannot be more than 10 at risk 1X 10⁻⁵ fpy
3. Slope -2
General public only
innovative ● entrepreneurial ● globalwww.utm.my
Think about this …
In real life, a risk is Acceptable when: § it falls below an arbitrary defined probability§ it falls below some level that is already tolerated§ it falls below an arbitrary defined attributable fraction of total disease
burden in the community§ the cost of reducing the risk would exceed the costs saved§ the cost of reducing the risk would exceed the costs saved when the
‘costs of suffering’ are also factored in§ the opportunity costs would be better spent on other, more pressing,
public health problems§ public health professionals say it is acceptable§ the general public say it is acceptable (or more likely, do not say it is
not)
§ politicians say it is acceptable.

innovative ● entrepreneurial ● globalwww.utm.my innovative ● entrepreneurial ● globalwww.utm.my
Risk Management & Mitigation
innovative ● entrepreneurial ● globalwww.utm.my
How can we reduce risks?
To reduce risk, we can either reduce severity and/or likelihood§ Reduce Severity: decrease capacity, operate at low pressure, use less
hazardous materials etc. § Reduce likelihood: use better technology, multiple layers of protection,
redundancy etc.
What if we cannot bring it lower than the tolerable limit?
§ Add Mitigating Measures to reduce impact: dispersion prevention, escalation prevention, damage control, emergency response & evacuation, etc…
ALARP (As Low As Reasonably Practicable)

innovative ● entrepreneurial ● globalwww.utm.my 61
Release Mitigation§ Release mitigation is defined as “lessening” the risk of a
release incident by acting on the source (at the point of release) either –1. in a preventive way by reducing the likelihood of an event which
could generate a hazardous vapour cloud; or
2. in a protective way by reducing the magnitude of the release and/or the exposure of local persons or property.
§ Release mitigation involves 1. Detecting the release as quickly as possible;
2. Stopping the release as quickly as possible; and
3. Invoking a mitigation procedure to reduce the impact of the release on the surroundings.

innovative ● entrepreneurial ● globalwww.utm.my 62
Release Mitigation Procedure
Design Basis
Source Model
Dispersion Model
Prediction ofRelease Impact
Is Hazard
Acceptable ?
Toxic Release Model
Revise- Process or plant
- Process operation- Emergency response
Operate plantyes
No

innovative ● entrepreneurial ● globalwww.utm.my
Release Mitigation
§ Design§ Engineering Controls
• Release prevention• Ignition Prevention• Dispersion Prevention• Escalation prevention
§ Administrative Control• Safe Work Procedure at every project stages• Emergency Response Management
63
innovative ● entrepreneurial ● globalwww.utm.my 64
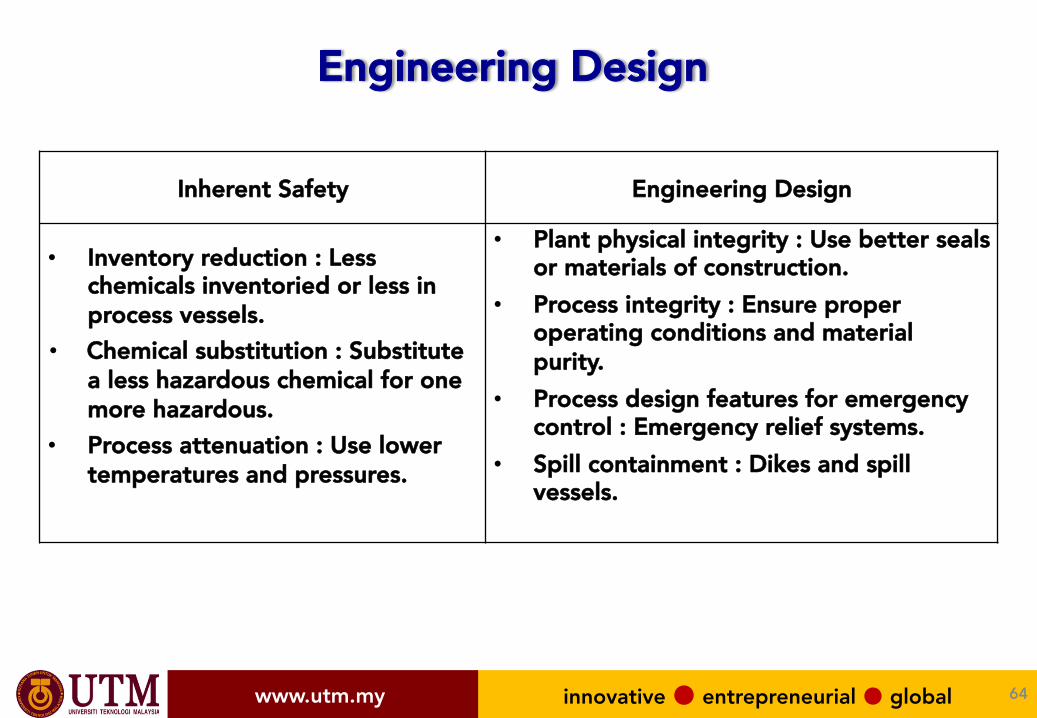
Engineering Design
Inherent Safety Engineering Design
• Inventory reduction : Less chemicals inventoried or less in process vessels.
• Chemical substitution : Substitute a less hazardous chemical for one more hazardous.
• Process attenuation : Use lower temperatures and pressures.
• Plant physical integrity : Use better seals or materials of construction.
• Process integrity : Ensure proper operating conditions and material purity.
• Process design features for emergency control : Emergency relief systems.
• Spill containment : Dikes and spill vessels.
innovative ● entrepreneurial ● globalwww.utm.my 65
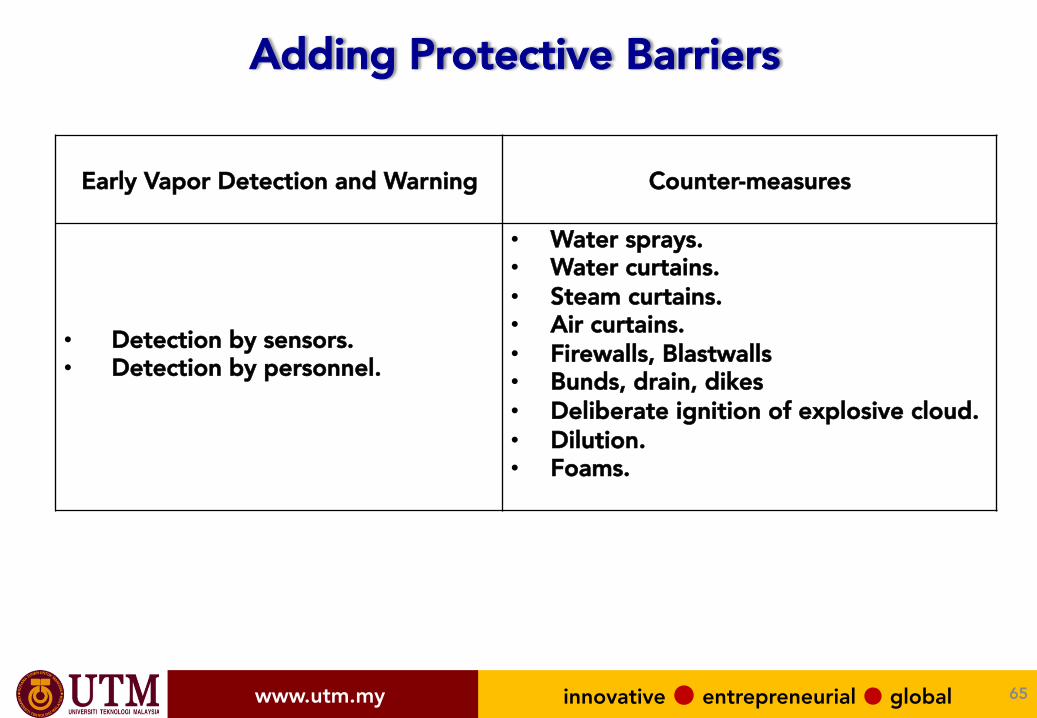
Early Vapor Detection and Warning Counter-measures
• Detection by sensors.• Detection by personnel.
• Water sprays.• Water curtains.• Steam curtains.• Air curtains.• Firewalls, Blastwalls• Bunds, drain, dikes• Deliberate ignition of explosive cloud.• Dilution.• Foams.
Adding Protective Barriers

innovative ● entrepreneurial ● globalwww.utm.my
Administrative Control
Safe Work Procedure at every project stages
Emergency Response Management
• Operating policies and procedures.• Training for vapor release prevention
and control.• Audits and inspections.• Equipment testing.• Maintenance program.• Management of modifications and
changes to prevent new hazards.• Security.
• On-site communications.• Emergency shutdown equipment and
procedures.• Site evacuation.• Safe havens.• Personal protective equipment.• Medical treatment.• On-site emergency plans, procedures,
training and drills.

innovative ● entrepreneurial ● globalwww.utm.my
Risk Communication (Seven Cardinal Rules)
1. Accept and involve the public as a legitimate partner.2. Plan carefully and evaluate your efforts.3. Listen to the public’s specific concerns (Communication is two way
activity)4. Be honest, frank and open (Trust and credibility are most precious
assets)5. Coordinate and collaborate with other credible sources6. Meet the needs of Media ( provide risk information tailored to the
needs of each type of media)7. Speak clearly and with compassion ( Use simple non technical
language with general public)

innovative ● entrepreneurial ● globalwww.utm.my innovative ● entrepreneurial ● globalwww.utm.my
END OF LECTURE