quantitative risk assessment - efsec.wa.gov savage/sepa-deis/deis_publiccomments... · dnv gl –...
TRANSCRIPT

VANCOUVER ENERGY TERMINAL
Quantitative Vessel Traffic Risk Assessment
Vancouver Energy Petroleum Terminal LLC
Report No.: PP111860-2, Rev. 5 Date: January 20, 2016

About DNV GL
Driven by its purpose of safeguarding life, property and the environment, DNV GL enables organizations to advance the safety and sustainability of their business. DNV GL provides classification and technical assurance along with software and independent expert advisory services to the maritime, oil and gas, and energy industries. It also provides certification services to customers across a wide range of industries.
Combining leading technical and operational expertise, risk methodology, and in-depth industry knowledge, DNV GL empowers its customers’ decisions and actions with trust and confidence. The company continuously invests in research and collaborative innovation to provide customers and society with operational and technological foresight. DNV GL, whose origins go back to 1864, operates globally in more than 100 countries with its 15,000 professionals dedicated to helping their customers make the world safer, smarter, and greener.
In the oil and gas industry DNV GL is the leading technical advisor to the global oil and gas industry. The company provides consistent, integrated services within technical and marine assurance and advisory, risk management, and offshore classification, to enable safe, reliable and enhanced performance in projects and operations. Together with its partners, DNV GL drives the industry forward by developing best practices and standards. Its people combine industry expertise, multi-disciplinary skills, and innovation to solve complex challenges for its customers.
In the maritime industry DNV GL is the world’s leading classification society and a recognized advisor for the maritime industry. We enhance safety, quality, energy efficiency and environmental performance of the global shipping industry – across all vessel types and offshore structures. We invest heavily in research and development to find solutions, together with the industry, that address strategic, operational or regulatory challenges.
In the energy industry
DNV GL delivers world-renowned testing and advisory services to the energy value chain including renewables and energy efficiency. Our expertise spans onshore and offshore wind power, solar, conventional generation, transmission and distribution, smart grids, and sustainable energy use, as well as energy markets and regulations. Our 2,500 energy experts support clients around the globe in delivering a safe, reliable, efficient, and sustainable energy supply.
For business assurance DNV GL is one of the world’s leading certification bodies. We help businesses assure the performance of their organizations, products, people, facilities and supply chains through certification, verification, assessment, and training services. Partnering with our customers, we build sustainable business performance and create stakeholder trust across all types of industries.
For software
DNV GL is the world-leading provider of software for managing risk and improving asset performance in the energy, process and maritime industries. Our solutions support a variety of business critical activities including design and engineering, risk assessment, asset integrity and optimization, QHSE, and ship management. Our worldwide presence facilitates a strong customer focus and efficient sharing of industry best practice and standards.
DNV GL – Report No. PP111860-2, Rev. 5 – www.dnvgl.com Page iii

EXECUTIVE SUMMARY
Tesoro Savage Petroleum Terminal LLC proposes to construct and operate the Vancouver Energy Terminal, a crude-by-rail terminal that would be capable of receiving an average of 360,000 bbl of crude oil per day, temporarily storing it onsite, and loading it onto double hull oil tankers for shipment to refineries located primarily on the West Coast of North America. State licensed Columbia River Pilots will navigate the loaded vessels approximately 75 miles down the Lower Columbia River to Astoria where a State licensed Columbia River Bar Pilot will board and navigate the vessel from Astoria across the Columbia River Bar to sea.
This report documents a quantitative risk assessment (QRA) of marine incidents and oil spills associated with vessel loading operations at the terminal and transits away from the Vancouver Energy Terminal. This study explores three separate oil spill risk aspects:
1. Risk along the route.
2. Risk from collision at the dock.
3. Risk from cargo loading.
The study area of the Columbia River extends from approximately river mile (RM) 106 in Vancouver, Washington at the I-5 bridge, to 12 NM offshore, where Columbia River Bar Pilots disembark the vessel. Key information about the route was gathered as input to navigation risk modeling, including ports, anchorages, bottom type, wind, sea state, currents, and visibility.
A 47,000 DWT tanker is the vessel type that will call on the terminal the vast majority of the time. Two larger size vessels (105,000 DWT and 165,000 DWT) have been included in the assessment to account for the possibility that larger vessels may become available. Approximately one tanker will be loaded per day. For the purposes of this assessment, a 47,000 DWT vessel was assumed to load 79% of the time. Additional vessel types are represented in the assessment as comprising 20% (105,000 DWT) and 1% (165,000 DWT) of the annual calls per year.
Risk along the route
A marine incident is a sudden departure, intended or unintended, from normal conditions, in which some degree of harm is caused. The vast majority of incidents do not result in an oil spill. Effects from Vancouver Energy Terminal vessels on marine incident rates were estimated for both up and down river transits. On departure from the terminal, the 47,000 DWT tanker is assumed to be fully loaded (330,945 bbl). The maximum loading of the two larger tankers is 600,000 bbl.
Marine vessel traffic is identified using data obtained from the Automatic Identification System (AIS) for July 1, 2013 to June 30, 2014. AIS is an automatic tracking system that allows vessels to identify and locate other vessels. The International Convention for the Safety of Life at Sea (SOLAS) requires AIS transmitters to be active onboard all vessels of more than 300 gross tons, although a large number of smaller vessels have been fitted with AIS. There were approximately 10,000 vessel transits over the Columbia River Bar between 1 July 2013 and 30 June 2014; roughly 6,600 of these continued upriver beyond Astoria.
The likelihood of navigation incidents was estimated using a DNV GL proprietary model, Marine Accident Risk Calculation System (MARCS), used to assess many other navigational risk studies and marine waterway suitability studies, including the Prince Rupert area (British Columbia), Mississippi River (Louisiana), Delaware River (New Jersey), Prince William Sound (Alaska), the Aleutian Islands (Alaska), Puget Sound
DNV GL – Report No. PP111860-2, Rev. 5 – www.dnvgl.com Page iv

(Washington), and the entire coast of Australia. Key inputs to the model describe the study area, the marine traffic, the marine environment, and risk control measures in place. The model applies global incident and accident data to the local information to provide an order of magnitude estimate of average annual likelihoods, presented in terms of events per year.
The planned risk control measures included in the model are:
• Pilotage.
• Cooperative coordination for collision avoidance between Pilots when navigating the river.
• Transview 32 (TV32).
• Portable Pilotage Unit (PPU).
• Differential Global Position System (DGPS).
• Automatic Identification System (AIS).
• Electronic Navigation Charts (ENC) on Electronic Chart Display and Information System (ECDIS).
• Under Keel Clearance Management.
• Port State Control (PSC).
• Conventional Aids to Navigation (AtoN).
• Maximum cargo limit of 600,000 bbl.
The planned / actual risk control measures not modeled are:
• Vessel vetting system.
• Two tugs used for docking / undocking.
Identified potential risk control measures are:
• Tethered Tug Escort - Modeling of tethered tug escort on loaded tankers showed a reduction of approximately 91% in grounding frequency of a loaded 47,000 DWT tanker with the use of a tethered tug.
• Full-time monitoring of TV32. While TV32 is used by pilots, it may not be monitored full time by shore-side personnel.
The model results were compared with historical averages, and found to over-predict collisions and groundings by a factor of two to seven. This is likely due to the nature of such models, which intentionally err on the side of realistic conservatism when uncertainties must be quantified.
A comparison was made between global incident rates and modeled local incident rates as a means of evaluating the veracity of the MARCS risk assessment results. The estimates of the number of future incidents are six times higher than that of local data compiled by the US Coast Guard.
The model predicts that the Vancouver Energy Terminal vessel traffic will increase the risk of marine incidents for current traffic (with or without consequences of concern) on the Columbia River by approximately 2%. The number of incidents predicted by the model for the study area is approximately 40 per year for current marine traffic. The incident return period for an incident of any type (most of which will
DNV GL – Report No. PP111860-2, Rev. 5 – www.dnvgl.com Page v

not result in a spill) for 47,000 DWT tankers is approximately one every 0.8 years. The estimated incident return period for 105,000 DWT tankers is one every 3 years. The estimated return period for the 165,000 DWT vessels is one every 57 years.
When considering all future marine traffic – a combination of current traffic, Sample Vessels, and traffic proposed for future projects - the frequency of an oil spill from a collision is:
• 0.023 /year (1 every 43years)1 for 47,000 DWT tankers.
• 0.0058 /year (1 every 170 years) for 105,000 DWT tankers.
• 0.00032 /year (1 every 3,100 years) for 165,000 DWT tankers.
The frequency of an oil spill from a grounding is:
• 0.025 /year (1 every 40 years)1 for 47,000 DWT tankers.
• 0.0063 /year (1 every 150 years) for 105,000 DWT tankers.
• 0.00035 /year (1 every 2,800 years) for 165,000 DWT tankers.
Risk from collision at the dock
Risk was estimated from a passing vessel colliding with a vessel moored at the Vancouver Energy Terminal. The study estimates the frequency of a collision and the potential range of oil spill volumes.
The method was developed based on guidelines for vessel collision and bridges from the American Association of State Highway and Transportation Officials (AASHTO). Sample Vessel characteristics (such as ultimate resistance of the tanker), waterway characteristics, geometry, and marine traffic characteristics were compared to standard acceptance criteria to estimate the extent of damage to a Sample Vessel.
The frequency of an oil spill from a collision at the dock is:
• 0.00004/year (1 every 25,000 years) for 47,000 DWT tankers.
• 0.00001 /year (1 every 100,000 years) for 105,000 DWT tankers.
• 0.0000006 /year (1 every 1.6 million years) for 165,000 DWT tankers.
Risk from cargo loading
The majority of the equipment being analyzed in this portion of the study is on land, so not all spills would reach the Columbia River. In general, no credit is given in this analysis for containment systems, catchments, or surface elevation changes (one exception is noted below). The term “release” is therefore used exclusively in this section to refer to oil which is no longer in its intended equipment (i.e., within piping, hoses, connecting equipment), but has not necessarily reached the water. For simplification purposes, when the frequency and oil volume results from this portion of the analysis are integrated into the two other portions, the distinction is ignored.
1 Return periods are rounded down to the next integer year.
DNV GL – Report No. PP111860-2, Rev. 5 – www.dnvgl.com Page vi

Potential release scenarios were identified based on:
• Drawings (Piping and Instrumentation diagrams and Process Flow Diagrams).
• Release location.
• Material.
• Operating conditions (temperature and pressure).
The sections of equipment identified as within the boundaries of the study were:
• 36 inch loading pipeline from dock to the first onshore emergency shutdown (ESD) valve.
• Loading branches and loading pipelines connected to loading hoses.
• Loading hoses to the tanker manifold.
• Crude return lines running from dock up to the first onshore ESD valve on the 36 inch line.
In order to calculate possible spill volumes and estimate their associated likelihoods (frequencies), the equipment was divided into isolatable sections per a standardized rule set common in safety QRA studies. Each isolatable section is defined as that set of equipment from which the same quantity of oil could be released after closure of Emergency Shutdown Valves (ESDV).
The planned risk control measures included in the model:
• The loading system at the terminal will incorporate automatic shutoff valves with a maximum 30-second closure time.
• Closed-circuit video monitoring of the transfer area at the dock during loading.
• Closed-circuit video monitoring of the transfer area on the ship during loading.
• Manual activation of ESDVs on the ship, terminal control room, and terminal dock.
Two methods were used to estimate the frequency and volume of spills involving the loading hose to the tanker. Method 1 used standard safety QRA practices and global failure frequencies to estimate the potential for spills of various quantities. Method 2 used Tesoro-specific historical spill experience and an oil spill study prepared for the Washington Department of Ecology to estimate the potential for spills of various quantities. Method 2 used reported oil spill volumes, which by definition, does not include the volume oil prevented from reaching the environment. This is the exception discussed above concerning credit for containment systems.
The planned / actual risk control measures not modeled are:
• Liquid holdups related to expansion joints and vertical variations are conservatively not considered in the volume outflow calculation.
• Mandatory seven year replacement of each loading hose (not accounted for in Method 1 spill frequency, but accounted for in the Method 2 spill frequency).
• A catchment will be constructed at or below the deck level for the containment of inadvertent releases in addition to storm water that may fall in the catchment area.
DNV GL – Report No. PP111860-2, Rev. 5 – www.dnvgl.com Page vii

The estimated recurrence interval for an oil spill from loading is:
Spill Volume Range (bbl)
Average Interval of Recurrence2
Method 1 (yr) Method 2 (yr)
0-50 1,300 7
50-100 42,000 42,000
100-500 8 160
500-1000 590 1,500,000
1000-10000 420,000 420,000
10000-30000 75,000 78,000,000,000
>30000 5,800,000 39,000
Both methods result in similar estimates of oil spill frequency from loading. The primary difference between the two methods is in the estimated volume released. Method 2, based on the Tesoro US experience, yields lower estimated spill volume. Speculatively, this could be due to the fact that experiential data account for actions taken to prevent further spillage after an event begins, whereas, the Method 1, a standard QRA approach, does not account for such actions. Taken together in context, the results from the two methods provide confidence that the uncertainty in the calculated loading risk is low.
2 Recurrence interval is used interchageably with return period. The results are rounded down to the next integer year and presented with a maximum of two significant digits.
DNV GL – Report No. PP111860-2, Rev. 5 – www.dnvgl.com Page viii

Table of contents
1 INTRODUCTION ................................................................................................................... 1 1.1 Objectives .......................................................................................................................... 1 1.2 General Approach ................................................................................................................ 2 1.3 Risk Terms .......................................................................................................................... 2
2 ROUTE DESCRIPTION ........................................................................................................... 4 2.1 Ports on the Columbia River .................................................................................................. 5 2.2 Anchorage Areas ................................................................................................................. 5 2.3 Hard Bottom Areas and Shoaling Waters ................................................................................ 5 2.4 Wind, Sea State and Surface Currents .................................................................................... 6 2.5 Visibility ........................................................................................................................... 10 2.6 Departure from and Arrival at Vancouver Energy Terminal ...................................................... 11 2.7 River Transit ..................................................................................................................... 11 2.8 Bar Transit ........................................................................................................................ 12
3 PROPOSED VANCOUVER ENERGY TERMINAL OPERATIONS ...................................................... 13 3.1 Sample Vessel Specifications ............................................................................................... 13 3.2 Terminal Description .......................................................................................................... 15
4 MARINE TRAFFIC ............................................................................................................... 16 4.1 Current Marine Traffic ........................................................................................................ 16 4.2 Proposed Marine Traffic ...................................................................................................... 28 4.3 Future Marine Traffic .......................................................................................................... 29
5 DESCRIPTION OF THE MARINE TRANSPORT INCIDENT MODEL ................................................ 30 5.1 Input Parameters ............................................................................................................... 30 5.2 Risk Controls Applied in the Analysis .................................................................................... 31
6 OIL SPILL RISK ALONG THE ROUTE ..................................................................................... 42 6.1 Navigation Incident Model ................................................................................................... 43 6.2 Frequency Comparison ....................................................................................................... 45 6.3 Consequence Assessment of Marine Transport Incidents ......................................................... 83 6.4 Oil Spill Risk during Marine Transport ................................................................................... 88
7 OIL SPILL RISK OF COLLISION AT DOCK .............................................................................. 91 7.1 Striking Frequency ............................................................................................................. 91 7.2 Consequence Assessment for Striking at Dock ....................................................................... 96 7.3 Oil Spill Risk from Collision at Dock ...................................................................................... 98
8 OIL SPILL RISK FROM CARGO LOADING AT THE TERMINAL ..................................................... 99 8.1 Scenario Identification ...................................................................................................... 100 8.2 Frequency of Oil Releases ................................................................................................. 101 8.3 Consequence Assessment from Loading .............................................................................. 106 8.4 Oil Spill Risk from Cargo Loading ....................................................................................... 111
DNV GL – Report No. PP111860-2, Rev. 5 – www.dnvgl.com Page ix

9 SENSITIVITIES ................................................................................................................ 121 9.1 Tidal Range ..................................................................................................................... 121 9.2 Tug Escort Assessment ..................................................................................................... 122
10 CONCLUSIONS ................................................................................................................ 125 10.1 Marine Traffic Risk Assessment .......................................................................................... 125 10.2 Oil Spill Risk Assessment .................................................................................................. 127
11 REFERENCES ................................................................................................................... 136 Appendix A Qualifications Required for Columbia River and Columbia River Bar Pilotage Appendix B Marine Terminal (Loading) Risk Analysis Appendix C Columbia River Anticipated Vessel Traffic Appendix D MARCS Validation Appendix E Description of MARCS Incident Frequency Model
List of Figures
Figure 1-1 Report Structure .............................................................................................................. 2 Figure 1-2 Risk Assessment Overview ................................................................................................ 3 Figure 2-1 Open (blue) vs. Sheltered Water (green) on Lower Columbia River ......................................... 8 Figure 2-2 Cross Currents in Lower Columbia River .............................................................................. 9 Figure 2-3 Visibility in Lower Columbia River ..................................................................................... 10 Figure 4-1 All AIS Registrations in the Study Area (July 1, 2013 to June 30, 2014) ................................ 17 Figure 4-2 Study Area (Lower Columbia River) .................................................................................. 18 Figure 4-3 Vessel Traffic Density in Lower Columbia River ................................................................... 19 Figure 4-4 Vessel Traffic Density in Columbia River Bar Area ............................................................... 21 Figure 4-5 Vessel Traffic Density in Longview/Kalama Area ................................................................. 22 Figure 4-6 Vessel Traffic Density in Portland/Vancouver Area .............................................................. 23 Figure 4-7 Subarea A ..................................................................................................................... 24 Figure 4-8 Subarea B ..................................................................................................................... 25 Figure 4-9 Subarea C ..................................................................................................................... 26 Figure 4-10 Subarea D ................................................................................................................... 27 Figure 5-1 Global Grounding Frequency Trends, 1980-2010 ................................................................ 35 Figure 6-1 Visual Representation of Scenarios ................................................................................... 44 Figure 6-2 Future Traffic in Subarea A .............................................................................................. 64 Figure 6-3 Future Traffic in Subarea B .............................................................................................. 66 Figure 6-4 Future Traffic in Subarea C .............................................................................................. 68 Figure 6-5 Future Traffic in Subarea D .............................................................................................. 70 Figure 6-6 General Arrangement of a Typical 47,000 DWT Tanker ......................................................... 83 Figure 6-7 Conditional Probability of Spill Volumes Given Collision........................................................ 86 Figure 6-8 Conditional Probability (P50) of Spill Volumes Given Grounding ............................................. 87 Figure 6-9 Oil Spill Risk Due to Marine Transport ............................................................................... 88 Figure 6-10 Oil Spill Risk due to Collision .......................................................................................... 89 Figure 6-11 Oil Spill Risk due to Grounding ....................................................................................... 90 Figure 7-1 Probability of Aberrancy .................................................................................................. 93 Figure 7-2 Probability of Sufficient Energy to Breach a Cargo Tank ....................................................... 94 Figure 7-3 Model for Geometric Probability of Vessel Collision with the Sample Vessel ............................ 95 Figure 7-4 Frequency of Collision and Breach of the Oil Tanker while at the Terminal ............................. 96 Figure 7-5 Conditional Probability (P50) of Spill Volumes Given a Strike ................................................. 97 Figure 7-6 Oil Spill Risk due to Striking at Dock ................................................................................. 98 Figure 8-1 Cargo Loading Risk Methodology ...................................................................................... 99 Figure 8-2 Cargo Loading Oil Release Volumes and Associated Frequencies, Method 1 .......................... 112 Figure 8-3 Oil Spill Risk due to Cargo Loading – Method 1 ................................................................. 114
DNV GL – Report No. PP111860-2, Rev. 5 – www.dnvgl.com Page x

Figure 8-4 Oil Spill Risk due to Cargo Loading (zoomed on most frequent events) ................................ 115 Figure 8-5 Cargo Loading Oil Release Volumes and Associated Frequencies, Method 2 .......................... 116 Figure 8-6 Oil Spill Risk due to Cargo Loading – Method 2 ................................................................. 117 Figure 8-7 Log-Log Method Comparison of Oil Spill Risk due to Cargo Loading ..................................... 118 Figure 8-8 Cargo Loading Method Comparison (Normal Frequency Scale) ........................................... 119 Figure 8-9 Cargo Loading Method Comparison (Logarithmic Frequency Scale) ..................................... 119 Figure 9-1 Oil Spill Grounding Risk of 47,000 DWT Tankers with no tide, 1 m tide, and 3 m tide ............ 121 Figure 9-2 Transit Oil Spill Risk from Sample Vessels with and without Tug Escort Risk Mitigation ........... 123 Figure 9-3 Transit Oil Spill Risk from Sample Vessels with and without Tug Escort Risk Mitigation (log scale) .................................................................................................................................................. 124 Figure 10-1 Cumulative Oil Spill Risk (Log Scale) ............................................................................. 127 Figure 10-2 Cumulative Oil Spill Risk (Log Scale), Smaller Spill Volumes ............................................. 128 Figure 10-3 Cumulative Spill Risk for Sample Vessels in Transit .......................................................... 129 Figure 10-4 Cumulative Oil Spill Risk from Collisions Involving Sample Vessels ..................................... 130 Figure 10-5 Cumulative Oil Spill Risk from Grounding of Sample Vessels.............................................. 131 Figure 10-6 Transit Oil Spill Risk from Sample Vessels with and without Tug Escort Risk Mitigation ........ 132 Figure 10-7 Transit Oil Spill Risk from Sample Vessels with and without Tug Escort Risk Mitigation ......... 133 Figure 10-8 Cumulative Oil Spill Risk from Collision with Sample Vessel at Dock ................................... 134 Figure 10-9 Cumulative Oil Spill Risk from Cargo Loading .................................................................. 135
List of Tables
Table 2-1 Major Ports on the Columbia River ....................................................................................... 5 Table 2-2 Wind Distribution over Lower Columbia River ........................................................................ 6 Table 3-1 Specifications of 47,000 DWT tanker .................................................................................. 14 Table 3-2 Specifications of 105,000 DWT tanker ................................................................................ 14 Table 3-3 Specifications of 165,000 DWT tanker ................................................................................ 14 Table 4-1 Projects Included in Proposed Marine Traffic ........................................................................ 28 Table 5-1 Summary of Studies that Quantify the Effects of Pilotage ...................................................... 32 Table 5-2 Summary of Studies that Quantify the Effects of VTS ........................................................... 34 Table 5-3 Causal Factors in Groundings, 1970-78 (Ref. /18/) ............................................................... 36 Table 5-4 Reductions applied for Performance Shaping Factors ............................................................. 41 Table 6-1 Modeled Incident Frequencies ............................................................................................ 45 Table 6-2 Estimated Annual Incident Frequencies (incidents/yr) for Current Marine Traffic in the Study Area .................................................................................................................................................... 46 Table 6-3 Historical Incident Data for the Study Area, 2002-2013 (Ref. /22/) ........................................ 48 Table 6-4 Comparison of Modeled Incident Frequency with Columbia River Historical Data (2002 – 2013) 49 Table 6-5 Estimated Annual Incident Frequencies (incidents/yr) for Current Marine Traffic in Warrior Rock Area .............................................................................................................................................. 50 Table 6-6 Estimated Annual Incident Frequencies (incidents/yr) for Current Marine Traffic in Confluence Area .............................................................................................................................................. 50 Table 6-7 Estimated Annual Incident Frequencies (incidents/yr) for Current Marine Traffic in Subarea B ... 51 Table 6-8 Estimated Annual Incident Frequencies (incidents/yr) for Current Marine Traffic in Subarea C ... 51 Table 6-9 Estimated Annual Incident Frequencies (incidents/yr) for Current Marine Traffic in Subarea D ... 52 Table 6-10 Estimated Annual Incident Frequencies (incidents/yr) for Sample Vessels in the Study Area ... 53 Table 6-11 Estimated Annual Incident Frequencies (incidents/yr) for Current Marine Traffic with Sample Vessels .......................................................................................................................................... 54 Table 6-12 Estimated Annual Incident Frequencies (incidents/yr) for Sample Vessels (Current Marine Traffic) in Warrior Rock Area of Subarea A .................................................................................................... 55 Table 6-13 Estimated Annual Incident Frequencies (incidents/yr) for Sample Vessels (Current Marine Traffic) in Confluence Area of Subarea A ....................................................................................................... 55 Table 6-14 Estimated Annual Incident Frequencies (incidents/yr) for Current Marine Traffic in Warrior Rock Area of Subarea A ........................................................................................................................... 56 Table 6-15 Estimated Annual Incident Frequencies (incidents/yr) for Current Marine Traffic in Confluence Area of Subarea A ........................................................................................................................... 56
DNV GL – Report No. PP111860-2, Rev. 5 – www.dnvgl.com Page xi

Table 6-16 Estimated Annual incident frequencies for Sample Vessels (Current Marine Traffic) in Subarea B .................................................................................................................................................... 57 Table 6-17 Estimated Annual Incident Frequencies (incidents/yr) for Current Marine Traffic in Subarea B . 58 Table 6-18 Estimated Annual incident frequencies for Sample Vessels (Current Marine Traffic) in Subarea C .................................................................................................................................................... 59 Table 6-19 Annual Incident Frequencies (incidents/yr) for Current Marine Traffic in Subarea C ................ 60 Table 6-20 Estimated Annual Incident Frequencies (incidents/yr) for Sample Vessels (Current Marine Traffic) in Subarea D .................................................................................................................................. 61 Table 6-21 Annual Incident Frequencies (incidents/yr) for Current Marine Traffic in Subarea D ................ 62 Table 6-22 Estimated Annual Incident Frequency for Future Marine Traffic in the Study Area................... 63 Table 6-23 Estimated Annual Incident Frequencies (incidents/yr) for Future Marine Traffic in Warrior Rock Area of Subarea A ........................................................................................................................... 65 Table 6-24 Estimated Annual Incident Frequencies (incidents/yr) for Future Marine Traffic in Confluence of Subarea A ...................................................................................................................................... 65 Table 6-25 Estimated Annual Incident Frequencies (incidents/yr) for Future Marine Traffic in Subarea B ... 67 Table 6-26 Estimated Annual Incident Frequencies (incidents/yr) for Future Marine Traffic in Subarea C ... 69 Table 6-27 Estimated Annual Incident Frequencies (incidents/yr) for Future Marine Traffic in Subarea D ... 71 Table 6-28 Estimated Annual Incident Frequencies (incidents/yr) for Sample Vessels (Future Marine traffic) in the Study Area ............................................................................................................................ 72 Table 6-29 Annual incident frequencies for Future Marine Traffic in the Study Area ................................ 73 Table 6-30 Estimated Annual Incident Frequencies (incidents/yr) for Sample Vessels (Future Marine Traffic) in Warrior Rock Area of Subarea A .................................................................................................... 74 Table 6-31 Estimated Annual Incident Frequencies (incidents/yr) for Sample Vessels (Future Marine Traffic) in Confluence of Subarea A .............................................................................................................. 74 Table 6-32 Estimated Annual Incident Frequencies for Future Marine Traffic in Warrior Rock Area of Subarea A .................................................................................................................................................. 75 Table 6-33 Estimated Annual Incident Frequencies (incidents/yr) for Future Marine Traffic in Confluence of Subarea A ...................................................................................................................................... 75 Table 6-34 Estimated Annual Incident Frequencies (incidents/yr) for Sample Vessels (Future Marine Traffic) in Subarea B .................................................................................................................................. 76 Table 6-35 Estimated Annual Incident Frequencies (incidents/yr) of Future Marine Traffic in Subarea B .... 77 Table 6-36 Estimated Annual Incident Frequencies (incidents/yr) of Sample Vessels (Future Marine Traffic) in Subarea C .................................................................................................................................. 78 Table 6-37 Estimated Annual Incident Frequencies (incidents/yr) of Future Marine Traffic in Subarea C .... 79 Table 6-38 Estimated Annual Incident Frequencies (incidents/yr) for Sample Vessels (Future Marine Traffic) in Subarea D .................................................................................................................................. 80 Table 6-39 Estimated Annual Incident Frequencies (incidents/yr) of Future Marine Traffic in Subarea D .... 81 Table 6-40 Estimated Annual Cargo Oil Spill Frequency for Sample Vessels in the Study Area (Current Marine Traffic) ................................................................................................................................ 82 Table 6-41 Estimated Annual Cargo Oil Spill Frequency for Sample Vessels in the Study Area (Future Marine Traffic) ................................................................................................................................ 82 Table 6-42 Sample Vessels Representing Vancouver Energy Terminal Tankers ...................................... 83 Table 6-43 Sample Vessel Cargo Tank Sizes ...................................................................................... 84 Table 7-1 Number of and Characteristics of Vessels within 0.4 NM (2013) ............................................. 92 Table 8-1 List of Isolatable Sections and Isolatable Volumes ............................................................. 100 Table 8-2 Hole Sizes for Pipes ....................................................................................................... 101 Table 8-3 Portion of a Year when Loading Occurs per Sample Vessel .................................................. 103 Table 8-4 Oil Release Frequency per Scenario and Isolatable Section ................................................. 104 Table 8-5 Transfer Operation Oil Spill Frequencies – Method 1 ........................................................... 105 Table 8-6 Transfer Operation Oil Spill Frequencies – Method 2 ........................................................... 106 Table 8-7 Oil Spill Volume per Scenario .......................................................................................... 107 Table 8-8 Method 1 Representative Isolation Times (in minutes)........................................................ 109 Table 8-9 Transfer Operation Oil Spill Volume per Scenario – Method 1 .............................................. 110 Table 8-10 Oil Transfer Spills (300+ GRT Vessels) into US Navigable Waters 1985-2004 (Ref. /28/) ..... 110 Table 8-11 Transfer Operation Oil Spill Volume per Scenario – Method 2............................................. 111 Table 9-1 Drift Grounding Frequencies with and without Tug Escort .................................................... 122
DNV GL – Report No. PP111860-2, Rev. 5 – www.dnvgl.com Page xii

Units
bbl Barrel DWT Deadweight Ton ft3 Cubic Foot GRT Gross Register Ton m Meter m3 Cubic Meter MJ Mega Joule mm Millimeter NM Nautical Mile t Ton yr Year
Acronyms and Definitions of Terms
AASHTO American Association of State Highway and Transportation Officials Accident An unintentional event that results in unwanted consequences; in this study it is
an oil spill. AIS Automatic Identification System. It is an automatic tracking system that allows
vessels to identify and locate other vessels for the purpose of collision avoidance. Allision The running of a ship upon a stationary object. AM Amplitude Modulation. AtoN Aids to Navigation. Cargo/Carrier (AIS type) Consists of bulk carriers, vehicle carriers, containerships, and general cargo ships. AtoN Aids to Navigation. CD Compact Disc. COC Certificate of Compliance. COI Certification of Inspection. Consequence A measure of the expected effects of an unwanted event. Critical situation Used in the navigation model to identify physical parameters of the route that
might pose navigation challenges under certain circumstances. A specific type of navigation hazard. See Hazard.
Current Marine Traffic Defined by AIS data collected for the year, from July 1, 2013 to June 30, 2014. DGPS Differential Global Positioning System. ECDIS Electronic Chart Display and Information System. ENC Electronic Navigation Chart. Encounters Is defined in this study as two vessels within 0.5 NM of each other while in transit.
This is considered a critical situation for collision in the Columbia River and on the Columbia River Bar.
EPA US Environmental Protection Agency. ESD Emergency Shutdown. ESDV Emergency Shutdown Valve. Fishing vessels (AIS Type) Consists of fishing vessels, factory trawlers, and fishery patrol vessels. Foundering Flooding; filling with water and sinking. Frequency The number of occurrences of a repeating event per unit time. FSA Formal Safety Assessment. Future project traffic Traffic associated with future project coming to fruition on the Lower Columbia
River. GPS Global Positioning System. Grid cell An area of 0.01 x 0.01 decimal degrees that is used to define vessel traffic
density.
DNV GL – Report No. PP111860-2, Rev. 5 – www.dnvgl.com Page xiii

Gross Registered Tonnage (GRT)
The volume of space within the hull and the enclosed space above the deck of a ship that is intended to accommodate cargo, stores, fuel, passengers and crew.
Hazard A chemical or physical condition that has the potential for causing damage to people, property, or the environment.
HCRD Hydrocarbon Release Database IMO International Maritime Organization. Incident A sudden departure, intended or unintended, from normal conditions, in which
some degree of harm is caused. A marine event is the realization of a hazard during marine transport.
ISM International Safety Management. ISSC International Ship Security Certificate. LNG Liquefied Natural Gas. LOA Length overall. MARCS Marine Accident Risk Calculation System. MVCU Marine Vapor Combustion Unit. NCDC National Climate Data Center NOAA National Ocean and Atmospheric Administration. OCIMF Oil Companies International Marine Forum. OFAC Office of Foreign Asset Control. Other vessels (AIS Type) Consists of offshore supply ships, multi-purpose offshore vessels, inland supply
vessels, cable layers, and buoy-laying vessels. Passenger vessels (AIS Type)
Consists of passenger ships, RO-RO/passenger ships, and inland passenger ships.
PHMSA Pipeline and Hazardous Safety Administration. Pilotage A service provided to vessels on the Columbia River Bar and Columbia River by
uniquely qualified mariners with specific knowledge of the waterways to assist in safely guiding ships to their destination.
Pleasure vessels (AIS Type)
Consists of yachts and recreational vessels.
PORTS Physical Oceanographic Real-Time System. PPU Portable Pilot Unit. Proposed Marine Traffic Future projects’ traffic as defined in Table 4-1 4. PSC Port State Control. PSF Performance Shaping Factors. QRA Quantitative Risk Assessment. Risk A measure of human injury, environmental damage, or the economic loss in terms
of both the likelihood and damage or loss. This study focuses on risk in terms of the likelihood and volume of oil spilled.
RM River Mile. Sample Vessels Tankers that are assumed in this study to load at Vancouver Energy Terminal. The
Sample Vessels include three sizes of tankers: 47,000 DWT, 105,000 DWT and 165,000 DWT.
SDN Specialty Designated Nationals. Service vessels (AIS Type) Consists of icebreakers, research/survey vessels, trailing suction hopper dredges,
logistic naval vessels, combat vessels, hospital vessels and replenishment vessels. SIL Safety Integrity Level SIRE Ship Inspection Reports Exchange. SMS Safety Management System. SOLAS International Convention for the Safety of Life at Sea, promulgated by the
International Maritime Organization. Tankers (AIS Type) Consists of oil/chemical, crude oil, oil products, and LPG tankers. TCA Time Charter Agreement. TSS Traffic Separation Schemes. Tugs (AIS Type) Consists of towing vessels, articulated pusher tugs, and all types of tugs.
DNV GL – Report No. PP111860-2, Rev. 5 – www.dnvgl.com Page xiv

TV32 Transview 32. A navigation tool used by River Pilots to navigate deep-draft vessels on the Lower Columbia River.
UKC Under Keel Clearance. Undefined (AIS Type) These are vessels that did not have an identifiable vessel type in AIS. USACE US Army Corps of Engineers. USCG US Coast Guard. Vessel traffic density The number of AIS data signals received per unit time in a (0.01 x 0.01 decimal
degree) grid cell. VHF-FM Very High Frequency-Frequency Modulation. VTIS Vessel Traffic Information System. VTS Vessel Traffic Systems.
DNV GL – Report No. PP111860-2, Rev. 5 – www.dnvgl.com Page xv

1 INTRODUCTION
Tesoro Savage Petroleum Terminal LLC proposes to construct and operate the Vancouver Energy Terminal, a crude-by-rail terminal that would be capable of receiving an average of 360,000 bbl of crude oil per day, temporarily storing it onsite, and loading it onto double hull oil tankers for shipment to refineries located primarily on the West Coast of North America. State licensed Columbia River Pilots will navigate the loaded vessels approximately 75 miles down the Lower Columbia River to Astoria where a State licensed Columbia River Bar Pilot will board and navigate the vessel from Astoria across the Columbia River Bar to sea (Ref. /1/).
This assessment focused on risk from marine operations, including loading and vessel transit down the river and past the Columbia Bar. The study area was limited to the Columbia River, from the I-5 Bridge at river mile (RM) 105 to 12 nautical miles off the coast of Oregon.
1.1 Objectives The objectives of this risk assessment are to:
• Provide an overview of traffic in the study area, and identify areas that may or may not be impacted by Vancouver Energy Terminal’s tanker traffic.
• Assess marine safety risks during transit.
• Assess marine safety risks during loading.
• Provide a basis to make informed choices about future events.
This study does not account for spill response measures or fate and transport of oil.
DNV GL – Report No. PP111860-2, Rev. 5 – www.dnvgl.com Page 1


2.1 Ports on the Columbia River Table 2-1 lists the major ports on the Columbia River as well as information on the primary vessel types each port receives and general information about each port (Ref. /3/).
Table 2-1 Major Ports on the Columbia River Port River Mile Vessel Types Port Information
Astoria, OR 12 Cruise ships, naval vessels, general cargo.
Cruise ship terminals, log exports, bulk oil
Longview, WA 65 General cargo, break bulk, log ships.
Exports calcined coke, forest products (1 to 1.2 million tons on average per year), grain products like corn, wheat, soybeans (over 4 million tons per year). Bulk liquids. Imports steel, salt, wind energy cargo (slightly less than half a million tons on average per year)
Kalama, WA 75 Tank Vessels, Bulk/Break bulk
43-foot channel. 9.2 million tons exports (corn, wheat, soybeans, barley), over 360,000 tons imports (steel products, benzene, toluene, logs), specialty chemicals.
St. Helens, OR 85 Log ships, tankers, dry bulk carriers. Exports/Imports forestry products and gypsum
Vancouver, WA 105
General cargo, break bulk, tank vessels, barges, Ro-Ro and PCC.
Exports grain products (wheat, corn, beans), scrap metal, wood pulp, bulk minerals (4 to 5 million tons on average per year) Imports steel, automobiles, wind energy cargo, pulp, liquid bulks (up to 1 million tons on average per year)
Portland, OR Mile 10 of Willamette River
General cargo, container carriers, break bulk, tank vessels, barges, Ro-Ro and PCC.
Exports grain products (wheat, corn, beans), soda ash, pot ash, hay, paper stock, general cargo (11 million tons on average per year). Bulk oil. Imports steel, autos, cement/limestone, general cargo (5 million tons on average per year). Private petroleum and ship fueling services. Large Deep Draft Dry Dock and shipyard
2.2 Anchorage Areas It is the policy of Vancouver Energy Terminal to not allow any laden vessels to anchor in the river. However, to provide a thorough description of the route, anchorages were identified.
There are ten designated anchorage areas along the Columbia River listed in the Lower Columbia River Harbor Safety Plan. Vancouver Energy Terminal and the Columbia River Pilots have stated that they intend to commence an outbound transit of the Columbia River only when assured that the vessel can safely transit without stopping to anchor based on tide and weather. However, there may be occasions when an empty vessel would have to wait or anchor for scheduling purposes (i.e., awaiting a dock).
General guidelines for procedures, notifications, and communications for all anchorages on the Lower Columbia Region are detailed in the Lower Columbia Region Harbor Safety Plan (Ref. /4/).
2.3 Hard Bottom Areas and Shoaling Waters The US Army Corps of Engineers (USACE) monitors river depths and updates information that is available to the Pilots, as described in Section 5.2.3. This section describes shoals and bottom surfaces from a general navigation context and identifies areas along the river with shoaling and hard/rocky bottoms.
DNV GL – Report No. PP111860-2, Rev. 5 – www.dnvgl.com Page 5

There is a tendency for the shoal north of Clatsop Spit to build up to the northwest because of spring freshets and northwest storms (Ref. /5/). Shoaling is also common at Desdemona Sands; however both shoal areas are well out of the navigation channel. Shoaling is also common between RM 25 and RM 27, and before RM 90 on the northwest side of Bachelor Island.
There are rocks on the north side of the river at Welch Island Reach, near RM 33. This area is well marked by a Red, Quick Flashing buoy “28.” There are also rocks near Warrior Point, at approximately RM 87. The rocks are well marked by Warrior Rock Light, Warrior Rock Turn Buoy “1,” Warrior Rock Reef Buoy “4,” and the Warrior Rock Range for downbound vessels.
The Columbia River bed deposits predominantly consist of soft alluvial fan with a few dense formations. The identified dense formations are located in the following locations (Ref. /6/; Ref. /7/):
• Sand Island. • Bunker Hill.
• Harrington Point. • Copper Point.
• Pillar Rock. • Goat Island’s Tybu Ledge.
• Rockland/Skamokawa. • Kalama.
• Bugby Hole. • Warrior Rock Reach.
2.4 Wind, Sea State and Surface Currents Data from the National Ocean and Atmospheric Administration’s (NOAA) National Climate Data Center were used to obtain wind speed and direction information (Ref. /7/ and Ref. /8/). Wind was categorized as calm, fresh, gale and storm, in accordance with the Beaufort scale for sea state. Table 2-2 summarizes the percentage of wind conditions, over time, at various weather stations on the Columbia River3. To assure that only valid data were used in the analysis, data that NOAA classified as “blank,” ”suspect,” “erroneous,” and “questionable” were excluded from this analysis.
Table 2-2 Wind Distribution over Lower Columbia River Columbia River Bar knots E NE N NW W SW S SE
Calm 0 - 20 10.8% 6.9% 9.8% 18.1% 5.6% 15.7% 14.5% 9.9%
Fresh 20 - 30 0.9% 0.5% 0.8% 1.4% 0.4% 1.2% 1.1% 0.8%
Gale 30 - 45 <0.1% <0.1% <0.1% <0.1% <0.1% <0.1% <0.1% <0.1%
Storm > 45 <0.1% <0.1% <0.1% <0.1% <0.1% <0.1% <0.1% <0.1%
3 There are certain times when the river reverses direction near Vancouver due to tidal reach. This does not affect the results of this study.
DNV GL – Report No. PP111860-2, Rev. 5 – www.dnvgl.com Page 6

Astoria knots E NE N NW W SW S SE
Calm 0 - 20 14.3% 5.2% 5.9% 12.8% 15.8% 18.8% 14.6% 11.2%
Fresh 20 - 30 <0.1% <0.1% <0.1% <0.1% <0.1% <0.1% <0.1% <0.1%
Gale 30 - 45 0% 0% 0% 0% 0% 0% 0% 0%
Storm > 45 0% 0% 0% 0% 0% 0% 0% 0%
Longview knots E NE N NW W SW S SE
Calm 0 - 20 5.4% 5.2% 13.7% 16.4% 12.8% 5.5% 16.6% 24.5%
Fresh 20 - 30 <0.1% <0.1% <0.1% <0.1% <0.1% <0.1% <0.1% <0.1%
Gale 30 - 45 0% 0% 0% 0% 0% 0% 0% 0%
Storm > 45 0% 0% 0% 0% 0% 0% 0% 0%
Scappoose (St Helens) knots E NE N NW W SW S SE
Calm 0 - 20 4.8% 2.7% 21.8% 14.6% 10.9% 6.9% 23.1% 15.1%
Fresh 20 - 30 0% 0% 0% 0% 0% 0% 0% 0%
Gale 30 - 45 0% 0% 0% 0% 0% 0% 0% 0%
Storm > 45 0% 0% 0% 0% 0% 0% 0% 0%
Pearson
(Vancouver) knots E NE N NW W SW S SE
Calm 0 - 20 12.8% 6.2% 9.3% 17.7% 12.1% 9.7% 13.5% 18.7%
Fresh 20 - 30 <0.1% <0.1% <0.1% <0.1% <0.1% <0.1% <0.1% <0.1%
Gale 30 - 45 0% 0% 0% 0% 0% 0% 0% 0%
Storm > 45 0% 0% 0% 0% 0% 0% 0% 0%
DNV GL – Report No. PP111860-2, Rev. 5 – www.dnvgl.com Page 7

Sea state depends on wind speed, tide, and how sheltered the water is. Because wave height data was not available along the entire route, wind speed was used in the analysis to infer sea state based on whether an area of water was considered to be “open” or “sheltered.” Figure 2-1 shows the areas where the sea state was identified as open or sheltered.
Figure 2-1 Open (blue) vs. Sheltered Water (green) on Lower Columbia River
DNV GL – Report No. PP111860-2, Rev. 5 – www.dnvgl.com Page 8

Surface currents on the Columbia River generally flow in the northwest direction, as Columbia River water runs from its origins to the Pacific Ocean. Current speed is typically one to three knots throughout the study area, and cross currents exist in several areas.
Figure 2-2 below shows the cross currents in the study area (Ref. /7/):
• Tongue Point coming out of North Channel.
• Tongue Point Range where Woody Island Channel crosses main ship channel.
• Brookville Clifton channel to main ship channel.
• Pillar Rocks.
• Longview where Cowlitz River enters main ship channel.
• Mouth of Willamette River.
Figure 2-2 Cross Currents in Lower Columbia River
DNV GL – Report No. PP111860-2, Rev. 5 – www.dnvgl.com Page 9

2.5 Visibility Ten years of visibility data from NOAA’s NCDC was used (July 1, 2004 to June 30, 2014) (Ref. /7/). Data was not available for the entire ten year period at all weather stations, either because some stations were installed after 2004 or due to periods of maintenance. Information on visibility at the Columbia River Bar was taken from United States Coast Guard’s (USCG) Lower Columbia River Port Risk Assessment conducted in 2000 (Ref. /9/).
Figure 2-3 presents the percentage of good versus poor visibility (hourly) at various locations on the Columbia River. For the purpose of this analysis, poor visibility is defined as less than 2 NM. The figure shows that the visibility is variable throughout the waterway. The visibility percentages in Figure 2-3 were applied to each subarea, represented by the colored boxes. Subarea A was subdivided to reflect the differences in the two data collection locations.
Figure 2-3 Visibility in Lower Columbia River
DNV GL – Report No. PP111860-2, Rev. 5 – www.dnvgl.com Page 10

2.6 Departure from and Arrival at Vancouver Energy Terminal All vessels will be under the direction of a Columbia River Pilot and have the assistance of two docking / undocking tugs. The qualification standards for Columbia River Pilots are outlined in Appendix A.
After loading, laden vessels will undock with the assistance of two docking tugs and a Pilot to safely come off the dock, make the turn to starboard and transit down the river.
All vessels will arrive at the terminal in ballast. Ballasted vessels will moor at the terminal port side to.
2.7 River Transit Vancouver Energy Terminal vets all ships before the ship enters the Columbia River for loading. Refer to Section 5.2.10 for more information on the vetting process.
Pilotage is compulsory for all vessels associated with the Vancouver Energy project. A Columbia River Pilot boards the vessel at the terminal and conducts a pre-departure safety meeting with the ship's Captain, exchanging information before assuming pilotage duties (“Master Pilot Exchange"). This information exchange typically includes:
• Any vessel deficiencies.
• Drafts fore and aft.
• Air draft corrected for trim.
• Location of navigation equipment.
• Type of propulsion.
• Propeller type and rotation.
• Engine notice requirements.
• Thruster status/horsepower, if equipped.
• Maneuvering speeds of vessel.
• Known errors in the gyrocompass.
• Any deficiencies or unusual characteristics of the navigation or ship control systems.
The Master/Pilot Exchange will also confirm the following:
• The Captain is immediately available at all times.
• An officer fluent in English is to be on the bridge at all times.
• The helm is manned with qualified a helmsman.
• A proper lookout is posted and direct communications are available.
• Anchors stations are sufficiently manned, ready for immediate and controlled release.
DNV GL – Report No. PP111860-2, Rev. 5 – www.dnvgl.com Page 11

The intended Passage Plan including:
• Anticipated traffic.
• Anticipated tides, currents and weather.
• Speed restrictions.
• Minimum underkeel/airdraft clearances.
• Tank vessel escort regulations.
• Berthing/unberthing plan.
The navigation channel is maintained at a depth of 43 feet and a minimum width of 600 feet for most of the route. The channel widens near Astoria and depths are approximately 55 feet. The route is characterized by several locations with limited visibility due to high ground in the vicinity of turns. Traffic is managed in these areas by cooperative coordination and agreements between Pilots, using various shipboard navigation instruments, as well as the Pilots own unique navigation tool, Transview 32 (TV32). TV32 is used to identify other vessels on the river (underway, anchored, or tied to a dock). It identifies a specific vessel’s location, course, and speed and allows coordination of safe meeting and passing along the route. TV32 is further described in Section 5.2.3 of this report. The channel passes beneath the Longview Bridge, with vertical clearances of 198 feet and a horizontal clearance of 1,085 feet, and the Astoria Bridge, with a vertical clearance of 208 feet and a horizontal clearance of 1,070 feet (Ref. /5/).
Passing vessels (encounters) are common in a river environment. The transit from the terminal in Vancouver to the Columbia River Bar takes approximately 8 hours.
2.8 Bar Transit Passing Astoria, the Columbia River Pilot will be relieved by a Columbia River Bar Pilot. A Columbia River Bar Pilot will guide the vessel across the bar to a point approximately 3 NM offshore from the mouth of the river. The Pilotage area actually extends out to 12 NM offshore, to allow for adequate sea room for vessels to maneuver, providing the safest position for Pilots to disembark. Pilots board either by helicopter or Pilot boat.
The tidal current velocity at the bar is 3.5 knots, but it is modified by the river discharge. On the flood, there is a set toward Clatsop Spit; on the ebb the current sets along the line of buoys. Heavy breakers have been reported as far inside the entrance as Buoy 20, north of Clatsop Spit (Ref. /5/).
The Columbia River Bar is characterized by changes in the currents often accompanied by breakers. The ebb currents on the north side of the bar attain velocities of 6 to 8 knots. Northwest winds occasionally cause currents to set north, or against the wind, in the area outside the jetties. In the entrance the currents are variable, and can reach a velocity of over 5 knots on the ebb. On the flood, they seldom exceed a velocity of 4 knots.
The Coast Guard maintains a recorded bar and weather forecast report to monitor conditions as they change. The recording is updated every 3 hours during daylight or when weather conditions change. Bar conditions are also broadcast over two amplitude modulation (AM) radio frequencies at 15 minute intervals. In addition, Coast Guard Station Cape Disappointment can be contacted via very high frequency-frequency modulation (VHF-FM) Channel 16 at all times for conditions on the bar.
DNV GL – Report No. PP111860-2, Rev. 5 – www.dnvgl.com Page 12


Table 3-1 Specifications of 47,000 DWT tanker Description Specification Length overall (LOA) 183.2 m (601 feet) Breadth 32.2 m (105.6 feet)
Summer Draft 12.2. m (40 feet) Type of Hull Double Hull
Lightship Freeboard 16.5 m (54.1 feet)
Total Advertised Capacity (98%) 52,733 m3 (331,681 bbl) distributed among 12 cargo tanks
Table 3-2 Specifications of 105,000 DWT tanker Description Specification LOA 243.8 m (799.9 feet)
Breadth 42 m (137.8 feet) Summer Draft 15.0 m (49.2 feet)
Type of Hull Double Hull Lightship Freeboard 18.6 m (61 feet)
Total Advertised Capacity (98%) 127,515 m3 (802,050 bbl) distributed among 12 cargo tanks4
Table 3-3 Specifications of 165,000 DWT tanker Description Specification LOA 274.5 m (900.6 feet) Breadth 48.0 m (157.5 feet)
Summer Draft 16.3 m (53.5 feet) Type of Hull Double Hull
Lightship Freeboard 20.5 m (67.3 feet)
Total Advertised Capacity (98%) 171,732 m3 (1,080,200 bbl) distributed among 12 cargo tanks4
4 These vessels will only be loaded to a maximum of 600,000 bbl at Vancouver Energy
DNV GL – Report No. PP111860-2, Rev. 5 – www.dnvgl.com Page 14

3.2 Terminal Description The terminal will receive crude oil by rail which will be stored in double-bottom, internal floating-roof aboveground storage tanks. Automatic tank level sensors and tank gauging systems will ensure operators are aware of tank volumes at all times. The tanks will include a leak detection system between the double-bottom tank floors, and will be cathodically protected to prevent corrosion. The tanks will be enclosed by a containment berm approximately six feet in height. The entire tank containment area will be equipped with a storm water collection and treatment system and will be lined with an impervious membrane to prevent spills from infiltration into the soil.
The loading system will incorporate automatic shutoff valves with a 30-second maximum shutoff time. The pipelines serving the dock will undergo annual testing as required by 33 CFR Part 156.170 and will be inspected by the US Coast Guard to verify compliance. A fire water pump house will contain an emergency fire pump and fire foam will be available in the pump house.
Storm water catchment will be treated through a storm water control system. A catchment will be constructed at or below the deck level for the containment of inadvertent releases in addition to storm water that may fall in the catchment area. The containment is configured with an automatic level detection sensor that will pump any liquids into the return line or an approved treatment system. Cargo Loading
Approximately one tanker will be loaded per day. Vancouver Energy anticipates that all of the tankers loading at the terminal will be 47,000 DWT; two other vessel sizes were included in this assessment because the vessel types visiting the terminal could change at some undefined time in the future.
For the purposes of this assessment, it was assumed that 79% of all tanker loadings were the 47,000 DWT tanker. The additional vessels were represented in the assessment as comprising 20% (105,000 DWT) and 1% (165,000 DWT) of the annual calls per year.
Loading will utilize three variable speed pumps with a fourth pump on standby. During loading, all vapors will be sent to a Marine Vapor Combustion Unit (MVCU), which will combust the hydrocarbons in the vapors.
A fixed boom, typically called a fence boom, will be placed between the vessel and the shoreline. Floating booms will be deployed prior to the transfer after the vessel is moored; and will connect with the fixed fence boom on the upstream and downstream ends to fully enclose the vessel.
An assessment of oil spill risk from loading operations (volume and frequency of spill occurring) was also performed. The results of the assessment are included in Appendix B of this report.
DNV GL – Report No. PP111860-2, Rev. 5 – www.dnvgl.com Page 15


Figure 4-1 shows the study area, AIS traffic, and the route of Sample Vessels (in yellow). Other frequently travelled routes are also indicated on the map. The Sample Vessel route extends from Vancouver, WA (i.e., RM 103.5) to 12 NM off the coast in the Pacific Ocean.
Figure 4-1 All AIS Registrations in the Study Area (July 1, 2013 to June 30, 2014)
The route of the Sample Vessels was defined based on routes currently sailed by cargo and tanker vessels. The study area was defined by the following coordinates in decimal degrees:
Latitude Longitude NW Point 46.38333 N 124.45 W NE Point 46.38333 N 122.65 W SE point 45.58333 N 122.65 W SW Point 45.58333 N 124.45 W
DNV GL – Report No. PP111860-2, Rev. 5 – www.dnvgl.com Page 17

The route was divided into four subareas. The route segments are indicated by colored boxes in Figure 4-2.
Figure 4-2 Study Area (Lower Columbia River)
AIS data was used to map vessel traffic density of the study area. Vessel traffic density was defined as the number of data returns received via AIS within a predefined area over a set period of time. Vessel position data was divided into grid cells. Data included within each grid cell was processed and converted to the number of vessel transits.
Note that the number of AIS points within a grid cell corresponds to the number of data returns received from all vessels AIS transponders. Each AIS data signal transmits the time stamp, ship’s identity and location. The vessel track was approximated by matching the location of the data transmission and the time it was sent to the identity of a vessel.
A location with higher vessel traffic density was a location with a greater number of data signals. If the AIS data signal from a ship remains at a location, it indicates that a ship was not moving (e.g., moored or anchored). Therefore, high vessel traffic density can represent slower or stationary vessels and not necessarily a larger number of vessels.
DNV GL – Report No. PP111860-2, Rev. 5 – www.dnvgl.com Page 18

4.1.1 Study Area Figure 4-3 is a “heat map” showing the relative density of traffic along the entire route. It is a cumulative picture of all vessels transiting the Columbia River. The AIS data recorded more than 10,000 vessel transits over the Columbia River Bar between July 1, 2013 and June 30, 2014, and of these, 6,600 transits continued upriver beyond Astoria. It is inferred that the vessels that do not continue beyond Astoria (approximately 4,100 transits) were vessels bound for Hammond, Astoria, Ilwaco or Chinook.
Figure 4-3 Vessel Traffic Density in Lower Columbia River
DNV GL – Report No. PP111860-2, Rev. 5 – www.dnvgl.com Page 19

Figure 4-4 shows the Columbia River Bar and the ports of Hammond, Astoria, Ilwaco and Chinook. The bar crossing to Ilwaco was a commonly transited area by fishing vessels and pleasure vessels. About 46% of pleasure traffic from the Pacific travelled to Astoria. Most of the remaining pleasure traffic travelled to Ilwaco and Chinook with a small percentage transiting upriver.
DNV GL – Report No. PP111860-2, Rev. 5 – www.dnvgl.com Page 20

Figure 4-4 Vessel Traffic Density in Columbia River Bar Area
There was relatively greater traffic density in the anchorage area near Astoria.
The majority of passenger vessel traffic stayed within the river and did not cross the bar. A total of 42 passenger vessel transits were recorded in the Columbia River Bar, and 598 passenger vessel transits were recorded in the vicinity of Astoria.
DNV GL – Report No. PP111860-2, Rev. 5 – www.dnvgl.com Page 21

Figure 4-5 shows the Ports of Longview and Kalama. There were 8,400 vessel transits at Longview around the mouth of the Cowlitz River, and 6,800 transits near Kalama. This accounts for both inbound and outbound traffic, as well as vessels on a single voyage past both ports. The river near Longview is predominantly transited by tugs, and has twice as many transits than cargo carrier transits.
Figure 4-5 Vessel Traffic Density in Longview/Kalama Area
Note darker areas on the turns, suggesting vessels slow on turns, and therefore send more AIS signals per distance travelled.
DNV GL – Report No. PP111860-2, Rev. 5 – www.dnvgl.com Page 22

Figure 4-6 shows the river from Scappoose, OR to Vancouver, WA. The region was primarily transited by tugs and cargo/carriers. More than 7,300 transits were recorded at the confluence of the Willamette and Columbia Rivers near Hewlett Point, and 18,800 transits at Vancouver. At the confluence, tugs make up 60% of the overall traffic; approximately 4,400 transits. Cargo/carriers make up 25% of the traffic with about 1,850 transits. At Vancouver, tugs comprise of 83% of the traffic with approximately 15,650 transits. Cargo/carriers make up 6% of the traffic in the same area with about 1,070 transits.
Figure 4-6 Vessel Traffic Density in Portland/Vancouver Area
DNV GL – Report No. PP111860-2, Rev. 5 – www.dnvgl.com Page 23

4.1.2 Subarea A Figure 4-7 shows Subarea A, where Sample Vessels will be loaded. Marine traffic in Subarea A navigates downriver towards Kalama and upriver towards Vancouver in co-flow (going the same direction) or counter-flow (in opposite directions). The segment is further divided into the “confluence”6 and “Warrior Rock”7 areas. For deep-draft vessels, the only area where there is no co- or counter-flow is from RM 84 to RM 90 near Warrior Rock; in this area, there is cooperative coordination between River Pilots where no overtaking or meeting occurs.
Figure 4-7 Subarea A
6 The “confluence” area is between 45.7633 N and 45.58333 N, where the Lower Columbia River and Willamette River converge. 7 The “Warrior Rock” area is between 45.58333 N and 45.95472 N, in the vicinity of Warrior Rock.
DNV GL – Report No. PP111860-2, Rev. 5 – www.dnvgl.com Page 24
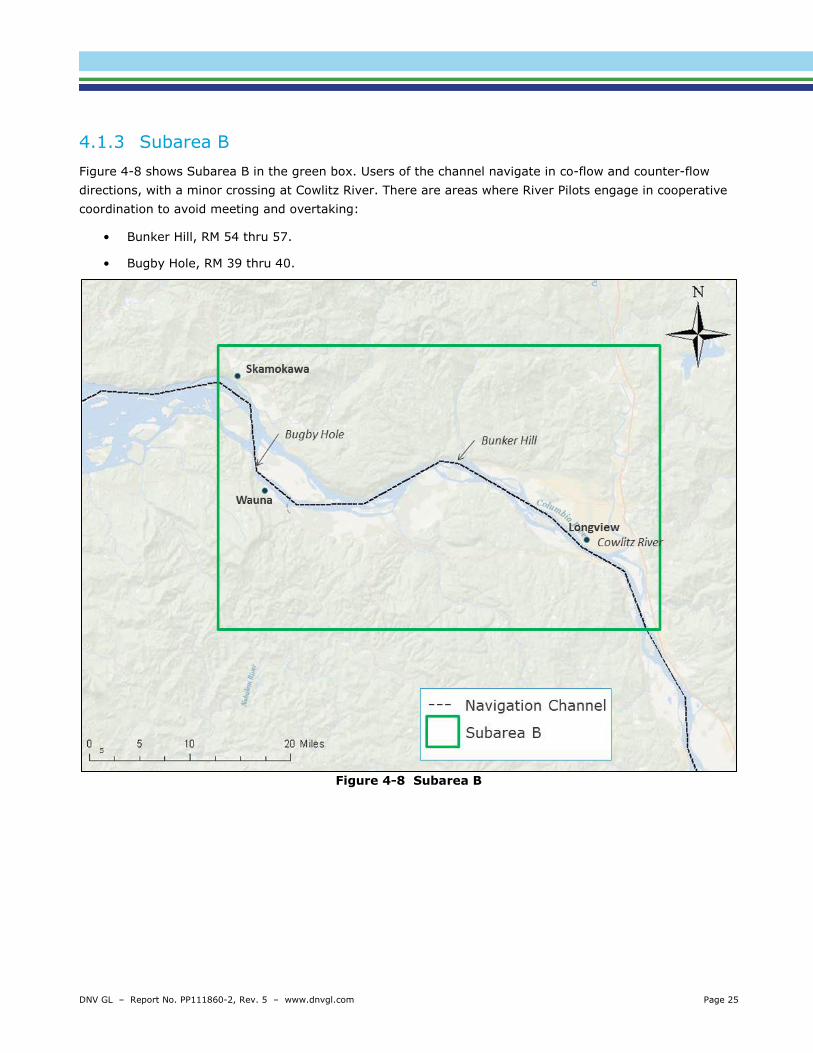
4.1.3 Subarea B Figure 4-8 shows Subarea B in the green box. Users of the channel navigate in co-flow and counter-flow directions, with a minor crossing at Cowlitz River. There are areas where River Pilots engage in cooperative coordination to avoid meeting and overtaking:
• Bunker Hill, RM 54 thru 57.
• Bugby Hole, RM 39 thru 40.
Figure 4-8 Subarea B
DNV GL – Report No. PP111860-2, Rev. 5 – www.dnvgl.com Page 25

4.1.4 Subarea C Figure 4-9 shows Subarea C outlined in yellow. Users of the channel navigate in co-flow and counter-flow directions. Down river from Skamokawa, marine traffic navigates past Pillar Rock and Miller Sands. There is cooperative coordination between River Pilots to avoid meeting and overtaking at:
• Brookfield, RM 28 thru 34.
• Miller Sands, RM 22 thru 23.
Near Astoria is the Pilot transfer station where vessels exchange Bar Pilots and River Pilots.
Figure 4-9 Subarea C
DNV GL – Report No. PP111860-2, Rev. 5 – www.dnvgl.com Page 26

4.1.5 Subarea D Figure 4-10 shows the area where marine traffic enters the Pacific Ocean across the Columbia River Bar. The navigation channel travels between Peacock Spit and Clatsop Spit.
Figure 4-10 Subarea D
DNV GL – Report No. PP111860-2, Rev. 5 – www.dnvgl.com Page 27

4.2 Proposed Marine Traffic BergerABAM researched several proposed new and expanding terminals (projects) on the Lower Columbia River. This was completed by first creating a baseline of all potential projects as of February 2015. Only publically-known projects and projects that have the potential to increase current marine traffic were considered. Their research was for compliance with the State Environmental Policy Act, which provides a way to identify possible environmental impacts from government decisions such as issuing permits for private projects. Table 4-1 contains the list of projects from BergerABAM; the estimated traffic volumes for future projects are discussed in detail in Appendix C.
Table 4-1 Projects Included in Proposed Marine Traffic
Project Name and Location Product No. of, Vessel Class ,and Frequency Status
Canpotex Portland, OR Potash 50 x 75,000 DWT Panamax calls annually Announced expansion
Export Grain Longview, WA Grain 200 x 75,000 DWT Panamax calls annually Complete in 2012
Global Partners Clatskanie, OR Crude Oil and Ethanol
132 x 75,000 DWT Panamax calls annually
Expansion construction to begin in 2015
Haven Energy Longview, WA Propane and Butane
30 LPG Tanker calls annually. Typical length 750 feet Announced
Kalama Export Kalama, WA Grain Additional 31 x 75,000 DWT Panamax calls annually
Expansion complete in 2011
Kinder Morgan Portland, OR Soda Ash 20 x 75,000 DWT Panamax calls annually Improvements complete
Millennium Bulk Terminals Longview, WA Coal 730 x 75,000 DWT Panamax
vessel calls annually In permitting
Morrow Pacific Boardman & Clatskanie, OR Coal
Initial: 286 barge tows 52 x 75,000 DWT Panamax vessel calls annually Complete: 624 barge tows & 156 x 75,000 DWT Panamax vessel calls annually
In permitting
NW Innovation Works Kalama, WA Methanol
36 to 72 LPG tanker vessel calls annually. Typical length 750 feet
In permitting
NW Innovation Works Clatskanie, OR Methanol 36 to 72 LPG tanker vessel calls
annually Typical length 750 feet Announced
Oregon LNG Warrenton, OR Liquefied Natural Gas (LNG)
125 LNG carrier vessel calls annually Typical length 900 feet
In permitting
Pembina Portland, OR Propane 24 to 36 VLGC vessel calls annually. Typical length 750 feet
In permitting
Temco Kalama, WA Grain 48 x 75,000 DWT Panamax vessel calls annually
Expansion construction through 2015
This study does not attempt to determine the likelihood of all proposed projects coming to fruition. To provide the most conservative estimates possible, the study assumed that every proposed project will be fully operational at some point in the future. Some of the projects are cancelled or unable to move forward at this time. All projects in Table 4-1 were used in determining incident frequencies for marine transport; therefore, the volume of Proposed Marine Traffic in this study is likely overstated. Since there was no
DNV GL – Report No. PP111860-2, Rev. 5 – www.dnvgl.com Page 28

definitive time when these projects will be completed, all marine traffic associated with future projects are referred to as Proposed Marine Traffic.
4.3 Future Marine Traffic The combination of Current Marine Traffic and Proposed Marine Traffic is referred to as Future Marine Traffic in this report. This does not include Sample Vessel Traffic.
DNV GL – Report No. PP111860-2, Rev. 5 – www.dnvgl.com Page 29

• Internal operational data describing operational procedures and equipment installed onboard ship – such data can affect both incident frequency and incident consequence factors.
• External operational data describing factors external to the ship that can affect ship safety, such as Vessel Traffic Systems (VTS), Traffic Separation Schemes (TSS), and the location and performance of emergency tugs – such data can affect both incident frequency and incident consequence factors.
The key model inputs are:
• Study area (Sections 2.1- 2.3, 2.6- 2.8).
• Marine traffic characteristics (Section 4).
• Marine environment (Sections 2.3, 2.4, and 2.5).
• Risk controls (Section 5.2).
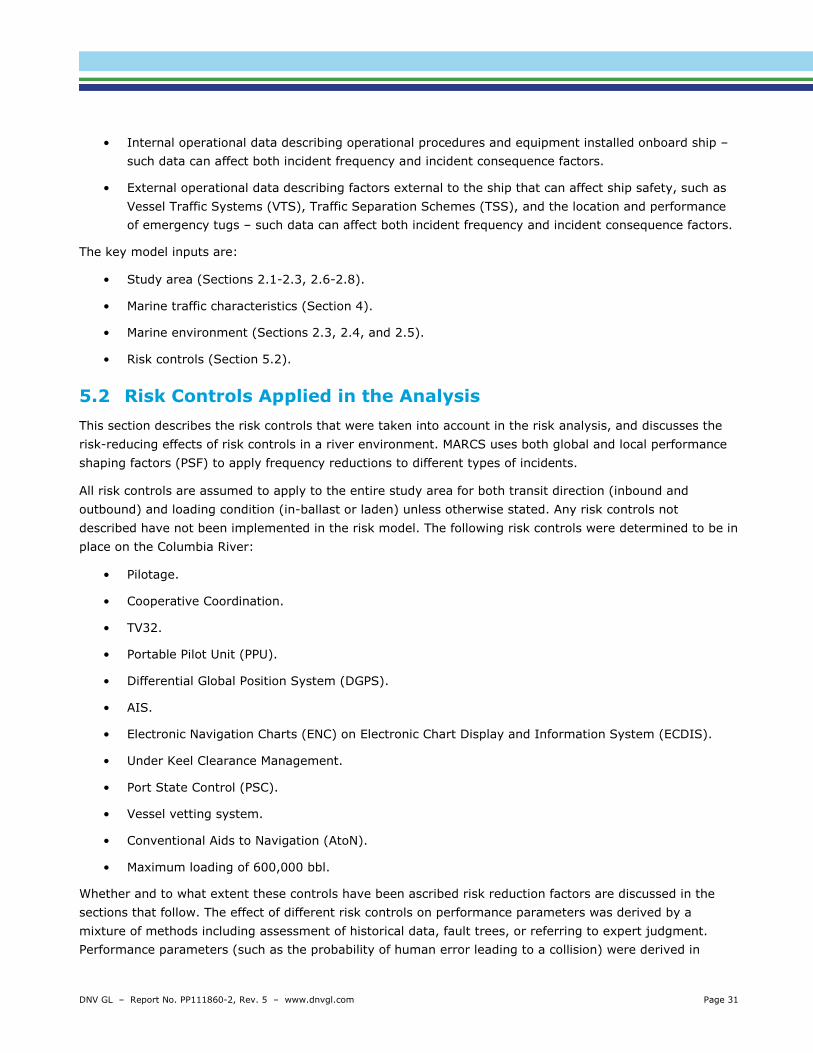
5.2 Risk Controls Applied in the Analysis This section describes the risk controls that were taken into account in the risk analysis, and discusses the risk-reducing effects of risk controls in a river environment. MARCS uses both global and local performance shaping factors (PSF) to apply frequency reductions to different types of incidents.
All risk controls are assumed to apply to the entire study area for both transit direction (inbound and outbound) and loading condition (in-ballast or laden) unless otherwise stated. Any risk controls not described have not been implemented in the risk model. The following risk controls were determined to be in place on the Columbia River:
• Pilotage.
• Cooperative Coordination.
• TV32.
• Portable Pilot Unit (PPU).
• Differential Global Position System (DGPS).
• AIS.
• Electronic Navigation Charts (ENC) on Electronic Chart Display and Information System (ECDIS).
• Under Keel Clearance Management.
• Port State Control (PSC).
• Vessel vetting system.
• Conventional Aids to Navigation (AtoN).
• Maximum loading of 600,000 bbl.
Whether and to what extent these controls have been ascribed risk reduction factors are discussed in the sections that follow. The effect of different risk controls on performance parameters was derived by a mixture of methods including assessment of historical data, fault trees, or referring to expert judgment. Performance parameters (such as the probability of human error leading to a collision) were derived in
DNV GL – Report No. PP111860-2, Rev. 5 – www.dnvgl.com Page 31

previous work by DNV GL using statistical analysis of global historical incident rates (Ref. /10/ , Ref. /11/). Performance parameters were selected using local knowledge from experts, and local data available for analysis when applicable.
5.2.1 Pilotage Pilotage is compulsory for all Sample Vessels. The presence of Bar and River Pilots on Sample Vessels, cargo/carriers and tankers identified in AIS, and Future Marine Traffic was accounted for in MARCS. Pilotage was included as a risk control measure, decreasing the frequency of collision and powered grounding.
Previous worldwide research listed in Table 5-1 quantified the effects of Pilotage. PSFs for Pilotage were used to account for an estimated 26% reduction of incident frequency for collision, and a 51% reduction of incident frequency for powered grounding.
Table 5-1 Summary of Studies that Quantify the Effects of Pilotage Study Information
Ship Collision with Bridges (Ref. /12/) Indicates that a Pilot on board reduced incident frequency by 83%
Risk Assessment of Pollution from Oil and Chemical Spills in Australian Ports and Waters (Ref. /13/)
49% risk reduction for compulsory Pilotage for majority of ships, 50% risk reduction for non-compulsory Pilotage
Summary Report on Evaluating Pilotage as Risk Reduction Measures (Ref. /14/)
Reports various studies using risk reduction factors in the range of 50%-97% reduction. Note: No data in this report is used in this study to support specific risk reduction factors.
5.2.2 Cooperative Coordination for Collision Avoidance The PSF assigned to Pilotage in this study are based on a global PSF, which has been applied to a local region. Cooperative coordination between Columbia River Pilots in meeting and / or overtaking situations on specific portions of the route is a unique local practice that is an effective method of collision avoidance. To account for the unique local practice, the study assessed the specific locations on the Columbia River where the practice is applied. In applying this practice, it is assumed in this study that piloted vessels do not collide with other piloted vessels in certain areas of the sailing route.
As a standard practice, River Pilots avoid meeting and overtaking situations in the following areas of the river:
• Miller Sands (RM 22 thru 25).
• Brookfield (RM 28 thru 34).
• Skamokawa (RM 39 thru 40).
• Bugby Hole (RM 55.5 thru 56.5).
• Warrior Rock (RM 84 thru 90).
A PSF of 90% was applied to these areas of the route for collision. No reduction was assigned for powered grounding.
DNV GL – Report No. PP111860-2, Rev. 5 – www.dnvgl.com Page 32

5.2.3 Transview 32 TV32 is a real time, vessel traffic information and management system that provide a real-time portrayal of vessel movements and interactions on the river along with water depth, current flow information and updated bathymetry charts. It combines four different systems that provided two-centimeter spatial resolution accuracy (Ref. /15/):
• AIS.
• ENC and ECDIS.
• NOAA Nautical Charts.
• NOAA Physical Oceanographic Real-Time System (PORTS).
• DGPS.
PORTS creates a layered architecture of ocean technologies (i.e. three acoustic sensors, with a back-up pressure sensor for freezing conditions) to measure surface current speeds, water depth, and wind direction and speed. The resolution of all acoustic and pressure sensors is one millimeter and the sample interval is every six minutes. Data is transmitted and displayed on the TV32 interface every six minutes.
TV32 may enhance Bar and River Pilot’s performance by:
• Providing redundancy against ship navigational equipment failure or incorrect calibration.
• Providing improved accuracy compared to the ship’s own equipment.
• Providing fine spatial and time resolutions
• Providing a layered architecture of technology systems for increased situational awareness.
• Allowing Pilots to accurately determine vessel meeting points to facilitate informed decision making regarding navigation, anchorage, and traffic coordination.
TV32 is considered a Vessel Traffic Information System (VTIS). The risk reduction factor of TV32, as its own unique navigation tool, was not quantified.
Risk reduction factors for VTS have been quantified by DNV GL. The primary difference between a VTS and a VTIS is that in a VTS, vessel location, speed and course data is consolidated in a centralized location, such as a control room (typically staffed by the US Coast Guard) and relevant information is disseminated from the control room to ships in the area. In a VTIS, vessel location, course, and speed data is made available directly to vessels operating in the area so that navigation decisions can be agreed upon between the pilots. As a VTIS, TV32 provides better dissemination of information to all users than a standard VTS.
Table 5-2 summarizes a selection of relevant studies addressing the reduction in collision and grounding frequencies based on implementation of a VTS.
DNV GL – Report No. PP111860-2, Rev. 5 – www.dnvgl.com Page 33

Table 5-2 Summary of Studies that Quantify the Effects of VTS Study Information COST-301: Shore-based Marine Navigation Aid Systems (Ref. /16/)
Estimated radar-based VTS would provide a 40% risk reduction for collisions and groundings
Ship Collision with Bridges (Ref. /12/) Found a 50% to 67% risk reduction The Estimation of Collision Risk for Marin Traffic in UK Waters (Ref. /17/)
Indicated that the effects of VTS were most prominent in thick fog Example: In the case of crossing encounters with 99% clear and 1% thick fog, a 57% reduction was found
Safety of Shipping in Coastal Waters Summary Report (Ref. /10/)
Quoted data from the Western Sheldt estuary that indicated a 40% risk reduction for collisions and a 20% risk reduction for powered groundings
Summary Report on Evaluating VTS and Pilotage as Risk Reduction Measures (Ref. /14/)
Reports various studies in the Baltic area obtaining a 55% to 80% risk reduction
The progressive adoption of VTS may contribute to an overall decrease in global incident frequencies of collisions and groundings, as the studies indicate. This collectively resulted in a 43% risk reduction for groundings and 30% risk reduction for collisions.
TV32 does not have USCG 24/7 oversight as a VTS does. It clearly provides a level of risk reduction, and while not as well documented as a VTS, its improved efficiency in communicating position, course, and speed between piloted vessels, combined with updated water depth and river current information. . Therefore, DNV GL’s expert judgment applied a PSF of 20% reduction to groundings and collisions to give some credit for the safety effects of TV32.
5.2.4 Portable Pilot Unit (PPU) The PPU is a portable global positioning system (GPS) unit, which gives Pilots their own source of accurate heading and positioning data, displayed on an electronic chart. It can be seen as a support tool to enhance the pilot’s navigational performance. PPUs’ benefits include:
• Familiarity to Pilots.
• Provides additional redundancy against ship navigation equipment failure or incorrect calibration.
• Provides onboard VTIS to a Pilot in real time.
Combined with pilotage, it is judged that PPU was modelled to improve the pilot’s human error performance with respect to powered grounding by 10%. The effects of collisions are assumed to be negligible in comparison.
DNV GL – Report No. PP111860-2, Rev. 5 – www.dnvgl.com Page 34

5.2.5 DGPS DGPS signals allow a receiver to calculate its position based on signals received from triangulation of GPS satellites, thereby enhancing GPS.
The advantage of DGPS over conventional AtoN is that:
• It provides a very accurate and continuously updated calculation of the ship’s position in all weather conditions.
• It requires less time than conventional navigation and hence reduces bridge workload (i.e., by plotting on a conventional chart).
Although DGPS is widely believed to make a major contribution to the safety of navigation, there are no known studies that provide a comparison between incident rates with DGPS and conventional (non-GPS) navigation. Figure 5-1 shows the global historical trend in the frequency of groundings in the world-wide fleet, most of which are powered groundings. The frequency of total losses has declined at an average rate of approximately 5.5% per year. However, when serious casualties and non-serious incidents are included, the frequency appears to increase from 2002 to 2007. The causes were not entirely clear, but the effect was that the global historical trend does not show any clear decline that could be apportioned into its various causes, including aids to navigation, changes in operating procedures and safety management.
Figure 5-1 Global Grounding Frequency Trends, 1980-2010
DNV GL – Report No. PP111860-2, Rev. 5 – www.dnvgl.com Page 35

The best available data concerning causes of grounding incidents studied Norwegian registered ships over 1,600 Gross Registered Tonnage (GRT) during 1970 to 1978. It gave the main causal areas as shown in Table 5-3.
Table 5-3 Causal Factors in Groundings, 1970-78 (Ref. /18/) Causal Factor Contribution External conditions 39.9% Channel and shallow water 18.9%
Reduced visibility 12.6%
Fault/deficiency of lights, marks etc. 6.4%
Other external conditions 2.0%
Technical failure 8.8% Fault in the ship’s technical systems 5.7%
Other technical failures 3.1%
Inadequate navigational factors 18.9%
Bridge manning/organization 8.4%
Error/deficiency in charts/publications 8.1%
Other navigational factors 2.4%
Navigational error 22.9% Navigation and maneuvering factors 11.7%
Misinterpretation of lights/marks 8.4%
Other navigational error 2.8%
Non-compliance 8.1% Inadequate coverage of the watch 5.7%
Other non-compliance 2.4%
Other ship 1.4% 1.4% Total 100.0% 100.0%
Errors in conventional navigation, which might be prevented by GPS, were represented by “misinterpretation of lights/marks,” and amounted to 8.4% of incidents. GPS would not necessarily prevent all such errors, and indeed may have some negative impacts that would not be visible in data from this period. However, GPS might have indirect benefits on all navigational errors. Therefore a reduction in groundings of 8.4% is justified by this data.
5.2.6 Automatic Identification System (AIS) Automatic Identification System (AIS) tracks and identifies marine traffic.
It is a requirement of the International Convention for the Safety of Life at Sea (SOLAS). SOLAS requires that AIS transmitters are active onboard all vessels of more than 300 gross tons.
DNV GL – Report No. PP111860-2, Rev. 5 – www.dnvgl.com Page 36

The benefits of the system include:
• It allows vessels to identify and locate other vessels.
• It increases situational awareness of hazards and route features that are not otherwise physically marked (or would require extra time and resources to mark).
The benefit of AIS on collision avoidance was expected to be small compared to the other risk reduction options considered here. It was assumed that AIS coverage could reduce the collision frequency on ships with AIS receivers by about 2%.
The benefit of AIS on grounding was expected to be larger than its benefit on collisions. The use of AIS may reduce the powered grounding frequency on ships with AIS receivers by 5%.
5.2.7 Electronic Navigation Charts on ECDIS An Electronic Chart Display and Information System (ECDIS) is an electronic navigation aid that can be used instead of paper charts and publications to plan and display a ship’s route and plot, and monitor its position throughout a voyage.
ECDIS’s benefits include:
• It provides a continuous display of a vessel’s position in relation to land, charted objects, aids to navigation and possible unseen hazards.
• It provides an improved representation of the vessel’s position, compared to paper charts.
• It reduces the workload due to position plotting.
• It can be located where convenient on the bridge, so as to enable the watch-keeper to maintain a good lookout, instead of needing a screened chart table.
• It allows charts to be updated in a more efficient way by inserting a compact disc (CD) into the ECDIS computer, instead of manually annotating paper charts.
• It allows route planning and continuous monitoring.
• It provides improved functionality, such as:
o Location polygons can be defined and alarms set if the ship exits defined safe areas.
o AIS data can be displayed.
o Radar targets can be superimposed on the ECDIS.
The potential risk reduction achieved by implementation of ECDIS was evaluated in previous research. A Formal Safety Assessment (FSA) was submitted to International Maritime Organization (IMO) Marine Safety Committee in 2006 in connection with a proposal for ECDIS carriage requirements. The assessment concluded that ECDIS reduced grounding risk by approximately 36%. This was due to a combination of more time available on the bridge for situational awareness, more efficient plotting of the ship’s position and more efficient updating routines. A subsequent study that took account of 11 different routes and a mix of ship types found reductions in grounding risk between 11% and 38% due to variations in ECDIS coverage (Ref. /19/). Where ECDIS coverage was 100% the reduction in grounding risk was 38%.
DNV GL – Report No. PP111860-2, Rev. 5 – www.dnvgl.com Page 37

ECDIS was included in the analysis for:
• Sample Vessels.
• Cargo/carriers.
• Tankers.
• Future traffic.
A 38% reduction in powered grounding was applied because the Columbia River was considered to have 100% ECDIS coverage.
While ECDIS provides a continuous display of a vessel’s position in relation to land, charted objects and AtoN, it does not display another vessel’s position. Seeing another vessel’s location is necessary to reduce the risk of collision. Therefore, no reduction was applied for collision.
5.2.8 Underkeel Clearance Management Underkeel clearance (UKC) is managed by the Pilots and vessel masters and is required by a ship’s Safety Management System (SMS). Vessels calling at the Vancouver Energy Terminal depart a dock or enter the river only when they can make the transit of the entire river with a minimum 2 feet of UKC and 10 feet across the bar. UKC management takes into account tide, weather, and vessel characteristics to ensure the UKC standard is maintained. The availability of water level sensor data VIA a NOAA program developed for the Lower Columbia River is a key component of the UKC management system on the Columbia River.
The main benefits of UKC management system are:
• It ensures adequate clearance between a vessel’s keel and the river bottom to avoid grounding provide improved information to navigators on UKC.
• To identify and avoid grounding hazards.
For an individual transit of a deep-draft vessel, an UKC management system is expected to make a significant reduction in grounding probability. Since UKC management is required on the river and at the port, a 10% reduction in powered grounding probability is reasonable.
5.2.9 Port State Control Port State Control (PSC) is the inspection of ships in national ports to verify that the condition of the ship and its equipment complies with the requirements of international regulations that the ship is manned and operated in compliance with these rules. In this report, the term PSC was also used to include other general shipping industry initiatives with similar goals, such as: classification society rules; enhanced surveys; vessel design standards; and bunker fuel oil quality testing.
Knapp et. al., (Ref. /20/) estimated the survival gains for different ship types in the years 2003 to 2007 based on individual ship loss experience and PSC inspections in Australia and the USA. PSC inspections were associated with ship survival gains of 0.1% to 0.5% on base risk rates of 1-3%. Combining the data for four cargo ship types over five years, the average gain was 12% of the risk of total loss. The average benefit
DNV GL – Report No. PP111860-2, Rev. 5 – www.dnvgl.com Page 38

may be smaller because not all ships are inspected. On the other hand, the benefit may be increased through the targeting of inspections of high-risk ships, and the possibility that any ship may be inspected and detained if not compliant. Overall, this analysis was considered to provide the best estimate of the benefit of PSC.
The effect of PSC was represented by:
• Applying a 12% reduction to the technical failure rates in the risk model. This directly affects the frequency of drift grounding, fire / explosion and foundering. It also has a very minor impact on collision and powered grounding (which are dominated by human error and human incapacitation).
• Applying a human error and human incapacitation reduction of 12% in the collision and powered grounding incident models. This represents the emphasis placed on International Safety Management (ISM) regulations by PSC inspections and should help ensure reductions in the likelihood of excessively fatigued navigating officers.
5.2.10 Vetting System The Vetting System employed by Vancouver Energy Terminal was considered.
The purpose of a vetting system is to ensure that:
• Vessels (i.e. ships, tugs, barges, suppliers of marine services) comply with applicable International, National, Local and Terminal rules, regulations, and accepted industry practices in respect to safety, pollution prevention and operational procedures.
• The quality of the ship, the crew, and the owner meet all of these and company requirements.
• A ship can safely arrive, moor, transfer, and depart taking into account the vessel, size, draft, mooring capabilities, and pumping capabilities.
Vetting is important and necessary because it protects shipping companies, terminals, businesses and the public against problem vessels. Vetting policy requires that all vessels must be vetted and approved before they can be spot chartered, perform under a Time-Charter Agreement (TCA), or come to the terminal.
The vetting process for the Vancouver Energy terminal is as follows:
• For each business transaction, a vessel is nominated for vetting. The vessel is approved or rejected each and every time, regardless of the number of times it comes to the terminal.
• No period approvals are granted.
• Inspections must be published in the Oil Companies International Marine Forum (OCIMF) Ship Inspection Reports Exchange (SIRE) system and cannot be older than 6 months.
• A crew matrix, where all officers meet language and experience expectations, is mandated.
• Different certifications of safe and efficient operations are obtained, such as: SMS, International Ship Security Certificate (ISSC), USCG Certificate of Compliance (COC) or USCG Certification of Inspection (COI).
DNV GL – Report No. PP111860-2, Rev. 5 – www.dnvgl.com Page 39

• Vessel, Technical Operator, Owner, Commercial Operator must not be listed on US Government’s Office of Foreign Asset Control’s (OFAC) Specialty Designated Nationals (SDN) list.
• Each vessel nominated is manually vetted.
• Vessel Operator, Master or Owner must confirm acceptance of approval conditions.
There is not a quantitative assessment for vetting systems. As such, no reduction factor was applied for vetting systems.
5.2.11 Conventional AtoN Conventional aids to navigation are key enablers for spatial awareness, leading to safe navigation. Aids on the Columbia River comprise a group of interacting external reference devices intended to collectively provide sufficient and timely information with which to safely navigate (Ref. /21/). The aids include a series of fixed and floating aids, which are visual, aural, electronic or any combination of all three.
There is no obvious baseline (i.e. risk without AtoN) that could be used for comparison. However, it is possible to consider the benefits of improvements in conventional AtoN.
Data shown in Table 5-3 was used to indicate the effects of conventional AtoN in reducing powered grounding. Using conventional AtoN decreases the number of incidents related to deficiency or fault of lights and markings by 6.4%. Therefore, a reduction in groundings by 6.4% can be justified by this data.
5.2.12 Summary of Risk Controls This section summarizes the risk reduction factors of collision and powered grounding frequencies of the following elements in place on the Columbia River:
• Pilotage.
• Cooperative Coordination for Collision Avoidance.
• Transview 32 (TV32).
• Portable Pilotage Unit (PPU).
• Differential Global Position Systems (DGPS).
• Automatic Identification System (AIS).
• Electronic Charts on ECDIS.
• Under Keel Clearance Management.
• Port State Control and Vessel Vetting System.
• Conventional Aids to Navigation (AtoN).
DNV GL – Report No. PP111860-2, Rev. 5 – www.dnvgl.com Page 40

All incident frequency reductions are shown in Table 5-4. All reductions were applied to:
• Sample Vessels.
• Cargo/carriers identified in AIS.
• Tankers identified in AIS.
• Proposed deep-draft vessel traffic.
Table 5-4 Reductions applied for Performance Shaping Factors Incident Type Pilotage TV32 PPU DGPS AIS ECDIS UKC PSC AtoN
Collision 26% 20% 0% 0% 2% 0% 0% 0% 0% Powered Grounding
51% 20% 10% 8.4% 5% 38% 10% 10% 6.4%
Values in Table 5-4 are integrated into a fault tree and event tree analyses to estimate incident frequencies. For a description of fault tree and event tree analyses, see Appendix D. The effect of each risk reduction option on incident frequency of various incidents is measured in the following ways:
If R0 = frequency of an incident without risk reduction option, and R1 = frequency of an incident with risk reduction option, then:
Percentage reduction = �𝑅𝑅0−𝑅𝑅1𝑅𝑅0
�
Relative risk = 𝑅𝑅1𝑅𝑅0
When representing the effects in a risk model, the various model parameters were modified according to PSFs. The risk parameters (R0 and R1) were related to PSF by the traffic pattern which could vary before and after the application of the risk reduction option. If the traffic pattern does not change as a risk reduction was applied, then the PSFs were identical to relative risks. This equivalence will be assumed for the risk reduction options described above. In general, the effect of this assumption will be to under-estimate the risk reduction benefit due to the risk reduction option. The advantage is that it reduces the complexity of the analysis and increases the clarity of discussion.
DNV GL – Report No. PP111860-2, Rev. 5 – www.dnvgl.com Page 41


• Section 6.3 presents the estimates of potential oil spill volume as a result of a collision or grounding incident involving a Sample Vessel.
• Section 6.4 presents the estimated oil spill risk which is the combination of spill frequency and spill consequences.
6.1 Navigation Incident Model This section presents the methodology used and resulting estimated incident frequencies of tankers traveling in the study area. The study area consists of the Columbia River from the Vancouver Energy Terminal at RM 105 to 12 NM off the Columbia River Bar. In this assessment, tankers transiting from and to the Terminal as represented in the model are referred to as Sample Vessels.
Vessels were classified in accordance with the AIS-identified vessel types as follows:
• Cargo/carrier. • Service. • Other (i.e. offshore supply ships, multi-purpose offshore vessels, inland supply vessels, cable layers, and buoy-laying vessels).
• Fishing. • Tug. • Passenger. • Tanker. • Pleasure. • Undefined.
Incident frequencies were calculated for five events:
• Collision.
• Foundering.
• Fire/Explosion.
• Powered grounding.
• Drift grounding.
Four scenarios were modeled, and results from all scenarios are presented in this section. Figure 6-1 shows the traffic analyzed in each scenario:
1. Current Marine Traffic. Estimating navigation-related incident frequencies of marine traffic without considering Vancouver Energy Terminal vessels (referred to hereafter as Sample Vessels).
2. Sample Vessels and Current Marine Traffic. This section estimates incident frequencies considering Sample Vessels in Current Marine Traffic.
3. Future Marine Traffic. This section estimates incident frequencies including Current Marine Traffic and known Proposed Marine Traffic. It does not include Sample Vessel traffic.
4. Sample Vessels and Proposed Marine Traffic. This section estimates incident frequencies considering Sample Vessels and Proposed Marine Traffic.
DNV GL – Report No. PP111860-2, Rev. 5 – www.dnvgl.com Page 43


Comparison of Current Marine Traffic Model Results with Historical Data
Historical local data rarely present smooth trend lines and low standard deviations. There is always “noise” around a trend. Historical data were taken from the USCG “Marine Casualty and Vessel Data for Researchers” database for the period 2002 to 2013 (Ref. /22/).
The US Coast Guard investigates all reportable marine casualties and compiles its findings in this data base. A reportable marine casualty includes:
• An unintended grounding, or an unintended strike of (allision with) a bridge.
• An intended grounding or an intended strike of a bridge, that creates a hazard to navigation, the environment or the safety of a vessel.
• A loss of main propulsion, primary steering, or any associated component or control system that reduces the maneuverability of the vessel.
• An occurrence materially and adversely affecting the vessel’s seaworthiness or fitness for service or route, including but not limited to fire, flooding, or failure of or damage to fixed fire extinguishing systems, lifesaving equipment, auxiliary power generating equipment, or bilge pumping systems.
• Loss of Life.
• An Injury that requires professional medical treatment (treatment beyond first aid), and if the person is engaged or employed on board a vessel in commercial service, that renders them unfit to perform his or her routine duties.
• Occurrence causing property damage in excess of $25,000, this damage including the cost of the labor and material to restore the property to its condition before the occurrence, but not including the cost of cleaning, gas freeing, dry docking, or demurrage.
• An occurrence involving significant harm to the environment.
The database was filtered to consider only those marine incidents meeting the following criteria:
• Incidents that occurred within the Study Area.
• Classified as “Columbia River”, “Westport Slough”, “river mile locations, “Pacific Ocean Deep Water Access,” and locations within the study area. Blanks were considered if the location of the incident were on the Columbia River. All incidents that were not classified as “Columbia River” but whose coordinates indicated the location as Columbia River were confirmed to have occurred on the Columbia River. Such was the case with the single incident that occurred near Westport Slough. All locations were on the sailing route or crossing the route.
• Categorized as a collision or grounding.
• Recorded to have occurred between January 1, 2002 and December 31, 2013.
DNV GL – Report No. PP111860-2, Rev. 5 – www.dnvgl.com Page 47

Table 6-3 lists the number of historical incidents within the aforementioned parameters. On average, the annual incidents included six allisions, two collisions, and six groundings in the study area. The greatest number of incidents involved towing vessels, barges, and bulk carriers. The historical grounding frequency is 5.5 per year with a standard deviation of 0.64. The historical collision frequency is 2.4 per year with a standard deviation of 0.15.
Table 6-3 Historical Incident Data for the Study Area, 2002-2013 (Ref. /22/) Vessel Type Collision Grounding TOTAL Bulk Carrier 3 23 26 Ro-Ro Ship 0 1 1 Tank Ship 1 1 28 General Dry Cargo Ship 1 5 6 Miscellaneous Vessel 1 0 1 Passenger Ship 2 8 109 Recreational 6 1 7 Unspecified 3 1 4 Warship 1 0 1 Fishing Vessel 2 18 20 Barge 4 1 510 Towing Vessel 5 8 13
Total Number of Incidents 29 66 95
Average No. per yr 2.4 5.5 13.5
The historical events were recorded per each vessel involved, with the result that each collision is recorded in the data twice (if only two vessels collide). Therefore, the above data is not quite analogous to 2.4 collisions per year on average, because it more closely represents 2.4 ships involved in a collision per year on average.
To provide a sense of the model’s performance in predicting future events, the model results for the most recent year of traffic data for all vessels in the study area were compared to the average annual historical incidents for all vessels the study area (2002 to 2013, Ref. /22/).
Table 6-4 shows the comparison between modeled MARCS results and historical incident data as a factor. For collision, the model results are 1.3 times the historical frequency, which is a good approximation. For grounding, the model results are 6.5 times the historical frequency, which is a slight overestimation, but a reasonable model result for grounding frequency.
8 One tank ship involved in a marine casualty was the chemical carrier Kamogowa, which was involved in a collision in 2010. The vessel was undamaged and did not release oil or pollutants.
9 Excludes one incident which occurred off the route. The navigational conditions varies greatly between the location of this incident and the route Sample Vessels will take.
10 Excludes one incident which occurred off the route. The navigational conditions varies greatly between the location of this incident and the route Sample Vessels will take.
DNV GL – Report No. PP111860-2, Rev. 5 – www.dnvgl.com Page 48
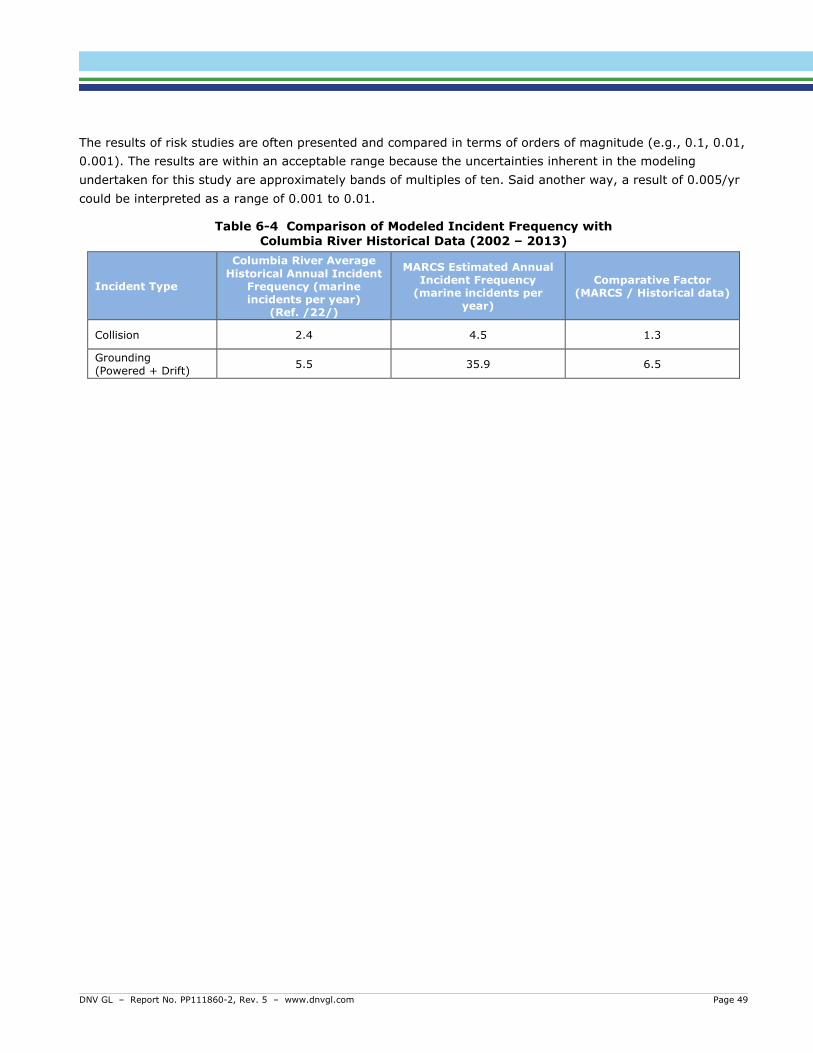
The results of risk studies are often presented and compared in terms of orders of magnitude (e.g., 0.1, 0.01, 0.001). The results are within an acceptable range because the uncertainties inherent in the modeling undertaken for this study are approximately bands of multiples of ten. Said another way, a result of 0.005/yr could be interpreted as a range of 0.001 to 0.01.
Table 6-4 Comparison of Modeled Incident Frequency with Columbia River Historical Data (2002 – 2013)
Incident Type
Columbia River Average Historical Annual Incident
Frequency (marine incidents per year)
(Ref. /22/)
MARCS Estimated Annual Incident Frequency
(marine incidents per year)
Comparative Factor (MARCS / Historical data)
Collision 2.4 4.5 1.3
Grounding (Powered + Drift) 5.5 35.9 6.5
DNV GL – Report No. PP111860-2, Rev. 5 – www.dnvgl.com Page 49

Estimated Annual Incidents in Subarea A 6.2.1.2
Table 6-5 and Table 6-6 show the modeled annual incident frequencies for the two areas within Subarea A. The estimated incident frequency in Subarea A was 13.5 per year, meaning that on average, 13.5 incidents involving AIS vessels were estimated to occur annually in Subarea A. The “confluence” area had 29% more total incidents than the “Warrior Rock area,” primarily due to model assumptions which influence the likelihood of grounding given a loss of steerage. Collision frequencies were 28% less in the “confluence” compared to the “Warrior Rock area” because model inputs were adjusted to reflect Pilot communication and aversion to passing in areas with limited line of sight.
Table 6-5 Estimated Annual Incident Frequencies (incidents/yr) for Current Marine Traffic in Warrior Rock Area
Incident Type Cargo/ Carrier Fishing Other Passenger Pleasure Service Tug Undefined Tanker
Annual Incidents per Incident Type
Collision 0.019 0.0019 0.014 0.019 0.0075 0.015 0.20 0.0087 0.0013 0.29 Foundering 0.00034 0.000008 0.00006 0.00008 0.00004 0.00007 0.0009 0.00004 0.00002 0.0016 Fire / Explosion 0.00018 0.000004 0.00003 0.00004 0.000019 0.00004 0.00048 0.00002 0.00001 0.00084 Powered grounding 0.31 0.025 0.20 0.28 0.1 0.2 2.93 0.13 0.021 4.19 Drift grounding 0.28 0.0063 0.049 0.057 0.027 0.052 0.74 0.032 0.019 1.26 Annual Incidents per Vessel Type
0.61 0.033 0.26 0.35 0.14 0.27 3.87 0.17 0.041 5.74
Table 6-6 Estimated Annual Incident Frequencies (incidents/yr) for Current Marine Traffic in Confluence Area
Incident Type Cargo/ Carrier Fishing Other Passenger Pleasure Service Tug Undefined Tanker
Annual Incidents per Incident Type
Collision 0.02 0.00065 0.016 0.0053 0.0088 0.014 0.32 0.0068 0.0013 0.4 Foundering 0.0003 0.000004 0.0001 0.00003 0.00005 0.00008 0.0019 0.00004 0.00002 0.0025 Fire / Explosion 0.00015 0.000002 0.00005 0.00002 0.00003 0.00005 0.001 0.00002 0.00001 0.0013 Powered grounding 0.27 0.013 0.24 0.11 0.16 0.22 4.75 0.14 0.018 5.91 Drift grounding 0.19 0.0027 0.052 0.02 0.035 0.048 1.04 0.029 0.013 1.43 Annual Incidents per Vessel Type
0.48 0.017 0.31 0.14 0.20 0.28 6.12 0.17 0.033 7.74
The greatest number of incidents involved cargo/carriers and tugs. Cargo/carriers and tugs had the greatest number of transits.
DNV GL – Report No. PP111860-2, Rev. 5 – www.dnvgl.com Page 50

Estimated Annual Incidents in Subarea B 6.2.1.3
Table 6-7 shows the annual incident frequencies of each area within Subarea B. The estimated incident frequency of all Current Marine Traffic was 15.5 incidents per year. The ship type incurring the greatest number of incidents was tugs.
Table 6-7 Estimated Annual Incident Frequencies (incidents/yr) for Current Marine Traffic in Subarea B
Incident type Cargo/ Carrier Fishing Other Passenger Pleasure Service Tug Undefined Tanker
Annual Incidents per Incident Type
Collision 0.095 0.0055 0.061 0.035 0.013 0.067 0.51 0.044 0.0049 0.84 Foundering 0.0016 0.00003 0.00033 0.00015 0.00007 0.00034 0.0026 0.00022 0.00008 0.0055 Fire / Explosion 0.00087 0.00002 0.00018 0.00008 0.00004 0.00018 0.0014 0.00012 0.00005 0.003 Powered grounding 1.09 0.064 0.67 0.48 0.15 0.79 6.35 0.54 0.056 10.2 Drift grounding 1.32 0.022 0.23 0.12 0.053 0.27 2.16 0.18 0.068 4.43 Annual Incidents per Vessel Type 2.51 0.092 0.97 0.63 0.22 1.13 9.02 0.76 0.13 15.5
Estimated Annual Incidents in Subarea C 6.2.1.4
Table 6-8 shows the annual incident frequencies for each vessel type within Subarea C. Estimated annual incident frequency for Current Marine Traffic is 10.0 in Subarea C. Several vessel types contribute significantly to the incident rate, including service, tug, passenger, cargo/carrier, and fishing.
Table 6-8 Estimated Annual Incident Frequencies (incidents/yr) for Current Marine Traffic in Subarea C
Incident type Cargo/ Carrier Fishing Other Passenger Pleasure Service Tug Undefined Tanker
Annual Incidents per Incident Type
Collision 0.21 0.27 0.084 0.32 0.049 0.82 0.41 0.073 0.0094 2.24 Foundering 0.0012 0.00055 0.00016 0.00045 0.0001 0.0013 0.00072 0.00014 0.00006 0.0047 Fire / Explosion 0.00067 0.0003 0.00009 0.00024 0.00005 0.0007 0.00039 0.00008 0.00003 0.0026 Powered grounding 0.64 0.84 0.29 0.85 0.13 1.82 1.38 0.23 0.031 6.21 Drift grounding 0.43 0.15 0.054 0.15 0.026 0.41 0.25 0.043 0.02 1.55 Annual Incidents per Vessel Type 1.29 1.27 0.43 1.32 0.20 3.04 2.04 0.34 0.06 10.0
DNV GL – Report No. PP111860-2, Rev. 5 – www.dnvgl.com Page 51

Estimated Annual Incidents in Subarea D 6.2.1.5
Table 6-9 shows the annual incident frequencies of each area in Subarea D. Estimated annual incident frequency for all Current Marine Traffic is 1.43 in Subarea D.
The greatest number of incidents involved service vessels and fishing vessels.
Table 6-9 Estimated Annual Incident Frequencies (incidents/yr) for Current Marine Traffic in Subarea D
Incident type Cargo/ Carrier Fishing Other Passenger Pleasure Service Tug Undefined Tanker
Annual Incidents per Incident Type
Collision 0.092 0.21 0.013 0.0039 0.033 0.23 0.1 0.021 0.0046 0.71 Foundering 0.00054 0.00049 0.00003 0.000008 0.00008 0.00054 0.00023 0.00005 0.00003 0.002 Fire / Explosion 0.00029 0.00027 0.00002 0.000004 0.000042 0.00029 0.00013 0.00003 0.00002 0.0011 Powered grounding 0.057 0.18 0.011 0.0037 0.029 0.20 0.086 0.019 0.0029 0.59 Drift grounding 0.035 0.032 0.002 0.00054 0.005 0.035 0.015 0.0032 0.0018 0.13 Annual Incidents per Vessel Type
0.19 0.43 0.027 0.0081 0.067 0.46 0.20 0.043 0.0093 1.43
DNV GL – Report No. PP111860-2, Rev. 5 – www.dnvgl.com Page 52

6.2.2 Scenario 2 Frequency – Sample Vessels and Current Marine Traffic
This section assesses the effect of Sample Vessels on Current Marine Traffic, which includes all vessels evaluated in the first scenario plus the addition of Sample Vessels.
Three Sample Vessel types were also evaluated: tanker vessels of 47,000 DWT, 105,000 DWT, and 165,000 DWT. The annual cargo spill frequency for the entire study area was also discussed to estimate the frequency of an incident leading to a cargo oil spill.
Estimated Annual Incident Frequency for Sample Vessels 6.2.2.1
Table 6-10 shows the estimated incident frequencies of all three Sample Vessels in Current Marine Traffic across the entire study area. An incident is a sudden departure, intended or unintended, from normal conditions, in which some degree of harm is caused (see Section 1.3). The outcome of an incident is not necessarily a spill. This is the annual number of incidents that a Vancouver Energy Terminal tanker is estimated to have, given the current volume and type of marine traffic on the Columbia River. The estimated incident frequency for Sample Vessels is 1.6 incidents per year.
The estimated return period for 47,000 DWT tankers is one incident approximately every 3 years. The estimated return period of 105,000 DWT tankers is one incident every 12 years. The estimated return period of the 165,000 DWT vessel is one incident every 220 years.
Table 6-10 Estimated Annual Incident Frequencies (incidents/yr) for Sample Vessels in the Study Area
Incident type 47,000 DWT Inbound
47,000 DWT Outbound
105,000 DWT Inbound
105,000 DWT Outbound
165,000 DWT Inbound
165,000 DWT Outbound
Annual Incidents per Incident Type
Collision 0.055 0.055 0.014 0.014 0.00076 0.00076 0.14 Foundering 0.00046 0.00046 0.00012 0.00012 0.000006 0.000006 0.0012 Fire / Explosion 0.00025 0.00025 0.00006 0.00006 0.000003 0.000003 0.00063 Powered grounding 0.31 0.28 0.078 0.071 0.0043 0.0039 0.75 Drift grounding 0.28 0.28 0.070 0.070 0.0038 0.0038 0.7 Annual Incidents per Vessel Type 0.64 0.61 0.16 0.16 0.0089 0.0085 1.59
DNV GL – Report No. PP111860-2, Rev. 5 – www.dnvgl.com Page 53

Estimated Annual Incident Frequency for Current Marine Traffic with Sample Vessels
Table 6-11 shows the estimated incident frequencies for Current Marine Traffic with Sample Vessels. The table shows only the estimated impact on Current Traffic. The estimated annual incident frequency involving Current Marine Traffic is 41.1, an increase of 0.8 incidents per year over incident rates that do not include Sample Vessels.
When the incident rate involving Sample Vessels of 1.6 incidents per year is included (see Table 6-10), the frequency is 42.6 incidents per year.
Table 6-11 Estimated Annual Incident Frequencies (incidents/yr) for Current Marine Traffic with Sample Vessels
Incident type Cargo/ Carrier Fishing Other Passenger Pleasure Service Tug Undefined Tanker
Annual Incidents per Incident Type
Collision 0.50 0.55 0.22 0.43 0.13 1.28 1.85 0.18 0.025 5.16 Foundering 0.004 0.0011 0.0007 0.0007 0.00033 0.0023 0.0063 0.0005 0.0002 0.016 Fire / Explosion 0.0022 0.0006 0.00037 0.0004 0.00018 0.0013 0.0034 0.0003 0.0001 0.0087 Powered grounding 2.37 1.13 1.41 1.72 0.57 3.23 15.49 1.05 0.13 27.1 Drift grounding 2.26 0.22 0.39 0.35 0.14 0.82 4.21 0.29 0.12 8.79 Annual Incidents per Vessel Type 5.15 1.90 2.01 2.49 0.84 5.32 21.56 1.52 0.28 41.1
The addition of Sample Vessels only effects collisions. In the MARCS model, collision frequency is calculated whenever two ships navigate within 0.5 nautical miles of each other. While the other incident types (i.e. foundering, fire/explosion, grounding) are influenced by the number of transits of each vessel type, they are not identified as encounters in the model, hence are unchanged with the addition of Sample Vessel traffic.
DNV GL – Report No. PP111860-2, Rev. 5 – www.dnvgl.com Page 54

Estimated Annual Incidents in Subarea A 6.2.2.2
Estimated Annual Incidents for Sample Vessels
The estimated incident frequency for Sample Vessels in Subarea A is 0.47 incidents per year. Table 6-12 and Table 6-16 show the modeled annual incident frequencies of each area within Subarea A.
Table 6-12 Estimated Annual Incident Frequencies (incidents/yr) for Sample Vessels (Current Marine Traffic) in Warrior Rock Area of Subarea A
Incident Type 47,000 DWT In
47,000 DWT Out
105,000 DWT In
105,000 DWT Out
165,000 DWT In
165,000 DWT Out
Annual Incidents per Incident Type
Collision 0.0039 0.0039 0.001 0.001 0.00006 0.00006 0.01 Foundering 0.00005 0.00005 0.00001 0.00001 0.000001 0.000001 0.00014 Fire / Explosion 0.00003 0.00003 0.000007 0.000007 0.0000005 0.0000005 0.00007 Powered grounding 0.05 0.05 0.013 0.013 0.0007 0.0007 0.13 Drift grounding 0.045 0.045 0.011 0.011 0.00062 0.00062 0.11 Annual Incidents per Direction
0.099 0.099 0.025 0.025 0.0014 0.0014 0.25
Table 6-13 Estimated Annual Incident Frequencies (incidents/yr) for Sample Vessels (Current Marine Traffic) in Confluence Area of Subarea A
Incident Type 47,000 DWT In
47,000 DWT Out
105,000 DWT In
105,000 DWT Out
165,000 DWT In
165,000 DWT Out
Annual Incidents per Incident Type
Collision 0.0037 0.0037 0.00093 0.00093 0.00005 0.00005 0.0093 Foundering 0.00004 0.00004 0.00001 0.00001 0.000001 0.000001 0.00011 Fire / Explosion 0.00002 0.00002 0.000006 0.000006 0.0000006 0.0000006 0.00005 Powered grounding 0.048 0.048 0.012 0.012 0.00066 0.00066 0.12 Drift grounding 0.035 0.035 0.0088 0.0088 0.00048 0.00048 0.088 Annual Incidents per Direction
0.086 0.086 0.022 0.022 0.0012 0.0012 0.22
DNV GL – Report No. PP111860-2, Rev. 5 – www.dnvgl.com Page 55

Estimated Annual Incidents for Current Marine traffic
Table 6-14 and Table 6-15 show the estimated annual incident frequencies for current marine traffic in each segment of Subarea A. The estimated incident frequency for all Current Marine Traffic is 13.7 incidents per year.
Collision frequency, which is the only incident frequency to vary between Scenarios 1 and 2, increased by 25% in Subarea A. The model predicts incident frequency in Subarea A to increase by 1% as a result of Sample Vessel traffic.
Table 6-14 Estimated Annual Incident Frequencies (incidents/yr) for Current Marine Traffic in Warrior Rock Area of Subarea A
Incident Type Cargo/ Carrier Fishing Other Passenger Pleasure Service Tug Undefined Tanker
Annual Incidents per Incident Type
Collision 0.025 0.0024 0.018 0.024 0.0096 0.0196 0.25 0.011 0.00167 0.36 Foundering 0.00034 0.000008 0.00006 0.00008 0.00004 0.00007 0.0009 0.00004 0.00002 0.0015 Fire / Explosion 0.00018 0.000004 0.00003 0.00004 0.000019 0.00004 0.00048 0.00002 0.00001 0.00084 Powered grounding 0.31 0.025 0.20 0.28 0.1 0.2 2.93 0.13 0.021 4.19 Drift grounding 0.28 0.0063 0.049 0.057 0.027 0.052 0.74 0.032 0.019 1.26 Annual Incidents per Vessel Type
0.62 0.033 0.26 0.36 0.14 0.28 3.92 0.17 0.042 5.82
Table 6-15 Estimated Annual Incident Frequencies (incidents/yr) for Current Marine Traffic in Confluence Area of Subarea A
Incident Type Cargo/ Carrier Fishing Other Passenger Pleasure Service Tug Undefined Tanker
Annual Incidents per Incident Type
Collision 0.025 0.0008 0.020 0.0067 0.011 0.018 0.40 0.0088 0.0017 0.5 Foundering 0.00028 0.000004 0.0001 0.00003 0.00005 0.00008 0.0019 0.00004 0.00002 0.0025 Fire/Explosion 0.00015 0.000002 0.00005 0.00002 0.00003 0.00005 0.001 0.00002 0.00001 0.0013 Powered grounding 0.27 0.013 0.24 0.11 0.16 0.22 4.75 0.14 0.018 5.91 Drift grounding 0.19 0.0027 0.052 0.02 0.035 0.048 1.04 0.029 0.013 1.43 Annual Incidents per Vessel Type
0.48 0.016 0.31 0.14 0.21 0.28 6.19 0.17 0.033 7.84
DNV GL – Report No. PP111860-2, Rev. 5 – www.dnvgl.com Page 56
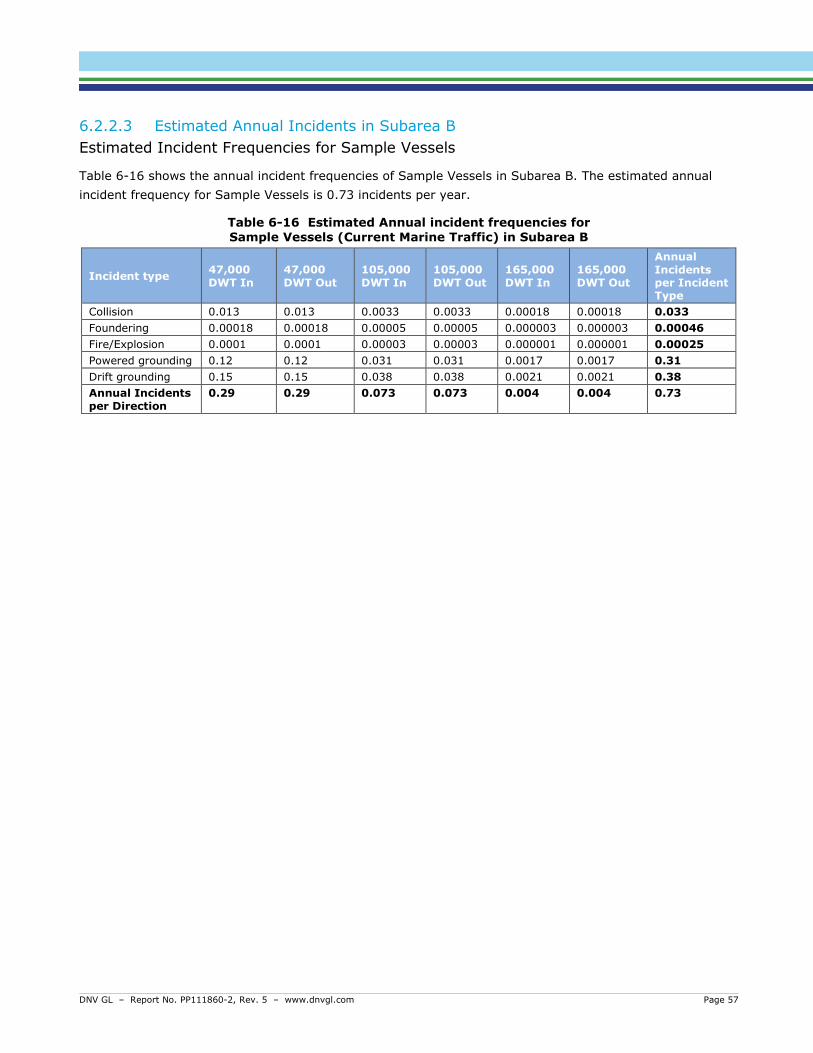
Estimated Annual Incidents in Subarea B 6.2.2.3
Estimated Incident Frequencies for Sample Vessels
Table 6-16 shows the annual incident frequencies of Sample Vessels in Subarea B. The estimated annual incident frequency for Sample Vessels is 0.73 incidents per year.
Table 6-16 Estimated Annual incident frequencies for Sample Vessels (Current Marine Traffic) in Subarea B
Incident type 47,000 DWT In
47,000 DWT Out
105,000 DWT In
105,000 DWT Out
165,000 DWT In
165,000 DWT Out
Annual Incidents per Incident Type
Collision 0.013 0.013 0.0033 0.0033 0.00018 0.00018 0.033 Foundering 0.00018 0.00018 0.00005 0.00005 0.000003 0.000003 0.00046 Fire/Explosion 0.0001 0.0001 0.00003 0.00003 0.000001 0.000001 0.00025 Powered grounding 0.12 0.12 0.031 0.031 0.0017 0.0017 0.31 Drift grounding 0.15 0.15 0.038 0.038 0.0021 0.0021 0.38 Annual Incidents per Direction
0.29 0.29 0.073 0.073 0.004 0.004 0.73
DNV GL – Report No. PP111860-2, Rev. 5 – www.dnvgl.com Page 57

Estimated Incident Frequencies for Current Marine Traffic
Table 6-17 shows the estimated annual incident frequencies for current marine traffic in Subarea B. The estimated incident frequency for all Current Marine Traffic is 15.6 incidents per year.
The annual collision frequency, which is the only incident frequency to change between Scenario 1 to 2, increased by 21% in Subarea B. However, the increase for all incident types in Subarea B is negligible at 1%.
Table 6-17 Estimated Annual Incident Frequencies (incidents/yr) for Current Marine Traffic in Subarea B
Incident type Cargo/ Carrier Fishing Other Passenger Pleasure Service Tug Undefined Tanker
Annual Incidents per Incident Type
Collision 0.12 0.0067 0.074 0.042 0.016 0.081 0.62 0.053 0.006 1.02 Foundering 0.0016 0.00003 0.00033 0.00015 0.00007 0.00034 0.0026 0.00022 0.00008 0.0055 Fire / Explosion 0.00087 0.00002 0.00018 0.00008 0.00004 0.00018 0.0014 0.00012 0.00005 0.003 Powered grounding 1.09 0.064 0.67 0.48 0.15 0.79 6.35 0.54 0.056 10.19 Drift grounding 1.32 0.022 0.23 0.12 0.053 0.27 2.16 0.18 0.068 4.43 Annual Incidents per Vessel Type
2.53 0.09 0.98 0.64 0.22 1.14 9.13 0.77 0.13 15.64
DNV GL – Report No. PP111860-2, Rev. 5 – www.dnvgl.com Page 58

Estimated Annual Incidents in Subarea C 6.2.2.4
Estimated Incident Frequencies for Sample Vessels
The estimated incident frequency for Sample Vessels in Subarea C is 0.34 incidents per year. Table 6-18 shows estimated annual incident frequencies for each Sample Vessel type in Subarea C.
Table 6-18 Estimated Annual incident frequencies for Sample Vessels (Current Marine Traffic) in Subarea C
Incident type 47,000 DWT In
47,000 DWT Out
105,000 DWT In
105,000 DWT Out
165,000 DWT In
165,000 DWT Out
Annual Frequency per Incident Type
Collision 0.023 0.023 0.0057 0.0057 0.00031 0.00031 0.058 Foundering 0.00012 0.00012 0.00003 0.00003 0.000002 0.000002 0.00031 Fire / Explosion 0.00007 0.00007 0.00002 0.00002 0.000001 0.000001 0.00017 Powered grounding
0.073 0.061 0.019 0.015 0.001 0.00084 0.17
Drift grounding 0.043 0.043 0.011 0.011 0.00061 0.00061 0.11 Annual Frequency per Vessel Type
0.14 0.13 0.035 0.032 0.0019 0.0018 0.34
DNV GL – Report No. PP111860-2, Rev. 5 – www.dnvgl.com Page 59

Estimated Incident Frequencies for Current Marine Traffic
Table 6-19 shows estimated annual incident frequencies for Current Marine Traffic in Subarea C with Sample Vessels. The modeled incident frequency for all Current Marine Traffic is 10.2 incidents per year.
Collision frequency, which is the only incident frequency to vary between Scenarios 1 and 2, increased by 10% in Subarea C. The model predicts incident frequency in Subarea C to increase by 2% as a result of Sample Vessel traffic.
Table 6-19 Annual Incident Frequencies (incidents/yr) for Current Marine Traffic in Subarea C
Incident type Cargo/ Carrier Fishing Other Passenger Pleasure Service Tug Undefined Tanker
Annual Incidents per Incident Type
Collision 0.23 0.30 0.094 0.35 0.054 0.90 0.45 0.081 0.01 2.47 Foundering 0.0012 0.00055 0.00016 0.00045 0.0001 0.0013 0.00072 0.00014 0.00006 0.0047 Fire / Explosion 0.00067 0.0003 0.00009 0.00024 0.00005 0.0007 0.00039 0.00008 0.00003 0.0025 Powered grounding 0.64 0.84 0.29 0.85 0.13 1.82 1.38 0.23 0.031 6.21 Drift grounding 0.43 0.15 0.054 0.15 0.026 0.41 0.25 0.043 0.02 1.55 Incident Frequency per Vessel Type
1.31 1.30 0.44 1.35 0.21 3.12 2.09 0.35 0.061 10.22
DNV GL – Report No. PP111860-2, Rev. 5 – www.dnvgl.com Page 60
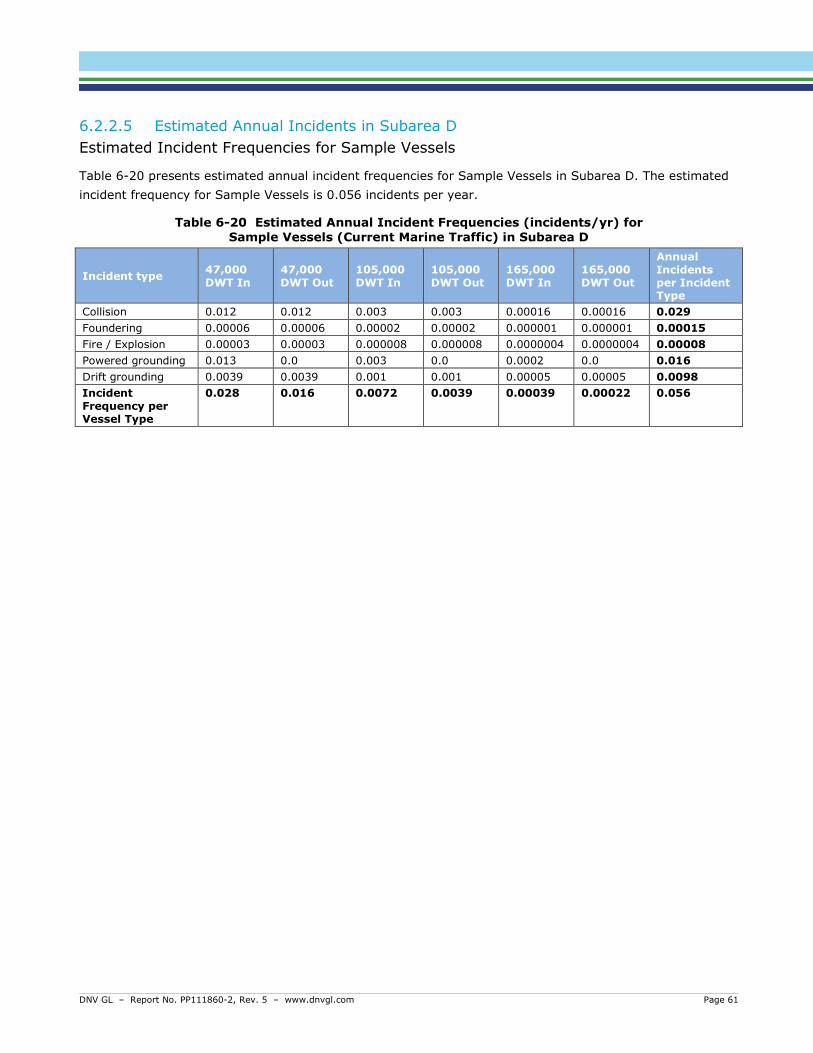
Estimated Annual Incidents in Subarea D 6.2.2.5
Estimated Incident Frequencies for Sample Vessels
Table 6-20 presents estimated annual incident frequencies for Sample Vessels in Subarea D. The estimated incident frequency for Sample Vessels is 0.056 incidents per year.
Table 6-20 Estimated Annual Incident Frequencies (incidents/yr) for Sample Vessels (Current Marine Traffic) in Subarea D
Incident type 47,000 DWT In
47,000 DWT Out
105,000 DWT In
105,000 DWT Out
165,000 DWT In
165,000 DWT Out
Annual Incidents per Incident Type
Collision 0.012 0.012 0.003 0.003 0.00016 0.00016 0.029 Foundering 0.00006 0.00006 0.00002 0.00002 0.000001 0.000001 0.00015 Fire / Explosion 0.00003 0.00003 0.000008 0.000008 0.0000004 0.0000004 0.00008 Powered grounding 0.013 0.0 0.003 0.0 0.0002 0.0 0.016 Drift grounding 0.0039 0.0039 0.001 0.001 0.00005 0.00005 0.0098 Incident Frequency per Vessel Type
0.028 0.016 0.0072 0.0039 0.00039 0.00022 0.056
DNV GL – Report No. PP111860-2, Rev. 5 – www.dnvgl.com Page 61

Estimated Incident Frequencies for Current Marine Traffic
Table 6-21 shows annual incident frequencies of Current Marine Traffic in Subarea D. The estimated incident frequency for all Current Marine Traffic is 1.54 incidents per year.
Collision frequency, which is the only incident frequency to vary between Scenarios 1 and 2, increased by 14% in Subarea D. The model predicts incident frequency in Subarea D to increase by 8% as a result of Sample Vessel traffic.
Table 6-21 Annual Incident Frequencies (incidents/yr) for Current Marine Traffic in Subarea D
Incident type Cargo/ Carrier Fishing Other Passenger Pleasure Service Tug Un-
defined Tanker Annual Incidents per Incident Type
Collision 0.10 0.24 0.015 0.0044 0.038 0.26 0.12 0.025 0.005263 0.81 Foundering 0.00054 0.00049 0.00003 0.000008 0.00008 0.00054 0.00023 0.00005 0.00003 0.002 Fire / Explosion 0.00029 0.00027 0.00002 0.000004 0.000042 0.00029 0.00013 0.00003 0.00002 0.0011 Powered grounding 0.057 0.18 0.011 0.0037 0.029 0.20 0.086 0.019 0.0029 0.59 Drift grounding 0.035 0.032 0.002 0.00054 0.005 0.035 0.015 0.0032 0.0018 0.13 Annual Incidents per Vessel Type
0.20 0.46 0.029 0.0087 0.072 0.50 0.22 0.046 0.01 1.54
DNV GL – Report No. PP111860-2, Rev. 5 – www.dnvgl.com Page 62

6.2.3 Scenario 3 Frequency - Future Marine Traffic This section discusses estimated incident frequencies for Future Marine Traffic, which encompasses Current Marine Traffic (based on AIS data) and Proposed Marine Traffic (i.e. marine traffic as a result from projects identified in Section 4.2), but it does not include Sample Vessels (Vancouver Energy Terminal vessels). See Appendix C for Proposed Marine Traffic estimates.
Estimated Annual Incidents in the Study Area 6.2.3.1
Table 6-22 presents incident frequencies for Future Marine Traffic across the entire study area. The number of incidents predicted by the model for the study area is approximately 44.2 per year. This means that the model predicts the annual incident frequency in the study area to increase 3.9 incidents per year should all of the proposed projects be implemented. The results are conservative yet reasonable given the available data and currently available modeling capabilities.
Table 6-22 Estimated Annual Incident Frequency for Future Marine Traffic in the Study Area
Incident type Cargo/ Carrier Fishing Other Passenger Pleasure Service Tug Undefined Tanker
Annual Frequency per Incident Type
Collision 2.03 0.84 0.32 0.57 0.18 1.82 2.39 0.093 0.036 8.28 Foundering 0.004 0.0011 0.0007 0.0007 0.00033 0.0023 0.0063 0.0005 0.0002 0.016 Fire / Explosion 0.0022 0.0006 0.00037 0.0004 0.00018 0.0013 0.0034 0.0003 0.0001 0.0088 Powered grounding 2.37 1.13 1.41 1.72 0.57 3.23 15.49 1.05 0.13 27.1 Drift grounding 2.26 0.22 0.39 0.35 0.14 0.82 4.21 0.29 0.12 8.79 Annual Frequency per Vessel Type
6.67 2.18 2.11 2.64 0.90 5.87 22.10 1.43 0.29 44.2
DNV GL – Report No. PP111860-2, Rev. 5 – www.dnvgl.com Page 63
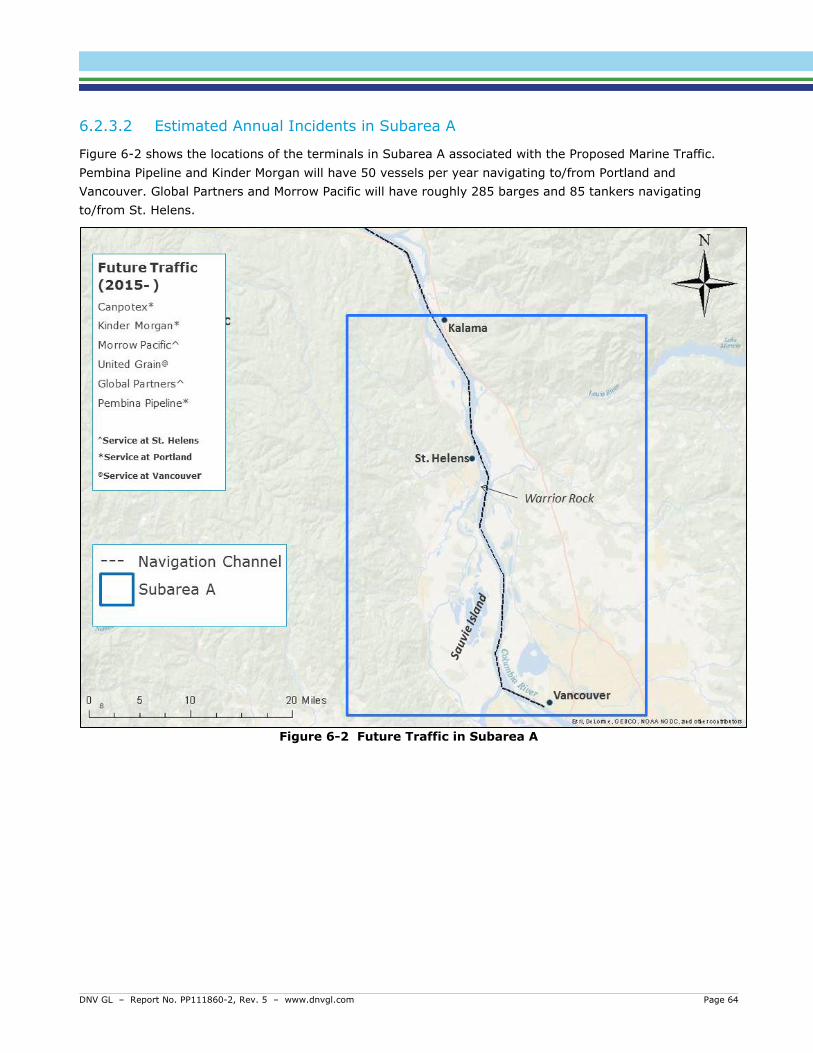
Estimated Annual Incidents in Subarea A 6.2.3.2
Figure 6-2 shows the locations of the terminals in Subarea A associated with the Proposed Marine Traffic. Pembina Pipeline and Kinder Morgan will have 50 vessels per year navigating to/from Portland and Vancouver. Global Partners and Morrow Pacific will have roughly 285 barges and 85 tankers navigating to/from St. Helens.
Figure 6-2 Future Traffic in Subarea A
DNV GL – Report No. PP111860-2, Rev. 5 – www.dnvgl.com Page 64

Table 6-23 and Table 6-24 present the model results for annual incident frequencies for Future Marine Traffic in the “Warrior Rock” area and “confluence” of Subarea A. The estimated incident frequency for all Future Marine Traffic is 13.8 incidents per year.
The model predicts an increase in collision frequency from Proposed Marine Traffic (comparing Scenario 1 to Scenario 3) by 31% in Subarea A. The frequency of any type of incident in Subarea A is modeled to increase 2% as a result of implementation of all projects identified as Proposed Marine Traffic.
Table 6-23 Estimated Annual Incident Frequencies (incidents/yr) for Future Marine Traffic in Warrior Rock Area of Subarea A
Incident Type Cargo/ Carrier Fishing Other Passenger Pleasure Service Tug Undefined Tanker
Annual Incidents per Incident Type
Collision 0.073 0.0027 0.021 0.027 0.011 0.022 0.28 0.0045 0.0018 0.44 Foundering 0.00034 0.000008 0.00006 0.00008 0.00004 0.00007 0.0009 0.00004 0.00002 0.0016 Fire / Explosion 0.00018 0.000004 0.00003 0.00004 0.00002 0.00004 0.00048 0.00002 0.00001 0.00084 Powered grounding 0.31 0.025 0.20 0.28 0.1 0.2 2.93 0.13 0.021 4.19 Drift grounding 0.28 0.0063 0.049 0.057 0.027 0.052 0.74 0.032 0.019 1.26 Incident Frequency per Vessel Type
0.67 0.034 0.27 0.36 0.14 0.28 3.95 0.16 0.042 5.90
Table 6-24 Estimated Annual Incident Frequencies (incidents/yr) for Future Marine Traffic in Confluence of Subarea A
Incident Type Cargo/ Carrier Fishing Other Passenger Pleasure Service Tug Undefined Tanker
Annual Incidents per Incident Type
Collision 0.058 0.0007 0.017 0.0057 0.0094 0.015 0.34 0.0027 0.0014 0.46 Foundering 0.0003 0.000004 0.0001 0.00003 0.00005 0.00008 0.0019 0.00004 0.00002 0.0025 Fire/Explosion 0.00015 0.000002 0.00005 0.00002 0.00003 0.00005 0.001 0.00002 0.00001 0.0013 Powered grounding 0.27 0.013 0.24 0.11 0.16 0.22 4.75 0.14 0.018 5.91 Drift grounding 0.19 0.0027 0.052 0.02 0.035 0.048 1.04 0.029 0.013 1.43 Incident Frequency per Vessel Type
0.51 0.017 0.31 0.14 0.20 0.28 6.14 0.17 0.033 7.88
DNV GL – Report No. PP111860-2, Rev. 5 – www.dnvgl.com Page 65

Estimated Annual Incidents in Subarea B 6.2.3.3
Figure 6-3 shows the locations of the terminals in Subarea B that are associated with the Proposed Marine Traffic. More than 1,000 vessels per year, associated with Millennium terminal and Haven Energy projects, will navigate to Longview. More than 250 vessels per year associated with CHS/Temco, Kalama Export and NW Innovations projects will navigate to Kalama.
Figure 6-3 Future Traffic in Subarea B
DNV GL – Report No. PP111860-2, Rev. 5 – www.dnvgl.com Page 66

Table 6-25 presents the model results for estimated annual incident frequencies for Future Marine Traffic in Subarea B. The estimated incident frequency for all Future Marine Traffic is 16.5 incidents per year.
The model predicts an increase in collision frequency from Proposed Marine Traffic (comparing Scenario 1 to Scenario 3) by 123% in Subarea B. The frequency of any type of incident in Subarea B is modeled to increase 7% as a result of implementation of all projects identified as Proposed Marine Traffic.
Table 6-25 Estimated Annual Incident Frequencies (incidents/yr) for Future Marine Traffic in Subarea B
Incident type Cargo/ Carrier Fishing Other Passenger Pleasure Service Tug Undefined Tanker
Annual Incidents per Incident Type
Collision 0.55 0.011 0.12 0.066 0.025 0.13 0.94 0.029 0.012 1.88 Foundering 0.0016 0.00003 0.00033 0.00015 0.00007 0.00034 0.0026 0.00022 0.00008 0.0055 Fire / Explosion 0.00087 0.00002 0.00018 0.00008 0.00004 0.00018 0.0014 0.00012 0.00005 0.003 Powered grounding 1.09 0.064 0.67 0.48 0.15 0.79 6.35 0.54 0.056 10.2 Drift grounding 1.32 0.022 0.23 0.12 0.053 0.27 2.16 0.18 0.068 4.43 Incident Frequency per Vessel Type
2.97 0.097 1.02 0.66 0.23 1.19 9.45 0.75 0.13 16.5
DNV GL – Report No. PP111860-2, Rev. 5 – www.dnvgl.com Page 67

Estimated Annual Incidents in Subarea C 6.2.3.4
Figure 6-4 shows the locations of the terminals in Subarea C that are associated with the Proposed Marine Traffic. Oregon LNG is the only project located in Astoria, and is proposing 125 vessel calls annually. However, more than 1,900 proposed vessels will enter or exit through the mouth of the Columbia River. All Proposed Marine Traffic will require Bar and River Pilots, and will slow or stop near Astoria for Pilot exchange.
Figure 6-4 Future Traffic in Subarea C
DNV GL – Report No. PP111860-2, Rev. 5 – www.dnvgl.com Page 68

Table 6-26 presents the model results for annual incident frequencies for Future Marine Traffic in Subarea C. The estimated incident frequency for all Future Marine Traffic is 11.7 incidents per year.
The model predicts an increase in collision frequency from Proposed Marine Traffic (comparing Scenario 1 to Scenario 3) by 77% in Subarea C. The frequency of any type of incident in Subarea C is modeled to increase 17% as a result of implementation of all projects identified as Proposed Marine Traffic.
Table 6-26 Estimated Annual Incident Frequencies (incidents/yr) for Future Marine Traffic in Subarea C
Incident type Cargo/ Carrier Fishing Other Passenger Pleasure Service Tug Undefined Tanker
Annual Incidents per Incident Type
Collision 0.9 0.44 0.14 0.47 0.077 1.24 0.65 0.043 0.015 3.97 Foundering 0.0012 0.00055 0.00016 0.00045 0.0001 0.0013 0.00072 0.00014 0.00006 0.0047 Fire/Explosion 0.00067 0.0003 0.00009 0.00024 0.00005 0.0007 0.00039 0.00008 0.00003 0.0026 Powered grounding 0.64 0.84 0.29 0.85 0.13 1.82 1.38 0.23 0.031 6.21 Drift grounding 0.43 0.15 0.054 0.15 0.026 0.41 0.25 0.043 0.02 1.55 Incident Frequency per Vessel Type
1.98 1.44 0.48 1.47 0.23 3.47 2.28 0.31 0.066 11.7
DNV GL – Report No. PP111860-2, Rev. 5 – www.dnvgl.com Page 69
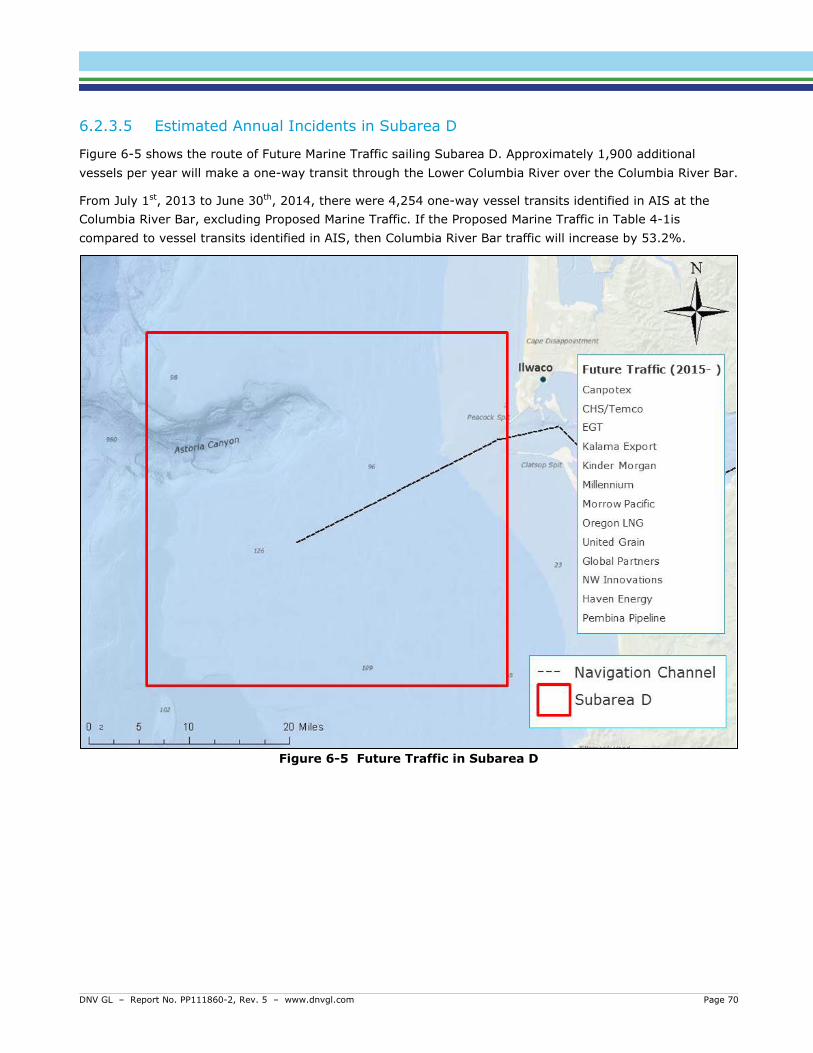
Estimated Annual Incidents in Subarea D 6.2.3.5
Figure 6-5 shows the route of Future Marine Traffic sailing Subarea D. Approximately 1,900 additional vessels per year will make a one-way transit through the Lower Columbia River over the Columbia River Bar.
From July 1st, 2013 to June 30th, 2014, there were 4,254 one-way vessel transits identified in AIS at the Columbia River Bar, excluding Proposed Marine Traffic. If the Proposed Marine Traffic in Table 4-1is compared to vessel transits identified in AIS, then Columbia River Bar traffic will increase by 53.2%.
Figure 6-5 Future Traffic in Subarea D
DNV GL – Report No. PP111860-2, Rev. 5 – www.dnvgl.com Page 70

Table 6-27 presents the model results for estimated annual incident frequencies for Future Marine Traffic in Subarea D. The estimated total incident frequency for all Future Marine Traffic is 2.26 incidents per year.
The model predicts an increase in collision frequency from Proposed Marine Traffic (comparing Scenario 1 to Scenario 3) by 115% in Subarea D. The frequency of all types of incident combined in Subarea D is modeled to increase by 58%.
Table 6-27 Estimated Annual Incident Frequencies (incidents/yr) for Future Marine Traffic in Subarea D
Incident type Cargo/ Carrier Fishing Other Passenger Pleasure Service Tug Undefined Tanker
Annual Incidents per Incident Type
Collision 0.44 0.38 0.024 0.0068 0.06 0.42 0.18 0.014 0.0081 1.53 Foundering 0.00054 0.00049 0.00003 0.000008 0.00008 0.00054 0.00023 0.00005 0.00003 0.002 Fire / Explosion 0.00029 0.00027 0.00002 0.000004 0.00004 0.00029 0.00013 0.00003 0.00002 0.0011 Powered grounding 0.057 0.18 0.011 0.0037 0.029 0.20 0.086 0.019 0.0029 0.59 Drift grounding 0.035 0.032 0.002 0.00054 0.005 0.035 0.015 0.0032 0.0018 0.13 Incident Frequency per Vessel Type
0.53 0.60 0.037 0.011 0.094 0.65 0.28 0.036 0.013 2.26
DNV GL – Report No. PP111860-2, Rev. 5 – www.dnvgl.com Page 71

6.2.4 Scenario 4 Frequency – Sample Vessels and Future Marine Traffic
This section considers the effect of Sample Vessels on Future Marine Traffic, which includes all vessels evaluated in Scenario 3 plus the addition of Sample Vessels. Incident frequencies were estimated for both inbound and outbound transits.
Estimated Annual Incidents in the Study Area 6.2.4.1
This section presents modeling results for Vancouver Energy Terminal vessels, represented as Sample Vessels, and Future Marine Traffic. The average annual frequencies for Sample Vessels and other traffic are presented and discussed for the study area as a whole.
Estimated Annual Incident Frequency for Sample Vessels
The estimated incident frequency for all Sample Vessels is an average of 1.7 incidents per year. Table 6-28 shows the estimated incident frequencies of Sample Vessels given Future Marine Traffic across the entire study area.
The estimated return period for 47,000 DWT tankers is one incident about every 0.8 years. The estimated return period for 105,000 DWT tankers is one incident every 3 years. The estimated return period for the 165,000 DWT vessels is one every 57 years.
Table 6-28 Estimated Annual Incident Frequencies (incidents/yr) for Sample Vessels (Future Marine traffic) in the Study Area
Incident type 47,000 DWT inbound
47,000 DWT outbound
105,000 DWT inbound
105,000 DWT outbound
165,000 DWT inbound
165,000 DWT outbound
Annual Incidents per Incident Type
Collision 0.086 0.086 0.022 0.022 0.0012 0.0012 0.22 Foundering 0.00046 0.00046 0.00012 0.00012 0.000006 0.000006 0.0012 Fire / Explosion 0.00025 0.00025 0.00006 0.00006 0.000003 0.000003 0.00063 Powered grounding 0.31 0.28 0.078 0.071 0.0043 0.0039 0.75 Drift grounding 0.28 0.28 0.070 0.070 0.0038 0.0038 0.7 Incident Frequency per Direction
0.67 0.64 0.17 0.16 0.0092 0.0090 1.67
DNV GL – Report No. PP111860-2, Rev. 5 – www.dnvgl.com Page 72

Estimated Annual Incident Frequency for Future Marine Traffic
Table 6-29 presents the estimated incident frequencies for all vessels in Future Marine Traffic. The estimated incident frequency for all Future Marine Traffic is 44.9 incidents per year.
Similar to Scenarios 1, 2 and 3, the model results show that tugs were estimated to have the greatest number of incidents, while tankers were estimated to have the fewest. The model predicts a 9% increase in incident frequency from Scenario 2 to Scenario 4 should all of the proposed projects be implemented.
Table 6-29 Annual incident frequencies for Future Marine Traffic in the Study Area
Incident type Cargo/ Carrier Fishing Other Passenger Pleasure Service Tug Undefined Tanker
Annual Incidents per Incident Type
Collision 2.16 0.9 0.35 0.61 0.2 1.96 2.70 0.1 0.039 9.02 Foundering 0.004 0.0011 0.0007 0.0007 0.00033 0.0023 0.0063 0.0005 0.0002 0.016 Fire/Explosion 0.0022 0.0006 0.00037 0.0004 0.00018 0.0013 0.0034 0.0003 0.0001 0.0088 Powered grounding 2.37 1.13 1.41 1.72 0.57 3.23 15.49 1.05 0.13 27.1 Drift grounding 2.26 0.22 0.39 0.35 0.14 0.82 4.21 0.29 0.12 8.79 Incident Frequency per Vessel Type 6.80 2.25 2.15 2.68 0.91 6.0 22.4 1.44 0.29 44.9
DNV GL – Report No. PP111860-2, Rev. 5 – www.dnvgl.com Page 73

Estimated Annual Incidents in Subarea A 6.2.4.2
Estimated Annual Incident Frequencies for Sample Vessels
Table 6-30 and Table 6-31 show the estimated annual incident frequencies for Sample Vessels in Subarea A. The estimated incident frequency for all Sample Vessels is 0.47 incidents per year.
The model predicts a 30% increase in collision frequency from Proposed Marine Traffic (comparing Scenario 2 to Scenario 4) in the “Warrior Rock” area, and 6% in the “confluence.” However, the total incident frequency did not increase.
Table 6-30 Estimated Annual Incident Frequencies (incidents/yr) for Sample Vessels (Future Marine Traffic) in Warrior Rock Area of Subarea A
Incident Type 47,000 DWT In
47,000 DWT Out
105,000 DWT In
105,000 DWT Out
165,000 DWT In
165,000 DWT Out
Annual Incidents per Incident Type
Collision 0.0051 0.0051 0.0013 0.0013 0.00007 0.00007 0.013 Foundering 0.00005 0.00005 0.00001 0.00001 0.000001 0.000001 0.00014 Fire/Explosion 0.00003 0.00003 0.000007 0.000007 0.0000005 0.0000005 0.00007 Powered grounding 0.05 0.05 0.013 0.013 0.0007 0.0007 0.13 Drift grounding 0.045 0.045 0.011 0.011 0.00062 0.00062 0.11 Incident Frequency per Direction
0.1 0.1 0.025 0.025 0.0014 0.0014 0.25
Table 6-31 Estimated Annual Incident Frequencies (incidents/yr) for Sample Vessels (Future Marine Traffic) in Confluence of Subarea A
Incident Type 47,000 DWT In
47,000 DWT Out
105,000 DWT In
105,000 DWT Out
165,000 DWT In
165,000 DWT Out
Annual Incidents per Incident Type
Collision 0.0038 0.0038 0.00097 0.00097 0.000053 0.000053 0.0099 Foundering 0.00004 0.00004 0.00001 0.00001 0.000001 0.000001 0.00011 Fire/Explosion 0.00002 0.00002 0.000006 0.000006 0.0000006 0.0000006 0.00006 Powered grounding 0.048 0.048 0.012 0.012 0.00066 0.00066 0.12 Drift grounding 0.035 0.035 0.0088 0.0088 0.00048 0.00048 0.088 Incident Frequency per Vessel Type
0.087 0.087 0.022 0.022 0.0012 0.0012 0.22
DNV GL – Report No. PP111860-2, Rev. 5 – www.dnvgl.com Page 74
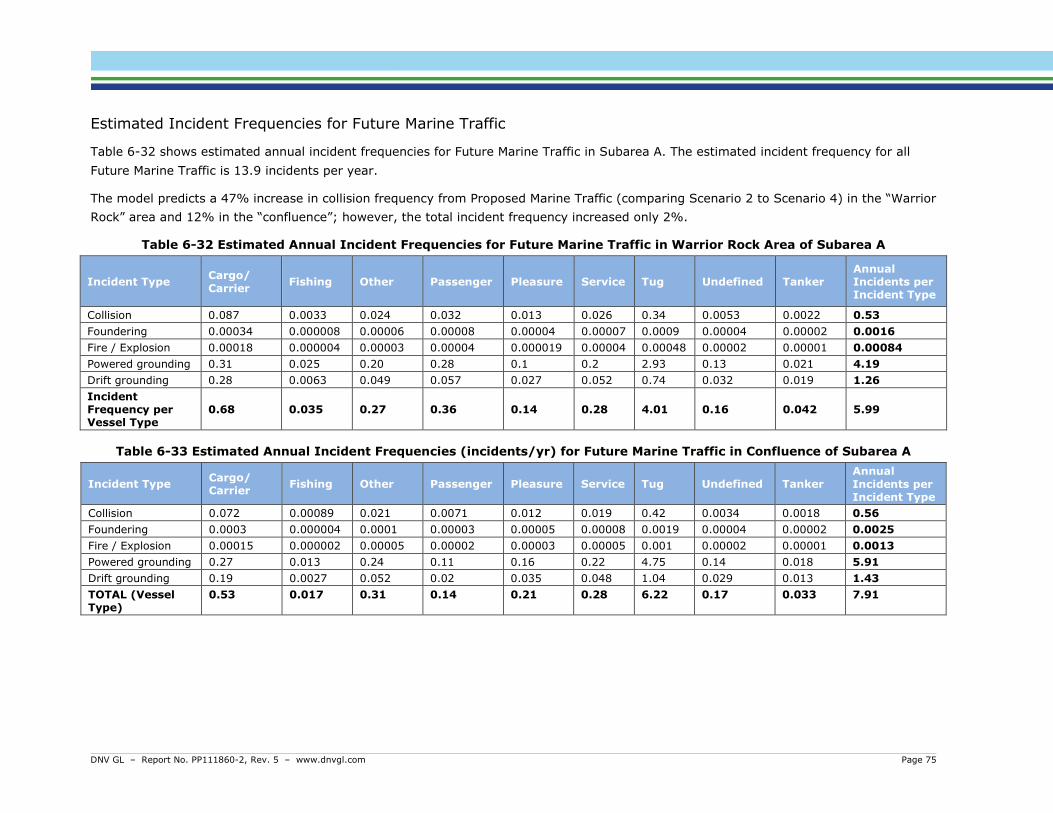
Estimated Incident Frequencies for Future Marine Traffic
Table 6-32 shows estimated annual incident frequencies for Future Marine Traffic in Subarea A. The estimated incident frequency for all Future Marine Traffic is 13.9 incidents per year.
The model predicts a 47% increase in collision frequency from Proposed Marine Traffic (comparing Scenario 2 to Scenario 4) in the “Warrior Rock” area and 12% in the “confluence”; however, the total incident frequency increased only 2%.
Table 6-32 Estimated Annual Incident Frequencies for Future Marine Traffic in Warrior Rock Area of Subarea A
Incident Type Cargo/ Carrier Fishing Other Passenger Pleasure Service Tug Undefined Tanker
Annual Incidents per Incident Type
Collision 0.087 0.0033 0.024 0.032 0.013 0.026 0.34 0.0053 0.0022 0.53 Foundering 0.00034 0.000008 0.00006 0.00008 0.00004 0.00007 0.0009 0.00004 0.00002 0.0016 Fire / Explosion 0.00018 0.000004 0.00003 0.00004 0.000019 0.00004 0.00048 0.00002 0.00001 0.00084 Powered grounding 0.31 0.025 0.20 0.28 0.1 0.2 2.93 0.13 0.021 4.19 Drift grounding 0.28 0.0063 0.049 0.057 0.027 0.052 0.74 0.032 0.019 1.26 Incident Frequency per Vessel Type
0.68 0.035 0.27 0.36 0.14 0.28 4.01 0.16 0.042 5.99
Table 6-33 Estimated Annual Incident Frequencies (incidents/yr) for Future Marine Traffic in Confluence of Subarea A
Incident Type Cargo/ Carrier Fishing Other Passenger Pleasure Service Tug Undefined Tanker
Annual Incidents per Incident Type
Collision 0.072 0.00089 0.021 0.0071 0.012 0.019 0.42 0.0034 0.0018 0.56 Foundering 0.0003 0.000004 0.0001 0.00003 0.00005 0.00008 0.0019 0.00004 0.00002 0.0025 Fire / Explosion 0.00015 0.000002 0.00005 0.00002 0.00003 0.00005 0.001 0.00002 0.00001 0.0013 Powered grounding 0.27 0.013 0.24 0.11 0.16 0.22 4.75 0.14 0.018 5.91 Drift grounding 0.19 0.0027 0.052 0.02 0.035 0.048 1.04 0.029 0.013 1.43 TOTAL (Vessel Type)
0.53 0.017 0.31 0.14 0.21 0.28 6.22 0.17 0.033 7.91
DNV GL – Report No. PP111860-2, Rev. 5 – www.dnvgl.com Page 75

Estimated Annual Incidents in Subarea B 6.2.4.3
Estimated Annual Incident Frequencies for Sample Vessels
Table 6-34 shows the estimated annual incident frequencies for Sample Vessels in Subarea B given Future Traffic. The estimated total incident frequency for all Sample Vessels is 0.75 incidents per year.
The model predicts a 76% increase in collision frequency as a result of Proposed Marine Traffic (comparing Scenario 2 to Scenario 4) in Subarea B; however, the total incident frequency in Subarea B increased by only 3%.
Table 6-34 Estimated Annual Incident Frequencies (incidents/yr) for Sample Vessels (Future Marine Traffic) in Subarea B
Incident type 47,000 DWT In
47,000 DWT Out
105,000 DWT In
105,000 DWT Out
165,000 DWT In
165,000 DWT Out
Annual Incidents per Incident Type
Collision 0.023 0.023 0.0058 0.0058 0.00032 0.00032 0.058 Foundering 0.00018 0.00018 0.00005 0.00005 0.000003 0.000003 0.00046 Fire / Explosion 0.0001 0.0001 0.00003 0.00003 0.000001 0.000001 0.00025 Powered grounding
0.12 0.12 0.031 0.031 0.0017 0.0017 0.31
Drift grounding 0.15 0.15 0.038 0.038 0.0021 0.0021 0.38 Incident Frequency per Direction
0.30 0.30 0.075 0.075 0.0041 0.0041 0.75
DNV GL – Report No. PP111860-2, Rev. 5 – www.dnvgl.com Page 76

Estimated Annual Incident Frequencies for Future Marine Traffic
Table 6-35 shows the estimated annual incident frequencies for Future Marine Traffic in Subarea B. The estimated total incident frequency for all Future Marine Traffic is 16.7 incidents per year.
The model predicts a 100% increase in collision frequency from Proposed Marine Traffic (comparing Scenario 2 to Scenario 4) in Subarea B; however, the total incident frequency increased 7%.
Table 6-35 Estimated Annual Incident Frequencies (incidents/yr) of Future Marine Traffic in Subarea B
Incident type Cargo/ Carrier Fishing Other Passenger Pleasure Service Tug Undefined Tanker
Annual Incidents per Incident Type
Collision 0.56 0.012 0.13 0.073 0.028 0.14 1.1 0.033 0.01 2.04 Foundering 0.0016 0.00003 0.00033 0.00015 0.00007 0.00034 0.0026 0.00022 0.00008 0.0055 Fire / Explosion 0.00087 0.00002 0.00018 0.00008 0.00004 0.00018 0.0014 0.00012 0.00005 0.003 Powered grounding 1.09 0.064 0.67 0.48 0.15 0.79 6.35 0.54 0.056 10.02 Drift grounding 1.32 0.022 0.23 0.12 0.053 0.27 2.16 0.18 0.068 4.43 Incident Frequency per Vessel Type
2.98 0.098 1.03 0.67 0.23 1.21 9.56 0.75 0.13 16.7
DNV GL – Report No. PP111860-2, Rev. 5 – www.dnvgl.com Page 77
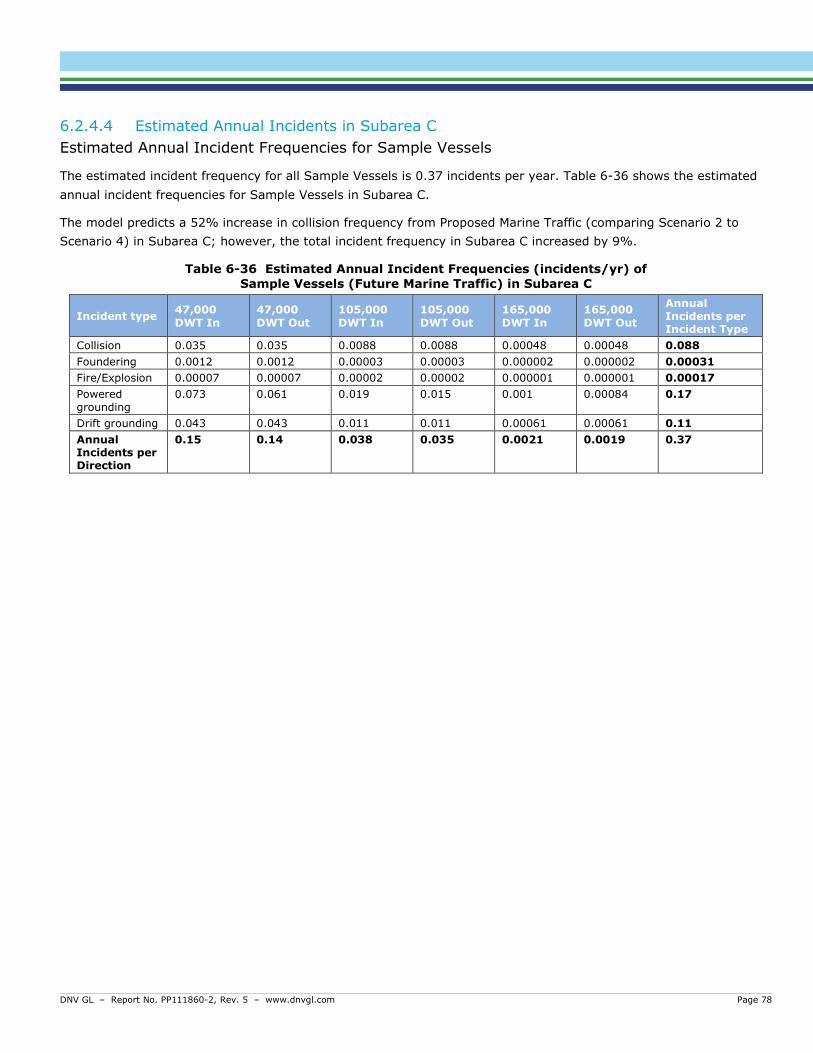
Estimated Annual Incidents in Subarea C 6.2.4.4
Estimated Annual Incident Frequencies for Sample Vessels
The estimated incident frequency for all Sample Vessels is 0.37 incidents per year. Table 6-36 shows the estimated annual incident frequencies for Sample Vessels in Subarea C.
The model predicts a 52% increase in collision frequency from Proposed Marine Traffic (comparing Scenario 2 to Scenario 4) in Subarea C; however, the total incident frequency in Subarea C increased by 9%.
Table 6-36 Estimated Annual Incident Frequencies (incidents/yr) of Sample Vessels (Future Marine Traffic) in Subarea C
Incident type 47,000 DWT In
47,000 DWT Out
105,000 DWT In
105,000 DWT Out
165,000 DWT In
165,000 DWT Out
Annual Incidents per Incident Type
Collision 0.035 0.035 0.0088 0.0088 0.00048 0.00048 0.088 Foundering 0.0012 0.0012 0.00003 0.00003 0.000002 0.000002 0.00031 Fire/Explosion 0.00007 0.00007 0.00002 0.00002 0.000001 0.000001 0.00017 Powered grounding
0.073 0.061 0.019 0.015 0.001 0.00084 0.17
Drift grounding 0.043 0.043 0.011 0.011 0.00061 0.00061 0.11 Annual Incidents per Direction
0.15 0.14 0.038 0.035 0.0021 0.0019 0.37
DNV GL – Report No. PP111860-2, Rev. 5 – www.dnvgl.com Page 78

Estimated Annual Incident Frequencies for Future Marine Traffic
Table 6-37 shows the total annual incident frequencies of Future Marine Traffic in Subarea C. The estimated incident frequency for all Future Marine Traffic is 12 incidents per year.
The model predicts a 71% increase in collision frequency from Proposed Marine Traffic (comparing Scenario 2 to Scenario 4) in Subarea C. The frequency of any type of incident increased 7%.
Table 6-37 Estimated Annual Incident Frequencies (incidents/yr) of Future Marine Traffic in Subarea C
Incident type Cargo/ Carrier Fishing Other Passenger Pleasure Service Tug Undefined Tanker
Annual Incidents per Incident Type
Collision 0.96 0.47 0.15 0.49 0.082 1.32 0.69 0.046 0.016 4.23 Foundering 0.0012 0.00055 0.00016 0.00045 0.0001 0.0013 0.00072 0.00014 0.00006 0.0047 Fire/Explosion 0.00067 0.0003 0.00009 0.00024 0.00005 0.0007 0.00039 0.00008 0.00003 0.0026 Powered grounding 0.64 0.84 0.29 0.85 0.13 1.82 1.38 0.23 0.031 6.21 Drift grounding 0.43 0.15 0.054 0.15 0.026 0.41 0.25 0.043 0.02 1.55 Annual Incidents per Vessel Type
2.04 1.47 0.49 1.49 0.24 3.54 2.33 0.32 0.067 12.0
DNV GL – Report No. PP111860-2, Rev. 5 – www.dnvgl.com Page 79

Estimated Annual Incidents in Subarea D 6.2.4.5
Estimated Incident Frequencies for Sample Vessels
Table 6-38 presents estimated annual incident frequencies for Sample Vessels given Future Marine Traffic in the Columbia River Bar. The estimated total incident frequency for all Sample Vessels is 0.075 incidents per year.
The model predicts a 69% increase in collision frequency from Proposed Marine Traffic (comparing Scenario 2 to Scenario 4) in Subarea D. The total incident frequency in Subarea D increased by 34%.
Table 6-38 Estimated Annual Incident Frequencies (incidents/yr) for Sample Vessels (Future Marine Traffic) in Subarea D
Incident type 47,000 DWT In
47,000 DWT Out
105,000 DWT In
105,000 DWT Out
165,000 DWT In
165,000 DWT Out
Annual Incidents per Incident Type
Collision 0.019 0.019 0.0049 0.0049 0.00027 0.00027 0.049 Foundering 0.00006 0.00006 0.00002 0.00002 0.000001 0.000001 0.00015 Fire / Explosion 0.00003 0.00003 0.000008 0.000008 0.0000004 0.0000004 0.00008 Powered grounding 0.013 0.0 0.003 0.0 0.0002 0.0 0.016 Drift grounding 0.0039 0.0039 0.001 0.001 0.00005 0.00005 0.0098 Annual Incidents per Direction
0.036 0.023 0.0091 0.0059 0.0005 0.00032 0.075
DNV GL – Report No. PP111860-2, Rev. 5 – www.dnvgl.com Page 80
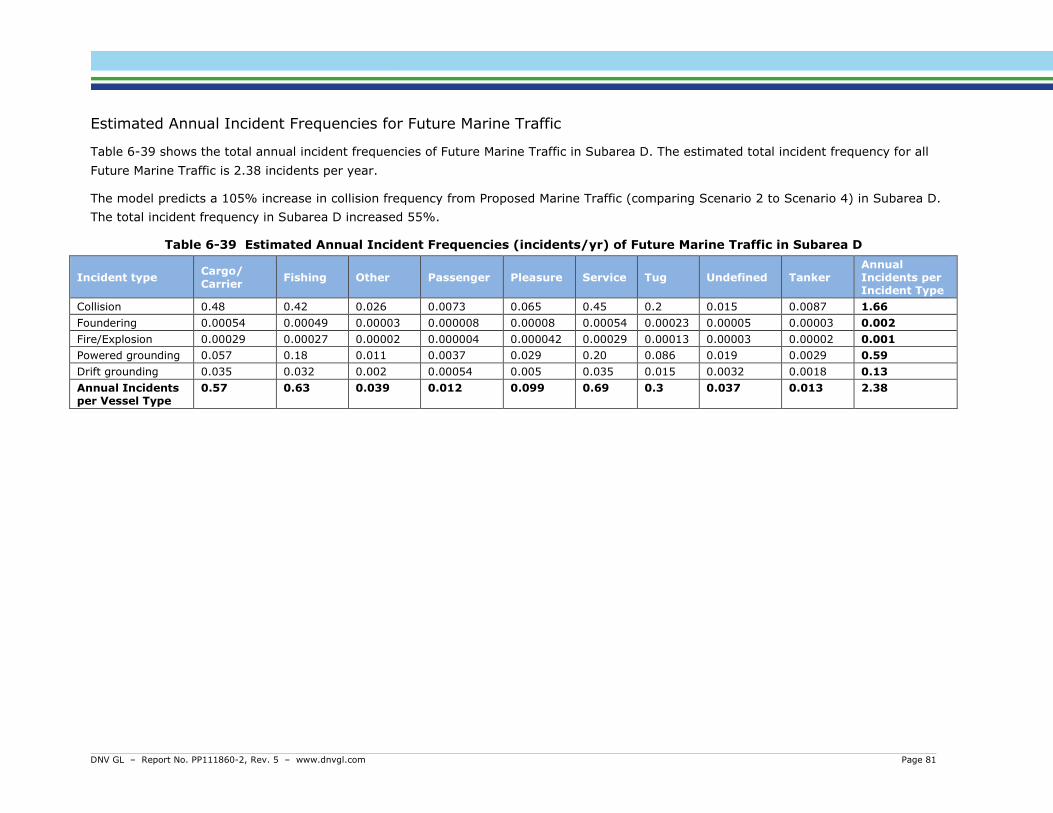
Estimated Annual Incident Frequencies for Future Marine Traffic
Table 6-39 shows the total annual incident frequencies of Future Marine Traffic in Subarea D. The estimated total incident frequency for all Future Marine Traffic is 2.38 incidents per year.
The model predicts a 105% increase in collision frequency from Proposed Marine Traffic (comparing Scenario 2 to Scenario 4) in Subarea D. The total incident frequency in Subarea D increased 55%.
Table 6-39 Estimated Annual Incident Frequencies (incidents/yr) of Future Marine Traffic in Subarea D
Incident type Cargo/ Carrier Fishing Other Passenger Pleasure Service Tug Undefined Tanker
Annual Incidents per Incident Type
Collision 0.48 0.42 0.026 0.0073 0.065 0.45 0.2 0.015 0.0087 1.66 Foundering 0.00054 0.00049 0.00003 0.000008 0.00008 0.00054 0.00023 0.00005 0.00003 0.002 Fire/Explosion 0.00029 0.00027 0.00002 0.000004 0.000042 0.00029 0.00013 0.00003 0.00002 0.001 Powered grounding 0.057 0.18 0.011 0.0037 0.029 0.20 0.086 0.019 0.0029 0.59 Drift grounding 0.035 0.032 0.002 0.00054 0.005 0.035 0.015 0.0032 0.0018 0.13 Annual Incidents per Vessel Type
0.57 0.63 0.039 0.012 0.099 0.69 0.3 0.037 0.013 2.38
DNV GL – Report No. PP111860-2, Rev. 5 – www.dnvgl.com Page 81

6.2.5 Estimated Annual Cargo Spill Frequency for Sample Vessels in Transit
Not all marine incidents result in a crude oil spill. MARCS estimated a fraction of these incidents would result in the spilling of any cargo. Since Sample Vessels are only expected to be laden going outbound, the incident frequency of a cargo oil spill was estimated only for outbound transits.
Table 6-40 presents the modeled annual cargo oil spills for Sample Vessels in the study area assuming Current Traffic. The estimated average annual cargo spill frequency is 0.051 / year, which can be interpreted as an average of one cargo spill incident every 19.5 years assuming Current Marine Traffic. The volume that relates to this frequency is presented in Section 6.3.3.
Table 6-40 Estimated Annual Cargo Oil Spill Frequency for Sample Vessels in the Study Area (Current Marine Traffic)
Incident type Outbound Sample Vessel Type Annual Oil Spill
Frequency per Incident Type 47,000 DWT 105,000 DWT 165,000 DWT
Collision 0.015 0.0037 0.00021 0.019 Foundering 0.00029 0.00007 0.000004 0.00037 Fire / Explosion 0.0002 0.00005 0.000003 0.00025 Powered grounding 0.013 0.0032 0.00018 0.016 Drift grounding 0.012 0.0031 0.00017 0.016 Annual Oil Spill Frequency per Sample Vessel Type 0.040 0.010 0.00056 0.051
As a point of reference, Table 6-41 shows the estimated annual accident frequency of a cargo oil spill from Sample Vessels given Future Marine Traffic. The estimated total accident frequency for all Sample Vessels is 0.062 incidents per year, meaning one cargo spill incident every 16.1 years assuming Proposed Marine Traffic.
The estimated incident return period of an oil spill from 47,000 DWT tankers is every 20.4 years. The estimated incident return period of an oil spill from 105,000 DWT tankers is every 83.3 years; and the estimated incident return period of an oil spill from 165,000 DWT tankers is every 1,470 years.
Table 6-41 Estimated Annual Cargo Oil Spill Frequency for Sample Vessels in the Study Area (Future Marine Traffic)
Incident type Outbound Sample Vessel Type Annual Oil Spill
Frequency per Incident Type 47,000 DWT 105,000 DWT 165,000 DWT
Collision 0.023 0.0058 0.00032 0.029 Foundering 0.00029 0.000073 0.0000040 0.00037 Fire / Explosion 0.00020 0.000051 0.0000028 0.00025 Powered grounding 0.013 0.0032 0.00018 0.016 Drift grounding 0.012 0.0031 0.00017 0.016 Annual Oil Spill Frequency per Sample Vessel Type
0.049 0.012 0.00068 0.062
DNV GL – Report No. PP111860-2, Rev. 5 – www.dnvgl.com Page 82

6.3 Consequence Assessment of Marine Transport Incidents The consequence assessment estimates the potential oil spill volume as a result of a marine transport accident involving a Sample Vessel. A commercial naval architecture package called NAPA is used to estimate the probability of oil outflow. The collision and grounding model links tanker hull design to longitudinal and transversal damage to the hull, in order to estimate oil spill. Using Monte Carlo simulations, in accordance with IMO Resolution MEPC.110(49) - Probabilistic Methodology for Calculating Oil Outflow.
This section describes ship parameters used in the model (Section 6.3.1), shows and discusses estimations of oil spill volumes from the three Sample Vessels (Section 6.3.2), and presents potential oil spill volumes (Section 6.3.3).
6.3.1 Sample Vessel Description Consequences for the Sample Vessels were modelled using a commercial naval architecture software package, NAPA. Table 6-42 contains general specifications of the tankers used in the analysis. The model estimates oil outflow volumes based on the number of damaged cargo tanks and interaction with tidal influences. Monte Carlo simulations were run for 50,000 damage cases to estimate the potential variability in impact and in oil outflow volumes.
Table 6-42 Sample Vessels Representing Vancouver Energy Terminal Tankers Parameter 47,000 DWT 105,000 DWT 165,000 DWT Length 183 m 235 m 264 m Breadth 32.2 m 42 m 50 m Depth 18.8 m 21.3 m 23.1 m Max Draft 12.17 m 14.8 m 17.15 m Number of Cargo Tanks 12 12 12 Number of Slop Tanks 2 2 2 Total Cargo Capacity 41,861 t 100,460 t 177,978 t Assumed Maximum Cargo Onboard 330,945 bbl 600,000 bbl 600,000 bbl Proportion of Sample Vessel Transits per Vessel Type
7/10 2/10 1/10
Note that the largest tanker will be filled to approximately one-half of its normal capacity.
Figure 6-6 is a drawing of a typical 47,000 DWT tanker used at the Vancouver Energy Terminal.
Figure 6-6 General Arrangement of a Typical 47,000 DWT Tanker
DNV GL – Report No. PP111860-2, Rev. 5 – www.dnvgl.com Page 83

Table 6-43 shows the maximum loaded volume for the three sample vessels. The 105,000 DWT vessel and
the 165,000 DWT vessel will be filled to 600,000 bbl.
Table 6-43 Sample Vessel Cargo Tank Sizes
Cargo Tank 47,000 DWT 105,000 DWT 165,000 DWT
Port-1 2,591 m3 (16,300 bbl)
7,544 m3 (47,450 bbl)
11,600 m3 (72,960 bbl)
Port-2 3,718 m3 (23,390 bbl)
10,159 m3 (63,900 bbl)
15,541 m3 (97,750 bbl)
Port-3 3,794 m3 (23,870 bbl)
10,187 m3 (64,070 bbl)
15,685 m3 (98,660 bbl)
Port-4 3,794 m3 (23,870 bbl)
10,187 m3 (64,070 bbl)
15,685 m3 (98,660 bbl)
Port-5 3,804 m3 (23,920 bbl)
9,792 m3 (61,590 bbl)
15,685 m3 (98,660 bbl)
Port-6 3,230 m3 (20,320 bbl)
9,439 m3 (59,371 bbl)
14,793 m3 (93,050 bbl)
Starboard-1 2,592 m3 (16,300 bbl)
7,544 m3 (47,450 bbl)
11,600 m3 (72,960 bbl)
Starboard-2 3,715 m3 (23,390 bbl)
10,159 m3 (63,900 bbl)
15,541 m3 (97,750 bbl)
Starboard-3 3,793 m3 (23,870 bbl)
10,187 m3 (64,070 bbl)
15,685 m3 (98,660 bbl)
Starboard-4 3,793 m3 (23,870 bbl)
10,187 m3 (64,070 bbl)
15,685 m3 (98,660 bbl)
Starboard-5 3,803 m3 (23,920 bbl)
9,792 m3 (61,590 bbl)
15,685 m3 (98,660 bbl)
Starboard-6 3,234 m3 (20,320 bbl)
9,439 m3 (59,371 bbl)
14,793 m3 (93,050 bbl)
Total 41,861 m3 (263,300 bbl)
100,460 m3 (631,870 bbl)
177,978 m3 (1,116,400 bbl)
6.3.2 Oil Spill Volumes In order to calculate oil spill volumes, assumptions were made about breaching the Sample Vessel’s cargo tanks. For cargo tank breaches via collision:
• The breach in the cargo tank is assumed at the water level, which leads to an initial loss of the oil in the cargo tank above the waterline due to the hydrostatic pressure.
• Oil outflow is calculated using the following baseline parameters:
Water density 62.4 lb/ft3 (Freshwater)
Tidal range Hydrostatic balance to the sea at zero tidal difference
Crude oil density 814 kg/m3
• After the breach, no measures are taken to reduce the volume of oil in the damaged compartment.
DNV GL – Report No. PP111860-2, Rev. 5 – www.dnvgl.com Page 84

For cargo tank breaches via grounding, it is assumed that:
• The breach of the cargo tank occurs below the waterline; hence a pressure balance calculation is carried out where the water pressure surrounding the tanker determines the amount of oil that flows out.
• This study assumed one meter tidal change. Tidal variation leads to “washout” of oil based on the water level, because the ship is assumed to remain at static elevation.
For cargo tank breaches, it is assumed that:
• At the terminal (i.e. dock), the Sample Vessel tanks are in ballast, being filled, or laden with oil.
• Sample Vessels are laden:
1. At the terminal - 50% of carrying capacity.
2. In the navigation channel –
• 330,945 bbl for the 47,000 DWT tanker.
• 600,000 bbl for the 105,000 DWT tanker.
• 600,000 bbl for the 165,000 DWT tanker.
The estimation was completed by determining the frequency of different oil spill volumes. This estimation is best calculated through Monte Carlo simulation to generate a probability distribution function. A function is developed for each type of incident for each Sample Vessel.
The Monte Carlo simulations were conducted in line with IMO Res. MEPC. 122(52), defining probability distributions of hole-size/indentation damage from collision and grounding incidents. By applying a probability distribution function, each unique combination of tanks or compartments in a given tanker design is assigned a probability of being damaged.
The results are reported in terms of the probability of a spill (selected on the y-axis) of a given volume (read off of the x-axis). The mean outflow (P50) and 90th percentile outflow (P90) are derived from the distribution graphs for side impact and bottom impact. A P50 probability estimate means that 50% of the calculated simulations exceed the P50 spill volume and by definition, 50% of the simulations are less than the P50 spill volume. It is a middle estimate. The simulations do not account for variability of all parameters, only the variation in tidal state. Therefore, selection of the relevant probability/volume pair appropriately considers other factors.
For collision, P90 is used to estimate oil spill volume because the model appropriately represents the conservative consequences of side impact in a river.
For grounding, the NAPA P50 is used to estimate oil spill volumes for the postulated scenarios studied in this assessment. The P90 volume could only be generated by compromise of more than one cargo tank, which is not a reasonable expectation given the predominance of soft shoreline substrate, the anticipated response time, and anticipated interventions.
DNV GL – Report No. PP111860-2, Rev. 5 – www.dnvgl.com Page 85

6.3.3 Estimated Oil Spill Volumes Spill Volumes from Collision
The results from the NAPA modelling for collision are shown in Figure 6-7 for the three Sample Vessels. An analysis of the P90 case shows that the modeled collision penetrated two oil cargo tanks. The initial oil outflow is driven by the hydrostatic pressure from the oil above the waterline. The residual oil outflow, which is the majority of the oil volume, is driven by washout effects from water flowing into the void space between the hull and cargo tank and into the cargo tank.
A comparison of the P90 spill volumes for the three Sample Vessels shows that the two larger vessels have similar spill volumes (102,500 bbl for 165,000 DWT tankers, and 100,000 bbl for 105,000 DWT tankers). It is 58,700 bbl for 47,000 DWT tankers.
Figure 6-7 Conditional Probability of Spill Volumes Given Collision
Spill Volumes from Grounding
The results from the NAPA modelling P50 spill volumes for collision are shown in Figure 6-8 for the three Sample Vessels. The P50 estimated volume represents a breach in two cargo tanks. The mechanisms include:
• A hole in the hull and cargo tanks under the waterline will lead to entrainment of water into the tanks. When the tanks are full, oil will wash out as water enters. However, after a while the oil will rise in the cargo tanks, as it is lighter than water, and only water will be washed in and out of the tank.
• The amount of oil washed out of cargo tanks depends on the tidal variation in the area. A 1 m tidal difference was assumed.
A comparison of the P50 spill volumes for the three Sample Vessels shows that the two larger vessels have similar spill volumes (31,900 bbl for 165,000 DWT tankers, and 30,600 bbl for 105,000 DWT tankers). It is 20,200 bbl for 47,000 DWT tankers.
DNV GL – Report No. PP111860-2, Rev. 5 – www.dnvgl.com Page 86

For grounding, the P90 results represent a breach in six cargo tanks. DNV GL’s subject matter experts in vessel structure and vessel stability calculations have evaluated the NAPA results in connection with the site specific operation data, i.e., soft shoreline substrate, the anticipated response time, and anticipated interventions, and have concluded that the P90 results are overstated and do not represent a realistic outcome.
Figure 6-8 Conditional Probability (P50) of Spill Volumes Given Grounding
DNV GL – Report No. PP111860-2, Rev. 5 – www.dnvgl.com Page 87


6.4.2 Oil Spill Risk from Grounding Figure 6-11 shows the combination of the potential oil spill volumes from grounding and the frequency for such a spill event.
The frequency of any oil spill from grounding is:
• 0.025 /year (1 every 40 years11) for 47,000 DWT tankers.
• 0.0063 /year (1 every 150 years) for 105,000 DWT tankers.
• 0.00035 /year (1 every 2,800 years) for 165,000 DWT tankers.
Figure 6-11 Oil Spill Risk due to Grounding
11 Return periods are rounded down to the next integer year.
DNV GL – Report No. PP111860-2, Rev. 5 – www.dnvgl.com Page 90

= × × ×== = =

7.1.1 Vessel Frequency, N The number of vessels, 𝑁𝑁, navigating inbound past Vancouver Energy Terminal were identified using AIS traffic information. Table 7-1 lists the number and type of ships that were navigating within 0.4 NM of the terminal. Four-tenths of a nautical mile NM is the average width of the navigable portion of the river between Vancouver Energy Terminal and Hayden Island. Tankers and Cargo/Carriers, because of their size, may affect the estimated risk. The vessel types are generally smaller, and may transit at higher speeds, but because of their size, these do not significantly affect the estimated risks.
Table 7-1 Number of and Characteristics of Vessels within 0.4 NM (2013)
Types Of Vessel Number of Vessels of
This Type (N) Cargo/Carrier 118
Fishing 5
Other 12
Passenger 5
Pleasure 21
Service 9
Tanker 6
Tug 21
7.1.2 Probability of Aberrancy, 𝑃𝑃𝐴𝐴 The probability of aberrancy (occasionally referred to as the causation probability) is a measure of the risk of a vessel losing control as a result of pilot error, adverse environmental conditions, or mechanical failure. The evaluation of accident statistics indicates that human error (causing 60% to 85% of the aberrancy cases) and environmental conditions form the primary reasons for accidents. To evaluate probability of aberrancy, DNV GL accounts for the following factors: the geometry of the navigation channel and the Sample Vessel location in the channel; the current direction and speed; and the crosscurrents.
To evaluate the probability of aberrancy, the study accounts for the following factors:
1. Geometry of the navigation channel and the location of the tanker compared to the channel (turns and bends).
2. Current direction and speed.
3. Crosscurrents.
4. Vessel traffic density.
The equation is:
PA= BR (RB) (RC) (RXC) (RD)
DNV GL – Report No. PP111860-2, Rev. 5 – www.dnvgl.com Page 92

Where:
• BR = aberrancy base rate (0.6×10⁻⁴ for vessel or 1.2×10⁻⁴ for barges);
• RB = correction factor for Sample Vessel location; 𝑅𝑅𝐵𝐵 = (1 + 𝜃𝜃
90°)
• Rc = correction factor for current acting parallel to vessel path; 𝑅𝑅𝐶𝐶 = (1 + 𝑉𝑉𝐶𝐶
10) VC specific to the Vancouver Energy site.
• Rxc = correction factor for crosscurrents acting perpendicular to vessel transit path; and 𝑅𝑅𝑋𝑋𝐶𝐶 = (1 + 𝑉𝑉𝑋𝑋𝐶𝐶) VXC specific to the Vancouver Energy site.
• RD = correction factor for vessel traffic density depending on the frequency of vessels.
The specific risk controls that are accounted for in this portion of the analysis are:
• Electronic Chart Display & Information System.
• Pilotage.
• Vessel Traffic Information Service (TV32).
An additional risk control not accounted for in this portion of the analysis is:
• Use of tugs to assist all vessels above Kelley Point.
Figure 7-1 illustrates the results from the probability of aberrancy.
Figure 7-1 Probability of Aberrancy
3.16E-05
4.86E-05
0.00E+00
1.00E-05
2.00E-05
3.00E-05
4.00E-05
5.00E-05
6.00E-05
Vessels with DWT < 2000 Vessels with DWT > 2000
Prob
abili
ty o
f Abe
rran
cy
DNV GL – Report No. PP111860-2, Rev. 5 – www.dnvgl.com Page 93

7.1.3 Probability of Sufficient Energy to Breach the Sample Vessel, 𝑃𝑃𝐶𝐶 Given that a vessel has become aberrant and struck an oil tanker at berth, in order to determine the potential to breach a cargo tank, it is necessary to calculate the available impact energy from the striking vessel. The available energy in the proximity of a Sample Vessel is therefore assessed based on the speed and mass of the ships passing the berth.
The ship movements are defined by average speed and deadweight tonnage for each ship type. From these inputs, the maximum impact energy is estimated. In addition, the ratio of ultimate lateral resistance to the vessel impact force is calculated in order to estimate the probability of sufficient energy to breach the vessel’s hull and cargo tank.
Figure 7-2 demonstrates the probability of sufficient energy to breach the Sample Vessel. The resulting probabilities are zero from smaller ship types, as expected, because these lack sufficient energy to cause a breach. It should be interpreted as the expected value for the maximum collision energy caused by each vessel type. This is the expected value for the maximum collision energy because it assumed that all available energy will be from the striking vessel.
Figure 7-2 Probability of Sufficient Energy to Breach a Cargo Tank
0.08 0.02
0.05 0.07
0
0.1
0.2
0.3
0.4
0.5
0.6
0.7
0.8
0.9
1
Prob
abili
ty o
f Col
laps
e (P
c)
DNV GL – Report No. PP111860-2, Rev. 5 – www.dnvgl.com Page 94


7.1.5 Annual Frequency of Breaching the Sample Vessel, 𝐴𝐴𝐹𝐹 The annual frequency of oil tanker breach based on the four probabilities described above. They are annual frequencies because they were multiplied with the number of vessels per year, 𝑁𝑁, navigating near Vancouver Energy Terminal.
The final annual frequency results have been evaluated for weighted average impact energy of 40 MJ. Figure 7-4 presents the annual frequency of breaching the Sample Vessel.
Figure 7-4 Frequency of Collision and Breach of the Oil Tanker while at the Terminal
7.2 Consequence Assessment for Striking at Dock Oil spill volumes for Sample Vessels at the dock were determined using oil spill volumes from NAPA modeling. NAPA was modeled specifically for loaded Sample Vessels in-transit. A collision with a moored Sample Vessel could occur at any time when the vessel is present. Therefore, it was assumed that, on average, a Sample Vessel would be 50% full when struck. To implement this, P90 spill volumes of collisions on route were reduced by 50% to consider the average spill volume at the dock.
The applied NAPA model results for striking at the dock are shown in Figure 7-5 for the three Sample Vessels. An analysis of the P90 case shows that the modeled striking penetrated two oil cargo tanks. The initial oil outflow is driven by the hydrostatic pressure from the oil above the waterline. The residual oil outflow, which is the majority of the oil volume, is driven by washout effects from water flowing into the void space between the hull and cargo tank and into the cargo tank. The primary difference between this striking result and the collision result is that the tankers are assumed to be loaded per the study assumptions (see previous Section 6.3.2) in transit for the collision estimate, but half full (on average) at the dock.
4.96E-05
4.79E-09 1.46E-06 0.00E+00
1.00E-05
2.00E-05
3.00E-05
4.00E-05
5.00E-05
6.00E-05
DNV GL – Report No. PP111860-2, Rev. 5 – www.dnvgl.com Page 96

A comparison of the P90 spill volumes for the three Sample Vessels shows that the two larger vessels have similar spill volumes; 51,200 bbl for the 165,000 DWT tanker, and 50,000 bbl for 105,000 DWT tanker. The estimated spill volume is 29,400 bbl for 47,000 DWT tankers.
Figure 7-5 Conditional Probability (P50) of Spill Volumes Given a Strike
DNV GL – Report No. PP111860-2, Rev. 5 – www.dnvgl.com Page 97


8.1 Scenario Identification Specific potential release scenarios were identified based on:
• Drawings (Piping and Instrumentation diagrams and Process Flow Diagrams).
• Release location.
• Material.
• Operating conditions (temperature and pressure).
The sections of equipment identified as within the boundaries of the study were:
• 36 inch loading pipeline from dock to the first onshore ESDV.
• Loading branches and loading pipelines connected to loading hoses.
• Loading hoses.
• Crude return lines running from dock up to the first onshore ESDV on the 36 inch line.
In order to calculate possible spill volumes and estimate their associated likelihoods (frequencies), the equipment was divided into isolatable sections per a standardized rule set common in safety QRA studies.
Table 8-1 lists the resulting isolatable sections and oil volumes within the sections.
Table 8-1 List of Isolatable Sections and Isolatable Volumes Isolatable
Section Description Length (m) Isolatable Volume (bbl)
1 36 inch loading pipeline 95
396 Loading branches 4
2 12 inch pipeline connected to loading branch 2
7.5 Loading hose 22 4 inch pipeline before isolation 0.7
3 12 inch pipeline connected to loading branch 2
7.6* Loading hose 22 4 inch pipeline before isolation 2
4 4 inch crude return line after isolation 6
11.2 6 inch crude return line up to the onshore ESDV 95
* Applicable to Method 1 only
DNV GL – Report No. PP111860-2, Rev. 5 – www.dnvgl.com Page 100

To define the specific events for each potential pipeline release scenario, the study applied a distribution to the hole sizes, and selected representative hole sizes as listed in Table 8-2. Note that these size categories are hole size ranges, and based on experience in similar projects, one representative size is applied in the modeling to reflect each range.
Table 8-2 Hole Sizes for Pipes
Descriptor Range (Diameter Equivalent)
Representative Size (Circular Diameter
Equivalent) Small 0 mm < Ø ≤ 20 mm 15 mm
Medium 20 mm < Ø ≤ 80 mm 50 mm Large 80 mm < Ø ≤ 150 mm 100 mm
Full Bore 150 mm ≤ Ø Full Diameter
Isolation times were developed to account for release location, leak size, and mode of operation. The isolation times are presented in Table 8-8, and are inclusive of detection, response times, and valve closure, so they indicate times from start of release to the time when the ESDVs are fully closed.
Transfer hoses were treated using two different methods because of the form of the best available data, discussed below.
8.2 Frequency of Oil Releases The scenarios consider oil releases due to leaks from pipelines, hoses and connecting equipment such as valves, flanges, instruments, drains, and vents. Frequencies of these leaks have been estimated based on best available historical incidents involving oil releases. Thus, the frequencies do not take into account site specific factors such as pipeline wall thickness, age of the pipeline, or material type. Three types of leak sources require historical frequency data: pipelines, hoses, and connecting equipment.
In addition, they need to be correlated to hole size and mode of operation, accounting for the probability of success of attempted isolation.
8.2.1 Leak Sources Pipelines 8.2.1.1
For leaks from pipelines, the types of failures and associated frequencies were derived from the US Department of Transportation Pipeline and Hazardous Safety Administration (PHMSA) (Ref. /24/) database which records incidents involving releases from above ground crude oil pipelines within terminals. The failure frequency for the above ground crude oil pipeline was derived on a per year per meter basis, taking into account the pipeline length and incidents involving mechanical punctures, leaks or ruptures from the crude oil pipeline operations.
For the scenarios concerning 36 inch, 12 inch, and 6 inch pipelines, the failure frequencies were calculated using pipeline lengths and distributions of the failure frequencies among the hole sizes (small, medium, large, rupture).
The 4 inch pipeline is best represented in the process pipework failure data, consequently, the failure frequencies for 4 inch pipes were based on UK Hydrocarbon Release Database (HCRD) offshore data (Ref. /25/).
DNV GL – Report No. PP111860-2, Rev. 5 – www.dnvgl.com Page 101

Loading Hoses 8.2.1.2
Two methods were used to estimate the frequency of spills related to loading hoses. Both methods use the average number of cargo transfers per year, 365, to calculate annual failure frequencies of the loading hoses / transfer operation.
Method 1 used loading hose failure frequencies obtained from the UK HSE Advisory Committee on Dangerous Substances (Ref. /26/). The frequencies were based on incidents involving connection failures and ranging failures12. The ranging failure frequencies were deduced on a per transfer basis, whereas connection failure frequencies were derived on a per hose per transfer basis. Frequencies for loading hoses were calculated separately for each hose (3.7x10⁻⁴ per transfer).
Method 2 used transfer operation failure frequencies derived from Tesoro’s historical spill data. Tesoro provided DNV GL with their historical release data related to global oil transfer operations for the period January 2009 to December 2014 (Ref. /27/). Of most relevance to the current analysis are 21,062 barge-to-shore and ship-to-shore transfers, which represent the 99.4% of the transfers during that period. There were only two reported cargo transfer incidents during the evaluated six-year period. One of the instances resulted in a release of 1 cup of crude oil to water; the other incident resulted in 41 bbl released with about 1-2 bbl released to water (including the amount that was eventually recovered). Because of the comparatively limited nature of the dataset, a confidence analysis was used to estimate the 99% confidence level, which is a spill event frequency of 4.0x10⁻⁴ per transfer, or an average of one event every 250 transfers.
Comparing the two methods, the frequency of spills can be considered the same. The differences between the approaches are primarily in the estimated spill volumes, as discussed in Section 8.4.3.
Piping Connections 8.2.1.3
For equipment connected to 36 inch, 12 inch, and 6 inch pipeline, the failure frequencies are based on the US Department of Transportation PHMSA data, whereas for equipment connected to 4 inch pipelines, failure frequencies are based on the UK HCRD offshore data (Ref. /25/).
8.2.2 Correlation of Frequency to Hole Size and Mode of Operation Once the basis of failure frequencies for pipelines and connecting equipment is established, the frequencies are directly related to hole size ranges. The exception is for loading hoses, which are described above.
For a pipeline or connecting equipment of a given size, the frequencies of failures within each hole size range were calculated. The calculations were done for each size range of pipeline and connecting equipment. Pipeline lengths are also required in order to calculate failure frequencies on a per year basis, as the incident data for pipelines generally reports frequencies on a per year per meter basis. Pipeline lengths were estimated from layout drawings. For equipment connected to the pipelines, a parts count was used to estimate the number of connections per size and type. These counts were used in conjunction with the historical frequencies to estimate the failure frequencies for each hole size range.
Two modes of operation are defined for the purposes of this study:
12 Ranging failures are due to gross movement of the ship at the jetty.
DNV GL – Report No. PP111860-2, Rev. 5 – www.dnvgl.com Page 102

1. Loading mode – a tanker is present and oil is being transferred.
2. Holding mode – the loading pump is not operating and therefore the loading hoses are not pressurized. During this mode, a tanker may be present while preparing for loading or while preparing for departure.
The frequencies were distributed between the two modes. This is achieved by first calculating the fraction of time loading and holding occur in a year and then multiplying the calculated frequencies with these fractions to arrive at mode-specific frequencies. Input data include the ship types, numbers of transfers per year for each ship type, quantity of oil being transferred, and total loading rate (through both hoses).
Table 8-3 presents the calculated loading fractions for the ship types, which are then summed to calculate an overall loading fraction of 0.53. This result should be interpreted as: 53% of a given year a ship will be loading at the terminal.
Table 8-3 Portion of a Year when Loading Occurs per Sample Vessel
Sample Vessel Number of Cargo Transfers (per yr)
Loading Time (hr/transfer)
Average Loading Fraction (per yr)
47,000 DWT 288 10.7 0.35 105,000 DWT 59 20 0.14 165,000 DWT 19 20 0.04
TOTAL 0.53
8.2.3 Isolation Probability Although there are many mitigation measures in place to prevent isolation failure, a detailed fault tree analysis of the probability for failure has not been conducted in this analysis. A simplified, conservative calculation has been performed to generically estimate the potential for various mechanisms to fail that may then result in continued pumped flow into the loading pipeline.
To account for the possibility of failure to isolate, either due to failure of the relevant ESDs or due to pump failure, the probability of isolation failure is determined as:
Pisolation failure = PFDESD x PFDPump
Where,
PFDESD = probability of failure on demand of the ESD(s); as the ESD system complies with Safety Integrity Level (SIL) 2, this is defined as 1%.
PFDPump = probability of failure on demand of the independent ESD initiating a shutdown of the loading pump. The independent ESD complies with SIL2 system, this is defined as 1%.
Loading activity is being monitored by pressure sensors, a flow controller and personnel on the dock during the transfer. Human intervention is not required to initiate an ESD following a release i.e., on detection of the release, ESD would be activated automatically; therefore, the probability of human failure is not considered.
Note that detection failure is not considered in this study. All releases are assumed to be detected at the maximum time for their respective size.
DNV GL – Report No. PP111860-2, Rev. 5 – www.dnvgl.com Page 103

Accordingly, each release scenario is split into two cases – isolation success and isolation failure. The release frequencies are multiplied with the calculated success and failure probabilities to obtain separate frequencies for the two cases.
The isolation failure case is not applicable to all potential releases. Isolation failure is not relevant for leaks from the crude return lines within Isolatable Section 4 because these valves are considered always closed. Therefore, for the leaks from the crude return lines, release frequencies correspond to pipeline failure frequencies without taking into account isolation failure or isolation success probabilities, and the spill volumes correspond to the isolated inventory equivalent to the volume of Isolatable Section 4.
8.2.4 Frequency Results Table 8-4 presents the frequency results for the isolatable sections and scenarios.
Table 8-4 Oil Release Frequency per Scenario and Isolatable Section
Isolatable Section Scenario Description Scenario
Number
Scenario Release Frequency
(events per year)
Section Release Frequency
(events per year)
1
1.1 36" trestle loading line from first onshore ESD up to dock
1.1S 3.7x10⁻⁵
4.6x10⁻⁵ 1.1M 6.7x10⁻⁶ 1.1L 5.2x10⁻⁷ 1.1R 2.0x10⁻⁶
1.2 36" loading line at dock and loading branches
1.2S 6.5x10⁻⁶
7.9x10⁻⁶ 1.2M 9.7x10⁻⁷ 1.2L 8.6x10⁻⁸ 1.2R 4.0x10⁻⁷
1.3 36" loading line and loading branches
1.3S 4.3x10⁻⁵
5.5x10⁻⁵ 1.3M 7.3x10⁻⁶ 1.3L 6.0x10⁻⁷ 1.3R 2.5x10⁻⁶
2
2.1 12" loading hose pipeline at dock
2.1S 7.1x10⁻⁷
8.7x10⁻⁷ 2.1M 8.2x10⁻⁸ 2.1L 1.2x10⁻⁸ 2.1R 6.3x10⁻⁸
2.2 4" crude return line (before isolation valve) at dock
2.2S 1.2x10⁻⁴ 1.4x10⁻⁴ 2.2M 1.3x10⁻⁵
2.2L 1.2x10⁻⁵
2.3 Crude loading hose See Table 8-5 and Table 8-6
3
3.1 12" loading hose pipeline at dock
3.1S 7.1x10⁻⁷
8.7x10⁻⁷ 3.1M 8.2x10⁻⁸ 3.1L 1.2x10⁻⁸ 3.1R 6.3x10⁻⁸
3.2 4" crude return line (before isolation valve) at dock
3.2S 1.2x10⁻⁴ 1.4x10⁻⁴ 3.2M 1.3x10⁻⁵
3.2L 1.2x10⁻⁵
3.3 Crude loading hose See Table 8-5 and Table 8-6
DNV GL – Report No. PP111860-2, Rev. 5 – www.dnvgl.com Page 104

Isolatable Section Scenario Description Scenario
Number
Scenario Release Frequency
(events per year)
Section Release Frequency
(events per year)
4
4.1 & 4.2 4" crude return line (after isolation valve)
4.1S 6.6x10⁻⁵ 9.2x10⁻⁵ 4.1M 8.7x10⁻⁶
4.1L 1.7x10⁻⁵ 4.2S 2.5x10⁻⁴
3.1x10⁻⁴ 4.2M 2.9x10⁻⁵ 4.2L 3.0x10⁻⁵
4.3 & 4.4 6" crude return line
4.3S 3.4x10⁻⁵
5.3x10⁻⁵ 4.3M 1.0x10⁻⁵ 4.3L 2.2x10⁻⁶ 4.3R 6.5x10⁻⁶ 4.4S 3.4x10⁻⁵
5.3x10⁻⁵ 4.4M 1.0x10⁻⁵ 4.4L 2.2x10⁻⁶ 4.4R 6.5x10⁻⁶
Table 8-5 Transfer Operation Oil Spill Frequencies – Method 1
Isolatable Section Scenario Description
Scenario
Number
Spill Frequency (per year)
2
2.3 Crude loading hose Isolation Success
2.3S 5.75x10⁻² 2.3L 7.59x10⁻³ 2.3B 8.43x10⁻⁴
2.3 Crude loading hose Isolation Failure
2.3S 5.87x10⁻⁶ 2.3L 7.74x10⁻⁷ 2.3B 8.60x10⁻⁸
3
3.3 Crude loading hose Isolation Success
3.3S 5.75x10⁻² 3.3L 7.59x10⁻³ 3.3B 8.43x10⁻⁴
3.3 Crude loading hose Isolation Failure
3.3S 5.87x10⁻⁶ 3.3L 7.74x10⁻⁷ 3.3B 8.60x10⁻⁸
TOTAL 0.132
DNV GL – Report No. PP111860-2, Rev. 5 – www.dnvgl.com Page 105

Table 8-6 Transfer Operation Oil Spill Frequencies – Method 2
Isolatable Section Scenario Description Scenario
Number Spill Frequency
(per year)
2 2.3 Crude loading hose
2.3-1 1.84x10⁻² 2.3-2 1.10x10⁻² 2.3-3 7.35x10⁻³ 2.3-4 7.35x10⁻³ 2.3-5 7.35x10⁻³ 2.3-6 3.67x10⁻³ 2.3-7 3.67x10⁻³ 2.3-8 7.35x10⁻³ 2.3-9 3.67x10⁻³ 2.3-10 2.94x10⁻³ 2.3-11 1.27x10⁻⁵
3 3.3 Crude loading hose
3.3-1 1.84x10⁻² 3.3-2 1.10x10⁻² 3.3-3 7.35x10⁻³ 3.3-4 7.35x10⁻³ 3.3-5 7.35x10⁻³ 3.3-6 3.67x10⁻³ 3.3-7 3.67x10⁻³ 3.3-8 7.35x10⁻³ 3.3-9 3.67x10⁻³ 3.3-10 2.94x10⁻³ 3.3-11 1.27x10⁻⁵
TOTAL 0.146
The frequency of any oil being released from the loading equipment is estimated to be an average of 1.3 to 1.5 releases every ten years of operation based on two different estimation methods.
A small leak from either loading hose comprises a large portion of the leak frequency. The sum of all other scenario frequencies results in an average of 1.8 every 100 years. Note that no credit is given to containment systems, catchments, or surface elevation changes, hence “releases” should not be generally interpreted as spills to a waterway. Small spills on land will be predominantly within secondary containment systems.
8.3 Consequence Assessment from Loading For each scenario, the spill quantity was estimated by calculating the dynamic (pumped) inventory and then adding the isolated section inventory, also called static inventory. The intent is to divide the spill quantity into two parts.
The first part is the dynamic inventory, the release quantity from the beginning of a release until closure of ESDVs. Dynamic inventories are generally calculated by multiplying outflow rates with ESD times when isolation succeeds, and with release duration (1 hour) for the isolation failure scenario. Except for the scenario when the loading pump continues for one hour following a rupture of the 36 inch pipeline, the initial maximum outflow rates were calculated based on hole sizes and release pressures, and these outflow rates were used to estimate the dynamic inventories.
DNV GL – Report No. PP111860-2, Rev. 5 – www.dnvgl.com Page 106

While calculating the outflow rate for leaks from pipelines other than 36 inch pipeline, frictional losses associated with pipeline length and valves are not accounted for, giving conservative results. The same approach is adopted for leaks from 36 inch pipeline with hole size smaller than the pipeline diameter. Note that in reality, the frictional losses would vary with release locations because of the variations of lengths of pipeline and numbers of valves, and distance from a source of pressure such as pump or tank to the release locations. As a result, dynamic inventories would vary based on the release location. The adopted approach for modeling leaks does not take into account such variations.
A different approach was used for ruptures of the 36 inch pipeline, during loading mode. The transient outflow rates for the ruptures were calculated taking into account frictional losses associated with pipeline length and onshore ESDV. The dynamic inventory, which is the release inventory until the loading pump shuts down, was calculated by estimating the area under the mass flowrate curve up to one hour. Static inventory was then added to the dynamic inventory to calculate the total release amount.
For leaks within an already isolated section, the dynamic (pumped) inventory does not further add to the volume of the spill. Such situation applies to Isolatable Section 4 because during loading or holding modes, the drain shut off valves are closed, so there is no inflow assumed into the isolatable section and only the static inventory is applied.
Note that liquid holdups related to expansion joints and vertical variations are conservatively not considered in the volume outflow calculation.
The second part is static inventory, the spill quantity after closure of ESDVs until all inventory in the isolatable section is released. The isolatable section volume was presented in previous Table 8-1.
Table 8-7 presents the oil volume released for each scenario, the sum of the dynamic and static inventories.
Table 8-7 Oil Spill Volume per Scenario
Isolatable Section Scenario Description Scenario Number
Scenario Release
Volume (bbl)
1
1.1 36" trestle loading line from first onshore ESD up to dock
1.1S 866 1.1M 1,611 1.1L 3,968 1.1R 32,848
1.2 36" loading line at dock and loading branches
1.2S 862 1.2M 1,561 1.2L 3,868 1.2R 32,848
1.3 36" loading line and loading branches
1.3S 396 1.3M 396 1.3L 396 1.3R 396
DNV GL – Report No. PP111860-2, Rev. 5 – www.dnvgl.com Page 107

Isolatable Section Scenario Description Scenario Number
Scenario Release
Volume (bbl)
2
2.1 12" loading hose pipeline at dock
2.1S 84 2.1M 784 2.1L 3,091 2.1R 28,588
2.2 4" crude return line (before isolation valve) at dock
2.2S 84 2.2M 784 2.2L 3,091
2.3 Crude loading hose See Table 8-9 and Table 8-11
3
3.1 12" loading hose pipeline at dock
3.1S 84 3.1M 784 3.1L 3,091 3.1R 28,589
3.2 4" crude return line (before isolation valve) at dock
3.2S 84 3.2M 784 3.2L 3,091
3.3 Crude loading hose See Table 8-9 and Table 8-11
4
4.1 & 4.2 4" crude return line (after isolation valve)
4.1S 11 4.1M 11 4.1L 11 4.2S 11 4.2M 11 4.2L 11
4.3 & 4.4 6" crude return line
4.3S 11 4.3M 11 4.3L 11 4.3R 11 4.4S 11 4.4M 11 4.4L 11 4.4R 11
The crude loading hose release volumes were estimated using two different methods.
For Method 1, the following transfer hose release sizes were defined based on DNV GL’s experience with standard QRA methodology, and also based on data available from the UK HSE Advisory Committee on Dangerous Substances, Major Hazard Aspects of the Transport of Dangerous Substances (Ref. /26/):
• Minor loading hose failure: Isolation time is 30 seconds with a release at a rate equal to 110% of the normal transfer rate through one hose. The enhancement accounts for pump over-speed, and preferential flow through the hose that fails.
• Major loading hose failure: Isolation time is 60 seconds with a release rate equal to 110% of the normal transfer flow through one hose. The enhancement accounts for pump over-speed, and preferential flow through the hose that fails.
DNV GL – Report No. PP111860-2, Rev. 5 – www.dnvgl.com Page 108

• Failure involving both loading hoses: Isolation time is 60 seconds with a release rate equal to whole
loading rate through all hoses, without enhancement.
Table 8-8 shows the isolation times used to estimate dynamic inventory for Method 1.
Table 8-8 Method 1 Representative Isolation Times (in minutes)
Release Source Release
Release Location
Within Dock Other than Dock
Detection Time
Valve Closure
Time
Total Isolation
Time
Detection Time
Valve Closure
Time
Total Isolation
Time
Hose Minor failure in one hose 0 0.5 0.5 - - -
Hose Major failiure in one hose 0.5 0.5 1.0 - - -
Hose Both hoses leak 0.5 0.5 1.0 - - -
Other than hose Small Hole 1.0 0.5 1.5 5.0 0.5 5.5
Other than hose Medium Hole 1.0 0.5 1.5 5.0 0.5 5.5
Other than hose Large Hole 1.0 0.5 1.5 3.0 0.5 3.5
Other than hose Full Bore Rupture 1.0 0.5 1.5 1.0 0.5 1.5
Additional details concerning hole sizes, isolation times for each valve and section pressures and temperatures are provided in Appendix B. Table 8-9 shows the resulting volumes for Method 1.
DNV GL – Report No. PP111860-2, Rev. 5 – www.dnvgl.com Page 109

Table 8-9 Transfer Operation Oil Spill Volume per Scenario – Method 1
Isolatable Section Scenario Description Scenario Number Volume (bbl)
2
2.3 Crude loading hose Isolation Success
2.3S 145 2.3L 283 2.3B 508
2.3 Crude loading hose Isolation Failure
2.3S 16,508 2.3L 16,508 2.3B 30,008
3
3.3 Crude loading hose Isolation Success
3.3S 145 3.3L 283 3.3B 508
3.3 Crude loading hose Isolation Failure
3.3S 16,508 3.3L 16,508 3.3B 30,008
For Method 2, the distribution of release sizes from the loading hose / cargo transfer operation was based on historical data for hydrocarbon tanker loading incidents in the US. Environmental Research Consulting analyzed trends in oil spills in US navigable waters between 1985 and 2004 (Ref. /28/). Table 8-10 shows the analysis of the ERC data as applied to this study.
Table 8-10 Oil Transfer Spills (300+ GRT Vessels) into US Navigable Waters 1985-2004 (Ref. /28/)
Percentile Spill Spill Volume (bbl)
Probability Fraction
25th 0.05 0.25
40th 0.19 0.15
50th 0.48 0.1
60th 0.71 0.1
70th 1.4 0.1
75th 1.7 0.05
80th 2.4 0.05
90th 7.1 0.1
95th 14 0.05
99th 238 0.04 100th
(worst discharge) 92,857 0.0002
The above distribution of spill volumes was applied to the frequency of transfer spills estimated for Vancouver Energy. The primary assumption behind this approach is that, in general, the types of failures and spills that occur during cargo transfer throughout the US are similar in size distribution to those that might occur at Vancouver Energy.
DNV GL – Report No. PP111860-2, Rev. 5 – www.dnvgl.com Page 110

Table 8-11 shows the resulting volumes for Method 2.
Table 8-11 Transfer Operation Oil Spill Volume per Scenario – Method 2 Isolatable
Section Scenario Description Scenario Number Volume (bbl)
2 2.3 Crude loading hose
2.3-1 0.05 2.3-2 0.19 2.3-3 0.48 2.3-4 0.71 2.3-5 1.4 2.3-6 1.7 2.3-7 2.4 2.3-8 7.1 2.3-9 14 2.3-10 238 2.3-11 92,857
3 3.3 Crude loading hose
3.3-1 0.05 3.3-2 0.19 3.3-3 0.48 3.3-4 0.71 3.3-5 1.4 3.3-6 1.7 3.3-7 2.4 3.3-8 7.1 3.3-9 14 3.3-10 238 3.3-11 92,857
8.4 Oil Spill Risk from Cargo Loading This section presents the results of volumes of oil and related frequencies for the transfer operation scenarios using the two different methods applied in the study. Appendix B provides a greater level of detail for each scenario.
DNV GL – Report No. PP111860-2, Rev. 5 – www.dnvgl.com Page 111

8.4.1 Method 1 Figure 8-2 presents the spill volume ranges and associated release frequencies calculated using Method 1. In order to understand the distribution of the spill volumes and associated release frequencies, the spill volumes are presented in terms of ranges.
This method predicts that spill volumes between 100 and 5000 bbl are the most likely (one event every 8 years), while spill volumes greater than 30,000 bbl are possible, but extremely unlikely (1 in 6,000,000 years).
Figure 8-2 Cargo Loading Oil Release Volumes and Associated Frequencies, Method 1
Loading hoses contribute 87% of the oil spill risk from loading equipment. It is unknown whether the underlying data involving crude loading hoses takes into account shelf lives of loading hoses; oil spill incidents separated based on shelf lives of loading hoses are not currently available. Therefore, replacing the crude loading hoses every seven years as part of preventative maintenance plan would be expected to reduce the likelihood of a spill.
While the preventive maintenance plan for the loading hoses is expected to reduce the spill frequency, quantification of the reduction is not performed in this study because hours in use are not known for crude loading hoses documented in the historical failure data. Note that a detailed fault tree analysis has not been performed to analyze the potential isolation failure mechanisms, and only a generic failure probability has been applied.
DNV GL – Report No. PP111860-2, Rev. 5 – www.dnvgl.com Page 112

Part of the value of a detailed risk assessment is the ability to look deeply into which scenarios contribute to the risk. For the Method 1 assessment, the following items are noteworthy:
• The scenario with the highest predicted frequency is related to a small release from one of the crude loading hoses during cargo transfer, with isolation success. The estimated spill quantity is 145 bbl with a total frequency of 1.2x10⁻¹ per year, which is once in 9 years.
• A small release from the 12 inch loading pipeline or 4 inch crude return line within Isolatable Section 2 or 3 results in about 9 bbl of oil spilled, which is the smallest quantity of oil spilled among all the scenarios considered in the study, with associated release frequency of 2.4x10⁻⁴ per year i.e. once in 4,200 years.
• As expected, full bore ruptures of 36 inch loading pipelines either during loading or holding are the worst scenarios in terms of severity of the release; however the likelihood of such a release is very low. If isolation (i.e., ESD system) fails, the rupture of the 36 inch loading line would result in an oil spill quantity of 31,600 bbl; however with a relatively small occurrence frequency of 2.4x10⁻¹⁰ per year, which is once in 4.1 billion years. The scenario of successful isolation of the pipeline rupture would bring the spill quantity down to about 1,200 bbl with associated frequency of 2.4x10⁻⁶ per year, which is once in 420,000 years.
DNV GL – Report No. PP111860-2, Rev. 5 – www.dnvgl.com Page 113


Figure 8-4 presents a portion of Figure 8-3, focusing on the smaller, more frequent spills.
Figure 8-4 Oil Spill Risk due to Cargo Loading (zoomed on most frequent events)
8.4.2 Method 2 Figure 8-6 presents the spill volume ranges and associated release frequencies calculated using Method 2. In order to understand the distribution of the spill volumes and associated release frequencies, the spill volumes are presented in terms of ranges.
This method predicts that spill volumes between 0 and 50 bbl are the most likely (one event every 7 years), while spill volumes greater than 30,000 bbl are possible, but extremely unlikely (1 in 40,000 years).
DNV GL – Report No. PP111860-2, Rev. 5 – www.dnvgl.com Page 115

Figure 8-5 Cargo Loading Oil Release Volumes and Associated Frequencies, Method 2
For the Method 2 assessment, the following items are noteworthy:
• The sum of the frequencies for potential releases with spill volumes less than 1 bbl is 8.8x10⁻² per year, i.e. once in 11 years. This frequency represents 60% of the frequency total in the study.
• The most frequent release is related to a very small release from one of the crude loading hoses during cargo transfer. The estimated spill quantity is 0.05 bbl (2 gallons) with a total frequency of 3.7x10⁻² per year, which is once in 27 years. This is also the smallest quantity of oil spilled among the scenarios considered in the study.
• The worst case cargo transfer operation / hose failure included in the study is the worst scenario in terms of severity of the release; however the likelihood of such a release is low. Note that this release inventory is based on the worst case release in US navigable waters related to a transfer operation incident. The inventory is approximately 92,900 bbl with an occurrence frequency of 2.5x10⁻⁵ per year, which is once in 39,000 years.
The risk curve for oil spills due to cargo loading is shown in Figure 8-6.
DNV GL – Report No. PP111860-2, Rev. 5 – www.dnvgl.com Page 116


8.4.3 Comparison This section compares the results from two methods used to estimate loading spill risk. In general, the two methods give similar overall results: the predicted frequency of a small spill is one in every 7 to 8 years.
Figure 8-8 is a plot of the exceedance frequencies and volumes of oil released. For a given oil spill quantity, the exceedance frequency is the frequency of an oil spill resulting in a spill volume equal to or greater than the value on the x-axis.
Figure 8-7 Log-Log Method Comparison of Oil Spill Risk due to Cargo Loading
DNV GL – Report No. PP111860-2, Rev. 5 – www.dnvgl.com Page 118

Figure 8-8 and Figure 8-9, two different ways to show the same data, present the relative risk for different spill sizes based on the two methods.
Figure 8-8 Cargo Loading Method Comparison (Normal Frequency Scale)
Figure 8-9 Cargo Loading Method Comparison (Logarithmic Frequency Scale)
DNV GL – Report No. PP111860-2, Rev. 5 – www.dnvgl.com Page 119

The differences in the results are plausible given the methods used and underlying data. For methods, the cargo transfer / hose release scenarios dominate the spill frequencies at small spill volumes. The sizes of the most frequent spills differ, but the frequency is similar:
• Method 1 - the frequency of a spill resulting in spill volume of 9 bbl or greater is 1.3x10⁻¹ per year, which is 1 in 8 years. Method 1 does not account for any catchments, basins, berms, impervious surfaces, or emergency actions stopping a spill that has started.
• Method 2 - the frequency of a spill resulting in spill volume of 0.05 bbl or greater is 1.5x10⁻¹ per year, which is 1 in 7 years. Unlike Method 1, the historical data underlying Method 2 includes only spilled volumes, not those that were prevented from reaching the environment, but might have. The data show that the majority of reported spills are less than 1 bbl, much less than the QRA-standard spill volumes calculated in Method 1. The frequencies in this method are based on historic incident records using a confidence level of 99%.
The largest volume spills differ, and the frequency of the biggest one is more uncertain:
• Method 1 – the frequency of the largest spill volume of 32,000 bbl is 2x10⁻¹⁰, or 1 in 4,000,000 years.
• Method 2 – the frequency of the largest spill volume of 92,900 bbl is the worst incident on record in the US for the time period applied in the analysis, and was assigned a frequency based on its representation in the data set (1 in 5747 transfers). The three next closest data points are around 30,000 bbl.
A criterion relating spill volume and exceedance frequency, when applied to the exceedance curve shown in Figure 8-8 could be used to determine whether risks of oil spills are tolerable. If the risks are not tolerable, risk reduction measures could be suggested. Such risk reduction measures would either reduce frequency of release or volume of release. For instance, shorter isolation times or lower release pressure would result in smaller quantities oil released, or setting maximum hours of operation for loading hoses would result in reduced frequency of spills from hoses.
However, since no such criteria relating exceedance frequency and spill volume have bene adopted in the US, it is not possible to deterministically evaluate whether the estimates are acceptable from a risk perspective.
DNV GL – Report No. PP111860-2, Rev. 5 – www.dnvgl.com Page 120


9.2 Tug Escort Assessment Marine traffic incident results previously reported in this study include Vancouver Energy Terminal tankers transiting without tug escort. A separate assessment was made to evaluate the risk of tankers transiting with a tethered tug escort.
The risk model was run assuming all downbound loaded Vancouver Energy Terminal tankers will be escorted by a tethered tug in a tug-bow-to-tanker-stern position from the terminal until they reach Astoria. Once at Astoria, where swells from the ocean begin to be felt, the tug will be released from the tanker and will standby as a sentinel tug until the tanker crosses the Bar and is safely underway in the open ocean.
For the purpose of calculating risk in the MARCS model, escort tug “save performance” is influenced by the capabilities of the tug, wind and wave conditions. The actual performance characteristics of a tug (i.e., horsepower, drive characteristics, etc.) related to ability to effect a save are not modeled because there is insufficient historical data to quantify their effects. Instead, MARCS uses a set of engineering judgments based on tug performance characteristics to estimate the effect of escort tugs on laden tank vessels based on tug bollard pull and the effects of wind and sea state.
The study assessed only the 47,000 DWT tanker and compared frequencies of a tanker grounding with no tug escort to grounding with a tethered tug escort.
Assumptions in the tug escort study model included:
• There will be one escort tug.
• The tug has capabilities such that in wind speeds up to 20 knots, there is a 90% probability that the escort tug would successfully prevent a tanker in distress from grounding. The probability of a successful save is assumed to decrease as the wind increased.
• The tug is tethered to the tanker.
• Modeling will consider laden tankers only (one way) from Vancouver to the sea.
• There will be one tanker serviced every day.
• The tug will escort every loaded ship downbound.
• Vessels will travel between 8-12 knots.
As shown in Table 9-1, both powered grounding and drift grounding frequencies of the 47,000 DWT tanker going outbound are reduced by over 90% with the use of a tethered tug.
The MARCS model result does not provide the same information or level of detail as bridge simulation studies, which may suggest even greater reduction in grounding probability.
Table 9-1 Drift Grounding Frequencies with and without Tug Escort
Event Type Estimated Drift Grounding Frequency (groundings/yr)
No Tug Escort Tethered Tug Escort Percentage Reduction
Drift Grounding 0.276626 0.022484 91.0% Powered Grounding 0.281382 0.025298 91.9%
MARCS ouput showed an average percentage reduction of 91.45% for the 47,000 DWT tankers, and the reduction is the same percentage for 105,000 DWT and 165,000 DWT Sample Vessels given that the escort
DNV GL – Report No. PP111860-2, Rev. 5 – www.dnvgl.com Page 122

tugs have equivalent capabilities to handle the larger ships. To assess the potential reduction in oil spill risk from tethered tug escort, transit risk was recalculated assuming implementation of escort tugs for outbound Sample Vessels. Therefore, the 91.45% reduction applied to the estimated total grounding frequency (presented in previous Section 6.4.2) for all Sample Vessels. The resulting effect of tug escort on transit risk is shown in Figure 9-2 and in Figure 9-3 (same data shown with a logarithmic scale on the y-axis).
The reduction in risk depends on the relative contribution from grounding as a cause of oil spills. As can be generally seen in the figure, the total transit risk is reduced by 27% to 91%. The greatest percentage reductions occur at spill volumes of 150,000 bbl and more.
The model predicts a reduction in oil spill risk from groundings from a recurrence interval of one in 31 years to one in 370 years. This mitigation reduces spill risk from transit (grounding + collision) by 48%.
Figure 9-2 Transit Oil Spill Risk from Sample Vessels with and without Tug Escort Risk Mitigation
DNV GL – Report No. PP111860-2, Rev. 5 – www.dnvgl.com Page 123

Figure 9-3 Transit Oil Spill Risk from Sample Vessels with and
without Tug Escort Risk Mitigation (log scale)
DNV GL – Report No. PP111860-2, Rev. 5 – www.dnvgl.com Page 124


Incident frequencies were calculated for collision, powered grounding, drift grounding, structural failure, and fire / explosion. Risk mitigation measures were also considered in the model. The following risk reduction measures were included in the marine traffic risk assessment:
• Pilotage.
• Cooperative coordination for collision avoidance between Pilots when navigating the river.
• TV32.
• Portable Pilotage Unit (PPU).
• Differential Global Position System (DGPS).
• Automatic Identification System (AIS).
• Electronic Navigation Charts on ECDIS.
• Under Keel Clearance Management.
• Port State Control.
• Conventional Aids to Navigation (AtoN).
• Maximum cargo limit of 600,000 bbl.
The planned / actual risk control measures not modeled in the Conclusions are:
• Vessel vetting system.
• Two tugs used for docking/undocking.
Identified potential risk control measures are:
• Tethered Tug Escort on downbound loaded tankers.
• Full-time monitoring of TV32.
The MARCS model estimated the marine incident rate on the Columbia River considering all vessel types and all incident types. Under Current Marine Traffic conditions, the estimated incident frequency for all vessel types is 40 incidents per year. If Vancouver Energy traffic were to operate in line with the assumptions in this study, the incident rate was estimated to be 41 incidents per year, approximately a 2% increase.
If all future proposed projects were executed, and the Vancouver Energy project was not included in the risk assessment, the MARCS model estimates the incident rate to be 44 incidents per year amongst all vessel types. Under the same conditions, if the Vancouver Energy Terminal project vessels are included in the risk assessment, the estimated incident frequency is 45 per year; an average increase of 1.6%.
Tug Escort Evaluation
As part of the Marine Risk Assessment, a separate comparison was made to estimate the frequency of grounding. When a laden tanker is assisted by a tethered escort tug as opposed to having no tethered escort tug, it was estimated that a laden tanker is ten times less likely to run aground than it is without a tethered escort tug. The oil spill risk reduction is discussed in greater detail in Section 10.2.
DNV GL – Report No. PP111860-2, Rev. 5 – www.dnvgl.com Page 126

10.2 Oil Spill Risk Assessment The vessel oil spill risk assessment estimated the frequencies of grounding, collision on the route, and collision at the dock that could result in oil spills and corresponding spill volumes. The terminal loading oil spill risk assessment estimated the frequency of operational and mechanical failures that could result in oil spills and their corresponding volumes.
Oil spill risk results are presented as frequency of accidents coupled with the probabilistic spill volumes at a given point on the curve and are read as the average annual frequency of an oil spill with a maximum given volume.
Figure 10-1 shows the results using a logarithmic scale on the y-axis, so each line across the graph is a multiple of ten from the lines above and below it. In general, the three risks are not within the same multiple of ten. The exception is for spill volumes less than 300 bbl, where the Total risk is equal to the loading risk plus the transit risk. The results can be read from the graph by selecting a given spill volume and reading the corresponding frequency (or vice-versa). For instance, for a spill volume of 20,000 bbl or greater, the estimated frequency is about 0.04 events per year.
Figure 10-1 Cumulative Oil Spill Risk (Log Scale)
DNV GL – Report No. PP111860-2, Rev. 5 – www.dnvgl.com Page 127

Of particular note is the frequency peak for the smaller, more likely spills (less than 1,000 bbl), visible in Figure 10-2. Transit and striking scenarios contribute to the Totals; the transit risk drives the cumulative shape of the total curve for volumes greater than 300 bbl.
Figure 10-2 Cumulative Oil Spill Risk (Log Scale), Smaller Spill Volumes
The difference in risk between the Future Traffic with Sample Vessel scenario and the Current Traffic with Sample Vessel scenario is negligible, so only one line depicts both in the figure.
Figure 10-3 is the cumulative risk curve for Sample Vessels in transit (assuming Current Traffic), showing the modeled likelihood of a vessel oil spill of a given volume or less.
For Sample Vessels in transit the estimated frequency of incidents that could result in an oil spillin transit is 0.06 per year (an average of one every 16 years).13
13 The use of escort tugs is not included in this result discussed in Section 9, discussed later in Section 10.
DNV GL – Report No. PP111860-2, Rev. 5 – www.dnvgl.com Page 128

Figure 10-3 Cumulative Spill Risk for Sample Vessels in Transit
A spill of 10,000 bbl or more has an estimated average frequency of 0.053 per year, or an average recurrence interval of 1 every 18 years. A spill of 60,000 bbl or more has an estimated average frequency of 0.006 per year, or an average recurrence interval of 1 every 198 years. Beginning at approximately 100,000 bbl, groundings primarily contribute to the risk (0.0013 per year or 1 every 785 years). Grounding and collision are the primary contributors to in transit risk, and are discussed below in greater detail.
Collision on Sailing Route
The estimated frequency of collision incidents that could result in an oil spill is an average of 0.03 per year (an average of one spill every 34 years). Figure 10-4 is the cumulative risk curve, showing the modeled likelihood of an oil spill of a given volume or less.
DNV GL – Report No. PP111860-2, Rev. 5 – www.dnvgl.com Page 129


Risk Reduction from an Escort Tug
The use of an escort tug was estimated in the model to reduce the risk from grounding incidents by approximately 90%. No credit was given in the model for any potential reduction to collision risk. The actual reduction might be greater, but is difficult to quantify without the use of significant expert judgment.
The model predicts a reduction in oil spill risk from groundings from a recurrence interval of one in 31 years to one in 370 years. This mitigation reduces spill risk from transit (grounding + collision) by 48%.
Figure 10-6 and Figure 10-7 show the resulting reduction in transit risk.
Figure 10-6 Transit Oil Spill Risk from Sample Vessels with and
without Tug Escort Risk Mitigation
DNV GL – Report No. PP111860-2, Rev. 5 – www.dnvgl.com Page 132


Collision at Dock
The estimated frequency of grounding events that could result in an oil spill is 0.00005 per year (an average of 1 spill every 20,000 yr). Figure 10-8 is the cumulative risk curve, showing the modeled likelihood of an oil spill of a given volume or less. This is a minor risk contributor to the overall spill risk.
Figure 10-8 Cumulative Oil Spill Risk from Collision with Sample Vessel at Dock
0.00E+00
1.00E-05
2.00E-05
3.00E-05
4.00E-05
5.00E-05
6.00E-05
0 10,000 20,000 30,000 40,000 50,000 60,000 70,000 80,000 90,000
Aver
age
Freq
uenc
y of
Spi
ll (/
yr)
Volume of Spill (bbl)
DNV GL – Report No. PP111860-2, Rev. 5 – www.dnvgl.com Page 134

Cargo Loading Risk Assessment
Oil spill scenarios involving cargo loading equipment were assessed. The estimated frequency of accidents that could result in an oil spill for both methods, is an average of 1 spill every 7 to 8 years.
Based on Tesoro and US-specific data (Method 215), the estimated most frequent spill volume is 0.05 bbl (2 gallons). Unlike Method 1, the historical data underlying Method 2 includes only spilled volumes, not those that were prevented from reaching the environment, but might have. The data show that the majority of reported spills are less than 1 bbl, much less than the QRA-standard spill volumes calculated in Method 1.
Figure 10-9 is the highest-frequency portion of the cumulative spill risk curve for cargo loading.
Figure 10-9 Cumulative Oil Spill Risk from Cargo Loading
15 The frequencies in this method are based on historic incident records using a confidence level of 99%.
DNV GL – Report No. PP111860-2, Rev. 5 – www.dnvgl.com Page 135

11 REFERENCES
/1/ Energy Facility Site Evaluation Council (EFSEC). Vancouver Energy Terminal Vancouver Energy Distribution Terminal Application No. 2013-01, Docket # EF-131590, WAC 463-60-245, Proposal-Construction Management. August 2013. http://www.efsec.wa.gov/Tesoro%20Savage/Application/EFSEC%202013-01%20Volume%20I/Section%202.16%20Construction%20Management.pdf.
/2/ Center for Chemical Process Safety, “Guidelines for Chemical Process Quantitative Risk Analysis,” 2nd Edition, Center for Chemical Process Safety/AIChE, 2000.
/3/ Pacific Northwest Waterways Association. PNWA Member Lower Columbia River Ports, http://www.pnwa.net/new/Articles/Lower_Columbia_River_Ports.pdf.
/4/ Lower Columbia Region Harbor Safety Committee, “Lower Columbia Region Harbor Safety Plan.” January 2013. Accessed August 2014: http://www.ecy.wa.gov/programs/spills/prevention/LCHarborSafetyPlan.pdf.
/5/ NOAA, Coast Pilot 7 California, Oregon and Washington, and includes Hawaii and other United States territories in the South Pacific, 47th Edition, 2015.
/6/ US Army Corps of Engineers (USACE) Portland District. Columbia River Hydrographic Surveys (Mouth to Vancouver). http://www.nwp.usace.army.mil/Missions/Navigation.aspx
/7/ NOAA’s NCDC. Climate Data Online, 2014. http://cdo.ncdc.noaa.gov/pls/plclimprod/poemain.accessrouter?datasetabbv=DS3505
/8/ Email Exchange between Eric Albright of ENVIRON and Danielle Holden of DNV GL in regards to meteorological data at Pearson Field in Vancouver, WA. 28 August 2014.
/9/ Navigation Center of Excellence, US Coast Guard, U.S. Department of Homeland Security. Port Risk Assessment of the Lower Columbia River. 11-22 September 2000. http://www.navcen.uscg.gov/pdf/pawsa/workshopReports/Columbia%20River.pdf.
/10/ SAFECO I (1998). Safety of Shipping in Coastal Waters (SAFECO) Summary Report. DNV Report No. 98-2038
/11/ SAFECO II Safety of Shipping in Coastal Waters (SAFECO II), WP IV, D24: DNV Report No. 99-2032 http://www.transport-research.info/Upload/Documents/200310/safeco2.pdf
/12/ Larsen, O.L. (1993), “Ship Collision with Bridges,” International Association for Bridge and Structural Engineering, Zurich.
DNV GL – Report No. PP111860-2, Rev. 5 – www.dnvgl.com Page 136

/13/ DNV (1999), “Risk Assessment of Pollution from Oil and Chemical Spills in Australian Ports and Waters”, Det Norske Veritas Project 9330-3972, December 1999.
/14/ SSPA (2012), “Summary Report on Evaluating VTS and Pilotage as Risk Reduction Measures,” Efficiency Sea Project, document W-WP6-5-04, January 2012.
/15/ “Environmental Measurement Systems Sensor Specifications and Measurement Algorithm” issued by NOAA’s Center for Operational Oceanographic Products and Services. Accessed November 2014: http://www.co-ops.nos.noaa.gov/publications/CO-OPS_Measurement_SpecUpdated_4.pdf.
/16/ CEC (1988), “COST-301: Shore-based Marine Navigation Aid Systems”, Report EUR-11304 EN, Commission of the European Communities.
/17/ Lewison, G.R.G. (1980), “The Estimation of Collision Risk for Marine Traffic in UK Waters,” Journal of Navigation, Sept 1980 (also in NMI Report R91).
/18/ Drager, K.H., Kristiansen, S., Karlsen, J.E. & Wienke, P.M. (1981), “Cause Relationships of Collisions and Groundings - Conclusions of Statistical Analysis,” Norwegian Maritime Research No. 3.
/19/ International Maritime Organization, FSA Study on ECDIS / ENCs, MSC/81/24/5, February 2006.
/20/ Knapp, S., Bijwaard, G. & Heij, C. (2011), “Estimated Incident Cost Savings in Shipping due to Inspections”, Accident Analysis and Prevention, vol 43, no 4, July 2011.
/21/ US Coast Guard, Aids to Navigation Manual, Commandant Instruction, M16500.3A, April 6, 2010.
/22/ Statistics based on “Marine Casualty and Vessel Data for Researchers” issued by Homeport - US Department of Homeland Security - United States Coast Guard. Accessed August 8, 2014: https://homeport.uscg.mil/mycg/portal/ep/contentView.do?contentTypeId=2&channelId=-18374&contentId=149309&programId=91343&programPage=%2Fep%2Fprogram%2Feditorial.jsp&pageTypeId=13489
/23/ American Association of State Highway and Transportation Officials (AASHTO). Guide Specification and Commentary for Vessel Collision Design of Highway Bridges, American Association of State Highway and Transportation Officials, Washington, D.C., 1991.
/24/ US Department of Transportation. Pipeline and Hazardous Material Safety Administration. Data & Statistics. [Online] http://www.phmsa.dot.gov/pipeline/library/data-stats.
/25/ UK HSE. Offshore Hydrocarbon Release Statistics, HSE Offshore Safety Division, Hydrocarbon Release Database (HCRD), March 2010.
/26/ UK HSE Advisory Committee on Dangerous Substances (ACDS). Major Hazard Aspects of the Transport of Dangerous Substances. s.l. : 1991. ISBN 0 11 885676 6.
DNV GL – Report No. PP111860-2, Rev. 5 – www.dnvgl.com Page 137
/27/ Haugstad, Eric A. Memorandum Tesoro Marine Incident Statistics. Tesoro Maritime Company, November 23, 2015
/28/ Etkin, D.S. 2006. Trends in Oil Spills from Large Vessels in the US and California with Implications for Anticipated Oil Spill Prevention and Mitigation Based on the Washington Oil Transfer Rule. Prepared by Environmental Research Consulting for Washington Department of Ecology, Olympia, WA. Contract No. C040018. April 2006. 72 p.
DNV GL – Report No. PP111860-2, Rev. 5 – www.dnvgl.com Page 138

ABOUT DNV GL Driven by our purpose of safeguarding life, property and the environment, DNV GL enables organizations to advance the safety and sustainability of their business. We provide classification and technical assurance along with software and independent expert advisory services to the maritime, oil and gas, and energy industries. We also provide certification services to customers across a wide range of industries. Operating in more than 100 countries, our 16,000 professionals are dedicated to helping our customers make the world safer, smarter and greener.

APPENDIX A Qualifications Required for Columbia River and Columbia River Bar Pilotage
DNV GL – Report No. PP111860-2 Appendix A, Rev. 5 – www.dnvgl.com Page A-i

Table of contents
1 INTRODUCTION .............................................................................................................. 2
2 REQUIREMENTS FOR ALL PILOTS ...................................................................................... 2 2.1 Experience Requirements ................................................................................................ 2 2.2 Written Examination........................................................................................................ 2 2.3 Physical, Medical, and Mental Standards ............................................................................ 3 2.4 Drug Testing Requirements .............................................................................................. 3 2.5 Other Background Information ......................................................................................... 3
3 COLUMBIA RIVER BAR PILOTAGE LICENSE REQUIREMENTS ................................................. 4
4 COLUMBIA RIVER PILOTAGE LICENSE REQUIREMENTS ........................................................ 4 4.1 Degrees of License for Columbia River Pilotage ................................................................... 5
5 PILOT APPRENTICE TRAINING PROGRAM ........................................................................... 8
6 REFERENCES .................................................................................................................. 9
DNV GL – Report No. PP111860-2 Appendix A, Rev. 5 – www.dnvgl.com Page A-i

1 INTRODUCTION A marine Pilot is an expert in ship handling and in the characteristics of a particular waterway. In this case, there are two separate pilot organizations involved in navigating a vessel to and from the Vancouver Energy terminal; the Columbia River Pilots Association, and the Columbia River Bar Pilots Association
All Columbia River Pilots and Columbia River Bar Pilots hold two separate licenses. One license is issued by the US Coast Guard, and the other is issued by the State of Oregon. The Coast Guard license is a prerequisite to obtaining a state issued pilot’s license.
In addition to the Coast Guard, Columbia River and Bar Pilots are licensed by the State of Oregon Board of Maritime Pilots (the Board) (Ref. /1/). The Board is an agency within the Public Utility Commission of Oregon (Ref. /2/). The Board grants licenses to marine Pilots and sets the requirements for testing the competency of River and Bar Pilots (Ref. /3/). The State of Washington has a Board of Pilotage Commissioners for Washington’s navigable waterways (Ref. /4/), however the waters of the Columbia River and Bar fall within the pilotage waters of the State of Oregon (Ref. /5/) and not within the State of Washington (Ref /6/).
Only individuals who have the required pre-requisite Coast Guard license, have completed a prescribed training program, have sufficient experience, and can demonstrate knowledge of currents, tides, soundings, bearings and distances of shoals, rocks, bars, points of landings, lights and fog signals can pilot a deep draft vessel on the Columbia River (Ref. /7/). This document outlines the training and qualifications required of the Columbia River and Columbia River Bar Pilots. -
2 REQUIREMENTS FOR ALL PILOTS Because of the differences between the two water bodies, there are some variations in the training and qualification requirements for Bar and River pilots. However, there are certain requirements set forth by the Board for all pilots.. Both are applicable to all pilotage waters in the state of Oregon. Only those relevant to the Columbia River or Columbia River Bar are included in this report.
2.1 Experience Requirements Anyone seeking a state pilot’s license must have actual experience as a pilot handling ships over the pilotage ground for which the license is sought. When applying for a license, the applicant must list the names of each ship piloted, the dates they were piloted, and the draft, gross tonnage, and length overall (LOA) of each ship piloted (Ref. /8/).
The Master’s license issued by the US Coast Guard must be endorsed for pilotage for the waterway for which the license is sought, and must include a Radar Observer endorsement (Ref. /8/).
2.2 Written Examination Any person who applies for an Oregon state pilotage license must successfully complete a written examination to test for skills and knowledge of ship handling and specific characteristics of the applicable pilotage grounds. The examination will be graded by the board member from the pilotage ground for which the applicant is seeking a license, and may include up to two additional pilots. The examination is pass/fail (Ref. /8/).
DNV GL – Report No. PP111860-2 Appendix A, Rev. 5 – www.dnvgl.com Page A-2

2.3 Physical, Medical, and Mental Standards All applicants for a pilot’s license must meet certain physical, medical, and mental standards. Original license applications must include a photocopy of a U.S. Coast Guard physical examination report, which must be signed by an Oregon or Washington licensed physician. The report must verify that the applicant meets the physical, medical and mental criteria required to qualify for a federal pilot’s license (Ref. /8/). The physical agility work test includes (Ref. /9/):
• Climbing a pilot ladder.
• Opening and closing a watertight door.
• Donning a survival suit.
• Climbing stairs.
• Balance and coordination activities.
• Lift 50 pounds from the floor to the waist.
• Other activities as directed by the testing facility.
If the examining physician determines that the applicant is not competent to perform the duties of a pilot, the applicant is not eligible to receive a license from the board. If the examining physician determines that the applicant’s physical, medical or mental condition is in need of further review, the applicant’s eligibility is then subject to review by the U.S. Coast Guard. The US Coast Guard may determine that the applicant is not competent for continued federal licensure as a pilot (Ref. /8/).
If the U.S. Coast Guard undertakes further medical review of an applicant’s physical, medical or mental competency, then the applicant shall report to the Board at least every 30 days regarding the status of such review. If, at the conclusion of the review process, the U.S. Coast Guard declines to approve the applicant for continued federal licensure as a pilot, the applicant shall immediately notify the Board and the Board will treat the decision as a suspension of the applicant’s federal license. Any license issued by the Board shall be automatically suspended, notwithstanding any appeal that may be taken from such decision. If the Coast Guard concludes its review by issuing a waiver to the applicant, the terms of the waiver shall be immediately reported to the Board, and the license shall become subject to the terms of the waiver issued by the Coast Guard (Ref. /8/).
2.4 Drug Testing Requirements All applicants must provide proof that they have been a participant in maritime employer’s random drug testing program during the 90 days preceding the date of application. Alternatively, applicants may provide proof of a negative drug test result performed within the preceding 30 days (Ref. /8/).
2.5 Other Background Information In addition, all applicants must disclose the following background information to the Board (Ref. /10/):
• Any conviction within the preceding 60 months for any alcohol-related motor vehicle infraction.
• A description of any maritime incident that resulted in either a disciplinary proceeding against the applicant’s federal license or a civil penalty proceeding by the U.S. Coast Guard.
DNV GL – Report No. PP111860-2 Appendix A, Rev. 5 – www.dnvgl.com Page A-3

3 COLUMBIA RIVER BAR PILOTAGE LICENSE REQUIREMENTS Before a candidate can apply for a pilotage license on the Columbia River Bar, he / she must first hold a Master Mariner’s license issued by the US Coast Guard for vessels 5,000 gross tons or greater, and have served in that capacity for a minimum of two years. A mariner may have been at sea for 15 to 25 years to earn such a license (Ref. /11/).
To be eligible to apply to the Columbia River Bar Pilot training program, applicants must (Ref. /9/):
• Complete a training program approved by the Oregon Board of Marine Pilots.
• Complete a bridge simulator exercise administered by a nationally recognized, independent, marine education and training facility. The simulator assesses:
o Fundamental piloting and ship handling ability.
o Ability to assimilate and prioritize all data while maintaining situational awareness.
o Ability to respond appropriately in routine situations.
o Ability to respond appropriately in emergency or non-routine situations.
o Ability to communicate well and project proper bridge presence.
o Demonstration of understanding of Bridge Resource Management.
o Demonstration of understanding of and command of the International and Inland Rules of the Road.
Candidates selected to train for licensure must have successfully completed the following requirements to receive an original pilot license (Ref. /8/; Ref. /9/):
• Complete a minimum of 100 crossings of the Columbia River Bar under the supervision of an unlimited state-licensed Pilot, and make crossings with at least five different state licensed Columbia River Bar pilots.
• Be on board a minimum of ten ships docking or undocking from the Astoria Port Docks, Tongue Point, and other facilities.
• Make 25% of the crossings of the Columbia River Bar during the hours of darkness.
The Applicants must be able to draw the Columbia River entrance chart by memory, including each floating and fixed aid to navigation along the route (Ref. /9/).
4 COLUMBIA RIVER PILOTAGE LICENSE REQUIREMENTS In addition to the pre-requisites identified above, applicants for a Columbia River pilotage endorsement must complete have served at least 730 active working days as captain of towing vessels on the Columbia River and its tributaries, or have completed a Board approved program of apprenticeship training (Ref. /8/).
Pilot licensing for the Columbia River includes the Willamette River. Licenses are issued in a graduated process that includes increasingly stringent training and qualification requirements. The Board issues four types of licenses to Columbia and Willamette River pilots. Each grade of license is valid for one year. Only an unlimited license may be renewed (Ref. /13/).
DNV GL – Report No. PP111860-2 Appendix A, Rev. 5 – www.dnvgl.com Page A-4
A Grade “C” license is the initial license obtained by prospective pilots. Columbia and Willamette River Grade "C" and Grade “B” license holders shall not pilot vessels with a draft of 38 feet or greater. Columbia and Willamette River Grade “A” license holders shall not pilot vessels with a draft of 40 feet or greater. Only pilots with an Unlimited License may pilot tankers (Ref. /12/).
4.1 Degrees of License for Columbia River Pilotage 4.1.1 Grade "C" License: The initial license issued by the Board to a pilot for the Columbia and Willamette River pilotage ground shall only authorize the pilot to pilot vessels under 600 feet length over-all (LOA). A pilot with a Grade “C” license may not pilot tank vessels. To earn a Grade “C” license, in the addition to the requirements in Sections 2 and 3, the following requirements must be met (Ref. /8/):
• Within 270 days preceding the examination, complete at least 110 transits while on the bridge of a ship of not less than 500 feet LOA.
• Within 270 days preceding the examination, complete at least six trips under the supervision of an unlimited state-licensed pilot while on the bridge of a ship of not less than 500 feet LOA in a combination of directions, with at least three trips in each direction. Combinations include:
o From the Willamette River, turning east (upstream) into the Columbia River.
o From the Columbia River upstream of the mouth of the Willamette River, turning south into the Willamette River.
• Complete at least 10 trips in either direction between Astoria and Longview or Kalama under the supervision of an unlimited state-licensed pilot.
• Complete at least 4 trips from dock to dock or anchor to dock while on ships not less than 500 feet LOA while under the supervision of an unlimited state-licensed pilot, with each such trip requiring a 180 degree turn before docking.
• Complete at least six trips under the supervision of an unlimited state-licensed pilot while on the bridge of a ship of not less than 500 feet LOA through the bridges in the upper harbor in Portland, up to and including the Broadway Bridge. There must be at least one transit beneath Broadway Bridge in each direction and must be made with and without the aid of a tug.
• Train at least 25 additional days as directed by the training course monitor, with assignments chosen at the discretion of the training course monitor that may include, but need not be limited to, shipboard training, electronic navigation training, manned model training, attendance at meetings with maritime-related governmental agencies or exposure to maritime related administrative activities.
• Present recommendations from the training course monitor and from at least ten unlimited state-licensed pilots who participated in the training, certifying that the applicant has demonstrated sufficient knowledge and shiphandling skills to pilot ocean-going ships up to 600 feet LOA.
4.1.2 Grade “B” License A Grade “B” license allows a pilot to pilot non-tank vessels with drafts of less than 38 feet, from and including 600 feet LOA to 700 feet LOA (Ref. /12/; Ref. /13/). To obtain a Grade "B" License while holding a
DNV GL – Report No. PP111860-2 Appendix A, Rev. 5 – www.dnvgl.com Page A-5

Grade "C" License, during the 180 days preceding the application for a Grade “B” license, an applicant must meet the following requirements (Ref. /13/):
• Complete at least 180 days service on the pilotage ground while holding a Grade “C” license.
• Complete at least 30 transits on the pilotage ground piloting ships of between 300 and 600 feet LOA.
• Complete at least 25 transits on ships 600 feet LOA or greater under the supervision of a minimum of ten different pilots, at least six of whom have held unlimited state licenses for at least 5 years.
• Complete at least 5 trips in either direction between Astoria and either Longview or Kalama on ships 600 feet LOA or greater under the supervision of an unlimited state-licensed pilot.
• Make at least 6 trips under the supervision of unlimited state-licensed pilots while on the bridge of ships not less than 500 feet LOA, with at least 3 trips in each of the following directions:
o From the Willamette River, turning east (upstream) into the Columbia River.
o From the Columbia River upstream of the mouth of the Willamette River, turning south (upstream) into the Willamette River.
• Complete at least 2 trips from dock to dock or anchor to dock while on ships not less than 600 feet LOA while under the supervision of an unlimited state-licensed pilot, with each such trip requiring a 180 degree turn before docking.
• Present recommendations from the training course monitor and from at least ten pilots holding unlimited state licenses who participated in the training, certifying that the applicant has sufficient knowledge and ship handling skills to pilot vessels from and including 600 feet LOA up to 700 feet LOA.
4.1.3 Grade “A” License A Grade “A” license permits pilot to pilot non-tank vessels from and including 700 feet LOA up to 800 feet LOA, with draft less than 40 feet (Ref. /12/; Ref. /13/). To obtain a Grade "A" License while holding a Grade "B" License, during the 270 days preceding application an applicant must meet the following requirements (Ref. /13/):
• Complete at least 270 days service on the pilotage ground while holding a Grade “B” license.
• Complete at least 40 transits piloting ships of between 300 and 700 feet LOA as a state-licensed pilot.
• Complete at least 20 transits on ships 700 feet LOA or greater while under the supervision of at least ten unlimited state-licensed pilots.
• Complete 2 trips from dock to dock or from an anchorage to a dock under the supervision of unlimited state-licensed pilots while on ships 700 feet LOA or greater, with each trip including a 180 degree turn before docking.
• Make at least 4 trips under the supervision of unlimited state-licensed pilots within the 270 days preceding the application while on the bridge of a ship 700 feet LOA or greater, with trips in each of the following directions:
DNV GL – Report No. PP111860-2 Appendix A, Rev. 5 – www.dnvgl.com Page A-6

o At least 3 trips from the Willamette River, turning east (upstream) into the Columbia River.
o At least 1 trip from the Columbia River upstream of the mouth of the Willamette River, turning south (upstream) into the Willamette River.
• Train at least 5 additional days as directed by the training course monitor, with assignments chosen at the discretion of the training course monitor.
• Present recommendations from the training course monitor and from at least ten unlimited pilots who participated in the training, certifying that the applicant has sufficient knowledge and ship handling skills to pilot vessels from and including 700 feet LOA up to 800 feet LOA on the pilotage ground;
4.1.4 Unlimited Pilotage License An Unlimited License permits a pilot to pilot any vessel without any limitation on the length and draft of the vessel, including tankers and vessels with a draft of 40 feet or greater. To obtain an Unlimited License while holding a Grade "A" License, an applicant must meet the following requirements (Ref. /13/):
• Complete at least 180 days service on the pilotage ground while holding a Grade “A” license.
• Complete at least 30 transits on ships of between 300 and 800 feet LOA during the 180 days preceding application for an unlimited license.
• Train at least 10 additional days as directed by the training course monitor, with assignments chosen at the discretion of the training course monitor.
• Complete at least ten transits on ships greater than 800 feet LOA while under the supervision of ten different unlimited pilots. Five of these transits must be supervised by pilots with not less than five years’ experience as unlimited state-licensed pilots.
• Present recommendations from the training course monitor and from at least ten unlimited pilots who participated in training, certifying that the applicant has sufficient knowledge and ship handling skills to pilot vessels 800 feet LOA or greater on the pilotage ground.
• Complete at least 12 transits on tankers (including at least nine transits on loaded tankers) while under the supervision of at least six different state-licensed pilots with not less than five years’ experience as unlimited state-licensed pilots.
• Present recommendations from the training course monitor and from at least six pilots who participated in training on tankers, certifying that the applicant has sufficient knowledge and ship handling skills to pilot tankers on the pilotage ground and understands the risks and hazards peculiar to piloting tankers on the pilotage ground.
• Complete at least 12 transits on ships with drafts of 40 feet or greater while under the supervision of at least six different state-licensed pilots with not less than five years’ experience as unlimited state-licensed pilots.
• Present recommendations from the training course monitor and from at least six unlimited pilots who participated in training on vessels with drafts 40 feet or greater, certifying that the applicant has sufficient knowledge and ship handling skills to pilot vessels with drafts 40 feet or greater.
DNV GL – Report No. PP111860-2 Appendix A, Rev. 5 – www.dnvgl.com Page A-7
• Provide proof of completion of a United States Coast Guard approved course in automatic radar plotting aids (ARPA).
5 PILOT APPRENTICE TRAINING PROGRAM The Board established a Pilot Apprentice Training Program in 1995 as an alternate means of obtaining a Columbia River pilot endorsement. The program requires prospective pilots to train on vessel 25 days per month. The apprenticeship program takes a minimum of three years to complete (Ref. /14/).
To be eligible for the Apprentice Training Program, an applicant must have a minimum of two years as (Ref. /14/):
• Master of Towing Vessels (Inland Waterways)
• Master of Towing Vessels (Ocean)
• Master, Vessels Greater than 1,600 Tons
• Master, Vessels 1,600 Tons or Less
• Chief or Second Mate on Vessels Greater than 1,600 Tons
The Apprentice Training Program requires pilot trainees to complete 500 vessel movements on the Columbia River System between the ports of Astoria and Portland/Vancouver, and another 500 vessel movements between any two points on the pilotage grounds, under the supervision of state-licensed pilots. In addition, up to 30 days of industry-related training is required, based upon the Training Course Monitor’s evaluation of the apprentice’s skills and training needs (Ref. /14/).
After completion of the apprentice training program a candidates must complete the Columbia River Pilots Training Program, which takes an additional two and one half years to complete (Ref. /14/).
DNV GL – Report No. PP111860-2 Appendix A, Rev. 5 – www.dnvgl.com Page A-8

6 REFERENCES /1/ ORS 776.015
/2/ State of Oregon, Board of Maritime Pilots. Available at: http://www.puc.state.or.us/BMP/Pages/about_us.aspx. Accessed April 10, 2015.
/3/ ORS 776.115
/4/ State of Washington Board of Pilotage Commissioners, www.pilotage.wa.gov/. Accessed April 7, 2015.
/5/ ORS 776.025
/6/ RCW 88.16.050
/7/ ORS 776.035
/8/ OAR 856-010-0010
/9/ Oregon Board of Maritime Pilots. “Columbia River Bar Pilot Trainee Application & Selection Policies and Procedural Guidelines.” Accessed April 7, 2015: http://www.puc.state.or.us/bmp/docs/bar_application_instructions.pdf.
/10/ OAR 856-010-0008.
/11/ Columbia River Bar Pilots, Available at: http://www.columbiariverbarpilots.com/columbiariverbarpilots_training.html. Accessed April 8, 2015
/12/ OAR 856-010-0011.
/13/ OAR 856-010-0012.
/14/ Oregon Board of Maritime Pilots, Pilot Apprentice Training Program Application Information and Instructions. Available at: http://www.puc.state.or.us/BMP/docs/Apprentice_Application_Instructions.pdf. Accessed April 8, 2015.
/15/
/16/
DNV GL – Report No. PP111860-2 Appendix A, Rev. 5 – www.dnvgl.com Page A-9
DNV GL – Report No. PP111860-2 Appendix B, Rev. 5 – www.dnvgl.com Page B-i
APPENDIX B
Marine Terminal (Loading) Risk Analysis
DNV GL – Report No. PP111860-2 Appendix B, Rev. 5 – www.dnvgl.com Page B-ii
Table of contents
B. INTRODUCTION .............................................................................................................. 1
B.1 Scope ............................................................................................................................ 1
B.2 Isolatable Sections .......................................................................................................... 1
B.3 Oil Release Scenarios ...................................................................................................... 7 Release Sizes ............................................................................................................. 7 B.3.1 Isolation Times .......................................................................................................... 9 B.3.2
B.4 Release Frequencies ...................................................................................................... 15 Operational Mode ..................................................................................................... 16 B.4.1 Isolation Probability .................................................................................................. 18 B.4.2 Historical Transfer Spill Frequency .............................................................................. 18 B.4.3
B.5 Oil Spill Volume ............................................................................................................ 22
B.6 Results ........................................................................................................................ 24
B.7 Conclusions and Discussion ............................................................................................ 31
B.8 . References ................................................................................................................. 33

DNV GL – Report No. PP111860-2 Appendix B, Rev. 5 – www.dnvgl.com Page B-1
B. INTRODUCTION
The objective of the analysis is to determine the risk of an oil spill from crude oil loading operations. For marine terminal loading risk, this is assessed as a loss of containment (LOC) risk from the equipment listed in Section B.1. Note that no credit is given to containment systems, catchments, or surface elevation changes. Hence, in this appendix, the term “release” is used in many cases, rather than “oil spill.” The risk is estimated in terms of a range of likelihoods (frequencies) and quantities that could be released.
This appendix describes results of the loading LOC risk analysis, and supplements the discussion in Section 8 of the main report.
B.1 Scope This analysis considered crude oil spill risk from loading operations and includes only facility equipment that is associated with loading of tankers. It does not consider all loading and storage equipment on the facility. The following equipment was considered in this analysis:
36 inch loading pipeline from the dock to the first onshore emergency shutdown (ESD) valve.
Loading branches and loading pipelines connected to loading hoses.
Loading hoses.
Crude return lines from the dock up to the first onshore ESD valve on the 36 inch line.
As shown on the piping drawing (Ref. (1)), loading branches are the two pipelines emerging from the 36 inch x 24 inch reducer connecting to the 36 inch loading pipeline on the upstream end and connecting to two 12 inch pipelines on the downstream ends.
Two modes of operation are defined for the purposes of this study:
Loading mode – a ship is present and oil is being loaded onto a tanker.
Holding mode – loading is not occurring, whether a tanker is present or not. Thus, the loading pump
is not operating and therefore the loading hoses are not pressurized. During this mode, a tanker may
be present while preparing for departure following loading and while preparing for loading following
arrival. This mode ends when loading begins.
The following are not included in the scope of the loading LOC risk analysis:
Crude oil releases due to a collision or grounding of a tanker. Oil spill risk from collision or grounding
is discussed in the main report.
Crude oil release from any part of the onshore facility upstream of the marine loading area onshore
ESD valve (e.g. storage tanks, onshore pipelines and rail activities).
B.2 Isolatable Sections
Isolatable sections are defined in a LOC risk analysis to allow identification of contiguous piping that would result in the same theoretical maximum quantity of released oil after closure of valves. Emergency shutdown valves (ESDVs) generally define the boundaries of isolatable sections. The supplied drawings and discussions with design engineers were used to identify isolatable sections. Figure B-1, Figure B-3, and Figure B-5Figure B-5 show resulting isolatable sections highlighted on drawings with different colors.Figure B-2, Figure B-4, and Figure B-6 illustrates their locations on a marine terminal plan view (Ref. (2)).

DNV GL – Report No. PP111860-2 Appendix B, Rev. 5 – www.dnvgl.com Page B-2
Figure B-1 Isolatable Sections Showing 36 Inch Loading Pipeline, Loading Branches, and Crude
Return Line (Ref. (3))
Figure B-2 Figure B-1 on Marine Terminal Enlarged View Plan (Ref. (2))

DNV GL – Report No. PP111860-2 Appendix B, Rev. 5 – www.dnvgl.com Page B-3
Figure B-3 Isolatable Sections Showing Loading Pipelines Connected to Loading Branches
(Ref. (1))
Figure B-4 Figure B-3 on Marine Terminal Enlarged Plan View (Ref. (2))

DNV GL – Report No. PP111860-2 Appendix B, Rev. 5 – www.dnvgl.com Page B-4
From Figure B-1 and Figure B-3, it is seen that the valves on the loading branches and the valve on the 36 inch pipeline act as ESDVs forming the boundaries of Isolatable Section 1. Isolatable Section 2 consists of the 12 inch loading pipeline connected to the loading branch, loading hose connected to the loading pipeline, and 4 inch pipeline connecting the 12 inch pipeline to the 6 inch crude return line. Isolatable Section 3 consists of the second 12 inch loading pipeline and second loading hose. Thus, drain shut off valves on the crude return line are considered to act as ESDVs.
The ship connection system contains isolation valves connecting the loading hoses that close in case of an emergency. Thus, as shown in Figure B-5, Isolatable Section 2 and Isolatable Section 3 extend only up to and including the loading hoses.
Although the 6 inch crude return line transfers crude to the storage tanks, as mentioned in Section B.1, releases from the 6 inch crude return line between the onshore ESDV and the storage tanks are not considered because the scope of this work includes releases only up to the onshore ESDV. In the event of a release from the crude return lines between the dock and the onshore ESDV, inventory in the 6 inch crude return line between the onshore ESDV and the storage tanks may be exposed, but based on discussions with design engineers it is noted that the 6 inch crude return line undergoes a change in elevation across the onshore ESDV. This elevation difference would prevent the release of the inventory within the 6 inch crude return line between the onshore ESDV and the storage tanks. Therefore, releases from the crude return line between the dock and the onshore ESDV would only result in a spill quantity equivalent to the volume of the Isolatable Section 4 highlighted in Figure B-1 and Figure B-3.
Figure B-5 Isolatable Sections Showing Loading Hoses (Ref. (4))

DNV GL – Report No. PP111860-2 Appendix B, Rev. 5 – www.dnvgl.com Page B-5
Figure B-6 Location of Figure B-5 on Marine Terminal - Enlarged Plan View (Ref. (2))
Loading activity will be monitored by the pressure indicator controller and personnel on the dock during the transfer. While loading, a leak from the pipeline, loading branch, or any connection within Isolatable Section 1 will signal and activate closure of the valves on the loading branches and onshore valve on the 36 inch pipeline, limiting oil outflow thereafter. Although there will be personnel on the dock during transfer activities, activation of closure of the valves is considered to be automatic and any additional actions facility personnel might take are not accounted for in this analysis. The volume of oil released from Isolatable Section 1 (36 inch loading pipeline) after closure of the valves is assumed to be equivalent to the volume of the isolatable section, independent of whether loading is occurring. After loading, inventory within Isolatable Section 1 can be drained through the crude return lines.
Except during draining or when relieving pressure in the line, the drain shutoff valves on the 4 inch crude return line are closed. After completion of loading, these valves may be opened to drain the loading hoses. The crude return lines (4 inch and 6 inch up to the onshore ESDV) are conservatively assumed to contain oil during holding and loading operations. For a leak from the crude return lines within Isolatable Section 4 during loading or holding, a release pressure of 2 psig is assumed because the loading lines are in standby mode (i.e., the loading pump is not operating). The lines are not pressurized, and they only see pressure equivalent to that in the crude storage tank, including the static head in the tank. Pressure in the crude storage tanks is atmospheric and taking into account the hydraulic head of oil into the tanks, pressure in the crude storage tank is assumed to be 2 psig.

DNV GL – Report No. PP111860-2 Appendix B, Rev. 5 – www.dnvgl.com Page B-6
The crude inventory within Isolatable Section 2 and Isolatable Section 3, that is, within the 12 inch loading pipelines and loading branches, will be pumped to storage tanks through the crude return lines. Thus, during holding (neither loading nor draining), there may not be any crude oil within these isolatable sections. Therefore, a release from loading pipelines or loading hoses within these isolatable sections is only credible during loading.
To summarize, the following are the assumptions regarding valves which either are ESDV or are assumed to act as ESDVs:
During loading, the valves forming boundaries of Isolatable Section 1, that is, valves on the loading branches and 36 inch loading pipeline, remain open and the drain shutoff valves on the crude return line remain closed. In the event of a leak from equipment within Isolatable Section 1, valves at the boundaries of Isolatable Section 1 close. In the event of a leak from equipment within Isolatable Section 2 or Isolatable Section 3, valves at the boundaries of these isolatable sections close. In the event of a leak from equipment within Isolatable Section 4, drain shut off valves on the 4 inch crude return line are assumed to remain closed providing isolation from the loading pipelines.
During holding mode, valves at the upstream and downstream boundaries of Isolatable Section 1 are closed. In the event of a leak from equipment within Isolatable Section 1 during holding, the valves remain closed. In the event of a leak from equipment within Isolatable Section 4, drain shut off valves on the 4 inch crude return line remain closed.
Based on lengths and diameters of pipelines within the isolatable sections, volumes of oil within isolatable sections were calculated. Such calculations estimate the quantity of oil released from the isolatable section after closure of ESDVs forming boundaries of the isolatable section. Pipeline dimensions were obtained from pipeline drawings. Length of expansion joints, if any, have been accounted for in the calculations. Any change in elevation of a pipeline or loading hose, as indicated by the drawing, has also been accounted for in estimation of pipeline length. Table B-1 illustrates the resulting volumes of the isolatable sections and associated mass. Isolatable volumes have been converted to mass using a crude oil density of 814 kg/m3 (Ref. (5)).
Table B-1 List of Isolatable Sections and Associated Isolatable Inventories
Isolatable Section
Description Length
(m) Volume
(m3) Volume
(bbl)
Isolatable Volume
(m3)
Isolatable Volume
(bbl)
Isolatable Mass (kg)
1 36 inch loading pipeline 95 63 392
63.6 395.9 51,277 Loading branches 4 0.6 3.9
2
12 inch pipeline connected to loading
branch 2 0.1 0.7
1.1 7.5 980 Loading hose 22 1 6.8 4 inch pipeline before
isolation 0.7 0.006 0.03
3
12 inch pipeline connected to loading
branch 2 0.1 0.7
1.1 7.6 988 Loading hose 22 1 6.8 4 inch pipeline before
isolation 2 0.02 0.1

DNV GL – Report No. PP111860-2 Appendix B, Rev. 5 – www.dnvgl.com Page B-7
Isolatable Section
Description Length
(m) Volume
(m3) Volume
(bbl)
Isolatable Volume
(m3)
Isolatable Volume
(bbl)
Isolatable Mass (kg)
4
4 inch crude return line after isolation 6 0.05 0.3
1.8 11.2 1,451 6 inch crude return line up to the onshore ESDV 95 1.7 10.9
As can be seen from Table B-1, for a given isolatable section, the maximum isolatable volume has been calculated by adding volumes of the equipment forming the isolatable section. Since the outflow rate is calculated in terms of kilograms per second, in addition to isolatable volume, isolatable section mass is also reported in the table.
B.3 Oil Release Scenarios
Table B-2 summarizes the release scenarios considered in the loading LOC risk analysis. Releases from each diameter of loading pipeline have been considered. During loading, the pressure is 40 psig (Ref. (6)), whereas release pressure of 2 psig is assumed when loading is not occurring.
The temperature of the released oil is assumed to be 54.2ºF for all releases, based on the atmospheric site temperature conditions. Atmospheric temperature was calculated based on annual average minimum and average maximum temperatures over 157 years, based on the measurements of air temperatures from 1856 to 2012 at the Vancouver 4 NNE Agricultural Meteorological Station located 4 miles northeast of the project site. The annual average min / max temperatures are 42.7ºF /62.1ºF (Ref. (7)). The average of the annual average minimum and average maximum temperatures (42.7ºF /62.1ºF), which is 54.2º F, was applied as release temperature for all the scenarios. Note that since crude oil density does not vary significantly with release temperature, the outflow rate is not expected to vary significantly and use of the average temperature is appropriate.
Release Sizes B.3.1This section describes the approach to release hole sizes applied to the equipment in the study and estimates of released volumes.
B.3.1.1 Pipeline & Equipment Releases
To define the release events applied to each potential pipeline and related equipment release scenario, four hole-size distributions with representative hole sizes are modeled as listed in Table B-2. Note that these size categories are hole size ranges, and one representative size is applied in the modeling to reflect each size range.
Table B-2 Hole Sizes
Descriptor Range (Diameter
Equivalent)
Representative Size (Circular Diameter
Equivalent)
Small 0 mm < Ø ≤ 20 mm 15 mm Medium 20 mm < Ø ≤ 80 mm 50 mm Large 80 mm < Ø ≤ 150 mm 100 mm
Full Bore 150 mm ≤ Ø Full Diameter

DNV GL – Report No. PP111860-2 Appendix B, Rev. 5 – www.dnvgl.com Page B-8
B.3.1.2 Loading Hose Releases
Two approaches are applied for estimating release sizes from the loading hose / cargo transfer operation:
Method 1 – based on standard safety QRA practice.
Method 2 – based on US and Tesoro historical data.
Method 1
For Method 1, the following release size categories are applied based on DNV GL’s experience and also based on generic data available for UK ports (Ref. (8)):
Small loading hose failure: Isolation time is 30 seconds with a release at a rate equal to 110% of the
normal transfer rate through one hose. The enhancement accounts for pump over-speed, and
preferential flow through the hose that fails.
Large loading hose failure: Isolation time is 60 seconds with a release rate equal to 110% of the
normal transfer flow through one hose. The enhancement accounts for pump over-speed, and
preferential flow through the hose that fails.
Failure involving both loading hoses: Isolation time is 60 seconds with a release rate of
1078 kg/s which is the loading rate through all hoses, without enhancement.
Note that isolation time includes the time required to detect a leak and the time required to fully close the associated valves. The times applied are further detailed in Section B.3.2.
Method 2
For Method 2, the distribution of release sizes from the loading hose / cargo transfer operation is based on US historical hydrocarbon tanker loading incident data. Environmental Research Consulting analyzed trends in oil spills in US navigable waters between 1985 and 2004 (Ref. (9)). From the ERC data analysis, a spill volume probability distribution related to oil transfer spills is developed, see Table B-3.
Table B-3 Oil Transfer Spills from Vessels (300 GRT+) into US Navigable Waters
1985-2004 (Ref. (9))
Percentile Spill Spill Volume
(gallons) Spill Volume
(bbl) Probability
Fraction
25th 2 0.05 0.25
40th 8 0.19 0.15
50th 20 0.48 0.1
60th 30 0.71 0.1
70th 60 1.4 0.1
75th 70 1.7 0.05
80th 100 2.4 0.05
90th 300 7.1 0.1
95th 600 14 0.05
99th 10,000 238 0.04
100th (worst discharge) 3,900,000 92,857 0.0002

DNV GL – Report No. PP111860-2 Appendix B, Rev. 5 – www.dnvgl.com Page B-9
Spill sizes in the data used in Method 2 are generally smaller than those in Method 1 until a spill frequency of 3x10⁻⁵ (1 every 28,000 yr), corresponding to 570 bbl. At this point, Method 2 results provide greater volumes. The number of data points for larger Method 2 spill volumes is limited, resulting in higher uncertainty at volumes greater than 30,000 bbl. Contributing to this is a single US incident involving the M/V Mega Borg, which released approximately 92,900 bbl of oil into the Gulf of Mexico in 1990 (Ref. (10)). While the incident remains in the data set for the purposes of this analysis, the conditions were significantly different than those associated with Vancouver Energy. Primarily, the incident occurred during a ship-to-ship (STS) transfer, and not a ship to shore transfer, as proposed in the Vancouver Energy project. During a ship to shore transfer, there are vapor return lines that exchange inert gas between the ship’s tanks and the facility tanks as the volume of liquid changes. This is normally not the case in the STS transfer. Also, the vessel was of pre-OPA 90 construction.
There are several differences in pre-OPA 90 tank vessels and modern tank vessels. Pre-OPA 90 vessels were of single hull construction. Modern tankers are of double hull construction. Pre-OPA 90 tankers typically do not
have inert gas generators to inert the space in each tank above the cargo, making the air/hydrocarbon gas
mixture in the tank too rich to ignite (O2 concentration of < 1%) making it non explosive. This gas is typically
exhaust from the main engines that has been cooled, dried and cleaned of residue and is returned to the cargo
tanks to remove displace the air in the tanks. Inert gas It is also needed to reduce the chance of an explosion
during crude oil washing (COW) as static charges can build up in the process and cause ignition.
Pre-OPA 90 vessels had integrated ballast and cargo tanks. This means that some tanks might carry cargo (oil)
on one voyage, and then ballast (water) on a subsequent voyage. Modern tank vessels have segregated ballast
tanks that are dedicated to ballast; meaning cargo cannot enter these tanks.
Pre-OPA 90 vessels typically did not have closed gauge measuring of cargo tanks; tanks were measured by
hand through open ullage caps. Modern tankers have closed gauge measuring systems for each tank to allow
sounding of inerted tanks without opening the tanks.
Isolation Times B.3.2The isolation times have been developed accounting for release location, leak size, and mode of operation. Isolation times are presented in Table B-5Table B-4 and are inclusive of detection, response times, and valve closure, so they indicate times from start of release to the time when the ESDV closes. In addition to site personnel present near a release location, a leak would also be detected by an operator in a control room. Thus, variations in isolation times for different release locations and modes of operation take into account variations in detection and response times, which depend on the presence of site personnel at the release location and leak sizes.

DNV GL – Report No. PP111860-2 Appendix B, Rev. 5 – www.dnvgl.com Page B-10
The times required to detect a release and then to initiate isolation are summarized in Table B-4.
Table B-4 Representative Isolation Times (in minutes)
Release Source
Type of Equipment
Release Size
Release Location
Within Dock Other than Dock
Detection Valve
Closure
Total Isolation
Time Detection
Valve Closure
Total Isolation
Time
Other than hose
Small 1.0 0.5 1.5 5.0 0.5 5.5
Medium 1.0 0.5 1.5 5.0 0.5 5.5
Large 1.0 0.5 1.5 3.0 0.5 3.5
Full Bore Rupture 1.0 0.5 1.5 1.0 0.5 1.5
Hose / Transfer operation – Method 1
Small* 0 0.5 0.5 - - -
Large* 0.5 0.5 1 - - - Failure of both
simultaneously* 0.5 0.5 1 - - -
Hose / Transfer operation – Method 2
Range of release sizes
Detection and Isolation times not modeled directly as already accounted for in historical data.
* Here small and large correspond to variations in released volumes arising from different isolation times rather than hole
sizes. Please refer to Section B.3.1.2 for definitions of these releases
Longer isolation times of 5.5 min, 3.5 min and 3.0 min, are applied to releases from small (15 mm), medium (50 mm), and large (100 mm) hole sizes for release locations other than the dock area during loading or holding mode.
Because personnel would be present at the dock during loading, irrespective of the leak size, an isolation time of 1.5 min is considered for releases within the dock area, except for releases from the loading hose. An isolation time of 0.5 minute is assumed for dock release scenarios because the response would be immediate.
For releases at the dock during holding mode, a longer isolation time is assumed because personnel may not be present at the dock. In this case, however, cameras and monitoring systems will allow detection by a control room operator, so 3.5 min is used for medium (50 mm hole size) and large (100 mm hole size) releases, and 5.5 min is used for small (15 mm hole size) release.
The facility has several protection measures to mitigate the potential for isolation failure. Some of the protection measures include “fail-close” valves, where if a signal is lost to the ESD valve, it will automatically close. The loading pump is also a positive displacement pump, and when shut down, it will prevent continued fluid flow from the tanks into the line. The pump will have protection measures and will trip if there is a loss of pressure on the downstream side (in the event of a release scenario) and/or when the ESD signal is sent. Vertical expansion joints are included in the pipeline layout to provide for thermal expansion ensuring design stresses and to provide a vertical barrier to prevent fluid flow from the tanks upstream of the loading pipeline without pumped force. Given these various mitigation measures, the likelihood of one of these aspects failing and resulting in “isolation failure” is considered to be low. A detailed failure mechanism analysis of the different barriers has not been conducted as part of this study. To be conservative, a possible scenario that results in “isolation failure” and continued pumped flow to the pipeline in a LOC event is

DNV GL – Report No. PP111860-2 Appendix B, Rev. 5 – www.dnvgl.com Page B-11
accounted for with a generic probability of 0.0001. The derivation of this generic probability is discussed in Section B.4.2.
For the generic “isolation failure” scenario, it is conservatively assumed that the release continues for one hour. In reality, the release duration may be longer or shorter, depending upon the available inventory and actions taken by the operators. However, the release duration is limited to one hour because it is considered a reasonable amount of time to mitigate the release given whatever mechanism was responsible for the breakdown of the various mitigation measures. Therefore, in the isolation failure case, in addition to the dynamic inventory (released for one hour), static inventory within the isolatable section was assumed to be subsequently released.
Isolation time is not applicable for leaks from the 4 inch and 6 inch crude return lines within Isolatable Section 4 during loading because the drain shutoff valves on the 4 inch crude return line are already in a closed position during loading or holding mode. Therefore, no isolation time is considered for these scenarios.
The scenarios are summarized in Table B-5 and Table B-6.

DNV GL – Report No. PP111860-2 Appendix B, Rev. 5 – www.dnvgl.com Page D-12
Table B-5 Scenarios Considered in the Loading Analysis
Isolatable
Section Scenario Description
Scenario
Number
Release Size
Category Mode
Pressure
(psig)
Temp.
(deg F)
Hole Size
(mm)
Isolation time
(minutes)
1
1.1 Leaks from 36" trestle loading line from first onshore
ESD up to dock
1.1S Small Loading 40 54.2 15 5.5 1.1M Medium Loading 40 54.2 50 5.5 1.1L Large Loading 40 54.2 100 3.5 1.1R Rupture Loading 40 54.2 914.4 1.5
1.2 Leaks from 36" loading line at dock and loading branches
1.2S Small Loading 40 54.2 15 1.5 1.2M Medium Loading 40 54.2 50 1.5 1.2L Large Loading 40 54.2 100 1.5 1.2R Rupture Loading 40 54.2 914.4 1.5
1.3 Leaks from 36" loading line and loading branches (all
locations)
1.3S Small Holding 2 54.2 15 5.5 1.3M Medium Holding 2 54.2 50 5.5 1.3L Large Holding 2 54.2 100 3.5 1.3R Rupture Holding 2 54.2 914.4 1.5
2
2.1 Leaks from 12" loading hose pipeline at dock
2.1S Small Loading 40 54.2 15 1.5 2.1M Medium Loading 40 54.2 50 1.5 2.1L Large Loading 40 54.2 100 1.5 2.1R Rupture Loading 40 54.2 304.8 1.5
2.2 Leaks from 4" crude return line (before isolation valve) at
dock
2.2S Small Loading 40 54.2 15 1.5 2.2M Medium Loading 40 54.2 50 1.5 2.2L Large Loading 40 54.2 100 1.5
2.3 Crude loading hose Refer to Table B-6
3
3.1 Leaks from 12" loading hose pipeline at dock
3.1S Small Loading 40 54.2 15 1.5 3.1M Medium Loading 40 54.2 50 1.5 3.1L Large Loading 40 54.2 100 1.5 3.1R Rupture Loading 40 54.2 304.8 1.5
3.2 Leaks from 4" crude return line (before isolation valve) at
dock
3.2S Small Loading 40 54.2 15 1.5 3.2M Medium Loading 40 54.2 50 1.5 3.2L Large Loading 40 54.2 100 1.5
3.3 Crude loading hose Refer to Table B-6
4 4.1 Leaks from 4" crude return line (after isolation valve)
4.1S Small Loading 2 54.2 15 Not Relevant 4.1M Medium Loading 2 54.2 50 Not Relevant 4.1L Large Loading 2 54.2 100 Not Relevant

DNV GL – Report No. PP111860-2 Appendix B, Rev. 5 – www.dnvgl.com Page D-13
Isolatable Section
Scenario Description Scenario Number
Release
Size Category
Mode Pressure
(psig) Temp. (deg F)
Hole Size (mm)
Isolation
time (minutes)
4.2 Leaks from 4" crude return line (after isolation valve)
4.2S Small Holding 2 54.2 15 Not Relevant 4.2M Medium Holding 2 54.2 50 Not Relevant 4.2L Large Holding 2 54.2 100 Not Relevant
4.3 Leaks from 6" crude return line
4.3S Small Loading 2 54.2 15 Not Relevant 4.3M Medium Loading 2 54.2 50 Not Relevant 4.3L Large Loading 2 54.2 100 Not Relevant 4.3R Rupture Loading 2 54.2 152.4 Not Relevant
4.4 Leaks from 6” crude return line
4.4S Small Holding 2 54.2 15 Not Relevant 4.4M Medium Holding 2 54.2 50 Not Relevant 4.4L Large Holding 2 54.2 100 Not Relevant 4.4R Rupture Holding 2 54.2 152.4 Not Relevant

DNV GL – Report No. PP111860-2 Appendix B, Rev. 5 – www.dnvgl.com Page D-14
Table B-6 Transfer Operation Scenarios Considered in the Loading Analysis
Method Isolatable
Section Scenario
Description Scenario Number
Release
Size Category
Mode Pressure
(psig) Temp. (deg F)
Isolation
time (minutes)
Defined Release Amount
(bbl)
Method 1
2 2.3 Crude loading hose
2.3S Small Loading 40 54.2 0.5 Not Applicable 2.3L Large Loading 40 54.2 1 Not Applicable 2.3B Both Loading 40 54.2 1 Not Applicable
3 3.3 Crude loading hose
3.3S Small Loading 40 54.2 0.5 Not Applicable 3.3L Large Loading 40 54.2 1 Not Applicable 3.3B Both Loading 40 54.2 1 Not Applicable
Method 2
2 2.3 Crude loading hose
2.3-1 - Loading - - Not Applicable 0.05 2.3-2 - Loading - - Not Applicable 0.19 2.3-3 - Loading - - Not Applicable 0.48 2.3-4 - Loading - - Not Applicable 0.71 2.3-5 - Loading - - Not Applicable 1.4 2.3-6 - Loading - - Not Applicable 1.7 2.3-7 - Loading - - Not Applicable 2.4 2.3-8 - Loading - - Not Applicable 7.1 2.3-9 - Loading - - Not Applicable 14 2.3-10 - Loading - - Not Applicable 238 2.3-11 - Loading - - Not Applicable 92,857
3 3.3 Crude loading hose
3.3-1 - Loading - - Not Applicable 0.05 3.3-2 - Loading - - Not Applicable 0.19 3.3-3 - Loading - - Not Applicable 0.48 3.3-4 - Loading - - Not Applicable 0.71 3.3-5 - Loading - - Not Applicable 1.4 3.3-6 - Loading - - Not Applicable 1.7 3.3-7 - Loading - - Not Applicable 2.4 3.3-8 - Loading - - Not Applicable 7.1 3.3-9 - Loading - - Not Applicable 14 3.3-10 - Loading - - Not Applicable 238 3.3-11 - Loading - - Not Applicable 92,857

DNV GL – Report No. PP111860-2 Appendix B, Rev. 5 – www.dnvgl.com Page D-15
B.4 Release Frequencies
The scenarios listed in Table B-5 and Table B-6 consider oil releases due to leaks from hoses and pipelines and connecting equipment such as valves, flanges, instruments, drains, and vents. Frequencies of these leaks have been estimated to associate oil spill quantities with the frequencies and thereby assess risks of oil spill. There are three types of leak sources for which a frequency basis is needed – pipelines, connecting equipment, and loading hoses.
Pipelines
For leaks from pipelines and connections, the types of failures and associated frequencies were derived from the US Department of Transportation Pipeline and Hazardous Safety Administration (US DOT PHMSA) (Ref. (11)) database which records incidents involving releases from above ground crude oil pipelines within terminals. The failure frequency for the above ground crude oil pipeline was derived on a per year per meter basis, taking into account the pipeline length and incidents involving mechanical punctures, leaks or ruptures from the crude oil pipeline operations.
For the scenarios concerning 36 inch, 12 inch, and 6 inch pipelines, the failure frequencies were calculated using pipeline lengths and distributions of the failure frequencies among the release types (small, medium, large, rupture). The distributions depend on the number of connecting equipment such as flanges, valves or small bore fittings installed on the pipelines. The frequencies derived from the US DOT PHMSA database are less conservative than the frequencies based on the offshore process piping or above ground natural gas transfer pipelines (Ref. (12)) and are more applicable.
The 4 inch pipeline is best represented as process pipework because it is a short section of piping connected to drain the shutoff valves which are operated during the draining operation. Therefore, long distance pipeline data are not applicable to the 4 inch pipeline. Consequently, the failure frequencies for 4 inch pipeline were based on the UK HCRD offshore data (Ref. (13)).
The failure frequencies have been derived based on historical incidents involving hydrocarbon releases. Thus, the frequencies do not take into account site-specific factors such as pipeline wall thickness, age of the pipeline, or material type.
Correlation of Frequency to Hole Size
Once the basis of failure frequencies for pipelines and connecting equipment is established, the frequencies are directly related to release size ranges. The hole size ranges used for this study are described in Section B.3.1.1 and are applied to all pipelines and connecting equipment, but not the loading hoses. Section B.3.1.2 describes the loading hose release types.
For a pipeline or connecting equipment of a given size, the frequencies of failures within each hole size range were calculated. The calculations were done for each size range of pipeline and connecting equipment. Pipeline lengths are also required in order to calculate failure frequencies, as the incident data for pipelines generally reports frequencies on a per year per meter (/yr-m) basis. Pipeline lengths are estimated from layout drawings. Once pipeline lengths are known for all sizes of pipelines, the pipeline failure frequencies are converted from a /yr-m basis to a per year basis. For equipment connected to the pipelines, a parts count is completed in order to estimate the number of equipment connections of given size and type. These

DNV GL – Report No. PP111860-2 Appendix B, Rev. 5 – www.dnvgl.com Page D-16
counts were then used in conjunction with the frequencies based on the offshore data for calculating the failure frequencies corresponding to the hole size ranges.
Loading Hoses
Loading hose / cargo transfer failure frequencies were based on two different methods with different data sources. Method 1 applied generic historical data from the UK HSE Advisory Committee on Dangerous Substances (ACDS) (Ref. (8)). The frequencies were based on incidents involving connection failures and loading arm ranging. The ranging failure frequencies were deduced on a per transfer basis, whereas connection failure frequencies were derived on a per hose per transfer basis. Since each crude oil hose is part of different isolatable sections, Isolatable Section 2 and Isolatable Section 3, frequencies for loading hoses were calculated separately for each hose.
Method 2 applied transfer operation failure frequencies derived from Tesoro’s historical operational data, refer to Section B.4.3 for the discussion.
Both methods use the average number of cargo transfers per year, 365 to calculate annual failure frequencies of the loading hoses / transfer operation.
Operational Mode B.4.1The interim frequencies calculated using the above approach do not differentiate between the modes of operation considered in this study. The interim frequencies need to be distributed between the two modes. This is achieved by first calculating the fraction of time loading and holding occur in a year and then multiplying the calculated frequencies with these fractions to arrive at annual frequencies for the modes. Input data include the ship types, numbers of transfers per year for each ship type, quantity of oil being transferred, and total loading rate (through two hoses).
As described in Section 3.1 of the main report, three Sample Vessels were selected to represent the possible range of tankers to load at the terminal. The first is 47,000 Deadweight Tons (DWT) loaded to a maximum of 320,000 bbl. The second is 105,000 DWT loaded to a maximum of 600,000 bbl. The third is 165,000 DWT loaded to a maximum of 600,000 bbl.
Table B-7 (Ref. (6)) presents the various activities associated with cargo transfer, along with durations for these activities. Note that only loading duration is used in this study, other durations are provided in the table for reference.

DNV GL – Report No. PP111860-2 Appendix B, Rev. 5 – www.dnvgl.com Page D-17
Table B-7 Assumptions for Vessel Loading Activities
Activity
Duration
47,000 DWT Tanker
105,000 DWT Tanker
165,000 DWT Tanker
Berthing and Mooring 1.5 hours 1.5 hours 1.5 hours
Loading arm connections 30 min 30 min 30 min
Survey Inspections, Nomination of Readiness (NOR) safety meeting
1.5 hours 1.5 hours 1.5 hours
Loading and deballast (simultaneous) (based on as assumed constant loading rate)
10.7 hours 20 hours 20 hours
Disconnect (Quick release), Surveyor, documentation, transfer of custody
2.0 hours 2.0 hours 2.0 hours
Preparation to depart, single up, let go. 30 min 30 min 30 min
TOTAL 16.7 hours 26 hours 26 hours
The loading durations shown in Table B-7 are calculated based on an average loading rate of 30,000 bbl per hour (Ref. (14) and Ref. (6)).
For the purposes of this risk assessment, the 47,000 DWT vessel is assumed to engage in 79% of the total number of cargo transfers per year, the 105,000 DWT tanker is assumed to engage in 20%, and the 165,000 DWT tanker is assumed to engage in 1% of the annual transfers.
The loading time per transfer is calculated for each Sample Vessel by dividing crude oil quantity in a ship by the loading rate. The calculated loading times (on a per transfer basis) are then multiplied by the number of transfers per ship types in order to calculate the loading fraction per year. For a given Sample Vessel,
Loading time (hr) per year =n*t, and loading fraction in a year = (n*t)/(365*24)
Where,
n = number of cargo transfers in a year
t = loading time (hr) per transfer
Table B-8 presents the calculated loading fractions for the ship types, which are then summed to calculate an overall loading fraction of 0.53. This result should be interpreted as: 53% of the time during a given year a ship will be loading at the terminal.
Table B-8 Portion of an Average Year when Loading Occurs
Ship Type Number of Cargo
Transfers (per yr)
Loading Time
(hr/transfer) Loading Fraction
47,000 DWT 288 10.7 0.35 105,000 DWT 73 20 0.17 165,000 DWT 4 20 0.01
Any releases that might occur during draining mode are included in holding.
DNV GL – Report No. PP111860-2 Appendix B, Rev. 5 – www.dnvgl.com Page D-18
Isolation Probability B.4.2Although there are many mitigation measures in place to prevent isolation failure, a detailed fault tree analysis of the probability for failure has not been conducted in this analysis. A simplified, conservative calculation has been performed to generically estimate the potential for various mechanisms to fail that may then result in continued pumped flow into the loading pipeline.
To account for the possibility of failure to isolate, either due to failure of the relevant ESDs or due to pump failure, the probability of isolation failure is determined as:
Pisolation failure = PFDESD*PFDPump
Where,
PFDESD = probability of failure on demand of the ESD(s); as the ESD system complies with Safety Integrity Level 2 (SIL2), this is defined as 1%.
PFDPump = probability of failure on demand of the independent ESD initiating a shutdown of the loading pump. The independent ESD complies with SIL 2, this is defined as 1%.
Human intervention is not required to initiate an ESD following a release, that is, on detection of the release, ESD would be activated automatically (Ref. (15), (16)). Therefore, the probability of human failure is not considered.
Note that detection failure is not considered in this study. All releases are assumed to be detected by the maximum time for their respective size.
Accordingly, each release scenario is split into two cases – isolation success and isolation failure. The release frequencies are multiplied with the calculated success and failure probabilities to obtain separate frequencies for the two cases.
Note that the isolation failure case is not applicable to all potential releases. Isolation failure is not relevant for leaks from the crude return lines within Isolatable Section 4 because these valves are considered always closed. Therefore, for the leaks from the crude return lines, release frequencies correspond to pipeline failure frequencies without taking into account isolation failure or isolation success probabilities, and the spill volumes correspond to the isolated inventory equivalent to the volume of Isolatable Section 4.
Historical Transfer Spill Frequency B.4.3Tesoro provided DNV GL with their historical release data related to global oil transfer operations for the period January 2009 to December 2014 (Ref. (17)). It includes 21,182 petroleum cargo transfers – which includes barge-to-shore, ship-to-shore and ship-to-ship (STS) transfers. Of most relevance to the current analysis are the barge-to-shore and ship-to-shore transfers, which represent the majority of the operations at 21,062 transfers. For the purposes of understanding the data, the number of incidents per year is presented together with the number of transfers per year and the number of barrels transferred per year in Figure B-7 and Figure B-8, respectively.

Figure B-7 Number of Transfers and Oil Spill Incidents by Year
Figure B-8 Number of Barrels Transferred and Oil Spill Incidents by Year

DNV GL – Report No. PP111860-2 Appendix B, Rev. 5 – www.dnvgl.com Page D-20
There were only two reported cargo transfer incidents during the evaluated six-year period. A summary of the incidents is presented in Table B-9. Both of the incidents resulted in a release of cargo and are related to this analysis. One of the instances resulted in a release of 1 cup of crude oil to water; the other incident resulted in 41 bbl released with about 1-2 bbl released to water (including the amount that was eventually recovered).
Table B-9 Related Incident Summary for 2009-2014 period (Ref. (18))
Time Period Incident Description Did the
incident result in a release?
Did the
release go to the water?
Estimated volume
released & oil type
Apr 2009 Overpressure of loading arm. Spill was from facility loading arm. Ship ramped up pump pressure too quickly.
Yes Yes 1 cup oil, crude
Nov 2012 Barge MS 2000. PIC lined up barge incorrectly. Overfilled port aft bunker tank, oil ran out of vent
Yes Yes 41 bbl spilled total (1.1 bbl to water, 40 bbl to
impermeable surface)
Total recovered 1 bbl from water, 40 bbl from deck
From this data set, the number of failures may be divided by the number of cargo transfers to get an average failure rate.
𝐶𝑎𝑟𝑔𝑜 𝑡𝑟𝑎𝑛𝑠𝑓𝑒𝑟 𝑟𝑒𝑙𝑒𝑎𝑠𝑒 𝑓𝑎𝑖𝑙𝑢𝑟𝑒 𝑟𝑎𝑡𝑒 =# 𝑜𝑓 𝑡𝑟𝑎𝑛𝑠𝑓𝑒𝑟 𝑟𝑒𝑙𝑒𝑎𝑠𝑒𝑠
𝑡𝑜𝑡𝑎𝑙 # 𝑜𝑓 𝑡𝑟𝑎𝑛𝑠𝑓𝑒𝑟𝑠=
2
21,062
= 9.5 𝑥 10−5 𝑓𝑎𝑖𝑙𝑢𝑟𝑒𝑠 𝑙𝑒𝑎𝑑𝑖𝑛𝑔 𝑡𝑜 𝑟𝑒𝑙𝑒𝑎𝑠𝑒 𝑝𝑒𝑟 𝑡𝑟𝑎𝑛𝑠𝑓𝑒𝑟, 𝑜𝑟 = 10,531 𝑡𝑟𝑎𝑛𝑠𝑓𝑒𝑟𝑠 𝑏𝑒𝑡𝑤𝑒𝑒𝑛 𝑓𝑎𝑖𝑙𝑢𝑟𝑒𝑠 𝑙𝑒𝑎𝑑𝑖𝑛𝑔 𝑡𝑜 𝑟𝑒𝑙𝑒𝑎𝑠𝑒
Because it is possible that a third failure is on the brink of occurring, it is common practice to include an additional failed transfer leading to release (simulating the failure of the very next transfer) in the calculation, bringing the average transfer failure rate leading to release up to 1.4x10⁻⁴ per transfer.
The Tesoro incident data set for transfer operation leading to release is very small, with only 2 events over 6 years. Because there are only two recorded failures over the course of 21,062 transfer operations, a degree of uncertainty is introduced into the calculation when attempting to determine future risk. To address this uncertainty, a confidence level may be found for the failure rate leading to release. The confidence level is a statistician’s tool for giving credit to the number of failures and the total number of transfers recorded in the data source.
The confidence level may be calculated in a number of ways. In this case, a chi-square method was utilized (Ref. (19)). With the chi-square methodology, a failure rate may be determined for a specific confidence level.

DNV GL – Report No. PP111860-2 Appendix B, Rev. 5 – www.dnvgl.com Page D-21
The governing formula is shown below:
𝐶𝑎𝑟𝑔𝑜 𝑡𝑟𝑎𝑛𝑠𝑓𝑒𝑟 𝑓𝑎𝑖𝑙𝑢𝑟𝑒 𝑟𝑎𝑡𝑒 𝑙𝑒𝑎𝑑𝑖𝑛𝑔 𝑡𝑜 𝑟𝑒𝑙𝑒𝑎𝑠𝑒 (𝑓𝑜𝑟 𝑎 𝑠𝑝𝑒𝑐𝑖𝑓𝑖𝑐
𝑐𝑜𝑛𝑓𝑖𝑑𝑒𝑛𝑐𝑒 𝑙𝑒𝑣𝑒𝑙)
=𝜒2
2 ∗ (𝑡𝑜𝑡𝑎𝑙 # 𝑜𝑓 𝑡𝑟𝑎𝑛𝑠𝑓𝑒𝑟𝑠)
The χ2 variable in this formula is dependent on the chosen confidence level and the number of failures. With this formula, the failure rates at any confidence level are calculated, as shown in Figure B-9.
Figure B-9 Confidence Levels per Upper Limit of Failure Rate
In Figure B-9, the x-axis has the range of possible failure rates leading to release for cargo transfer operations. The y-axis has the confidence levels which indicate the probabilities that the respective failure rates will not be exceeded (assuming that cargo transfer equipment and procedures are managed similarly to Tesoro’s historical operations). The trend is clear that as confidence levels rise, failure rates must increase, given the limitations of the provided data. From this analysis, it is observed that the mean average failure rate of 1.4x10⁻⁴ per transfer falls close to the 60% confidence level. At a confidence level of 99.95%, failure rates per transfer remain under 6x10⁻⁴. For purposes of this study, a 99% confidence level was selected.
Based on the above analysis, Method 2 estimates an average oil spill rate of 4.0x10⁻⁴ per transfer, which correlates to a confidence level of 99%. Coincidently, the 99% confidence level transfer failure rate is similar to the generic transfer failure rate (3.7x10⁻⁴ per transfer) applied in Method 1.
The Tesoro historical incident release frequency of 4.0x10⁻⁴ per transfer is distributed across the US historical spill volume probabilities described in Section B.3.1.2. Table B-10 shows the cargo transfer operation scenario frequencies, which are based on Tesoro cargo transfer oil spill data and US oil cargo transfer spill volume data. The annual frequencies are based on the assumed 365 transfers per year.
0.0
5%
0.1
0%
0.5
0%
1.0
0%
2.5
0%
5.0
0%
10
.00
%
20
.00
%
30
.00
%
40
.00
%
50
.00
%
1.47E-04, 60.00%
70
.00
%
80
.00
%
90
.00
%
95
.00
%
97
.50
%
99
.00
%
99
.50
%
99
.90
%
99
.95
%
0%
10%
20%
30%
40%
50%
60%
70%
80%
90%
100%
1.0E-06 1.0E-05 1.0E-04 1.0E-03
Pro
bab
ility
of
No
n-E
xcee
dan
ce
Failure Rate Leading to Release (per transfer)

DNV GL – Report No. PP111860-2 Appendix B, Rev. 5 – www.dnvgl.com Page D-22
Table B-10 Method 2 Hose Transfer Scenario Definitions
Spill Volume (bbl)
Probability Fraction
Frequency (per year)
0.05 0.25 3.7E-02
0.19 0.15 2.2E-02
0.48 0.1 1.5E-02
0.71 0.1 1.5E-02
1.4 0.1 1.5E-02
1.7 0.05 7.3E-03
2.4 0.05 7.3E-03
7.1 0.1 1.5E-02
14 0.05 7.3E-03
238 0.04 5.9E-03
92,857 0.0002 2.5E-05
B.5 Oil Spill Volume
For each scenario presented in previous Table B-5, the spill quantity was estimated by calculating the dynamic (pumped) inventory and then adding the isolated section inventory, also called static inventory. The intent is to split the spill quantity into two parts. The first part is the dynamic inventory the release quantity from the beginning of a release until closure of ESDVs. The second part is static inventory, the spill quantity after closure of ESDVs until all inventory in the isolatable section is released, which is equivalent to the isolatable section volume presented in Table B-1.
Generally within this study, dynamic inventories are calculated by multiplying outflow rates with ESD times when isolation succeeds; exceptions are specifically noted within this appendix. For isolation failure scenarios, a release duration of 1 hour was used in the calculation. The initial maximum outflow rates were calculated using hole sizes and release pressures for each of the scenarios. These outflow rates were used to calculated the dynamic inventories. This analysis conservatively simplifies the outflow rate calculations by not accounting for friction between the oil and the equipment for hole release scenarios from the 36 inch pipeline.
A different approach is followed for ruptures of the 36 inch pipeline during loading mode. The transient outflow rates for the ruptures were calculated taking into account frictional losses associated with pipeline length and onshore ESDV. The dynamic inventory, which is the release inventory until the loading pump shuts down, was calculated by estimating the area under the mass flowrate curve up to one hour. Static inventory was then added to the dynamic inventory to calculate the total release amount.
It is important to note that not every scenario presented in Table B-5 would result into a spill quantity that can be split into dynamic flow and static flow. For instance, if a leak occurs within an already isolated section, meaning there is no inflow into the section prior to leak, there will not be any contribution to the total spill quantity from dynamic inventory. Such situation applies to Isolatable Section 4 because during loading or holding modes, the drain shut off valves are closed, so there is no inflow assumed into the isolatable section and only the static inventory is applied.

DNV GL – Report No. PP111860-2 Appendix B, Rev. 5 – www.dnvgl.com Page D-23
During holding, it is considered that the valves on the upstream and downstream boundaries of Isolatable Section 1 and all valves upstream of this one are normally closed. Thus, in the event of a leak within Isolatable Section 1 during holding, there would be no inflow to Isolatable Section 1 and therefore dynamic inventory would not be a contributor to the total potential release inventory.
Note that oil that may remain within the pipelines in the event of a release due to expansion joints and vertical variations, which are conservatively not considered in the volume outflow calculation.
Additionally it is important to note that no distinction is made between the volumes that would / would not reach soil or the waterway. Nor have allowances or adjustments been made to the spill volumes to account for any volumes that might be recovered.
DNV GL – Report No. PP111860-2 Appendix B, Rev. 5 – www.dnvgl.com Page D-24
B.6 Results
Estimates of release inventories and release frequencies are shown in Table B-11 for isolation success, in Table B-12 for isolation failure, in Table B-13 for the scenarios where isolation success or failure is irrelevant, and in Table B-14 for the transfer operation scenarios of the two different methods applied in the study.
The calculated mass flow rates are identical between the two cases (isolation success and failure), but the isolation times are different. The isolation failure case (assuming a generic failure mechanism that results in continued pumped flow) considers 1 hour of release duration and subsequent release of inventory within the isolatable section. Isolation times for the case where isolation succeeds (isolation valves successfully close and/or the pump successfully shuts down) are significantly smaller, resulting in significantly smaller dynamic inventories.
The results presented in the tables can be summarized as follows, according to the different methods applied:
Method 1
As expected, full bore ruptures of 36 inch loading pipelines either during loading or holding are the worst scenarios in terms of severity of the release; however the likelihood of such a release is very low. If isolation fails, the rupture of the 36 inch loading line would result in an oil spill quantity of 31,600 barrels; however with a relatively small occurrence frequency of 2.4x10⁻¹⁰ per year, which is once in 4.1 billion years. The scenario of successful isolation of the pipeline rupture would bring the spill quantity down to about 1,200 barrels with associated release frequency of 2.4x10⁻⁶ per year, which is once in 420,000 years.
The most frequent release is related to a small release from one of the crude loading hoses during cargo transfer, with isolation success. The estimated spill quantity is 145 barrels with a total frequency of 1.2x10⁻¹ per year, which is once in 9 years.
A small release from the 12 inch loading pipeline or 4 inch crude return line within Isolatable Section 2 or 3 results in about 9 bbl of oil spilled, which is the smallest quantity of oil spilled among all the scenarios considered in the study, with associated release frequency of 2.4x10⁻⁴ per year i.e. once in 4,200 years.
Method 2
The worst case cargo transfer operation (e.g., hose or other equipment) failure included in the study is the worst scenario in terms of severity of the release; however the likelihood of such a release is low. Note that this release inventory is based on the worst case release in US navigable waters related to a transfer operation incident. The inventory is approximately 92,900 barrels with an occurrence frequency of 2.5x10⁻⁵ per year, which is once in 39,000 years.
The most frequent release is related to a very small release from one of the crude loading hoses during cargo transfer. The estimated spill quantity is 0.05 barrels (2 gallons) with a total frequency of 3.7x10⁻² per year, which is once in 27 years. This is also the smallest quantity of oil spilled among the scenarios considered in the study.

DNV GL – Report No. PP111860-2 Appendix B, Rev. 5 – www.dnvgl.com Page D-25
The sum of the frequencies for potential releases with spill volumes less than 1 barrel is 8.8x10⁻² per year i.e. once in 11 years. This frequency represents 60% of the frequency total in the study.
The frequency of a release of any size was derived by summing the release frequencies shown in Table B-11, Table B-12, and Table B-13. The total release frequency is 1.3x10⁻¹ per year, which is once in 8 years for Method 1 and 1.5x10⁻¹ per year, which is once in 7 years for Method 2. Releases from the loading hoses contribute the most, about 99%, to the total release frequency, for both Methods 1 and 2.

DNV GL – Report No. PP111860-2 Appendix B, Rev. 5 – www.dnvgl.com Page D-26
Table B-11 Released Oil Quantities and Associated Frequencies for Isolation Success
Isolatable Section Scenario Description Scenario
Number Mode Mass Flow Rate (kg/s)
Dynamic Inventory
(kg)
Static Inventory
(kg)
Total Release
Inventory (kg)
Volume (bbl)
Release Frequency (per year)
1 1.1 Leaks from 36" trestle loading line from first onshore ESD up to dock
1.1S Loading 2.4 801 51277 52078 402 3.67E-05
1.1M Loading 27 8899 51277 60176 465 6.66E-06
1.1L Loading 108 22652 51277 73929 571 5.24E-07
1.1R Loading 1157 104061 51277 155338 1200 1.96E-06
1.2 Leaks from 36" loading line at dock and loading branches
1.2S Loading 2.4 218 51277 51495 398 6.46E-06
1.2M Loading 27 2427 51277 53704 415 9.70E-07
1.2L Loading 108 9708 51277 60985 471 8.61E-08
1.2R Loading 1157 104061 51277 155338 1200 3.99E-07
1.3 Leaks from 36" loading line and loading branches Refer to Table B-13
2 2.1 Leaks from 12" loading hose pipeline at dock
2.1S Loading 2.4 218 980 1198 9 7.14E-07
2.1M Loading 27 2427 980 3407 26 8.23E-08
2.1L Loading 108 9708 980 10688 83 1.18E-08
2.1R Loading 1002 90191 980 91171 704 6.28E-08
2.2 Leaks from 4" crude return line (before isolation valve) at dock
2.2S Loading 2.4 218 980 1198 9 1.17E-04
2.2M Loading 27 2427 980 3407 26 1.31E-05
2.2L Loading 108 9708 980 10688 83 1.16E-05
2.3 Crude loading hose Refer to Table B-14 3 3.1 Leaks from 12" loading
hose pipeline at dock 3.1S Loading 2.4 218 988 1206 9 7.14E-07
3.1M Loading 27 2427 988 3415 26 8.23E-08
3.1L Loading 108 9708 988 10696 83 1.18E-08
3.1R Loading 1002 90191 988 91179 705 6.28E-08
3.2 Leaks from 4" crude return line (before isolation valve) at dock
3.2S Loading 2.4 218 988 1206 9 1.19E-04
3.2M Loading 27 2427 988 3415 26 1.33E-05
3.2L Loading 108 9708 988 10696 83 1.18E-05
3.3 Crude loading hose Refer to Table B-14

DNV GL – Report No. PP111860-2 Appendix B, Rev. 5 – www.dnvgl.com Page D-27
Table B-12 Released Oil Quantities and Associated Frequencies for Isolation Failure
Isolatable Section Scenario Description Scenario
Number Mode Mass Flow
Rate (kg/s)
Dynamic Inventory
(kg)
Static Inventory
(kg)
Total Release Inventory (kg)
Volume (bbl)
Release Frequency (per year)
1
1.1 Leaks from 36" trestle loading line from first onshore ESD up to dock
1.1S Loading 2.4 8737 51277 60014 464 3.74E-09 1.1M Loading 27 97081 51277 148358 1146 6.79E-10 1.1L Loading 108 388324 51277 439601 3397 5.34E-11 1.1R Loading 1157 4044367 51277 4095644 31647 2.00E-10
1.2 Leaks from 36" loading line at dock and loading branches
1.2S Loading 2.4 8737 51277 60014 464 6.59E-10 1.2M Loading 27 97081 51277 148358 1146 9.90E-11 1.2L Loading 108 388324 51277 439601 3397 8.78E-12 1.2R Loading 1157 4044367 51277 4095644 31647 4.07E-11
1.3 Leaks from 36" loading line and loading branches Refer to Table B-13
2
2.1 Leaks from 12" loading hose pipeline at dock
2.1S Loading 2.4 8737 980 9717 75 7.28E-11 2.1M Loading 27 97081 980 98060 758 8.40E-12 2.1L Loading 108 388324 980 389304 3008 1.20E-12 2.1R Loading 1002 3607642 980 3608622 27884 6.40E-12
2.2 Leaks from 4" crude return line (before isolation valve) at dock
2.2S Loading 2.4 8737 980 9717 75 1.19E-08 2.2M Loading 27 97081 980 98060 758 1.34E-09 2.2L Loading 108 388324 980 389304 3008 1.18E-09
2.3 Crude loading hose Refer to Table B-14
3
3.1 Leaks from 12" loading hose pipeline at dock
3.1S Loading 2.4 8737 988 9725 75 7.28E-11 3.1M Loading 27 97081 988 98068 758 8.40E-12 3.1L Loading 108 388324 988 389312 3008 1.20E-12 3.1R Loading 1002 3607642 988 3608630 27884 6.40E-12
3.2 Leaks from 4" crude return line (before isolation valve) at dock
3.2S Loading 2.4 8737 988 9725 75 1.21E-08 3.2M Loading 27 97081 988 98068 758 1.35E-09 3.2L Loading 108 388324 988 389312 3008 1.21E-09
3.3 Crude loading hose Refer to Table B-14

DNV GL – Report No. PP111860-2 Appendix B, Rev. 5 – www.dnvgl.com Page D-28
Table B-13 Released Oil Quantities and Associated Frequencies when Isolation is Irrelevant
Isolatable Section
Scenario Description
Scenario Number Mode Mass Flow
Rate (kg/s)
Static Inventory
(kg)
Total Release
Inventory (kg)
Volume (bbl) Release
Frequency (per year)
1
1.3 Leaks from 36" loading line and loading branches
1.3S Holding 0.5 51277 51277 396 4.43E-05 1.3M Holding 6 51277 51277 396 7.40E-06 1.3L Holding 24 51277 51277 396 6.13E-07 1.3R Holding 651 51277 51277 396 2.53E-06
4
4.1 & 4.2 Leaks from 4" crude return line (after isolation valve)
4.1S Loading 0.5 1451 1451 11 6.57E-05 4.1M Loading 6 1451 1451 11 8.70E-06 4.1L Loading 24 1451 1451 11 1.72E-05 4.2S Holding 0.5 1451 1451 11 2.49E-04 4.2M Holding 6 1451 1451 11 2.86E-05 4.2L Holding 24 1451 1451 11 3.04E-05
4.3 & 4.4 Leaks from 6" crude return line
4.3S Loading 0.5 1451 1451 11 3.39E-05 4.3M Loading 6 1451 1451 11 1.01E-05 4.3L Loading 24 1451 1451 11 2.23E-06 4.3R Loading 56 1451 1451 11 6.54E-06 4.4S Holding 0.5 1451 1451 11 3.39E-05 4.4M Holding 6 1451 1451 11 1.01E-05 4.4L Holding 24 1451 1451 11 2.23E-06 4.4R Holding 56 1451 1451 11 6.54E-06
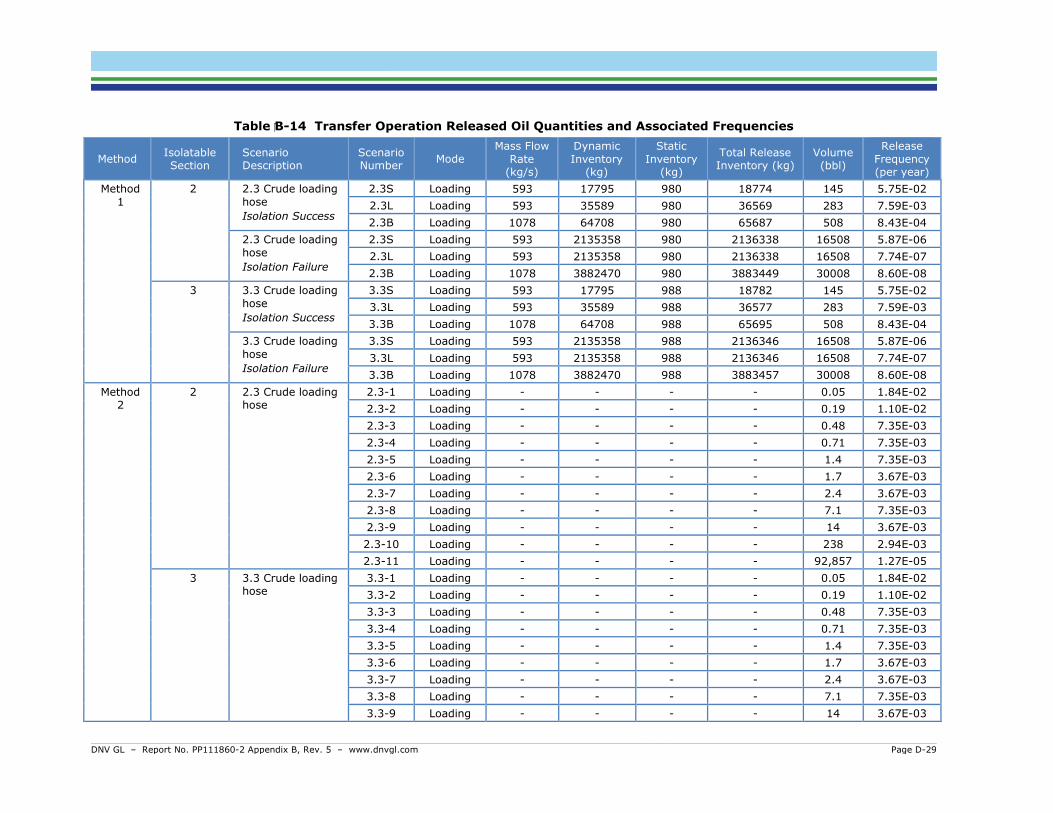
DNV GL – Report No. PP111860-2 Appendix B, Rev. 5 – www.dnvgl.com Page D-29
Table B-14 Transfer Operation Released Oil Quantities and Associated Frequencies
Method Isolatable Section
Scenario Description
Scenario Number Mode
Mass Flow Rate
(kg/s)
Dynamic Inventory
(kg)
Static Inventory
(kg)
Total Release Inventory (kg)
Volume (bbl)
Release Frequency (per year)
Method 1
2 2.3 Crude loading hose Isolation Success
2.3S Loading 593 17795 980 18774 145 5.75E-02 2.3L Loading 593 35589 980 36569 283 7.59E-03 2.3B Loading 1078 64708 980 65687 508 8.43E-04
2.3 Crude loading hose Isolation Failure
2.3S Loading 593 2135358 980 2136338 16508 5.87E-06 2.3L Loading 593 2135358 980 2136338 16508 7.74E-07 2.3B Loading 1078 3882470 980 3883449 30008 8.60E-08
3 3.3 Crude loading hose Isolation Success
3.3S Loading 593 17795 988 18782 145 5.75E-02 3.3L Loading 593 35589 988 36577 283 7.59E-03 3.3B Loading 1078 64708 988 65695 508 8.43E-04
3.3 Crude loading hose Isolation Failure
3.3S Loading 593 2135358 988 2136346 16508 5.87E-06 3.3L Loading 593 2135358 988 2136346 16508 7.74E-07 3.3B Loading 1078 3882470 988 3883457 30008 8.60E-08
Method 2
2 2.3 Crude loading hose
2.3-1 Loading - - - - 0.05 1.84E-02 2.3-2 Loading - - - - 0.19 1.10E-02 2.3-3 Loading - - - - 0.48 7.35E-03 2.3-4 Loading - - - - 0.71 7.35E-03 2.3-5 Loading - - - - 1.4 7.35E-03 2.3-6 Loading - - - - 1.7 3.67E-03 2.3-7 Loading - - - - 2.4 3.67E-03 2.3-8 Loading - - - - 7.1 7.35E-03 2.3-9 Loading - - - - 14 3.67E-03 2.3-10 Loading - - - - 238 2.94E-03 2.3-11 Loading - - - - 92,857 1.27E-05
3 3.3 Crude loading hose
3.3-1 Loading - - - - 0.05 1.84E-02 3.3-2 Loading - - - - 0.19 1.10E-02 3.3-3 Loading - - - - 0.48 7.35E-03 3.3-4 Loading - - - - 0.71 7.35E-03 3.3-5 Loading - - - - 1.4 7.35E-03 3.3-6 Loading - - - - 1.7 3.67E-03 3.3-7 Loading - - - - 2.4 3.67E-03 3.3-8 Loading - - - - 7.1 7.35E-03 3.3-9 Loading - - - - 14 3.67E-03

DNV GL – Report No. PP111860-2 Appendix B, Rev. 5 – www.dnvgl.com Page D-30
Method Isolatable Section
Scenario Description
Scenario Number Mode
Mass Flow Rate
(kg/s)
Dynamic Inventory
(kg)
Static Inventory
(kg)
Total Release Inventory (kg)
Volume (bbl)
Release Frequency (per year)
3.3-10 Loading - - - - 238 2.94E-03 3.3-11 Loading - - - - 92,857 1.27E-05
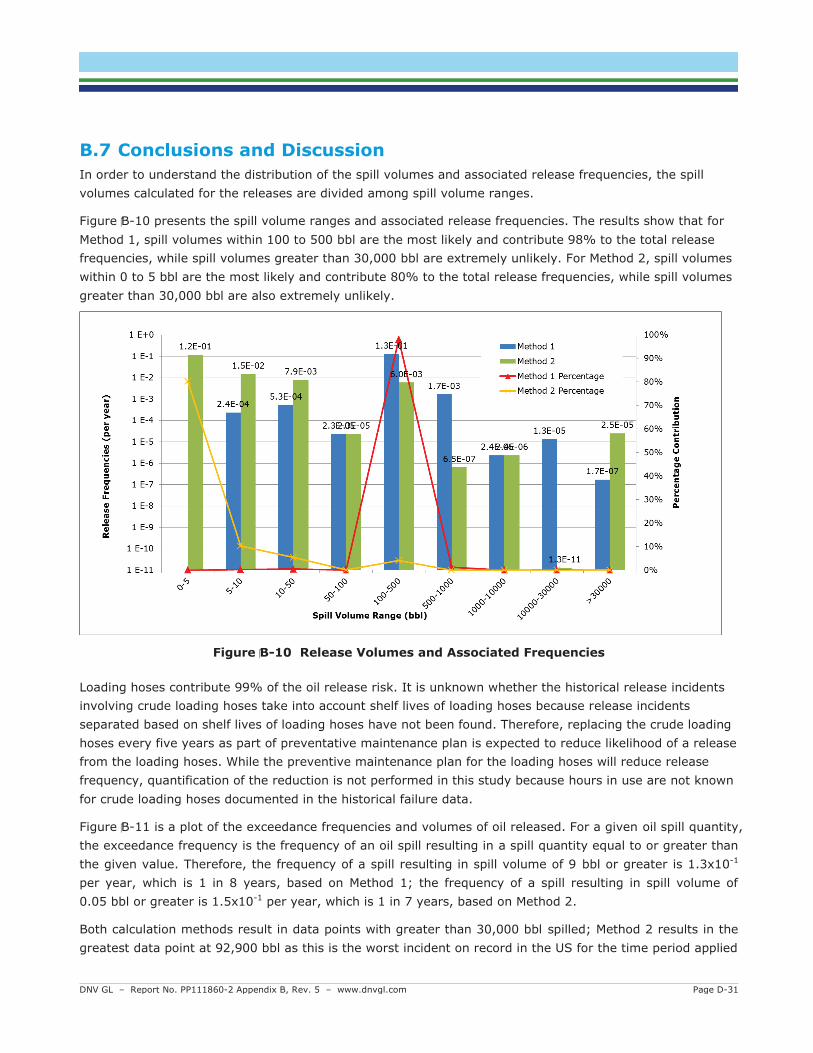
B.7 Conclusions and Discussion
Figure B-10 Release Volumes and Associated Frequencies

Figure B-11 Cumulative Frequencies vs. Oil Volume
DNV GL – Report No. PP111860-2 Appendix B, Rev. 5 – www.dnvgl.com Page D-33
B.8 . References
1. Vancouver Energy Distribution Terminal. Piping Detail @ Marine Vessel Loading Area. 10/24/14.
0400-PD-006, Rev. B.
2. —. Area 0400 Marine Terminal Enlarged Plan View. 05-06-13. 0400-SP-001 Rev. HH.
3. —. Transfer Pipelines to Marine Terminal. 10/24/14. 0400-PD-004 Rev. E.
4. —. Area 400 Vessel Loading Lighting Sections. 10/17/14. 0400-ED-021 Rev. E.
5. David Corpron, Vancouver Energy Distribution Terminal. RE: Bakken Oil Composition. December 8,
2014.
6. Meeting to discuss Vancouver Energy Distribution Terminal LOC Study Basis. December 4th, 2014.
7. Vancouver Energy Distribution Terminal. Application for Site Certification Agreement. 29 August
2013. Vol. Volume 1. Agreement No. 2013-01.
8. Major Hazard Aspects of the Transport of Dangerous Substances. s.l. : UK HSE Advisory Committee on
Dangerous Substances, 1991. ISBN 0 11 885676 6.
9. Environmental Research Consulting. Trends in Oil Spills from Large Vessels in the US and California
with Implications for Anticipated Oil Spill Prevention and Mitigation based on the Washington Oil Transfer
Rule. 2006.
10. M/V Mega Borg, Incident News. NOAA Incident News. [Online]
http://incidentnews.noaa.gov/incident/6748.
11. US Department of Transportation. Pipeline and Hazardous Material Safety Administration. Data &
Statistics. [Online] http://www.phmsa.dot.gov/pipeline/library/data-stats.
12. Failure Rate and Event Data for Use Within Risk Assessments. www.hse.gov.uk. [Online] June 28, 2012.
http://www.hse.gov.uk/landuseplanning/failure-rates.pdf.
13. UK HSE. Offshore Hydrocarbon Release Statistics. s.l. : HSE Offshore Safety Division, March 2010.
14. DNV GL. Columbia River Vessel Traffic Risk Assessment. August 22, 2014. PP111860-1 Rev. 1.
15. Meeting to review Vancouver Energy Distribution Terminal VTRA Draft Report. January 21st, 2015.
16. Meeting to review Vancouver Energy Distribution Terminal VTRA Rev 1 Report. February 19, 2015.
17. Tesoro. A representative of the Joint Venture provided the data on August 13, 2015 at Katy, Texas.
18. Haugstad, Eric A. Memorandum Tesoro marine Incident Statistics. s.l. : Tesoro Maritime Company,
November 23, 2015.
19. Smith, Dr. David J. Reliability, Maintainability and Risk: Practical Methods for Engineers, 6th Edition.
s.l. : Butterworth-Heinemann, 2001. 0 7506 5168 7.
20. Vancouver Energy Distribution Terminal. Overall Site Plan. 05-06-13. 0100-SP-001 Rev. GG.


APPENDIX C BergerABAM Columbia River Anticipated Vessel Traffic
DNV GL – Report No. PP111860-2, Rev. 5 – www.dnvgl.com

Memorandum
Date: 11 February 2015
Subject: Columbia River Anticipated Vessel Traffic
From: Irina Makarow, Carissa Watanabe
To: Jay Derr, Van Ness Feldman
Route to:
INTRODUCTION The purpose of this memorandum is to document publicly available information regarding
marine terminal projects along the Columbia River which are anticipated to generate future
additional vessel traffic.
PROJECTS WITH ADDITIONAL VESSEL CALLS
The following facilities have either announced their intent to build or expand, are in permitting
or construction, or have completed construction. A short description of each project is provided
below and is summarized in Table 1.
Canpotex Canpotex is a potash export facility located at Terminal 5 at the Port of Portland. Canpotex’s
long‐term lease with the Port was expanded and extended in October 2014 (Port of Portland
2014b). The facility expansion is currently in permitting and includes a new storage building,
shiploader, and improvements to its conveyer system. Canpotex expects to increase its tonnage
incrementally within the coming years (Port of Portland 2014c). Canoptex currently has six
storage bays with a capacity of 135,000 metric tons of potash (Wall Street Journal 2014) and
exports more than two million tons to overseas markets (Port of Portland 2014c).
EGT, LLC EGT operates a grain export facility located at the Port of Longview. The facility opened in 2012
and is expected to handle as many as 200 ships per year with an annual capacity of eight million
metric tons (EGT 2012).
Global Partners Global Partners operates a crude oil and ethanol export facility located at Port Westward in
Clatskanie, Oregon. Global Partners is currently permitting an expansion of the existing facility

Vancouver Energy
11 February 2015
Page 2
to increase handling capacity. The maximum crude oil and ethanol throughput for the facility
will be 1.839 billion gallons per year (ODEQ 2014). Crude oil and ethanol is loaded onto
oceangoing vessels for export overseas. Assuming Panamax vessels with a capacity of 331,000
barrels are used for transport, approximately 132 one‐way trips would be required annually at
full buildout. Construction is anticipated to begin in 2015 (Port of St. Helens 2014).
Haven Energy Haven Energy is proposing to construct a new propane/butane export facility at the Port of
Longview. The facility would receive the product by rail and exported on vessels to Hawaii,
Mexico, and Asia. Export will be on very large gas carriers (VLGCs), and 30 vessel trips are
estimated annually (Port of Longview 2014). The project is currently in lease negotiations with
the Port.
Kalama Export Company Kalama Export operates a grain export facility located at the Port of Kalama. In 2011 Kalama
Export expanded their existing facility, including an additional 21,000 metric tons of storage
and greater vessel‐loading capacity (Gavilon 2010). The improvements were expected to
increase the facility’s annual throughput by 25 percent (Port of Kalama 2011). Kalama Export
had a total of 122 vessel calls in 2013 (Port of Kalama 2013) and a 25 percent increase could
result in an additional 31 vessel trips along the Columbia River.
Kinder Morgan Kinder Morgan operates a soda ash export facility located at Terminal 4 at the Port of Portland.
Kinder Morgan negotiated a 10‐year lease with the Port of Portland in 2013 and improvements
included a new shiploader to increase efficiency and “set the stage for growth,” (Port of
Portland 2013).
Millennium Bulk Terminals Millennium Bulk Terminals is a proposed coal export facility to be located at the Port of
Longview. The proposed facility will import coal by rail and export it overseas. The facility will
be capable of handling 44 million metric tons of coal per year and will average 730 Panamax
vessel trips annually along the Columbia River (Cowlitz County and Washington State
Department of Ecology 2014). The project is currently in the permitting stage.
Morrow Pacific Ambre Energy’s Morrow Pacific project is a proposed coal export facility to be located at the
Port of Morrow in Boardman, Oregon, and at Port Westward in Clatskanie, Oregon. The
proposed facility will transport coal from the Port of Morrow to Port Westward via barge,
where it will be loaded onto oceangoing vessels. Initial volumes exported will be approximately
3.5 million metric tons per year; at full capacity, volumes will be 8 million metric tons per year
(Ambre Energy 2012). Vessel traffic will be 5.5 loaded barge tows and 1 Panamax vessel each
week initially, and 12 loaded barge tows and 3 Panamax vessels each week at full buildout (U.S.

Vancouver Energy
11 February 2015
Page 3
Army Corps of Engineers 2012). The project has been denied a permit by the Oregon
Department of State Lands; however, appeals have been filed against the decision and the
project has not been formally cancelled (Morrow Pacific 2014).
NW Innovation Works NW Innovation Works is proposing to construct two methanol facilities; one at the Port of
Kalama and one at Port Westward in Clatskanie, Oregon. Each facility will produce methanol
from natural gas received via pipeline and export it to China. The Port Westward facility has
been announced, and the Kalama facility is currently in permitting. At full capacity the Kalama
facility is anticipated to produce 3.6 million metric tons of methanol annually. The Kalama
facility anticipates between three and six ships per month, depending on vessel size (Port of
Kalama 2014). Assuming the facilities will be similar in size and production, there could be a
potential increase of 72 to 144 ships annually along the Columbia River.
Oregon LNG Oregon LNG is a proposed liquefied natural gas (LNG) facility in Warrenton, Oregon. The
facility will liquefy up to 9 million metric tons of LNG annually at full capacity and export
overseas on liquefied natural gas carriers (LNGCs). It is estimated there will be 125 annual
vessel trips consisting of 50 trips on LNGCs of 148,000 cubic meter capacity and 75 trips on
LNGCs of 173,000 cubic meter capacity (CH2M Hill 2013). The project is currently in permitting,
construction is estimated to begin in 2015, and the first shipment will be in 2019 (Oregon LNG
2015).
Pembina Pipeline Corporation Pembina Pipeline Corporation is proposing to construct a new propane facility at Terminal 6 at
the Port of Portland. At full build‐out, the facility will receive approximately 37,000 barrels of
propane per day and export it to overseas markets (Port of Portland 2014a). Export overseas
will be on VLGCs, and it is estimated there will be two to three vessel trips per month (City of
Portland 2015). The project is currently in permitting.
TEMCO TEMCO operates a grain export facility located at the Port of Kalama. TEMCO is renovating its
existing facility to add new docks, shipping system, and rail and barge unloading machinery
(Pittman 2014). The updated facility will have the capacity to handle up to 200 million bushels
of grain per year, doubling the facility’s previous capacity (Luck 2014). At full operating
capacity, an additional 48 vessel trips along the Columbia River could be generated, assuming
2.1 million bushels per Panamax vessel. The renovations are expected to be complete in early
2015.

Vancouver Energy
11 February 2015
Page 4
Table 1. Vessel Traffic Summary Project Name and
Location Product Vessel Class and Frequency Status
Canpotex Portland, OR Potash
Panamax 50 calls annually
Announced expansion
Export Grain Longview, WA Grain Panamax
200 annually Complete in 2012
Global Partners Clatskanie, OR
Crude Oil and Ethanol 132 annually Expansion construction
to begin in 2015
Haven Energy Longview, WA
Propane and Butane
VLGC 30 annually Announced
Kalama Export Kalama, WA Grain Panamax
31 additional annually Expansion complete in
2011
Kinder Morgan Portland, OR Soda Ash Handymax/Panamax Improvements complete
Millennium Bulk Terminals Longview, WA Coal Panamax
730 trips annually In permitting
Morrow Pacific Boardman & Clatskanie, OR Coal
Initial: 5.5 barge tows & 1 Panamax per week Complete: 12 barge
tows & 3 Panamax per week
In permitting
NW Innovation Works Kalama, WA Methanol Tanker
36 to 72 trips annually In permitting
NW Innovation Works Clatskanie, OR Methanol
Tanker 36 to 72 trips annually
Announced
Oregon LNG Warrenton, OR
LNG LNGC 125 trips annually In permitting
Pembina Portland, OR Propane VLGC
24 to 36 trips annually In permitting
Temco Kalama, WA Grain Panamax
48 additional annually Expansion construction
through 2015
REFERENCES
Canpotex Port of Portland. 2014b. Minutes, Regular Commission Meeting. Available at:
http://www.portofportland.com/Library/Commission/Oct_2014_Fin_Minutes.pdf, accessed
November 19, 2014. October 8, 2014.

Vancouver Energy
11 February 2015
Page 5
Port of Portland. 2014c. Canpotex to invest at Port of Portland terminal. Available at:
http://www.portofportland.com/NewsRelease.aspx?newsContent=A_2014108115634RMCanpot
exNR46.ascx&topic=Marine%20News%20Release, accessed November 20, 2014. October 8, 2014.
Wall Street Journal. 2014. Canpotex expanding Portland, Ore., Marine Terminal. Available at:
http://www.wsj.com/articles/canpotex‐expanding‐portland‐ore‐marine‐terminal‐1412796970,
accessed January 26, 2015. October 8, 2014.
EGT, LLC EGT. 2012. EGT facility creates new export opportunities for American farmers. Available at:
http://www.egtgrain.com/news/release/egt‐facility‐creates‐new‐export‐opportunities‐for‐
american‐famers/, accessed on January 26, 2015. July 9, 2012.
Global Partners ODEQ. 2014. Response to Comments – Proposed Air Contaminant Discharge Permit (05‐0023‐
ST‐01) for Cascade Kelly Holdings LLC, dba Columbia Pacific Bio‐Refinery. Available at:
http://www.oregon.gov/deq/docs/CPBR_PermitResponseToComments.pdf, accessed November
19, 2014. August 19, 2014.
Port of St. Helens. 2014. Port of St. Helens Meeting Minutes. Available at:
http://www.portsh.org/meetings/Aug%2027%202014%20(2).pdf, accessed November 19, 2014.
August 27, 2014.
Haven Energy Port of Longview. 2014. Port of Longview negotiations on LPG terminal progressing. Available
at:
http://www.portoflongview.com/Portals/0/Documents/2014%20Sept.%20Haven%20Energy.pdf,
accessed November 19, 2014. September 9, 2014.
Kalama Export Company Gavilon. 2010. Kalama Export Company LLC announces expansion project. Available at:
http://www.gavilon.com/news/kalama‐export‐company‐llc‐announces‐expansion‐project,
accessed on January 27, 2015. February 17, 2010.
Port of Kalama. 2013. Fast Facts.
Port of Kalama. 2011. Trade Winds Newsletter, Winter 2011.
Kinder Morgan Port of Portland. 2013. Portland marine terminal upgraded for soda ash exports. Available at:
http://www.portofportland.com/publications/PortDispatch/post/SodaAsh.aspx, accessed
January 27, 2015. April 12, 2013.

Vancouver Energy
11 February 2015
Page 6
Millennium Bulk Terminals Cowlitz County and State of Washington Department of Ecology. 2014. Summary scoping
report, Millennium Bulk Terminals – Longview, SEPA environmental impact statement.
Available at: http://www.millenniumbulkeiswa.gov/assets/mbtl_sepa_scoping_report2_14.pdf,
accessed on November 19, 2014. February 2014.
Morrow Pacific Ambre Energy. 2012. Morrow Pacific project. Available at:
http://www.ambreenergy.com/morrow‐pacific‐project, accessed on January 26, 2015.
Morrow Pacific. 2014. E‐Newsletter – Project update: Appeal notices submitted to DSL.
Available at: http://morrowpacific.com/wp‐content/uploads/2014/10/MP_ENewsletter_Project‐
update‐Appeal‐notices‐submitted‐to‐DSL_91114.pdf, accessed November 19, 2014. September
11, 2014.
U.S. Army Corps of Engineers. 2012. Public notice for permit application, Corps No. NWP‐2012‐
56. March 6, 2012.
NW Innovation Works Port of Kalama. 2014. Determination of significance and request for comments on scope of EIS.
Available at: http://portofkalama.com/File.ashx?cid=2791, accessed November 19, 2014. October
31, 2014.
Oregon LNG CH2M Hill. 2013. Applicant‐prepared draft biological assessment and essential fish habitat
assessment for the Oregon LNG terminal and Oregon pipeline project, Docket Nos. CP09‐6‐001
and CP09‐7‐001. December 2013.
Oregon LNG. 2015. Project timeline. Available at: http://www.oregonlng.com/project‐timeline/,
accessed January 26, 2015.
Pembina City of Portland. 2015. Terminal 6 propane export facility zoning code and map amendments.
Available at: http://efiles.portlandoregon.gov/Record/7141966, accessed on January 26, 2015.
January 9, 2015.
Port of Portland. 2014a. Propane Exports Fueling Plans for Historic Investment in Portland.
Available at:
http://www.portofportland.com/NewsRelease.aspx?newsContent=A_20149262239RMPembina
NR49.ascx&topic=Marine News Release, accessed November 19, 2014. September 2, 2014.

Vancouver Energy
11 February 2015
Page 7
TEMCO Luck, Marissa. Temco grain terminal expansion nearly complete. Available at:
http://tdn.com/news/local/temco‐grain‐terminal‐expansion‐nearly‐complete/article_c3ebca44‐
7464‐11e4‐affc‐5f58cb34ceca.html, accessed on January 26, 2015. November 24, 2014.
Pittman, Justin. 2014. Temco grain terminal expansion on track for fall completion, officials say.
TDN.com. Available at: http://tdn.com/news/local/temco‐grain‐terminal‐expansion‐on‐track‐
for‐fall‐completion‐officials/article_de15bde8‐1132‐11e4‐b0f3‐0019bb2963f4.html, accessed on
November 19, 2014. July 21, 2014

APPENDIX D Validation of MARCS
DNV GL – Report No. PP111860-2 Appendix D, Rev. 5 – www.dnvgl.com Page D-i

Table of contents
1 MARCS VALIDATION ....................................................................................................... 2 1.1 Comparison of MARCS Results with Historical Accident Statistics ........................................... 3
DNV GL – Report No. PP111860-2 Appendix D, Rev. 5 – www.dnvgl.com Page D-1

1 MARCS VALIDATION It is always relevant to ask the question: Why do we believe the results of the model that are presented?
Demonstrating that a risk model is validated and that its results are verified is not a straightforward process. Like other computer models, risk models may reference 100s or 1000s of parameters and probably contain 1000s of lines of computer code. It is not practical, efficient or even desirable to validate such a model by manually checking input parameters or lines of code. DNV GL’s response to this legitimate question is described here.
When the models are first written and after any significant modifications, they are subject to manual checking. This includes checking the outputs from simple systems against analytical solutions (where possible) or against back-of-the-envelope estimates. Discrepancies are understood and either eliminated or documented. Following significant updates the outputs of the new model are checked against the old model and any discrepancies are understood and either eliminated or documented.
Models which have been used regularly over a longer period of time gain additional credibility. Different types of applications generate different problems which are then resolved through the work performed. Thus models that have been used extensively over a period of time gain credibility and hence validation. MARCS was first developed in the early 1990s. It has been used extensively since then by many different types of projects. As part of two different projects in the US in 1996 and 2010, the methods and results of MARCS have been subjected to third party academic peer review by the US National Academy of Sciences.
Risk models, like MARCS, often generate aggregate risk numbers (e.g. over an entire study area) and apportioned risk numbers (e.g. for different operations within a study area). Analysts perform check-sums to ensure that numbers derived by different parts of the calculation tool that should agree do in fact agree. This type of test is applied within a calculation case.
Risk models are also often applied to multiple cases where each case may be similar to each other but not identical. Often it is possible to estimate from the input parameters the relative magnitude of the results. Even if this is not possible, the analyst will have an expectation of how the model results should vary and these variations across case results are verified and any differences are understood.
The absolute predictions of risk models should be checked against historical accident experience (see Section 8.2). This can be subject to significant uncertainties, but nevertheless this is an important verification step for any risk model. Care should be taken with understanding these types of checks as some models are calibrated with historical data, thus for some models this may be a circular process. MARCS results are compared to historical accident data but the MARCS algorithms are not calibrated with historical data.
Finally, it is DNV’s view that the majority of the benefit of a risk model is derived from building the model and examining how its relative results vary with the inputs used. This promotes understanding of the key risk drivers and hence allows the identification of the more appropriate risk reduction options. The accuracy of the absolute prediction of risk is in many projects secondary to this understanding.
DNV GL – Report No. PP111860-2 Appendix D, Rev. 5 – www.dnvgl.com Page D-2

1.1 Comparison of MARCS Results with Historical Accident
Statistics
1.1.1 Purpose and Goals The review of historical accident statistics is an important task in most risk assessments. Location specific statistics provide an indication of the safety performance of the assessed system in the recent past with the currently applied controls. They also suggest the types of accidents that may be more likely to occur. Regional or worldwide statistics provide a more statistically significant indication of average safety performance of the sector under study (ship transportation in this case).
Comparison of location specific statistics with risk results calculated by MARCS can also provide assurance (or validation) that the risk model (data and methods applied) is reasonable. However there are many problems with making this comparison, as noted in this section, so weak agreement is often observed. This does not discredit the value of the risk model results for the reasons discussed in Section 1.1.2 below.
1.1.2 Linkage of Historical Accident Data to MARCS Results Usually the accident frequency (spilling and non-spilling accidents per year) is the most appropriate parameter to compare to historical accident data. This is because near miss data is not well reported and spilling accidents are relatively rare events (not statistically representative).
1.1.2.1 Categorisation of Accidents Different data sources are maintained for different reasons. This is the reason why the data recorded in different sources are usually different even without complications. There is rarely a simple relationship between the classes of reportable events used by different data sources and the major shipping accident types evaluated by MARCS.
1.1.2.2 Accuracy and Completeness of Reported Data An additional problem regarding accident data is the accuracy and completeness of the reported data. In many cases data can be incomplete, under reported or duplicated. Another problem results from inconsistent categorisation of reports over the recording period. This may be random (e.g. because several people categorise the reports) or may vary systematically (e.g. due to changes of policy). Often the use of a new data source for risk assessment purposes requires a “data review and cleaning” process, which is time consuming and in the worst case can lead to bias.
Whilst data are important to risk assessments they must always be used with critical evaluation.
1.1.2.3 Statistical Significance of Historical Accident Data The number of serious navigational accidents recorded in relatively small sea areas is often low. This is, of course, a good thing, but it does present challenges to risk assessment work. MARCS uses 7 main accident types. Ideally there should be at least 2-3 and preferably more than 5 accidents per accident type in order to get results with reasonable statistical significance. Ideally this number of accidents should be recorded within 5 to 10 years, otherwise changes in operational procedures or trades may introduce bias.
DNV GL – Report No. PP111860-2 Appendix D, Rev. 5 – www.dnvgl.com Page D-3

There are very significant challenges to comparing historical accident data with predictions made by MARCS and in general good agreement (to better than a factor of about 2 to 5) is not expected. This does not discredit the MARCS model or the results produced.
1.1.3 Justification of use of Worldwide Data as the basis for MARCS The reasons cited above provide ample justification for the use of worldwide historical accident data to form the basis of the accident parameters used in MARCS. Furthermore, DNV GL considers that the international nature of the shipping business provides further justification of this approach.
It should be noted that the worldwide accident data are used in a very specific way. In general, MARCS calculates accident frequencies from:
• The frequency of critical situations: This is calculated from the local traffic levels in the study area taking account of study area specific risk controls and study area specific environmental data. This is a local calculation.
• The probability of an accident given a critical situation: These probability factors are calculated from worldwide historical accident data.
Thus MARCS uses only local data when it can and combines this with data derived from worldwide historical accidents where there is no reasonable alternative.
1.1.4 Modification Factors for MARCS Parameters For the majority of marine risk assessments the use of unmodified accident parameters derived from worldwide data is sufficient, supplemented by generic modifications for RROs as discussed in Section 6 of the main report. If this is not considered to be sufficient then it is possible to perform additional work to modify the accident parameters used in the risk assessment. A range of approaches are possible, such as:
• Application of expert judgement factors to one or more risk parameters: If there are identified specific reasons to modify risk parameters this can be done provided this is documented and justified.
• Use of audit methods: DNV GL has performed formal audits of shipping companies to provide an objective assessment of the quality of their safety management systems. We have then used these results to modify the risk model parameters on a company specific basis.
The use of unmodified marine risk parameters is usually justified because the main value of a risk assessment is not derived from the absolute risk results, but instead comes from the relative results (such as which accident type dominates the risk profile).
DNV GL – Report No. PP111860-2 Appendix D, Rev. 5 – www.dnvgl.com Page D-4


APPENDIX E Description of the MARCS Incident Frequency Model
DNV GL – Report No. PP111860-2 Appendix E, Rev. 5 – www.dnvgl.com Page E-i

1 INTRODUCTION: DESCRIPTION OF THE MARCS MODEL Transportation by sea using conventional shipping operations results in both economic benefits and associated ship incident risks, which can result in safety and environmental impacts. Analysis of historical ship incident data indicates that almost all open-water shipping losses (with the exception of causes such as war or piracy) can be categorized into the following generic incident types:
• Ship-to-ship collision. • Powered grounding (groundings which occur when the ship has the ability to navigate safely yet goes
aground). • Drift grounding (groundings which occur when the ship is unable to navigate safely due to mechanical
failure). • Structural failure / foundering whilst underway. • Fire / explosion whilst underway. • Powered ship collision with fixed marine structures such as platforms or wind turbines (similar
definition to powered grounding). • Drifting ship collision with fixed marine structures such as platforms or wind turbines (similar
definition to drift grounding).
These generic incident types effectively represent the results of a high level marine transportation hazard identification (HAZID) exercise and are applicable for most marine transportation systems.
The marine transport incident frequency assessment can be performed by assessing the frequency of the above incident types in a defined study area. DNV GL has developed the MARCS model (Marine Accident Risk Calculation System) to perform such marine transport risk analyses in a structured manner. The analysis results can then be assessed to determine if the estimated incident frequencies are acceptable or if mitigation measures are justified or required.
Two versions of MARCS were developed to address different traffic systems. The version of MARCS used for this study is used to perform marine transport risk analyses for river systems. As with all risk-predictive models, MARCS is necessarily conservative, that is, when inputs of calculations are uncertain, the goal is to have any resulting error result in a slightly greater estimate than reality should bear out. Two attempts are offered in this report to provide perspective on the level of conservatism. They are model validation, presented in Appendix E, and comparison to actual values, presented in Section 6.2.1.2 of the main report.
DNV GL – Report No. PP111860-2 Appendix E, Rev. 5 – www.dnvgl.com Page E-1

2 INTRODUCTION TO MARCS
2.1 Overview The MARCS incident frequency model provides an estimate of the frequency incidents that may occur at sea. A block diagram of the model is shown in Figure 2—1.
Figure 2—1 Block Diagram of MARCS Incident Frequency Model
The MARCS model classifies data into four main types:
• Shipping lane data describes the movements of different marine traffic types within the study area. • Environmental data describes the conditions within the calculation area, including the location of
geographical features (land, offshore structures, etc.) and meteorological data (visibility, wind rose, water currents and sea state).
• Internal operational data describes operational procedures and equipment installed onboard ship – such data can affect both incident frequency and incident consequence factors.
• External operational data describes factors external to the ship that can affect ship safety, such as Vessel Traffic Systems (VTS), Traffic Separation Schemes (TSS), and the location and performance of emergency tugs – such data can affect both incident frequency and incident consequence factors.
2.2 Critical Situations To calculate the incident frequency, MARCS first identifies critical situations. The definition of a critical situation varies with the incident type; see Section 4. It calculates the location dependent frequency of critical situations (the number of situations which could result in an incident – ‘potential incidents’ – at a location per year).
Fault tree analysis (see, for example, Ref. /1/ or Ref. /2/) can be described as an analytical technique, whereby an undesired state of a system is specified, and the system is then analyzed in the context of its environment and operation to find all credible ways in which the undesired event can occur. This undesired
DNV GL – Report No. PP111860-2 Appendix E, Rev. 5 – www.dnvgl.com Page E-2

state is referred to as the top event of the fault tree. It expresses the frequency or probability for the occurrence of this event or incident.
The basic events of a fault tree are those events that make up the bottom line of the fault tree structure. To perform calculations of the top frequency or probability of a fault tree, these basic events need to be quantified.
The fault tree structure is built up by basic events and logical combinations of these events that are expressed by AND and OR gates. The outputs of these gates are new events, which again may be combined with other events / basic events in new gates. The logic finally results in the top event of the fault tree. For example, fire occurs if combustible material AND air / oxygen AND an ignition source are present.
The different symbols in the fault tree are defined in Figure 2—2.
Figure 2—2 Fault Tree Symbols
The OR gate (Figure 2—3) expresses the probability of occurrence of Event 1 or Event 2, and is calculated as the sum minus the intersection of the two events:
P(Event 1 OR Event 2) = P1 + P2 - P1*P2
Usually the intersection probability can be neglected, as it will be a very small number (if P1 = P2 = 10-2, then P1*P2 = 10-4).
OR - gate
AND - gate
description of initial event, gate or top event
Transfer symbol to another part of the tree
OR - gate
AND - gate
description of initial event, gate or top event
Transfer symbol to another part of the tree
DNV GL – Report No. PP111860-2 Appendix E, Rev. 5 – www.dnvgl.com Page E-3

Figure 2—3 OR Gate
The AND gate (Figure 2—4) expresses the probability that Event 1 and Event 2 occur simultaneously, and is calculated as the product of the two events:
P(Event 1 AND Event 2)= P1*P2
Figure 2—4 AND Gate
It should be emphasized that the quality of the results produced by fault tree analysis is dependent on how realistically and comprehensively the fault tree model reflects the causes leading to the top event. Of course, it is never possible to fully represent reality, and therefore the models will always only represent a simplified picture of the situation of interest. The top event frequencies will generally be indicative, and hence relative trends are more reliable than the absolute values.
Fault tree models have been constructed to assess a number of parameters within MARCS, including collision probabilities per encounter (collision model) and failure probabilities to avoid a powered grounding given a critical situation (powered grounding model) (Ref. /3/; Ref. /4/).
event 2event 1
event 1 or event 2
event 2event 1
event 1 or event 2
event 2event 1
event 1 and event 2
event 2event 1
event 1 and event 2
DNV GL – Report No. PP111860-2 Appendix E, Rev. 5 – www.dnvgl.com Page E-4

3 DATA USED BY MARCS
3.1 Traffic Image Data The marine traffic image data used by MARCS is a representation of the actual flows of traffic within the calculation area. Marine traffic data is represented using lane data.
The following data items are defined for all lanes:
• The lane number (a unique identifier used as a label for the lane). • The lane directionality (one-way or two-way). • The annual frequency of ship movements along the lane. • A list of waypoints. • The vessel size distribution on the lane.
Additional data may be attached to the lane, such as: the hull type distribution (single hull, double hull, etc.) for tankers; the loading type (full loading, hydrostatic loading) for tankers; ship type, etc.
Detailed surveys of marine traffic in UK waters in the mid-1980s (Ref. /5/) concluded that even in open water, commercial shipping follows fairly well-defined shipping lanes, as opposed to mainly random tracks of individual ships. The narrowness of rivers hinders random tracks of individual ships, therefore MARCS characterizes shipping lanes as lines.
The marine traffic description used by MARCS is completed by the definition of additional parameters for each type of traffic:
1. Average vessel speed (generally 8 to 18 knots). 2. Location-specific speed (where the ships are known to slow down or go faster). 3. Types of vessels. 4. Risk reducing measures or restrictions that apply per vessel type.
3.2 Internal Operational Data Internal operational data is represented within MARCS using either worldwide data or frequency factors obtained from fault tree analysis or location specific survey data. Fault tree parameters take into consideration factors such as crew watchkeeping competence and internal vigilance (where a second crew member, or a monitoring device, checks that the navigating officer is not incapacitated). Examples of internal operational data include:
• The probability of a collision given an encounter. • The probability of a powered grounding given a ship’s course close to the shoreline. • The frequency (per hour at risk) of fires or explosions.
Internal operational data may be defined for different traffic types and / or the same traffic type on a location-specific basis.
DNV GL – Report No. PP111860-2 Appendix E, Rev. 5 – www.dnvgl.com Page E-5

3.3 Environmental Data The environmental data describes meteorological conditions (visibility, wind rose, sea currents and sea state).
Poor visibility is defined as restriction of visibility by fog, snow, rain or other phenomena to less than 2 nautical miles. It should be noted that night-time is categorized as good visibility unless, for example, fog is present.
Wind rose data is divided into four wind speed categories: calm (0 to 20 knots, Beaufort 0 to 4); fresh (20 to 30 knots, Beaufort 5 to 6); gale (30 to 45 knots, Beaufort 7 to 9); and storm (greater than 45 knots, Beaufort 10 to 12). Sea state (wave height) within MARCS is inferred from the wind speed and the nature of the sea area (classified as sheltered, semi-sheltered or open water).
DNV GL – Report No. PP111860-2 Appendix E, Rev. 5 – www.dnvgl.com Page E-6

4 DESCRIPTION OF ACCIDENT FREQUENCY MODELS This section describes how input data (traffic image, internal operational data, external operational data and environment data) is used to calculate the frequency of serious incidents in the study area.
4.1 The Collision Model The collision model calculates the frequency of serious inter-ship powered collisions at a given geographical location in two stages. The model first estimates the frequency of encounters (critical situations for collision - when two vessels pass within 0.5 nautical miles of each other) from the traffic image data using a pair-wise summation technique, assuming no collision avoiding actions are taken. This enables the calculation of either total encounter frequencies, or encounter frequencies involving specific vessel types.
Second, the model applies a probability of a collision for each encounter, obtained from fault tree analysis, to give the collision frequency. The collision probability value depends on a number of factors including, for example, visibility or the presence of a Pilot.
Figure 4—1 shows a graphical representation of the collision model.
Figure 4—1 Graphical Representation of the Collision Model
In Figure 4—1, d1 is the density of traffic associated with Lane 1 (Ship 1 direction) at the location (x, y). The frequency of encounters at location (x, y) is proportional to the product of d1, d2 and the relative velocity of ships in each lane.
DNV GL – Report No. PP111860-2 Appendix E, Rev. 5 – www.dnvgl.com Page E-7

4.2 The Powered Grounding Model The powered grounding model estimates the frequency of powered grounding incidents by calculating the frequency of critical situations, as illustrated in Figure 4—2. Critical situations arise when a course change point (waypoint) is located such that failure to make the course change would result in grounding within 20 minutes navigation from the planned course change point if the course change is not made successfully.
The frequency of powered groundings is calculated as the frequency of critical situations multiplied by the probability of failure to avoid grounding.
Figure 4—2 Graphical Representation of the Powered Grounding Model
The powered grounding probabilities are derived from the fault tree analysis of powered grounding as a result of failure to make a course change whilst on a dangerous course. A dangerous course is defined as one that would ground the vessel within 20 minutes if a course change were not made (see Figure 4—2). The powered grounding frequency model takes into account internal and external vigilance, visibility and the presence of navigational aids (e.g., radar) in deducing failure parameters.
DNV GL – Report No. PP111860-2 Appendix E, Rev. 5 – www.dnvgl.com Page E-8

4.3 The Drift Grounding Model The drift grounding frequency model is illustrated in Figure 4—3.
Figure 4—3 Graphical Representation of the Drift Grounding Model
The drift grounding frequency model consists of two main elements: first, the ship traffic image is combined with a ship breakdown frequency factor to generate the location and frequency of vessel breakdowns; second, the recovery of control of a drifting ship can be regained by one of three mechanisms:
• Repair. • Emergency tow vessel assistance.
A drifting ship that is not saved by one of these mechanisms (and does not drift out into the open sea) contributes to the serious drift grounding incident frequency results.
The number and size distribution of ships which start to drift is determined from the ship breakdown frequency, the annual number of transits along the lane and the size distribution of vessels using the lane. The proportion of drifting vessels that are saved (fail to ground) is determined from the vessel recovery models.
Implicit in Figure 4—3 is the importance of the time taken for a ship to drift aground. When this time is lengthy (because the distance to the shore is large and / or because the drift velocity is small) then the probability that the ship will recover control before grounding (via repair or tug assistance) is greater.
4.3.1 Repair Recovery Model Vessels that start to drift may recover control by effecting repairs. Figure 4—4 shows the model inputs regarding recovery from repair of a vessel. Data were derived under the SAFECO project by structured expert judgment principles (Ref. /3/; Ref. /4/). For a given vessel breakdown location, grounding location and drift speed, there is a characteristic drift time to the grounding point. The proportion of drifting vessels that have recovered control by self-repair is estimated from this characteristic drift time and the distribution of repair times.
DNV GL – Report No. PP111860-2 Appendix E, Rev. 5 – www.dnvgl.com Page E-9

Figure 4—4 Graphical Representation of the Self-Repair Save Mechanism
4.3.2 Recovery of Control by Emergency Tow Drifting vessels may be brought under control (saved from grounding) by being taken in tow by an appropriate tug. It should be noted that the tug save model assumes a save is made when the ship is prevented from drifting further towards the shoreline by the attachment of a suitable tug.
The tug model contains parameters to take explicit account of:
• The availability of a tug (some tugs have other duties). • The performance of a tug (identified as the maximum control tonnage for the tug) as a function of
wind speed and location (since the wind speed and the fetch control sea state).
4.4 The Structural Failure Model The structural failure / foundering incident frequency model applies incident frequency parameters derived from incident data or fault tree analysis with calculations of the ship exposure time to obtain the serious incident frequency. The structural failure / foundering parameters take into account the structural strength of some hull designs, such as double-hulled vessels.
The total ship exposure time (number of vessel hours) in any area for a given wind speed category (used by MARCS to infer the sea state) can be calculated from the traffic image parameters (locations of lanes, frequencies of movements and vessel speeds) and the local wind speed parameters. The serious structural failure / foundering frequency is then obtained by multiplying these vessel exposure times by the appropriate structural failure frequency factor for the wind speed (sea state) category.
4.5 The Fire and Explosion Model The fire / explosion incident frequency model applies the incident frequency parameters derived from incident data or fault tree analysis with calculations of the ship exposure time to obtain the serious incident frequency. The total ship exposure time (number of vessel hours) in any area can be calculated from the traffic image parameters (locations of lanes, frequencies of movements and vessel speeds). The fire / explosion serious incident frequency is then obtained by multiplying these vessel exposure times by the
00.10.20.30.40.50.60.70.80.9
1
0 10 20 30
Rep
air P
roba
bilit
y
Repair Time (Hours)
DNV GL – Report No. PP111860-2 Appendix E, Rev. 5 – www.dnvgl.com Page E-10

appropriate fire / explosion frequency factor (incidents per vessel-hour). It should be noted that fire / explosion frequency factors are assumed to be independent of environmental conditions outside the vessel.
DNV GL – Report No. PP111860-2 Appendix E, Rev. 5 – www.dnvgl.com Page E-11

5 REFERENCES /1/ E. J. Henley and H. Kumamoto, “Reliability Engineering and Risk Assessment,” Prentice-Hall Inc.,
1981.
/2/ R. M. Cooke, “Methods and Code for Uncertainty Analysis”, UNICORN, AE Technology, TUDelft, 1995.
/3/ SAFECO I: “Safety of Shipping in Coastal Waters (SAFECO I) Summary Report,” DNV 98-2038, 1998.
/4/ SAFECO II: “Safety of Shipping in Coastal Waters (SAFECO II) Summary Report,” DNV 99-2032, 1999.
/5/ HMSO, “Shipping routes in the area of the UK continental shelf: Offshore technology report,” OTH 85 213, HMSO, March 1985.
DNV GL – Report No. PP111860-2 Appendix E, Rev. 5 – www.dnvgl.com Page E-12