quantitative risk assessment: a critique · quantitative risk assessment: a critique1 ... 2 see for...
TRANSCRIPT

Working Paper 25
Quantitative risk assessment: a critique1
Andrew Hopkins Associate Member, National Research Centre for Occupational Health and Safety Regulation, Regulatory Institutions Network, Research School of
Social Sciences, Australian National University
April, 2004
1 I am indebted to Mark Tweeddale for his detailed comments on this paper.

About the Centre The National Research Centre for Occupational Health and Safety Regulation is a research centre within the Regulatory Institutions Network (RegNet), in the Research School of Social Sciences, at the Australian National University. The Centre is funded by the National Occupational Health and Safety Commission (NOHSC).
The aims of the Centre are to: • conduct and facilitate high quality empirical and policy-focused research
into OHS regulation, consistent with the National OHS Strategy; • facilitate and promote groups of collaborating researchers to conduct
empirical and policy-focused research into OHS regulation in each of the States and Territories;
• facilitate the integration of research into OHS regulation with research findings in other areas of regulation;
• produce regular reports on national and international developments in OHS regulation;
• develop the research skills of young OHS researchers; and • assist in the development of the skills and capacities of staff of the
NOHSC Office.
In order to achieve these aims the Centre undertakes research, supports a consortium of OHS regulation researchers in Australia, assists in the development of skills and capacities of staff of NOHSC staff and collaborates in research programs with other Australian and international researchers and research centres.
Address for correspondence:
National Research Centre for Occupational Health and Safety Regulation Regulatory Institutions Network (RegNet) 1st Floor Garden Wing, University House The Australian National University Canberra ACT 0200 Ph (02) 6125 1514 Fax (02) 6125 1507 Email [email protected] Web http://ohs.anu.edu.au
ii

The aim of risk management is identify and reduce risks. But how far do managers need to go in reducing the level of risk? How low is low enough? The law provides one answer to this question. Risks must be reduced “so far as is reasonably practicable”2. A great deal has been written about what this means, and although no clear cut criteria have emerged, there is general agreement about what needs to be considered3. One consideration is the severity of the risk: how serious are the possible consequences? Another is the question of foreseeability: would a reasonable employer4 have been able to foresee what might happen? A third consideration is whether means are available to control the risk and a fourth is whether the cost of installing these controls is justified in the circumstances. According to one influential view, if there is a “gross disproportion” between the cost of the precautions and the level of risk, that is, if the risk is insignificant in relation to the financial sacrifice involved in rectifying it, a reasonable employer is not bound to take the precautions in question5. These considerations do not generate a set of rules which can be automatically applied to determine whether the risk is as low as is reasonably practicable, and ultimately a judgment must be made in each situation about what a reasonable employer would do. Such judgments are to some extent subjective, which is not to say that they are arbitrary. One guide which courts use as to what is reasonably practicable is current good practice in the industry6. Employers who fail to comply with current good practice are likely to be found not to have done what was reasonably practicable, should the issue arise. One implication of this is that what is reasonably practicable will vary, from industry to industry, and over time, as industry standards improve. It is not a concept which can ever be given a fixed meaning. Anglo-Saxon law is content with this approach. There is a general assumption in the common law that inflexible principles cannot be laid down in advance, that human circumstances are too varied and complex to be reducible to any formula, that each case has to be considered on its merits, and that the law evolves as a result of case by case decision making. Only after a series of cases has been decided can general principles be discerned, but these are always provisional and subject to modification as new cases arise.
2 See for example, the UK Health and Safety at Work Act, 1974, section 2(1). In the state of Victoria, risks must be reduced “so far as is practicable” but the way this is defined makes it clear that there is no significant difference between the two tests. 3 See discussion in R Johnstone, Occupational Health and Safety Law and Policy (Law book Company, Sydney, 1997), pp202-17. 4 It is not only employers who have a duty of care, but for ease of exposition at this point I shall use the term employer rather than the more accurate but more cumbersome term, duty-holder. 5 Edwards v. The National Coal Board (1949) 1 All ER 743, quoted in HSE (Health and Safety Executive), Reducing Risks, Protecting People, HSE’s Decision Making Process (HMSO, Norwich, 2001) p62 6 A Brooks, Occupational Health and Safety Law in Australia (CCH, Sydney,1993), p82.

On the other hand, Western civilization is characterized by a drive for consistency and systematization7, and from this perspective, the common law approach to deciding what level risk is low enough appears unacceptably arbitrary and subjective. Hence the trend towards quantitative risk assessment (QRA). The premise of QRA is that if levels of risk can be estimated numerically, we can specify an acceptable upper limit and require managers to drive risk below this level. Provided the determination of the acceptable numerical level is agreed beforehand and is based on some coherent reasoning, this is presumed to be a more objective and hence more satisfactory way of deciding how low is low enough. This thinking has emerged in industries such as nuclear power, petroleum production, and railways, and is driven, in part, by regulators seeking objective ways of justifying their demands that companies carry out further risk reduction activities8. It is, however, intuitively obvious that where risk is being imposed on workers, or passengers, or members of the public, the concept of acceptable risk is contentious. “Acceptable to whom?” we are entitled to ask. Moreover, to say in some context that a risk is acceptable is to say that it is not worth spending money to further reduce it. Thus the notion of acceptable risk carries with it an implicit notion of the value of a human life, again an obviously contentious idea. Quantitative risk assessment therefore poses profound moral dilemmas, as well as a variety of other conceptual and practical problems. The aim of this chapter is to examine some of these problems, as they have emerged in current attempts to apply the QRA framework. Before moving on, it should be recognized that the moral dilemmas which confront QRA are inherent in the legal approach as well. But they remain dilemmas, which are never finally resolved. QRA on the other hands purports to resolve the dilemmas by developing objective criteria to decide whether risks are low enough. This apparent claim to objectivity amounts to a denial of dilemma and contributes to the controversy about QRA. Objective and subjective risk QRA is built on the assumption that risk can be objectively measured. This often associated with a second assumption, that if subjective perceptions of risk do not coincide with the objective measures, the subjective perceptions must be wrong. These assumptions are thoroughly problematic. Subjective perceptions are not just imperfect estimates of an objective reality. They exist independently of measured risk and may indeed influence it. Consider this. The road accident fatality rate for children has steadily declined in the UK, leading some observers to conclude that the roads are safer for children than they used to be9. However, half of all children killed on the roads are pedestrians10, and one reason for the drop in the fatality rate
7 R Bendix, Max Weber: An Intellectual Portrait, (Methuan, London, 1966) 8 The emergence of QRA was endorsed in the Cullen report into the fire on the Piper Alpha platform in the North Sea. 9 J. Adams, Risk, (University College of London Press, 1995), p 12 10 British Medical Association, BMA Guide to Living with Risk, (Harmondsworth: Penguin, 1990)
2

is that parents have become increasingly concerned about their children being hit by cars. Adams notes that “in 1971, for example, 80 per cent of seven and eight year old children in England travelled to school on their own, unaccompanied by an adult. By 1990 this figure had dropped to 9 per cent; the questionnaire survey disclosed that the parent’s main reason for not allowing their children to travel independently was fear of traffic.”11 The growing perception that roads were dangerous places had altered behaviour in such a way as to reduce the measured fatality rate. Pedestrian road crossings provide an interesting example of the effect of risk perception. Casual observation suggests that pedestrians are less likely to be on the lookout for oncoming traffic when they step out onto a pedestrian crossing than when they step out to cross a road at some other point. Some pedestrians seem almost oblivious to the possibility that a car may fail to stop at a crossing. If it turned out that, by some measure, the number of pedestrians hit by cars on crossings was disproportionately high, we would be unlikely to conclude that using pedestrian crossings was objectively riskier than crossing at unmarked locations. Rather we would conclude that the reason for the disproportionate number of accidents at crossing was that pedestrians at crossings were tending to drop their guard. Adams describes another important way in which risk perceptions can influence objective risk indicators. He outlines a theory of risk compensation, which assumes that everyone has a level of risk taking behaviour with which they are comfortable and that this varies from one individual to another12. One consequence of this is that if the authorities reduce the risk to which we are exposed, we may adjust our behaviour to restore the level of risk with which we are comfortable. Consider the following. Many drivers travel on country roads as fast as, in their judgment, the road allows. If a government attempts to make such a road safer by widening it and straightening out the worst bends – removing the black spots - most drivers respond by driving faster, as fast as, in their view, the improved road allows. Quite possibly in these circumstances the accident rate will not decrease, and the fatality rate may even increase, because with cars traveling at higher speed the proportion of accidents that result in fatalities is likely to increase. Driver perceptions are that this is now a safer road, which no doubt it is, controlling for speed, but those very perceptions increase the risk of fatality. This discussion demonstrates that objective or measured risk is strongly influenced by our perceptions and that the relationship may be surprisingly complex. Accident rates may be low because the perceived risk is high and conversely, rates may increase because the perceived risk has declined13.
11 Adams, op cit, p13 12 Adams, op cit, p14-16 13 A more complete discussion of the problematic nature of objective risk can be found in N Pidgeon, C Hood, D Jones, B Turner and R Gibson “Risk perception”, Chapter 5 in Risk analysis, Perception and Management: Report of a Royal Society Study Group, 1992, London, The Royal Society, pp94-97
3
Risk and rate The preceding discussion demonstrates a second, quite intriguing aspect of the relationship between objective and subjective risk, namely, that our willingness to interpret fatality rates as indicators of risk is substantially affected by our perception of the intrinsic risk of the activity. No-one seriously believes that roads are safer places for children to play on or near simply because accident rates have gone down. Moreover, we believe that crossing a road at a pedestrian crossing is intrinsically safer than crossing elsewhere, regardless of what the statistics might show. The situation is nicely illustrated by an Australian study of the risks associated with a number of activities, including football14. Using estimated player populations as its denominator, it found that the fatality rate per million person-years for rugby union and league combined was 29, while the corresponding figure for touch football was 37. Touch football prohibits tackling, yet, on the numbers, it is a riskier activity than rugby. This flies in the face of reason. We all “know” that rugby is intrinsically riskier than touch football and this is a case where we are not prepared to accept the objective rates as indicators of intrinsic risk. The author of the study offered no explanation for this anomaly, but we can certainly imagine one. Touch football attracts players who may be quite unfit and disproportionately likely to suffer fatal heart attacks on the field. Such a possibility would enable us to make sense of the apparently higher risk involved in what we believe to be an intrinsically safer activity15. Risk, then, is not another word for rate. We can accept that the fatality rate for touch football may be higher than the rate for rugby, and then set about explaining why. But we are unlikely to accept that touch football is a riskier activity than rugby. A further reason for distinguishing between risk and rate is that risk is always highly dependent on the specific situation. For instance, the death rate from lightening strike is less than one person per million per annum16. If this is taken as an indicator of risk we conclude that the risk of death by lightening strike is insignificant. On a clear day, that is unarguable, but if one is caught in a violent electrical storm, it is surely prudent to take reasonable risk reduction measures, for example by staying in the open and not seeking shelter under a tree. The overall rate is no guide to the risk we face in these circumstances. The meaning and relevance of the concepts of risk and rate depend to some extent on one’s vantage point. Suppose we are talking about an insurance company which has insured car owners against accidents. It needs to know the overall accident rate so that it can set its premiums in such a way as to cover all claims and stay in business. For the insurance company, risk of accident and accident rate mean much
14 D. J. Higson, “Risks to Individuals in NSW and in Australia as a Whole”, Australian Nuclear Science and Technology Organisation, Lucas Heights, July 1989, unpublished paper, p9 15 Another possible explanation is that the difference is not statistically significant. 16 A calculation in the UK puts the figure at 1 in 18,700,000. HSE, op cit. p70
4

the same thing17. Moreover, if it charges all drivers same premium, this is simply an expedient way of covering the financial risk to which it is exposed and involves no assumption that all drivers are equally at risk of having an accident. As far as the company is concerned the real risk which any individual faces is irrelevant. If the company’s data allow it to identify groups, for example age groups or gender groups, whose accident rates differ systematically, it may decide to offer different premiums to different groups, but again, these premiums will be set in accordance with the overall accident rate of the group and without any presumption that this is the actual risk faced by any particular individual in the group. From the point of view of the individual driver, however, it is the accident rates which are irrelevant, since they provide no indication of the risk inherent in any particular situation. That will depend on all the circumstances and is quite unknowable in any quantitative sense. That is not to say that that there is nothing we can do as individual drivers to reduce the risks we face. Various risk reduction strategies are available to us, such as driving more slowly around corners, avoiding travel on holiday weekends, and so on. We may not be able to quantify the effectiveness of these strategies but we know by a priori reasoning that they will reduce the risk we face. In short, although the level of risk involved in any such course of action cannot be known numerically, we quite reasonably make qualitative estimates and act accordingly. The preceding discussion has demonstrated that it is often necessary to distinguish between risk and rate. Rates are measurable; risks often are not. This casts doubt on the whole enterprise of QRA, as will become apparent at various points in later discussion. Having made the distinction between risk and rate, I shall nevertheless use the terms interchangeably in what follows, for ease of expression, unless the context dictates otherwise. Determining numerical risk limits The risk of fatality is often expressed as a ratio, for example 1 in 104, or an equivalent rate, 10-4 (.0001), in both cases, per annum. What this means, in this example, is that on average we expect one fatality per year for every 10,000 exposed individuals. What rate, then, is acceptable? A recent article by Swiss authors Fleuler and Seiler provides an elegant and reasonably coherent answer to this question which I shall take as representative of thinking on this matter. 18 They propose two rules. The first is that there be an absolute upper limit on the risk to which individuals are to be exposed. Anything above this is intolerable from a moral point of view and cannot be justified, no matter what societal advantage there may in exceeding this limit. Second, risk should be reduced as far below this absolute limit as is cost effective. Whereas the first rule is morally based, the second
17 The financial risk is different. 18 T Flueler and H Seiler, “Risk-based regulation of technical risks: lessons learnt from case studies in Switzerland”, Journal of Risk Research 6(3):213-231 (2003).
5

is based on utilitarian considerations: risk reduction is required only if it is judged to be financially justified. I shall say about more about this later. So what is the limit beyond which it is morally intolerable to impose risk? Fleuler and Seiler argue that it varies for different categories of risk and they identify four such categories. Category 1: voluntary risk exposure in order to satisfy one’s own desires, e.g. dangerous sports Category 2: high degree of choice involving direct individual benefit, e.g. car driving Category 3: low degree of choice, individual benefit, e.g. working conditions Category 4: involuntary, imposed risk, no direct benefit, e.g. dangerous installation located in neighbourhood. These categories vary in the extent to which the victim is responsible for his or her own exposure: at one extreme participants in dangerous sports such as rock climbing are entirely responsible for their own exposure; at the other extreme, if the authorities choose to locate a nuclear power station in one’s neighbourhood, there is little one can do about the risk, short of selling up and moving away. Fleuler and Seiler nominate limits ranging from 10-3 to 10-5 as being appropriate19: for a risk which is totally imposed and provides no direct benefit for the exposed person, category 4 risks, the limit of tolerability is 1 in a 100,000 (10-5) while for category 2 risks, such as car driving, the limit of tolerability is one death in a thousand (10-3). They suggest it may be inappropriate to specify any risk level as intolerable for people who voluntarily engage in dangerous sports. To do so, it could be argued, would be an unwarranted interference with freedom of choice. Fleuler and Seiler acknowledge that the limits of tolerability which they specify are based on normative or value judgments20, but they also claim that these judgments are guided by empirical considerations, in the following way. First, their proposed limits correspond roughly to the actual risk levels in their own country, Switzerland. In a sense, these are the rates which Swiss society already accepts. Second, the limits of tolerability are in part set by reference to the overall risk of death to which we are subject from all sources, including disease. The age group with the lowest death rate per annum from all causes is 10 to 15 year olds; their death rate is about one in 10,000 (10-4). For adults in the prime of life the death rate is more like 1 in a thousand (10-3)21. Fleuler and Seiler argue that the imposed risk is acceptable as long as it is small in relation to overall risk of death. As they put it, “the philosophy requires not to unduly increase this natural lethal risk by technical risks” 22. From this they derive the limit of 10-5 per year for imposed risk, the logic being that is order of magnitude lower than the lowest age-specific death rate. 10-5 is thus a baseline, appropriate for imposed risks, and higher levels of risk are tolerable to the extent that the activity involves an element of choice. The authors do not, however,
19 Unless otherwise indicated, risks are per annum. 20 op cit p218 21 HSE, op cit, p 69. See also M Tweeddale, Managing Risk and Reliability of Process Plants, (Gulf, Boston, 2003) p 71 22 Flueler and Seiler, op cit, p218
6

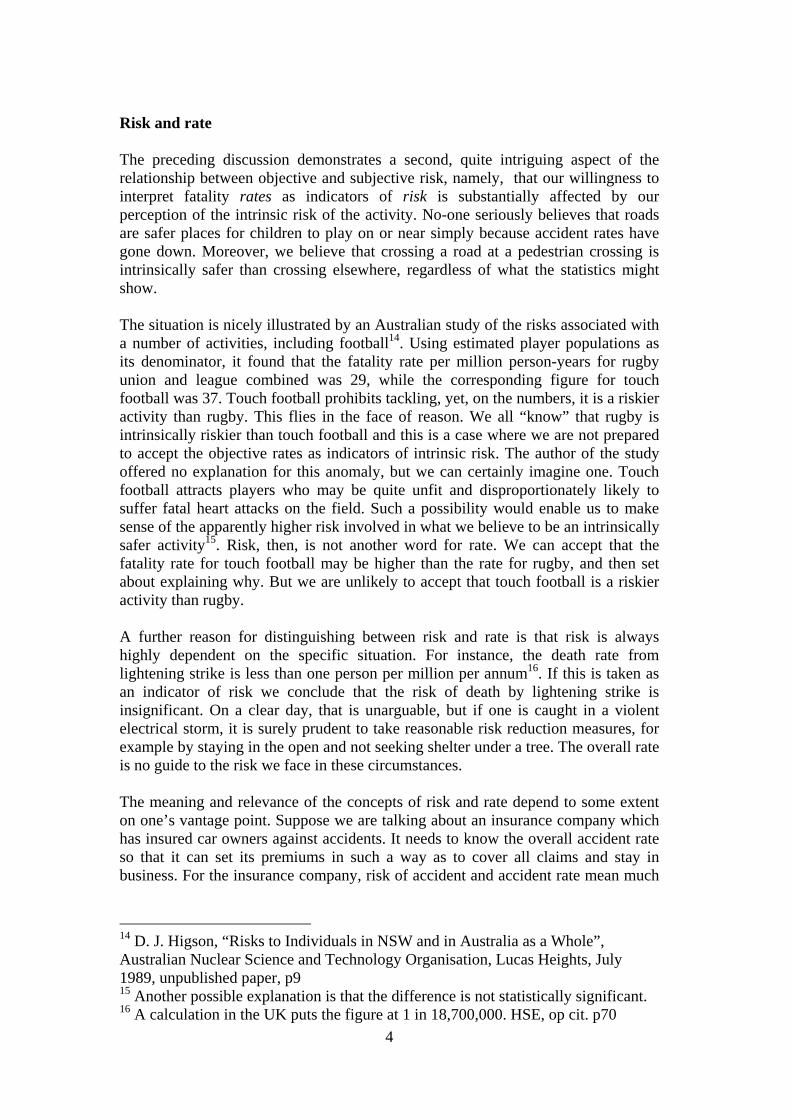
provide any way of quantifying degree of voluntariness or associating degree of voluntariness with the acceptable numerical risk level, so the levels they propose remain somewhat arbitrary. This style of thinking has been given an authoritative stamp by the OHS regulator in the UK, the Health and Safety Executive (HSE), which has produced an influential document, Reducing Risks, Protecting People. But whereas Fleurer and Seiler have essentially only two levels of risk: tolerable and intolerable, the HSE has three: intolerable, tolerable and acceptable. See figure 1.
At the highest level, if a risk is deemed intolerable, the activity is ruled out, unless a way can be found to reduce it to the point that it falls into one of the lower levels. Within the tolerable region, risks must be assessed and controlled, so far as reasonably practicable, which is to say, efforts must be made to reduce them as long as the cost of those efforts is not grossly disproportionate to the benefits. This is precisely the legal test discussed above, but it is referred to in HSE document as the ALARP principle - as low as reasonably practicable. At the bottom of the scale is the broadly acceptable region. According to the HSE, “risks falling into this region are generally regarded as insignificant and adequately controlled…. The levels of risk characterising this region are comparable to those that people regard as insignificant or trivial in their daily lives”23. This comment would suggest that risks in this region can be ignored. The HSE says explicitly that “we, as regulators would not usually require further action to reduce (such) risks”, but it immediately goes on, “unless reasonably practicable measures are available”. There is a paradox associated with this last statement. The law requires that risks be reduced as far as reasonably practicable, regardless of the starting point, and it is 23 HSE, op cit, p 43
7

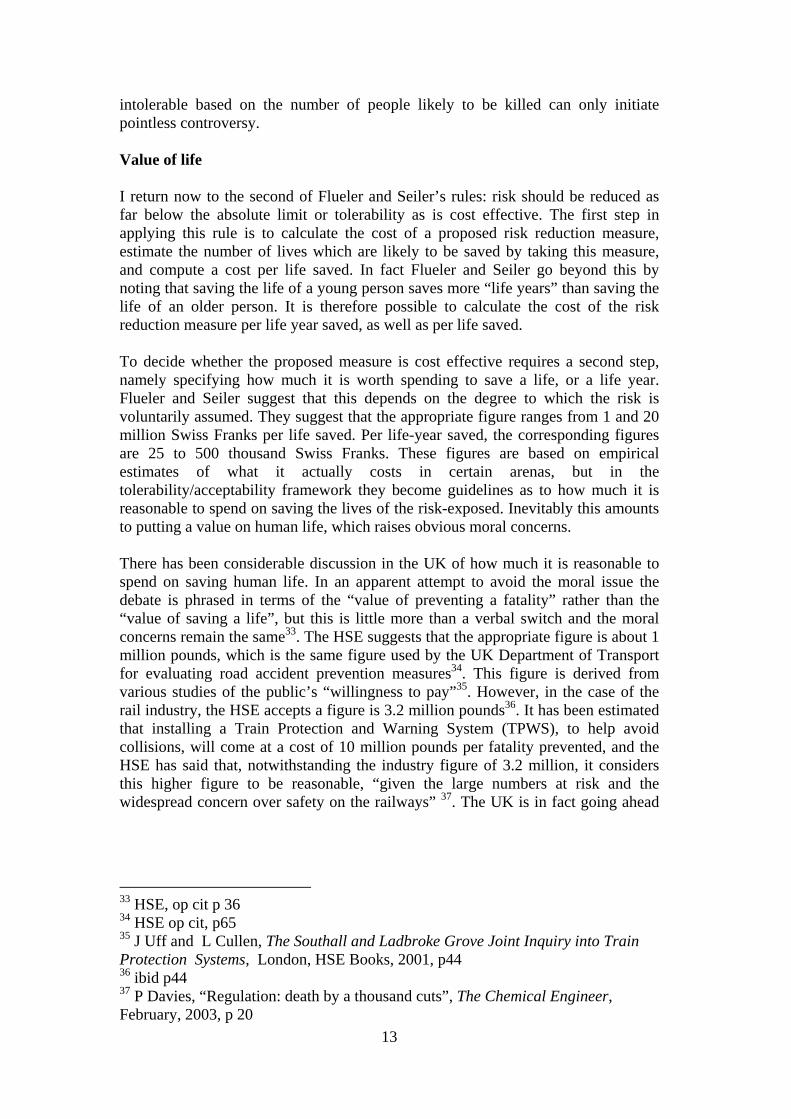
therefore appropriate for the HSE to note that even in the region of acceptability employers should aim for further risk reductions if it is reasonably practicable to do so. But if that is the case there is no real distinction between the regions of tolerability and acceptability: in both cases risks are to be kept as low as reasonably practicable. How is this paradox to be resolved by those seeking to follow the HSE framework? One obvious way is simply to ignore the ALARP requirement for the lowest risk category - acceptable risks. Proceeding in this way maintains the rationale of the three layered approach: intolerable risks must be reduced at all costs; tolerable risks should be reduced if reasonably practicable; acceptable risks require no further action. This is indeed how some companies have interpreted the framework. Figure 2 is an attempt by one major oil company to adapt the HSE framework for one of its offshore production platforms. It describes the region of tolerability as the ALARP region and it interprets broadly acceptable risk as requiring no further risk reduction.
The following example demonstrates this approach in action. A company with offshore petroleum production platforms had reduced the risk to its employees to the region of acceptability. It decided it wished to install another gas compressor on one of its platforms. Compressors bring with them an increased risk of fire, and risk engineers calculated that the installation of the compressor would increase the total risk to which employees on this platform were exposed to a level above the company’s stated goal for its employees. It turns out that the greatest risk to offshore production workers is the helicopter flights to and from the platform. Risk engineers therefore concluded that by altering the shift arrangement so as to reduce the number of helicopter flights to which workers were exposed they could bring the total risk exposure back below the acceptable limit.
8

The problem is that if it was reasonably practicable to reduce the number of helicopter flights after the installation of the compressor, it must have been reasonably practicable to do so beforehand. But the company did not consider doing so because the risk was already acceptably low. One would have to conclude that prior to the installation of the compressor, the company had failed to reduce the risk to its employees as far as reasonably practicable. For this company, as for the company which drew up figure 2, the ALARP principle did not apply once risks were below a certain level. I turn, now, to the numerical thresholds of these different regions of risk. The HSE argues that one in a million (10-6) is extremely low, in relation to the death rate for any age group in the whole population and should be regarded as acceptable for workers and public alike. It will be noticed in figure 2 that the petroleum company has set the threshold of acceptability at 10-5. The difference is probably not of much practical significance. As for the other end the risk spectrum, here is what the HSE has to say about the limits of tolerability:
An individual risk of death of one in a thousand per annum should on its own represent the dividing line between what could be just tolerable for any substantial group of workers for any large part of a working life, and what is unacceptable for any but fairly exceptional groups. For members of the public who have a risk imposed on them ‘in the wider interest of society’ this limit is judged to be an order of magnitude lower – at 1 in 10,000 per annum24.
In figure 2 it can be seen that the petroleum company concerned accepts the figure of 1 in 1000 as its limit of tolerability. The HSE statement raises a number of issues. First, it acknowledges that for some “exceptional groups” of workers the tolerable level of risk may be higher than 1 in a thousand. This seriously undermines the significance of the limit as a guideline. Consider the risk to helicopter pilots and crop dusting pilots to name just two high risk occupations. The risk to such groups may well be considerably above the 1 in a thousand per annum. Should regulators regard this situation as intolerable and demand that the risk be reduced no matter what the cost, or should they regard these occupational groups as “exceptional” and their risk exposure as therefore tolerable? The tolerability framework provides no guidance. It is worth noting that the legal framework is not bedevilled by this problem. The law does not regard any particular level of risk as intolerable on a priori grounds. Provided risks have been reduced as low as reasonably practicable, even very high risk levels may be justified. Enormous efforts have been made to reduce the risks of helicopter flights to offshore petroleum platforms in the UK and it is arguable that the risk to these pilots is now as low as is reasonably practicable, but it would be foolish to suggest that there are not more steps which could reasonably be taken to reduce the risks to crop dusting pilots in Australia.
24 HSE, op cit, p 46
9

A second issue is raised by the HSE proposal to use different limits for workers and members of the public on whom risks are imposed. Fleuler and Seiler made the same distinction. The presumption is that workers exercise some choice about where they work and their risk exposure is therefore to some extent voluntary. On this basis a higher level of risk is tolerable. It should be noted, however, that for many workers the choice is between manual work, with all its attendant risks, and unemployment. Most such workers do not have the option of retreating to the relative safety of white collar jobs. That being so, it is somewhat unrealistic to treat workplace risk as voluntarily assumed. There is also a question of equity here. For most groups of workers, and especially white collar and service workers, the risk of death at work is orders of magnitude below one in a 1000 per annum. In the service industry in the UK for instance it is 1 in 333,00025. The risk to construction workers, on the other hand, is 1 in 17,000 and in mining quarrying of energy producing materials the risk is 1 in 9000. To conclude that that the risk to these workers is tolerable because it is less than 1 in a thousand is, in effect, to endorse the unequal distribution of risks across the workforce. The distinction between workers and other members of the public which is built into the acceptable/tolerable risk framework turns out to be to be quite problematic in some contexts. Consider its application in the railways, for example. The Safety Case which was prepared by the UK Railtrack corporation lays out the tolerable levels of risk for different categories of stakeholders26. For employees, the limit is 1 in a 1,000. For individual members of the public adjacent to the track for any reason, for example at level crossings, the tolerable risk drops to 1 in 10,000. This is presumably justified on the grounds that for such people the risk is imposed, rather than in any sense voluntarily assumed. The largest stakeholder group consists of passengers, especially commuters going to and from work. Railtrack judges the limit of tolerability for this group to be 1 in 10,000, ten times less than the figure for employees. No clear justification is provided for this distinction. Passengers are in some respects members of the public in a way that employees are not. But the justification which the HSE proposes for a lower level of tolerability for certain members of the public is not that they are members of the public, but that the risks concerned have been imposed on them. Rail commuters do not have risks imposed on them in the way that householders do if a nuclear power station is built in their neighbourhood. On the contrary, they daily take steps to put themselves at risk by boarding trains to go to work. In this way they are no different from employees who daily put themselves at risk by being at work. The point is that going to work is no more voluntary or involuntary than being at work27. If that is accepted there can be no justification for tolerating a higher level of risk for rail employees than for rail passengers. Although Railtrack cites the HSE discussion on tolerability of risk, it does not in fact justify its tolerability limits by reference to degree of choice which individuals
25 HSE, op cit, p70 26 Raitrack’s Railway Safety Case, vol 1, 5 July 1999, p 22 27 Indeed, workers compensation law has often regarded the journey to work as part of the day’s work.
10

exercise in assuming the risk. Rather, its limits are determined by reference to the existing accident rates of these groups. The argument appears to be that because rail employees are killed at a higher rate than passengers, this difference must be tolerable. Used in this way, the idea of tolerability serves simply to legitimate the status quo. Acceptable to whom? The notion of tolerability or acceptability immediately raises the question of tolerable or acceptable to whom? The answer, frequently, is “society”. As the HSE says, tolerable refers to “ a willingness by society as a whole to live with a risk so as to secure certain benefits…”28 But this is to confuse the way things are with the way things ought to be. In one sense, of course, the fact that things are as they are means that we are currently tolerating them, as a matter of fact. But tolerability is more fundamentally a normative concept. The crucial question is - should things be as they are or should they be regarded as intolerable? This question cannot be answered by reference to the existing state of affairs. A further problem with this whole approach is that it personifies society in an inappropriate way. Societies don’t have views; individuals do. And the views of individuals may differ depending on whether or not they are exposed to the risk. While the shareholders in a company may find that a risk of one fatality per thousand workers per year is tolerable, the workers concerned may not. One solution to this problem is to speak, not of tolerable or acceptable risks, but rather, of approved risk. This is the risk that the regulators or legislators accept for an activity or occupation. This is a relatively unambiguous term, in that it is clear who is doing the approving, and there is no implication that the risk is necessarily acceptable to those exposed to it. Tweeddale argues that were such a term to be widely adopted it would make the discussion of the limits of risk less “provocative and paternalistic” 29. The acceptability of multiple fatalities The public reaction when numbers of people are killed in a single event, such as a mine explosion or an aircraft crash is often far more intense than when the same number die in separate events, for example in separate car crashes. Risk analysts conclude that because the risks associated with multiple fatalities give rise to particular societal concerns, they must be treated differently. Putting this another way, the acceptable risk of death for an individual is lower if the that individual dies along with others than if he or she is the only one killed. Specifically, the death of 10 in one accident is hundred times less acceptable than the death of 1; the death of 100 is ten thousand times less acceptable than the death of 1; and so on30.
28 op cit p8 29 Tweeddale, op cit, p70 30 See Tweeddale, op cit, pp73, 83; Risk and Reliability Associates, Risk and Reliability: An Introductory Text, 4th ed., self-published, Melbourne, 2002, p4.4
11

There is something very disturbing about these attempts to relate acceptability to number of fatalities. Certainly for the individual it makes no difference whether he or she is killed alone or with others. Despite these reservations policy makers in the UK have, very tentatively, proposed a limit of this kind for the risk associated with allowing a major chemical plant to continue in operation adjacent to a housing estate. In such circumstances, HSE proposes that the risk of an accident causing the death of 50 people or more in a single event should be regarded as intolerable if the frequency is estimated to be more than one in five thousand per annum.31 The HSE notes that that such thinking may not apply to “very different types of risk such as flooding from a bust dam or crushing from crowds in sports stadia”. Tweeddale makes the point dramatically by reference to the barrier on the river Thames in London.
At times of unusually high tide, if the wind is blowing strongly from the east the level of the sea in the Thames estuary rises substantially, with the potential to flood large areas of London. Because of long-term, gradual subsidence of the land, the risk of this has been assessed as very high, perhaps as much as around 1 in 50 years. So a barrier was built, able to be raised from the bed of the river at the onset of such times. It is estimated that this barrier or the surrounding high ground could now be flooded with a risk of around 1 in 1000 per year. This is clearly a major improvement. But it is estimated that, in the event of the barrier being overtopped, hundreds of people would drown, in spite of all the emergency procedures that might be taken. Thus, this installation is not able to reduce the risks from the natural hazard of flooding to a level meeting typical industrial society risk criteria.32
Tweeddale’s last point can be seen by comparing the Thames Barrier risk with the HSE proposal. For industrial installations the risk of an event which causes 50 deaths is only tolerable if it is less than 1 in 5000 per annum; the tolerable risk of an event causing hundreds of deaths would be much lower. On the other hand the risk of a storm tide event causing hundreds of deaths in London is regarded as tolerable even though it is 1 in 1000 per annum. It is not at all clear why in principle risks regarded as intolerable in one context should be seen as tolerable in another. The only conceivable justification is that the limit is chosen in light of what is reasonably practicable – it is reasonably practical to reduce the risk around industrial installations to the levels proposed by the HSE, and it is not reasonably practicable to do so in the case of the Thames Barrier. But if this is the reasoning, it flies in the face of the whole tolerability framework which requires that the level of tolerability be set independently of questions of practicability. It is clear that the concepts of tolerable or acceptable risk in the context of multiple fatalities are even more questionable than they are for individual fatality risk. It makes sense to talk of approved risk in this context, for there is no normative claim involved in such language, but to suggest that any level of risk is tolerable or
31 HSE, op cit, p47 32 Tweeddale, op cit p84
12
intolerable based on the number of people likely to be killed can only initiate pointless controversy. Value of life I return now to the second of Flueler and Seiler’s rules: risk should be reduced as far below the absolute limit or tolerability as is cost effective. The first step in applying this rule is to calculate the cost of a proposed risk reduction measure, estimate the number of lives which are likely to be saved by taking this measure, and compute a cost per life saved. In fact Flueler and Seiler go beyond this by noting that saving the life of a young person saves more “life years” than saving the life of an older person. It is therefore possible to calculate the cost of the risk reduction measure per life year saved, as well as per life saved. To decide whether the proposed measure is cost effective requires a second step, namely specifying how much it is worth spending to save a life, or a life year. Flueler and Seiler suggest that this depends on the degree to which the risk is voluntarily assumed. They suggest that the appropriate figure ranges from 1 and 20 million Swiss Franks per life saved. Per life-year saved, the corresponding figures are 25 to 500 thousand Swiss Franks. These figures are based on empirical estimates of what it actually costs in certain arenas, but in the tolerability/acceptability framework they become guidelines as to how much it is reasonable to spend on saving the lives of the risk-exposed. Inevitably this amounts to putting a value on human life, which raises obvious moral concerns. There has been considerable discussion in the UK of how much it is reasonable to spend on saving human life. In an apparent attempt to avoid the moral issue the debate is phrased in terms of the “value of preventing a fatality” rather than the “value of saving a life”, but this is little more than a verbal switch and the moral concerns remain the same33. The HSE suggests that the appropriate figure is about 1 million pounds, which is the same figure used by the UK Department of Transport for evaluating road accident prevention measures34. This figure is derived from various studies of the public’s “willingness to pay”35. However, in the case of the rail industry, the HSE accepts a figure is 3.2 million pounds36. It has been estimated that installing a Train Protection and Warning System (TPWS), to help avoid collisions, will come at a cost of 10 million pounds per fatality prevented, and the HSE has said that, notwithstanding the industry figure of 3.2 million, it considers this higher figure to be reasonable, “given the large numbers at risk and the widespread concern over safety on the railways” 37. The UK is in fact going ahead
33 HSE, op cit p 36 34 HSE op cit, p65 35 J Uff and L Cullen, The Southall and Ladbroke Grove Joint Inquiry into Train Protection Systems, London, HSE Books, 2001, p44 36 ibid p44 37 P Davies, “Regulation: death by a thousand cuts”, The Chemical Engineer, February, 2003, p 20
13

with a further system called Automatic Train Protection at an additional cost per fatality prevented of 30 million pounds38. The range of figures endorsed by the HSE and the decision to implement ATP, at 30 million pounds per fatality prevented, demonstrates the difficulty of making use of any such value as an independent benchmark against which to make cost benefit decisions. The reality described above seems almost the reverse: expenditure decisions are made on various grounds, the cost per fatality prevented is then calculated, and this cost per fatality is said to be justified by widespread public concern, or perhaps by political considerations or the public’s willingness to pay. In this case, therefore, the “value of a prevented fatality” is not an aid to decision making but an ex post facto, ad hoc rationalisation of the decision. This is perhaps just as well. If a decision were made not to go ahead with a risk reduction project on the grounds that the cost per fatality prevented exceeded some agreed value, the moral question would again be raised as to whether this amounted to putting a value on human life. The ethical problems involved in implicitly or explicitly putting a value on human life have been highlighted by various authors. Tweeddale, for example, notes (when considering industrial risks) that:
A problem with using the value of life as the basis for setting the criterion (of what is reasonably practicable) is that, if it is decided that the monetary value of the lives saved is insufficient to justify the proposed expenditure on safeguards, the saving and the “costs” are directed to different groups: the saving being made by the organisation which avoids the need to install the safeguards, and the cost (in the form of the risks) being born by those exposed.39
This comment is less applicable where costs of the safeguards are likely to passed on directly to the risk-exposed, as they would be in the case of rail passengers, in the form of higher fares. But in the case of industrial safety, where the expenditure on safety will be in the first instance at the expense of owners and not workers, any decision that it is not cost effective to spend further resources very clearly benefits one group at the expense of another.40 There is one way in which the moral issue can be largely circumvented. Where there is a possibility of using funds on one or other of a number of possible risk reduction measures, it makes sense to calculate the cost per life saved for each measure and fund those interventions which give the greatest value for money in terms of lives saved. For example, it has been calculated in the US that grooved pavements on highways would cost $29,000 per life year saved, while relocation utility poles from 8 to 15 feet from the highway edge would cost $420,000 per life 38 “Joint statement of experts on risk management”, Appendix 7 to L Cullen, The Ladbroke Grove Rail Inquiry, Part 2 (London, HSE Books, 2001), p 211 39 op cit, p 78 40 The problems involved in putting a value on life are well discussed in P Dorman, Markets and Mortality: Economics, Dangerous Work and the Value of Human Life, (Cambridge, Cambridge UP, 1996); see also Adams, op cit, chap 6
14

year saved41. Assuming highway authorities have a choice about how they spend their money, they can save many more lives for a given amount of money by grooving highways than by relocating light poles. The beauty of this analysis is that it in no way places an implicit value on life, and it involves no judgement about how much money should be spent. It is simply a guide to how to maximise the life saving potential of available funds. The preceding example is not easily generalisable. In the debate about installing Automatic Train Protection in the UK, the point was often made that it would be far more cost effective to spend the money on preventing road fatalities. One estimate was the cost to prevent a road fatality was about 0.1 million pounds as against the 30 million pounds for the Automatic Train Protection (ATP) system42. In other words, if all the money earmarked for spending on ATP were spent instead on preventing road deaths, many more lives would be saved. The problem is, however, that the funds are not readily transferable. The funding for ATP will presumably come from the various rail organisations, to be recouped from rail passengers, while the resources needed to prevent road fatalities presumably comes from a number of government and non government sources. In short, a decision not to spend money on ATP does not mean that the money will be spent instead on reducing road fatalities. In general, wherever funds are non-transferable in this way, cost-benefit comparisons become largely irrelevant. To summarise this section, the “value of life saved” approach is intended as a spending guide for those seeking to reduce risks as far as reasonably practicable. But it turns out to be little more than a codification of what is in fact being spent to save life and as such loses much of its value as a decision making criterion. It may perhaps help to standardise spending in a given industry or arena, but it is of little value in determining what that standard should be. Moreover, as the decisions about TPWS and ATP reveal, there are circumstances where it is no guide at all, even to industry practice, until after the spending decisions have been made. Finally, it appears to legitimate existing discrepancies between industries or areas of activity, without any particular rational or moral basis. The idea of accidents as caused Quantitative risk assessment is based on an assumption that accidents are fundamentally chance or random events and so can never be totally prevented, no matter what measures we take. The alternative view is that accidents are caused and that the role of management is to identify and counter those causes. Time and again analyses of accidents occurring in an organizational context show that they occur because of the failure of some preventive measure or series of preventive measures which should have been in place43. As Tweeddale notes, these are “driven failures, not random failures”44. It
41 T Tengs et al, “Five-hundred life-saving interventions and their cost-effectiveness”, Risk Analysis, Vol 13(3), 1995 42 Cullen, op cit, p211 43 J Reason, Managing the Risks of Organisational Accidents (Aldershot:Ashgate,1997)
15

may be, for example, that systematic hazard identification procedures have not been carried out, auditing has been shallow, permit to work systems have not been implemented as required, preventive maintenance has not been done, procedures have been violated, and so on. Such measures are designed to prevent accidents and accidents can only occur if one or more of these measures fails. It is for this reason that the claim is often made that all accidents are preventable. All too often we hear that this was an accident “waiting to happen”, meaning that those concerned knew beforehand that the hazards had not been properly controlled. When courts find, as they so often do, that it would have been reasonably practicable to prevent a particular accident, it is the failure or inadequacy of these preventive measures to which they refer. It is noteworthy that in making such decisions, courts do not concern themselves with whether or not the overall level of risk to employees or other stakeholders has been driven down below the threshold of acceptable risk45. The question is whether the risk in the current case was as low as reasonably practicable, and if it was not, the company will be found liable46. On this view, then, no specific death can be regarded as acceptable simply because the death rate or risk of death is acceptably low. The style of accident analysis referred to above implicitly adopts a particular meaning of cause - necessary condition. Had any one of the failures identified in the analysis not occurred, the accident would not have happened. Each such failure was thus a precondition for the accident. This is not to say that such failures make an accident inevitable. An organization may survive without an accident for a considerable time, despite the presence of a series of organizational failures or inadequacies, until some particular pattern of events triggers the accident. For this reason these failures have sometimes been described as latent causes or conditions47. In other words, identifying organizational failings does not enable us to predict that a particular accident will occur; it enables simply us to conclude that the risk of accident is unnecessarily high. Necessary conditions therefore amount to causes only in a relatively weak sense. It can be argued, however, that the ultimate purpose of causal analysis is to be able to predict events, and this requires that we identify a set of conditions which together make the accident inevitable48. Such a set of conditions would include all the background failures and all the immediate circumstances. The idea of cause as a set of sufficient conditions is clearly a much stronger notion of cause. But
44 Tweeddale, op cit p 202 45 See A Hopkins, Lessons from Longford: The Trial (Sydney:CCH, 2002). 46 Rasmussen notes that many of the failures which give rise to accidents occur because of economic pressures and that therefore it is not appropriate to view accidents as chance events. Analyses of accidents, he says, “demonstrate that they have not been caused by a coincidence of independent failures and human errors, but by the systematic migration of organisational behaviour toward accident under the influence of pressure toward cost-effectiveness in an aggressive, competitive environment”. J Rasmussen, (1997), “Risk management in a dynamic society: a modelling problem”, Safety Science , 27 (2/3), p189 47 Reason, op cit. 48 D Fischer, “Dependently sufficient causes in tort law – a reply to Professor Wright”, unpublished paper, University of Missouri-Columbia.
16

identifying causes in this sense is far more difficult, indeed impossible in most situations. To predict in detail when and where a specific accident will take place would require far more information than is normally available. This is not to say that predicting the future is impossible. Using powerful computers and masses of data, weather forecasters are becoming increasingly capable of predicting weather at least 24 hours in advance. In 2000 they predicted that an uncommonly intense storm would develop in a very specific location off the south east coast of Australia, just at the time the Sydney-Hobart yacht race was expected to pass through the area. Their prediction was not effectively relayed to race participants, but it proved to be accurate, and six yachtsmen died in the storm49. Of course the weather forecasters were not in a position to predict that these particular people would die. But if we had known something about the buoyancy characteristics of the boats, and their predicted locations, we might well have been able to predict which particular boats would get into trouble. In short, the more information that is available, the more specific the predictions can become. The notion of cause in the strong sense seems ultimately incompatible with the idea of chance or randomness. If events are entirely predictable then there is no room for random occurrences50. The notion of cause in the weaker sense is not, however, incompatible with chance, in principle. The absence of preventive measures does not make accidents inevitable, it merely makes them more likely, and it is arguable that whether or not they actually occur is still a matter of chance. Nevertheless, in practice the whole framework of risk acceptability is jeopardised once we begin to identify necessary conditions which have allowed accidents to occur. Consider the following. In the UK the annual risk of death from the use of gas in the home (by fire, explosion or carbon monoxide poisoning) is less than 1 in a million - 1 in 1.5 million, to be precise51. Recall that the HSE regards a risk of 1 in a million as acceptable. But gas deaths are viewed quite differently. As the HSE puts it “gas incidents continue to give rise to societal concern, particularly where incidents occur because unscrupulous landlords seek to avoid the cost of simple safety checks on their gas heating systems and so put those who rent the accommodation (often young people) at greater risk”. Such events are not seen as chance occurrences the risk of which is so low as to be acceptable; rather they are seen as having a cause - the unscrupulous behaviour of landlords. As such they are entirely preventable and the HSE notes that it “has responded by firm enforcement action where appropriate, and by targeted publicity emphasising the importance of annual gas checks”. 49 Chaos theory suggests that if we knew enough about the weather we might be able to show how a butterfly flapping its wings might initiate a chain of events leading to a storm on the other side of the world. The phenomenon is known as sensitive dependence on initial conditions. J Gleick, Chaos, The Amazing Science of the Unpredictable (Vintage, London, 1998), p23 50 Vatn suggests that randomness does not exist as such. Rather, the limitations on our knowledge make it quite impossible to predict most events, and we therefore invoke the concept of randomness to deal with this uncertainty. J Vatn, “A discussion of the acceptable risk problem”, Reliability Engineering and System Safety, 61(1-2):11-19, 1998, p3 51 HSE op cit p 44
17

Here, then, is a case in which HSE does not adopt a do-nothing approach because of the very low level of the risk. Indeed it is arguable that the very low level is precisely because of the activities of the regulator and that in the absence of this activity the number of gas related deaths in the home would rise to barely tolerable or even intolerable levels. It might be argued the level of risk where landlords do not carry out safety checks is much higher than one in a million and that it is this risk that justifies the more vigorous response. But the HSE has not tried to quantify this heightened risk in order to justify its actions. Rather it points to “societal concern” in these circumstances as its justification. It seems likely that this societal concern arises from the fact that these deaths are easily preventable, that landlords are obliged to take steps to prevent them, and that their failure to do so is therefore culpable. The chance of dying from the use of gas in the home in the UK is not very different from the chance of being killed by lightning52, but the response is very different. As has already been noted, death by lightning strike is generally viewed as a random event and a matter of very bad luck. The difference is instructive. We know enough about the causes of home gas incidents to be able to prevent them; we don’t know enough about the weather to be able to predict lightning strikes and so prevent the occasional death by lightning. In the former case we are inclined to adopt the cause/prevention paradigm while in the latter we are inclined to adopt the paradigm of chance and acceptable risk. Reducing risk by reducing exposure One of the paradoxical consequences of the risk acceptability framework is that it can sometimes distract attention from the need to identify hazards and put in place controls. This comes about in the following way. QRA seeks to quantify the risk to the individual and to encourage employers/operators to drive these risks below some predetermined level of tolerability or acceptability. One way to do this is to reduce the risk that an accident will occur, but the risk to individuals can also be reduced simply by reducing their exposure to a possible accident event. Such thinking drives decisions about the citing of housing estates adjacent to dangerous installations. Given that the risk of a major accident at such an installation is non zero, the risk to residents can be kept below whatever limit of acceptability is chosen by maintaining sufficient separation between houses and plant. It is hard to fault such decision making, but one consequence should be noted. Given the higher level of risk to which employees may be subject, the plant may not required to carry out risk reduction activities to the same extent as would have been required had it been located immediately adjacent to a housing estate. Consider now the case of a petroleum company operating offshore which requires some of its workers to pay frequent visits to unmanned platforms. In order to keep the risk to which each of these people is exposed within the limits of acceptability, the company restricts the number of flights which each such employee makes. The
52 1 in 19 million, HSE, p70. In Australia, a figure of 1 in 8 million has been calculated, see Higson, op cit p 33
18

helicopter operator keeps a tally and when the limit is approached the worker will be taken off this job and another will take his place. In this way the company honours its commitment to individual workers not to expose them to more than the acceptable level of risk. Notice that this strategy does nothing to limit the risk that someone will be killed; it merely spreads the risk over a larger group of employees. Moreover, from a company point of view, the risk that someone (anyone) will be killed is the relevant risk. A fatality will cause unpredictable disruptions, the possibility of enforcement action and immeasurable psychological damage to all who are close to the person or persons killed. The company has an interest in driving the risk of any fatality as low as possible and its focus on individual fatality risk inevitably distracts it from this goal. Consider, finally, the petroleum company which reduced the number of helicopter flights to compensate for the increased risk from the gas compressor. This was a strategy which concentrated exclusively on reducing exposure. It accepted the risks inherent in compressors and helicopter flight as given, and did nothing to reduce the inherent dangers of either. It was a strategy that ignored or perhaps simply accepted the fact that the platform would henceforth be at greater risk of fire, as a result of the new compressor. Calculating risks So far discussion has been about the acceptability of risk; nothing has been said about exactly how organizations go about calculating the risks to which their stakeholders are exposed. This is a area which raises additional concerns about the adequacy of the whole acceptable risk framework. In some contexts calculating the risk is relatively straightforward. For railway workers, for example, one possibility is to divide the number of fatalities per year by the number of railway employees. Some rail employees, such as track side workers, are much more exposed than others, so to obtain a more meaningful picture it is preferable to calculate a rate for this group separately. If we make the assumption that such workers are all equally exposed to risk over the course of a year, their fatality rate can be taken as an indication of risk53. Suppose, however, one is wanting to quantify the risk of a major fire at some hazardous installation, such as a proposed new offshore petroleum production platform. An obvious starting point is to look for historical data on the number of major fires at hazardous installations so as to be able to calculate a rate. But what is the population of installations for which the rate is to be calculated? It could be argued that the risks in chemical processing plants are systematically different from those in petroleum production installations and the former should therefore be excluded from the calculation. Similarly, onshore oil and gas processing plants are systematically different from offshore facilities and need to be excluded. Furthermore, existing offshore platforms were built to less stringent standards and their experience is therefore not relevant. In this way we rapidly arrive at the
53 The assumption is, of course, questionable
19

conclusion that the historical data on fires in hazardous installations is of no value in assessing the risk at our proposed new platform. This is a case where the rate, no matter how defined, provides no indication of the risk. In these circumstances QRA adopts a different approach. It seeks to identify every possible way in which a major fire might develop and assess the probability of each such scenario. For example a valve might fail on a compressor releasing a large amount of gas, a hole might develop in a high pressure gas line as a result of corrosion and so on. Industry data exists on the probability of such occurrences and this can then be used as a starting point. Knowledge of the particular installation can be used to identify potential ignition points and hence the likelihood of ignition. Adding together all these risks yields the overall risk of fire. The probability that an individual will be in the area can also be estimated and in this way the risk to an individual can be calculated. Production workers are more likely to be in the area than, for example, catering staff, and so their risk will be greater. Other kinds of risks can then be computed, for example, the risk of aircraft crash en route to and from the platform, and a total risk for individuals in various categories can be estimated. These are then expressed as the individual risk per annum or the fatality rate per annum expected for workers with a specified pattern of risk exposure, that is, in a specified category. Making these calculations is a formidable task involving a substantial commitment of resources but the end result is a figure for each category of workers which can then be compared with the risk acceptance criterion, say one in a thousand, to assess whether the risk to which an individual is exposed is within the limits of tolerability. As can be imagined a host of assumptions are made in the process of carrying out these calculations. Here is an example. At one installation workers fly in an out on fixed wing aircraft. The aircraft are chartered. Chartered aircraft have a higher accident rate than regular passenger aircraft. However the risk analysts decided not to use the accident rate for chartered aircraft because the charterer in this case is a large airline that operates the charter flight much like a regular passenger service. The decision was no doubt justified in this case, but it provides an example of the discretion available to analysts in deciding what kind of industry data to incorporate into their models. It can be assumed that this discretion will often be exercised in such a way as to reduce the calculated risk. Indeed one hears stories about risk analysts experimenting with different assumptions in an effort to bring the results in under the limit of tolerability54. Apart from this, the generic data may be of very doubtful relevance to the particular case. An Australian QRA firm notes, for example, that the use of generic pipeline failure rates,
does not take into consideration improvement in manufacturing and monitoring standards, or the possibility that local systems are superior to world standard. Failure rates also do not take into account land use. For
54Tweeddale, op cit p 206, makes a related point.
20

example, third party pipeline damage is far more likely in a rural area than in a major city street 55
There is another, probably more fundamental problem associated with this type of QRA – it fails to acknowledge the crucial role of human factors. Admittedly, there have been some attempts to take human error into account. For example it is estimated that the probability of dialing ten consecutive digits wrongly is 6 in a hundred, while the probability of failing to notice that a valve is in the wrong position is one in two56. But accident research shows that it is not just errors of this type which trigger accidents, but phenomena which defy quantification, such as poor procedures, violations of procedures, and plain ignorance. For example, the Piper Alpha disaster got underway because of a failure in the permit to work system. The inadequacy in the permit system was longstanding but had not been picked up in auditing. This is essentially a management failure which would be impossible to incorporate into a quantitative risk assessment. Take another example. To estimate the risk of valve failure from industry data is to ignore the fact that the likelihood of valve failure in any particular situation may be almost wholly determined by the behaviour of employees and their managers on the spot. If routine maintenance work is not being done as a result of financial cutbacks, the risk of valve failure will be much higher. Even more dramatically, if employees have disabled valves for some reason, these valves will certainly fail to function as designed when the need arises. This is precisely what happened at the Kaiser alumina plant in Louisiana in which an explosion injured 29 people in 199957. Industry data on valve failure provide no indication the risks involved in these circumstances. Putting all this another way, the quality of management will have a major effect on risk. Poor management could conceivably increase the risks ten or even a hundred fold. In other words, although a quantitative risk assessment might assess the risks to be tolerable, inadequate management could drive the true risks well above the limit of tolerability58. Conversely, good management may reduce risks to well below any quantitatively assessed level. QRA has been subjected to some very harsh criticism along these lines by some of its own practitioners. For example, Robert Bea, after three decades of carrying out quantitative risk assessments, has come to the view that QRAs are being widely misused. Engineers working for organizations are inevitably biased in the direction
55 R2A (Risk and Reliability Associates), Risk and Reliability, 4th edition, Melbourne, self published, 2002, p11.13 56 R2A, op cit, p6.9. Tweeddale shows how problematic these probabilities are, op cit, pp 371, 375. 57 See report of the US Dept of Labor, Mine Safety and Health Administration, available at website. 58 Tweeddale, op cit, makes a similar point, p201, 214. He argues that the effects of poor management cannot be included in a QRA and any attempt to do so is pure guesswork. He concludes bluntly that poor management simply invalidates a QRA.
21

of underestimating the risk, he says. Moreover, their primary purpose is to “produce elegant analytic models”, and they “start believing that the numbers represent reality”. He concludes that “the marked limitations of analytical models and quantitative methods must be recognized or major damage can be done to the cause of system safety”59 Petroleum engineer, Graham Dalzell, is similarly critical. He argues that, because of its emphasis on finding appropriate data to be used in risk calculations, QRA tends in practice to distract attention from the hunt for possible causes of major accidents in petrochemical facilities. Efforts should be focused, he says, not on locating appropriate “historical data but on a rigorous examination of the plant, the causes of failure and the effectiveness of prevention systems. … the first step in risk reduction is either to eliminate the cause or to improve the prevention system”60. The preceding analysis has been largely critical of QRA because of the ways in which it is often used. It is not my intention, however the dismiss QRA entirely. Its advocates argue quite persuasively that it can be an aid to decision making provided its limitations are kept in mind. In his discussion of the strengths and weaknesses of QRA, Tweeddale notes that:
the value of the assessments lies not in the bottom line (of computed risk), which is usually of too dubious precision or applicability to be relied on, but in the insights gained in undertaking the analysis, and the relative magnitudes of the components of the assessed risk61.
59 R Bea “Quantitative risk analyses – the safety of offshore platforms”, paper presented at the 28th Annual Offshore technology conference, Houston, May 1996, p 1; R Bea, “Human and organisational factors in quality and reliability of engineering systems”, Proceedings of Seminar on Managing Safety in Hazardous Processes, Melbourne, November 1999, p5 60 G Dalzell, “From ignorance to enlightenment: a study of implementing change”, unpub paper p6. 61 Tweeddale, op cit p 206ff
22

23
Conclusion This analysis has uncovered two competing conceptions of how accidents occur, one that they are caused, and the other that they occur by chance. QRA and its associated concepts of acceptable or tolerable risk are based on the latter conception. Discussion here has focused on the limitations of these ideas in providing guidance on just how far organisations should go in seeking to improve safety. As we have seen, there are various ethical and other difficulties in determining the limits of tolerability and there are enormous if not insuperable difficulties in quantifying risk in any particular context in order to be able to compare it against benchmark figures. The most significant risk is poor management and this is inherently unquantifiable. QRA is largely inappropriate, therefore, as a means of deciding whether risk has been driven to a sufficiently low level. In particular, it should never be allowed to over-ride sound professional judgments about necessary risk reduction measures. It can, however, have more modest uses, such as helping to determine priorities. The alternative paradigm, that accidents are caused, is fundamental to accident prevention. Only by knowing their causes can accidents be prevented. Moreover, causation is the starting point in any legal inquiry. A finding of legal liability is a finding that an accident was caused by the duty-holder, and that it could and should have been prevented. This is the very antithesis of randomness. Given that organisational accidents in which people are killed or injured frequently give rise to findings of either criminal or civil liability, it is clear that the courts routinely reject the notion of accidents as chance events62. There are tensions, therefore, between the tolerability framework and the way cases are decided in courts. These tensions are partly a result of the difference is how accidents are understood – chance events versus caused events. But they arise also from different ways of deciding how low risk needs to be driven. At law, employers must drive risks down as far as is reasonably practicable, and there is no level of risk which, a priori, can be said to be acceptable63. Moreover, the law has a well developed set of principles for determining whether risks are as low as reasonably achievable, and despite the indeterminacy of these principles, it is by no means clear that QRA and the tolerability/acceptability framework offers a better way of deciding how low is low enough.
62 But not always. Courts will sometimes take the view that an accident was a chance event which it was not reasonably practicable for an employer to prevent. See Marshall v Gotham, [1954] A.C. 360. 63 This point is also made by Derek Viner, “Risk assessments – do they work?”, Safety in Australia, Vol 24 (3), December 2002, p12.