qra – unleashing its power · qra – unleashing its power philip nalpanis and ade oke, dnv,...
TRANSCRIPT
SYMPOSIUM SERIES NO. 156 Hazards XXII # 2011 IChemE
QRA – UNLEASHING ITS POWER
Philip Nalpanis and Ade Oke, DNV, London, UK
INTRODUCTIONQuantitative Risk Assessment (QRA) has been used sincethe late 1960s as a tool for regulators, operators and contrac-tors to assess risks posed by installations extracting, proces-sing and/or storing hazardous substances in significantquantities and/or with significant throughputs (“processinstallations” hereafter). Since the 1980s this has beenfacilitated by the development of software (starting withTechnica’s SAFETI – Software for the Assessment ofFlammable, Explosion and Toxic Impacts) to carry out thedemanding computational elements of QRA, in particularconsequence modelling and risk estimation.1 QRA hasbecome an essential tool in many parts of the world forthe development, continued operation and expansion ofprocess installations that meet society’s growing expec-tations of such installations posing as little risk as possibleto its members. At the same time, ever increasing pressuresto reduce costs without (apparently) compromising safetyhave required risk reduction to be demonstrably costeffective.
QRA has therefore grown – or rather, been requiredto grow – from a coarse tool that could be used to assesswhether a process installation met regulatory risk criteriato a tool that can be used through most stages of a processinstallation’s lifecycle to demonstrate cost effective riskacceptability and risk minimization. This paper will demon-strate, through history and case studies, how QRA can nowmeet these sophisticated expectations and how this has beendriven by client needs, with software developers respondingto these needs.
GROWING EXPECTATIONSIn the energy and process industries, QRA was first devel-oped in the Netherlands, where its original use lay in ensur-ing that the dykes which protect the low-lying areas fromsea ingress were robust enough to withstand all but theworst storm surges. QRA for energy and process industryoperations was shown (Slater 1982) to be do-able but torequire computer software to be practical.
The initial Dutch risk acceptance criteria divided risksinto three bands, with the highest risks being unacceptableand the lowest acceptable as they stood. Risks in themiddle band were required to be reduced, not necessarilyto lie in the lowest band, but to be demonstrably ALARA(As Low As Reasonably Achievable).
1Throughout this paper the term “estimation” has been used in prefer-
ence to “calculation” as the uncertainties in risk numbers mean that
the precision of mathematical or engineering calculations cannot be
ascribed to those risk numbers.
267
SAFETI, commissioned by the Dutch governmentand first released in 1982, enabled the risks from processinstallations to be estimated and assessed to identifywhere they lay in relation to the criteria. Thus, initiallyQRA was used as a “go/no-go” assessment tool.
Given the computing power available at the time,SAFETI necessarily had to use relatively simple, phenome-nological consequence models in order for QRA studies tobe completed within a reasonable time-scale. Use of Compu-tational Fluid Dynamics (CFD) was impractical (and remainsso for the bulk of QRA work, as discussed below).
Offshore, the Norwegian Petroleum Directorate(NPD) established a requirement for Concept Safety Eva-luations (CSEs) of new installations (NPD 1981), a differentapproach to QRA but the first formal requirement forQRA offshore. The CSE addressed the risk of impairmentof “safety functions” such as escapeways and lifeboatsand ensured, early in the design process (before it becameprohibitively expensive to make major changes), that therisks were minimized and thus the concept acceptable tothe NPD to take forward.
Even from its earliest days, QRA could also be usedto assess the relative risks of different concepts for newonshore process installations.
For QRA clients (at that time, the operators of exist-ing process installations), the requirement to demonstratethat risks were ALARP (As Low As Reasonably Practi-cable) immediately raised the question: what risk reductionmeasures would be demonstrably effective? This requiredmore than the overall risk levels: it required a breakdownof the risks, by section of the installation and by scenario,to identify the major risk contributors (or “risk drivers”).The SAFETI software developers duly provided themeans to do this, although it could not easily be used toidentify the particular outcomes (e.g. explosion) that weredriving the risk.
In the early stages of a project, the installation layout(onshore or offshore) can be optimized to minimize therisks. Even with details of the process undefined, itbecame desirable for QRA to be used to identify thehighest risk units, so as to guide the installation layout.
Offshore UK, many operators used QRA methods asan integral part of the design process but, prior to the PiperAlpha accident of 1988, QRA tended to be applied tospecific aspects of the design rather than to assess theoverall risks. Consequently, it was mainly used as part ofthe detailed design when the scope for changes waslimited. Examples include the prediction of the risks ofship-platform collision, and modelling of the risks in emer-gency evacuation. Several operators used the latter to assessand improve their arrangements for evacuation by lifeboat.
SYMPOSIUM SERIES NO. 156 Hazards XXII # 2011 IChemE
In the UK, the HSE developed risk criteria (1988) forthe Sizewell B public enquiry, along with the associatedrationale. Unlike in the Netherlands and Norway, QRAper se was not, and is not, mandatory for ALARP demon-stration. The UK also developed land use planning guide-lines (Turner & Fairhurst 1989), for developments outsideprocess installations, that were implicitly risk based. ThusQRA was used, not only to assess the risks from a processinstallation, but also to assess whether proposed externaldevelopments could proceed.
The public inquiry into the Piper Alpha disaster(Cullen 1990) identified, amongst many other issues, theimportance of blast walls able to withstand a strongexplosion. Whilst QRA could be used to estimate the riskfrom explosions taking into account the blast wall strength,estimating the overpressures that could be generated by anexplosion required CFD. These results could then be incor-porated in the QRA, and thus was developed a strong linkbetween CFD and QRA, playing to the strengths of eachwhilst not requiring the power (and resource requirements)of CFD to be deployed throughout the QRA.
The Texas City accident in 2005 placed a new empha-sis on the siting of temporary buildings within a processinstallation (and resulted in a new API standard, RP-753).More generally, risks onsite onshore have increasinglybeen a concern in the design and operation of process ins-tallations. Consequence modelling in QRA software hasgenerally been understood to be valid in the medium tofar field but not in the near field. Estimating onsite riskrequires models valid in the near field and also requiresconsideration of buildings’ ability to withstand an explosionor fire. Phenomenological explosion models that reflectconfinement and congestion on the installation (e.g.through applying the GAME/GAMES metholology:Eggen 1998; Werex et al. 1998) have necessarily becomea key part of onshore QRA, replacing more general VCE(Vapour Cloud Explosion) models. CFD can be used tooin this context, to inform the QRA rather than as part ofthe QRA software tool itself. Thus QRA, often in conjunc-tion with CFD, has come to be used to facilitate risk basedstructural design of process installations (e.g. blast walls,buildings), onshore and offshore, as well as the layout andprocess design.
The increased expectations of QRA have drivenimprovements in both modelling and reporting, with theability to “drill down” and understand in detail the riskdrivers a vital feature of QRA software.
All of the above applications have usually and tra-ditionally focused on risk to people. Fatalities of coursemake news headlines and are extremely damaging tothe responsible party’s reputation. However, asset damageand loss of production are extremely damaging to the oper-ator’s finances: it may take many years to recover to pre-vious production levels. With the means available toestimate the risks of damage to an installation, it is then ashort step to present explicit risk estimates for assets andproduction, as can now be done, for example, by PhastRisk Financial.
268
What of the environment, especially in the light ofBP’s Macondo well disaster? QRA can be used to estimatespill quantities and flow rates of hazardous materials intothe environment, together with their frequencies. Thespill quantities and frequencies can be used to producean F-S (Frequency-Spill size) curve, equivalent to an F-N(Frequency-Number of fatalities) curve for personnel risk,but equivalent criteria do not appear to exist. Furthermore,spill quantity is not equivalent to number of fatalities as itdoes not measure the impact on the environment (e.g. fish,trees). Models exist for environmental impact; however,true environmental QRA is beyond the scope of this paper.
QRA FOR (THE PROCESS INSTALLATION’S)
LIFEToday, QRA is no longer seen as an isolated activity but asan integral part of an overall risk management strategythroughout an installation’s life, including modificationand expansion.2 At different stages, it can provide differentinputs that can, properly used, ensure that a process installa-tion’s risks are minimized cost-effectively. Whilst these willalmost invariably not be the only considerations as designchoices are narrowed down, no company can afford toproceed without sufficient regard to the safety risks as amajor accident will severely impact their reputation, cashflow and share price, possibly even their survival.
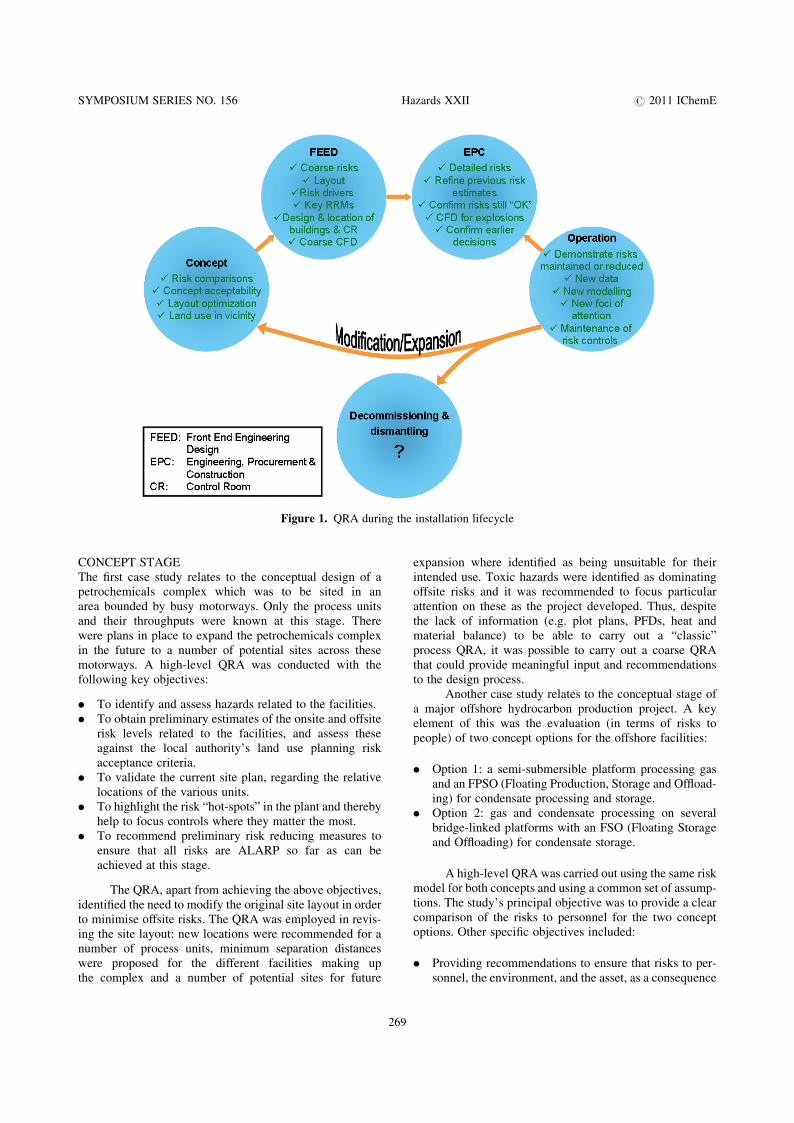
Figure 1 shows how QRA and CFD can be appliedfrom concept through to operation and then modificationor expansion. How the QRA is carried out and what usecan be made of the results changes through the various life-cycle stages. CFD can be, and increasingly is, used toinform the QRA and so make credible the results obtainedfrom the phenomenological models used in the QRA, aswill be shown in Section 4.0.
The only stage where the application of QRA isrestricted is decommissioning and dismantling. However,at this stage the installation is expected to be empty of hazar-dous process substances and the safety issues are largelysimilar to those faced in any major dismantling project,being largely structural, mechanical and electrical ratherthan process; they shift away from major hazard and occu-pational safety to occupational safety only.3
CASE STUDIESThe following are case studies derived from real-life pro-jects that illustrate the different benefits of a QRA over aprocess installation’s lifecycle.
2In this context, QRA is not seen as sufficient to demonstrate that the
risks of a process installation’s operation are acceptable: the importance
of safety management has been increasingly recognized and accord-
ingly, at least in the UK, a Safety Case must demonstrate adequate
safety management, not only adequate design. However, QRA is not
superseded; rather it forms a valuable part of the whole process of
ALARP demonstration.3However, many accidents have occurred because plants were shut
down with chemicals left in them and not dismantled until years later
by which time everyone had forgotten what was in the plant.
SYMPOSIUM SERIES NO. 156 Hazards XXII # 2011 IChemE
Figure 1. QRA during the installation lifecycle
CONCEPT STAGEThe first case study relates to the conceptual design of apetrochemicals complex which was to be sited in anarea bounded by busy motorways. Only the process unitsand their throughputs were known at this stage. Therewere plans in place to expand the petrochemicals complexin the future to a number of potential sites across thesemotorways. A high-level QRA was conducted with thefollowing key objectives:
. To identify and assess hazards related to the facilities.
. To obtain preliminary estimates of the onsite and offsiterisk levels related to the facilities, and assess theseagainst the local authority’s land use planning riskacceptance criteria.
. To validate the current site plan, regarding the relativelocations of the various units.
. To highlight the risk “hot-spots” in the plant and therebyhelp to focus controls where they matter the most.
. To recommend preliminary risk reducing measures toensure that all risks are ALARP so far as can beachieved at this stage.
The QRA, apart from achieving the above objectives,identified the need to modify the original site layout in orderto minimise offsite risks. The QRA was employed in revis-ing the site layout: new locations were recommended for anumber of process units, minimum separation distanceswere proposed for the different facilities making upthe complex and a number of potential sites for future
26
expansion where identified as being unsuitable for theirintended use. Toxic hazards were identified as dominatingoffsite risks and it was recommended to focus particularattention on these as the project developed. Thus, despitethe lack of information (e.g. plot plans, PFDs, heat andmaterial balance) to be able to carry out a “classic”process QRA, it was possible to carry out a coarse QRAthat could provide meaningful input and recommendationsto the design process.
Another case study relates to the conceptual stage ofa major offshore hydrocarbon production project. A keyelement of this was the evaluation (in terms of risks topeople) of two concept options for the offshore facilities:
. Option 1: a semi-submersible platform processing gasand an FPSO (Floating Production, Storage and Offload-ing) for condensate processing and storage.
. Option 2: gas and condensate processing on severalbridge-linked platforms with an FSO (Floating Storageand Offloading) for condensate storage.
A high-level QRA was carried out using the same riskmodel for both concepts and using a common set of assump-tions. The study’s principal objective was to provide a clearcomparison of the risks to personnel for the two conceptoptions. Other specific objectives included:
. Providing recommendations to ensure that risks to per-sonnel, the environment, and the asset, as a consequence
9
SYMPOSIUM SERIES NO. 156 Hazards XXII # 2011 IChemE
of hazardous events are reduced to a level that is As LowAs Reasonably Practicable (ALARP).
. Identifying the particular hazards, systems or equip-ment, which have major significance for the presenceor control of risks.
. Demonstrating clearly the effects of the uncertainty ofdata used in the risk model, where assumptions have asignificant impact on the risk levels, and providing refer-ences for all data used in the analysis.
The QRA achieved the above objectives in spiteof the coarseness of the design data available at thisearly stage of the project. The uncertainty and conser-vatism was recognized, however the risk indicatorsenabled a clear comparison of the risk levels associatedwith both concepts. The risk levels were not the onlyfactor influencing the concept choice; the economic factorwas also an important consideration but was outside thescope of the QRA study.
A follow-up QRA study associated with the selectedconcept option (Option 1 above) aimed to comparevarious layout options for both the semi-submersible plat-form and the FPSO vessel, to ensure the layout designwas optimized. The QRA model was used to evaluate thevariation and the magnitude of variations between thevarious layout options. This took into account variationsin terms of location of equipment, blast/fire walls, anddimensions of the decks.
FRONT END ENGINEERING DESIGN (FEED) STAGEThe third case study relates to the FEED stage design of anLNG/LPG facility consisting of multiple LNG productiontrains. A conceptual QRA had been conducted earlier;however, due to the limited project specific information atthe concept stage, the QRA could not provide the prelimi-nary risk-based design information required at the FEEDstage. As such, the concept stage QRA was revised withthe following key objectives:
. To quantify the risks associated with the project facili-ties and operations.
. To check or redefine safety distances to permanentlyoccupied buildings and temporary camp facilities, aswell as the level of fire/blast rating required for allbuildings (occupied and unoccupied).
. To assess the acceptability of the quantified risks, toidentify the risk drivers, and to propose potentialmeasures for risk reduction.
. To assess the effectiveness of safety systems.
. To assess Simultaneous Operations (SIMOPS) risks toconstruction workers as the facility develops.
. To define ignition source exclusion zones at the LNG/LPG berths satisfying a risk-based design criteria.
. To size LNG impoundment basins satisfying a risk-based design criteria.
. To define passive fire protection requirementsaround the LNG trains satisfying a risk-based designcriteria.
270
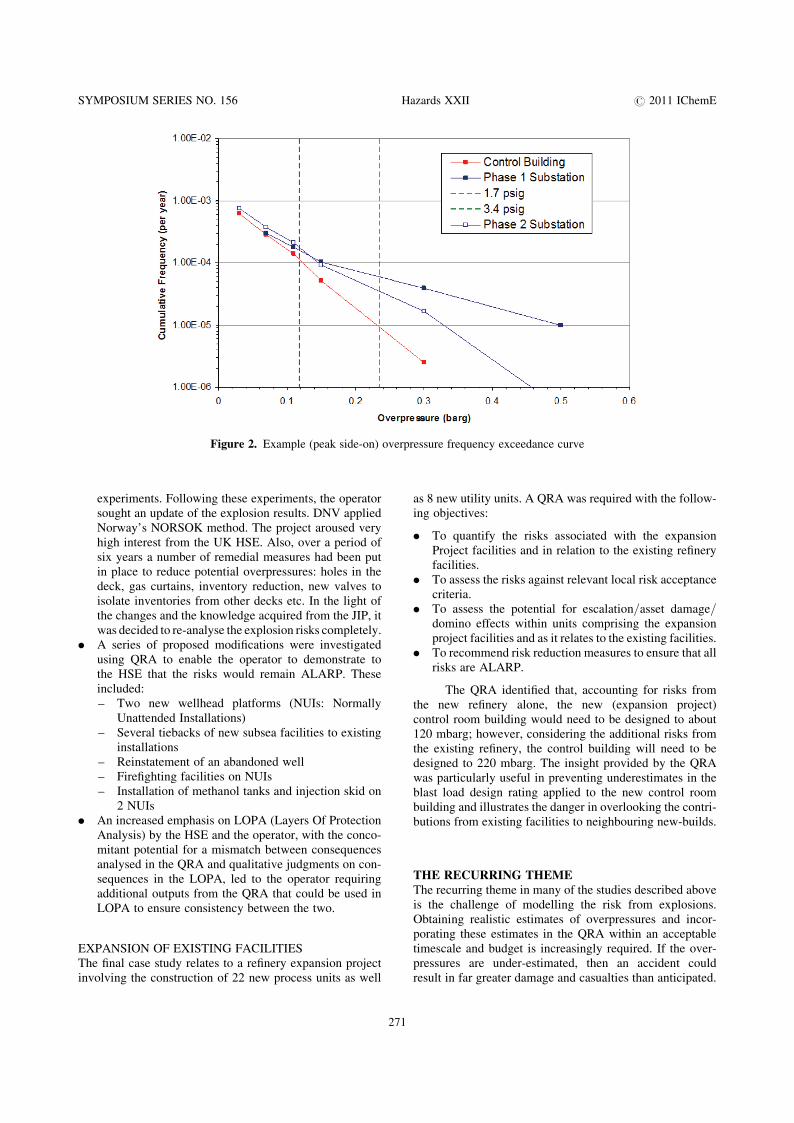
Exceedance curves obtained from the QRA were usedto define:
. Appropriate fire and blast design loading to buildingsand safety critical elements.
. Optimum (risk-based) sizes for LNG impoundmentbasins.
. Exclusion zones around the LNG/LPG berths.
. Maximum heights for the application of passive fireprotection over the entire length of the LNG trains, satis-fying a set of risk criteria.
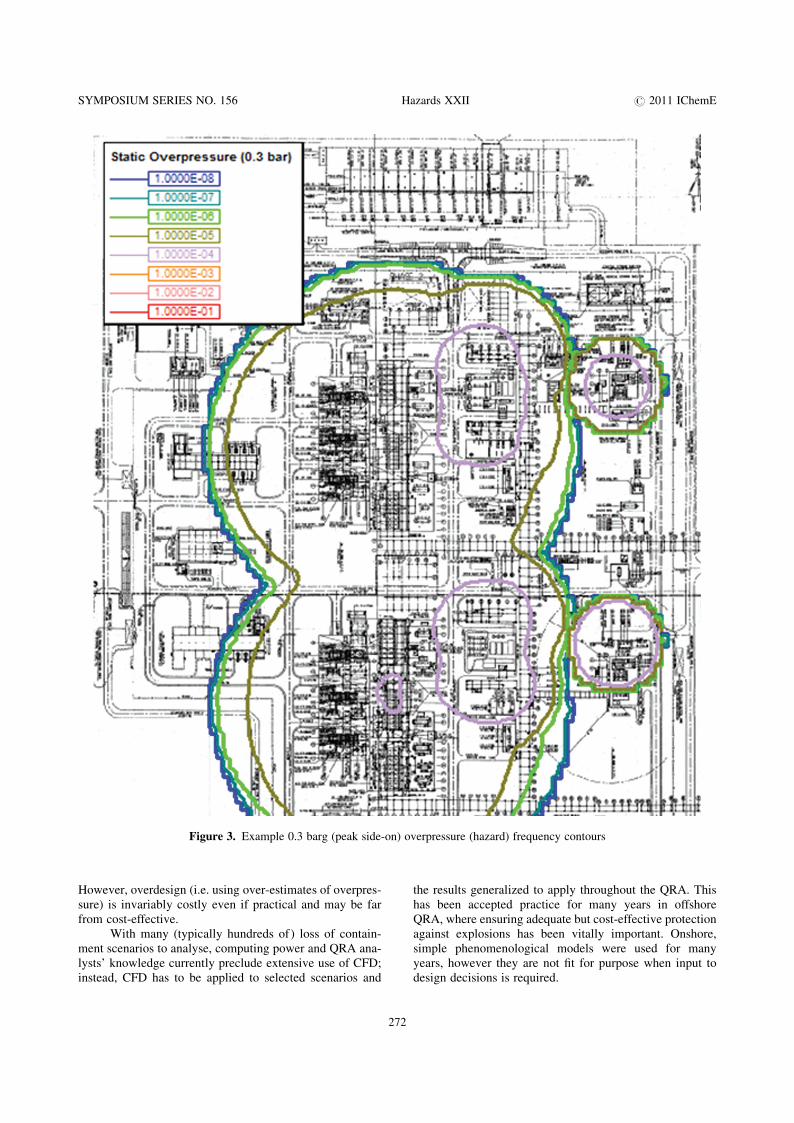
An example of an exceedance curve is provided inFigure 2. Furthermore, the results of the QRA, as illustratedin Figure 3 (overpressure frequency contours), enabled thedetermination of appropriate safety distances for the sitingof temporary occupied (construction) facilities duringSIMOPS.
ENGINEERING, PROCUREMENT AND
CONSTRUCTION (EPC) STAGEThis case study relates to the detailed engineering designand construction stages of a gas compressor facility. AQRA was required with the following objectives:
. To quantify the risks associated with the project facili-ties and operations.
. To assess the associated risks to assets, loss of pro-duction and the environment.
. To assess the acceptability of the quantified risks, toidentify the risk drivers and to propose potentialmeasures for risk reduction as the detailed design pro-gresses.
. To assist in demonstrating that the risks are ALARP.
. To assess the effectiveness of safety systems.
. To check or redefine safety distances, fire zoning, fire-proofing, fire and gas detector arrangements.
. To perform Safety Critical Element analysis anddevelop performance standards for each.
. To perform escape and evacuation analysis and proposethe number and location of muster points to aid in devel-oping escape routing plans.
The above objectives were largely met by using acombination of the various risk reporting capabilities(exceedance curves, hazard frequency/risk contour maps,risk ranking reports etc) available within the DNVBLAST (and now Phast Risk 6.6) software tool (seeFigures 2 and 3 for example).
OPERATION AND MODIFICATIONQRA can provide vital support during the operation of aprocess installation, both to support changes to the installa-tion and in the light of new knowledge or data. This is illus-trated by a series of studies for one offshore operator with anasset comprising 18 installations:
. For one platform, high overpressures had previouslybeen predicted by the FLACs CFD model prior to JIP
SYMPOSIUM SERIES NO. 156 Hazards XXII # 2011 IChemE
Figure 2. Example (peak side-on) overpressure frequency exceedance curve
experiments. Following these experiments, the operatorsought an update of the explosion results. DNV appliedNorway’s NORSOK method. The project aroused veryhigh interest from the UK HSE. Also, over a period ofsix years a number of remedial measures had been putin place to reduce potential overpressures: holes in thedeck, gas curtains, inventory reduction, new valves toisolate inventories from other decks etc. In the light ofthe changes and the knowledge acquired from the JIP, itwas decided to re-analyse the explosion risks completely.
. A series of proposed modifications were investigatedusing QRA to enable the operator to demonstrate tothe HSE that the risks would remain ALARP. Theseincluded:– Two new wellhead platforms (NUIs: Normally
Unattended Installations)– Several tiebacks of new subsea facilities to existing
installations– Reinstatement of an abandoned well– Firefighting facilities on NUIs– Installation of methanol tanks and injection skid on
2 NUIs. An increased emphasis on LOPA (Layers Of Protection
Analysis) by the HSE and the operator, with the conco-mitant potential for a mismatch between consequencesanalysed in the QRA and qualitative judgments on con-sequences in the LOPA, led to the operator requiringadditional outputs from the QRA that could be used inLOPA to ensure consistency between the two.
EXPANSION OF EXISTING FACILITIESThe final case study relates to a refinery expansion projectinvolving the construction of 22 new process units as well
27
as 8 new utility units. A QRA was required with the follow-ing objectives:
. To quantify the risks associated with the expansionProject facilities and in relation to the existing refineryfacilities.
. To assess the risks against relevant local risk acceptancecriteria.
. To assess the potential for escalation/asset damage/domino effects within units comprising the expansionproject facilities and as it relates to the existing facilities.
. To recommend risk reduction measures to ensure that allrisks are ALARP.
The QRA identified that, accounting for risks fromthe new refinery alone, the new (expansion project)control room building would need to be designed to about120 mbarg; however, considering the additional risks fromthe existing refinery, the control building will need to bedesigned to 220 mbarg. The insight provided by the QRAwas particularly useful in preventing underestimates in theblast load design rating applied to the new control roombuilding and illustrates the danger in overlooking the contri-butions from existing facilities to neighbouring new-builds.
THE RECURRING THEMEThe recurring theme in many of the studies described aboveis the challenge of modelling the risk from explosions.Obtaining realistic estimates of overpressures and incor-porating these estimates in the QRA within an acceptabletimescale and budget is increasingly required. If the over-pressures are under-estimated, then an accident couldresult in far greater damage and casualties than anticipated.
1
SYMPOSIUM SERIES NO. 156 Hazards XXII # 2011 IChemE
Figure 3. Example 0.3 barg (peak side-on) overpressure (hazard) frequency contours
However, overdesign (i.e. using over-estimates of overpres-sure) is invariably costly even if practical and may be farfrom cost-effective.
With many (typically hundreds of) loss of contain-ment scenarios to analyse, computing power and QRA ana-lysts’ knowledge currently preclude extensive use of CFD;instead, CFD has to be applied to selected scenarios and
27
the results generalized to apply throughout the QRA. Thishas been accepted practice for many years in offshoreQRA, where ensuring adequate but cost-effective protectionagainst explosions has been vitally important. Onshore,simple phenomenological models were used for manyyears, however they are not fit for purpose when input todesign decisions is required.
2
SYMPOSIUM SERIES NO. 156 Hazards XXII # 2011 IChemE
The well-known Multi Energy and Baker Strehlowmodels provide a considerable advance to bridge this gap.Until recently, they weren’t available in general purposeQRA software, although they formed the basis of DNV’sin-house tool BLAST; they are now available in DNV’scommercial Phast Risk 6.6, enabling their routine use inQRA for all the scenarios modelled.
CFD remains a tool for use by specialists but it isincreasingly used as an adjunct to onshore QRA, to enablethe inputs to the QRA’s inbuilt phenomenological modelsto be tuned. This increases confidence in the realism ofthe QRA results, giving greater confidence for major invest-ment decisions.
FUTURE DIRECTIONS FOR QRA. QRAs are increasingly being looked upon as sources
of asset/process design information. QRA tools willtherefore need to be constantly updated to adapt to thegrowing list of requirements.
. Detailed QRA results can be used, and are increasinglybeing used, to identify the key process safety technicalcontrols; this in turn can be used to ensure these controlsare maintained and to show how, if they becomedegraded, the risks will materially increase.
. Environmental risks are only crudely modelled bycurrent process QRA models. As increased attention ispaid to these, the scope of QRA models will need tobe extended in order to address them. Environmentalrisk acceptance criteria will also be required.
. QRA tools are generally either suited for onshore oroffshore risk assessments. With the increasing comput-ing capabilities now available to users, single tools sup-porting both onshore and offshore risk modellingrequirements are likely to emerge (e.g. DNV’s Phast 7project).
273
. Most QRA tools employ phenomenological models, andin some cases, look-up functions based on outputs fromCFD studies. With the ongoing advances in computing,QRA software tools are in future likely to fully supportCFD based deterministic modelling in addition to exist-ing phenomenological modelling.
. In the meantime, there is increased interest in employingCFD models to tune phenomenological models (e.g. theGAMES project and the recent updates to the Baker-Strehlow explosion model). It is likely that this trendwill continue while QRA tools with full CFD capabili-ties are being developed.
REFERENCESCullen, Hon. Lord, 1990. The public inquiry into the Piper
Alpha disaster, Department of Energy, London: HMSO.
Eggen, J B M M, 1998. GAME: Development of guidance for
the application of the multi-energy method, TNO Prins
Maurits Laboratory, ISBN 0717616517.
HSE, 1988. The tolerability of risk from nuclear power stations,
London: HMSO, ISBN 0118839829.
NPD, 1981. Guidelines for Safety Evaluation of Platform
Conceptual Design.
Salter, D H, 1982. Risk analysis of six potentially hazardous
industrial objects in the Rijnmond Area: a pilot study. A
report to the Rijnmond Public Authority (“The COVO
study”), Dordrecht, Boston, London: D. Reidel.
Turner, R M and Fairhurst, S, 1989. Risk Criteria for Land Use
Planning in the Vicinity of Major Industrial Hazards, HSE,
London: HMSO.
Werex, W P M, van den Berg, A C and van Leeuven, D, 1998.
Application of correlations to quantify the source strength of
vapour cloud explosions in realistic situations, final report
for the project ‘GAMES’, TNO report PML 1998-C53.