noaa climate science & services monthly climate update
TRANSCRIPT

NOAA Climate Science & Services Monthly Climate Update
December 20, 2012
A look back at November and a preview of Jan. through Mar.

2 December 20, 2012 Monthly Climate Webinar
November 2012 Temperatures: • 5th warmest November globally (+0.67°C / +1.21°F) • Land: 6th warmest; Ocean: 6th warmest • N. Hemisphere: 6th warmest November • S. Hemisphere 3rd warmest November
Regional Analysis: • Australia: 4th highest max temperatures on record • New Zealand: 0.9°C cooler than average • Croatia: locally 2.4°C to 4.4°C above average
November 2012 Precipitation: • N. Hemisphere snow cover 5th largest on record
N. America: 12th largest; Eurasia 8th largest • U.K. precipitation 111 percent of average. • Spain precipitation 150 percent of average. Dry: India, Australia, Eastern Europe, South Africa Wet: Southeast Asia, Western Europe, West Africa

3 December 20, 2012 Monthly Climate Webinar
January-November 2012 Temperatures • 8th warmest year-to-date globally (+0.59°C/1.06°F) • Land: 5th warmest; Ocean: 9th warmest • N. Hemisphere: 4th warmest; S. Hemisphere: 9th warmest

4 December 20, 2012 Monthly Climate Webinar
November Arctic Sea Ice: 3rd smallest on record • Arctic sea ice expanded rapidly in November • Below-average ice in Kara and Barents Seas • November 2012 sea ice 12.2 percent below average

5
Nationally: 20th warmest and 8th driest November Drought continues for 61.8% of contiguous United States
November Temperature: 2.1°F above average •Warm: The West. AZ, CO, NM, UT, and WY top ten
warm for the month. •Cool: The East. NC had a top ten cool month.
November Precipitation: 0.93” below average •Wet: Pacific Northwest and Northern Plains. •Dry: Central U.S., Midwest, and East Coast. 22
states had a top ten dry month.
December 20, 2012 Monthly Climate Webinar
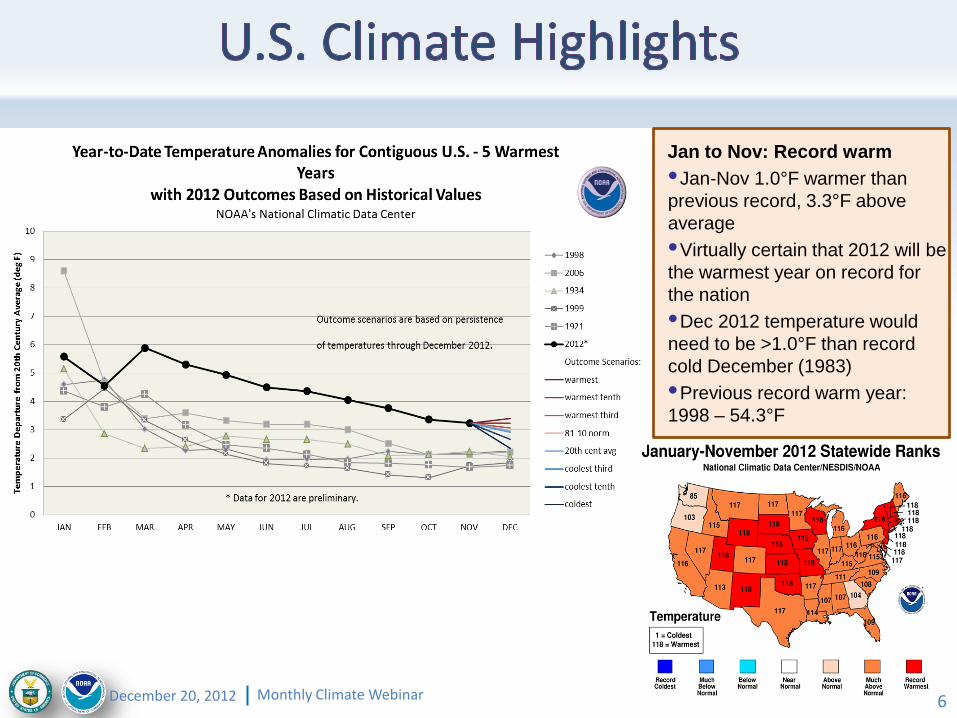
December 20, 2012 Monthly Climate Webinar 6
Jan to Nov: Record warm •Jan-Nov 1.0°F warmer than previous record, 3.3°F above average •Virtually certain that 2012 will be the warmest year on record for the nation •Dec 2012 temperature would need to be >1.0°F than record cold December (1983) •Previous record warm year: 1998 – 54.3°F

December 20, 2012 Monthly Climate Webinar 7

8 December 2012 Monthly Climate Webinar
Event , Location, Dates Brief Summary Deaths
Southeast/Ohio Valley Tornadoes March 2-3 2012
Outbreak of tornadoes over the southeast and Ohio Valley (AL, GA ,IN ,OH ,KY ,TN) with 75 confirmed tornadoes including an EF-4, the deadliest single tornado of the year that struck Henryville, Ind.
42
Texas Tornadoes April 2-3 2012
Outbreak of 22 confirmed tornadoes across the greater Dallas-Ft. Worth metropolitan area. There was considerable hail damage to aircraft at the Dallas-Ft. Worth International Airport cancelling many flights.
0
Great Plains Tornadoes April 13-14 2012
Outbreak of tornadoes over the midwest (KS, OK, NE, IA) with 98 confirmed tornadoes.
6
Midwest/Ohio Valley Severe Weather April 28-May 1 2012
Severe storms over the midwest and Ohio Valley states (MO, IL, IN, TX, KY) with 38 confirmed tornadoes. Hail greater than four inches in diameter and straight-line winds also caused considerable damage.
1
Southern Plains/Northeast Severe Weather May 25-30 2012
An outbreak of 27 confirmed tornadoes and severe storms raced across the Southern Plains, Midwest and Northeast (OK, TX, KS, MN, NY, PA) killing one person. Significant damage was caused by severe hail and wind.
1
Rockies/Southwest Severe Weather June 6-12 2012
Severe storms and damaging hail over several states (CO, TX, NM) with 25 confirmed tornadoes. Two major hail events created widespread damage across cities in Colorado and Texas.
0

9 December 2012 Monthly Climate Webinar
Event , Location, Dates Brief Summary Deaths
Plains/East/North-east Severe Weather June 29-July 2 2012
Sustained outbreak of thunderstorms / high winds from a strong derecho event over the central, eastern, and northeastern states (IL, IN, KY, MD, DC, NC, NJ, OH, SC, VA, WV).
28
Hurricane Isaac August 2012
Category 1 hurricane made landfall over Louisiana. Isaac's slow motion and large size led to a large storm surge and flooding rains. This created damage across several southeastern states (LA, MS, AL, FL).
9
Western Wildfires Summer-Fall, 2012
Wildfires burned over 9.1 million acres across the U.S. in 2012. This is the 2nd highest annual total since the year 2000, only exceeded by 2006 when 9.4 million acres burned. The most damaging wildfires occurred in the Western states (CO, ID, WY, MT, CA, NV, OR, WA). Colorado experienced the most costly wildfires (e.g., Waldo Canyon fire)
8
U.S. Drought/Heatwave 2012
The 2012 drought is the most extensive drought to affect the U.S. since the 1930s. Drought conditions have affected over half of the country for a majority of the year including the central agriculture states causing widespread failure of many crops and challenges to water-intensive industries and commerce.
123 (excess
mortality unknown)
Sandy October 2012
Sandy caused devastation in several northeastern states (NJ, NY, MD, PA, MA) due to high wind and coastal storm surge. This hurricane also joined with a developing Nor'easter, which intensified the storm's strength. Sandy's impact on major population centers caused widespread interruption to critical water and electrical services and also caused 131 deaths.
131

10 December 2012 Monthly Climate Webinar
*Please note that the map reflects a summation of billion dollar events for each state affected (i.e., it does not mean that each state shown suffered at least $1 billion in losses for each event)

11 December 20, 2012 Monthly Climate Webinar
• ENSO-neutral conditions continue • Equatorial sea surface temps. remain
above average across Western and Central Pacific
• Atmospheric circulation over tropical Pacific is near average
• ENSO-neutral favored through the N. Hemisphere winter 2012-13

12 December 20, 2012 Monthly Climate Webinar
January Average Temperature Probability
January Total Precipitation Probability

13 December 20, 2012 Monthly Climate Webinar
Jan–Feb–Mar Average Temperature Probability
Jan–Feb–Mar Total Precipitation Probability

14 December 20, 2012 Monthly Climate Webinar

Today’s Presentation: • http://www.ncdc.noaa.gov/sotc/briefings
NOAA’s National Climatic Data Center: www.ncdc.noaa.gov
• Monthly climate reports (U.S. & Global): www.ncdc.noaa.gov/sotc/
• Billion Dollar Weather/Climate Disasters: http://www.ncdc.noaa.gov/billions/
NOAA’s Climate Prediction Center: www.cpc.ncep.noaa.gov
U.S. Drought Monitor: http://www.drought.gov
Climate Portal: www.climate.gov
Media Contacts • [email protected], 202-429-6127 (NOAA/Comms) • [email protected], 828-257-3136 (NOAA/NCDC)
15 December 20, 2012 Monthly Climate Webinar