climate protection program update
TRANSCRIPT
Climate Protection Program
Update
Climate Protection Committee
January 15, 2015
Henry Hilken,
Director of Planning, Rules & Research
Abby Young
Principal Environmental Planner
AGENDA: 4
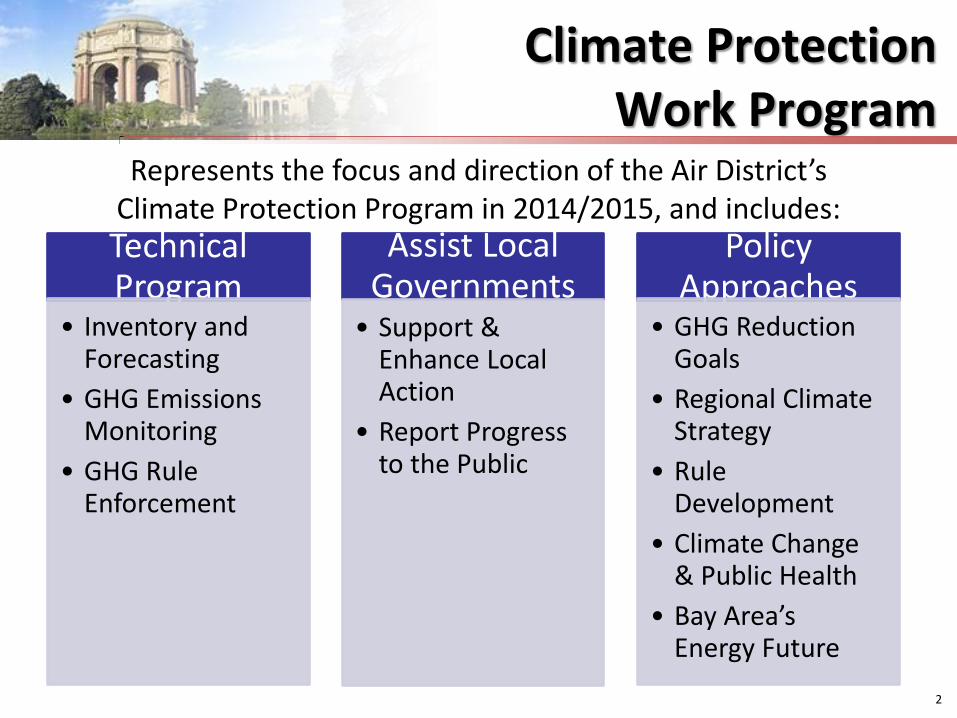
Climate Protection Work Program
Policy Approaches
• GHG Reduction Goals
• Regional Climate Strategy
• Rule Development
• Climate Change & Public Health
• Bay Area’s Energy Future
Assist Local Governments
• Support & Enhance Local Action
• Report Progress to the Public
Technical Program
• Inventory and Forecasting
• GHG Emissions Monitoring
• GHG Rule Enforcement
Represents the focus and direction of the Air District’s Climate Protection Program in 2014/2015, and includes:
2
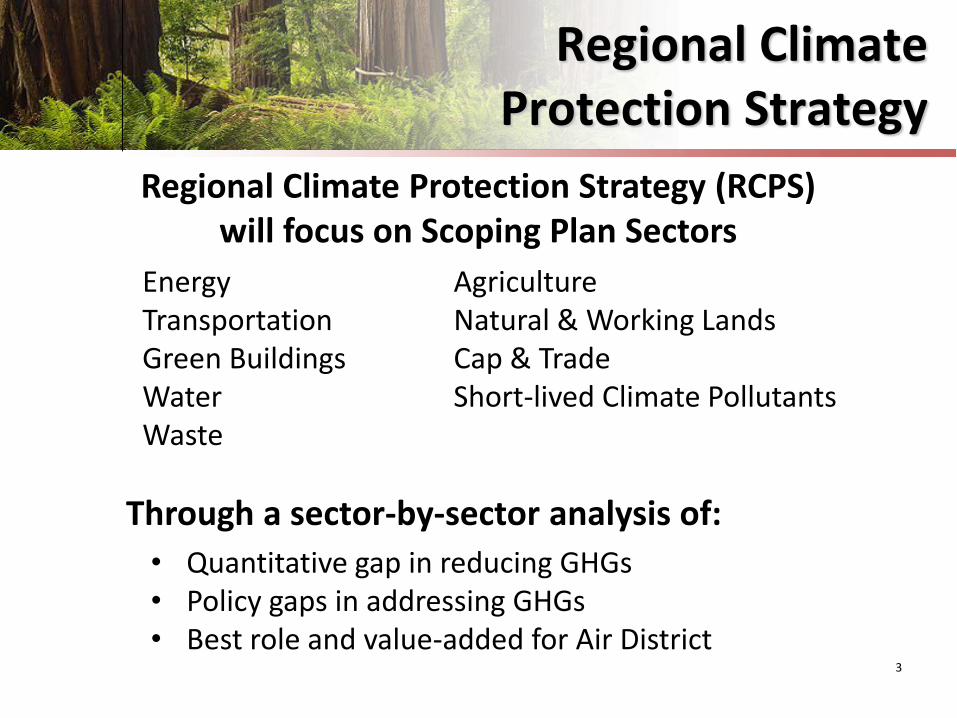
Regional Climate Protection Strategy
3
Regional Climate Protection Strategy (RCPS) will focus on Scoping Plan Sectors
Energy Transportation Green Buildings Water Waste
Agriculture Natural & Working Lands Cap & Trade Short-lived Climate Pollutants
Through a sector-by-sector analysis of:
• Quantitative gap in reducing GHGs • Policy gaps in addressing GHGs • Best role and value-added for Air District
4
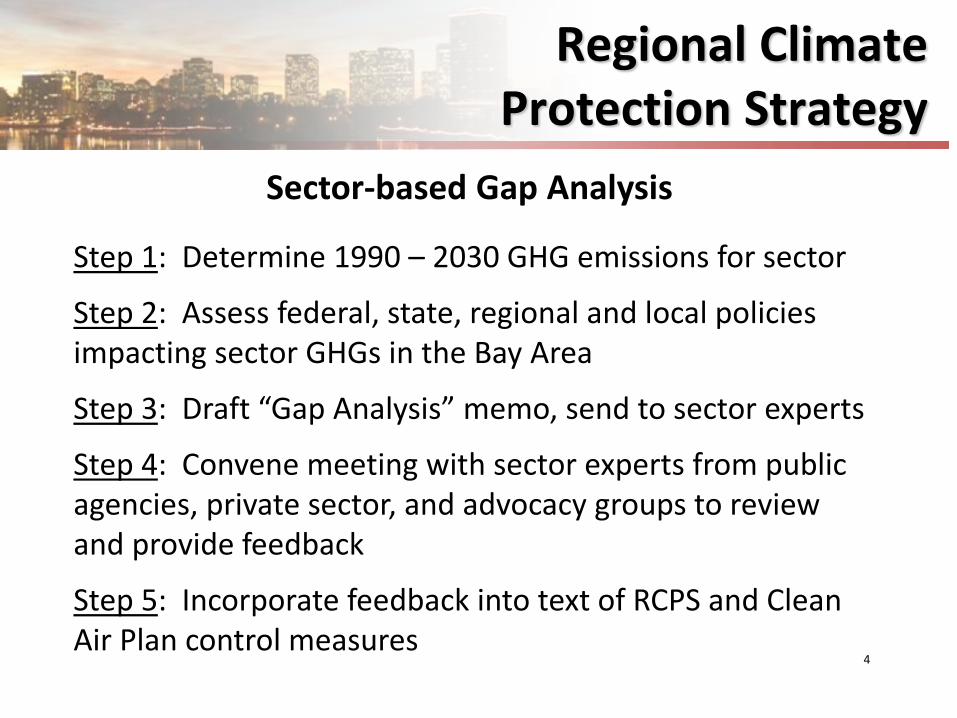
Sector-based Gap Analysis
Regional Climate Protection Strategy
Step 1: Determine 1990 – 2030 GHG emissions for sector
Step 2: Assess federal, state, regional and local policies impacting sector GHGs in the Bay Area
Step 3: Draft “Gap Analysis” memo, send to sector experts
Step 4: Convene meeting with sector experts from public agencies, private sector, and advocacy groups to review and provide feedback
Step 5: Incorporate feedback into text of RCPS and Clean Air Plan control measures
Regional Climate Protection Strategy
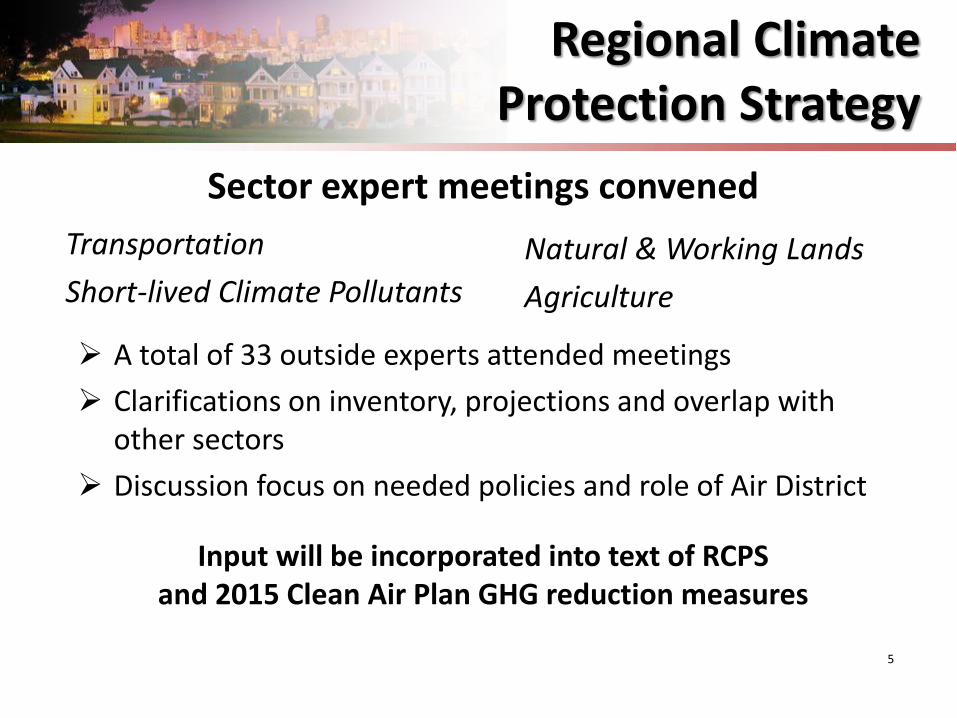
Sector expert meetings convened
Transportation
Short-lived Climate Pollutants
A total of 33 outside experts attended meetings
Clarifications on inventory, projections and overlap with other sectors
Discussion focus on needed policies and role of Air District
Input will be incorporated into text of RCPS and 2015 Clean Air Plan GHG reduction measures
5
Natural & Working Lands
Agriculture
Regional Climate Protection Strategy
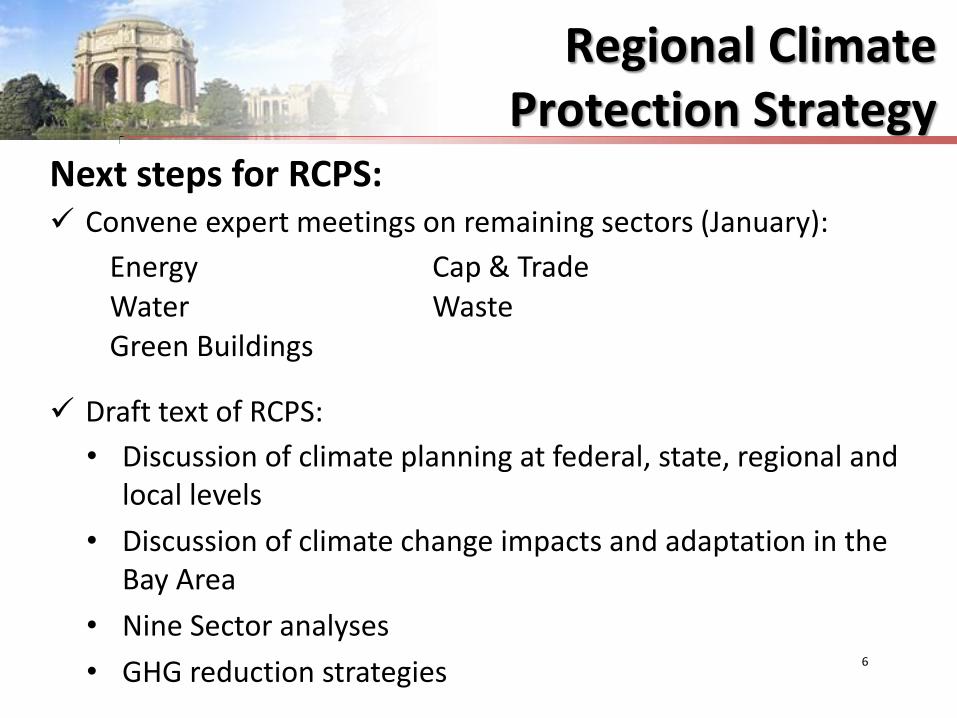
Next steps for RCPS: Convene expert meetings on remaining sectors (January):
Energy Cap & Trade Water Waste Green Buildings
Draft text of RCPS:
• Discussion of climate planning at federal, state, regional and local levels
• Discussion of climate change impacts and adaptation in the Bay Area
• Nine Sector analyses
• GHG reduction strategies 6
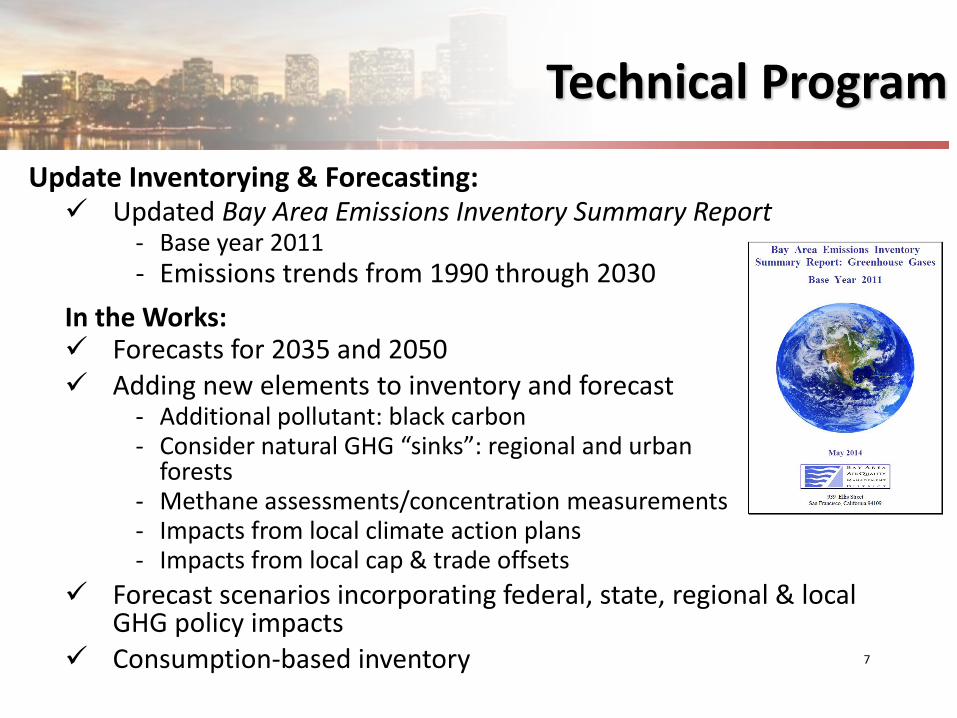
Update Inventorying & Forecasting: Updated Bay Area Emissions Inventory Summary Report
- Base year 2011 - Emissions trends from 1990 through 2030
In the Works: Forecasts for 2035 and 2050 Adding new elements to inventory and forecast
- Additional pollutant: black carbon - Consider natural GHG “sinks”: regional and urban
forests - Methane assessments/concentration measurements - Impacts from local climate action plans - Impacts from local cap & trade offsets
Forecast scenarios incorporating federal, state, regional & local GHG policy impacts
Consumption-based inventory
Technical Program
7
Technical Program
8
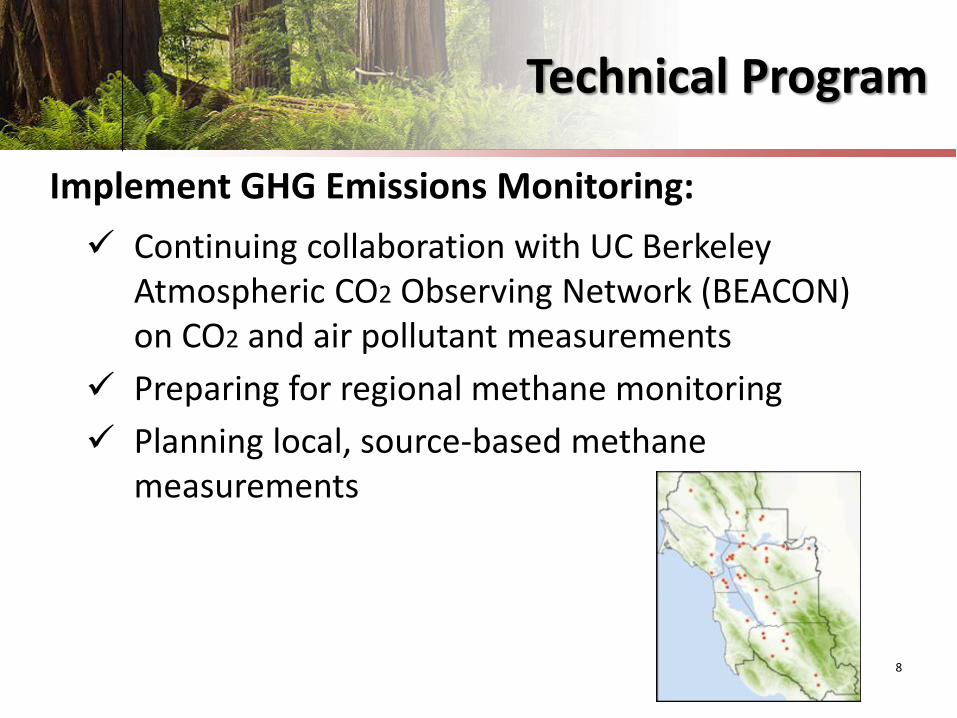
Implement GHG Emissions Monitoring:
Continuing collaboration with UC Berkeley Atmospheric CO2 Observing Network (BEACON) on CO2 and air pollutant measurements
Preparing for regional methane monitoring
Planning local, source-based methane measurements
Assist Local Governments
9
Support & Enhance Local Action:
Continue providing continuous support to local government staff: • Review and comment on climate action plans (CAPs)
• Respond to daily requests for information and guidance
• Facilitate the sharing of best practices
• Facilitate networking between local government and state agency staff
• Provide and help interpret data for GHG inventories
• Ongoing support and guidance for 58 Bay Area CAPs
Actively monitor and participate in state and federal initiatives that forward local climate planning
Assist Local Governments
41.3
17.5 27.6
7.4
Report Progress to the Public:
With JPC, convened webinar for 20+ local governments on GHG indicators
Need for standardized methods for measuring and analyzing data
Focus on fewer, but meaningful, indicators
Co-benefit indicators on health, economy help climate story resonate with broader audience
10
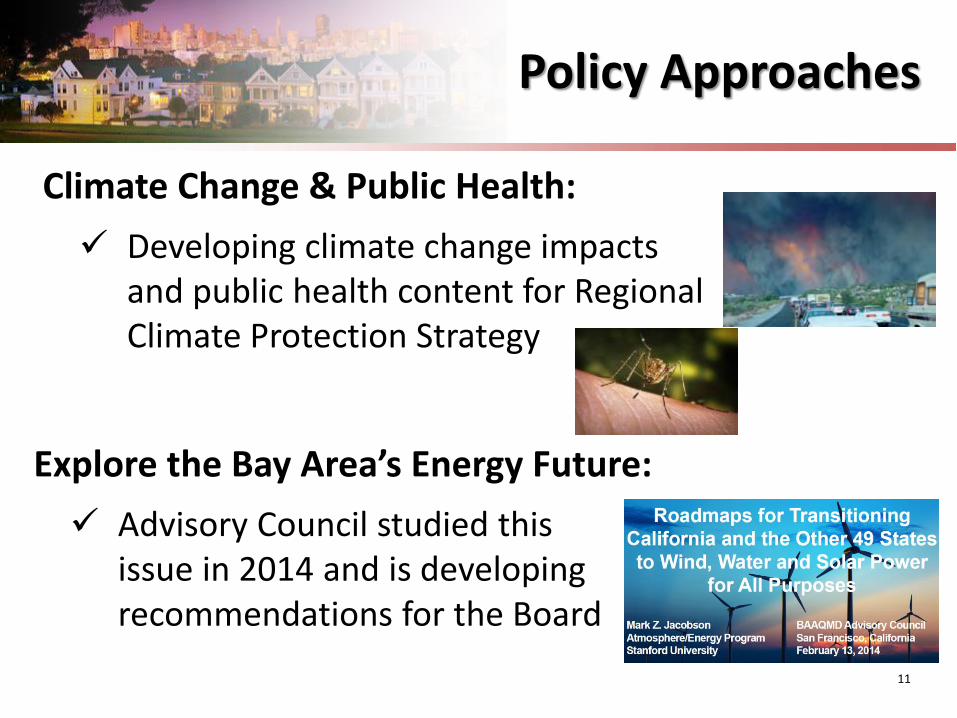
Policy Approaches
Explore the Bay Area’s Energy Future:
Advisory Council studied this issue in 2014 and is developing recommendations for the Board
11
Climate Change & Public Health:
Developing climate change impacts and public health content for Regional Climate Protection Strategy
Rule Development
41.3
17.5 27.6
7.4
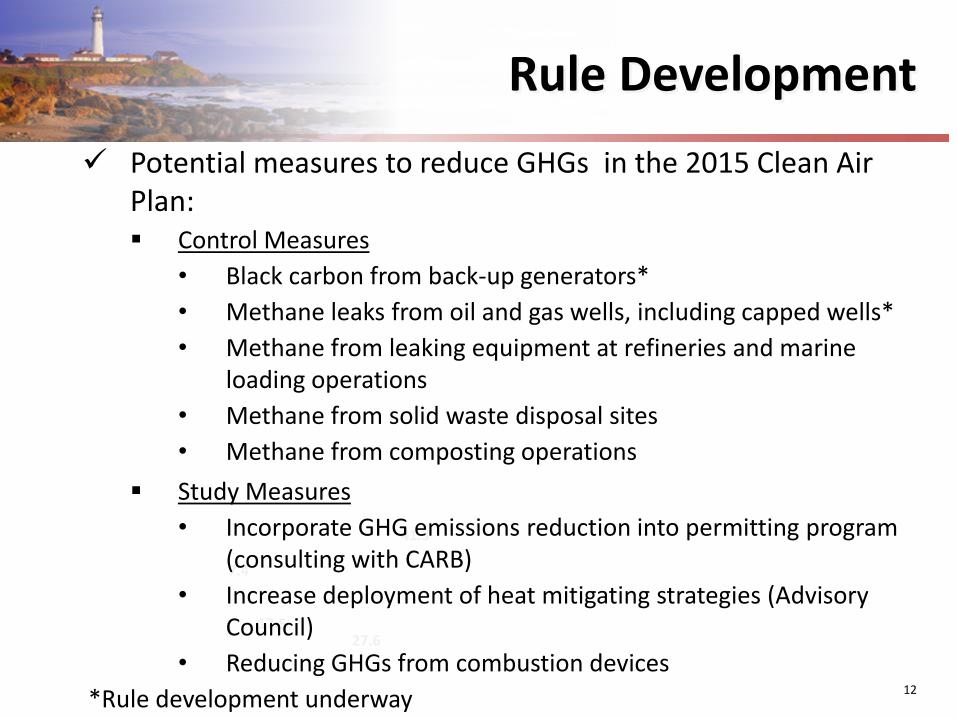
Potential measures to reduce GHGs in the 2015 Clean Air Plan: Control Measures
• Black carbon from back-up generators*
• Methane leaks from oil and gas wells, including capped wells*
• Methane from leaking equipment at refineries and marine loading operations
• Methane from solid waste disposal sites
• Methane from composting operations
Study Measures
• Incorporate GHG emissions reduction into permitting program (consulting with CARB)
• Increase deployment of heat mitigating strategies (Advisory Council)
• Reducing GHGs from combustion devices
*Rule development underway 12
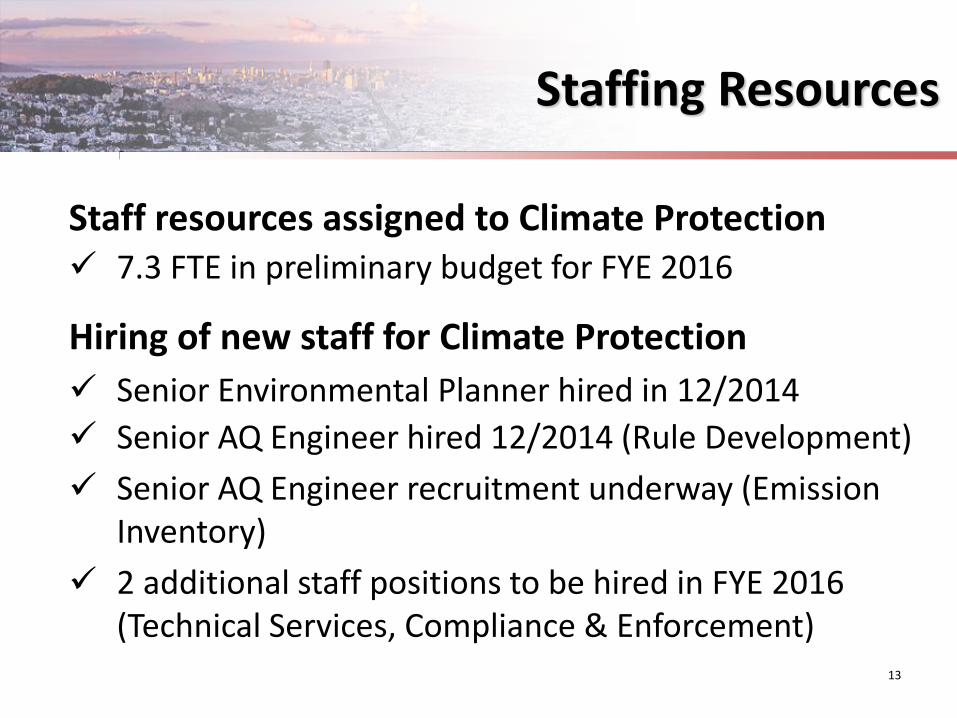
Staffing Resources
Staff resources assigned to Climate Protection 7.3 FTE in preliminary budget for FYE 2016
Hiring of new staff for Climate Protection
Senior Environmental Planner hired in 12/2014
Senior AQ Engineer hired 12/2014 (Rule Development)
Senior AQ Engineer recruitment underway (Emission Inventory)
2 additional staff positions to be hired in FYE 2016 (Technical Services, Compliance & Enforcement)
13
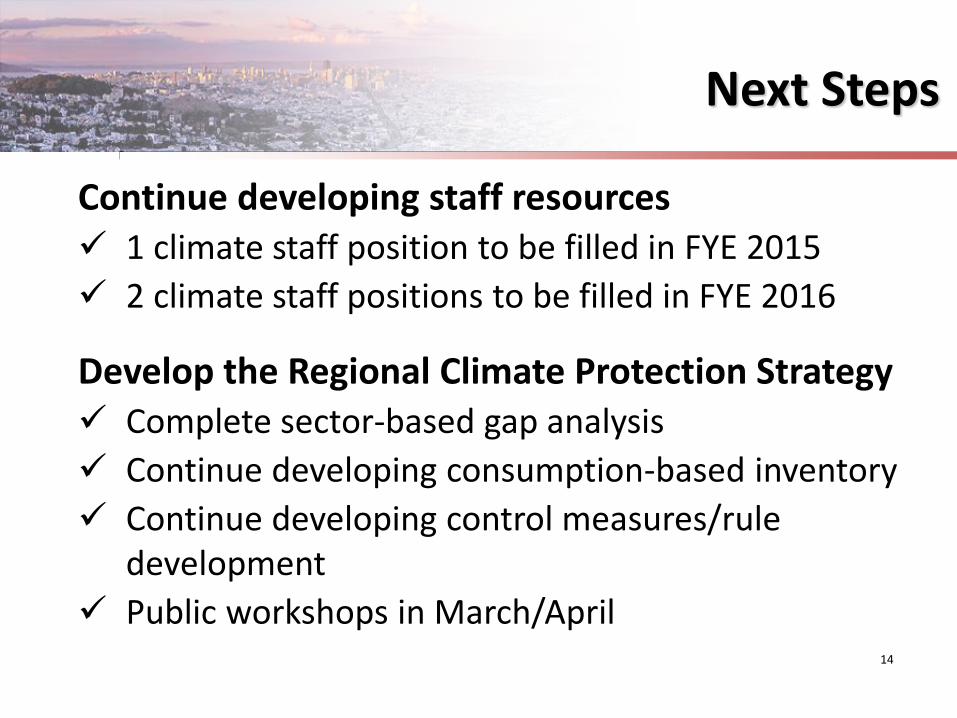
Next Steps
Continue developing staff resources 1 climate staff position to be filled in FYE 2015
2 climate staff positions to be filled in FYE 2016
Develop the Regional Climate Protection Strategy Complete sector-based gap analysis
Continue developing consumption-based inventory
Continue developing control measures/rule development
Public workshops in March/April 14
Observing CO2 in the
Bay Area:
Documenting emissions
changes as they
happen
Ronald C. Cohen
Professor of Chemistry
Professor of Earth and Planetary Science
UC Berkeley
$NSF, BAAQMD, HEI, UC Berkeley
AGENDA: 5

Climate
Slide 2
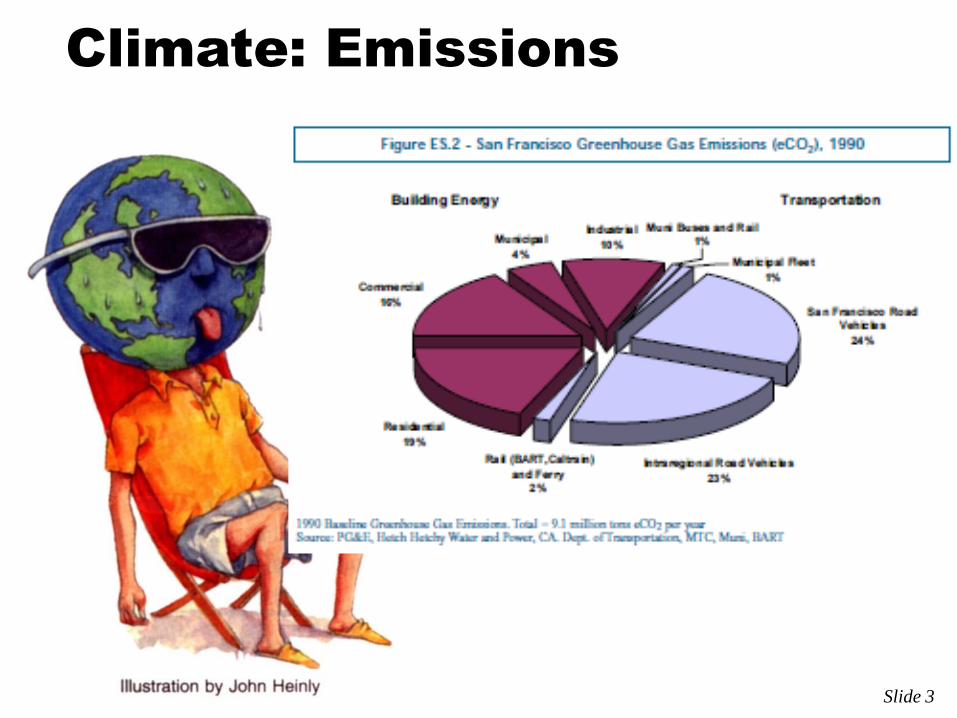
Climate: Emissions
Slide 3
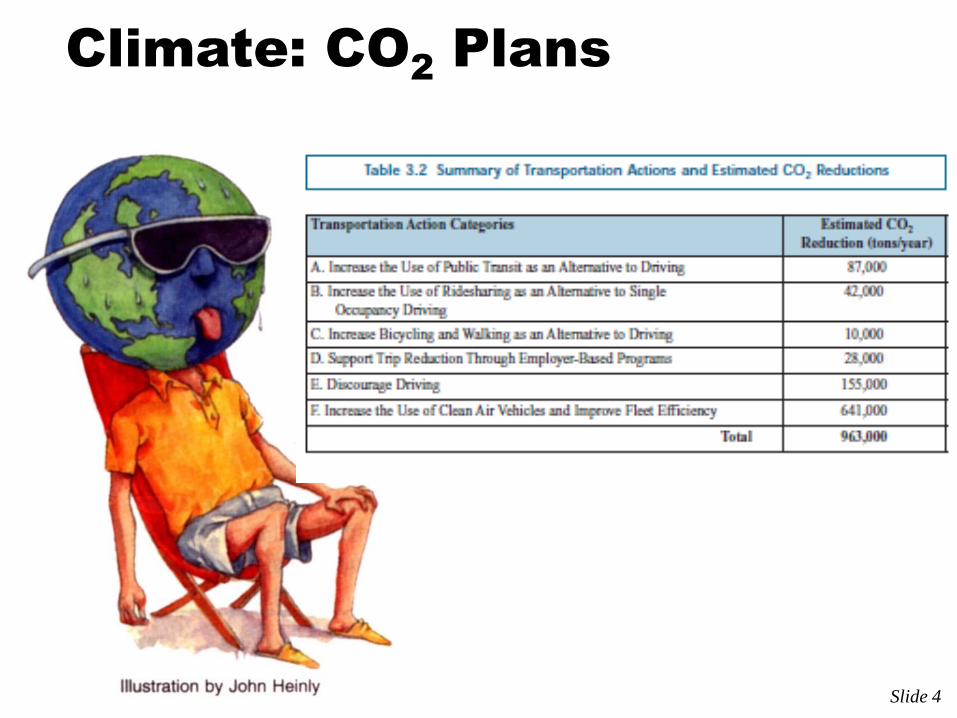
Climate: CO2 Plans
Slide 4
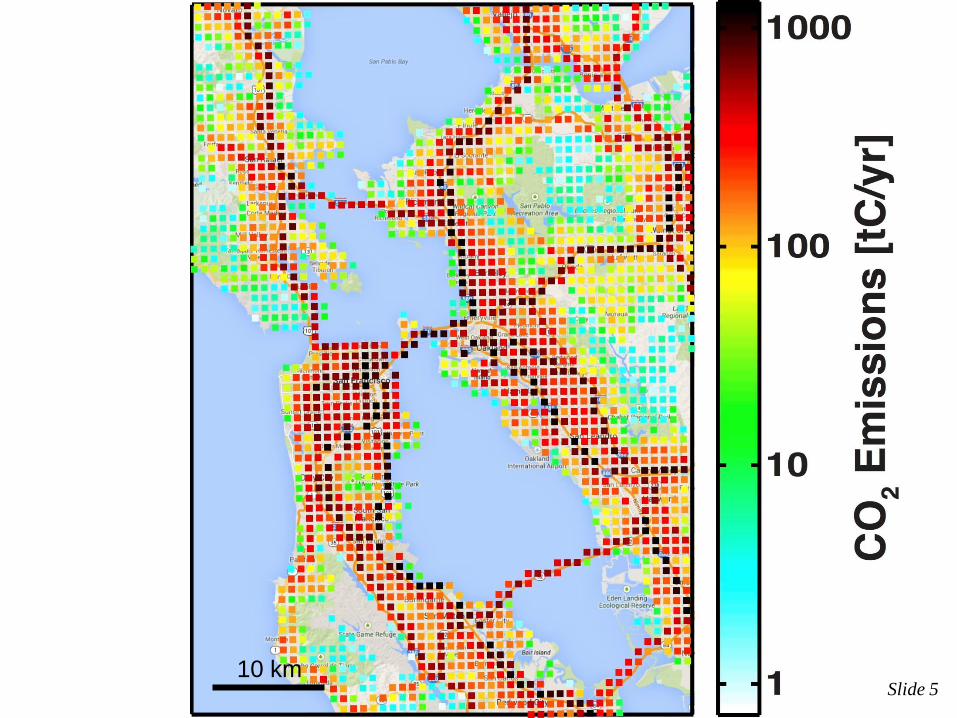
10 km Slide 5
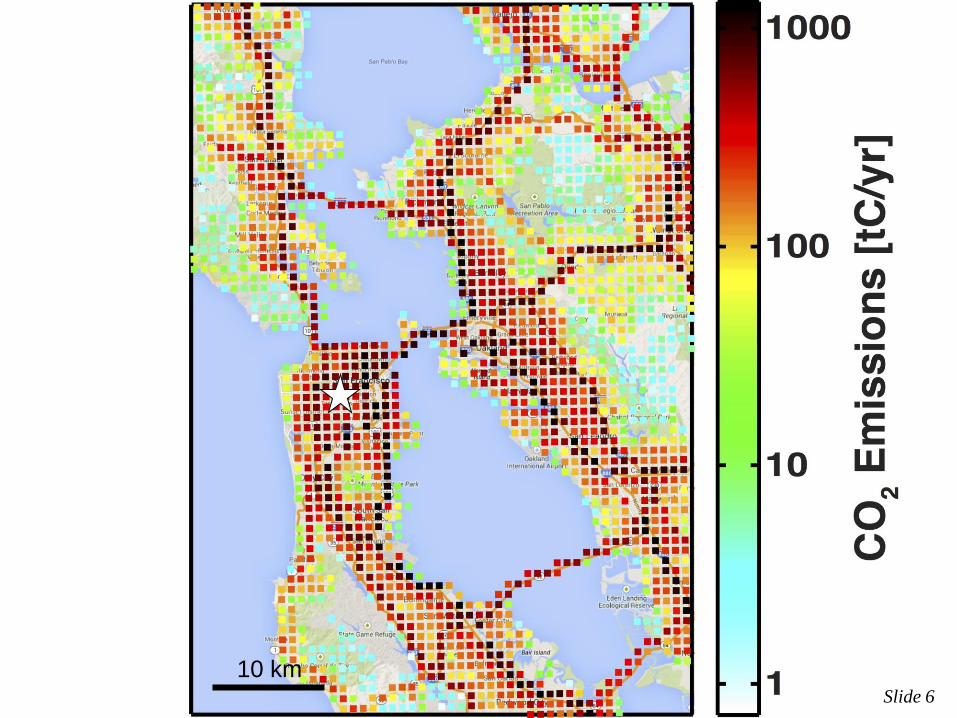
10 km Slide 6
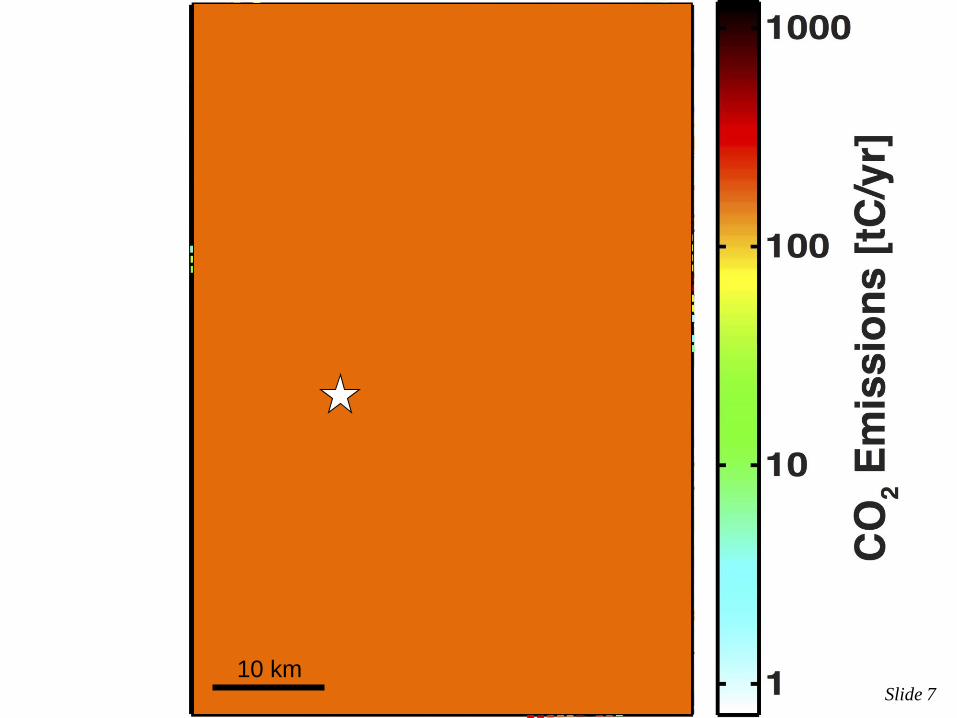
10 km Slide 7
How many measurements do we need?
Slide 8
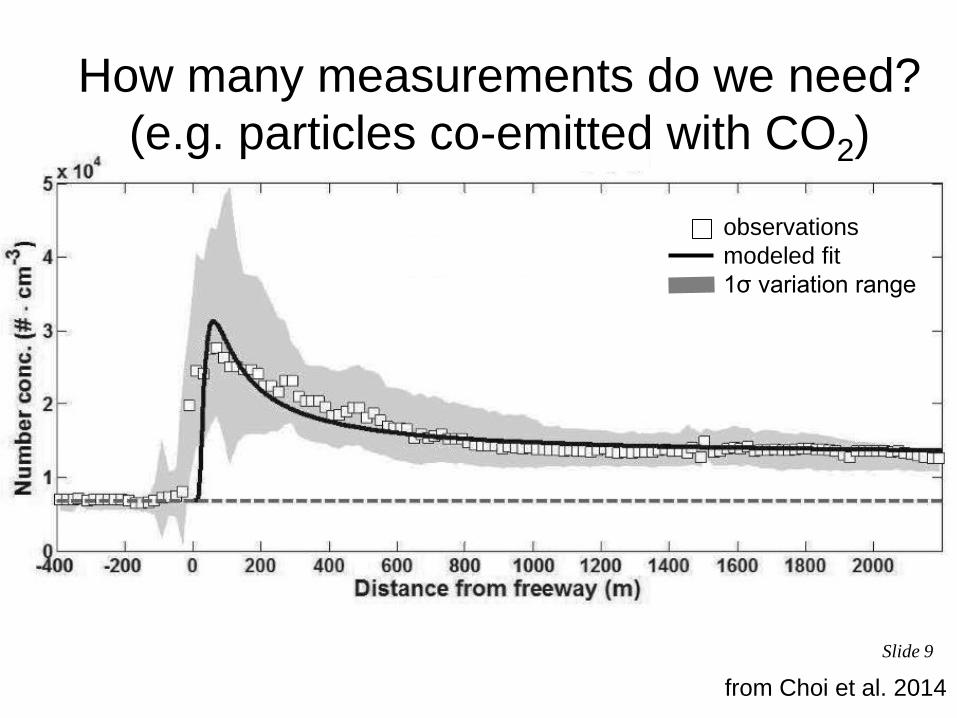
from Choi et al. 2014
observations
modeled fit
1σ variation range
How many measurements do we need?
(e.g. particles co-emitted with CO2)
Slide 9

from Choi et al. 2014
observations
modeled fit
1σ variation range
How many measurements do we need?
(e.g. particles co-emitted with CO2)
Slide 10
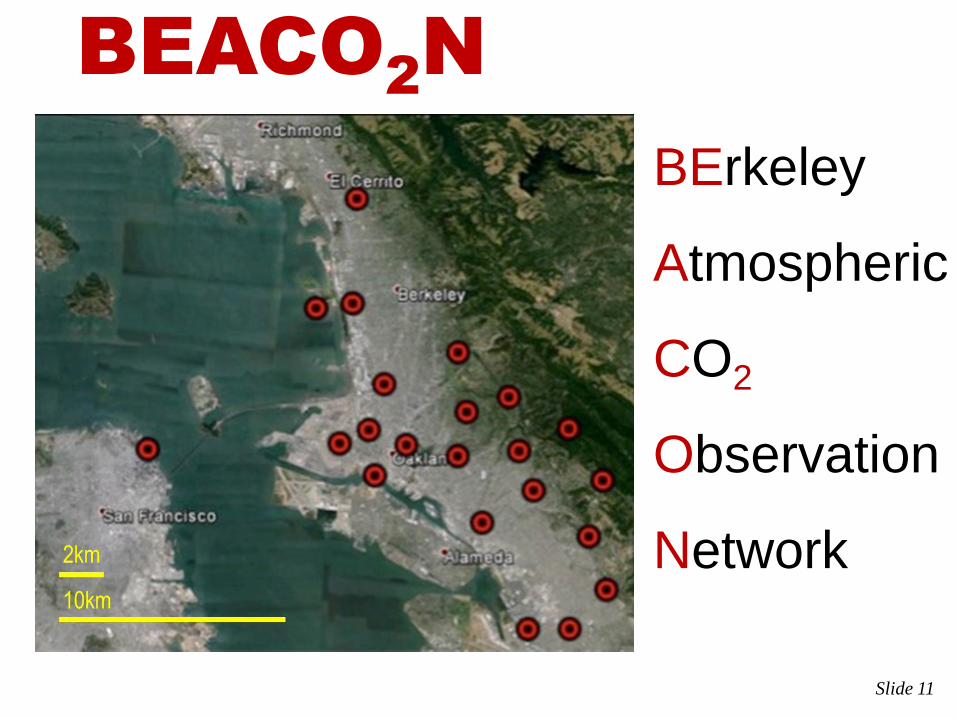
BErkeley
Atmospheric
CO2
Observation
Network
BEACO2N
Slide 11
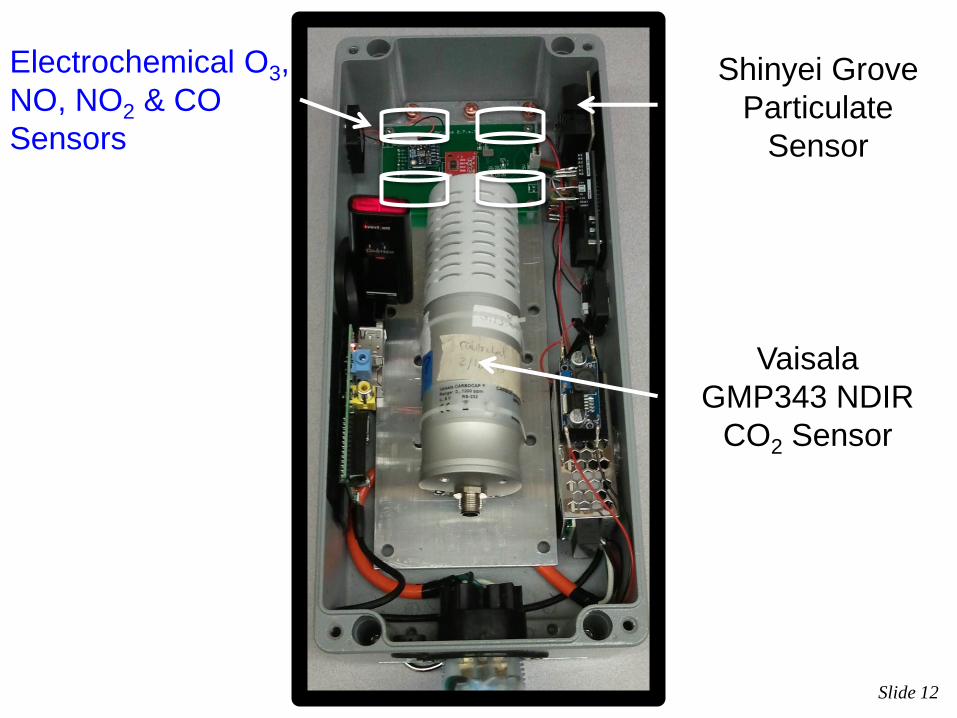
Vaisala
GMP343 NDIR
CO2 Sensor
Shinyei Grove
Particulate
Sensor
Electrochemical O3,
NO, NO2 & CO
Sensors
Slide 12
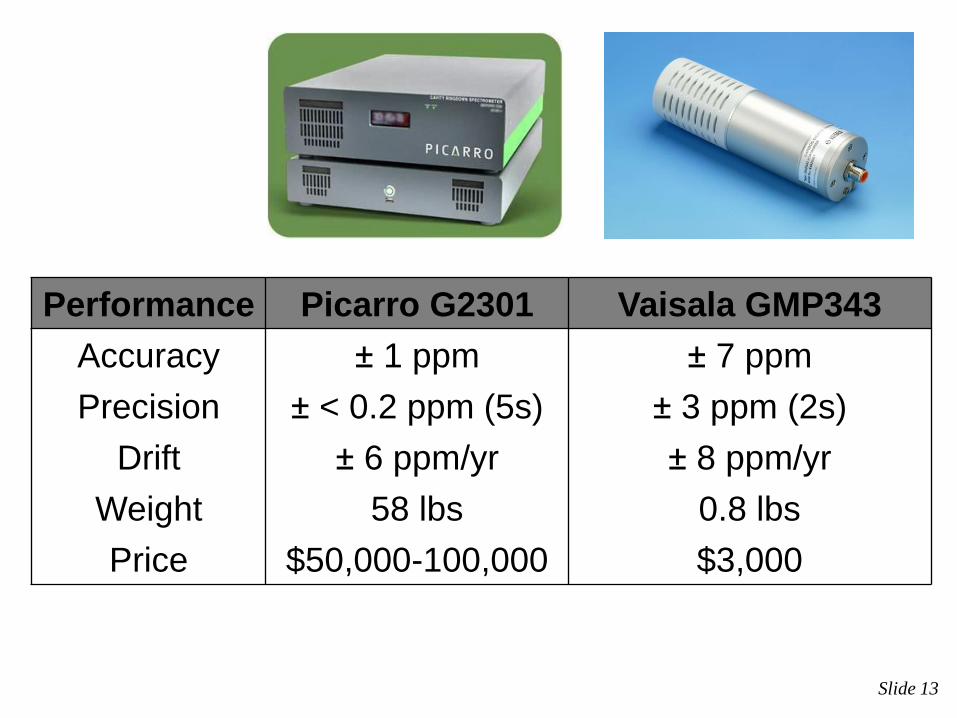
Performance Picarro G2301 Vaisala GMP343
Accuracy ± 1 ppm ± 7 ppm
Precision ± < 0.2 ppm (5s) ± 3 ppm (2s)
Drift ± 6 ppm/yr ± 8 ppm/yr
Weight 58 lbs 0.8 lbs
Price $50,000-100,000 $3,000
Slide 13
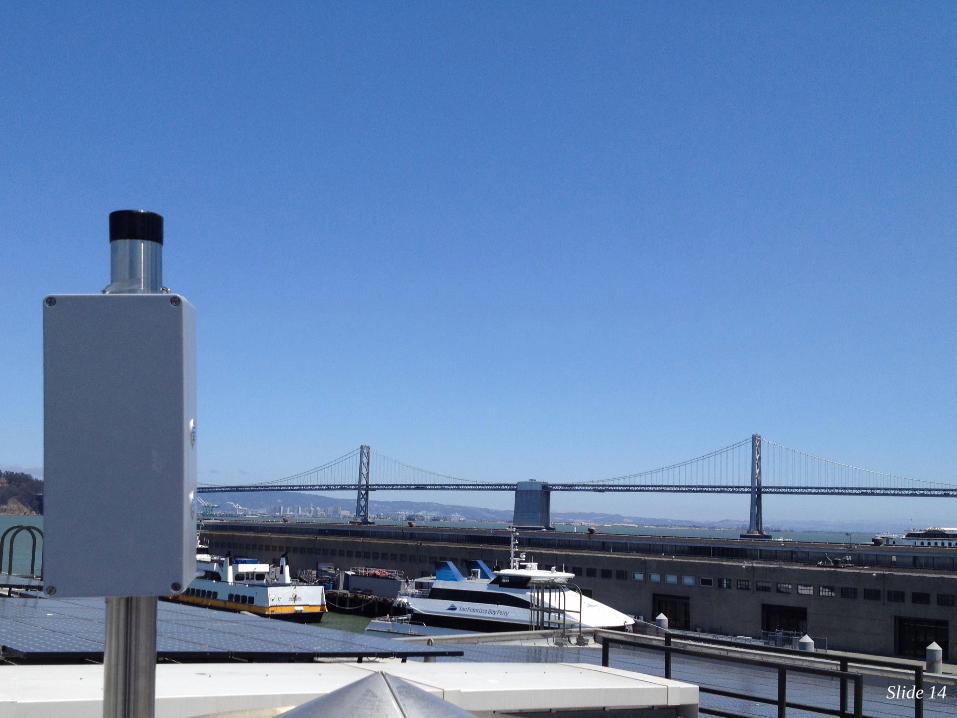
Slide 14
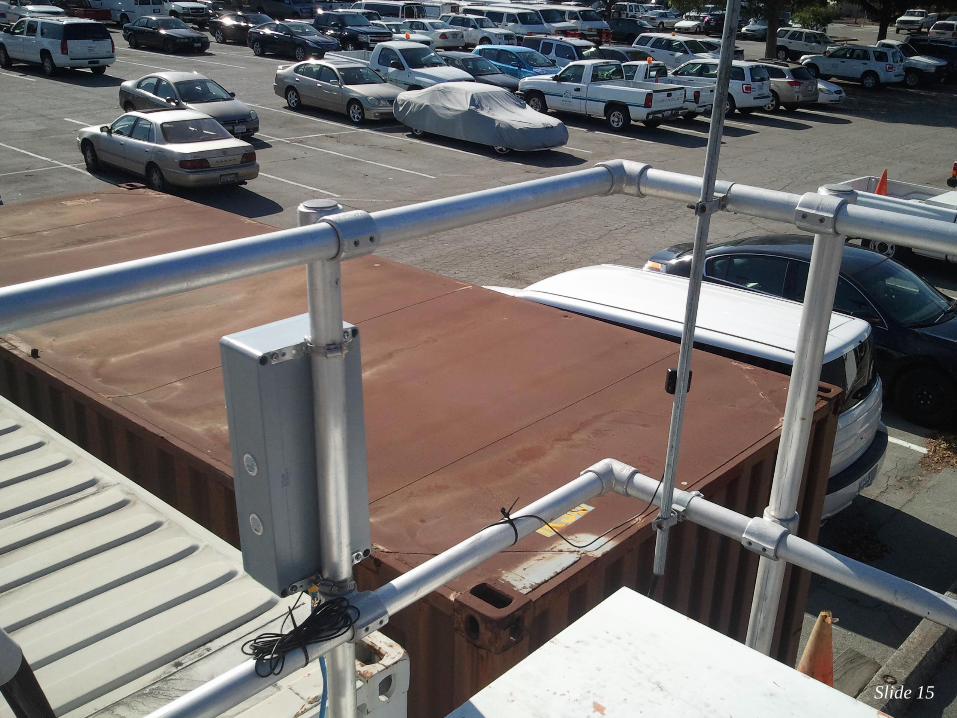
Slide 15
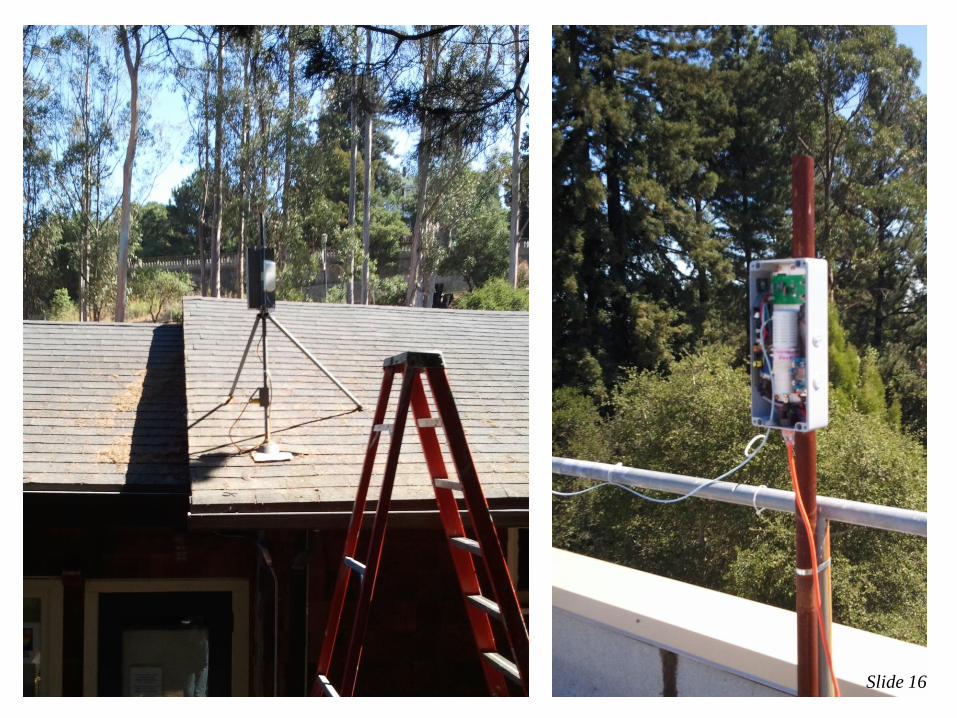
Slide 16
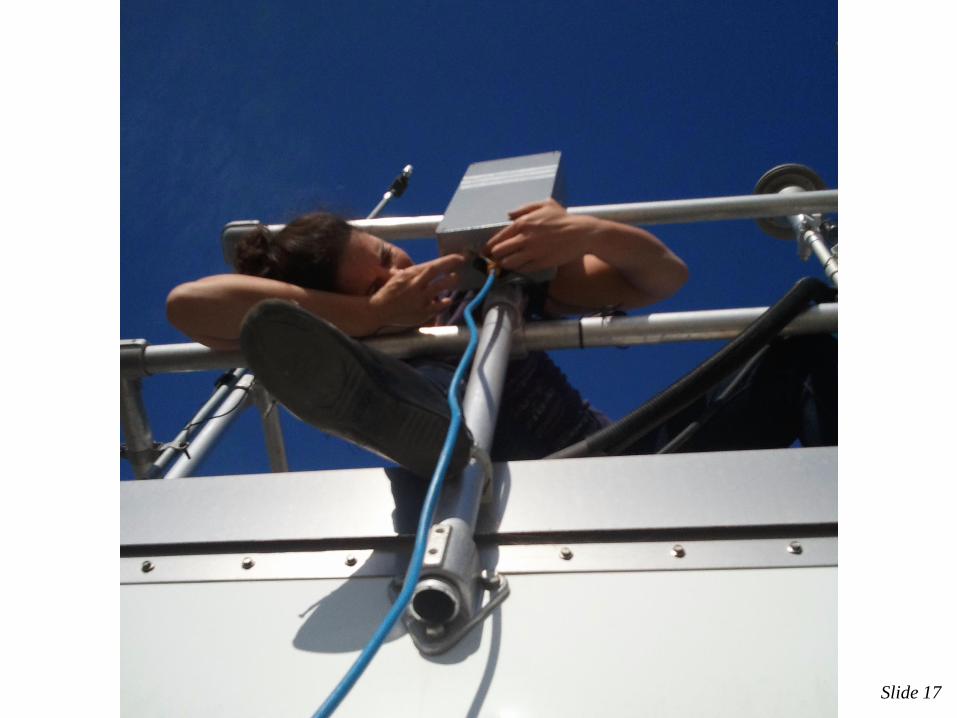
Slide 17

BEACO2N CO2 2013
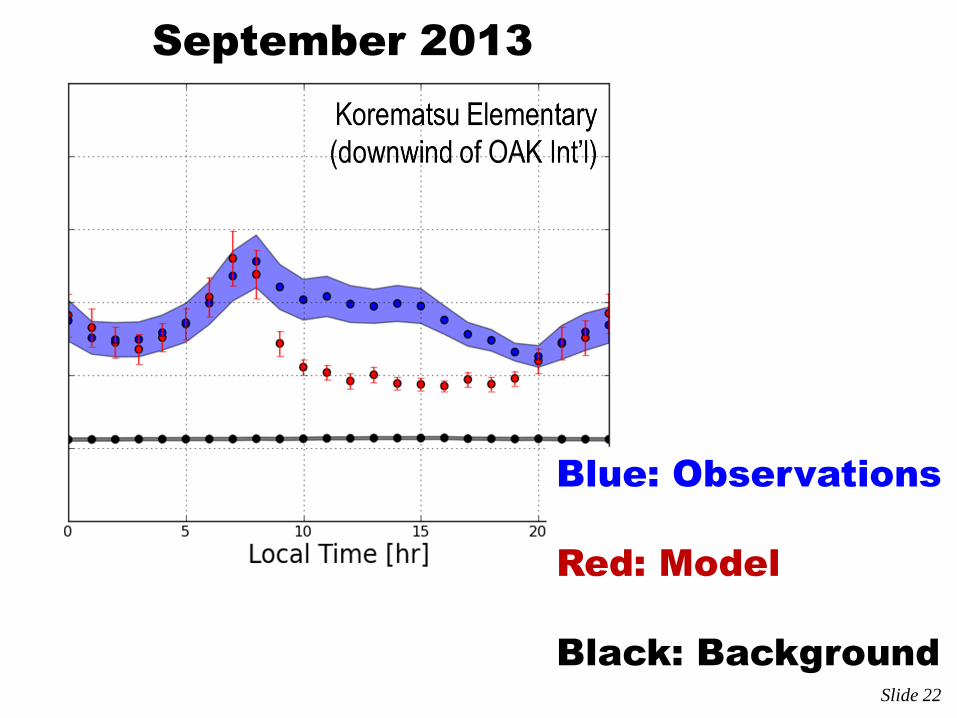
Sites: Laurel Korematsu HeadRoyce
Burckhalter Kaiser ODowd ElCerrito
Prescott CollegePrep StLiz NOakland Slide 18
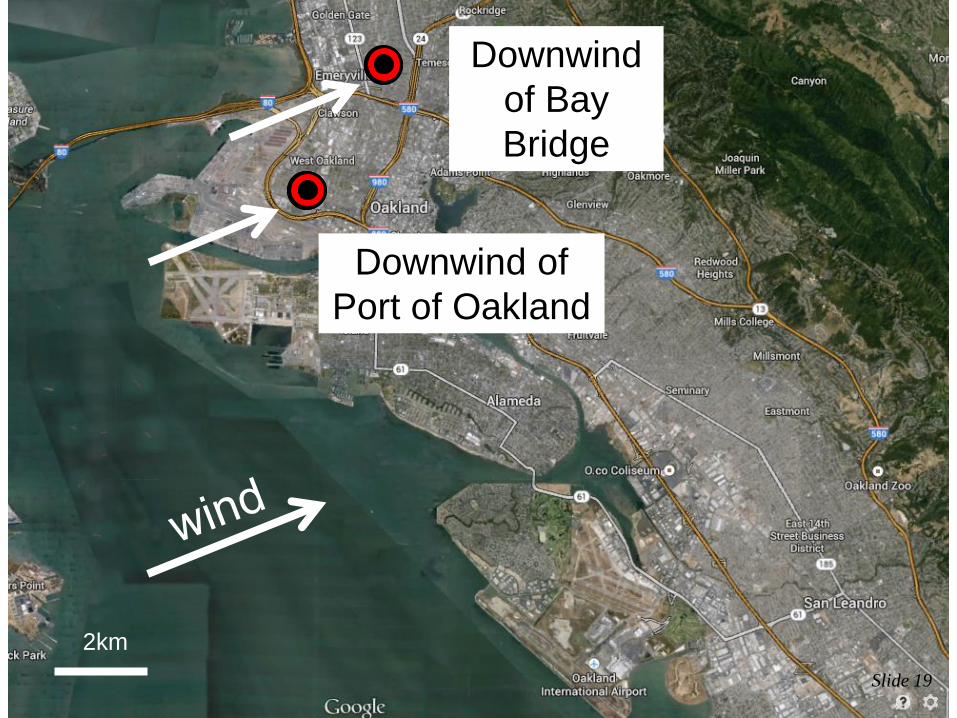
2km
Downwind of
Port of Oakland
Downwind
of Bay
Bridge
Slide 19
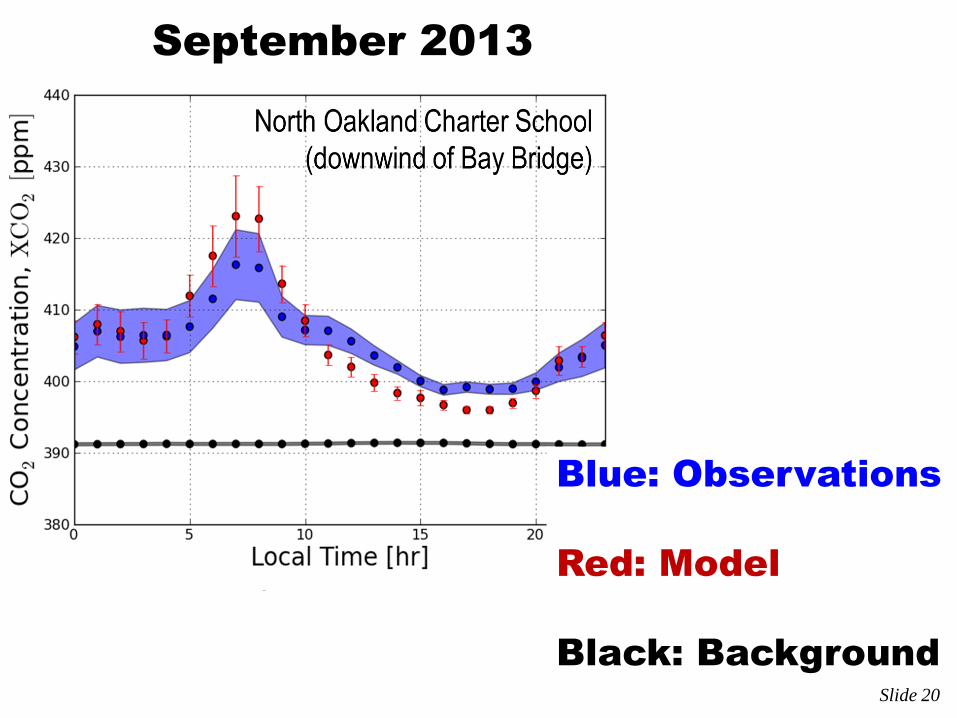
Blue: Observations
Red: Model
Black: Background
September 2013
Slide 20
Blue: Observations
Red: Model
Black: Background
September 2013
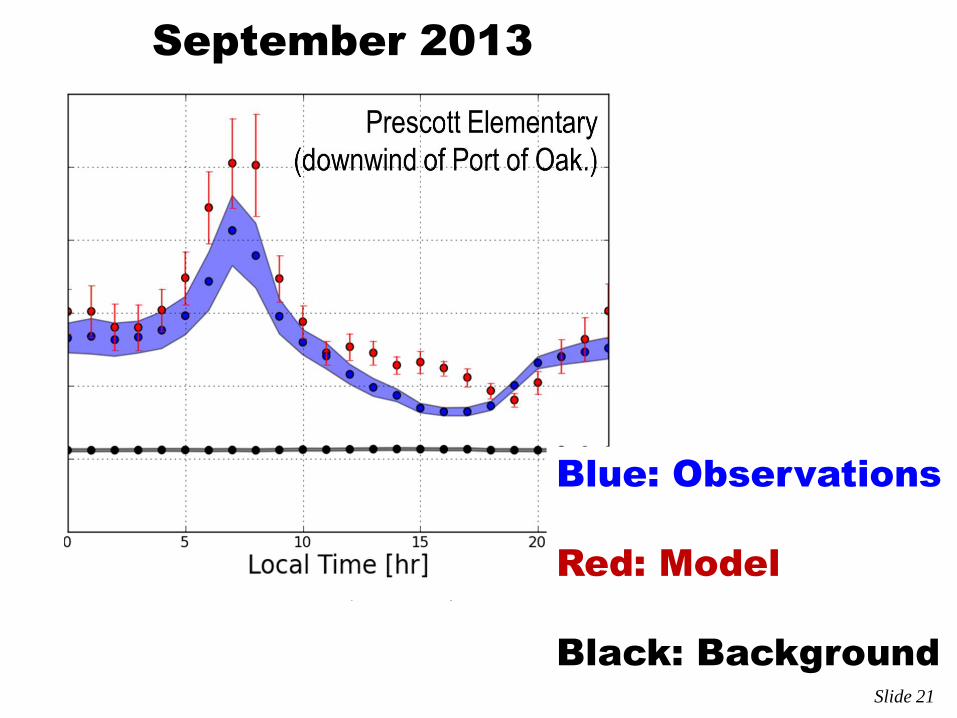
Slide 21
Blue: Observations
Red: Model
Black: Background
September 2013
Slide 22
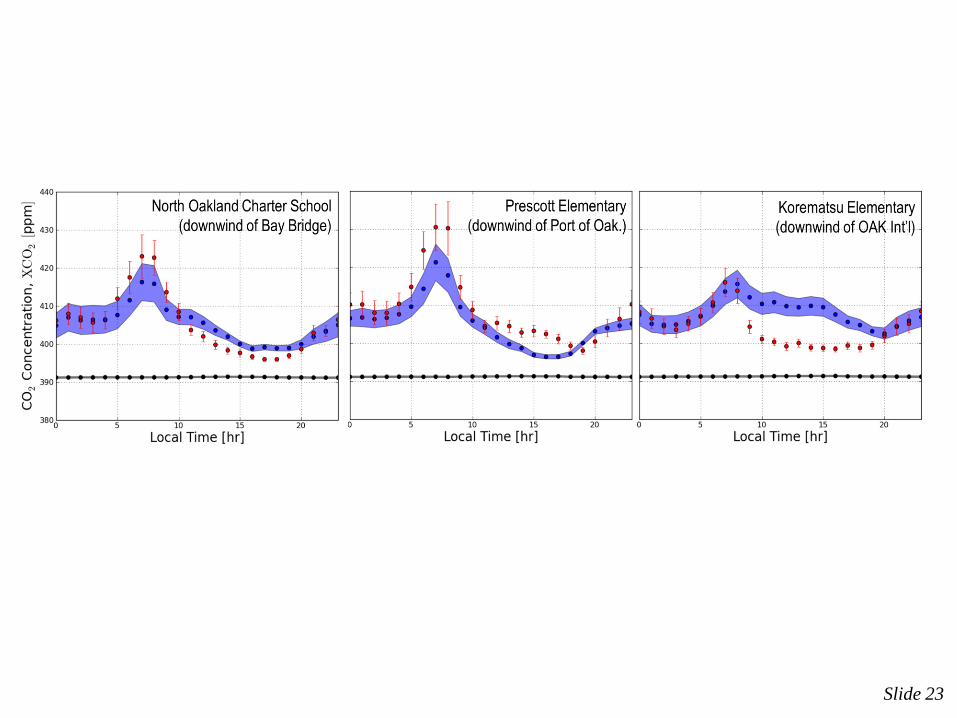
Slide 23
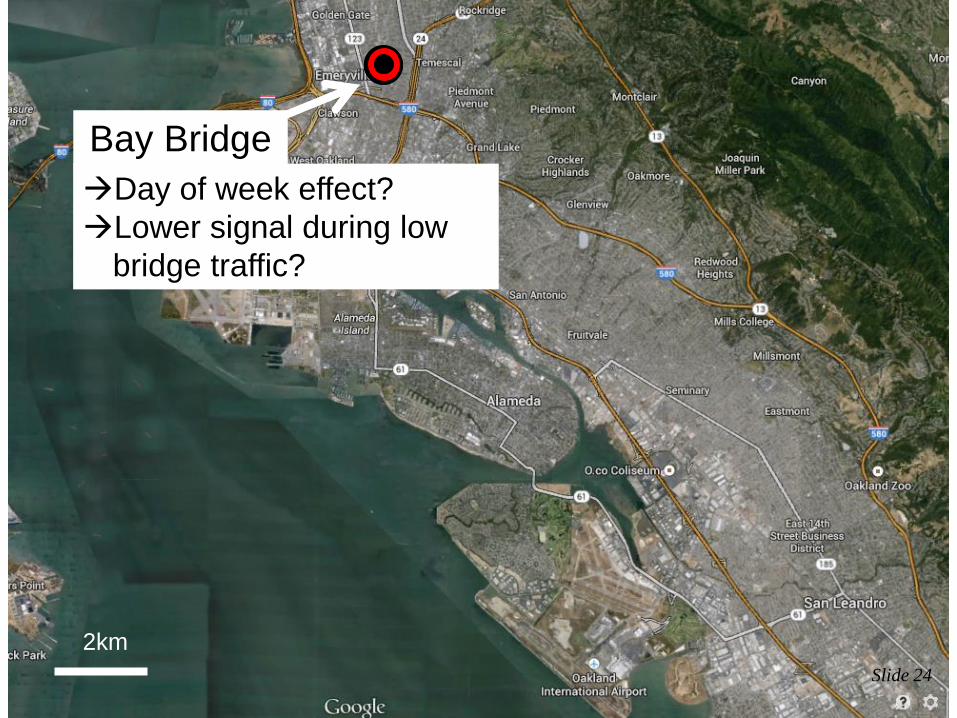
2km
Bay Bridge
Day of week effect?
Lower signal during low
bridge traffic?
Slide 24
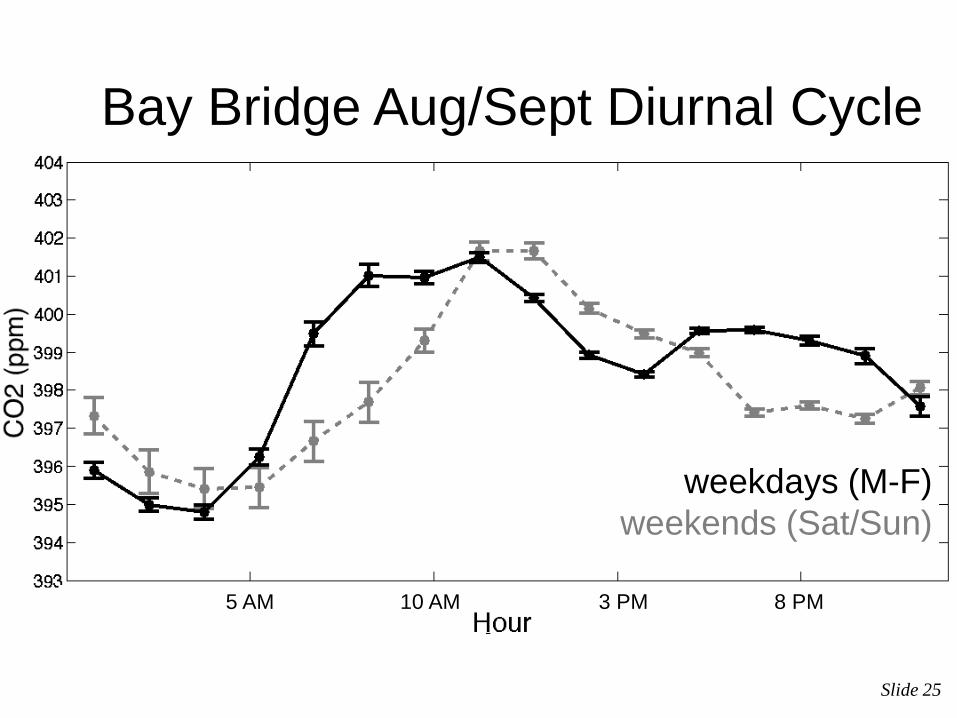
Bay Bridge Aug/Sept Diurnal Cycle
weekdays (M-F)
weekends (Sat/Sun)
3 PM 8 PM 10 AM 5 AM
Slide 25
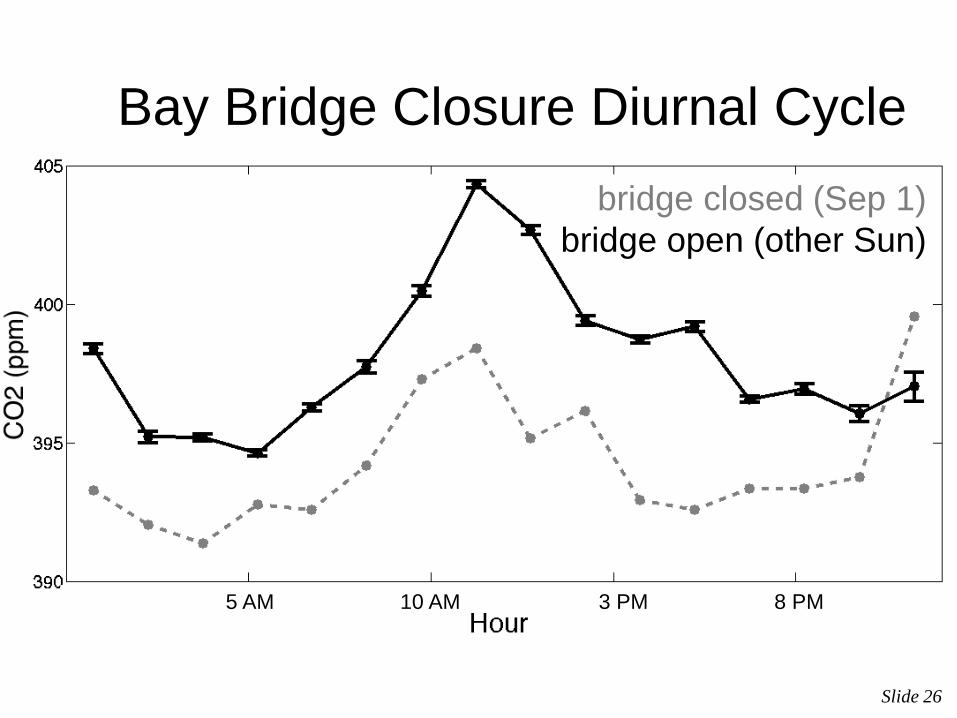
Bay Bridge Closure Diurnal Cycle
bridge closed (Sep 1)
bridge open (other Sun)
3 PM 8 PM 10 AM 5 AM
Slide 26
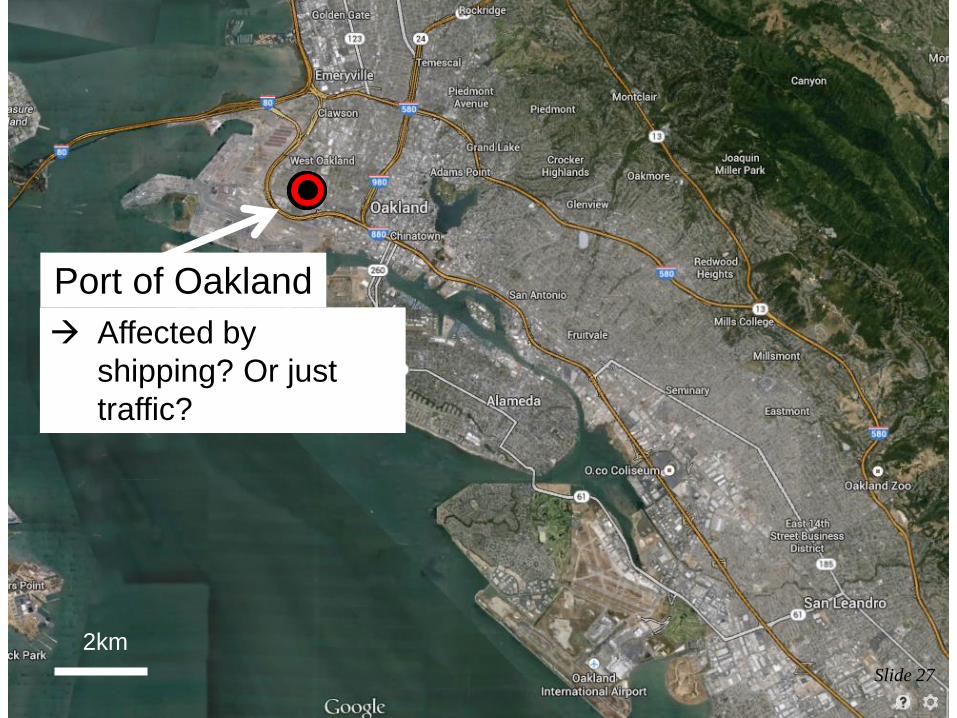
2km
Port of Oakland
Affected by
shipping? Or just
traffic?
Slide 27
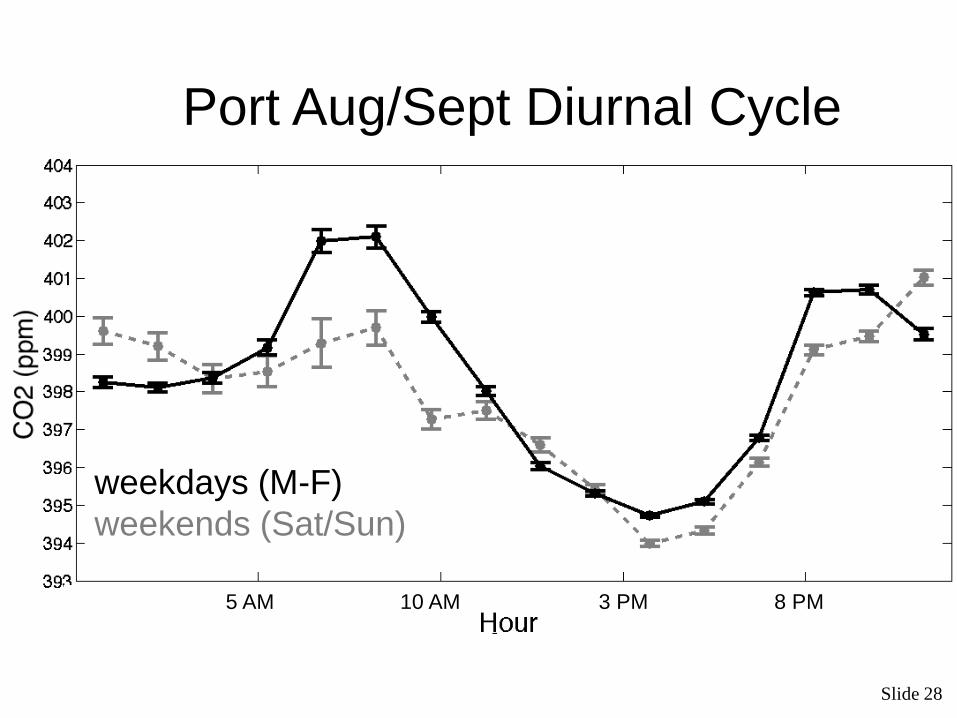
Port Aug/Sept Diurnal Cycle
weekdays (M-F)
weekends (Sat/Sun)
3 PM 8 PM 10 AM 5 AM
Slide 28
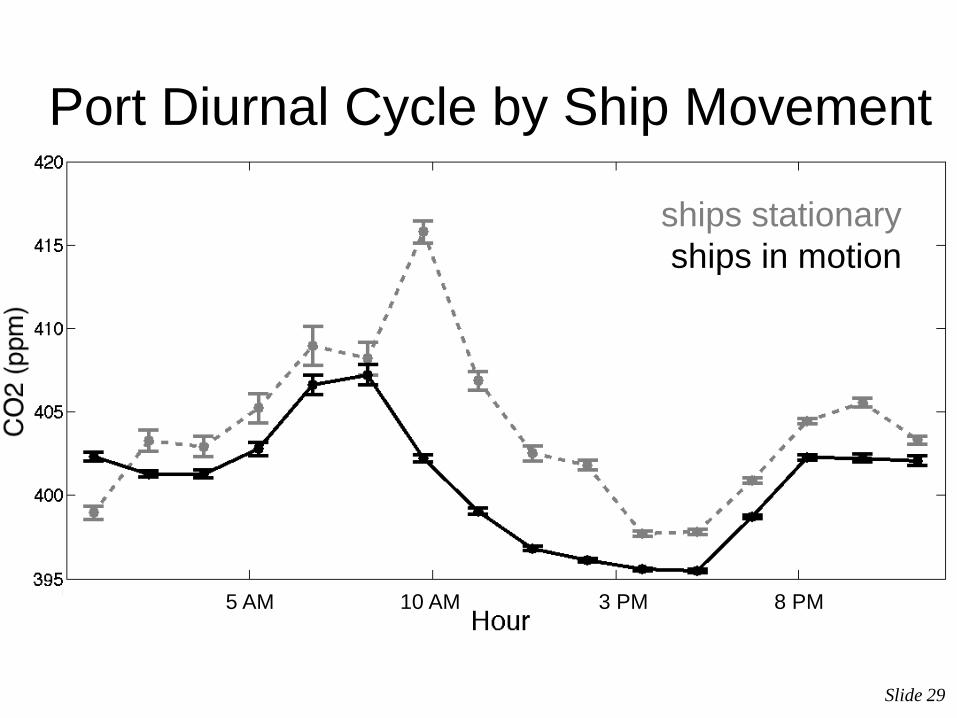
Port Diurnal Cycle by Ship Movement
ships stationary
ships in motion
3 PM 8 PM 10 AM 5 AM
Slide 29
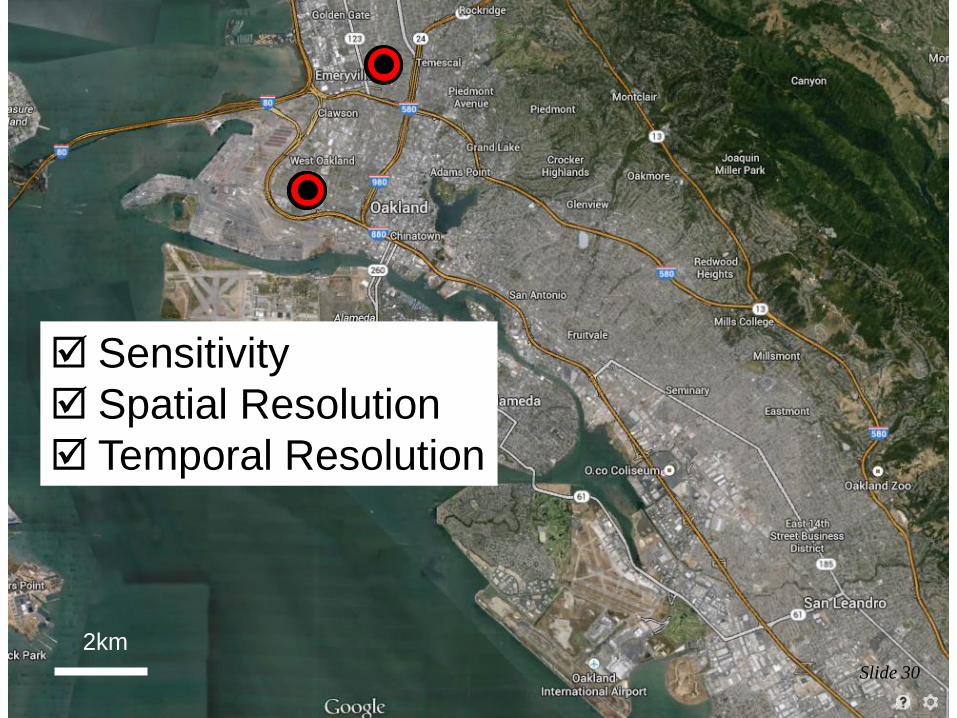
2km
Sensitivity
Spatial Resolution
Temporal Resolution
Slide 30
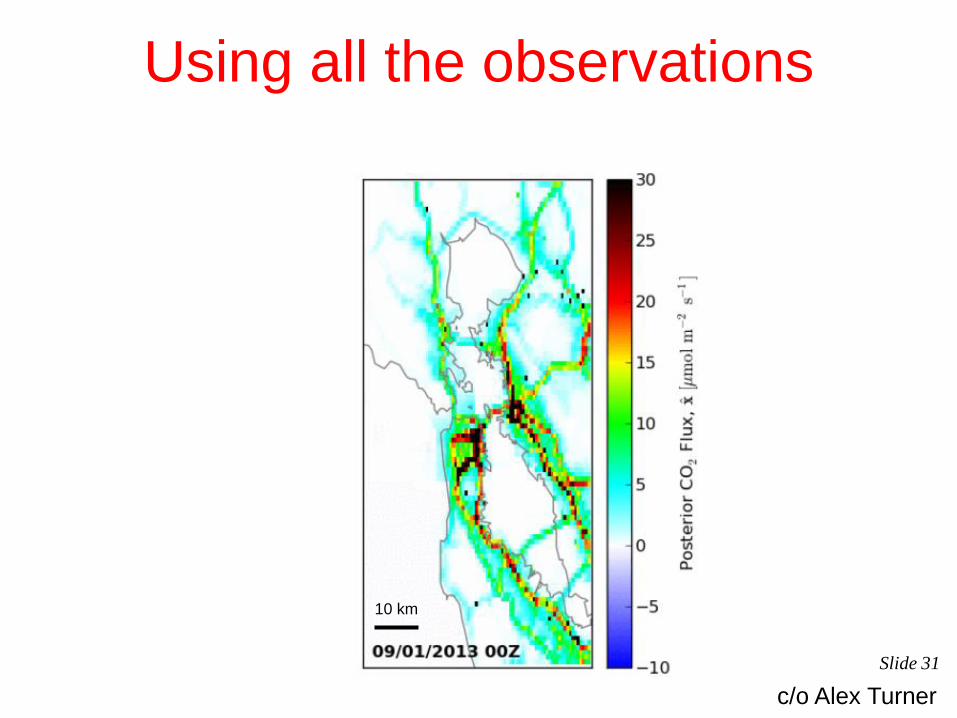
Using all the observations
c/o Alex Turner
10 km
Slide 31
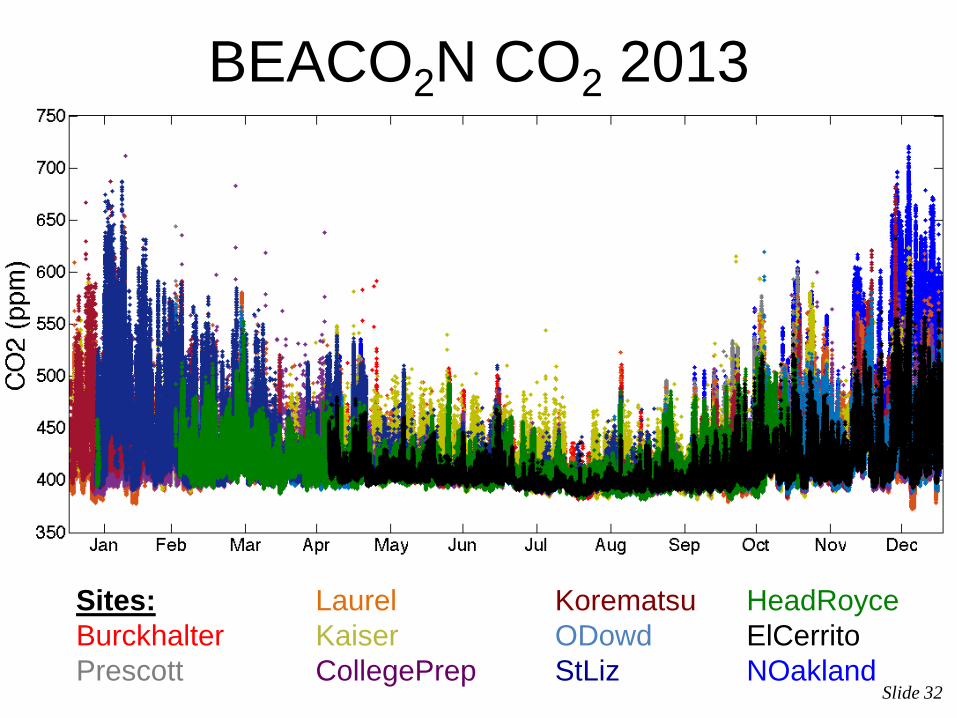
BEACO2N CO2 2013
Sites: Laurel Korematsu HeadRoyce
Burckhalter Kaiser ODowd ElCerrito
Prescott CollegePrep StLiz NOakland Slide 32
Alex Turner
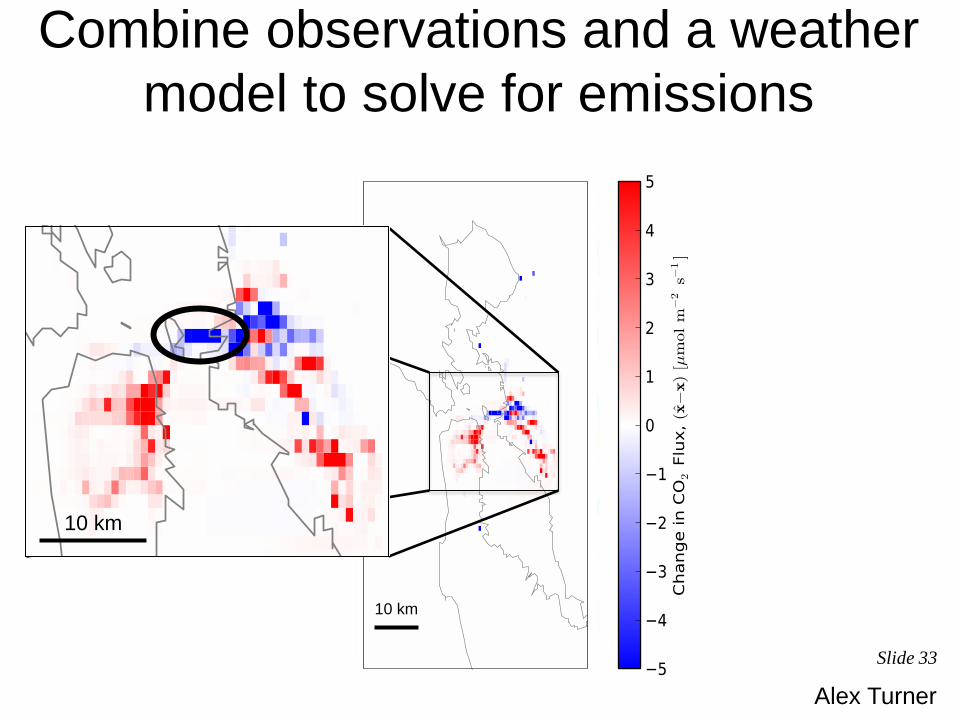
10 km
10 km
Combine observations and a weather
model to solve for emissions
Slide 33
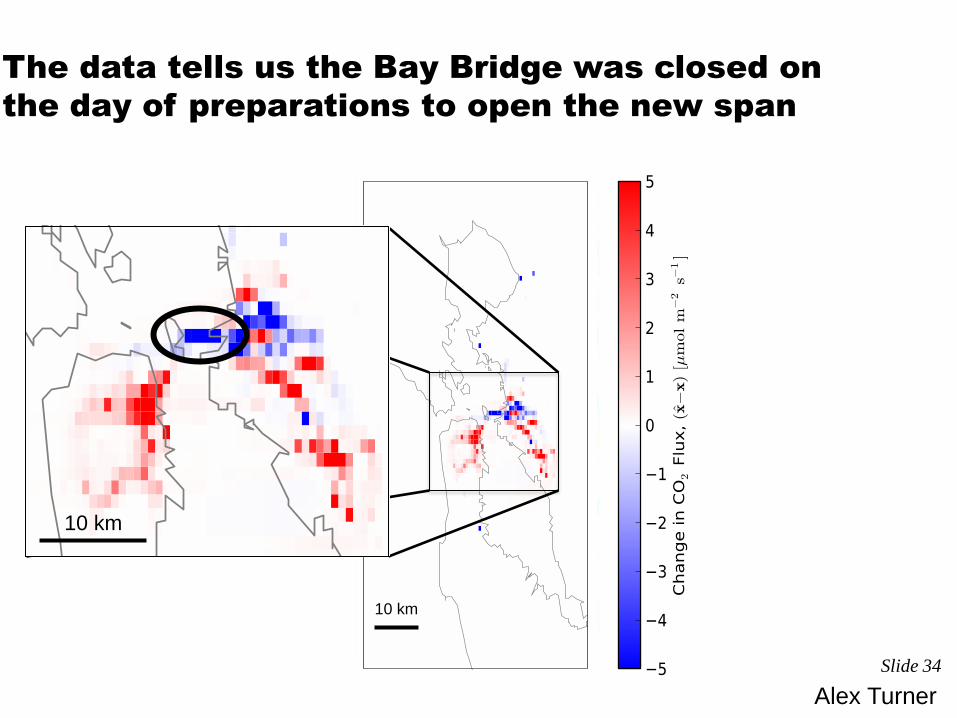
Alex Turner
10 km
10 km
The data tells us the Bay Bridge was closed on
the day of preparations to open the new span
Slide 34

2km
Sensitivity
Spatial Resolution
Temporal Resolution
Multi-Node Analysis
Slide 35
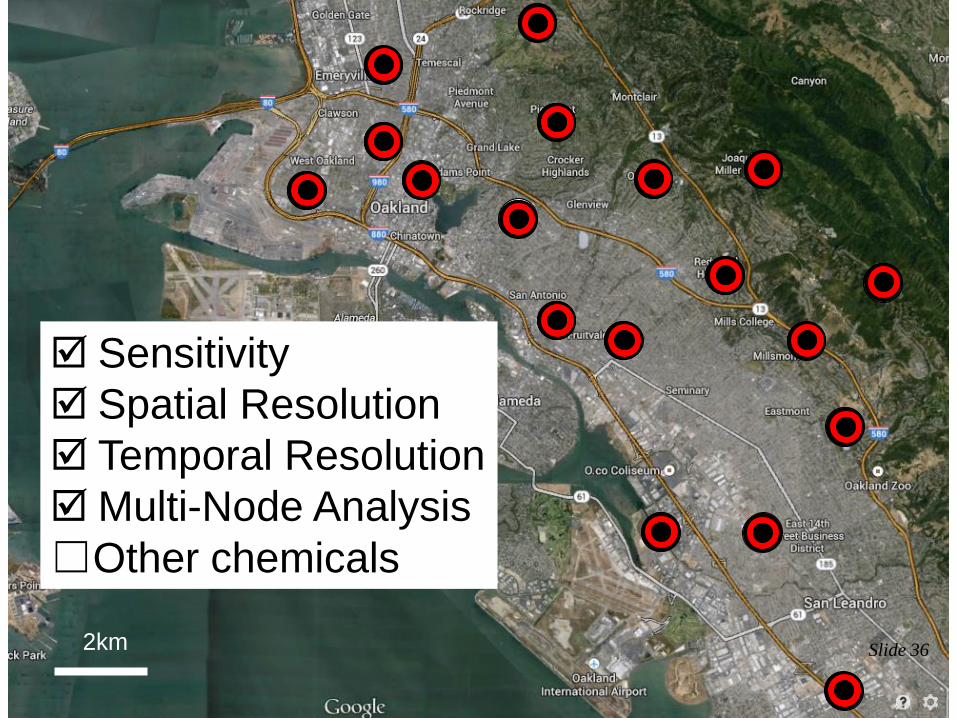
2km
Sensitivity
Spatial Resolution
Temporal Resolution
Multi-Node Analysis
☐Other chemicals
Slide 36
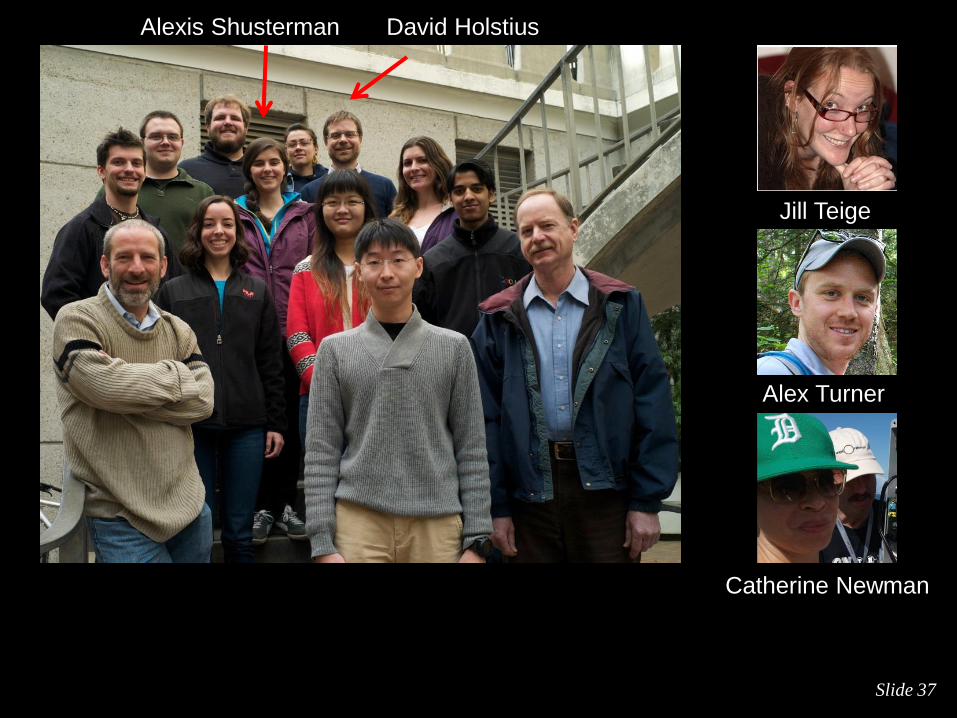
Jill Teige
Alex Turner
Catherine Newman
Alexis Shusterman David Holstius
Slide 37

Thank you!