china: opportunities and challenges for latin america luis miguel castilla chief economist...
TRANSCRIPT
China: Opportunities and challenges for Latin America
Luis Miguel Castilla
Chief EconomistCorporación Andina de Fomento
Punta del Este, March 30 2006

China: key player in global markets
0
200
400
600
800
1000
1980 1982 1984 1986 1988 1990 1992 1994 1996 1998 2000 2002
China
East Asia & Pacific
Latin America & Caribbean
World
Export growth 1980=100
Share in World FDI, net inflows (2003)
Tariff levels and Chinese exports
Share in World Exports
Source: CAF, Direction of Trade Database, IMF, Global Development Indicators, Yang (2003)
0%
2%
4%
6%
8%
1980's 1990's 2000's
ChinaLatin America & CaribbeanEast Asia & Pacific
43 44 444340
36
1818 161413
24
56
0
10
20
30
40
50
60
70
1982 1984 1986 1988 1990 1992 1994 1996 1998 2000 2002
%
0
100
200
300
400
500
600
700
billio
n U
S$
Average Tariff Level
Chinese Trade w ith the World
0% 5% 10% 15%
Russian Federation
Brazil
Mexico
Germany
Singapore
Hong Kong
Italy
Switzerland
United Kingdom
Spain
Ireland
United States
France
China
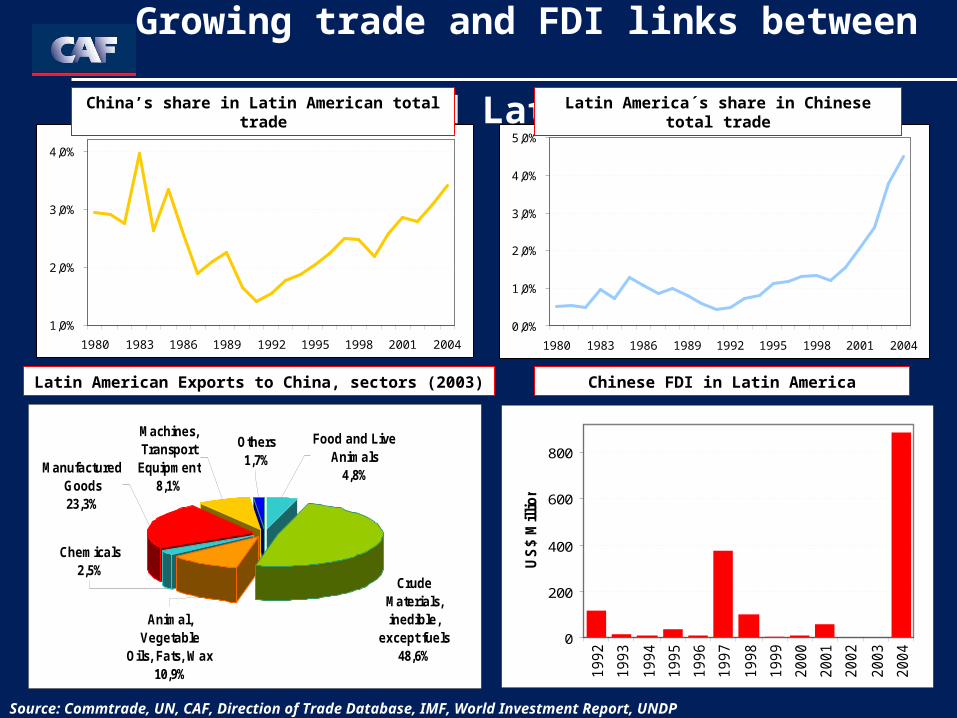
Growing trade and FDI links between China and Latin America
Chinese FDI in Latin AmericaLatin American Exports to China, sectors (2003)
Source: Commtrade, UN, CAF, Direction of Trade Database, IMF, World Investment Report, UNDP
Fuente:
1,0%
2,0%
3,0%
4,0%
1980 1983 1986 1989 1992 1995 1998 2001 2004
0,0%
1,0%
2,0%
3,0%
4,0%
5,0%
1980 1983 1986 1989 1992 1995 1998 2001 2004
Latin America´s share in Chinese total tradeChina’s share in Latin American total trade
Chemicals2,5%
Manufactured Goods23,3%
Food and Live Animals
4,8%
Crude Materials, inedible,
except fuels48,6%
Animal, Vegetable
Oils, Fats, Wax10,9%
Machines, Transport
Equipment8,1%
Others1,7%
0
200
400
600
800
1992
1993
1994
1995
1996
1997
1998
1999
2000
2001
2002
2003
2004
US
$ M
illio
n
0 1 2 3
Animal and Vegetable Oils
Others
Beverage and Tobacco
Mineral Fuels and Lubricants
Crude Materials
Chemicals
Food and live animals
Machinery and TransportEquipment
Manufactured goods
Other Manufactures
Specialisation Index (Balassa)
0 1 2 3
Others
Chemicals
Other Manufactures
Machinery and TransportEquipment
Manufactured goods
Animal and Vegetable Oils
Beverage and Tobacco
Food and live animals
Mineral Fuels and Lubricants
Crude Materials
Specialisation Index (Balassa)
0
0,5
1
1,5
2
2,5
0 0,5 1 1,5 2 2,5CHINA
LATI
N A
MER
ICA
Manufactured goods
Machinery and Transport Equip.
Other Manufactures
Crude Materials
Other Manufactures
Food and live animals
Beverage and Tobacco
Animal and Vegetable Oils
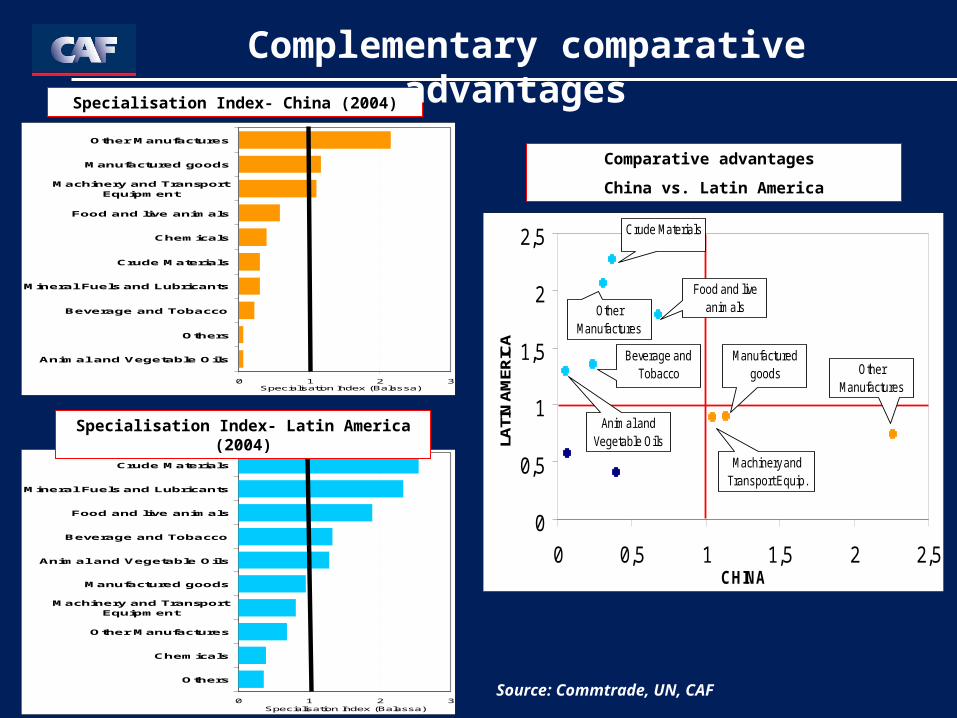
Specialisation Index- China (2004)
Specialisation Index- Latin America (2004)
Complementary comparative advantages
Comparative advantages
China vs. Latin America
Source: Commtrade, UN, CAF
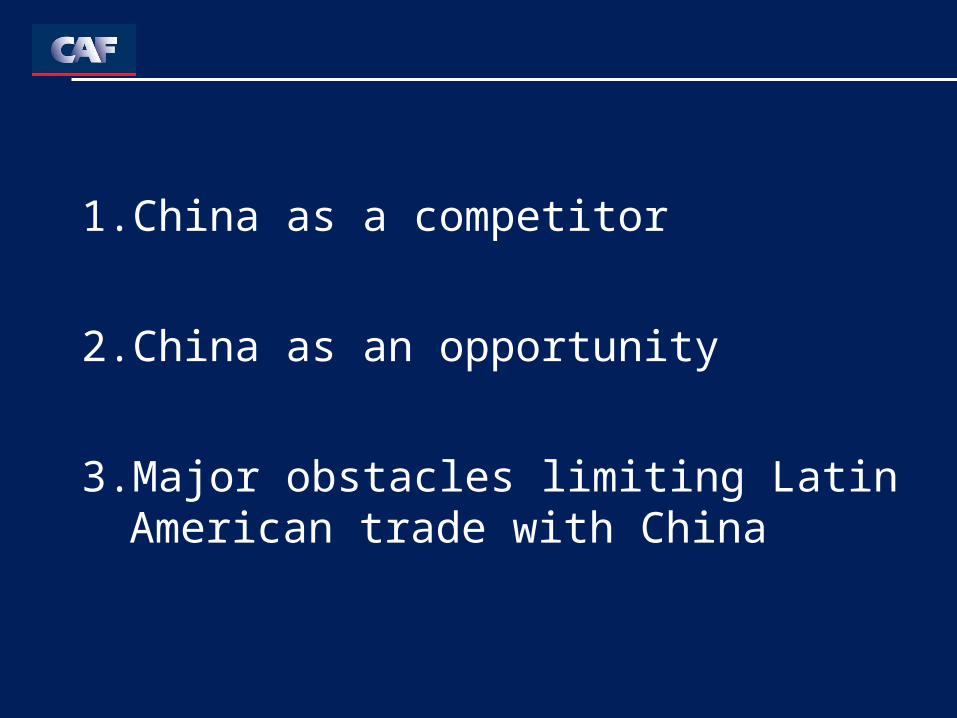
1. China as a competitor
2. China as an opportunity
3. Major obstacles limiting Latin American trade with China
China as a competitor
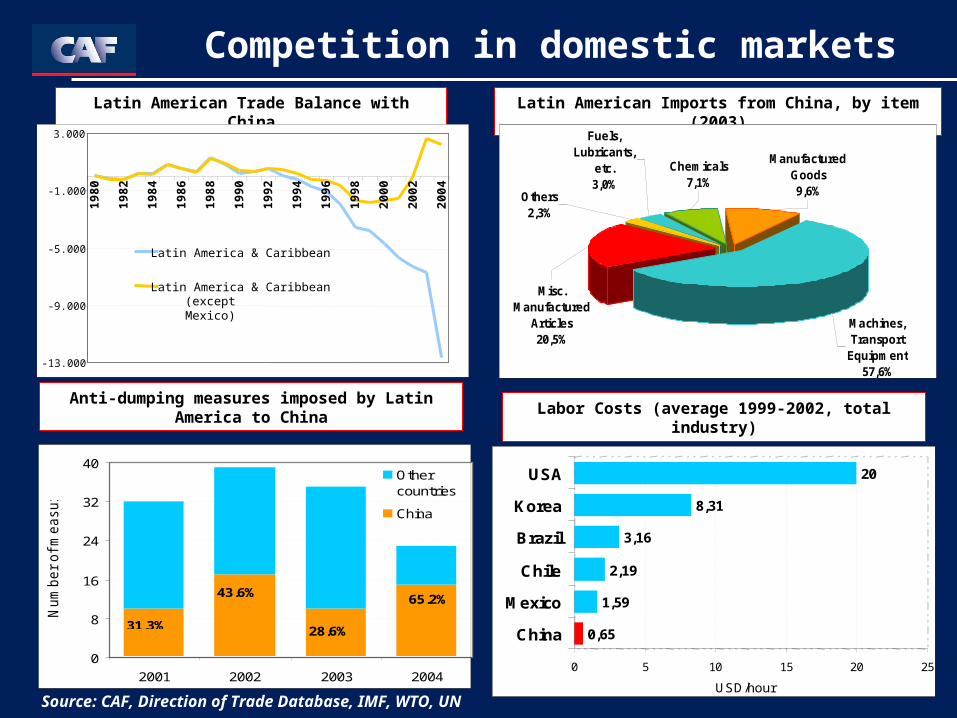
Competition in domestic marketsLatin American Imports from China, by item (2003)
Labor Costs (average 1999-2002, total industry)Anti-dumping measures imposed by Latin America
to China
Latin American Trade Balance with China
Source: CAF, Direction of Trade Database, IMF, WTO, UN
-13.000
-9.000
-5.000
-1.000
3.000
19
80
19
82
19
84
19
86
19
88
19
90
19
92
19
94
19
96
19
98
20
00
20
02
20
04
Latin America & Caribbean
Latin America & Caribbean(except Mexico)
0,65
1,59
2,19
3,16
8,31
20
0 5 10 15 20 25
China
Mexico
Chile
Brazil
Korea
USA
USD/hour
Others2,3%
Manufactured Goods9,6%
Chemicals7,1%
Fuels, Lubricants,
etc.3,0%
Misc. Manufactured
Articles20,5%
Machines, Transport
Equipment57,6%
0
8
16
24
32
40
2001 2002 2003 2004
Num
ber
of m
easure
s
Othercountries
China
65,2%
28,6%
43,6%
31,3%
China as an opportunity
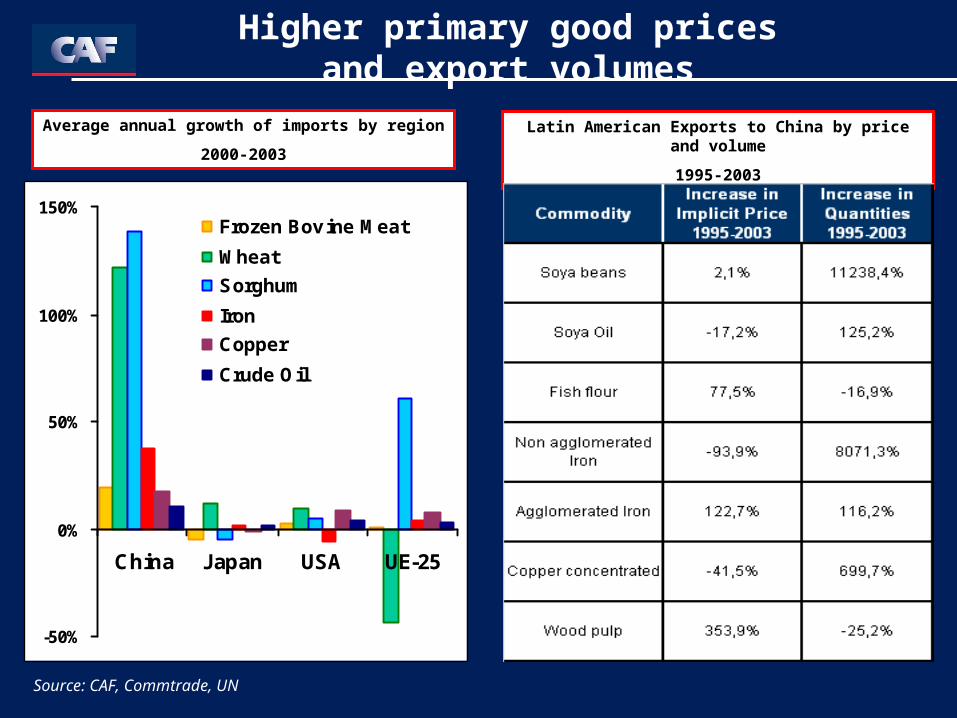
Higher primary good prices and export volumes
Source: CAF, Commtrade, UN
-50%
0%
50%
100%
150%
China Japan USA UE-25
Frozen Bov ine Meat
Wheat
Sorghum
Iron
Copper
Crude Oil
Average annual growth of imports by region
2000-2003
Latin American Exports to China by price and volume
1995-2003
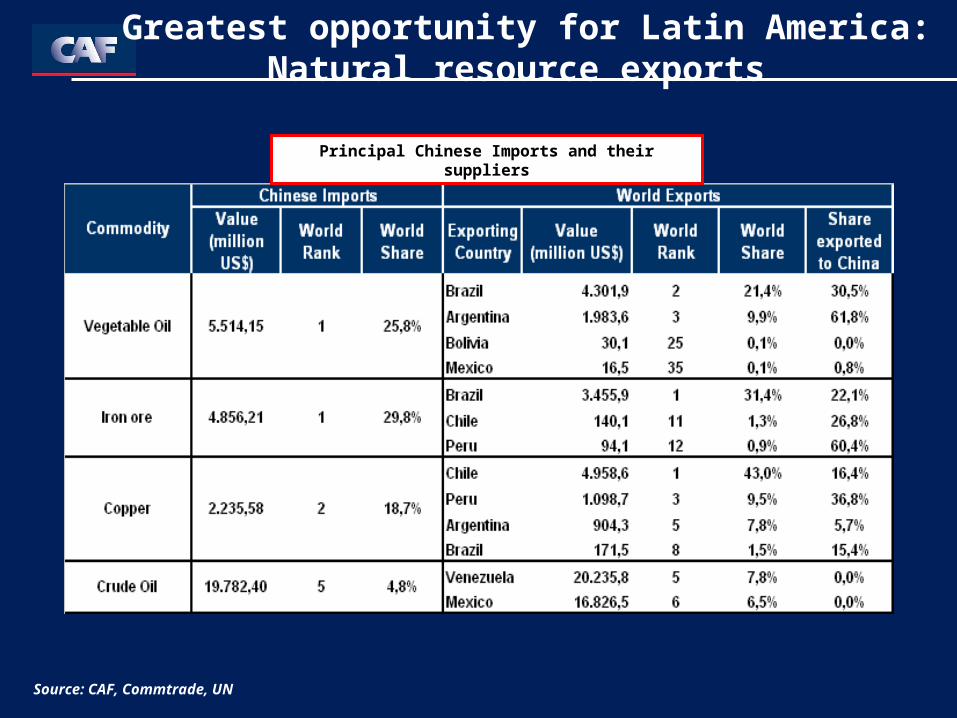
Greatest opportunity for Latin America:Natural resource exports
Source: CAF, Commtrade, UN
Principal Chinese Imports and their suppliers
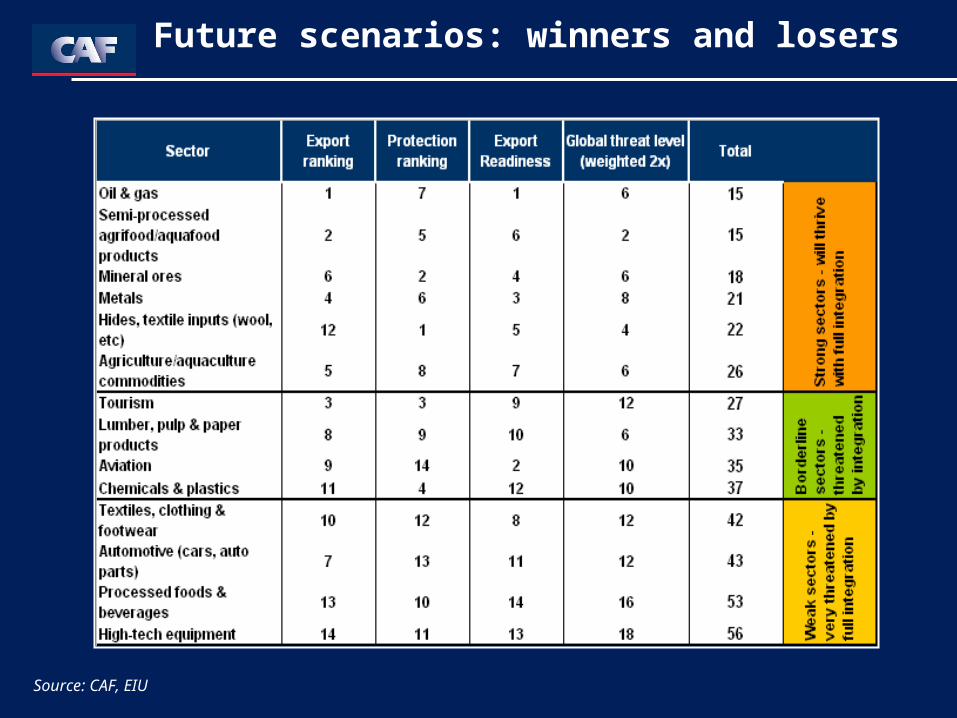
Future scenarios: winners and losers
Source: CAF, EIU
Major obstacles faced by Latin American winning sectors :
• Infrastructure and logistics
• Competitiveness
• Business environment
• Trade barriers
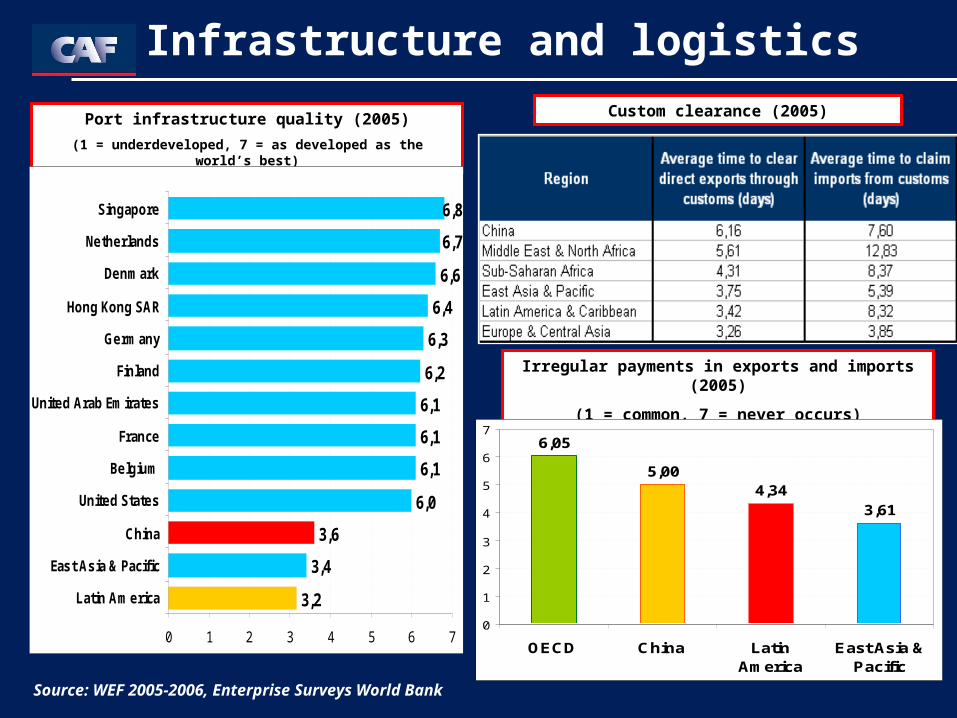
Infrastructure and logistics
Port infrastructure quality (2005)
(1 = underdeveloped, 7 = as developed as the world’s best)
Custom clearance (2005)
Irregular payments in exports and imports (2005)
(1 = common, 7 = never occurs)
Source: WEF 2005-2006, Enterprise Surveys World Bank
3,2
3,4
3,6
6,0
6,1
6,1
6,1
6,2
6,3
6,4
6,6
6,7
6,8
0 1 2 3 4 5 6 7
Latin America
East Asia & Pacific
China
United States
Belgium
France
United Arab Emirates
Finland
Germany
Hong Kong SAR
Denmark
Netherlands
Singapore
6,05
5,004,34
3,61
0
1
2
3
4
5
6
7
OECD China LatinAmerica
East Asia &Pacific
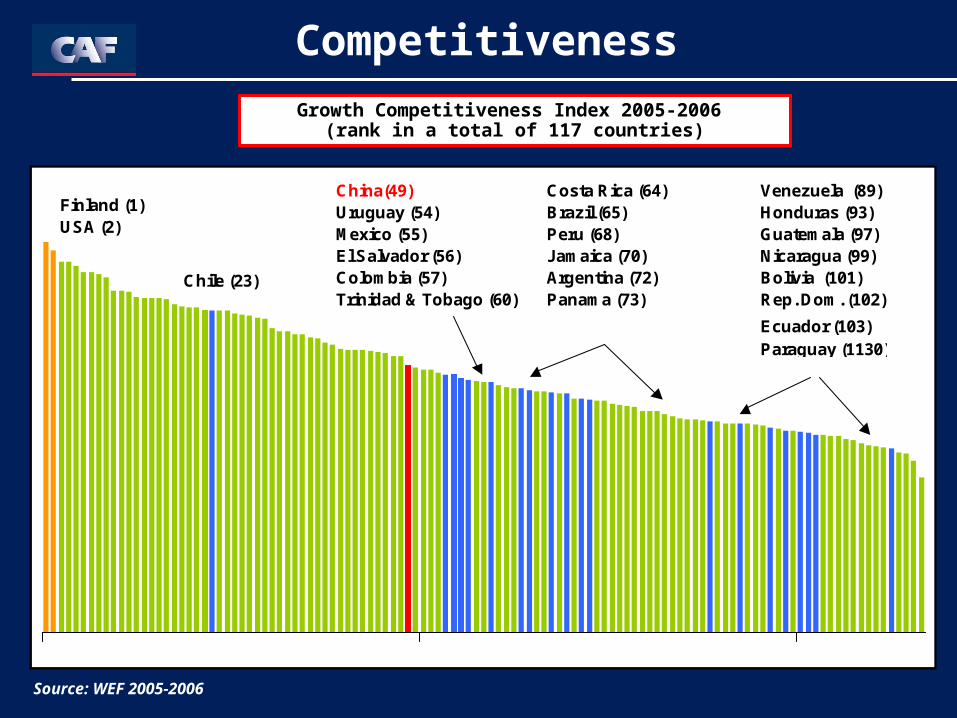
Competitiveness
Chile (23)
Uruguay (54)Mexico (55)El Salvador (56)Colombia (57)Trinidad & Tobago (60)
Costa Rica (64)Brazil (65)Peru (68)Jamaica (70)Argentina (72)Panama (73)
Venezuela (89)Honduras (93)Guatemala (97)Nicaragua (99)Bolivia (101)Rep. Dom. (102)
Ecuador (103)Paraguay (1130)
Finland (1)USA (2)
China(49)
Source: WEF 2005-2006
Growth Competitiveness Index 2005-2006 (rank in a total of 117 countries)
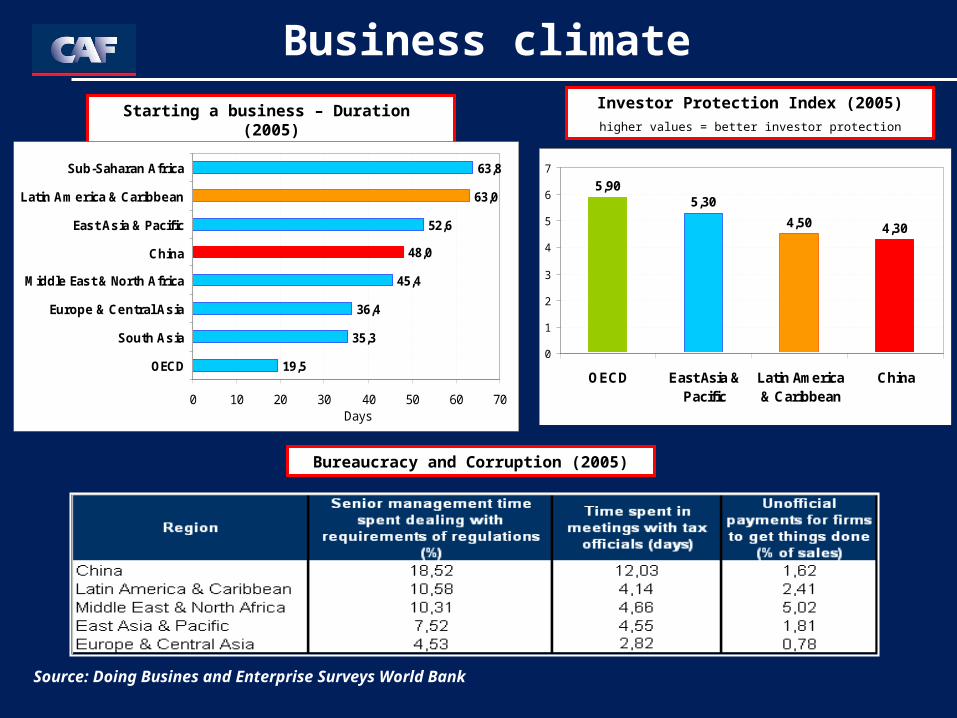
Bureaucracy and Corruption (2005)
Business climate
Starting a business – Duration (2005) Investor Protection Index (2005)
higher values = better investor protection
Source: Doing Busines and Enterprise Surveys World Bank
19,5
35,3
36,4
45,4
48,0
52,6
63,0
63,8
0 10 20 30 40 50 60 70
OECD
South Asia
Europe & Central Asia
Middle East & North Africa
China
East Asia & Pacific
Latin America & Caribbean
Sub-Saharan Africa
Days
5,905,30
4,50 4,30
0
1
2
3
4
5
6
7
OECD East Asia &Pacific
Latin America& Caribbean
China
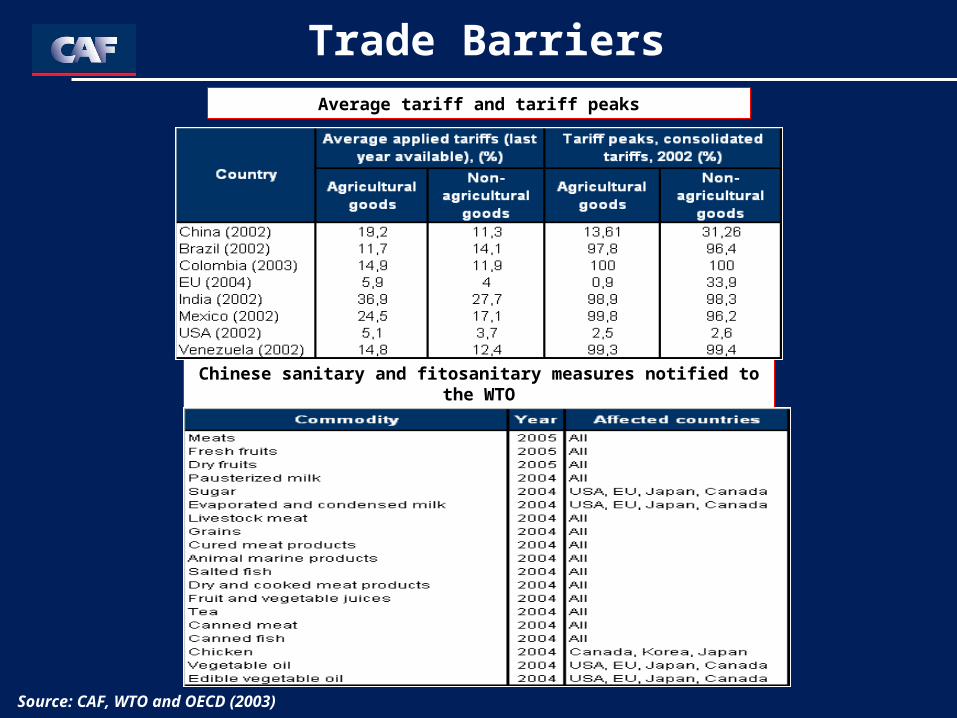
Trade Barriers
Chinese sanitary and fitosanitary measures notified to the WTO
Average tariff and tariff peaks
Source: CAF, WTO and OECD (2003)
Latin American strategy towards China:
• For sensitive sectors, generating greater value added and product differentiation
• Overcoming barriers:- Investment in infrastructure- Trade facilitation (customs) - Business climate
• Eliminating trading barriers that limit bilateral trade
• FDI attraction and technological upgrade
In summary...

www.caf.com