washington, september 10-11 2009 managing in frastructure for social and productive development...
TRANSCRIPT
Washington, September 10-11 2009
Managing infrastructure for social and productive development
Pablo SanguinettiResearch Director
Corporación Andina de Fomento
IDB SeminarDevelopment Challenges and Policies in Latin America and the Caribbean: What are the issues?
Presentation Structure
• Introduction: Why infrastructure? • A brief diagnosis of the state of infrastructure in Latin
America• Main messages of the Report • Impact evaluation of infrastructure services• Improving management• Final remarks
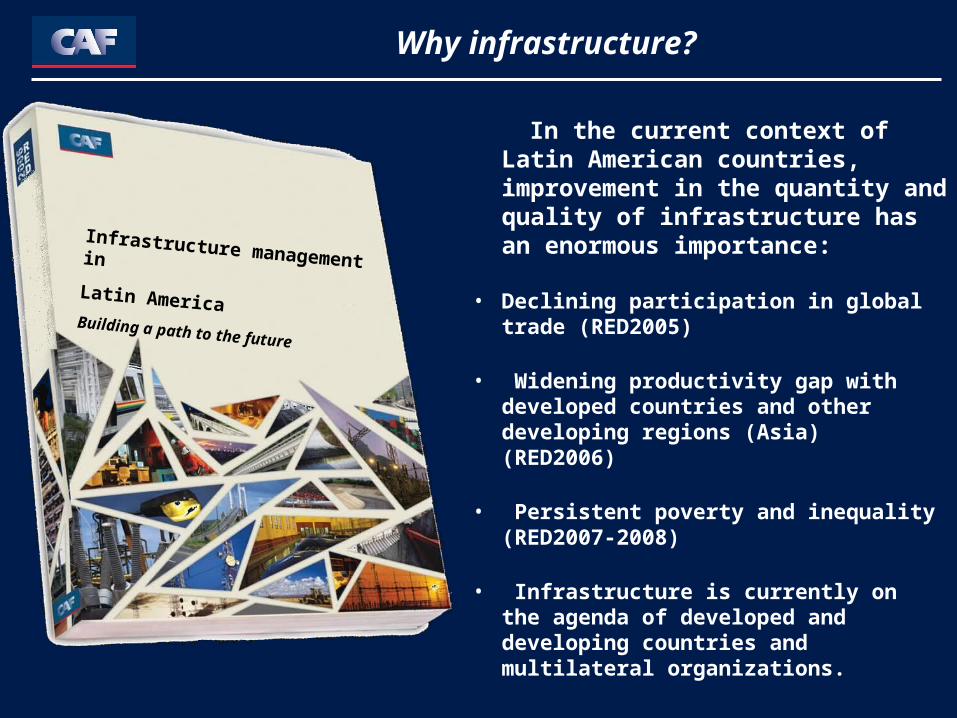
Why infrastructure?
Infrastructure management in Latin AmericaBuilding a path to the future
In the current context of Latin American countries, improvement in the quantity and quality of infrastructure has an enormous importance:
• Declining participation in global trade (RED2005)
• Widening productivity gap with developed countries and other developing regions (Asia) (RED2006)
• Persistent poverty and inequality (RED2007-2008)
• Infrastructure is currently on the agenda of developed and developing countries and multilateral organizations.
Although its relevance is widely
recognized, infrastructure services in
Latin America are insufficient both in
quantity and quality.
State of infrastructure in Latin America
State of infrastructure in Latin America
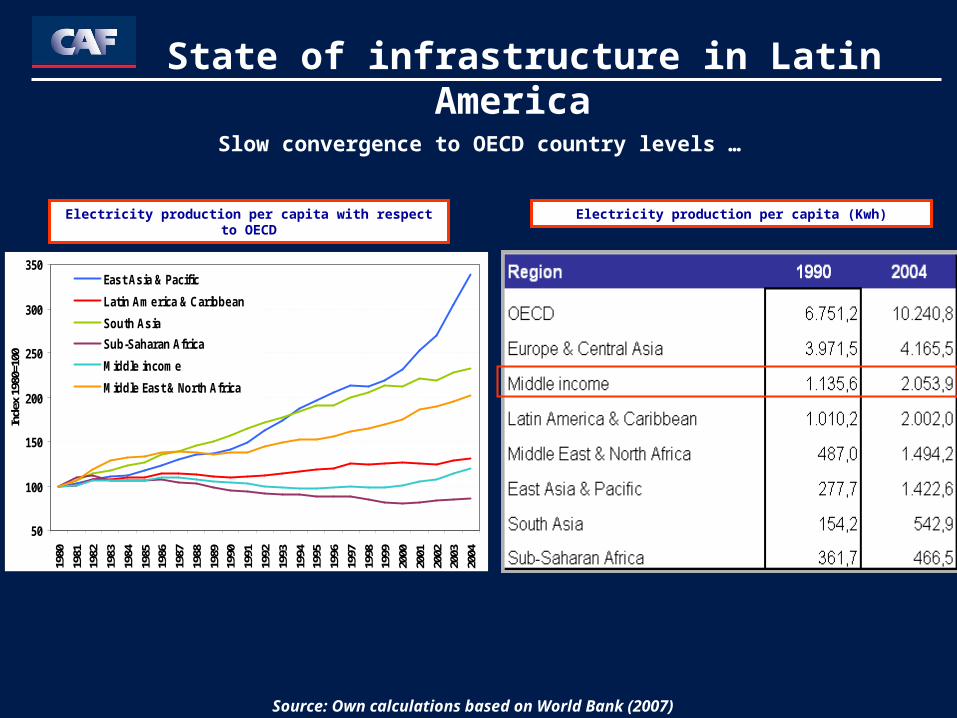
Electricity production per capita with respect to OECD Electricity production per capita (Kwh)
Source: Own calculations based on World Bank (2007)
50
100
150
200
250
300
350
1980
1981
1982
1983
1984
1985
1986
1987
1988
1989
1990
1991
1992
1993
1994
1995
1996
1997
1998
1999
2000
2001
2002
2003
2004
Inde
x 19
80=1
00
East Asia & Pacific
Latin America & Caribbean
South Asia
Sub-Saharan Africa
Middle income
Middle East & North Africa
Slow convergence to OECD country levels …
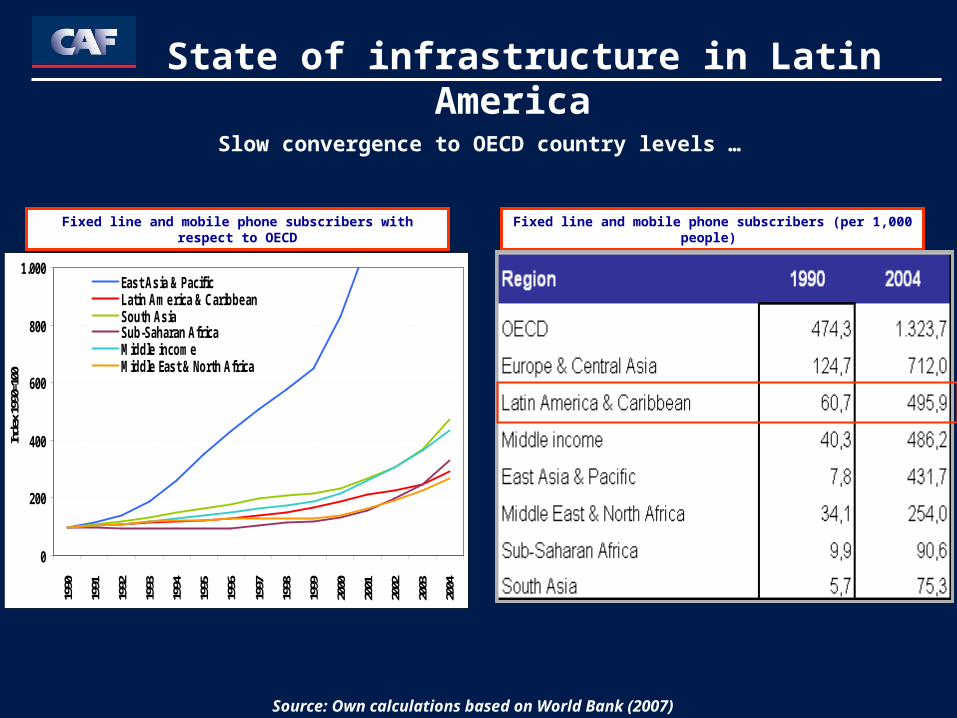
Fixed line and mobile phone subscribers with respect to OECD
0
200
400
600
800
1.000
1990
1991
1992
1993
1994
1995
1996
1997
1998
1999
2000
2001
2002
2003
2004
Inde
x 199
0=10
0
East Asia & PacificLatin America & CaribbeanSouth AsiaSub-Saharan AfricaMiddle incomeMiddle East & North Africa
Fixed line and mobile phone subscribers (per 1,000 people)
Source: Own calculations based on World Bank (2007)
State of infrastructure in Latin America
Slow convergence to OECD country levels …
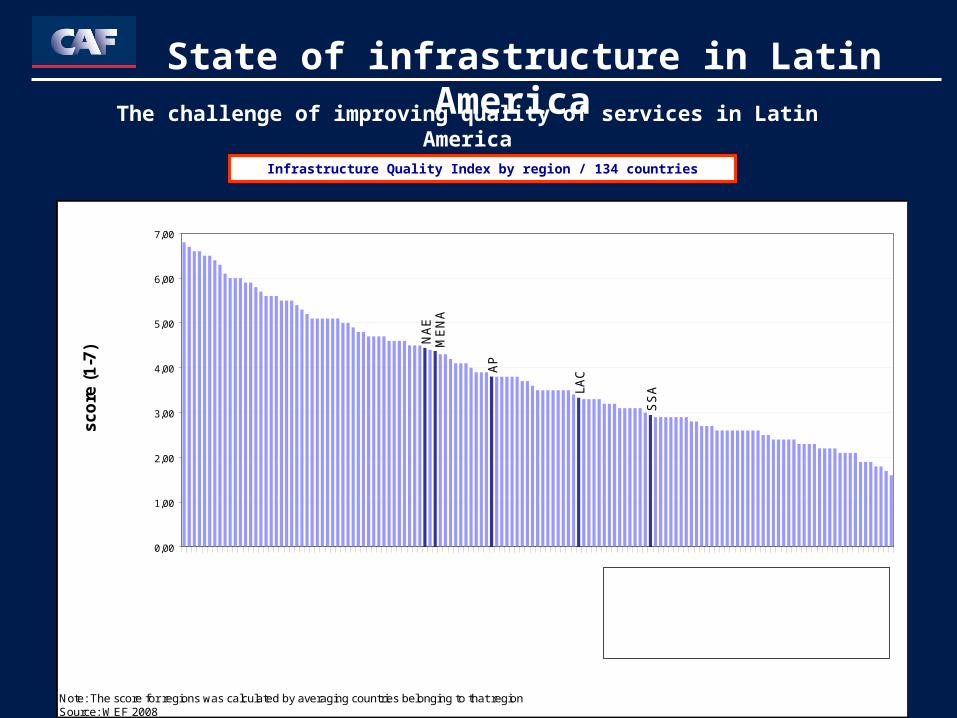
The challenge of improving quality of services in Latin America
Note: The score for regions was calculated by averaging countries belonging to that regionSource: WEF 2008
NA
EM
EN
A
AP
LA
C
SS
A
0,00
1,00
2,00
3,00
4,00
5,00
6,00
7,00
sco
re (
1-7
)
NAE North America and EuropeMENA Middle East and North AfricaAP Asia and the PacificLAC Latin America and the CaribbeanSSA Sub-Saharian Africa
Infrastructure Quality Index by region / 134 countries
State of infrastructure in Latin America
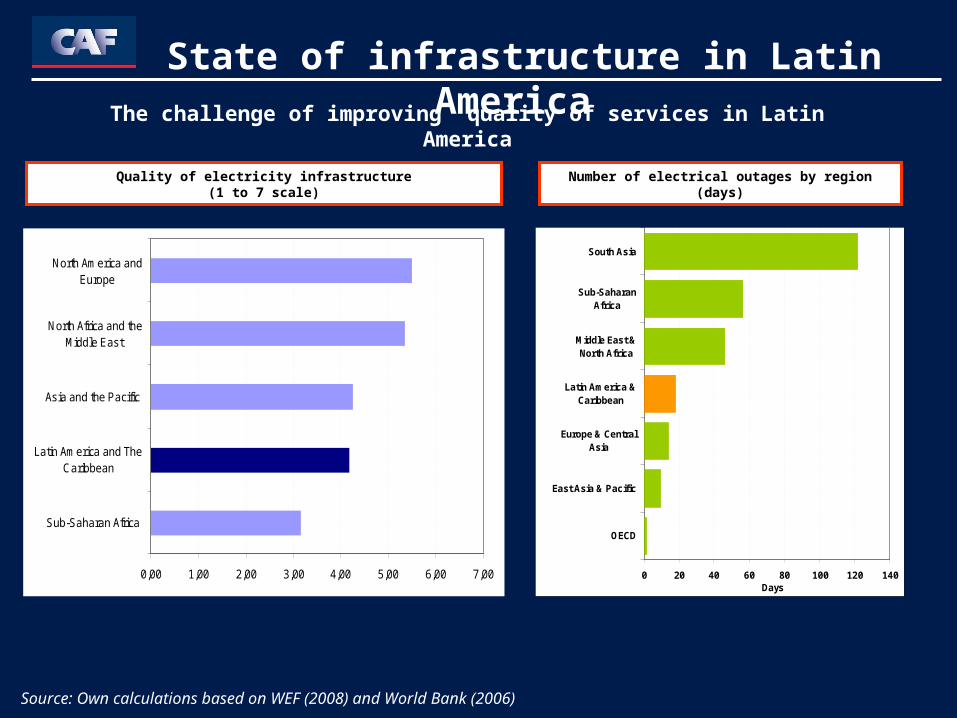
Source: Own calculations based on WEF (2008) and World Bank (2006)
Quality of electricity infrastructure(1 to 7 scale)
0 20 40 60 80 100 120 140
OECD
East Asia & Pacific
Europe & CentralAsia
Latin America &Caribbean
Middle East &North Africa
Sub-SaharanAfrica
South Asia
Days
Number of electrical outages by region(days)
The challenge of improving quality of services in Latin America
State of infrastructure in Latin America
0,00 1,00 2,00 3,00 4,00 5,00 6,00 7,00
Sub-Saharan Africa
Latin America and TheCaribbean
Asia and the Pacific
North Africa and theMiddle East
North America andEurope
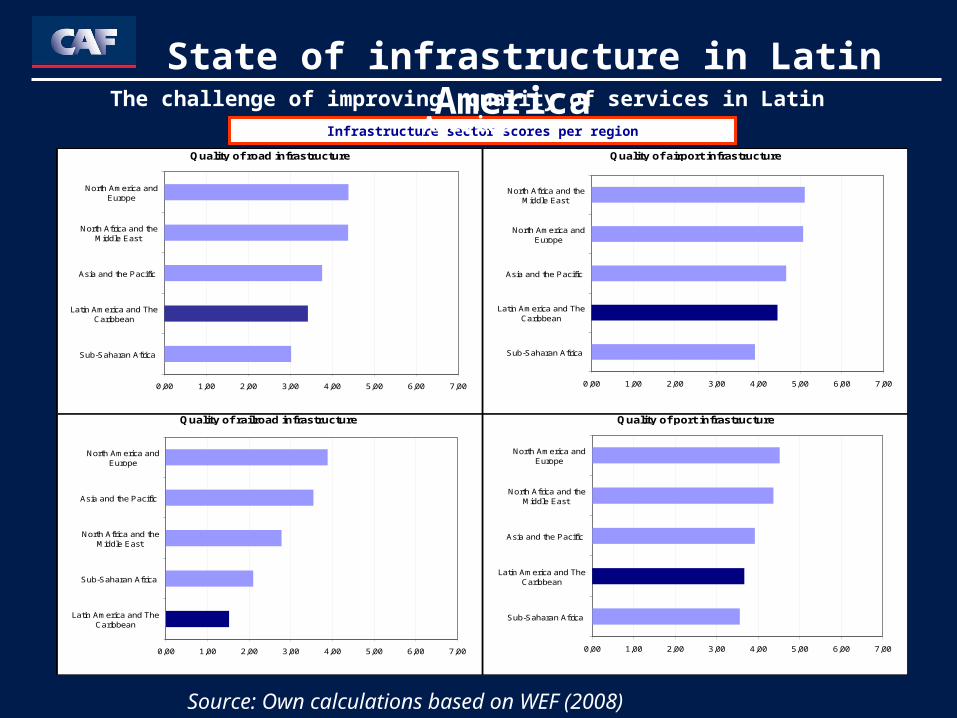
State of infrastructure in Latin America
Quality of airport infrastructureQuality of road infrastructure
Quality of railroad infrastructure Quality of port infrastructure
0,00 1,00 2,00 3,00 4,00 5,00 6,00 7,00
Sub-Saharan Africa
Latin America and TheCaribbean
Asia and the Pacific
North Africa and theMiddle East
North America andEurope
0,00 1,00 2,00 3,00 4,00 5,00 6,00 7,00
Sub-Saharan Africa
Latin America and TheCaribbean
Asia and the Pacific
North Africa and theMiddle East
North America andEurope
0,00 1,00 2,00 3,00 4,00 5,00 6,00 7,00
Sub-Saharan Africa
Latin America and TheCaribbean
Asia and the Pacific
North America andEurope
North Africa and theMiddle East
0,00 1,00 2,00 3,00 4,00 5,00 6,00 7,00
Latin America and TheCaribbean
Sub-Saharan Africa
North Africa and theMiddle East
Asia and the Pacific
North America andEurope
Infrastructure sector scores per region
Source: Own calculations based on WEF (2008)
The challenge of improving quality of services in Latin America
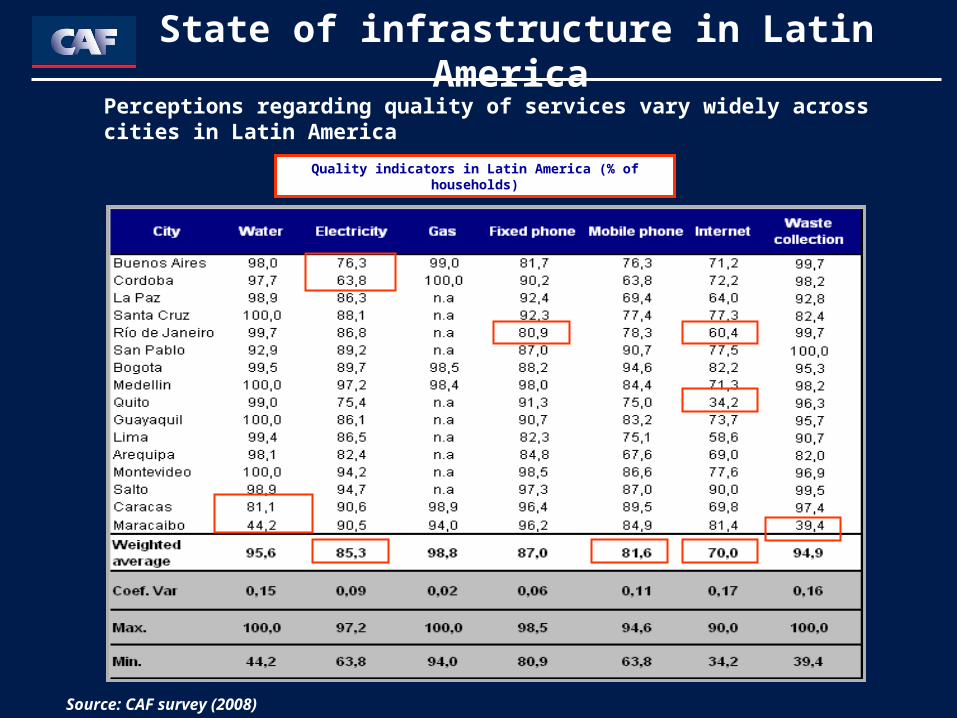
Source: CAF survey (2008)
Quality indicators in Latin America (% of households)
State of infrastructure in Latin America
Perceptions regarding quality of services vary widely across cities in Latin America
In the context of the previous evidence on the quantity and
quality of infrastructure in the region, how has investment evolved?
State of infrastructure in Latin America
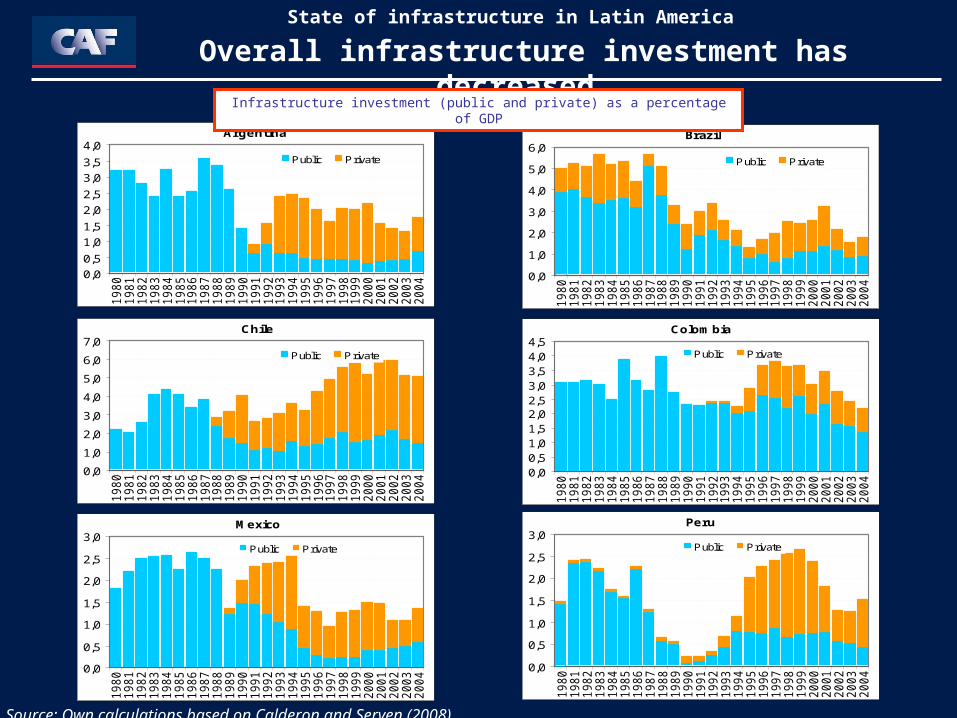
Overall infrastructure investment has decreased…
Argentina
0,0
0,5
1,0
1,5
2,0
2,5
3,0
3,5
4,0
1980
1981
1982
1983
1984
1985
1986
1987
1988
1989
1990
1991
1992
1993
1994
1995
1996
1997
1998
1999
2000
2001
2002
2003
2004
Public Private
Chile
0,0
1,0
2,0
3,0
4,0
5,0
6,0
7,0
1980
1981
1982
1983
1984
1985
1986
1987
1988
1989
1990
1991
1992
1993
1994
1995
1996
1997
1998
1999
2000
2001
2002
2003
2004
Public Private
Mexico
0,0
0,5
1,0
1,5
2,0
2,5
3,0
1980
1981
1982
1983
1984
1985
1986
1987
1988
1989
1990
1991
1992
1993
1994
1995
1996
1997
1998
1999
2000
2001
2002
2003
2004
Public Private
Brazil
0,0
1,0
2,0
3,0
4,0
5,0
6,0
1980
1981
1982
1983
1984
1985
1986
1987
1988
1989
1990
1991
1992
1993
1994
1995
1996
1997
1998
1999
2000
2001
2002
2003
2004
Public Private
Colombia
0,00,51,01,52,02,53,03,54,04,5
1980
1981
1982
1983
1984
1985
1986
1987
1988
1989
1990
1991
1992
1993
1994
1995
1996
1997
1998
1999
2000
2001
2002
2003
2004
Public Private
Peru
0,0
0,5
1,0
1,5
2,0
2,5
3,0
1980
1981
1982
1983
1984
1985
1986
1987
1988
1989
1990
1991
1992
1993
1994
1995
1996
1997
1998
1999
2000
2001
2002
2003
2004
Public Private
Infrastructure investment (public and private) as a percentage of GDP
Source: Own calculations based on Calderon and Serven (2008)
State of infrastructure in Latin America
State of infrastructure in Latin America
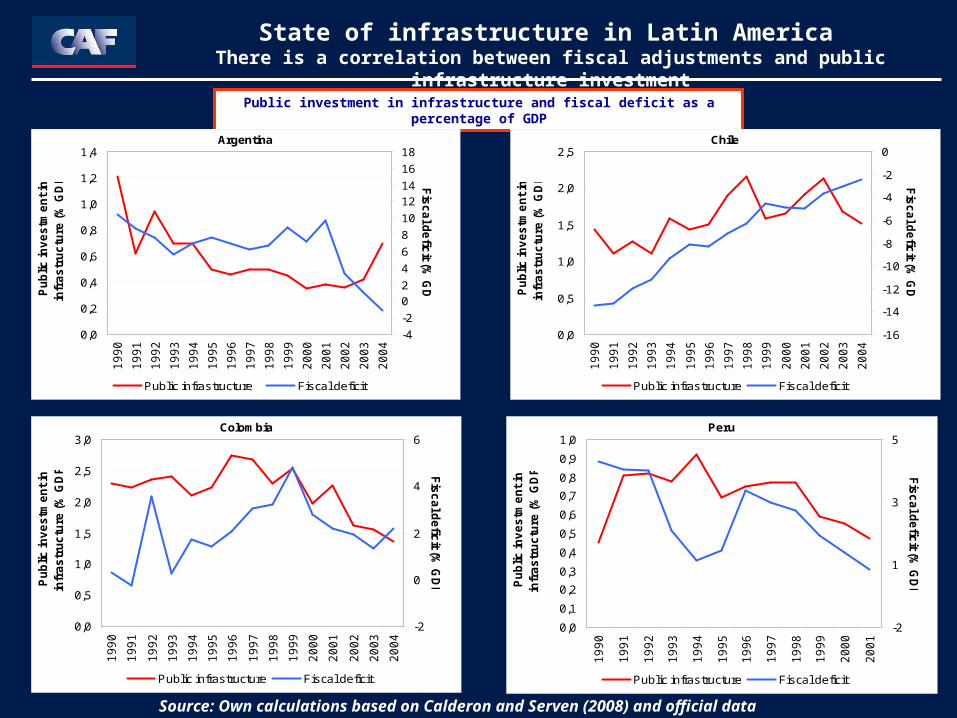
There is a correlation between fiscal adjustments and public infrastructure investment
Public investment in infrastructure and fiscal deficit as a percentage of GDP
Source: Own calculations based on Calderon and Serven (2008) and official data
Argentina
0,0
0,2
0,4
0,6
0,8
1,0
1,2
1,4
19
90
19
91
19
92
19
93
19
94
19
95
19
96
19
97
19
98
19
99
20
00
20
01
20
02
20
03
20
04
Pu
blic
inv
es
tme
nt
in
infr
as
tru
ctu
re (
% G
DP
)
-4
-2
0
2
4
6
8
10
12
14
16
18
Fis
ca
l de
ficit (%
GD
P)
Public infrastructure Fiscal deficit
Colombia
0,0
0,5
1,0
1,5
2,0
2,5
3,0
19
90
19
91
19
92
19
93
19
94
19
95
19
96
19
97
19
98
19
99
20
00
20
01
20
02
20
03
20
04
Pu
blic
inv
es
tme
nt
in
infr
as
tru
ctu
re (
% G
DP
)
-2
0
2
4
6
Fis
ca
l de
ficit (%
GD
P)
Public infrastructure Fiscal deficit
Chile
0,0
0,5
1,0
1,5
2,0
2,5
19
90
19
91
19
92
19
93
19
94
19
95
19
96
19
97
19
98
19
99
20
00
20
01
20
02
20
03
20
04
Pu
blic
inv
es
tme
nt
in
infr
as
tru
ctu
re (
% G
DP
)
-16
-14
-12
-10
-8
-6
-4
-2
0
Fis
ca
l de
ficit (%
GD
P)
Public infrastructure Fiscal deficit
Peru
0,0
0,1
0,2
0,3
0,4
0,5
0,6
0,7
0,8
0,9
1,0
19
90
19
91
19
92
19
93
19
94
19
95
19
96
19
97
19
98
19
99
20
00
20
01
Pu
blic
inv
es
tme
nt
in
infr
as
tru
ctu
re (
% G
DP
)
-2
1
3
5
Fis
ca
l de
ficit (%
GD
P)
Public infrastructure Fiscal deficit
1. Since infrastructure is such an important element for the development process, one needs a better understanding of the factors underlying the link between infrastructure and:
• Households’ quality of life,• Productivity of firms and industries and international trade, • Environment
It is important to undertake rigorous impact evaluations analyses. This will provide: better information for decision-making; enrich public debates; improved ex-ante evaluations and more efficient public spending.
Main messages of the report
2. Improve management process both at the public and private level. This implies:
• To have a comprehensive vision of the different intervention mechanisms:
- New investment
- Maintenance
- Administration of existing infrastructure facilities
• Strengthening institutions associated with planning, evaluating, regulating and supervising infrastructure services.
Main messages of the report
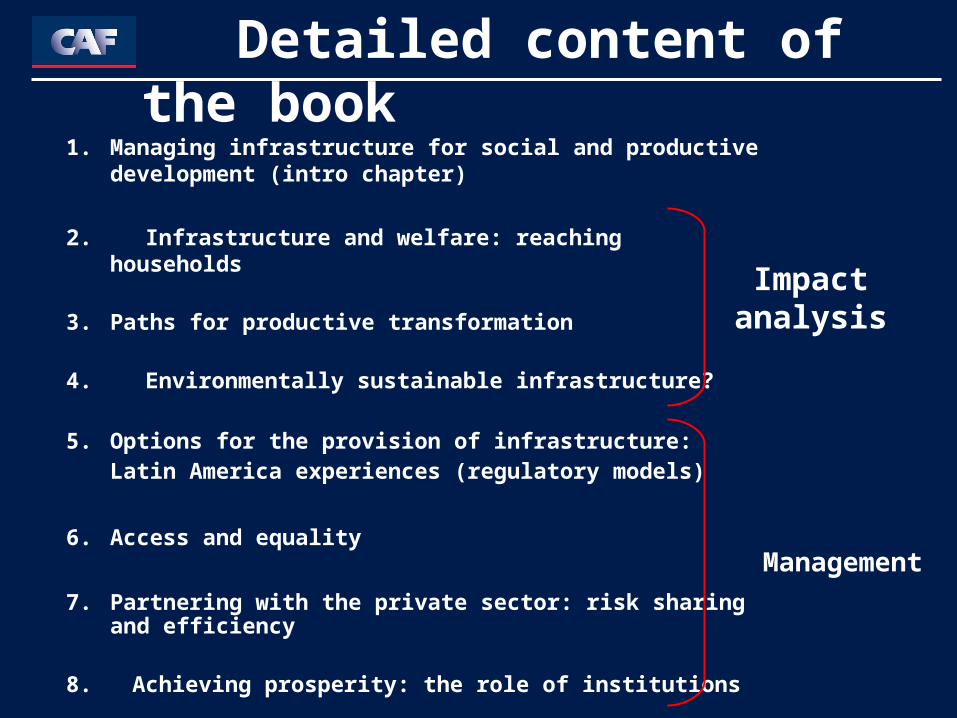
Detailed content of the book
1. Managing infrastructure for social and productive development (intro chapter)
2. Infrastructure and welfare: reaching households
3. Paths for productive transformation
4. Environmentally sustainable infrastructure?
5. Options for the provision of infrastructure: Latin America experiences (regulatory models)
6. Access and equality
7. Partnering with the private sector: risk sharing and efficiency
8. Achieving prosperity: the role of institutions
Impact analysis
Management
Impact of infrastructure
• Proper impact evaluation will ensure better infrastructure project selection. However, causality remains an important challenge.
• Sector complementarities must be considered (e.g. water and electricity) and tradeoffs among different types of policies must be analyzed (e.g. new investment vs. maintenance).
Impact of infrastructure
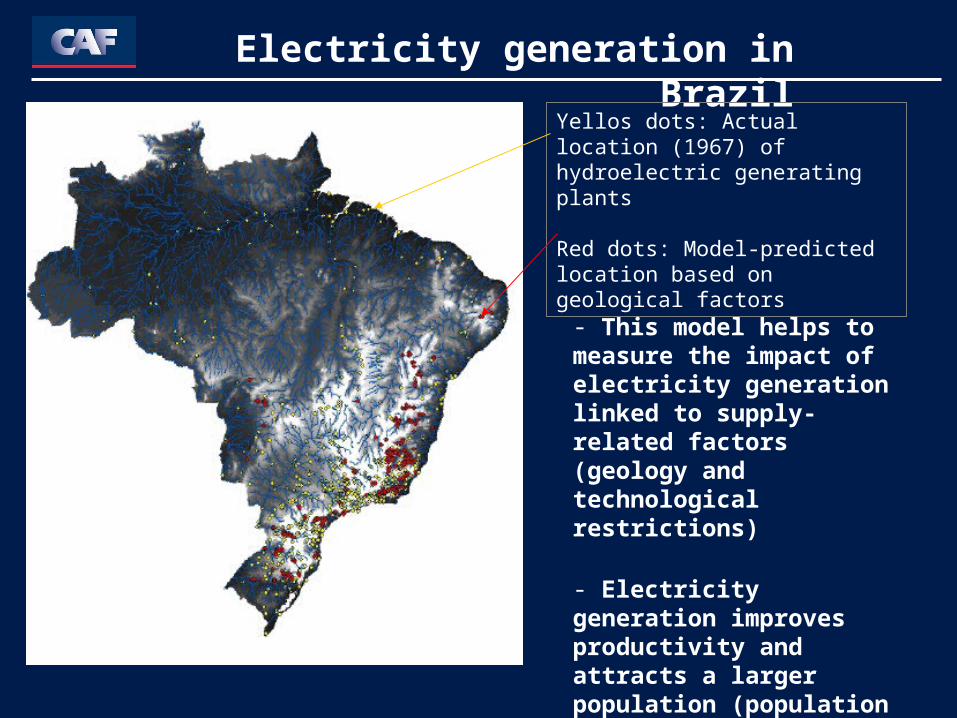
Electricity generation in Brazil
Yellos dots: Actual location (1967) of hydroelectric generating plants
Red dots: Model-predicted location based on geological factors
- This model helps to measure the impact of electricity generation linked to supply-related factors (geology and technological restrictions)
- Electricity generation improves productivity and attracts a larger population (population density may double each decade)
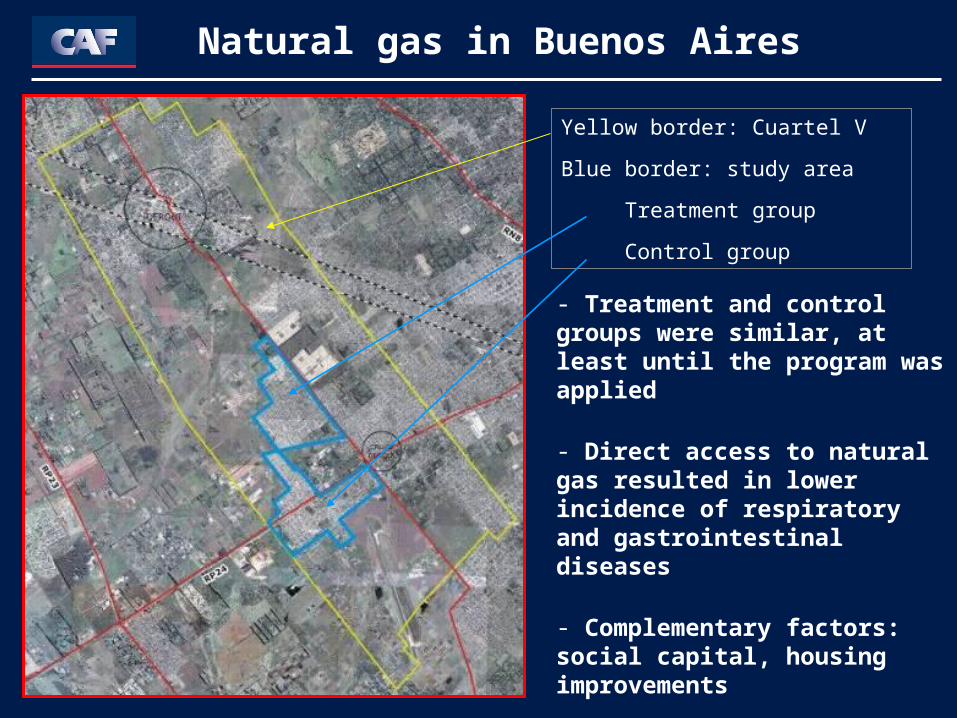
Natural gas in Buenos Aires
Yellow border: Cuartel V
Blue border: study area
Treatment group
Control group
- Treatment and control groups were similar, at least until the program was applied
- Direct access to natural gas resulted in lower incidence of respiratory and gastrointestinal diseases
- Complementary factors: social capital, housing improvements
Improving Infrastructure management
Improving Infrastructure management
• An adequate management of infrastructure depends on the nature of the established institutional and regulatory framework. The private sector has been and could be a key player.
• The public sector should be capable of planning, evaluating, regulating and overseeing infrastructure investments, both public and private.
- Examples of planning institutions: multiyear planning in Brazil; “Botton Up” Territorial Planning in Colombia
- Examples of evaluating schemes : SNIP legislation in Peru.
Public Private Partnerships
• Public Private Partnerships (PPP) have had an increasing role in infrastructure provision
- Intermediate approach between outright privatization and traditional public provision (pubic work contracts).
- They can be applied even for projects that user tariffs would not cover all cost. Public sector could participate co-financing the project. Example: highways.
- PPP´s main advantage is enabling better risk distribution (allocation rules) and efficiency gains (bundling).
•
Public Private Partnerships
• Institutional scheme for better management of PPPs:
- Strategic planning and project identification: sector ministries (transport, etc.)
- Priorization or coordination: Finance ministries or National Planning Departments (fiscal consequences)
- PPP agencies in charge of attracting private sector participants and designing contracts
- Independent regulatory agencies: Contract enforcement and information on service provision
- Monitoring: ex-post impact evaluation by NSPI in collaboration with local universities.
Regulatory aspects
• Infrastructure characteristics justify regulation and determine specific regulatory schemes:
• Size and maturity of investments• Scale and scope economies• Network effects
• There is no single regulatory model.
• Regulation encompasses a broad scope of variables and parameters: prices, quality, investments, public subsidies, procurement, property schemes, etc.
• Regulate quality standards when cost efficiency may lead to quality reduction.
• Regulation should not limiting competition in those segments/markets that this is feasible (electricity generation). It may also meeting social objectives.
• Infrastructure plays a key role in development. That is why we need to have a better understanding of the factors underlying this link, and the mechanisms through which this relation takes form. This will ultimately lead to better selection of projects and evaluation methods.
• Need for improving infrastructure service management both in the public and the private sector.
• This requires strengthening institutions associated with planning, evaluating, regulating and supervising infrastructure services.
• A well designed PPP regimen and legislation could improve the social gains associated with private sector participation in infrastructure.
Final Remarks

http://www.caf.comhttp://www.caf.com