terrestrial laser scanner techniques in the assessment of ... · 1dipartimento di scienze...
TRANSCRIPT
Earth Planets Space, 64, 889–903, 2012
Terrestrial Laser Scanner techniques in the assessment of tsunami impacton the Maddalena peninsula (south-eastern Sicily, Italy)
G. Scicchitano1,5, C. Pignatelli2,3, C. R. Spampinato1, A. Piscitelli4, M. Milella4, C. Monaco1, and G. Mastronuzzi2,3
1Dipartimento di Scienze Geologiche, Universita di Catania, Corso Italia, 55, 95129 Catania, Italy2Dipartimento di Scienze della Terra e Geoambientali, Universita degli Studi ‘Aldo Moro’ di Bari, Via E.Orabona, 4, 70125, Bari, Italy
3LAGATTA LAboratorio Gis geoAmbientale e di Telerilevamento-Taranto, II Facolta di Scienze Matematiche, Fisiche e Naturali,Universita degli Studi “Aldo Moro”, Via A. De Gasperi, 74123 Taranto, Italy
4Environmental Surveys s.r.l., Via Della Croce 156, 74100 Taranto, Italy5Studio Geologi Associati T.S.T. Via Galliano, 157, 95045, Misterbianco, Catania, Italy
(Received November 24, 2010; Revised November 5, 2011; Accepted November 7, 2011; Online published October 24, 2012)
The coastline of the Maddalena peninsula (south-eastern Sicily, Italy) is characterised by the occurrence ofa boulder field associated to an extended soil stripping area and by a gravel/sandy berm. The accumulation ofthe boulders has been mostly correlated to the impact of the December 28, 1908 tsunami wave. The use ofTerrestrial Laser Scanner survey techniques, associated to Differential Global Position System determinations,permits to obtain new data for the assessment of tsunami impact on this coastal area. The computing of thesurveyed data using the most recent equations is a useful tool in order to estimate the theoretic inundation limitand to reconstruct its variability in function of the boulders size and of the coastal topography. Moreover, theentire new data set allows to confirm that the hypothesis of the tsunami impact is the most reasonable to explainthe occurrence of boulders weighing up to 50 tons on the Maddalena peninsula.Key words: Tsunami, hydrodynamic model, Laser Scanner Techniques, Sicily, Italy.
1. IntroductionOne of the most impressive evidence of extreme wave
impact on the rocky coasts is represented by the presenceof mega-boulders, sparse or accumulated in field or berms(Mastronuzzi and Sanso, 2000, 2004; Williams and Hall,2004; Hall et al., 2006, 2008; Scheffers and Scheffers,2006; Mastronuzzi et al., 2007; Scicchitano et al., 2007;Goto et al., 2009a, b, 2010a). The post-event surveys per-formed after the impact of the Indian Ocean Tsunami (IOT),occurred on December 26, 2004, have permitted to recog-nise morphological/sedimentological effects of its impactand, in the same time, to extend all obtained results oncoastal sectors where similar evidences were recognised(e.g. Szczuciski et al., 2005; Kelletat et al., 2006, 2007;Lavigne et al., 2006; Richmond et al., 2006; Paris et al.,2007, 2009, 2010; Srinivasalu et al., 2007; Umitsu et al.,2007). In particular, it has been demonstrated that fre-quently the wave flow has been able to detach and scat-ter inland boulders of significant size and weight (Goto etal., 2009a, b). Notwithstanding the immense number ofdata derived by the surveys performed all along the coasthit by the IOT, the debate about the correlation of theselandforms/sediments with the extreme event responsible oftheir genesis/deposit is still open. In fact, since the absenceof eyewitness, at present, no undisputable signatures allowto discriminate between the boulders accumulated by a sea
Copyright c© The Society of Geomagnetism and Earth, Planetary and Space Sci-ences (SGEPSS); The Seismological Society of Japan; The Volcanological Societyof Japan; The Geodetic Society of Japan; The Japanese Society for Planetary Sci-ences; TERRAPUB.
doi:10.5047/eps.2011.11.009
storm from those accumulated by tsunami. The reply to thisscientific question was the increase of the number of papersexamining the nature of these landforms/sediments, focus-ing their attention on the wave forces necessary to detach,transport and deposit boulders of different size and weight(e.g. Nott, 1997, 2003; Noormets et al., 2004; Scheffers andKelletat, 2005; Kelletat et al., 2006, 2007; Mastronuzzi etal., 2006; Scheffers, 2006, 2008; Goto et al., 2007, 2010b;Scicchitano et al., 2007; Imamura et al., 2008; Kelletat,2008; Benner et al., 2010; Goff et al., 2010; Regnauld etal., 2010).
The occurrence of boulders eradicated from the infralit-toral/adlittoral zones is considered evidence of the past im-pact of extreme waves. Starting from the presence of boul-ders and from their size, some authors consider really possi-ble to evaluate the features of the impacting waves. An im-portant degree of uncertainty regards the methodology aim-ing to the definition of the origin of the wave responsiblefor their deposition. In the boulder accumulation process,is the impacting wave height more important compared tothe wave length and to the wave period? Different theorieshave been proposed in the recent time, but the final reply isstill far away (Nott, 2003; Goto et al., 2007, 2009b, 2010b;Hansom et al., 2008; Imamura et al., 2008; Pignatelli et al.,2009; Barbano et al., 2010). The more easy reply is that if awave can be described by height, length and period, the bestway to evaluate its impact on a rocky coast should considerthese parameters all together.
The aim of this paper is to estimate the inland penetrationlimit of tsunami waves responsible for boulder depositionapplying the Pignatelli et al. (2009) method. In particular,
889
890 G. SCICCHITANO et al.: TSUNAMI IMPACT, SOUTH-EASTERN SICILY, ITALY
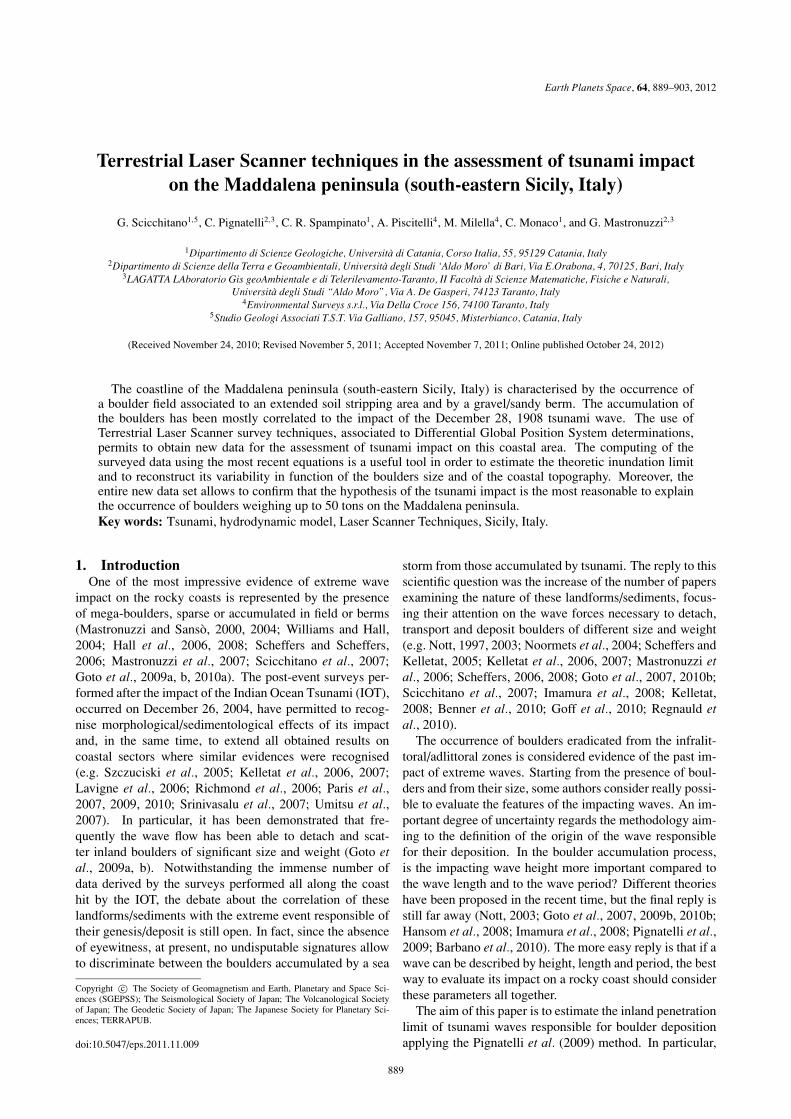
Fig. 1. (a) Tectonic sketch map of south-eastern Sicily. Inset shows the seismotectonic features of the Siculo-Calabrian rift zone (Monaco and Tortorici,2000) and its location in the central Mediterranean area (line with triangles indicates the frontal thrust of the orogenic belt). (b) Geographical positionof the sites studied by Scicchitano et al. (2007, 2010) along the Ionian coast of southeastern Sicily, in the Augusta–Siracusa area (see Fig. 1(a) forlocation). (c) The studied area (box) on the north-eastern corner of the Maddalena peninsula (see Fig. 1(b) for location).
Terrestrial Laser Scanner (TLS) and Differential Global Po-sition System (DGPS) techniques were used to survey someboulders accumulated on the Maddalena peninsula (Fig. 1),along the south-eastern coasts of Sicily (Italy), whose ac-
cumulation has been ascribed to the impact of three differ-ent and famous tsunamis occurred during the 1169, 1693and 1908 seismic events (Scicchitano et al., 2007). The useof the TLS techniques allows an accurate evaluation of the

G. SCICCHITANO et al.: TSUNAMI IMPACT, SOUTH-EASTERN SICILY, ITALY 891
boulders size and weight whose accuracy is fundamentalin order to test the reliability of the known hydrodynamicequations.
2. Geological and Geomorphological SettingSouth-eastern Sicily is one of the most seismically active
areas of the central Mediterranean (Fig. 1(a)). It is char-acterized by thick Mesozoic to Quaternary carbonate se-quences and volcanics forming the emerged foreland of theSiculo-Maghrebian thrust belt (Grasso and Lentini, 1982).This area, mostly constituted by the Hyblean Plateau, is lo-cated on the footwall of a large normal fault system whichsince the Middle Pleistocene has reactivated the Malta Es-carpment (Hirn et al., 1997; Bianca et al., 1999), a Meso-zoic boundary separating the continental domain from theoceanic crust of the Ionian basin (Scandone et al., 1981;Sartori et al., 1991; Argnani and Bonazzi, 2005). Sincethe Middle Pleistocene, active faulting has contributed tocontinuous extensional deformation from eastern Sicily towestern Calabria (Siculo-Calabrian Rift Zone, see insetin Fig. 1(a); Monaco and Tortorici, 2000; Jacques et al.,2001). In eastern Sicily the SSW-NNE striking normalfaults are mostly located offshore and control the Ioniancoast from Messina to the eastern lower slope of Mt. Etna,joining southwards to the NNW-SSE trending system ofthe Malta Escarpment. This area is marked by a highlevel of crustal seismicity producing earthquakes with MCS(Mercalli-Cancani-Sieberg) intensities of up to XI–XII andM ∼ 7, such as the 1169, 1693 and 1908 events (Postpischl,1985; Boschi et al., 1995). Several earthquake-generatedtsunamis struck the Ionian coast of south-eastern Sicily inhistorical times (AD 1169, 1329, 1693, 1818, 1908, 1990;Tinti et al., 2004, 2007; Scicchitano et al., 2007; Smedile etal., 2011). According to most of published geological dataand numerical modelling, the seismogenic source of theseevents should be located in the Messina Straits and in theIonian offshore (the Malta Escarpment) between Cataniaand Siracusa (Baratta, 1910; Barbano and Cosentino, 1981;Carbone et al., 1982; Barbano, 1985; Lombardo, 1985;Postpischl, 1985; Ghisetti, 1992; Valensise and Pantosti,1992; Piatanesi and Tinti, 1998; Bianca et al., 1999; Azzaroand Barbano, 2000; Monaco and Tortorici, 2000; Tintiand Armigliato, 2003). However it is important to con-sider that other source such as submarine landslides or vol-canic eruption, could be responsible of the generation oftsunamis that struck the Ionian coast of south-eastern Sicily(Mastronuzzi, 2010).
Geomorphological evidences of extreme waves impactare present all along the coast of south-eastern Sicily be-tween the town of Augusta and Capo Passero (Fig. 1(a)).Scicchitano et al. (2007) described boulder deposits re-lated to tsunami and storm generated waves between Au-gusta and Siracusa (Fig. 1(b)). Hydrodynamic estimationsand radiocarbon age determinations suggested that threedistinct tsunami events (1169, 1693, 1908) were responsi-ble for the deposition of the biggest isolated boulders andboulder fields. Along the coast of Vendicari, 40 km southof Siracusa (Fig. 1(a)), Barbano et al. (2010) discovereda boulder field and isolated boulders related to differenttsunami events. Moreover, tsunami impact deposits related
to the 1693 event and other tsunami and storm depositswere found preserved within a ria-type rocky coastal set-ting at the bottom of the channel harbour of Ognina, 20 kmsouth of Siracusa (Scicchitano et al., 2010). Finally, DeMartini et al. (2010) and Smedile et al. (2011) evidencedthe occurrence of out of place coarse layers ascribed to dis-tinct tsunami waves that invaded lagoon and marine envi-ronments near Augusta.
The boulder deposit described in this paper has beenfound near Siracusa, south-east Sicily (Fig. 1(b)), alongthe north-eastern corner of the Maddalena peninsula thatbounds to the south the large natural harbour of the town.
3. Boulder SettingThe Maddalena peninsula (Fig. 1(c)) is a calcareous
semi-horst gently tilted to the ENE, formed by Miocenelimestones that along the coast are unconformably coveredby Pleistocene calcarenites. Most boulders are scattered ata distance of up to 70 m from the coastline (Scicchitano etal., 2007) on a large Pleistocene wave-cut platform located5–10 m above sea level (a.s.l.), gently sloping towards thesea and bordered by up to 5 m high cliffs. The near-shoresea bottom topography is irregular, being characterized bytwo steps at −6/−10 m and at −10/−32 m. The blocksare mostly arranged in isolated elements (Figs. 2(a, b)) andhave also been found on a flat anthropogenic platform at 1–2 m a.s.l. inside an ancient Greek quarry located along thecoast and nowadays partially submerged (Scicchitano et al.,2008) (Figs. 2(c, d)). Locally, small groups composed ofstacked elements occur. It’s worth to note that the bouldersare preferentially accumulated on sectors of promontoriesexposed towards north-east (Fig. 1(c)), where the offshoresource areas of earthquakes are located (active faults in theMessina Straits and at the foot of the Malta Escarpment, seeFig. 1(a)).
The studied area is characterized by the occurrence of awell developed berm (Fig. 3(a)) located at a distance rang-ing between 80 m and 90 m from the coastline (Marziano,2004). The berm is composed by coarse sand and pebblesorganized into a cross laminated stratification lying on apaleo-soil (Fig. 3(b)). Various shells and shell fragmentswere recognized in the berm and several pottery and humanmanufactory were distinguished too (Fig. 3(c)). The occur-rence of several boulders, up to 1 ton in weight, on the berm(Fig. 3(d)) was interpreted by Marziano (2004) as evidenceof its deposition by extreme waves.
In order to estimate the inland penetration limit oftsunami waves responsible for boulder deposition, our studyhas been focused on the three biggest boulders described inthe area by Scicchitano et al. (2007), that are B3, B4 andB13 (Fig. 2) whose features indicate a joint bounded sce-nario JBS. TLS and DGPS techniques were used to surveyboth boulders and berm.
4. Hydrodynamic EquationsNott (1997) proposed hydrodynamic equations in order
to evaluate the height of tsunami or of severe storm wavesable to detach and move boulders. These equations take intoaccount boulder dimensions (a-axis = major axis, b-axis =medium axis, c-axis = minor axis), boulder shape and den-

892 G. SCICCHITANO et al.: TSUNAMI IMPACT, SOUTH-EASTERN SICILY, ITALY
Fig. 2. (a) Boulders B3 and B4 along the coast of Maddalena peninsula. (b) Boulder B13 located inside an ancient Greek quarry. (c) Panoramic viewof the ancient Greek quarry located on the north-eastern corner of the Maddalena peninsula. (d) Aerial view of the studied area (photograph suppliedby Marine Protected Area of Plemmirio, Siracusa). The arrows indicate the analyzed boulders.
sity of rock (bulk density). Nott (2003) improved theseequations introducing the pre-transport settings and, to bemore precise, the determination of the main morphologi-cal features of the deposited boulders: the position priorto the tsunami impact, the size, the shape and rock den-sity. Indeed, the reconstruction of the position prior to thetsunami impact could be extremely important in the predic-tion of the possible future scenarios. Three different sce-narios were hypothesized: the first one considers a boul-
der placed on a cliff edge (joint bounded scenario JBS);in the second one, the boulder is taken up and placed be-low sea level (submerged scenario SMS); in the last one,the boulder is detached and placed inland (sub-aerial sce-nario SAS). Many authors used Nott’s equations to deter-mine if sea storm or tsunami were responsible for boulderdisplacement (e.g. Scheffers, 2002, 2004; Mastronuzzi andSanso, 2004; Mastronuzzi et al., 2007; Scicchitano et al.,2007; Maouche et al., 2009); some of these studies have

G. SCICCHITANO et al.: TSUNAMI IMPACT, SOUTH-EASTERN SICILY, ITALY 893
Fig. 3. (a) View of the berm located in the north-eastern corner of the Maddalena peninsula. (b) Natural section of the berm showing coarse sands andpebbles lying on a paleo-soil (see Marziano, 2004). (c) Human manufactory found in the berm deposit; (d) Boulders overlying the berm deposit.
Fig. 4. 3D representation of the tsunami impact on a rocky coast. The small parallelepiped represents a boulder in joint bounded conditions. a, b, c:main axes of the boulder. The a × c red surface is directly exposed to wave.
permit to deduce that storm and tsunami heights calculatedby Nott’s equations appear overestimated (e.g. Scheffers,2002, 2004; Paris et al., 2009; Goto et al., 2010b; Bourgeoisand MacInnes, 2010). Moreover, starting from the study ofboulder accumulated by past tsunami impacting the Apulia
coasts (southern Italy), Pignatelli et al. (2009) introducednew equations that optimize the Nott’s theory. According toPignatelli et al. (2009), boulders come from the emerged—or immediately submerged—part of the cliff in JBS condi-tion, drawing a scenario that is very similar to the geomor-

894 G. SCICCHITANO et al.: TSUNAMI IMPACT, SOUTH-EASTERN SICILY, ITALY
phological situation described by Noormets et al. (2002,2004); the boulder is placed still in the outcropping rockbut loose along joints at all sides. In this condition the a ×cface of the boulder—c-axis indicates the thickness—is di-rectly exposed to wave impact (Fig. 4). The Pignatelli et al.(2009) hydrodynamic equation is:
HT = [0.5 · c · (ρb − ρw)/ρw]/CL (1)
where HT is the tsunami height at breaking point, c axis isthe boulder height (thickness), ρb is the density of boulder,ρw is the density of water = 1.02 g/ml; CL is the coefficientof lift = 0.178 (see Bryant, 2001). In the scenario hypothe-sized by Pignatelli et al. (2009) it is possible to calculate thetsunami height at the top of the cliff; the wave heights usedto simulate the tsunami flooding are assessed in relation tothe boulder scattered inland. If a boulder is detached fromcliff edge (joint bounded scenario), the height of the watercolumn flooding can be obtained from this relation:
HFL = HT − Altitude of the cliff. (2)
In fact, at the edge of the cliff, where the boulders initiallywere placed, the tsunami height must be not smaller thanthe minimum wave able to move the biggest boulder.
Hills and Mader (1997) provided an empirical formulathat permits to calculate the inland flooding limit XFL of animpacting tsunami:
XFL = (HFL)1.33n−2k (3)
where: HFL is tsunami height at coastline; n is Manning’snumber (see below), k = 0.06 is a constant for manytsunamis (see Bryant, 2001). This formula provides goodestimation for coasts characterised by overland flat profile.In the reality, often the coastal sectors show sloping over-land profile very complex, conditioned by the local litho-structural features. Starting from the cited formula, consid-ering boulder accumulated by tsunami at a distance D fromthe coastline, a factor cos α—where α represents the meansloping—has been introduced (Pignatelli et al., 2009); thispermit to take into account the coastal overland profile:
XFL = D + (HFL)1.33n−2k cos α. (4)
The Manning number is a coefficient expression of themicro-topography and sinuosity of the surface; it repre-sents the hydraulic roughness of the terrain propriety thatcauses resistance to the water flow by creating a retardingforce (Chow, 1973). Various authors have estimated Man-ning coefficient for distinct terrain typology (Arcement andSchneider, 1989) but the obtained values are often approx-imated since their absolute value did not derive by strictlyquantitative surveys. As consequence, the use of the Hillsand Mader (1997) equation adopting distinct Manning co-efficient is not always rigorous. Moreover, an importantaspect that should not be neglected is the roughness vari-ability over time. In fact, the Manning coefficient is notconstant with time in the same place due to weed and/or ur-ban growth (Asal, 2003). As a consequence, in a coastalsector it is possible to obtain an evaluation of the presentroughness useful for the elaboration of a near-future sce-nario, but that is not representative of a past tsunami impact(i.e. Pignatelli et al., 2010).
5. Material and MethodsThe assessment of the inland penetration limit of tsunami
waves using the Pignatelli et al. (2009) method implies thepossibility of accurately measuring dimension, geometryand position of the main boulders recognised along stud-ied coastal areas. Terrestrial Laser Scanner (TLS) tech-niques were used to perform accurate 3D reconstruction ofthe three biggest boulders located along the coastline of theMaddalena peninsula, whose accumulations have been as-cribed to the impact of different large tsunami (Scicchitanoet al., 2007).
Recent TLS technology is based on the reflectorless ac-quisition of a point cloud of the topography using the time-of-flight distance measurement of laser pulse (Slob andHack, 2004). The scanner consists of a laser beam gen-erator, a mirror rotating on its horizontal axis and forminga 45◦ degree angle with the beam direction and a servo-motor which makes the instrument rotate around its verti-cal axis. This setting gives to the scanner a field view of360◦ × 270◦. The monochromatic and nearly parallel laserpulse is sent out in a precisely known direction. The scannerthen records the back-scattered pulse. The time-of-flight ofthe signal is then converted into the distance between thescanner and the object; these two values are used to calcu-late Cartesian coordinates with reference to the centre of thescanner.
On March 2009 and April 2010 measurements have beenperformed on the cited boulders surveyed in the Mad-dalena peninsula (B3, B4, B13) using a Leica Scanstation 2(Fig. 7(a)); the measurements have been finalised to verifythe occurrence of possible movements after the impact ofthe very strong storms occurred in the span of time rang-ing from 2008 to 2010. The instrument captures up to amaximum of 50,000 points/sec over a maximum range be-tween 200 and 300 m, depending on the reflectivity of thescanned object. A single scan representing a simple pointof view is not enough to realize an accurate 3D reconstruc-tion of the boulders, but the TLS kit is supplied with circu-lar/rectangular targets characterised by a very reflective sur-face (Fig. 5(a)); their position can be acquired for a simpletake and distinction to the beam of the scanner. Therefore,to obtain a complete 3D model, it is necessary to overlapnumerous scans performed from different point of views us-ing selected targets as reference points. The TLS completedatasets acquired were treated and analysed using the HDSCyclone software (Leica Geosystems, 2004). All the rawscans were manually cleaned to remove any outliers suchas vegetation or anthropogenic features. TLS surveys gen-erated cloud points that permitted to reconstruct a 3D modelin order to define shapes and volumes of the boulders se-lected in the studied areas; using a reverse engineering soft-ware, the 3D cloud points were converted to a TIN (trian-gulated irregular network) model which consists of closedsurface. Moreover, the model showed holes and gaps dueboth to scan and to surface interpolations. The fill holes op-eration closes the polygonal structures and makes the layoutcontinuous. The complete reconstruction of lacking parts,also at the bottom, was supported by the using of picturesand allowed to define a more realistic shape of the measuredboulders.

G. SCICCHITANO et al.: TSUNAMI IMPACT, SOUTH-EASTERN SICILY, ITALY 895
Fig. 5. (a) The Scan Station 2 used to perform TLS survey at Maddalena Penisula; (b) Boulder B3 reconstruction obtained applying softwareinterpolation to TLS points cloud; (c) The boulder B3 volume calculated with reverse engineering software tool; (d) DGPS instrument operatingin field.
Table 1. Mean parameters for the three boulders studied in the Maddalena peninsula: axis dimensions (a, b, c), Volume (V ), Density (ρb), (Weight(W ), Distance from the coast line (D), Tsunami wave height (Ht). In bracket are reported values estimated by Scicchitano et al. (2007) for the sameboulders.
Boulder a (m) b (m) c (m) V (m3) ρb (ton/m3) Weight (ton) D (m) Ht (m)
B3 5.76–(8) 4.95–(5) 1.4–(0.7) 21.35–(28) 2.33–(2.28) 49.746–(59.64) 33–(28) 5.051–(6.82)
B4 3.951–(4.9) 3.596–(3.5) 1.088–(1) 9.368–(17.5) 2.08–(2.28) 19.480–(39.10) 33–(35) 3.174–(3.04)
B13 4.746–(5) 2.386–(3.2) 1.343–(1) 9.396–(16) 1.98–(2.28) 18.643–(36.48) 12–(18) 3.566–(2.63)
The 3D model reconstruction of the boulders allows togauge the a, b, c axes more accurately than their measuresobtained by classical field survey. In particular, to assessthe mean value of each axis, several measures can be catchover the whole boulder. Moreover, the 3D model providesthe correct volume which is essential to estimate the boulderweight, knowing the rock density (Figs. 5(b, c); Table 1).Finally, in order to apply the Pignatelli et al. (2009) methodfor calculating the minimum wave height of tsunami or seastorm able to move the boulders and the inland penetrationlimit, it is important to know in detail the coastal topogra-phy especially in the coastal sector where the largest boul-ders are recognised. Highly accurate plano-altimetric sur-veys (Fig. 5(d)) were carried out with a Differential GlobalPosition System (DGPS) in Real Time Kinematic (RTK)mode. This allowed to obtain the altitude of the cliff alongthe considered shoreline, the slope, the position of eachstudied boulder and the inner limit of a sandy/vegetatedberm recognised along the studied area.
6. Data AnalysisWe tested the Pignatelli et al. (2009) method, by apply-
ing it to the boulder field at the Maddalena peninsula, withthe aim of calculating the max inland penetration limit of atsunami wave that is able to transport boulders. We selectedthe three biggest boulders occurring in the area whose fea-tures indicate an original joint bounded partially submergedpre transport setting: for each boulder we performed accu-rate 3D reconstruction using TLS method for measuring thea, b, c axes. Several samples were collected from the se-lected boulders to determinate an accurate average valueof ρb. Using the formula (1) we calculated the tsunamiheight at breaking point HT for the three boulders selected(Table 1). HT values so obtained were subsequently in-troduced into Eqs. (2) and (3) to obtain the maximum in-land penetration limit D of a tsunami wave that is able totransport the analysed boulders. The D value has been es-timated for each boulder starting from the 3D reconstruc-tion obtained by using the TLS survey. The parameters n
896 G. SCICCHITANO et al.: TSUNAMI IMPACT, SOUTH-EASTERN SICILY, ITALY
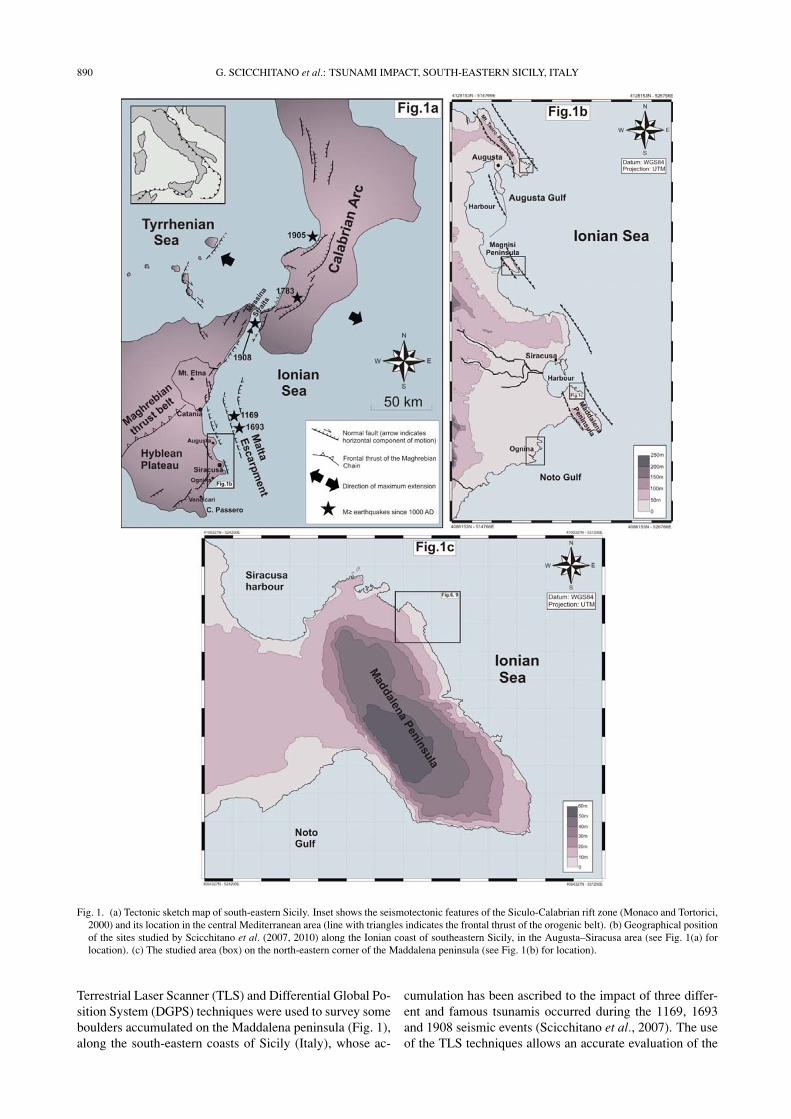
Fig. 6. Sketch map showing the studied area divided into 14 buffer (300 × 50 m) (see Fig. 1(c) for location).
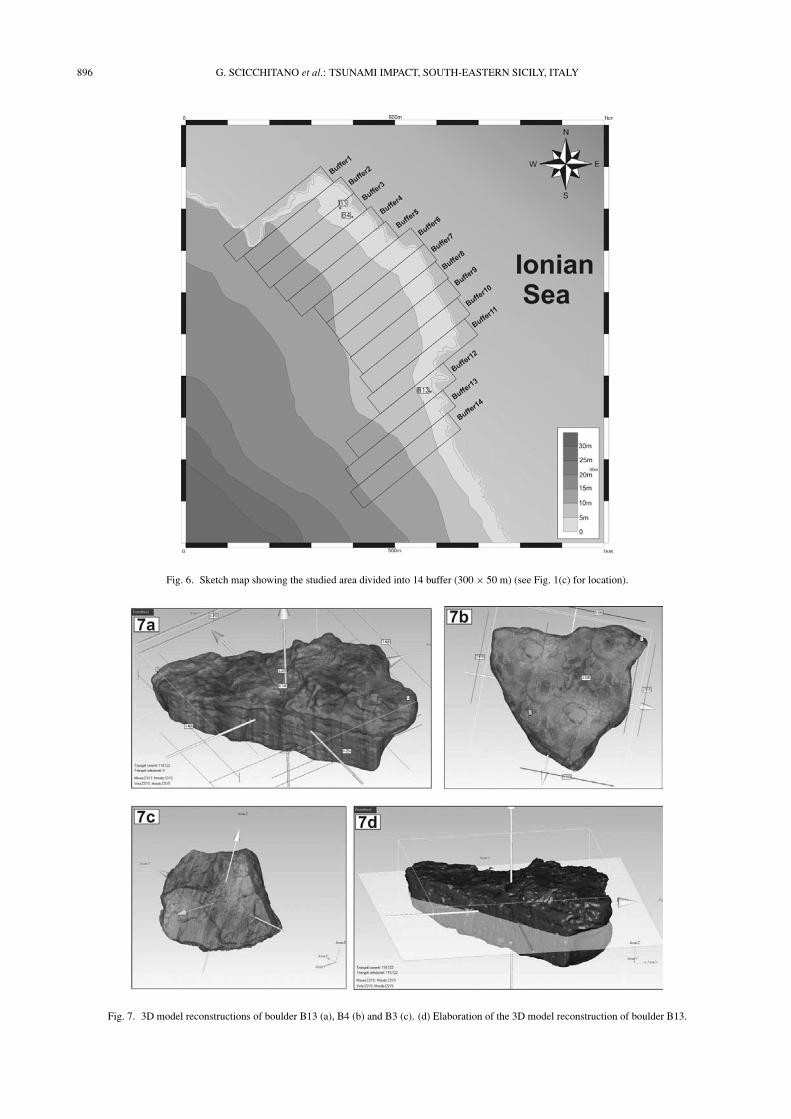
Fig. 7. 3D model reconstructions of boulder B13 (a), B4 (b) and B3 (c). (d) Elaboration of the 3D model reconstruction of boulder B13.

G. SCICCHITANO et al.: TSUNAMI IMPACT, SOUTH-EASTERN SICILY, ITALY 897
Table 2. Values of height of the cliff (hc), mean slope (α) and roughness (n) for each one of the 14 buffer in which the studied area has been divided(see Fig. 8).
Buffer number hc (m) α (◦) Manning number
1 1.5 4 0.042
2 1.8 4 0.041
3 1.7 4 0.041
4 1.8 4 0.041
5 1.7 3.8 0.042
6 1.6 2.7 0.041
7 1.8 2.6 0.041
8 1.8 2.5 0.041
9 1.5 2.4 0.041
10 1.5 2.5 0.042
11 1.75 4 0.040
12 2 5.7 0.039
13 2 6 0.039
14 2 6 0.039
Table 3. Average values of the Manning number n estimated using the methodology of Arcement and Schneider (1989).
Coastal types Manning number (n)
Lagoon, fluvial plain 0.01–0.015
Mediterranean vegetation 0.016–0.025
Farm area 0.026–0.035
Discontinuous dune belts (without vegetation) 0.036–0.040
Dune belts (Altitude ≥ 3 m) 0.041–0.046
Rocky coasts (very karstifyed) 0.047–0.052
Urban area discontinuous 0.053–0.058
Urban area (with buildings very concentrated) 0.059–0.064
Mangrooves 0.065–0.069
Forests, Pinewood, etc. ≥0.07
(Manning number), hc (Altitude of the cliff) and α (emer-gent slope of the coast) are strictly related to the surfaceon which the tsunami flooded the coastal area and were di-rectly measured in field. The selected area has been dividedinto 14 buffers 300 × 50 m (Fig. 8). In Table 1 are reportedsize and weight of the boulders B3, B4, B13 reconstructedfrom 3D models by using TLS survey techniques (Figs. 7(a,b, c)), distance from the coastline and tsunami wave heightrequired to their transport according to the Pignatelli et al.(2009) method. Moreover, we provided a comparison withmeasurements and calculations performed by using analog-ical methods for the same boulders in our previous work(Scicchitano et al., 2007).
Volumes calculated in the previous work appear to beoverestimated with respect to values estimated by 3D modelanalyses, probably depending on having approximated theshape of the boulders to a parallelepiped. In fact, the useof TLS underlined that the classic method of boulder mea-surement tends to overestimate the three main axes and, asconsequence, the weight of the boulder (see also Marsico etal., 2009). Since the Pignatelli et al. (2009) hydrodynamicequations are built around the c-axis value, this approxima-tion induce an evident overestimation of the minimum waveheight able to detach and scatter inland the boulders. More-over, in the previous works an average value of the density(2.28 ton/m3) was considered for the boulders located inMaddalena peninsula, but new analyses furnished different
values ranging between 1.98 ton/m3 and 2.33 ton/m3 also(Table 1).
Unlike the previous work, where the axis dimension ofthe boulders and the distance of the boulders from the coast-line were measured in field by an invar rod mechanical sys-tem, in the present work, in this work we estimated the axisdimension of the boulders by analyzing several planar sec-tions extracted from the 3D model (Fig. 7(d)). For example,as regards the boulder B3, in the previous work a-, b-, c-axis we were estimated to be 8 m, 5 m, 0.7 m, respectively(Table 1). TLS reconstruction furnished values of 5.76 mfor a-axis, 4.95 m for b-axis and 1.4 m for c-axis. Startingfrom these surveyed measures and from the distance of theboulders from the coastline, aiming at defining the floodinginland limit, the applicability of the Pignatelli et al. (2009)equation needs the knowledge of the cliff height (Hc) and ofthe mean slope (α) values. The first value was measured foreach buffer directly on field and corrected for tide (Table 2);the second one was calculated from a DEM (definition1 × 1 m) of the area (Table 2). Average values of the n (theManning number) have been estimated from Arcement andSchneider (1989) (Table 3). In the Maddalena peninsula,two of the distinct coastal types described in Table 3 canbe clearly distinguished: very karstifyed rocky coasts, char-acterized by n ranging between 0.047 and 0.052 (averagevalue = 0.0495), and a pebble sandy berm/soil cover whitshaved vegetation whose n value can be considered similar
898 G. SCICCHITANO et al.: TSUNAMI IMPACT, SOUTH-EASTERN SICILY, ITALY
to that of the discontinuous dune belts, characterized by nranging between 0.036 and 0.040 (average value = 0.038).Considering for each buffer the surface of rocky coasts andsoil cover related to their n values, we obtained weighedaverage values of roughness coefficients (n) from:
n = [(Aknk) + (Adnd)]/(Ak + Ad)
with Ak rocky coast surface, nk manning number for rockycoast (n = 0.0495), Ad berm/soil cover surface, nd man-ning number for berm/soil cover (n = 0.038). Obtainedvalues have been reported in Table 2. In the following,we apply the Pignatelli et al. (2009) equation to calcu-late the maximum inland penetration limits for each bufferin which the area has been divided, considering distincttsunami heights estimated for the biggest boulders foundin Maddalena peninsula.
7. DiscussionThe 3D model reconstruction of each analyzed boulder
highlighted serious discrepancies with measures and esti-mation performed for the same boulders by Scicchitano etal. (2007) using an invar rod mechanical system. Previousmeasurements of the a-, b- axis of the boulders (Table 1)are overestimated up to 25% with respect to the values ob-tained from the 3D models (see boulder B3), whereas thec-axis results underestimated up to 50% (see boulders B3,B13).
The analyses of 3D models allowed us not only to drawthe real shape and geometry of the boulders but also to re-construct the microtopography of the surface of the boul-ders. Erosion pools and features, flow channels, hole andfractures present on the blocks can be easily related to theirgeometry and measured. Microtopography analyses helpedto depict the pre-transport setting of the considered boul-ders and the scenario of their transport. In Scicchitanoet al. (2007), boulders B3, B4, B13 were all consideredinto a submerged scenario, but through microtopographicalinvestigation we obtained further constraints that allowedto attribute them to a joint boulders scenario although ina partial submerged environment. Matter of debate couldbe the type of transport. In a recent paper, Goff et al.(2010) examined the physics of the boulder transport andconcluded that the suspension is unrealistic, whereas theentrainment and/or the saltation are more probable. Thesetypes of transport were directly surveyed by Mastronuzziand Sanso (2004) for boulders moved by a four day storm—hundred-thousand of waves—occurred in Adriatic Sea onJanuary 2003 or hypothesized by Hall et al. (2006, 2008)and by Hansom et al. (2008) for the terrible storms im-pacting on the high British cliffs facing on the North Sea.Despite the conclusions reached by Goff et al. (2010), thegeneral features of the boulders, the absence of significantsmaller fragments, the presence of a delicate and contin-uous band of algal rim and of sparse bio-concretions, alltogether seem to suggest a transport characterised by a sin-gle movement, eluding the possibility that boulders couldhave been rounded by the abrasion on the surf bench. Ex-perimental data indicated that the maximum pressure ex-erted by an impacting wave is concentrated at the breaking
Table 4. Tsunami wave height and storm generated wave height estimatedfor the analyzed boulders at Maddalena peninsula, using the Nott (2003)and Pignatelli et al. (2009) models.
Boulder Nott (2003) Pignatelli et al.
model (2009) model
Ht (m) Hs (m) Ht (m) Hs (m)
B3 6.82 27.28 5.051 20.204
B4 3.04 12.16 3.174 12.696
B13 2.63 10.52 3.566 14.264
wave depth (Rundgren, 1958); broken waves have less en-ergy, directly connected to their height, period and length.Undoubtedly, when a tsunami arrives at the coastline it isalready broken; its velocity is dramatically decreasing dueto its friction on the bottom and length and period values arealso changing. The only effective force on the cliff/slopingcoast is exerted by the water hammer effect due to the in-creasing of the wave height since the impact on the coastand the backwash due to its partial reflection (Goto et al.,2009a). Since the lack of eyewitness, the use of morpho-logical evidence is the only instrument to reconstruct theevent and to characterise its features. In Scicchitano etal. (2007), boulders B4 and B13 were interpreted as trans-ported by the same tsunami; dimension of the axis and den-sity of the boulders were processed by using the Nott (2003)model, estimating a minimum tsunami height and stormgenerated wave height that were compared with the max-imum storm generated wave height calculated starting fromthe dataset of the offshore waves measured by the onda-metric buoy of Catania, that is part of the RON (Rete Onda-metrica Nazionale = national wave measurement network).In Table 4 values of Ht and Hs calculated for the analysedboulders both with Nott (2003) and Pignatelli et al. (2009)methods are reported.
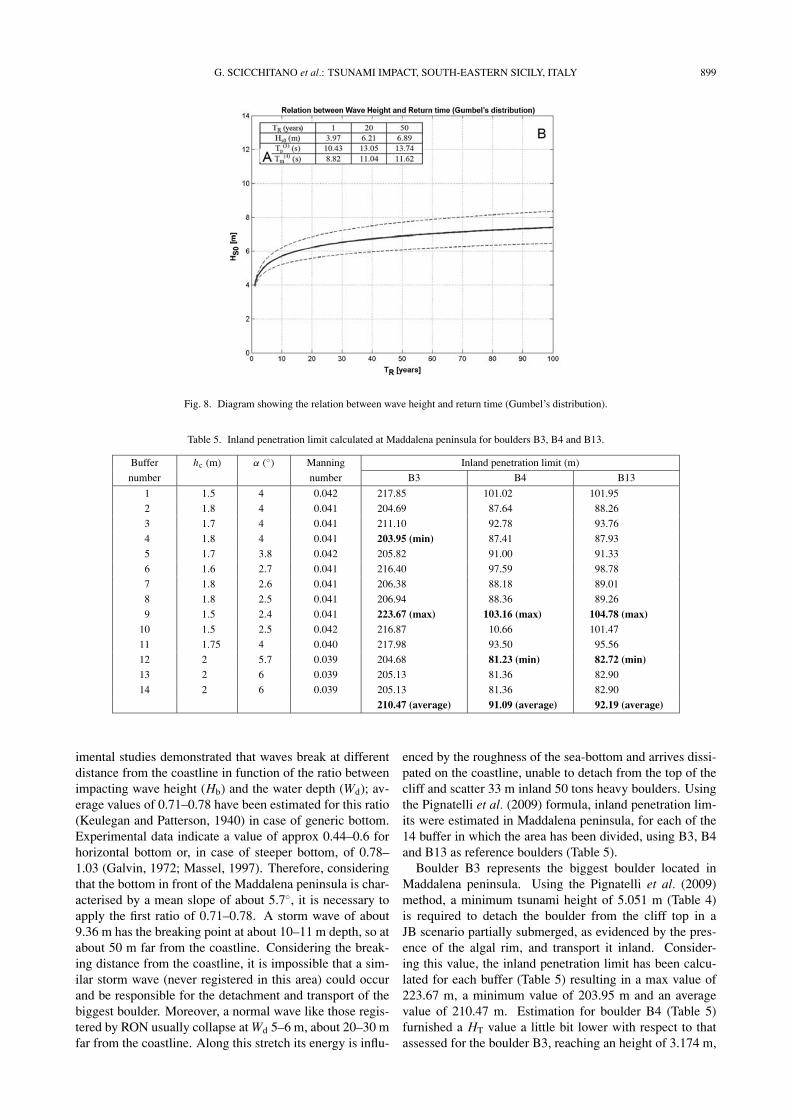
For the Maddalena peninsula, Scicchitano et al. (2007)estimated a maximum storm generated wave height be-tween 9.31 m and 9.36 m, by applying the equation ofSunamura and Horikawa (1974) used to calculate the heightof a wave at breaking point (Hb) starting from the height andthe period of the same wave measured in deep water (Ho).Following this method, the wave heights at breaking pointwere calculated for the most severe storm generated waveregistered by the ondametric buoy of Catania since 1989(Ho1989 = 6.2 m; Hb1989 = 9.31 m) and for the most severestorm generated wave supposable for the area with a returnperiod of 50 years (HoT 50 = 6.24 m; HbT 50 = 9.36 m)estimated by applying the Gumbel treatment to availablerecorded data (Inghilesi et al., 2000) (Fig. 8). Hs valuescalculated by the Nott (2003) and Pignatelli et al. (2009)methods appear to be in any case higher than these val-ues, confirming the results proposed by Scicchitano et al.(2007) namely, that the boulders were transported inland bytsunami events.
Important indications come also from the analysis ofthe bathymetry in front of the promontory—about −5 m—jointly to the estimation of the bottom slope. A storm wavereaches at breaking point its maximum height, but as soonas it over runs the breaking point it breaks and continuouslydecreases in height until it approaches the coastline. Exper-
G. SCICCHITANO et al.: TSUNAMI IMPACT, SOUTH-EASTERN SICILY, ITALY 899
Fig. 8. Diagram showing the relation between wave height and return time (Gumbel’s distribution).
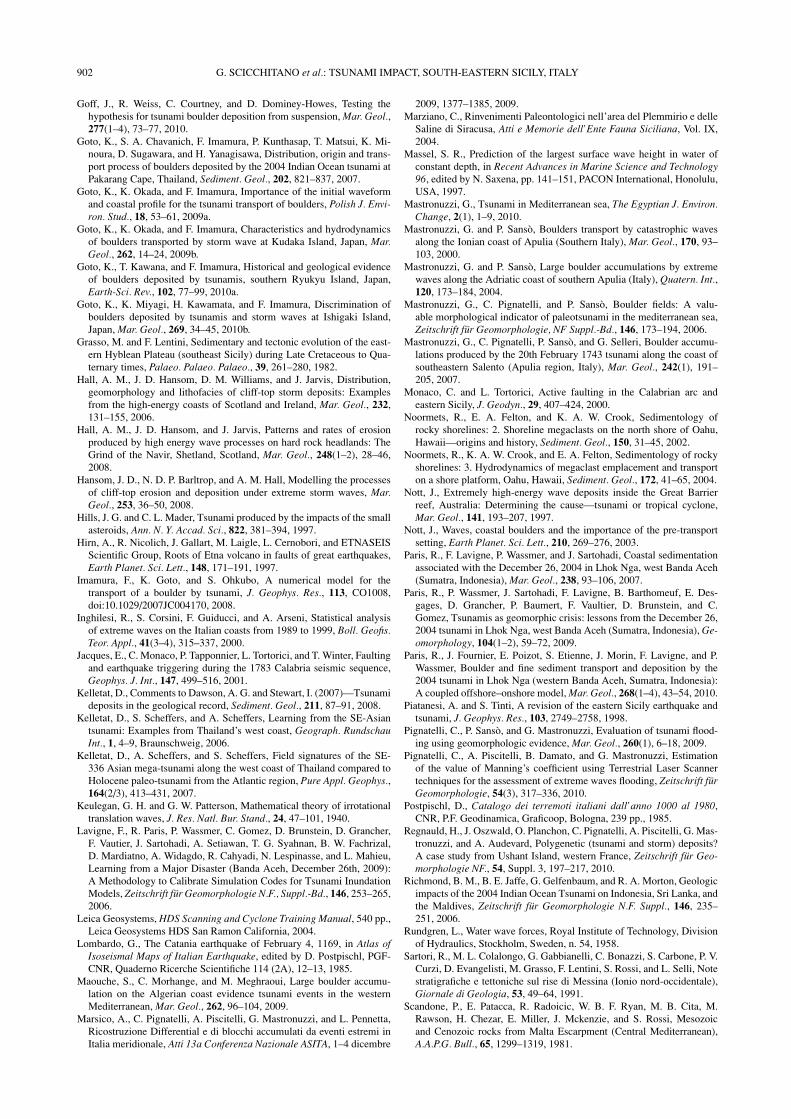
Table 5. Inland penetration limit calculated at Maddalena peninsula for boulders B3, B4 and B13.
Buffer hc (m) α (◦) Manning Inland penetration limit (m)
number number B3 B4 B13
1 1.5 4 0.042 217.85 101.02 101.95
2 1.8 4 0.041 204.69 87.64 88.26
3 1.7 4 0.041 211.10 92.78 93.76
4 1.8 4 0.041 203.95 (min) 87.41 87.93
5 1.7 3.8 0.042 205.82 91.00 91.33
6 1.6 2.7 0.041 216.40 97.59 98.78
7 1.8 2.6 0.041 206.38 88.18 89.01
8 1.8 2.5 0.041 206.94 88.36 89.26
9 1.5 2.4 0.041 223.67 (max) 103.16 (max) 104.78 (max)10 1.5 2.5 0.042 216.87 10.66 101.47
11 1.75 4 0.040 217.98 93.50 95.56
12 2 5.7 0.039 204.68 81.23 (min) 82.72 (min)13 2 6 0.039 205.13 81.36 82.90
14 2 6 0.039 205.13 81.36 82.90
210.47 (average) 91.09 (average) 92.19 (average)
imental studies demonstrated that waves break at differentdistance from the coastline in function of the ratio betweenimpacting wave height (Hb) and the water depth (Wd); av-erage values of 0.71–0.78 have been estimated for this ratio(Keulegan and Patterson, 1940) in case of generic bottom.Experimental data indicate a value of approx 0.44–0.6 forhorizontal bottom or, in case of steeper bottom, of 0.78–1.03 (Galvin, 1972; Massel, 1997). Therefore, consideringthat the bottom in front of the Maddalena peninsula is char-acterised by a mean slope of about 5.7◦, it is necessary toapply the first ratio of 0.71–0.78. A storm wave of about9.36 m has the breaking point at about 10–11 m depth, so atabout 50 m far from the coastline. Considering the break-ing distance from the coastline, it is impossible that a sim-ilar storm wave (never registered in this area) could occurand be responsible for the detachment and transport of thebiggest boulder. Moreover, a normal wave like those regis-tered by RON usually collapse at Wd 5–6 m, about 20–30 mfar from the coastline. Along this stretch its energy is influ-
enced by the roughness of the sea-bottom and arrives dissi-pated on the coastline, unable to detach from the top of thecliff and scatter 33 m inland 50 tons heavy boulders. Usingthe Pignatelli et al. (2009) formula, inland penetration lim-its were estimated in Maddalena peninsula, for each of the14 buffer in which the area has been divided, using B3, B4and B13 as reference boulders (Table 5).
Boulder B3 represents the biggest boulder located inMaddalena peninsula. Using the Pignatelli et al. (2009)method, a minimum tsunami height of 5.051 m (Table 4)is required to detach the boulder from the cliff top in aJB scenario partially submerged, as evidenced by the pres-ence of the algal rim, and transport it inland. Consider-ing this value, the inland penetration limit has been calcu-lated for each buffer (Table 5) resulting in a max value of223.67 m, a minimum value of 203.95 m and an averagevalue of 210.47 m. Estimation for boulder B4 (Table 5)furnished a HT value a little bit lower with respect to thatassessed for the boulder B3, reaching an height of 3.174 m,

900 G. SCICCHITANO et al.: TSUNAMI IMPACT, SOUTH-EASTERN SICILY, ITALY
Fig. 9. Inland penetration limits evaluated at Maddalena peninsula using the Pignatelli et al. (2009) method (see Fig. 1(c) for location).
inland penetration limits ranging between a minimum valueof 81.23 m and a maximum value of 103.16 m with an aver-age value of 91.09 m. For the boulder B13 (Table 5), a HT
of 3.566 m has been estimated; consequently, the minimuminland penetration limit is about 82.72 m, the maximumis about 104.78 m, the average value 92.19 m. Averageinland penetration limit estimated for B4 and B13 appearto be in good agreement, suggesting that the two boulderscould have been transported during the same event. This isconfirmed by radiocarbon age determination performed byScicchitano et al. (2007) on these boulders, yielding an ageof 465 ± 37 age (BP) for boulder B4 and 465 ± 35 age (BP)for boulder B13 (not calibrated), that allowed to refer theiraccumulation to the December 28, 1908 tsunami.
As regards the inland penetration limits along the Mad-dalena peninsula, they have been reported in Fig. 9: it isworth to note the good correspondence between the limitscalculated for boulders B4 and B13 and the berm locatedin the peninsula, from buffer 1 to buffer 10. In buffer 11the two limits appear to stay closer to the coastline than theberm, but it must be considered that this buffer is not prop-erly orientated with respect to the shoreline. In buffers 12,13 and 14 the limit of B4 and B13 is located at a distance ofabout 20–30 m from the berm, since the slope is character-ized by two steps and it is not regular as in the other buffers.In general, we can affirm that the good agreement betweenthe limits calculated for B4 and B13 and the berm surveyedin the Maddalena peninsula suggests that the same event
(1908 tsunami) has been responsible for their deposition. Adifferent conclusion must be drawn for boulder B3; unfortu-nately it was not possible to estimate the age of the event re-sponsible for the deposition of this boulder, because it doesnot show marine encrustation useful to perform radiocarbonage determination. Two scenario can be considered: i) theboulder B3 has been deposited by an event occurred before1908; ii) the boulder has been deposited by the 1908 event.The first hypothesis seems more reliable considering that inthe area located between the berm and the B3 limit severalsmall boulder weighing up to 30 kg, totally encrusted ofmarine organisms, were found. This suggests that anothermore extreme event could have occurred before the depo-sition of the berm but we did not find indication about itsage. Another explanation for the different extension of theinland flooding calculated for B3 could be find in the localvariability of the morphological features of the Maddalenapeninsula coastline. Boulder B3 is placed in a sector of thepeninsula where the more articulated coastline and sea bot-tom could have caused a sensible increasing of the wave re-sponsible for its transport. Besides, it is really very difficultto imagine a regular coastline uniformly conditioning thewave progression, as indicate in recent papers (Mastronuzziet al., 2006; Goto et al., 2009a; Pignatelli et al., 2009) andunderlined by Imamura in Benner et al. (2010). Moreover,the non-correspondence of the assessed inundation limit tothe position of the berm could be explained considering thatthe micro-topography of the surf bench is not yet well rep-

G. SCICCHITANO et al.: TSUNAMI IMPACT, SOUTH-EASTERN SICILY, ITALY 901
resented by scheduled Manning’s number. The area of theboulder B3 has been considered uniform with respect to allthe remaining surface: in effect, it is locally characterisedby a “phantom” topography that cannot be recognised bythe human eyes but only by a digital survey. Most likely, thepresence of extended partially destroyed quarry and karsticpools should increase the real Manning’s number respect tothe weighed averaged used for buffer 2 up to the value 0.05.The need of surveys devoted to obtain the real value of thisparameter is evident as suggested by Pignatelli et al. (2010).
8. ConclusionsThe Maddalena peninsula preserves the evidence of the
recent impact of the disastrous tsunami occurred on De-cember 28, 1908. Its coastal area is characterised by thepresence of a boulder field with blocks weighting up to 50tons whose pre-transport scenario seems to have been the“joint bounded”. Generally, the boulders come from theadlittoral/infralittoral area and their deposit is associated tothose of stripping soil and of a gravel/sandy berm. A de-tailed TLS/DGPS surveys has been performed in order toobtain more detailed data that can describe, morphologi-cally and topographically, the three biggest boulders andthe berm shaped by the impact of the waves. New data indi-cate a general previous overestimation—up to the 50%—ofthe dimensions, volumes and weights of the surveyed boul-ders. Surveyed data have been computed in different stepsin order to verify the conclusions of previous works and toimprove the knowledge on the effect of the 1908 tsunami:
• the application of the most recent equations using thesize and weight parameters of three boulders for theevaluation of the possible tsunami height responsiblefor their deposition suggested that two boulders havebeen moved by waves characterized by the same heightwhile the third one seems to have been moved by abiggest wave;
• the digital analysis of the local emerged and sub-merged topography compared to the available recordedand statistical data concerning the local wave climateallowed us to exclude the deposition of the bouldersdue to the impact of normal storm generated waves;
• the use of the inundation formulas permitted to evalu-ate the minimum inland flooding of the events respon-sible for the boulders scattering, transport and deposi-tion: in general a good agreement has been recognisedsince the value are included in a range of ±10 m, thatis a reasonable value considering the variability of thetopography and, as consequence, the differential de-creasing of the inland running wave;
• the use of DGPS permitted to verify that these esti-mated values correspond to the measured position ofthe inland limit of the strip soil and of the pebble/sandyberm.
• The use of TLS and DGPS sensibly improved the ac-curacy of field measurements allowing a better estima-tion of the tsunami wave height and inland penetrationlimit.
In the case of the Maddalena peninsula, the results ob-tained elaborating the digitally surveyed data fit reasonably
well, confirming the conclusions of our previous work thatshowed the evidence of the impact of the December 28,1908 tsunami wave. However, some improvements are re-quired in order to obtain experimental “in situ” real Man-ning’s number that can optimise the application of the flood-ing assessment formulas.
Acknowledgments. This research has been financially supportedby INGV-DPC Project S1 2007/09 “Analysis of the seismic poten-tial in Italy for the evaluation of the seismic hazard” (Nat. Resp.:S. Barba, C. Doglioni; Unit 6.03 Resp.: G. Mastronuzzi), by Re-search Project of Bari University 2009 “Modellizzazione e val-utazione del rischio costiero da eventi parossistici” (Resp. Prof.G. Mastronuzzi) and by University of Catania funds (Resp. C.Monaco). Many thanks are due to C. Marziano for the importantsuggestions supported. We are grateful to the Marine ProtectedArea of Plemmirio for the aerial views they supplied us. The au-thors sincerely thank the two anonymous reviewers for helpful cor-rections and valuable comments on the manuscript.
ReferencesArcement, G. and V. Schneider, Guide for selecting Manning’s roughness
coefficients for natural channels and flood plains, U.S. Geol. Surv. WaterSupply Pap., 2339, 1989.
Argnani, A. and C. Bonazzi, Malta Escarpment fault zone offshore easternSicily: Pliocene-Quaternary tectonic evolution based on new multichan-nel seismic data, Tectonics, 24, TC 4009, doi:10.1029/2004TC001656,2005.
Asal, F. F. F., Airborne remote sensing for landscape modelling, PhDthesis, 317 pp., The University of Nottingham, UK, 2003.
Azzaro, R. and S. Barbano, Analysis of the seismicity of southeasternSicily: a proposed tectonic interpretation, Annali di Geofisica, 43, 171–188, 2000.
Baratta, M., La catastrofe sismica calabro-messinese (28 Dicembre 1908),Relazione alla Soc. Geogr. Ital., 1910.
Barbano, M. S., C. Pirrotta, and F. Gerardi, Large boulders along the south-eastern Ionian coast of Sicily: Storm or tsunami deposits?, Mar. Geol.,doi:10.1016/j.margeo.2010.05.005, 2010.
Barbano, S., The Val di Noto earthquake of January 11, 1693, in Atlas ofIsoseismal Maps of Italian Earthquake, edited by D. Postpischl, PGF-CNR, Quaderno Ricerche Scientifiche 114 (2A), 48–49, 1985.
Barbano, S. and M. Cosentino, Il terremoto siciliano dell’11 Gennaio 1693,Rend. Soc. Geol. Ital., 4(5), 517–522, 1981.
Benner, R., T. Browne, H. Bruckner, D. Kelletat, and A. Scheffers, Boul-der transport by waves: Progress in physical modelling, Zeitschrift furGeomorphologie, 54(3), 127–146, 2010.
Bianca, M., C. Monaco, L. Tortorici, and L. Cernobori, Quaternary normalfaulting in southeastern Sicily (Italy): A seismic source for the 1693large earthquake, Geophys. J. Int., 139, 370–394, 1999.
Boschi, E., G. Ferrari, P. Gasperini, E. Guidoboni, G. Smiraglio, and G.Valensise, Catalogo dei forti terremoti in Italia dal 461 a.c. al 1980,Istituto Nazionale di Geofisica, S.G.A., Roma, 1995.
Bourgeois, J. and B. MacInnes, Tsunami boulder transport and other dra-matic effects of the 15 November 2006 central Kuril Islands tsunami onthe island of Matua, Zeitschrift fuer Geomorphologie, 54(3), 175–195,2010.
Bryant, E. A., Tsunami, The Underrated Hazard, 320 pp., CambridgeUniversity Press, Cambridge, UK, 2001.
Carbone, S., M. Cosentino, M. Grasso, F. Lentini, G. Lombardo, and G.Patane, Elementi per una prima valutazione dei caratteri sismotettonicidell’Avampaese Ibleo (Sicilia sud-orientale), Mem. Soc. Geol. It., 24,507–520, 1982.
Chow, V. T., Open-Channel Hydraulics, McGraw-Hill, New York, 1973.De Martini, P. M., M. S. Barbano, A. Smedile, F. Gerardi, D. Pantosti, P.
Del Carlo, and C. Pirrotta, A unique 4000 year long geological record ofmultiple tsunami inundations in the Augusta Bay (eastern Sicily, Italy),Mar. Geol., 276(1–4), 42–57, 2010.
Galvin Jr., C. J., Wave breaking in shallow water, in Waves on Beachesand Resulting Sediment Transport, edited by R. E. Meyer, pp. 413–456,Academic Press, New York, 1972.
Ghisetti, F., Fault parameters in the Messina Strait (southern Italy) andrelations with the seismogenic source, Tectonophysics, 210, 117–133,1992.
902 G. SCICCHITANO et al.: TSUNAMI IMPACT, SOUTH-EASTERN SICILY, ITALY
Goff, J., R. Weiss, C. Courtney, and D. Dominey-Howes, Testing thehypothesis for tsunami boulder deposition from suspension, Mar. Geol.,277(1–4), 73–77, 2010.
Goto, K., S. A. Chavanich, F. Imamura, P. Kunthasap, T. Matsui, K. Mi-noura, D. Sugawara, and H. Yanagisawa, Distribution, origin and trans-port process of boulders deposited by the 2004 Indian Ocean tsunami atPakarang Cape, Thailand, Sediment. Geol., 202, 821–837, 2007.
Goto, K., K. Okada, and F. Imamura, Importance of the initial waveformand coastal profile for the tsunami transport of boulders, Polish J. Envi-ron. Stud., 18, 53–61, 2009a.
Goto, K., K. Okada, and F. Imamura, Characteristics and hydrodynamicsof boulders transported by storm wave at Kudaka Island, Japan, Mar.Geol., 262, 14–24, 2009b.
Goto, K., T. Kawana, and F. Imamura, Historical and geological evidenceof boulders deposited by tsunamis, southern Ryukyu Island, Japan,Earth-Sci. Rev., 102, 77–99, 2010a.
Goto, K., K. Miyagi, H. Kawamata, and F. Imamura, Discrimination ofboulders deposited by tsunamis and storm waves at Ishigaki Island,Japan, Mar. Geol., 269, 34–45, 2010b.
Grasso, M. and F. Lentini, Sedimentary and tectonic evolution of the east-ern Hyblean Plateau (southeast Sicily) during Late Cretaceous to Qua-ternary times, Palaeo. Palaeo. Palaeo., 39, 261–280, 1982.
Hall, A. M., J. D. Hansom, D. M. Williams, and J. Jarvis, Distribution,geomorphology and lithofacies of cliff-top storm deposits: Examplesfrom the high-energy coasts of Scotland and Ireland, Mar. Geol., 232,131–155, 2006.
Hall, A. M., J. D. Hansom, and J. Jarvis, Patterns and rates of erosionproduced by high energy wave processes on hard rock headlands: TheGrind of the Navir, Shetland, Scotland, Mar. Geol., 248(1–2), 28–46,2008.
Hansom, J. D., N. D. P. Barltrop, and A. M. Hall, Modelling the processesof cliff-top erosion and deposition under extreme storm waves, Mar.Geol., 253, 36–50, 2008.
Hills, J. G. and C. L. Mader, Tsunami produced by the impacts of the smallasteroids, Ann. N. Y. Accad. Sci., 822, 381–394, 1997.
Hirn, A., R. Nicolich, J. Gallart, M. Laigle, L. Cernobori, and ETNASEISScientific Group, Roots of Etna volcano in faults of great earthquakes,Earth Planet. Sci. Lett., 148, 171–191, 1997.
Imamura, F., K. Goto, and S. Ohkubo, A numerical model for thetransport of a boulder by tsunami, J. Geophys. Res., 113, CO1008,doi:10.1029/2007JC004170, 2008.
Inghilesi, R., S. Corsini, F. Guiducci, and A. Arseni, Statistical analysisof extreme waves on the Italian coasts from 1989 to 1999, Boll. Geofis.Teor. Appl., 41(3–4), 315–337, 2000.
Jacques, E., C. Monaco, P. Tapponnier, L. Tortorici, and T. Winter, Faultingand earthquake triggering during the 1783 Calabria seismic sequence,Geophys. J. Int., 147, 499–516, 2001.
Kelletat, D., Comments to Dawson, A. G. and Stewart, I. (2007)—Tsunamideposits in the geological record, Sediment. Geol., 211, 87–91, 2008.
Kelletat, D., S. Scheffers, and A. Scheffers, Learning from the SE-Asiantsunami: Examples from Thailand’s west coast, Geograph. RundschauInt., 1, 4–9, Braunschweig, 2006.
Kelletat, D., A. Scheffers, and S. Scheffers, Field signatures of the SE-336 Asian mega-tsunami along the west coast of Thailand compared toHolocene paleo-tsunami from the Atlantic region, Pure Appl. Geophys.,164(2/3), 413–431, 2007.
Keulegan, G. H. and G. W. Patterson, Mathematical theory of irrotationaltranslation waves, J. Res. Natl. Bur. Stand., 24, 47–101, 1940.
Lavigne, F., R. Paris, P. Wassmer, C. Gomez, D. Brunstein, D. Grancher,F. Vautier, J. Sartohadi, A. Setiawan, T. G. Syahnan, B. W. Fachrizal,D. Mardiatno, A. Widagdo, R. Cahyadi, N. Lespinasse, and L. Mahieu,Learning from a Major Disaster (Banda Aceh, December 26th, 2009):A Methodology to Calibrate Simulation Codes for Tsunami InundationModels, Zeitschrift fur Geomorphologie N.F., Suppl.-Bd., 146, 253–265,2006.
Leica Geosystems, HDS Scanning and Cyclone Training Manual, 540 pp.,Leica Geosystems HDS San Ramon California, 2004.
Lombardo, G., The Catania earthquake of February 4, 1169, in Atlas ofIsoseismal Maps of Italian Earthquake, edited by D. Postpischl, PGF-CNR, Quaderno Ricerche Scientifiche 114 (2A), 12–13, 1985.
Maouche, S., C. Morhange, and M. Meghraoui, Large boulder accumu-lation on the Algerian coast evidence tsunami events in the westernMediterranean, Mar. Geol., 262, 96–104, 2009.
Marsico, A., C. Pignatelli, A. Piscitelli, G. Mastronuzzi, and L. Pennetta,Ricostruzione Differential e di blocchi accumulati da eventi estremi inItalia meridionale, Atti 13a Conferenza Nazionale ASITA, 1–4 dicembre
2009, 1377–1385, 2009.Marziano, C., Rinvenimenti Paleontologici nell’area del Plemmirio e delle
Saline di Siracusa, Atti e Memorie dell’Ente Fauna Siciliana, Vol. IX,2004.
Massel, S. R., Prediction of the largest surface wave height in water ofconstant depth, in Recent Advances in Marine Science and Technology96, edited by N. Saxena, pp. 141–151, PACON International, Honolulu,USA, 1997.
Mastronuzzi, G., Tsunami in Mediterranean sea, The Egyptian J. Environ.Change, 2(1), 1–9, 2010.
Mastronuzzi, G. and P. Sanso, Boulders transport by catastrophic wavesalong the Ionian coast of Apulia (Southern Italy), Mar. Geol., 170, 93–103, 2000.
Mastronuzzi, G. and P. Sanso, Large boulder accumulations by extremewaves along the Adriatic coast of southern Apulia (Italy), Quatern. Int.,120, 173–184, 2004.
Mastronuzzi, G., C. Pignatelli, and P. Sanso, Boulder fields: A valu-able morphological indicator of paleotsunami in the mediterranean sea,Zeitschrift fur Geomorphologie, NF Suppl.-Bd., 146, 173–194, 2006.
Mastronuzzi, G., C. Pignatelli, P. Sanso, and G. Selleri, Boulder accumu-lations produced by the 20th February 1743 tsunami along the coast ofsoutheastern Salento (Apulia region, Italy), Mar. Geol., 242(1), 191–205, 2007.
Monaco, C. and L. Tortorici, Active faulting in the Calabrian arc andeastern Sicily, J. Geodyn., 29, 407–424, 2000.
Noormets, R., E. A. Felton, and K. A. W. Crook, Sedimentology ofrocky shorelines: 2. Shoreline megaclasts on the north shore of Oahu,Hawaii—origins and history, Sediment. Geol., 150, 31–45, 2002.
Noormets, R., K. A. W. Crook, and E. A. Felton, Sedimentology of rockyshorelines: 3. Hydrodynamics of megaclast emplacement and transporton a shore platform, Oahu, Hawaii, Sediment. Geol., 172, 41–65, 2004.
Nott, J., Extremely high-energy wave deposits inside the Great Barrierreef, Australia: Determining the cause—tsunami or tropical cyclone,Mar. Geol., 141, 193–207, 1997.
Nott, J., Waves, coastal boulders and the importance of the pre-transportsetting, Earth Planet. Sci. Lett., 210, 269–276, 2003.
Paris, R., F. Lavigne, P. Wassmer, and J. Sartohadi, Coastal sedimentationassociated with the December 26, 2004 in Lhok Nga, west Banda Aceh(Sumatra, Indonesia), Mar. Geol., 238, 93–106, 2007.
Paris, R., P. Wassmer, J. Sartohadi, F. Lavigne, B. Barthomeuf, E. Des-gages, D. Grancher, P. Baumert, F. Vaultier, D. Brunstein, and C.Gomez, Tsunamis as geomorphic crisis: lessons from the December 26,2004 tsunami in Lhok Nga, west Banda Aceh (Sumatra, Indonesia), Ge-omorphology, 104(1–2), 59–72, 2009.
Paris, R., J. Fournier, E. Poizot, S. Etienne, J. Morin, F. Lavigne, and P.Wassmer, Boulder and fine sediment transport and deposition by the2004 tsunami in Lhok Nga (western Banda Aceh, Sumatra, Indonesia):A coupled offshore–onshore model, Mar. Geol., 268(1–4), 43–54, 2010.
Piatanesi, A. and S. Tinti, A revision of the eastern Sicily earthquake andtsunami, J. Geophys. Res., 103, 2749–2758, 1998.
Pignatelli, C., P. Sanso, and G. Mastronuzzi, Evaluation of tsunami flood-ing using geomorphologic evidence, Mar. Geol., 260(1), 6–18, 2009.
Pignatelli, C., A. Piscitelli, B. Damato, and G. Mastronuzzi, Estimationof the value of Manning’s coefficient using Terrestrial Laser Scannertechniques for the assessment of extreme waves flooding, Zeitschrift furGeomorphologie, 54(3), 317–336, 2010.
Postpischl, D., Catalogo dei terremoti italiani dall’anno 1000 al 1980,CNR, P.F. Geodinamica, Graficoop, Bologna, 239 pp., 1985.
Regnauld, H., J. Oszwald, O. Planchon, C. Pignatelli, A. Piscitelli, G. Mas-tronuzzi, and A. Audevard, Polygenetic (tsunami and storm) deposits?A case study from Ushant Island, western France, Zeitschrift fur Geo-morphologie NF., 54, Suppl. 3, 197–217, 2010.
Richmond, B. M., B. E. Jaffe, G. Gelfenbaum, and R. A. Morton, Geologicimpacts of the 2004 Indian Ocean Tsunami on Indonesia, Sri Lanka, andthe Maldives, Zeitschrift fur Geomorphologie N.F. Suppl., 146, 235–251, 2006.
Rundgren, L., Water wave forces, Royal Institute of Technology, Divisionof Hydraulics, Stockholm, Sweden, n. 54, 1958.
Sartori, R., M. L. Colalongo, G. Gabbianelli, C. Bonazzi, S. Carbone, P. V.Curzi, D. Evangelisti, M. Grasso, F. Lentini, S. Rossi, and L. Selli, Notestratigrafiche e tettoniche sul rise di Messina (Ionio nord-occidentale),Giornale di Geologia, 53, 49–64, 1991.
Scandone, P., E. Patacca, R. Radoicic, W. B. F. Ryan, M. B. Cita, M.Rawson, H. Chezar, E. Miller, J. Mckenzie, and S. Rossi, Mesozoicand Cenozoic rocks from Malta Escarpment (Central Mediterranean),A.A.P.G. Bull., 65, 1299–1319, 1981.

G. SCICCHITANO et al.: TSUNAMI IMPACT, SOUTH-EASTERN SICILY, ITALY 903
Scheffers, A., Paleotsunami Evidences of tsunami from Boulder depositson Aruba, Curacao, and Bonaire, Sci. Tsunami Haz., 20(1), 26–37, 2002.
Scheffers, A., Tsunami imprints on the Leeward Netherlands Antilles(Aruba, Curacao and Bonaire) and their relation to other coastal prob-lems, Quatern. Int., 120(1), 163–172, 2004.
Scheffers, A., Sedimentary impacts of Holocene tsunami events from theintra Americas seas and southern Europe—A review, ZGeomorph N.F.,Suppl. Bd., 146, 7–37, 2006.
Scheffers, A., Tsunami Boulder Deposits, in Tsunamiites, edited by T.Shiki, Y. Tsuji, T. Yamazaki, and K. Minoura, Feature and Implications,299–318, Elsevier, 2008.
Scheffers, A. and S. Scheffers, Documentation of the impact of hurricaneIvan on the coastline of Bonaire (Netherlands Antilles), J. Coast. Res.,22(6), 1437–1450, 2006.
Scheffers, A. and D. Kelletat, Tsunami relics in the coastal landscape westof Lisbon, Portugal, Sci. Tsunami Haz., 23(1), 3–16, 2005.
Scicchitano, G., C. Monaco, and L. Tortorici, Large boulder deposits bytsunamis along the Ionian coast of south-eastern Sicily (Italy), Mar.Geol., 238, 75–91, 2007.
Scicchitano, G., F. Antonioli, E. F. Castagnino Berlinghieri, A. Dutton,and C. Monaco, Submerged archaeological sites along the Ionian coastof south-eastern Sicily (Italy) and implications with the relative sea levelchange during the late Holocene, Quatern. Res., 70, 26–39, 2008.
Scicchitano, G., B. Costa, A. Di Stefano, S. G. Longhitano, and C.Monaco, Tsunami and storm deposits preserved within a ria-type rockycoastal setting (Siracusa, SE Sicily), Zeitschrift fur Geomorphologie,54, Suppl. 3, 51–77, 2010.
Slob, S. and R. Hack, 3D terrestrial laser scanning as a new field mea-surement and monitoring technique, in Engineering Geology for In-frastructure Planning in Europe: A European Perspective, edited byR. Hack, R. Azzam, and R. Charlier, Lecture Notes in Earth Sci-ences, Vol. 104, publ. Springer-Verlag Heidelberg, ISBN: 3-540-21075-X, doi:10.1007/b93922, pp. 800, 2004.
Smedile, A., P. M. De Martini, D. Pantosti, L. Bellucci, P. Del Carlo,L. Gasperini, C. Pirrotta, A. Polonia, and E. Boschi, Possible tsunami
signatures from an integrated study in the Augusta Bay offshore, Mar.Geol., 281(2011), 1–13, 2011.
Srinivasalu, S., N. Thangadurai, A. D. Switzer, V. Ram Mohan, and T.Ayyamperumal, Erosion and sedimentation in Kalpakkam (N TamilNadu, India) from the 26th December 2004 Tsunami, Mar. Geol.,240(1–4), 65–75, 2007.
Sunamura, T. and K. Horikawa, Two dimensional beach transformationdue to waves, Proceedings 14th Coastal Engineering Conference, Amer-ican Society of Civilian Engineerings, 920–938, 1974.
Szczuciski, W., P. Niedzielski, G. Rachlewicz, T. Sobczyski, A. Ziola, A.Kowalski, S. Lorenc, and J. Siepak, Contamination of tsunami sedi-ments in a coastal zone inundated by the 26 December 2004 tsunami inThailand, Environ. Geol., 49(2), (month and year of the edition), 321–331, 2005.
Tinti, S. and A. Armigliato, The use of scenarios to evaluate the tsunamiimpact in southern Italy, Mar. Geol., 199, 221–243, 2003.
Tinti, S., A. Maramai, and L. Graziani, The new catalogue of Italiantsunamis, Nat. Haz., 33, 439–465, 2004.
Tinti, S., A. Maramai, and L. Graziani, The Italian Tsunami Cata-logue (ITC), Version available on-line at http://www.ingv.it/servizi-e-risorse/BD/catalogo-tsunami/catalogo-degli-tsunami-italiani, 2007.
Umitsu, M., C. Tanavud, and B. Patanakanog, Effects of landforms ontsunami flow in the plains of Banda Aceh, Indonesia, and Nam Khem,Thailand, Mar. Geol., 242(1–3), 141–153, 2007.
Valensise, G. and D. Pantosti, A 125 Kyr long geological record of seismicsource repeatability: the Messina Straits (southern Italy) and the 1908earthquake (Ms 71/2), Terra Nova, 4, 472–483, 1992.
Williams, D. M. and A. M. Hall, Cliff-top megaclast deposits of Ireland,a record of extreme waves in the North Atlantic-storms or tsunamis?,Mar. Geol., 206, 101–117, 2004.
G. Scicchitano (e-mail: [email protected]), C. Pignatelli,C. R. Spampinato, A. Piscitelli, M. Milella, C. Monaco, and G.Mastronuzzi