water resources data for massachusetts and rhode island, 2000
TRANSCRIPT

Water Resources Data for
Massachusetts and Rhode Island, 2000
By R.S. Socolow, J.S. Whitley, Domenic Murino, Jr., and L.R. Ramsbey
INTRODUCTION
The Water Resources Division of the U.S. GeologicalSurvey, in cooperation with State agencies, obtains a largeamount of data pertaining to the water resources of Massachu-setts and Rhode Island each water year. These data, accumu-lated during many water years, constitute a valuable data basefor developing an improved understanding of the waterresources of the States. To make these data readily available tointerested parties outside the Geological Survey, the data arepublished annually in this report series entitled “WaterResources Data-Massachusetts and Rhode Island.”
Hydrologic data are also available through the Massachu-setts–Rhode Island District Home Page on the world-wideweb (http://ma.water.usgs.gov). Historical data and real-timedata (for sites equipped with satellite gage-height telemeter)are also available. The home page also contains a link to theU.S. Geological Survey National Home Page where stream-flow data from locations throughout the United States can beretrieved.
This report series includes records of stage, discharge,and water quality of streams; contents of lakes and reservoirs;and water levels of ground-water wells. This volume containsdischarge records for 95 gaging stations; stage records for 2gaging stations; month-end contents of four lakes and reser-voirs; water quality for 41 gaging stations; and water levels for139 observation wells. Locations of these sites are shown infigures 1 and 2. Short-term water-quality data were collectedat 21 gaging stations and are shown in figure 3. Hydrologicdata were collected at many sites that were not involved in thesystematic data-collection program and are published as mis-cellaneous discharge measurements and miscellaneoussurface-water-quality data. The data in this report representthat part of the National Water Data System operated by theU.S. Geological Survey and cooperating State and Federalagencies in Massachusetts and Rhode Island.
This series of annual reports for Massachusetts andRhode Island began with the 1961 water year with a report thatcontained only data relating to the quantities of surface water.For the 1964 water year, a similar report was introduced thatcontained only data relating to water quality. Beginning with
the 1975 water year, the report format was changed to present,in one volume, data on quantities of surface water, quality ofsurface and ground water, and ground-water levels.
Prior to introduction of this series and for several wateryears concurrent with it, water-resources data for Massachu-setts and Rhode Island were published in U.S. GeologicalSurvey Water-Supply Papers. Data on stream discharge andstage and on lake or reservoir contents and stage, throughSeptember 1960, were published annually under the title“Surface-Water Supply of the United States, Parts 1A and 1B.”For the 1961 through 1970 water years, the data were pub-lished in two 5-year reports. Data on chemical quality, temper-ature, and suspended sediment for the 1941 through 1970water years were published annually under the title “Qualityof Surface Waters of the United States,” and water levels forthe 1939 through 1974 water years were published under thetitle “Ground-Water Levels in the United States.” The abovementioned Water-Supply Papers may be consulted in thelibraries of the principal cities of the United States and may bepurchased from U.S. Geological Survey, InformationServices, Box 25286, Denver Federal Center, Box 25425,Denver, CO 80225-0286.
Publications similar to this report are published annuallyby the Geological Survey for all States. These officialSurvey reports have an identification number consisting of thetwo-letter State abbreviation, the last two digits of the wateryear, and the volume number. For example, this volume isidentified as “U.S. Geological Survey Water-Data Report MA-RI-00-1.” For archiving and general distribution, the reportsfor 1971–74 water years also are identified as water-datareports. These water-data reports are for sale in paper copy orin microfiche by the National Technical Information Service,U.S. Department of Commerce, Springfield, VA 22161. Addi-tional information, including current prices, for ordering spe-cific reports may be obtained from the District Office at theaddress given on the back of the title page or by telephone(508) 490-5000.
COOPERATION
The U.S. Geological Survey and agencies of the States ofMassachusetts and Rhode Island have had cooperative agree-ments for the collection of streamflow records since 1909 and

2
CA
PE
CO
D
BA
Y
ATLANTIC O
CEAN
RHO
DE
ISLA
ND
SOU
ND
NA
NTU
CK
ET
SOU
ND
MA
SSA
CH
USE
TT
S
RH
OD
E
ISL
AN
D
42˚0
0'
41˚3
0'
70˚0
0'
73˚3
0'73
˚00'
72˚3
0'72
˚00'
71˚3
0'
71˚0
0'70
˚30'
42˚3
0'
1044
80
010
2030
4050
KIL
OM
ET
ER
S
010
2030
4050
MIL
ES
WA
TE
R-D
ISC
HA
RG
E S
TAT
ION
WA
TE
R-D
ISC
HA
RG
E S
TAT
ION
WIT
H S
AT
EL
LIT
E
TE
LE
ME
TE
R A
ND
DA
TA O
N T
HE
WE
B P
AG
EST
RE
AM
STA
GE
ON
LYW
AT
ER
-QU
AL
ITY
STA
TIO
NC
HE
MIC
AL
-ME
ASU
RE
ME
NT
SIT
ET
EM
PER
AT
UR
E-M
EA
SUR
EM
EN
T S
ITE
MIC
RO
BIO
LO
GIC
AL
-ME
ASU
RE
ME
NT
SIT
ESE
DIM
EN
T-M
EA
SUR
EM
EN
T S
ITE
PRE
CIP
ITA
TIO
N
EX
PL
AN
AT
ION
STA
TIO
N N
UM
BE
RS
AR
E I
N A
BB
RE
VIA
TE
D F
OR
M:
TH
E F
IRST
TW
O D
IGIT
S A
RE
OM
ITT
ED
, FO
R E
XA
MPL
EST
AT
ION
NU
MB
ER
011
7600
0 IS
SH
OW
N A
BO
VE
AS
1760
00
1055
8510
5584
1
3325
0033
3000
3315
00
1970
00
1855
00
1975
00
1835
00
1810
00
1795
0017
5670
1760
0017
7000
1745
65
1755
00
1730
0017
4500
1735
00
1725
00
1720
03
1701
00
1705
00
1715
00
1685
0016
9000
1665
00
1699
0017
0000
1632
00
1625
0016
2000
1170
0011
7800
1174
6811
7350
1173
70
1174
20
1185
00
1175
00
1180
00
1166
1711
6500
1090
6011
4500
1150
9811
4000
1160
00
1112
30
1115
0011
2900
1125
00
1113
00 1151
871100
00
1090
7010
9403
1105
00
1090
00
1058
837
1080
00
1059
331057
30 1058
70
1056
00
1055
85
1055
8410
5584
1
1020
308
1020
29
1055
0010
5000
1055
566
1045
0010
4430
1046
15
1032
80
1040
001042
00
1035
00
1025
0010
2345
1010
00
1006
0010
1500
1020
0010
0000
1005
68
0985
300995
0009
6000
0970
00
0973
00
0965
00
0944
00
0945
00
0952
2009
5375
1136
95
1174
10
1173
545
WATER RESOURCES DATA FOR MASSACHUSETTS AND RHODE ISLAND, 2000
Fig
ure
1.
Loca
tion
of g
agin
g st
atio
ns.

3
CA
PE
CO
D
BA
Y
ATLANTIC O
CEAN
RHO
DE
ISLA
ND
SOU
ND
NA
NTU
CK
ET
SOU
ND
SU
FF
OLK
BE
RK
SH
IRE
HA
MP
SH
IREFR
AN
KLI
N
MID
DLE
SE
X
WO
RC
ES
TE
RN
OR
FO
LK
ES
SE
X
PR
OV
IDE
NC
E
BR
ISTO
L
PLY
MO
UT
H
KE
NT
WA
SH
ING
TON
DU
KEBA
RN
STA
BLE
NA
NT
UC
KE
T
HA
MP
DE
N
SU
FF
OLK
NF
42˚0
0'
41˚3
0'
70˚0
0'
73˚3
0'73
˚00'
72˚3
0'72
˚00'
71˚3
0'
71˚0
0'70
˚30'
42˚3
0'
010
2030
4050
KIL
OM
ET
ER
S
010
2030
4050
MIL
ES
EX
PL
AN
AT
ION
OB
SE
RV
AT
ION
WE
LL
AN
D L
OC
AL
WE
LL
NU
MB
ER
OB
SE
RV
AT
ION
WE
LL
WIT
H R
EC
OR
DE
R A
ND
LO
CA
L W
EL
L N
UM
BE
R
GM
W 2
PT
W 5
1
LTW
142
AC
W 1
58
AJW
462
AT
W 8
3
A1W
230
A1W
247
A3W
12
BC
W 3
63
BE
W 9
BH
W 1
98
BK
W 8
7
BM
W 2
1
BM
W 2
2
CG
W 1
38
CH
W 3
84C
JW 2
CM
W 9
5
CS
W 8
CT
W 1
65C
TW
167
CY
W 1
3
DD
W 2
31
DF
W 4
4
DV
W 1
0
D4W
79
D4W
80
EB
W 3
0
EN
W 5
2
FX
W 3
F3W
23
GC
W 1
68
GK
W 6
8
GLW
5
GLW
6
GM
W 2
HG
W 7
6
HH
W 1
HH
W 3
1
HLW
23
HM
W 8
HR
W 1
69
LKW
14
LTW
104
MIW
29
MT
W 8
2
M7W
19
NB
W 2
28
NG
W 1
16
NIW
27
NN
W 2
7N
XW
54
N4W
37
OR
W 6
3
OT
W 7
PD
W 2
3
PD
W 2
4
PH
W 1
6P
TW
51
PW
W 2
2P
WW
494
PY
W 6
4
SD
W 2
52
SD
W 2
53
SH
W 2
75
SJW
58
SS
W 1
2
SV
W 9
5
SY
W 1
SY
W 1
77S
6W 7
S6W
68
TA
W 3
37
TM
W 3
TQ
W 1
TR
W 1
3
TS
W 1
TS
W 8
9
WA
W 3
8
WE
W 4
3
WF
W 5
1
WK
W 2
WLW
1
WN
W 1
7
WP
W 7
6
WS
W 2
6 WS
W 2
7
WS
W 2
8
WU
W 2
WU
W 1
0
WX
W 2
0
WV
W 6
2
WV
W 1
52X
GW
2
XG
W 3
XG
W 4
XJW
55
XM
W 7
8
XN
W 1
3
XO
W 1
4
XS
W 2
74
BU
W 1
87
BU
W 3
95
BU
W 3
96
BU
W 3
97B
UW
398
CH
W 1
8
CH
W 5
86C
HW
587
CO
W 3
42C
OW
411
CO
W 4
66
CR
W 4
39
CU
W 2
65
EX
W 6
EX
W 1
58E
XW
238
EX
W 2
78E
XW
475
EX
W 5
54
FO
W 4
0FO
W 2
90
HO
W 6
7
LIW
84
LTW
142
NH
W 2
58NK
W 2
55
NS
W 2
1 PA
W 1
36
PO
W 5
51
PR
W 4
8
RIW
417
RIW
600
RIW
785
SN
W 6 SN
W 5
15
TIW
274
WC
W 5
9
WE
W 5
22
WG
W 1
81W
GW
206
MA
SSA
CH
USE
TT
S
RH
OD
E I
SLA
ND
WATER RESOURCES DATA FOR MASSACHUSETTS AND RHODE ISLAND, 2000
Fig
ure
2.
Loca
tion
of o
bser
vatio
n w
ells
.

4
05
10 M
ILE
S
10 K
ILO
ME
TE
RS
05
72o 0'
71o 30
'71
o 0'70
o 30'
42o 30
'
42o 0'
NE
W H
AM
PSH
IRE
MA
SSA
CH
USE
TT
S
RH
OD
E I
SLA
ND
MA
SSA
CH
USE
TT
S
CONNECTICUT
1.
010
9654
4 07
1240
8 42
3704
2.
010
9671
0 07
1374
8 42
1946
3.
010
9694
5 07
1290
7 42
2536
4.
010
9727
0 07
1263
4 42
2734
5.
010
9747
6 07
1274
8 42
1545
6.
011
0320
58
0712
710
4207
11
7
. 0
1105
500
0710
847
4209
16
8
. 0
1105
581
0705
956
4213
12
9
. 0
1106
468
0705
821
4202
01
10
. 0
1109
595
0714
928
4214
19
11
. 0
1110
000
0714
241
4213
49
12
. 0
1112
262
0713
056
4202
27
13
. 0
1115
098
0713
624
4151
0914
. 0
1115
110
0713
644
4150
48
15
. 0
1115
170
0713
506
4150
27
16
. 0
1115
183
0713
507
4147
51
17
. 0
1115
187
0714
220
4149
07
18
. 0
1115
190
0714
203
4149
20
19
. 0
1115
265
0714
157
4147
26
20
. 0
1115
275
0714
031
4146
57
21
. 0
1115
280
0713
901
4148
14
22
. 0
1115
297
0713
810
4145
5323
. 0
1102
460
0710
746
4229
29
24
. 0
1102
474
0710
732
4228
10
25
. 0
1103
015
0710
859
4225
20
26
. 0
1103
017
0710
836
4225
14
27
. 0
1103
025
0710
804
4224
25
28
. 0
1105
642
0705
136
4214
36
29
. 0
1105
600
0705
643
4211
25
30
. 0
1105
612
0705
525
4212
56
31
. 0
1105
583
0705
843
4213
15
32
. 0
1105
585
0705
952
4214
52
33
. 0
1095
220
0714
730
4224
39
34
. 0
1100
000
0711
756
4238
45
35
. 0
1101
500
0710
139
4234
10
36
. 0
1102
345
0710
028
4228
10
37
. 0
1102
500
0710
822
4226
50
38
. 0
1105
000
0711
205
4210
39
39
. 0
1109
000
0711
038
4156
51
40
. 0
1112
900
0712
814
4158
16
41.
011
1550
007
1330
141
4358
Map
No.
Sta
tion
No.
Long
itude
Lat
itude
WA
TE
R-D
ISC
HA
RG
E S
TAT
ION
WA
TE
R-D
ISC
HA
RG
E S
TAT
ION
WIT
H S
AT
EL
LIT
E
TE
LE
ME
TE
R A
ND
DA
TA O
N T
HE
WE
B P
AG
E
WA
TE
R-Q
UA
LIT
Y S
TAT
ION
CH
EM
ICA
L-M
EA
SUR
EM
EN
T S
ITE
TE
MPE
RA
TU
RE
-ME
ASU
RE
ME
NT
SIT
E
MIC
RO
BIO
LO
GIC
AL
-ME
ASU
RE
ME
NT
SIT
E
SED
IME
NT-
ME
ASU
RE
ME
NT
SIT
E
PRE
CIP
ITA
TIO
N
EX
PL
AN
AT
ION
NE
W T
EM
POR
AR
Y S
ITE
S A
DD
ED
IN
200
0 W
AT
ER
YE
AR
WATER RESOURCES DATA FOR MASSACHUSETTS AND RHODE ISLAND, 2000
Fig
ure
3.
Loca
tion
of s
tort
-ter
m w
ater
-qua
lity
sam
plin
g si
tes.

5
WATER RESOURCES DATA FOR MASSACHUSETTS AND RHODE ISLAND, 2000
1941, respectively, and for water-quality records since 1954.Organizations that assisted in collecting the data in this reportthrough cooperative agreement with the Survey are:
Massachusetts:
Department of Environmental Management, P. Webber, CommissionerDivision of Resource Conservation,
Michael Gildesgame, Director; Department of Environmental Protection,
L.A. Liss, CommissionerOffice of Watershed Management,
Glenn Haas, DirectorMetropolitan District Commission,
D.B. Balfour, Jr., CommissionerDivision of Watershed Management,
J.M. McGinn, DirectorDivision of Parks, Engineering, and Construction,
F.D. Faucher, DirectorTown of Dartmouth,
Manuel Branco, Water SuperintendentTown of Franklin
Ronald Massey, Director, Department of Public WorksTown of Rockport
J.M. Tomasz, Director, Department of Public WorksRhode Island:
State Water Resources Board,D.W. Varin, Chairman
Department of Environmental Management,J.H. Reitsma, Director,E.S. Szymanski, Associate Director
Providence Water Supply Board, R.O. Rafanovic, General Manager and Chief EngineerA. Parillo, Chairman
Assistance in the form of funds or services was given bythe Corps of Engineers, U.S. Army, in collecting records forthree gaging stations published in the report. Assistance in theform of services was given by the Cape Cod Commission,Barnstable County, Nantucket Land Council, NantucketCounty, and Cooperative Extension, Martha’s Vineyard,Dukes County, Massachusetts, in measuring observationwells on Cape Cod, Nantucket Island, and Martha’s VineyardIsland, Massachusetts.
SUMMARY OF HYDROLOGIC CONDITIONS
Streamflow
Runoff for the 2000 water year was generally normal(between the lowest 25 percent of record and highest 25 per-cent of record) at stations in Massachusetts and Rhode Island.Annual peak flows occurred during the period April 22–26 atmost sites in central and eastern Massachusetts and all ofRhode Island. In southwestern Massachusetts annual peakflows occurred June 7–9. In northwestern Massachusettsannual peak flows occurred June 26 and July 16. No new peakflows for period-of-station records were recorded at any sta-tions with five or more years of record. Monthly and yearlydischarges for the 2000 water year and median monthly andyearly discharges for the reference period 1961–90 for threeindex gaging stations are compared in figure 4. Maps showing
monthly surface-water conditions during the 2000 water yearin Massachusetts and Rhode Island are shown in figure 5.The maps show areas of normal, above-normal (within thehighest 25 percent of record), or below-normal (withinthe lowest 25 percent of record) runoff for each month andare based on records for many of the streamflow-gagingstations contained in this report. Additional statistics for eachgaging station are provided with the tables of daily mean dis-charge. Hydrographs plotted at the end of each streamflowdischarge table contained in this report provide additionalinformation on runoff trends. Streamflow data are also avail-able on the Massachusetts–Rhode Island web pages at:http://ma.water.usgs.gov.
Reservoir Storage
Month-end storage of Quabbin Reservoir in centralMassachusetts ranged from 86 percent of usable capacity atthe end of December and January to 97 percent of usablecapacity at the end of June. Storage values were provided bythe Metropolitan District Commission, Division of WatershedManagement. The month-end storage of Scituate Reservoir incentral Rhode Island ranged from 76 percent of usable capac-ity at the end of October to 103 percent of usable capacity atthe end of April and May. Storage values were provided bythe Providence Water Supply Board.
Water Quality
Selected water-quality characteristics—specific conduc-tance and water temperature—were recorded at 6 surface-water sites in Massachusetts and 11 surface-water sites inRhode Island. In Massachusetts three sites were in operationprior to the 2000 water year (Stillwater River, QuinapoxetRiver, and Hobbs Brook) and three sites were started in the2000 water year (Aberjona River at Winchester, CharlesRiver above Watertown Dam at Watertown, and Stony BrookReservoir at Stony Brook Dam near Waltham, MA). In RhodeIsland 1 site was in operation prior to the 2000 water year(Wood River at Hope Valley) and 10 sites were started in the2000 water year (see table of contents, Surface-Water andWater-Quality Stations, Pawtuxet River Basin, ScituateReservoir). A new maximum specific conductance value wasrecorded at Hobbs Brook below Cambridge Reservoir nearKendall Green, MA (963 µs/cm, July 17). New maximum andminimum water temperature values were recorded at HobbsBrook (25.2˚C on Aug. 11, 0.5˚C on Jan. 14). All readings ofspecific conductance and water temperature at the continuousrecording monitoring stations on the Stillwater River nearSterling, MA, Quinapoxet River at Canada Mills nearHolden, MA, and Wood River at Hope Valley, R.I., werewithin the previous extreme values for the period of dailyrecord.

6
Figure 4.
Comparison of discharge at three long-term index stationsduring the 2000 water year with median discharge for 1961–90.
WATER RESOURCES DATA FOR MASSACHUSETTS AND RHODE ISLAND, 2000
0
700
0
100
200
300
400
500
600
DIS
CH
AR
GE
, IN
CU
BIC
FE
ET
PE
R S
EC
ON
D
EXPLANATION
Median of monthly and yearly discharge for period 1961–90.
Monthly and yearly mean discharge for 2000 water year.
Ware River at Intake Works near Barre, Mass.; Drainage area = 96.3 mi
2
0
800
0
100
200
300
400
500
600
700
0
700
0
100
200
300
400
500
600
West Branch Westfield River at Huntington, Mass.; Drainage area = 94.0 mi
2
Pawcatuck River at Wood River Junction, R.I.; Drainage area = 100 mi
2
01117500
01173000
01181000
OCT NOV DEC JAN FEB MAR APR MAY JUNE JULY AUG SEPT WTR YR

7
October 1999 April 2000
May 2000
June 2000
July 2000
August 2000
September 2000
November 1999
December 1999
January 2000
February 2000
March 2000
BERKSHIREHAMPSHIRE
FRANKLIN
MIDDLESEX
WORCESTERNORFOLK
ESSEX
PROVIDENCE
BRISTOL
PLYMOUTH
KENT
WASHINGTONDUKES
BARNSTABLE
NANTUCKET
HAMPDEN
SUFFOLK
BERKSHIREHAMPSHIRE
FRANKLIN
MIDDLESEX
WORCESTERNORFOLK
ESSEX
PROVIDENCE
BRISTOL
PLYMOUTH
KENT
WASHINGTONDUKES
BARNSTABLE
NANTUCKET
HAMPDEN
SUFFOLK
BERKSHIREHAMPSHIRE
FRANKLIN
MIDDLESEX
WORCESTERNORFOLK
ESSEX
PROVIDENCE
BRISTOL
PLYMOUTH
KENT
WASHINGTONDUKES
BARNSTABLE
NANTUCKET
HAMPDEN
SUFFOLK
BERKSHIREHAMPSHIRE
FRANKLIN
MIDDLESEX
WORCESTERNORFOLK
ESSEX
PROVIDENCE
BRISTOL
PLYMOUTH
KENT
WASHINGTONDUKES
BARNSTABLE
NANTUCKET
HAMPDEN
SUFFOLK
BERKSHIREHAMPSHIRE
FRANKLIN
MIDDLESEX
WORCESTERNORFOLK
ESSEX
PROVIDENCE
BRISTOL
PLYMOUTH
KENT
WASHINGTONDUKES
BARNSTABLE
NANTUCKET
HAMPDEN
SUFFOLK
BERKSHIREHAMPSHIRE
FRANKLIN
MIDDLESEX
WORCESTERNORFOLK
ESSEX
PROVIDENCE
BRISTOL
PLYMOUTH
KENT
WASHINGTONDUKES
BARNSTABLE
NANTUCKET
HAMPDEN
SUFFOLKBERKSHIREHAMPSHIRE
FRANKLIN
MIDDLESEX
WORCESTERNORFOLK
ESSEX
PROVIDENCE
BRISTOL
PLYMOUTH
KENT
WASHINGTONDUKES
BARNSTABLE
NANTUCKET
HAMPDEN
SUFFOLK
BERKSHIREHAMPSHIRE
FRANKLIN
MIDDLESEX
WORCESTERNORFOLK
ESSEX
PROVIDENCE
BRISTOL
PLYMOUTH
KENT
WASHINGTONDUKES
BARNSTABLE
NANTUCKET
HAMPDEN
SUFFOLK
BERKSHIREHAMPSHIRE
FRANKLIN
MIDDLESEX
WORCESTERNORFOLK
ESSEX
PROVIDENCE
BRISTOL
PLYMOUTH
KENT
WASHINGTONDUKES
BARNSTABLE
NANTUCKET
HAMPDEN
SUFFOLK
BERKSHIREHAMPSHIRE
FRANKLIN
MIDDLESEX
WORCESTERNORFOLK
ESSEX
PROVIDENCE
BRISTOL
PLYMOUTH
KENT
WASHINGTONDUKES
BARNSTABLE
NANTUCKET
HAMPDEN
SUFFOLK
BERKSHIREHAMPSHIRE
FRANKLIN
MIDDLESEX
WORCESTERNORFOLK
ESSEX
PROVIDENCE
BRISTOL
PLYMOUTH
KENT
WASHINGTONDUKES
BARNSTABLE
NANTUCKET
HAMPDEN
SUFFOLK
BERKSHIREHAMPSHIRE
FRANKLIN
MIDDLESEX
WORCESTERNORFOLK
ESSEX
PROVIDENCE
BRISTOL
PLYMOUTH
KENT
WASHINGTONDUKES
BARNSTABLE
NANTUCKET
HAMPDEN
SUFFOLKBOSTON
PROVIDENCE
SPRINGFIELD
PITTSFIELD
WORCESTER
BOSTON
PROVIDENCE
SPRINGFIELD
PITTSFIELD
WORCESTER
BOSTON
PROVIDENCE
SPRINGFIELD
PITTSFIELD
WORCESTER
BOSTON
PROVIDENCE
SPRINGFIELD
PITTSFIELD
WORCESTER
BOSTON
PROVIDENCE
SPRINGFIELD
PITTSFIELD
WORCESTER
BOSTON
PROVIDENCE
SPRINGFIELD
PITTSFIELD
WORCESTERBOSTON
PROVIDENCE
SPRINGFIELD
PITTSFIELD
WORCESTER
BOSTON
PROVIDENCE
SPRINGFIELD
PITTSFIELD
WORCESTER
BOSTON
PROVIDENCE
SPRINGFIELD
PITTSFIELD
WORCESTER
BOSTON
PROVIDENCE
SPRINGFIELD
PITTSFIELD
WORCESTER
BOSTON
PROVIDENCE
SPRINGFIELD
PITTSFIELD
WORCESTER
BOSTON
PROVIDENCE
SPRINGFIELD
PITTSFIELD
WORCESTER
0 50 KILOMETERS
0 50 MILES
0 50 KILOMETERS
0 50 MILES
0 50 KILOMETERS
0 50 MILES
0 50 KILOMETERS
0 50 MILES
0 50 KILOMETERS
0 50 MILES
0 50 KILOMETERS
0 50 MILES
0 50 KILOMETERS
0 50 MILES
0 50 KILOMETERS
0 50 MILES
0 50 KILOMETERS
0 50 MILES
0 50 KILOMETERS
0 50 MILES
0 50 KILOMETERS
0 50 MILES
0 50 KILOMETERS
0 50 MILES
RI
MA
RI
MA
RI
MA
RI
MA
RI
MA
RI
MA
RI
MA
RI
MA
RI
MA
RI
MA
RI
MA
RI
MA
50 MILES
50 KILOMETERS
0
0
for this month
within the lowest25 percent of record
COMPARISON WITHMONTHLY SURFACE-WATER
NORMAL RANGE
ABOVE NORMALwithin the highest
25 percent of recordfor this month
NORMAL RANGE
BELOW NORMAL
EXPLANATION
INDEXSTREAM GAGE
NORMAL
NORMAL
NORMAL
A
CD
B
A
CD
B
A
CD
B
A
CD
B
A
CD
B
A
CD
B
A
CD
B
A
CD
B
A
CD
B
A
CD
B
A
CD
B
A
CD
B
Figure 5.
Monthly surface-water conditions during the 2000 water year in Massachusetts and Rhode Island.
WATER RESOURCES DATA FOR MASSACHUSETTS AND RHODE ISLAND, 2000

8
WATER RESOURCES DATA FOR MASSACHUSETTS AND RHODE ISLAND, 2000
Ground-Water Levels
During October through March, 19 new monthlyhigh water levels and 19 new monthly low water levels weremeasured at wells in Massachusetts and Rhode Island. DuringApril through September, 65 new monthly high water levelsand two new monthly low water levels were measuredat wells in Massachusetts and Rhode Island. Twenty-three ofthe 65 new monthly high water levels occurred in August.Wells with water level records that started prior to 1996 inMassachusetts and Rhode Island are included in this sum-mary. Monthly water levels and median, maximum, and min-imum monthly water levels for periods of record for threeindex observation wells in Massachusetts and Rhode Islandare compared in figure 6. Maps showing monthly ground-water conditions during the 2000 water year in Massachusettsand Rhode Island are shown in figure 7. The maps show areasof normal, above-normal, and below-normal ground-waterlevels for each month. During the period October 1999through September 2000, ground-water levels for part or allof Cape Cod were below normal. During the period Junethrough September 2000, ground-water levels for most ofMassachusetts and Rhode Island were above normal. Hydro-graphs plotted below each ground-water table contained inthis report provide additional information on water-leveltrends. Ground-water-level data are also available on theMassachusetts-Rhode Island web pages at:
http://ma.water.usgs.gov/water_g.htm.
During the year new low ground-water levels, for periodsof record were measured at the following wells with five ormore years of record in Massachusetts and Rhode Island:
Well name and number Month of new extreme (start of well record) high water level
Massachusetts WellsHardwick 1 (1965 -) AprilSterling 1 (1947 -) February
Rhode Island WellsExeter 554 (1988-) MarchExeter 554 (1988-) May
Floods and Droughts
Floods
No significant floods occurred during the year.
Droughts
No significant droughts occurred during the year.
SPECIAL NETWORKS AND PROGRAMS
The National Water-Quality Assessment (NAWQA)Program of the U.S. Geological Survey is a long-termprogram with goals to describe the status and trends of water-quality conditions for a large, representative part of the
Nation’s ground- and surface-water resources; provide animproved understanding of the primary natural and humanfactors affecting these observed conditions and trends; andprovide information that supports development and evalua-tion of management, regulatory, and monitoring decisions byother agencies.
Assessment activities are being conducted in 59 studyunits (major watersheds and aquifer systems) that represent awide range of environmental settings nationwide and thataccount for a large percentage of the Nation’s water use. Awide array of chemical constituents will be measured inground water, surface water, streambed sediments, and fishtissues. The coordinated application of comparative hydro-logic studies at a wide range of spatial and temporal scaleswill provide information for decision making by water-resources managers and a foundation for aggregation andcomparison of findings to address water-quality issues ofregional and national interest.
Communication and coordination between USGS per-sonnel and other local, State, and Federal interests are criticalcomponents of the NAWQA Program. Each study unit has alocal liaison committee consisting of representatives fromkey Federal, State, and local water resources agencies, Indiannations, and universities in the study unit. Liaison committeestypically meet semiannually to discuss their informationneeds, monitoring plans and progress, desired informationproducts, and opportunities to collaborate efforts among theagencies.
The New England Coastal Basins (NECB) NAWQAstudy unit encompasses 23,000 square miles (mi2) in westernand central Maine, eastern New Hampshire, easternMassachusetts, most of Rhode Island, and a small part ofeastern Connecticut. NECB NAWQA fixed stations pub-lished in this report are: Stillwater River near Sterling, MA(01095220); Merrimack River below Concord River, at Low-ell, MA (01100000), Ipswich River at South Middleton, MA(01101500); Saugus River at Saugus Ironworks at Saugus,MA (01102345); Aberjona River (head of Mystic River) atWinchester, MA (01102500); Charles River above Water-town Dam at Watertown, MA (01104615); Neponset River atNorwood, MA (01105000); Wading River (head of ThreemileRiver) near Norton, MA (01109000); and Blackstone River atManville, RI (01112900).
Additional information about the NAWQAProgram is available through the world wide web at: http://wwwrvares.er.usgs.gov/nawqa/nawqa_home.html
Radiochemical programs is a network of regularlysampled water-quality stations where samples are collected tobe analyzed for radioisotopes. The streams that are sampledrepresent major drainage basins in the conterminous UnitedStates.

9
Figure 6.
Comparison of monthly water levels in selected observation wells during the 2000 water yearwith average, maximum, and minimum monthly water levels for periods of record.
WATER RESOURCES DATA FOR MASSACHUSETTS AND RHODE ISLAND, 2000
O N D J F M A M J J A S2000
4
12
4
5
6
7
8
9
10
11
WA
TE
R L
EV
EL
, IN
FE
ET
BE
LO
W L
AN
D S
UR
FAC
E
MEDIAN WATER LEVEL FOR PERIOD OF WELL RECORD
MONTHEND WATER LEVEL FOR 2000 WATER YEAR
WILMINGTON 78, MASS. (July 1951- )
UNSHADED AREA SHOWS RANGE BETWEEN HIGHEST AND LOWESTMONTHEND WATER LEVEL FOR PERIOD OF WELL RECORD
EXPLANATION
12
28
12
14
16
18
20
22
24
26
PITTSFIELD 51, MASS. (August 1963- )
16
25
16
17
18
19
20
21
22
23
24
COVENTRY 411, RI. (October 1961- )

10
October 1999 April 2000
May 2000
June 2000
July 2000
August 2000
September 2000
November 1999
December 1999
January 2000
February 2000
March 2000
BERKSHIREHAMPSHIRE
FRANKLIN
MIDDLESEX
WORCESTERNORFOLK
ESSEX
PROVIDENCE
BRISTOL
PLYMOUTH
KENT
WASHINGTONDUKES
BARNSTABLE
NANTUCKET
HAMPDEN
SUFFOLK
BERKSHIREHAMPSHIRE
FRANKLIN
MIDDLESEX
WORCESTERNORFOLK
ESSEX
PROVIDENCE
BRISTOL
PLYMOUTH
KENT
WASHINGTONDUKES
BARNSTABLE
NANTUCKET
HAMPDEN
SUFFOLK
BERKSHIREHAMPSHIRE
FRANKLIN
MIDDLESEX
WORCESTERNORFOLK
ESSEX
PROVIDENCE
BRISTOL
PLYMOUTH
KENT
WASHINGTONDUKES
BARNSTABLE
NANTUCKET
HAMPDEN
SUFFOLK
BERKSHIREHAMPSHIRE
FRANKLIN
MIDDLESEX
WORCESTERNORFOLK
ESSEX
PROVIDENCE
BRISTOL
PLYMOUTH
KENT
WASHINGTONDUKES
BARNSTABLE
NANTUCKET
HAMPDEN
SUFFOLK
BERKSHIREHAMPSHIRE
FRANKLIN
MIDDLESEX
WORCESTERNORFOLK
ESSEX
PROVIDENCE
BRISTOL
PLYMOUTH
KENT
WASHINGTONDUKES
BARNSTABLE
NANTUCKET
HAMPDEN
SUFFOLK
BERKSHIREHAMPSHIRE
FRANKLIN
MIDDLESEX
WORCESTERNORFOLK
ESSEX
PROVIDENCE
BRISTOL
PLYMOUTH
KENT
WASHINGTONDUKES
BARNSTABLE
NANTUCKET
HAMPDEN
SUFFOLKBERKSHIREHAMPSHIRE
FRANKLIN
MIDDLESEX
WORCESTERNORFOLK
ESSEX
PROVIDENCE
BRISTOL
PLYMOUTH
KENT
WASHINGTONDUKES
BARNSTABLE
NANTUCKET
HAMPDEN
SUFFOLK
BERKSHIREHAMPSHIRE
FRANKLIN
MIDDLESEX
WORCESTERNORFOLK
ESSEX
PROVIDENCE
BRISTOL
PLYMOUTH
KENT
WASHINGTONDUKES
BARNSTABLE
NANTUCKET
HAMPDEN
SUFFOLK
BERKSHIREHAMPSHIRE
FRANKLIN
MIDDLESEX
WORCESTERNORFOLK
ESSEX
PROVIDENCE
BRISTOL
PLYMOUTH
KENT
WASHINGTONDUKES
BARNSTABLE
NANTUCKET
HAMPDEN
SUFFOLK
BERKSHIREHAMPSHIRE
FRANKLIN
MIDDLESEX
WORCESTERNORFOLK
ESSEX
PROVIDENCE
BRISTOL
PLYMOUTH
KENT
WASHINGTONDUKES
BARNSTABLE
NANTUCKET
HAMPDEN
SUFFOLK
BERKSHIREHAMPSHIRE
FRANKLIN
MIDDLESEX
WORCESTERNORFOLK
ESSEX
PROVIDENCE
BRISTOL
PLYMOUTH
KENT
WASHINGTONDUKES
BARNSTABLE
NANTUCKET
HAMPDEN
SUFFOLK
BERKSHIREHAMPSHIRE
FRANKLIN
MIDDLESEX
WORCESTERNORFOLK
ESSEX
PROVIDENCE
BRISTOL
PLYMOUTH
KENT
WASHINGTONDUKES
BARNSTABLE
NANTUCKET
HAMPDEN
SUFFOLK
A
C
B D
A
C
B D
A
C
B D
A
C
B D
A
C
B D
A
C
B D
A
C
B D
A
C
B D
A
C
B D
A
C
B D
A
C
B D
A
C
B D
BOSTON
PROVIDENCE
SPRINGFIELD
PITTSFIELD
WORCESTER
BOSTON
PROVIDENCE
SPRINGFIELD
PITTSFIELD
WORCESTER
BOSTON
PROVIDENCE
SPRINGFIELD
PITTSFIELD
WORCESTER
BOSTON
PROVIDENCE
SPRINGFIELD
PITTSFIELD
WORCESTER
BOSTON
PROVIDENCE
SPRINGFIELD
PITTSFIELD
WORCESTER
BOSTON
PROVIDENCE
SPRINGFIELD
PITTSFIELD
WORCESTERBOSTON
PROVIDENCE
SPRINGFIELD
PITTSFIELD
WORCESTER
BOSTON
PROVIDENCE
SPRINGFIELD
PITTSFIELD
WORCESTER
BOSTON
PROVIDENCE
SPRINGFIELD
PITTSFIELD
WORCESTER
BOSTON
PROVIDENCE
SPRINGFIELD
PITTSFIELD
WORCESTER
BOSTON
PROVIDENCE
SPRINGFIELD
PITTSFIELD
WORCESTER
BOSTON
PROVIDENCE
SPRINGFIELD
PITTSFIELD
WORCESTER
0 50 KILOMETERS
0 50 MILES
0 50 KILOMETERS
0 50 MILES
0 50 KILOMETERS
0 50 MILES
0 50 KILOMETERS
0 50 MILES
0 50 KILOMETERS
0 50 MILES
0 50 KILOMETERS
0 50 MILES
0 50 KILOMETERS
0 50 MILES
0 50 KILOMETERS
0 50 MILES
0 50 KILOMETERS
0 50 MILES
0 50 KILOMETERS
0 50 MILES
0 50 KILOMETERS
0 50 MILES
0 50 KILOMETERS
0 50 MILES
RI
MA
RI
MA
RI
MA
RI
MA
RI
MA
RI
MA
RI
MA
RI
MA
RI
MA
RI
MA
RI
MA
RI
MA
INDEXOBSERVATION WELL
for this month
within the lowest25 percent of record
COMPARISON WITHMONTHLY GROUND-WATER
NORMAL RANGE
ABOVE NORMALwithin the highest
25 percent of recordfor this month
NORMAL RANGE
BELOW NORMAL
EXPLANATION
Figure 7.
Monthly ground-water conditions during the 2000 water year in Massachusetts and Rhode Island.
WATER RESOURCES DATA FOR MASSACHUSETTS AND RHODE ISLAND, 2000

11
WATER RESOURCES DATA FOR MASSACHUSETTS AND RHODE ISLAND, 2000
EXPLANATION OF THE RECORDS
The surface-water and ground-water records publishedin this report are for the 2000 water year that began October 1,1999, and ended September 30, 2000. A calendar of the wateryear is provided on the inside of the front cover. The recordscontain streamflow data, stage and content data for lakes andreservoirs, water-quality data for surface water, and ground-water-level data.
The locations of the stations and wells where the datawere collected are shown in figures 1, 2, and 3. The followingsections of the introductory text are presented to provideusers with a more detailed explanation of how the hydrologicdata published in this report were collected, analyzed,computed, and arranged for presentation.
Station-Identification Numbers
Each data station, whether streamsite or well, in thisreport is assigned a unique identification number. Thisnumber is unique in that it applies specifically to a given sta-tion and to no other. The number usually is assigned when astation is first established and is retained for that station indef-initely. The systems used by the U.S. Geological Survey toassign identification numbers for surface-water stations andfor ground-water well sites differ, but both are based on geo-graphic location. The “downstream order” system is used forsurface-water stations and the “latitude-longitude” system isused for wells.
Downstream Order System
Since October 1, 1950, the order of listing hydrologic-station records in Survey reports is in a downstream directionalong the main stream. All stations on a tributary enteringupstream from a mainstream station are listed before that sta-tion. A station on a tributary that enters between two main-stream stations is listed between them. A similar order isfollowed in listing stations on first rank, second rank, andother ranks of tributaries. The rank of any tributary withrespect to the stream to which it is immediately tributary isindicated by an indention in the “List of Stations” in the frontof this report. Each indention represents one rank. Thisdownstream order and system of identification shows whichstations are on tributaries between any two stations and therank of the tributary on which each station is situated.
The station-identification number is assigned accordingto downstream order. In assigning station numbers, nodistinction is made between continuous- record stations andother types of stations; therefore, the station number for acontinuous-record station indicates downstream-orderposition in a list made up of all types of stations.Gaps are left in the series of numbers to allow for new sta-tions that may be established; hence, the numbers are not con-secutive. The complete station number (usually eight digits,but sometimes nine or more if needed) appears just to the leftof the station name. The first two digits indicate the Partnumber (formerly used in Water-Supply Papers to designate
major river systems) and the last six or more digits indicatethe downstream order within the Part. For example, in the sta-tion number 01094400, “01” is the Part number for “NorthAtlantic Slope Basins” and “094400” is the downstreamorder number.
Latitude-Longitude System
The identification numbers for wells are assignedaccording to the grid system of latitude and longitude. Thenumber consists of 15 digits. The first six digits denote thedegrees, minutes, and seconds of latitude, the next sevendigits denote degrees, minutes, and seconds of longitude, andthe last two digits (assigned sequentially) identify the wells orother sites within a 1-second grid. This site-identificationnumber, once assigned, is a pure number and has no loca-tional significance. In the rare instance where the initial deter-mination of latitude and longitude is found to be in error, thestation will retain its initial identification number; however,its true latitude and longitude will be listed in the LOCATIONparagraph of the station description. (See figure 7.)
Numbering System for Wells
A local well numbering system is also used in this report.The local well number consists of a 2-letter code for the townin which the well is located followed by a “W” signifying thatit is a well, and a sequential number. The local number is usedto identify the location of observation wells in figure 3.
Records of Stage and Water Discharge
Records of stage and water discharge may be completeor partial. Complete records of discharge are those obtainedusing a continuous stage-recording device through whicheither instantaneous or mean daily discharges may becomputed for any time, or any period of time, during the
71°1
6’45
”
44”
70°1
6’43
”
Coordinates for well C: (413957070164301)
Coordinates for wells D: Coordinates for wells A: (413956070164401) (413956070164301) and E: and B: (413956070164402) (413956070164302)
41°39’56”
57”
41°39’58”
Figure 8.--System for numbering wells (latitude and longitude)
D
E
C
A
B

12
WATER RESOURCES DATA FOR MASSACHUSETTS AND RHODE ISLAND, 2000
period of record. Complete records of lake or reservoir con-tent, similarly, are those for which stage or content may becomputed or estimated with reasonable accuracy for anytime, or period of time. They may be obtained using a contin-uous stage-recording device, but need not be. Because dailymean discharges and end-of-day contents commonly are pub-lished for such stations, they are referred to as “dailystations.”
By contrast, partial records are obtained through discretemeasurements without using a continuous stage-recordingdevice and pertain only to a few flow characteristics, or per-haps only one. The nature of the partial record is indicated bytable titles such as “Crest-stage partial records,” or “Low-flowpartial records.” Records of miscellaneous discharge mea-surements or of measurements from special studies, such aslow-flow seepage studies, may be considered as partialrecords, but they are presented separately in this report. Therewere no crest-stage stations this year. Location of allcomplete-record stations for which data are given in thisreport are shown in figure 1; location of all partial-recordstations for which data are given in this report are shown infigure 2.
Data Collection and Computation
The data obtained at a complete-record gaging station ona stream or canal consist of a continuous record of stage, indi-vidual measurements of discharge throughout a range ofstages, and notations regarding factors that may affect therelationships between stage and discharge. These data,together with supplemental information, such as weatherrecords, are used to compute daily discharges. The dataobtained at a complete-record gaging station on a lake or res-ervoir consist of a record of stage and of notations regardingfactors that may affect the relationship between stage and lakecontent. These data are used with stage-area and stage-capacity curves or tables to compute water-surface areas andlake storage.
Continuous records of stage are obtained with electronicrecorders that log data at selected time intervals. Measure-ments of discharge are made with current meters using meth-ods adopted by the Geological Survey as a result ofexperience accumulated since 1880. These methods aredescribed in standard textbooks; in U.S. Geological SurveyTechniques of Water-Resources Investigations, Book 3,Chapter A6; and in U.S. Geological Survey Water-SupplyPaper 2175, “Measurement and Computation of Stream-flow:Volume 1--Measurement of Stage and Discharge (p. 1–284);Volume 2--Computation of Discharge (p. 285–631)” by S.E.Rantz and others (1982).
In computing discharge records, results of individualmeasurements are plotted against the corresponding stages,and stage-discharge relation curves are then constructed.From these curves, rating tables indicating the approximate
discharge for any stage within the range of the measurementsare prepared. If it is necessary to define extremes of dischargeoutside the range of the current-meter measurements, thecurves are extended using: (1) logarithmic plotting;(2) velocity-area studies; (3) results of indirect measurementsof peak discharge, such as slope-area or contracted-openingmeasurements, and computations of flow over dams or weirs;or (4) step-backwater techniques.
Daily mean discharge is computed by applying thedaily mean stage (gage height) to the stage-discharge ratingtable or by applying each recorded stage in the day tothe rating table and computing the mean from the sum of theindividual discharges. If the stage-discharge relation is sub-ject to change because of frequent or continual change in thephysical features that form the control, the daily mean dis-charge is determined by the shifting-control method, in whichcorrection factors based on the individual discharge measure-ments and notes of the personnel making the measurementsare applied to the gage heights before the discharges aredetermined from the curves or tables. This shifting-controlmethod also is used if the stage-discharge relation is changedtemporarily because of aquatic growth or debris on the con-trol. For some stations, formation of ice in the winter mayobscure the stage-discharge relations. This requires dailymean discharges to be estimated from other information suchas temperature and precipitation records, notes of observa-tions, and records for other stations in the same or nearbybasins for comparable periods.
At some stream-gaging stations, the stage-dischargerelation is affected by the backwater from reservoirs, tributarystreams, or other sources. This necessitates the use of theslope method in which the slope or fall in a reach of thestream is a factor in computing discharge. The slope or fall isobtained by means of an auxiliary gage set at some distancefrom the base gage. At some stations the stage-dischargerelation is affected by changing stage; at these stations therate of change in stage is used as a factor in computingdischarge.
In computing records of lake or reservoir contents, it isnecessary to have available from surveys, curves or tablesdefining the relationship of stage and content. The applicationof stage to the stage-content curves or tables gives the con-tents from which daily, monthly, or yearly changes then aredetermined. If the stage-content relationship changes becauseof deposition of sediment in a lake or reservoir, periodicresurveys may be necessary to redefine the relationship. Evenwhen this is done, the contents computed may becomeincreasingly in error as the lapsed time since the last surveyincreases. Discharges over lake or reservoir spillways arecomputed from stage-discharge relationships much as otherstream discharges are computed.

13
WATER RESOURCES DATA FOR MASSACHUSETTS AND RHODE ISLAND, 2000
For some gaging stations, there are periods when nogage-height record is obtained, or the recorded gage height isso faulty that it cannot be used to compute daily discharge orcontents. This happens when the recorder stops or otherwisefails to operate properly, intakes are plugged, the float isfrozen in the well, or for various other reasons. For suchperiods, the daily discharges are estimated from the recordedrange in stage, previous or following record, discharge mea-surements, weather records, and comparison with otherstation records from the same or nearby basins. Likewise,daily contents may be estimated from operator’s logs,previous or following record, inflow-outflow studies, andother information. Information explaining how estimateddaily-discharge values are identified in station records isincluded in the next two sections, “Data Presentation”(REMARKS paragraph) and “Identifying Estimated DailyDischarge.”
Data Presentation
The records published for each continuous-recordsurface-water discharge station (gaging station) consist offive parts: the manuscript or station description; the data tableof daily mean values of discharge for the current water yearwith summary data; a tabular statistical summary of monthlymean flow data for a designated period, by water year; a sum-mary statistics table that includes statistical data of annual,daily, and instantaneous flows as well as data pertaining toannual runoff, 7-day low-flow minimums, and flow duration;and a hydrograph of daily mean discharges for the currentwater year that includes the 10, 50, and 90 percent flow dura-tions (PERCENT EXCEEDS) for the period of continuousgage record.
Station manuscript
The manuscript provides, under various headings,descriptive information, such as station location; period ofrecord; historical extremes outside the period of record;record accuracy; and other remarks pertinent to stationoperation and regulation. The following information, asappropriate, is provided with each continuous record ofdischarge or lake content. Comments to follow clarify infor-mation presented under the various headings of the stationdescription.
LOCATION--Information on locations is obtained from themost accurate maps available. The location of the gage withrespect to the cultural and physical features in the vicinity andwith respect to the reference place mentioned in the stationname is given. River mileages, given for only a few stations,were determined by methods given in “River Mileage Mea-surement,” Bulletin 14, Revision of October 1968, preparedby the Water Resources Council or were provided by the U.S.Army Corps of Engineers.
DRAINAGE AREA--Drainage areas are measured using themost accurate maps available. Because the type of mapsavailable varies from one drainage basin to another, the accu-racy of drainage areas likewise varies. Drainage areas areupdated as better maps become available.
PERIOD OF RECORD--This indicates the period for whichthere are published records for the station or for an equivalentstation. An equivalent station is one that was in operation at atime that the present station was not and whose location wassuch that records from it can reasonably be consideredequivalent with records from the present station.
REVISED RECORDS--Because of new information, pub-lished records occasionally are found to be incorrect, andrevisions are printed in later reports. Listed under this headingare all the reports in which revisions have been published forthe station and the water years to which the revisions apply. Ifa revision did not include daily, monthly, or annual figures ofdischarge, that fact is noted after the year dates as follows:“(M)” means that only the instantaneous maximum dischargewas revised; “(m)” that only the instantaneous minimum wasrevised; and “(P)” that only peak discharges were revised. Ifthe drainage area has been revised, the report in which themost recently revised figure was first published is given.
GAGE--The type of gage in current use, the datum of the cur-rent gage referred to sea level (see glossary), and a condensedhistory of the types, locations and datums of previous gagesare given under this heading.
REMARKS--All periods of estimated daily discharge willeither be identified by date in this paragraph of the stationdescription for water-discharge stations or flagged in the dailydischarge table. (See next section, "Identifying EstimatedDaily Discharge.") If a REMARKS paragraph is used to iden-tify estimated record, the paragraph will begin with thisinformation presented as the first entry. The paragraph is alsoused to present information relative to the accuracy of therecords, to special methods of computation, and to conditionsthat affect natural flow at the station. In addition, informationmay be presented pertaining to average discharge data for theperiod of record; to extremes data for the period of record andthe current year; and, possibly, to other pertinent items. Forreservoir stations, information is given on the dam formingthe reservoir, the capacity, outlet works and spillway, andpurpose and use of the reservoir.
COOPERATION--Records provided by a cooperating orga-nization or obtained for the U.S. Geological Survey by acooperating organization are identified here.
EXTREMES OUTSIDE PERIOD OF RECORD--Includedhere is information concerning major floods or unusually lowflows that occurred outside the stated period of record. Theinformation may or may not have been obtained by the U.S.Geological Survey.

14
WATER RESOURCES DATA FOR MASSACHUSETTS AND RHODE ISLAND, 2000
REVISIONS--If a critical error in published records is dis-covered, a revision is included in the first report publishedfollowing discovery of the error.
Although rare, occasionally the records of a discontinuedgaging station may need revision. Because, for these stations,there would be no current or, possibly, future stationmanuscript published to document the revision in a "RevisedRecords" entry, users of data for these stations who obtainedthe record from previously published data reports may wishto contact the District Office (address given on the back of thetitle page of this report) to determine if the published recordswere ever revised after the station was discontinued. Ofcourse, if the data for a discontinued station were obtained bycomputer retrieval, the data would be current and there wouldbe no need to check because any published revision of data isalways accompanied by revision of the corresponding data incomputer storage.
Manuscript information for lake or reservoir stations dif-fers from that for stream stations in the nature of the"Remarks" and in the inclusion of a skeleton stage-capacitytable when daily contents are given.
Headings for AVERAGE DISCHARGE, EXTREMESFOR PERIOD OF RECORD, AND EXTREMES FORCURRENT YEAR have been deleted and the informationcontained in these paragraphs, except for the listing ofsecondary instantaneous peak discharges in the EXTREMESFOR CURRENT YEAR paragraph, is now presented in thetabular summaries following the discharge table or in theREMARKS paragraph, as appropriate. No changes have beenmade to the data presentations of lake contents.
Data table of daily mean values
The daily table of discharge records for stream-gagingstations gives mean discharge for each day of the water year.In the monthly summary for the table, the line headed“TOTAL” gives the sum of the daily figures for each month;the line headed "MEAN" gives the average flow in cubic feetper second for the month; and the lines headed "MAX" and"MIN" give the maximum and minimum daily mean dis-charges, respectively, for each month. Discharge for themonth also is usually expressed in cubic feet per second persquare mile (line headed "CFSM"); or in inches (line headed"IN."); or in acre-feet (line headed "AC-FT"). Figures forcubic feet per second per square mile and runoff in inches orin acre-feet may be omitted if there is extensive regulation ordiversion or if the drainage area includes large noncontribut-ing areas. At some stations monthly and (or) yearly observeddischarges are adjusted for reservoir storage or diversion, ordiversion data or reservoir contents are given. These figuresare identified by a symbol and corresponding footnote.
Statistics of monthly mean data
A tabular summary of the mean (line headed "MEAN"),maximum (line headed "MAX"), and minimum (line headed"MIN") of monthly mean flows for each month for adesignated period is provided below the mean values table.The water years of the first occurrence of the maximum andminimum monthly flows are provided immediately belowthose figures. The designated period will be expressed as"FOR WATER YEARS _ - _, BY WATER YEAR (WY)," andwill list the first and last water years of the range of yearsselected from the PERIOD OF RECORD paragraph in thestation manuscript. It will consist of all of the station recordwithin the specified water years, inclusive, including com-plete months of record for partial water years, if any, and maycoincide with the period of record for the station. The wateryears for which the statistics are computed will be consecu-tive, unless a break in the station record is indicated in themanuscript.
Summary statistics
A table titled "SUMMARY STATISTICS" follows thestatistics of monthly mean data tabulation. This table consistsof four columns, with the first column containing the lineheadings of the statistics being reported. The table provides astatistical summary of yearly, daily, and instantaneous flows,not only for the current water year but also for the previouscalendar year and for a designated period, as appropriate. Thedesignated period selected, "WATER YEARS _ - _," willconsist of all of the station record within the specified wateryears, inclusive, including complete months of record forpartial water years, if any, and may coincide with the periodof record for the station. The water years for which thestatistics are computed will be consecutive, unless a break inthe station record is indicated in the manuscript. All of thecalculations for the statistical characteristics designatedANNUAL (See line headings below.), except for the"ANNUAL 7-DAY MINIMUM" statistic, are calculated forthe designated period using complete water years. The otherstatistical characteristics may be calculated using partialwater years.
The date or water year, as appropriate, of the first occur-rence of each statistic reporting extreme values of dischargeis provided adjacent to the statistic. Repeated occurrencesmay be noted in the REMARKS paragraph of the manuscriptor in footnotes. Because the designated period may not be thesame as the station period of record published in the manu-script, occasionally the dates of occurrence listed for the dailyand instantaneous extremes in the designated-period columnmay not be within the selected water years listed in the head-ing. When this occurs, it will be noted in the REMARKSparagraph or in footnotes. Selected streamflow duration curvestatistics and runoff data are also given. Runoff data may beomitted if there is extensive regulation or diversion of flow inthe drainage basin.

15
WATER RESOURCES DATA FOR MASSACHUSETTS AND RHODE ISLAND, 2000
The following summary statistics data, as appropriate,are provided with each continuous record of discharge. Com-ments to follow clarify information presented under thevarious line headings of the summary statistics table.
ANNUAL TOTAL--The sum of the daily mean values of dis-charge for the year. At some stations the annual totaldischarge is adjusted for reservoir storage or diversion. Theadjusted figures are identified by a symbol and correspondingfootnotes.
ANNUAL MEAN--The arithmetic mean of the individualdaily mean discharges for the year noted or for the designatedperiod. At some stations the yearly mean discharge is adjustedfor reservoir storage or diversion. The adjusted figures areidentified by a symbol and corresponding footnotes.
HIGHEST ANNUAL MEAN--The maximum annual meandischarge occurring for the designated period.
LOWEST ANNUAL MEAN--The minimum annual meandischarge occurring for the designated period.
HIGHEST DAILY MEAN--The maximum daily meandischarge for the year or for the designated period.
LOWEST DAILY MEAN--The minimum daily meandischarge for the year or for the designated period.
ANNUAL 7-DAY MINIMUM--The lowest mean dischargefor 7 consecutive days for a calendar year or a water year.Note that most low-flow frequency analyses of annual 7-dayminimum flows use a climatic year (April 1–March 31). Thedate shown in the summary statistics table is the initial date ofthe 7-day period. (This value should not be confused with the7-day 10-year low-flow statistic.)
INSTANTANEOUS PEAK FLOW--The maximum instanta-neous discharge occurring for the water year or for thedesignated period. Note that secondary instantaneous peakdischarges above a selected base discharge are stored in Dis-trict computer files for stations meeting certain criteria. Thosedischarge values may be obtained by writing to the DistrictOffice. (See address on back of title page of this report.)
INSTANTANEOUS PEAK STAGE--The maximum instan-taneous stage occurring for the water year or for thedesignated period. If the dates of occurrence for the instanta-neous peak flow and instantaneous peak stage differ, theREMARKS paragraph in the manuscript or a footnote may beused to provide further information.
INSTANTANEOUS LOW FLOW--The minimum instanta-neous discharge occurring for the water year or for thedesignated period.
ANNUAL RUNOFF--Indicates the total quantity of water inrunoff for a drainage area for the year. Data reports may useany of the following units of measurement in presentingannual runoff data:
Acre-foot (AC-FT) is the quantity of water required to cover1 acre to a depth of 1 foot and is equal to 43,560 cubic feet orabout 326,000 gallons or 1,233 cubic meters.
Cubic feet per second per square mile (CFSM) is the averagenumber of cubic feet of water flowing per second from eachsquare mile area drained, assuming the runoff is distributeduniformly in time and area.
Inches (INCHES) indicates the depth to which the drainagearea would be covered if all of the runoff for a given timeperiod were uniformly distributed on it.
10 PERCENT EXCEEDS--The discharge that has beenexceeded 10 percent of the time for the designated period.
50 PERCENT EXCEEDS--The discharge that has beenexceeded 50 percent of the time for the designated period.
90 PERCENT EXCEEDS--The discharge that has beenexceeded 90 percent of the time for the designated period.
Data collected at partial-record stations follow the infor-mation for continuous-record sites. Data for partial-recorddischarge stations are presented in two tables. The first is atable of annual maximum stage and discharge at crest-stagestations, and the second is a table of discharge measurementsat low-flow partial-record stations. The tables of partial-record stations are followed by a listing of discharge measure-ments made at sites other than continuous-record or partial-record stations. These measurements are generally made intimes of drought or flood to give better areal coverage to thoseevents. Those measurements and others collected for somespecial reason are called measurements at miscellaneoussites.
Identifying Estimated Daily Discharge
Estimated daily-discharge values published in the water-discharge tables of annual State data reports are identifiedeither by flagging individual daily values with the lettersymbol "e" and printing a table footnote, "e Estimated," or bylisting the dates of the estimated record in the REMARKSparagraph of the station manuscript.
Accuracy of the Records
The accuracy of streamflow records depends primarilyon: (1) The stability of the stage-discharge relation or, if thecontrol is unstable, the frequency of discharge measurements;and (2) the accuracy of measurements of stage, measurementsof discharge, and interpretation of records.
The accuracy attributed to the records is indicated under"REMARKS." "Excellent" means that about 95 percent of thedaily discharges are within 5 percent of their true values;"good," within 10 percent; and "fair," within 15 percent.Records that do not meet the criteria mentioned are rated"poor." Different accuracies may be attributed to differentparts of a given record.
16
WATER RESOURCES DATA FOR MASSACHUSETTS AND RHODE ISLAND, 2000
Daily mean discharges in this report are given to thenearest hundredth of a cubic foot per second for values lessthan 1 ft3/s; to the nearest tenth between 1.0 and 10 ft3/s; towhole numbers between 10 and 1,000 ft3/s; and to 3 signifi-cant figures for more than 1,000 ft3/s. The number of signif-icant figures used is based solely on the magnitude of thedischarge value. Discharges listed for partial-record stationsand miscellaneous sites are generally shown to threesignificant figures.
Discharge at many stations, as indicated by the monthlymean, may not reflect natural runoff due to the effects ofdiversion, consumption, regulation by storage, increase ordecrease in evaporation due to artificial causes, or to otherfactors. For such stations, figures of cubic feet per second persquare mile and of runoff, in inches, are not published unlesssatisfactory adjustments can be made for diversions, forchanges in contents of reservoirs, or for other changes inci-dent to use and control. Evaporation from a reservoir is notincluded in the adjustments for changes in reservoir contents,unless it is so stated. Even at those stations where adjust-ments are made, large errors in computed runoff may occur ifadjustments or losses are large in comparison with theobserved discharge.
Other Records Available
Information used in the preparation of the records in thispublication, such as discharge-measurement notes, gage-height records, temperature measurements, and rating tablesis on file in the District Office. Also, most of the daily meandischarges are in computer-readable form and have been ana-lyzed statistically. Information on the availability of theunpublished information or on the results of statistical analy-ses of the published records may be obtained from the Mas-sachusetts-Rhode Island District Office at the address givenon the back of the title page or by telephone (508) 490-5000.
Records of Surface-Water Quality
Records of surface-water quality ordinarily are obtainedat or near stream-gaging stations because interpretation ofrecords of surface-water quality nearly always requirescorresponding discharge data. Records of surface-water qual-ity in this report may involve a variety of types of data andmeasurement frequencies.
Classification of Records
Water-quality data for surface-water sites are groupedinto one of three classifications. A continuing-record stationis a site where data are collected on a regularly scheduledbasis. Frequency may be once or more times daily, weekly,monthly, or quarterly. A partial-record station is a site wherelimited water-quality data are collected systematically over aperiod of years. Frequency of sampling is usually less thanquarterly. A miscellaneous sampling site is a location other
than a continuing or partial-record station where randomsamples are collected to give better areal coverage to definewater-quality conditions in the river basin.
A careful distinction needs to be made between "continu-ing records," as used in this report, and "continuous record-ings," which refers to a continuous graph or a series ofdiscrete values recorded at short intervals on a digital or elec-tronic data logger. Some records of water quality, such astemperature and specific conductance, may be obtainedthrough continuous recordings; however, because of costs,most data are obtained only monthly or less frequently. Loca-tions of stations for which records on the quality of surfacewater appear in this report are shown in figure 1.
Arrangement of Records
Water-quality records collected at a surface-water dailyrecord station are published immediately following thatrecord, regardless of the frequency of sample collection. Sta-tion number and name are the same for both records. Wherea surface-water daily record station is not available or wherethe water quality differs significantly from that at the nearbysurface-water station, the continuing water-quality record ispublished with its own station number and name in theregular downstream-order sequence.
On-Site Measurements and Sample Collection
In obtaining water-quality data, a major concern needs tobe assuring that the data obtained represent the in situ qualityof the water. To assure this, certain measurements, such aswater temperature, pH, and dissolved oxygen, need to bemade onsite when the samples are taken. To assure that mea-surements made in the laboratory also represent the in situwater, carefully prescribed procedures need to be followed incollecting the samples, in treating the samples to preventchanges in quality pending analysis, and in shipping thesamples to the laboratory.
Procedures for onsite measurements and for collecting,treating, and shipping samples are given in publicationson "Techniques of Water-Resources Investigations,"Book 1, Chap. D2; Book 3, Chap. C2; Book 5, Chap. A1,A3, and A4. All of these references are listed under "PUBLI-CATIONS ON TECHNIQUES OF WATER- RESOURCESINVESTIGATIONS" which appears at the end of the intro-ductory text. Detailed information on collecting, treating, andshipping samples may be obtained from the Massachusetts-Rhode Island District Office.
One sample can define adequately the water quality at agiven time if the mixture of solutes throughout the streamcross section is homogeneous. However, the concentration ofsolutes at different locations in the cross section may varywidely with different rates of water discharge, depending onthe source of material and the turbulence and mixing of the

17
WATER RESOURCES DATA FOR MASSACHUSETTS AND RHODE ISLAND, 2000
stream. Some streams must be sampled through severalvertical sections to obtain a representative sample needed foran accurate mean concentration and for use in calculatingload. All samples obtained for the National Stream QualityAccounting Network (see definitions) are obtained from atleast several verticals. Whether samples are obtained from thecentroid of flow or from several verticals depends on flowconditions and other factors which must be evaluated by thecollector.
Chemical-quality data published in this report are con-sidered to be the most representative values available for thestations listed. The values reported represent water-qualityconditions at the time of sampling as much as possible,consistent with available sampling techniques and methods ofanalysis. In the rare case where an apparent inconsistencyexists between a reported pH value and the relative abundanceof carbon dioxide species (carbonate and bicarbonate), theinconsistency is the result of a slight uptake of carbon dioxidefrom the air by the sample between measurement of pH in thefield and determination of carbonate and bicarbonate in thelaboratory.
For chemical-quality stations equipped with digital mon-itors, the records consist of daily maximum, minimum, andmean values for each constituent measured and are basedupon hourly punches beginning at 0100 hours and ending at2400 hours for the day of record.
Water Temperature
Water temperatures are measured at most of the water-quality stations. Large streams have a small diurnal temper-ature change; shallow streams may have a daily range of sev-eral degrees and may follow closely the changes in airtemperature. Some streams may be affected by waste-heatdischarges. At stations where recording instruments are used,maximum, minimum, and mean temperatures for each dayare published.
Sediment
Suspended-sediment concentrations are determinedfrom samples collected by using depth-integrating samplers.Samples usually are obtained at several verticals in the crosssection, or a single sample may be obtained at a fixed pointand a coefficient applied to determine the mean concentrationin the cross sections.
During periods of rapidly changing flow or rapidlychanging concentration, samples may have been collectedmore frequently (twice daily or, in some instances, hourly).The published sediment discharges for days of rapidly chang-ing flow or concentration were computed by the subdivided-day method (time-discharge weighted average). Therefore,for those days when the published sediment discharge valuediffers from the value computed as the product of dischargetimes mean concentration times 0.0027, the reader can
assume that the sediment discharge for that day was com-puted by the subdivided-day method. For periods when nosamples were collected, daily discharges of suspended sedi-ment were estimated on the basis of water discharge, sedi-ment concentrations observed immediately before and afterthe periods, and suspended-sediment loads for other periodsof similar discharge.
At other stations, suspended-sediment samples were col-lected periodically at many verticals in the stream cross sec-tion. Although data collected periodically may representconditions only at the time of observations, such data areuseful in establishing seasonal relations between quality andstreamflow and in predicting long- term sediment-dischargecharacteristics of the stream.
In addition to the records of suspended-sedimentdischarge, records of the periodic measurements of the parti-cle-size distribution of the suspended sediment and bedmaterial are included for some stations.
Laboratory Measurements
Sediment samples, samples for biochemical oxygendemand (BOD), samples for indicator bacteria, and dailysamples for specific conductance are analyzed locally. Allother samples are analyzed in the Geological Surveylaboratory at the Denver Federal Center in Lakewood, Colo-rado. Methods used in analyzing sediment samples and com-puting sediment records are given in TWRI, Book 5,Chap. C1.
Methods used by the Geological Survey laboratory aregiven in TWRI, Book 1, Chap. D2; Book 3, Chap. C2;Book 5, Chap. A1, A3, and A4.
Analyses of pesticides in surface-water samples and ground-water samples (schedule 2001)
Selected surface-water samples and ground-water sam-ples from New England Coastal Basins National Water-Qual-ity Assessment Program (NECB NAWQA) study sites wereanalyzed for pesticides on National Water Quality Laboratory(NWQL) schedule 2001 during the 1999 water year. The fol-lowing table lists the pesticides on the schedule, the unit ofmeasure (micrograms per liter, µg/L), the U.S. GeologicalSurvey National Water Information System parameter code,the NWQL compound name, and the minimum reportinglevel (MRL).
Estimated values for constituents in the 2001 scheduleare preceded by an "E" to alert the data user to decreased con-fidence in accurate quantitation. Values for analytes in the2001 schedule are preceded by an "E" in the following situa-tions:
1. An analyte is determined outside the concentration range (upper concentration limits are to 20 mg/L for most compounds). The analyte is reported as greater

18
WATER RESOURCES DATA FOR MASSACHUSETTS AND RHODE ISLAND, 2000
than the highest calibration standard, and qualified with an "E". For example, a sample with a concentration of cyanazine determined as 41 mg/L from the calibration curve is reported as "E41".
2. The concentration is less than the MDL. The analyte meets all identification criteria to be positively identified, but the amount detected is below where it can be reliably quantified. The MDL's are used as the default reporting values when no analyte is detected in a sample.
3. An analyte demonstrated "poor" performance (that is, low and/or inconsistent recovery). These performance problems are related to either SPE or GC/MS procedures. The analyte is reported with an "E" code, to indicate that the concentration is an estimated measurement.
Only pesticides measured at or above the minimum reportinglevel for one or more samples are listed in the water-qualitytables.
ANALYSES DESCRIPTION--Pesticides are partitionedfrom the filtered sample water by a C-18 Solid Phase Extrac-tion (SPE) cartridge and analyzed by gaschromatography/mass spectrometry (GC/MS).
SAMPLE REQUIREMENTS--1 liter of water is filteredthrough a 0.7-micron glass-fiber depth filter, chilled at 4oC(packed in ice).
CONTAINER REQUIREMENTS--1 liter baked amber glassbottle (GCC) from USGS NWQL.
PCODE--The USGS parameter code.
COMPOUND NAME--IUPAC nomenclature.
COMMON NAME--Common or trade name(s) forconstituent.
MRL--Minimum reporting level.
Analyses of volatile-organic compounds in surface-water samples and ground-water samples (schedule 2020)
Selected surface-water samples and ground-watersamples from New England Coastal Basin National Water-Quality Assessment Program (NECB NAWQA) study siteswere analyzed for volatile organic compounds (VOCs) in1999.The National Water Quality Lab (NWQL) created amethod for accurate determination of VOCs in water in thenanogram per liter range, schedule 2020. The methoddescribed in USGS Open-File Report 97-829 (Connor and
PCode Compound Name/(Common Name)MRL(µg/L)
82660 2,6-Diethylanaline (Metabolite of Alachlor)
0.003
49260 Acetochlor (Harness Plus, Surpass) 0.00246342 Alachlor (Lasso, Bullet) 0.00239632 Atrazine (Atrex, Atred) 0.00182686 Azinphos, Methyl- (Guthion,
Gusathion)0.001
82673 Benfluralin (Benefin, Balan) 0.00204028 Butylate (Genate Plus, Suntan+) 0.00282680 Carbaryl (Sevin, Denapan) 0.00382674 Carbofuran (Furandan, Curaterr) 0.00338933 Chlorpyrifos (Brodan, Dursban) 0.00404041 Cyanazine (Bledex, Fortrol) 0.004
82682 DCPA (Dacthal, Chlorthal-dimethyl) 0.00234653 DDE,p,p- 0.00604040 Deethylatrazine, (Metabolite of
Atrazine)0.002
39572 Diazinon (Basudin, Diazatol) 0.00239381 Dieldrin (Panoram D-31, Octalox) 0.00182677 Disulfoton (Disyston, Frumin AL) 0.01782668 EPTC (Eptam, Farmarox) 0.00282663 Ethalfluralin (Sonalan, Curbit) 0.00482672 Ethoprop (Mocap, Ethoprophos) 0.00304095 Fonofos (Dyfonate, Capfos) 0.00334253 HCH,alpha- (alpha-BHC, alpha-
lindane)0.002
39341 HCH,gamma- (Lindane, gamma-BHC) 0.00482666 Linuron (Lorex, Linex) 0.00239532 Malathion 0.00539415 Metolachlor (Dual, Pennant) 0.00282630 Metribuzin (Lexon, Sencor) 0.00482671 Molinate (Ordram) 0.00482684 Napropamide (Devrinol) 0.00339542 Parathion, Ethyl- (Roethyl-P, Alkron) 0.00482667 Parathion, Methyl- (Penncap-M) 0.00682669 Pebulate (Tillam, PEBL) 0.00482683 Pendimethalin (Prowl, Stomp, Pre-M) 0.00482687 Permethrin,cis- (Ambush, Astro) 0.00582664 Phorate (Thimet, Granutox) 0.00204037 Prometon (Pramitol, Princep) 0.01882676 Pronamide (Kerb) (Propyzamid) 0.00304024 Propachlor (Ramrod, Satecid) 0.00782679 Propanil (Stampede, Stam) 0.00482685 Propargite (Omite, Alkyl sulfite) 0.01304035 Simazine (Princep, Caliber 91) 0.00582670 Tebuthiuron (Spike, Tebusan) 0.01082665 Terbacil (Sinbar) 0.00782675 Terbufos (Counter, Contraven) 0.01382681 Thiobencarb (Bolero, Saturn) 0.00282678 Triallate (Avadex BW, Far-Go) 0.00182661 Trifluralin (Treflan, Gowan) 0.002
PCode Compound Name/(Common Name)MRL(µg/L)
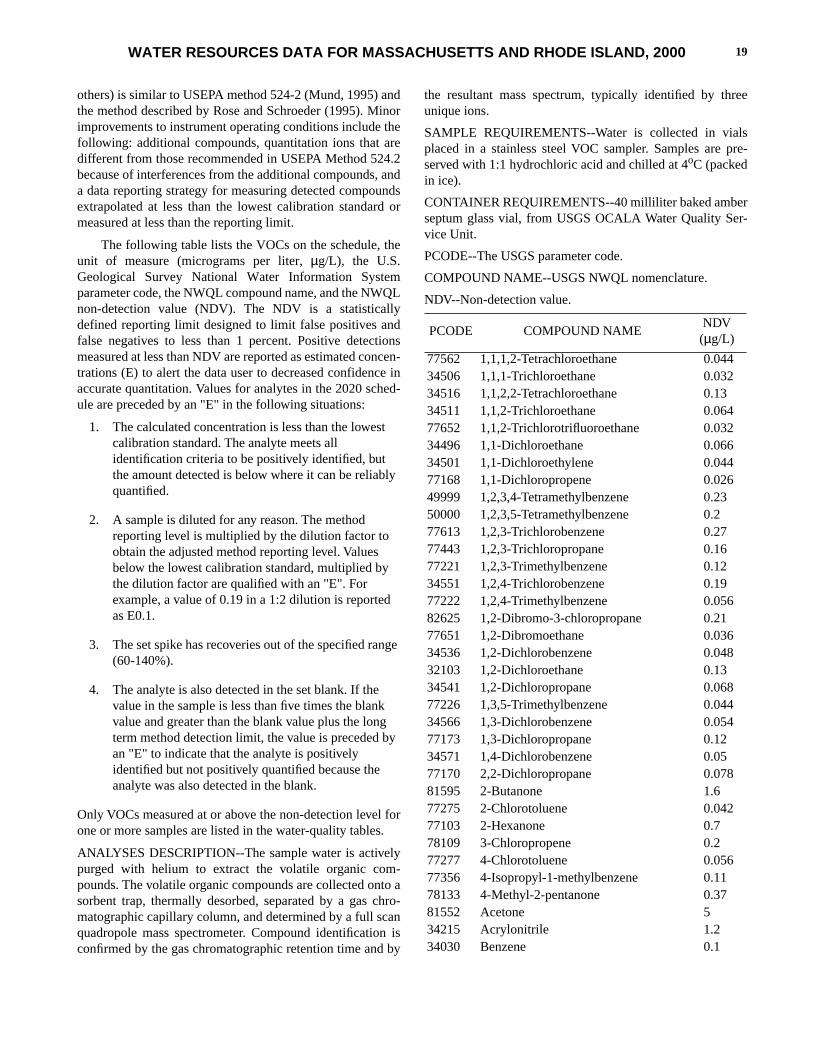
19
WATER RESOURCES DATA FOR MASSACHUSETTS AND RHODE ISLAND, 2000
others) is similar to USEPA method 524-2 (Mund, 1995) andthe method described by Rose and Schroeder (1995). Minorimprovements to instrument operating conditions include thefollowing: additional compounds, quantitation ions that aredifferent from those recommended in USEPA Method 524.2because of interferences from the additional compounds, anda data reporting strategy for measuring detected compoundsextrapolated at less than the lowest calibration standard ormeasured at less than the reporting limit.
The following table lists the VOCs on the schedule, theunit of measure (micrograms per liter, µg/L), the U.S.Geological Survey National Water Information Systemparameter code, the NWQL compound name, and the NWQLnon-detection value (NDV). The NDV is a statisticallydefined reporting limit designed to limit false positives andfalse negatives to less than 1 percent. Positive detectionsmeasured at less than NDV are reported as estimated concen-trations (E) to alert the data user to decreased confidence inaccurate quantitation. Values for analytes in the 2020 sched-ule are preceded by an "E" in the following situations:
1. The calculated concentration is less than the lowest calibration standard. The analyte meets all identification criteria to be positively identified, but the amount detected is below where it can be reliably quantified.
2. A sample is diluted for any reason. The method reporting level is multiplied by the dilution factor to obtain the adjusted method reporting level. Values below the lowest calibration standard, multiplied by the dilution factor are qualified with an "E". For example, a value of 0.19 in a 1:2 dilution is reported as E0.1.
3. The set spike has recoveries out of the specified range (60-140%).
4. The analyte is also detected in the set blank. If the value in the sample is less than five times the blank value and greater than the blank value plus the long term method detection limit, the value is preceded by an "E" to indicate that the analyte is positively identified but not positively quantified because the analyte was also detected in the blank.
Only VOCs measured at or above the non-detection level forone or more samples are listed in the water-quality tables.
ANALYSES DESCRIPTION--The sample water is activelypurged with helium to extract the volatile organic com-pounds. The volatile organic compounds are collected onto asorbent trap, thermally desorbed, separated by a gas chro-matographic capillary column, and determined by a full scanquadropole mass spectrometer. Compound identification isconfirmed by the gas chromatographic retention time and by
the resultant mass spectrum, typically identified by threeunique ions.
SAMPLE REQUIREMENTS--Water is collected in vialsplaced in a stainless steel VOC sampler. Samples are pre-served with 1:1 hydrochloric acid and chilled at 4oC (packedin ice).
CONTAINER REQUIREMENTS--40 milliliter baked amberseptum glass vial, from USGS OCALA Water Quality Ser-vice Unit.
PCODE--The USGS parameter code.
COMPOUND NAME--USGS NWQL nomenclature.
NDV--Non-detection value.
PCODE COMPOUND NAMENDV
(µg/L)
77562 1,1,1,2-Tetrachloroethane 0.04434506 1,1,1-Trichloroethane 0.03234516 1,1,2,2-Tetrachloroethane 0.1334511 1,1,2-Trichloroethane 0.06477652 1,1,2-Trichlorotrifluoroethane 0.03234496 1,1-Dichloroethane 0.06634501 1,1-Dichloroethylene 0.04477168 1,1-Dichloropropene 0.02649999 1,2,3,4-Tetramethylbenzene 0.2350000 1,2,3,5-Tetramethylbenzene 0.277613 1,2,3-Trichlorobenzene 0.2777443 1,2,3-Trichloropropane 0.1677221 1,2,3-Trimethylbenzene 0.1234551 1,2,4-Trichlorobenzene 0.1977222 1,2,4-Trimethylbenzene 0.05682625 1,2-Dibromo-3-chloropropane 0.2177651 1,2-Dibromoethane 0.03634536 1,2-Dichlorobenzene 0.04832103 1,2-Dichloroethane 0.1334541 1,2-Dichloropropane 0.06877226 1,3,5-Trimethylbenzene 0.04434566 1,3-Dichlorobenzene 0.05477173 1,3-Dichloropropane 0.1234571 1,4-Dichlorobenzene 0.0577170 2,2-Dichloropropane 0.07881595 2-Butanone 1.677275 2-Chlorotoluene 0.04277103 2-Hexanone 0.778109 3-Chloropropene 0.277277 4-Chlorotoluene 0.05677356 4-Isopropyl-1-methylbenzene 0.1178133 4-Methyl-2-pentanone 0.3781552 Acetone 534215 Acrylonitrile 1.234030 Benzene 0.1

20
WATER RESOURCES DATA FOR MASSACHUSETTS AND RHODE ISLAND, 2000
Data Presentation
For continuing-record stations, information pertinent tothe history of station operation is provided in descriptiveheadings preceding the tabular data. These descriptive head-ings give details regarding location, drainage area, period ofrecord, type of data available, instrumentation, generalremarks, cooperation, and extremes for parameters currentlymeasured daily. Tables of chemical, physical, biological,radiochemical data, and so forth, obtained at a frequency lessthan daily are presented first. Tables of “daily values” of spe-cific conductance, pH, water temperature, dissolved oxygen,and suspended sediment then follow in sequence.
In the descriptive headings, if the location is identical tothat of the discharge, neither the LOCATION nor theDRAINAGE AREA statements are repeated. The followinginformation, as appropriate, is provided with eachcontinuous-record station. Comments that follow clarifyinformation presented under the various headings of thestation description.
LOCATION--See Data Presentation under “Records of Stageand Water Discharge;” same comments apply.
DRAINAGE AREA--See Data Presentation under “Recordsof Stage and Water Discharge”; same comments apply.
PERIOD OF RECORD--This indicates the periods for whichthere are published water-quality records for the station. Theperiods are shown separately for records of parameters mea-sured daily or continuously and those measured less thandaily. For those measured daily or continuously, periods ofrecord are given for the parameters individually.
INSTRUMENTATION--Information on instrumentation isgiven only if a water-quality monitor temperature record,sediment pumping sampler, or other sampling device is inoperation at a station.
REMARKS--Remarks provide added information pertinentto the collection, analysis, or computation of the records.
COOPERATION--Records provided by a cooperating orga-nization or obtained for the Geological Survey by acooperating organization are identified here.
EXTREMES--Maximums and minimums are given only forparameters measured daily or more frequently. None aregiven for parameters measured weekly or less frequently,because the true maximums or minimums may not have beensampled. Extremes, when given, are provided for both theperiod of record and for the current water year.
81555 Bromobenzene 0.03677297 Bromochloromethane 0.04432101 Bromodichloromethane 0.04832104 Bromoform 0.134413 Bromomethane 0.1577342 Butylbenzene 0.1977041 Carbon disulfide 0.3734301 Chlorobenzene 0.02834311 Chloroethane 0.1232106 Chloroform 0.05234418 Chloromethane 0.2577093 cis-1,2-Dichloroethylene 0.03834704 cis-1,3-Dichloropropene 0.0932105 Dibromochloromethane 0.1830217 Dibromomethane 0.0534668 Dichlorodifluoromethane 0.1434423 Dichloromethane 0.3881576 Diethyl ether 0.1781577 Diisopropyl ether 0.09873570 Ethyl methacrylate 0.2850004 Ethyl tert-butyl ether 0.05434371 Ethylbenzene 0.0339702 Hexachlorobutadiene 0.1434396 Hexachloroethane 0.3677223 Isopropylbenzene 0.03285795 m- and p-Xylene 0.0649991 Methyl acrylate 1.481593 Methyl acrylonitrile 0.5777424 Methyl iodide 0.2181597 Methyl methacrylate 0.3534696 Naphthalene 0.2577220 o-Ethyl toluene 0.177135 o-Xylene 0.0677224 Propylbenzene 0.04277350 sec-Butylbenzene 0.04877128 Styrene 0.04278032 tert-butyl Methyl ether 0.1777353 tert-Butylbenzene 0.150005 tert-Pentyl methyl ether 0.1134475 Tetrachloroethylene 0.132102 Tetrachloromethane 0.08881607 Tetrahydrofuran 934010 Toluene 0.0534546 trans-1,2-Dichloroethylene 0.03234699 trans-1,3-Dichloropropene 0.1373547 trans-1,4-Dichloro-2-butene 0.739180 Trichloroethylene 0.038
PCODE COMPOUND NAMENDV
(µg/L)
34488 Trichlorofluoromethane 0.0950002 Vinyl bromide 0.139175 Vinyl chloride 0.11
PCODE COMPOUND NAMENDV
(µg/L)

21
WATER RESOURCES DATA FOR MASSACHUSETTS AND RHODE ISLAND, 2000
REVISIONS--If errors in published water-quality records arediscovered after publication, appropriate updates are made tothe Water-Quality File in the U.S. Geological Survey’s com-puterized data system, WATSTORE, and subsequently bymonthly transfer of update transactions to the U.S. Environ-mental Protection Agency’s STORET system. Because theusual volume of updates makes it impractical to documentindividual changes in the State data-report series or else-where, potential users of U.S. Geological Survey water-quality data are encouraged to obtain all required data fromthe appropriate computer file to insure the most recentupdates. The surface-water-quality records for partial-recordstations and miscellaneous sampling sites are published inseparate tables following the table of discharge measure-ments at miscellaneous sites. No descriptive statements aregiven for these records. Each station is published with its ownstation number and name in the regular dowstream-ordersequence.
Remark Codes
The following remark codes may appear with the water-quality data in this report:
PrintedOutput Remark
E Estimated value
> Actual value is known to be greater than thevalue shown
< Actual value is known to be less than thevalue shown
K Results based on colony count outside theacceptance range; non-ideal colony count)
L Biological organism count less than 0.5 per-cent (organism may be observed rather thancounted)
D Biological organism count equal to or greaterthan 15 percent (dominant)
& Biological organism estimated as dominant
V Analyte was detected in both the environ-mental sample and the associated blanks.
Water Quality-Control Data
Data generated from quality-control (QC) samples are arequisite for evaluating the quality of the sampling and pro-cessing techniques as well as data from the actual samplesthemselves. Without QC data, environmental sample datacannot be adequately interpreted because the errors associ-ated with the sample data are unknown. The various types ofQC samples collected by this district are described in the fol-lowing section. Procedures have been established for thestorage of water-quality-control data within the USGS. These
procedures allow for storage of all derived QC data and areidentified so that they can be related to corresponding envi-ronmental samples.
Blank Samples
Blank samples are collected and analyzed to ensure thatenvironmental samples have not been contaminated by theoverall data-collection process. The blank solution used todevelop specific types of blank samples is a solution that isfree of the analytes of interest. Any measured value signal ina blank sample for an analyte (a specific component measuredin a chemical analysis) that was absent in the blank solutionis believed to be due to contamination. There are many typesof blank samples possible, each designed to segregate a dif-ferent part of the overall data-collection process. The types ofblank samples collect in this district are:
Field blank—a blank solution that is subjected to allaspects of sample collection, field processing preservation,transportation, and laboratory handling as an environmentalsample.
Trip blank—a blank solution that is put in the same typeof bottle used for an environmental sample and kept with theset of sample bottles before and after sample collection.
Equipment blank—a blank solution that is processedthrough all equipment used for collecting and processing anenvironmental sample (similar to a field blank but normallydone in the more controlled conditions of the office).
Sampler blank—a blank solution that is poured orpumped through the same field sampler used for collecting anenvironmental sample.
Filter blank—a blank solution that is filtered in the samemanner and through the same filter apparatus used for anenvironmental sample.
Splitter blank—a blank solution that is mixed and sepa-rated using a field splitter in the same manner and through thesame apparatus used for an environmental sample.
Preservation blank—a blank solution that is treated withthe sampler preservatives used for an environmental sample.
Reference Samples
Reference material is a solution or material prepared bya laboratory whose composition is certified for one or moreproperties so that it can be used to assess a measurementmethod. Samples of reference material are submitted for anal-ysis to ensure that an analytical method is accurate for theknown properties of the reference material. Generally, theselected reference material properties are similar to theenvironmental sample properties.

22
WATER RESOURCES DATA FOR MASSACHUSETTS AND RHODE ISLAND, 2000
Replicate Samples
Replicate samples are a set of environmental samplescollected in a manner such that the samples are thought to beessentially identical in composition. Replicate is the generalcase for which a duplicate is the special case consisting of twosamples. Replicate samples are collected and analyzed toestablish the amount of variability in the data contributed bysome part of the collection and analytical process. There aremany types of replicate samples possible, each of which mayyield slightly different results in a dynamic hydrologic set-ting, such as a flowing stream. The types of replicate samplescollected in this district are: Sequential samples—a type ofreplicate sample in which the samples are collected one afterthe other, typically over a short time.
Split sample—a type of replicate sample in which asample is split into subsamples contemporaneous in time andspace.
Spike Samples
Spike samples are samples to which known quantities ofa solution with one or more well-established analyte concen-trations have been added. These samples are analyzed todetermine the extent of matrix interference or degradation onthe analyte concentration during sample processing andanalysis.
Records of Ground-Water Levels
Only water-level data from a national network of obser-vation wells are given in this report. These data are intendedto provide a sampling and historical record of water-levelchanges in the Nation’s most important aquifers. Locations ofthe observation wells in this network in Massachusetts andRhode Island are shown in figure 2.
Data Collection and Computation
Measurements of water levels are made in many types ofwells under varying conditions, but the methods of measure-ment are standardized to the extent possible. The equipmentand measuring techniques used at each observation wellensure that measurements at each well are of consistentaccuracy and reliability.
Tables of water-level data are presented by countiesarranged in alphabetical order. The prime identificationnumber for a given well is the 15-digit number that appears inthe upper left corner of the table.
The secondary identification number is the local wellnumber, an alphanumeric number, derived from a two-lettertown code followed by the letter W to specify a well. Water-level records are obtained from direct measurements with achalked steel tape, electric tape, or from digital water-stagerecorder. The water-level measurements in this report aregiven in feet with reference to land-surface datum (lsd).Land-surface datum is a datum plane that is approximately at
land surface at each well. If known, the elevation of the land-surface datum is given in the well description. The height ofthe measuring point (MP) above or below land-surface datumis given in each well description. Water levels in wellsequipped with recording gages are reported daily or for everyfifth day and the end of each month (eom). Water levels arereported to as many significant figures as can be justified bythe local conditions. For example, in a measurement of adepth to water of several hundred feet, the error of determin-ing the absolute value of the total depth to water may be a fewtenths of a foot, whereas the error in determining the netchange of water level between successive measurements maybe only a hundredth or a few hundredths of a foot. For lesserdepths to water, the accuracy is greater. Accordingly, mostmeasurements are reported to a hundredth of a foot, but someare given to a tenth of a foot or a larger unit.
Data Presentation
Each well record consists of three parts, the stationdescription, the data table of water levels observed during thewater year, and the hydrograph showing water-levelfluctuations during the most recent five-year period. Hydro-graphs are based on end-of-month measurements, includingthose wells for which 5-day or more frequent water levels arepublished. The description of the well is presented firstthrough use of descriptive headings preceding the tabulardata. The comments to follow clarify information presentedunder the various headings.
LOCATION--This paragraph follows the well-identificationnumber and reports the latitude and longitude (given indegrees, minutes, and seconds); a landline location designa-tion; the hydrologic-unit number; the distance and directionfrom a geographic point of reference; and the owner’s name.
AQUIFER--This entry designates by name (if a name exists)and geologic age the aquifer(s) open to the well.
WELL CHARACTERISTICS--This entry describes the wellin terms of depth, diameter, casing depth and/or screenedinterval, method of construction, use, and additional informa-tion such as casing breaks, collapsed screen, and otherchanges since construction.
INSTRUMENTATION--This paragraph provides informa-tion on both the frequency of measurement and the collectionmethod used, allowing the user to better evaluate the reportedwater-level extremes by knowing whether they are based onweekly, monthly, or some other frequency of measurement.
DATUM--This entry describes both the measuring point andthe land-surface elevation at the well. The measuring point isdescribed physically (such as top of collar, notch in top ofcasing, plug in pump base, and so on), and in relation to landsurface (such as 1.3 ft above land-surface datum). The eleva-tion of the land-surface datum is described in feet above (orbelow) sea level; it is reported with a precision depending onthe method of determination.
23
WATER RESOURCES DATA FOR MASSACHUSETTS AND RHODE ISLAND, 2000
REMARKS--This entry describes factors that may influencethe water level in a well or the measurement of the waterlevel. It should identify wells that also are water-qualityobservation wells, and may be used to acknowledge theassistance of local (non-Survey) observers.
PERIOD OF RECORD--This entry indicates the period forwhich there are published records for the well. It reports themonth and year of the start of publication of water-levelrecords by the U.S. Geological Survey and the words “to cur-rent year” if the records are to be continued into the followingyear. Periods for which water-level records are available, butare not published by the Geological Survey, may be noted.
EXTREMES FOR PERIOD OF RECORD--This entry con-tains the highest and lowest water levels of the period ofpublished record, with respect to land-surface datum, and thedates of their occurrence. A table of water levels follows thestation description for each well. Water levels are reported infeet below land-surface datum. For most wells all taped mea-surements of water level are published. For wells equippedwith digital recorders, tables of daily mean water levels andthe means, highs, and lows for each month are published.Abbreviated tables are published for wells.
ACCESS TO USGS WATER DATA
The USGS provides near real-time stage and dischargedata for many of the gaging stations equipped with the neces-sary telemetry and historic daily-mean and peak-flow dis-charge data for most current or discontinued gaging stationsthrough the world wide web (WWW). These data may beaccessed at
http://water.usgs.gov
Some water-quality and ground-water data also are availablethrough the WWW. In addition, data can be provided invarious machine-readable formats on magnetic tape or 3-1/2inch floppy disk. Information about the availability of specifictypes of data or products, and user charges, can be obtainedlocally from each of the Water Resources Division DistrictOffices (See address on the back of the title page.)
DEFINITION OF TERMS
Terms related to streamflow, water-quality, and otherhydrologic data, as used in this report, are defined below. Seealso table for converting English units to International System(SI) Units on the inside of the back cover.
Acre-foot (AC-FT, acre-ft) is the quantity of waterrequired to cover 1 acre to a depth of 1 foot and is equivalentto 43,560 ft3 or about 326,000 gallons or 1,233 m3.
Adenosine triphosphate (ATP) is an organic,phosphate-rich, compound important in the transfer of energyin organisms. Its central role in living cells makes it an excel-
lent indicator of the presence of living material in water. Ameasure of ATP therefore provides a sensitive and rapidestimate of biomass. ATP is reported in micrograms per literof the original water sample.
Algae are mostly aquatic single-celled, colonial, or mul-ticelled plants, containing chlorophyll and lacking roots,stems, and leaves.
Algal growth potential (AGP) is the maximum algal dryweight biomass that can be produced in a natural water sam-ple under standardized laboratory conditions. The growthpotential is the algal biomass present at stationary phase andis expressed as milligrams dry weight of algae produced perliter of sample.
Alkalinity is the capacity of solutes in an aqueous sys-tem to neutralize acid. This term designates titration of a“filtered” sample.
Annual runoff is the total quantity of water in runoff fora drainage area for the year. Data reports may use any of thefollowing units of measurement in presenting annual runoffdata:
Acre-foot (AC-FT, acre-ft) is the quantity of waterrequired to cover 1 acre to a depth of 1 foot and is equal to43,560 cubic feet, 325,851 gallons, or 1,233 cubic meters
Cubic foot per second per square mile [CFSM,(ft3/s)/mi2] is the average number of cubic feet of water flow-ing per second from each square mile of area drained,assuming the runoff is distributed uniformly in time and area.
Inch (IN., in.) as used in this report, refers to thedepth to which the drainage area would be covered with waterif all of the runoff for a given time period were uniformly dis-tributed on it.
Aquifer is a geologic formation, group of formations, orpart of a formation that contains sufficient saturated perme-able material to yield significant quantities of water to wellsand springs.
Artesian means confined and is used to describe a wellin which the water level stands above the top of the aquifertapped by the well. A flowing artesian well is one in which thewater level is above the land surface.
Bacteria are microscopic unicellular organisms,typically spherical, rodlike, or spiral and threadlike in shape,often clumped into colonies. Some bacteria cause disease,while others perform an essential role in nature in therecycling of materials; for example, by decomposing organicmatter into a form available for reuse by plants.
Total coliform bacteria are a particular groupof bacteria that are used as indicators of possible sewagepollution. They are characterized as aerobic or facultative

24
WATER RESOURCES DATA FOR MASSACHUSETTS AND RHODE ISLAND, 2000
anaerobic, gram-negative, nonspore-forming, rod-shapedbacteria which ferment lactose with gas formation within 48hours at 35˚. In the laboratory these bacteria are defined as allthe organisms that produce colonies with a golden-greenmetallic sheen within 24 hours when incubated at 35˚ plus orminus l.0˚ on M-Endo medium (nutrient medium for bacterialgrowth). Their concentrations are expressed as number of col-onies per 100 mL of sample.
Fecal coliform bacteria are bacteria that are presentin the intestine or feces of warm-blooded animals. They areoften used as indicators of the sanitary quality of the water. Inthe laboratory they are defined as all organisms that produceblue colonies within 24 hours when incubated at 44.5˚ plus orminus 0.2˚ on M-F˚ medium (nutrient medium for bacterialgrowth). Their concentrations are expressed as number of col-onies per 100 mL of sample.
Fecal streptococcal bacteria are bacteria found alsoin the intestine of warm-blooded animals. Their presence inwater is considered to verify fecal pollution. They are charac-terized as gram-positive, cocci bacteria which are capable ofgrowth in brain-heart infusion broth. In the laboratory theyare defined as all the organisms which produce red or pinkcolonies within 48 hours at 35˚ plus or minus 1.0˚ on KF-streptococcus medium (nutrient medium for bacterialgrowth). Their concentrations are expressed as number of col-onies per 100 mL of sample.
Escherichia coli (E. coli) are bacteria present in theintestine and feces of warm-blooded animals. E. coli are amember species of the fecal coliform group of indicator bac-teria. In the laboratory, they are defined as those bacteria thatproduce yellow or yellow-brown colonies on a filter pad sat-urated with urea substrate broth after primary culturing for 22to 24 hours at 44.5˚C on mTEC medium. Their concentra-tions are expressed as number of colonies per 100 mL ofsample.
Base flow is flow in a channel sustained by ground-waterdischarge in the absence of direct runoff.
Bed material is the sediment mixture of which a stre-ambed, lake, pond, reservoir, or estuary bottom is composed.
Benthic organisms (invertebrates) are the group of ani-mals inhabiting the bottom of an aquatic environment. They include a number of types of organisms, such as bacteria, fungi, insect larvae and nymphs, snails, clams, and crayfish. They are useful as indicators of water quality.
Biochemical oxygen demand (BOD) is a measure of thequantity of dissolved oxygen, in milligrams per liter, neces-sary for the decomposition of organic matter by micro-organisms, such as bacteria.
Biomass is the amount of living matter present at anygiven time, expressed as the mass per unit area or volume ofhabitat.
Ash mass is the mass or amount of residue presentafter the residue from the dry mass determination has beenashed in a muffle furnace at a temperature of 500˚ for 1 hour.The ash mass values of zooplankton and phytoplankton areexpressed in grams per cubic meter, and periphyton andbenthic organisms in grams per square mile.
Dry mass refers to the mass of residue present afterdrying in an oven at 105˚ for zooplankton and periphyton,until the mass remains unchanged. This mass represents thetotal organic matter, ash and sediment, in the sample. Dry-mass values are expressed in the same units as ash mass.
Organic mass or volatile mass of the living sub-stance is the difference between the dry mass and ash massand represents the actual mass of the living matter. Theorganic mass is expressed in the same units as for ash massand dry mass.
Wet mass is the mass of living matter plus containedwater.
Biomass pigment ratio is an indicator of the total pro-portion of periphyton which are autotrophic (plants). This isalso called the Autotrophic Index.
Bottom material: See “Bed material.”
Cells/volume refers to the number of cells of any organ-ism which is counted by using a microscope and grid orcounting cell. Many planktonic organisms are multicelled andare counted according to the number of contained cells persample, usually milliliters or liters.
Chemical oxygen demand (COD) is a measure of thechemically oxidizable material in the water and furnishes anapproximation of the amount of organic and reducing mate-rial present. The determined value may correlate with naturalwater color or with carbonaceous organic pollution from sew-age or industrial wastes.
Chlorophyll refers to the green pigments of plants.Chlorophyll a and b are the two most common green pig-ments in plants.
Color unit is produced by 1 milligram per liter of plati-num in the form of the chloroplatinate ion. Color is expressedin units of the platinum-cobalt scale.
Confined aquifer is a term used to describe an aquifercontaining water between two relatively impermeable bound-aries. The water level in a well tapping a confined aquiferstands above the top of the confined aquifer and can be higher

25WATER RESOURCES DATA FOR MASSACHUSETTS AND RHODE ISLAND, 2000
or lower than the water table that may be present in thematerial above it. In some cases the water level can rise abovethe ground surface, yielding a flowing well.
Contents is the volume of water in a reservoir or lake.Unless otherwise indicated, volume is computed on the basisof a level pool and does not include bank storage.
Continuous-record station is a site that meets either ofthe following conditions:
1. Stage or streamflow are recorded at some interval on a continuous basis. The recording interval is usually 15 minutes, but may be less or more frequent.
2. Water-quality, sediment, or other hydrologic mea-sure-ments are recorded at least daily.
Control designates a feature downstream from the gagethat determines the stage-discharge relation at the gage. Thisfeature may be a natural constriction of the channel, an artifi-cial structure, or a uniform cross section over a long reach ofthe channel.
Control structure as used in this report is a structure ona stream or canal that is used to regulate the flow or stage ofthe stream or to prevent the intrusion of salt water.
Cubic foot per second (ft3/s) is the rate of discharge rep-resenting a volume of 1 ft3 passing a given point during 1second and is equivalent to 7.48 gal/s or 448.8 gal/min or0.02832 m3/s.
Cubic foot per second-day (CFS-DAY, Cfs-day,[(ft3/s)/d]) is the volume of water represented by a flow of1 cubic foot per second for 24 hours. It is equivalent to 86,400cubic feet, 1.9835 acre-feet, 646,317 gallons, or 2,447 cubicmeters.
Cubic foot per second per square mile [(ft3/s)/mi2]is the average number of cubic feet of water flowing per sec-ond from each square mile of area drained, assuming that therunoff is distributed uniformly in time and area.
Daily record is a summary of streamflow, sediment, orwater-quality values computed from data collected with suf-ficient frequency to obtain reliable estimates of daily meanvalues.
Daily record station is a site for which daily records ofstreamflow, sediment, or water-quality values are computed.
Datum, as used in this report, is an elevation above meansea level to which all gage height readings are referenced.
Discharge is the volume of water (or more broadly, vol-ume of fluid plus suspended sediment) that passes a givenpoint within a given period of time.
Mean discharge (MEAN) is the arithmetic mean ofindividual daily mean discharges during a specific period.
Instantaneous discharge is the discharge at a partic-ular instant of time.
Annual 7-day minimum is the lowest mean dis-charge for 7 consecutive days for a calendar year or a wateryear. Note that most low-flow frequency analyses of annual 7-day minimum flows use a climatic year (April 1-March 31).The date shown in the summary statistics table is the initialdate of the 7-day period. (This value should not be confusedwith the 7-day 10-year low-flow statistic.)
Dissolved refers to that material in a representative watersample which passes through a 0.45-mm membrane filter.This is a convenient operational definition used by Federalagencies that collect water data. Determinations of “dis-solved” constituents are made on subsamples of the filtrate.
Dissolved oxygen (DO) content of water in equilibriumwith air is a function of atmospheric pressure, temperature,and dissolved-solids concentration of the water. The ability ofwater to retain oxygen decreases with increasing temperatureor dissolved solids, with small temperature changes havingthe more significant offset. Photosynthesis and respirationmay cause diurnal variations in dissolved-oxygen concentra-tion in water from some streams.
Dissolved-solids concentration of water is determinedeither analytically by the “residue-on-evaporation” method,or mathematically by totaling the concentrations of individualconstituents reported in a comprehensive chemical analysis.During the analytical determination of dissolved solids, thebicarbonate (generally a major dissolved component ofwater) is converted to carbonate. Therefore, in the mathemat-ical calculation of dissolved-solids concentration, thebicarbonate value, in milligrams per liter, is multiplied by0.492 to reflect the change.
Drainage area of a stream at a specified location is thatarea, measured in a horizontal plane, enclosed by a topo-graphic divide from which direct surface runoff fromprecipitation normally drains by gravity into the stream abovethe specified point. Figures of drainage area given hereininclude all closed basins, or noncontributing areas, within thearea unless otherwise specified.
Drainage basin is a part of the surface of the earth thatis occupied by a drainage system, which consists of a surfacestream or a body of impounded surface water together with alltributary surface streams and bodies of impounded surfacewater.

26 WATER RESOURCES DATA FOR MASSACHUSETTS AND RHODE ISLAND, 2000
Gage datum is the elevation of the zero point of the ref-erence gage from which gage height is determined ascompared to sea level (see “Datum”). This elevation is estab-lished by a system of levels from known benchmarks, byapproximation from topographic maps, or by geographicalpositioning system.
Gage height (G.H.) is the water-surface elevationreferred to some arbitrary gage datum. Gage height is oftenused interchangeably with the more general term “stage,”although gage height is more appropriate when used with areading on a gage.
Gaging station is a particular site on a stream, canal,lake, or reservoir where systematic observations of hydro-logic data are obtained.
Gas chromatography/flame ionization detector(GC/FID) is a laboratory analytical method used as a screen-ing technique for semivolatile organic compounds that areextractable from water in methylene chloride.
Ground-water level is the elevation of the water table oranother potentiometric surface at a particular location.
Hardness of water is a physical-chemical characteristicthat is commonly recognized by the increased quantity ofsoap required to produce lather. It is computed as the sum ofequivalents of polyvalent cations and is expressed as theequivalent concentration of calcium carbonate (CaCO3).
High tide is the maximum height reached by each risingtide. The high-high and low-high tides are the higher andlower of the two high tides, respectively, of each tidal day.See NOAA web site: http://www.co-ops.nos.noaa.gov/tideglos.html
Hydrologic benchmark station is one that provideshydrologic data for a basin in which the hydrologic regimenwill likely be governed solely by natural conditions. Data col-lected at a benchmark station may be used to separate effectsof natural from human-induced changes in other basins thathave been developed and in which the physiography, climate,and geology are similar to those in the undeveloped bench-mark basin.
Hydrologic unit is a geographic area representing partor all of a surface drainage basin or distinct hydrologic featureas delineated by the Office of Water Data Coordination on theState Hydrologic Unit Maps; each hydrologic unit is identi-fied by an eight-digit number.
Land-surface datum (lsd) is a datum plane that isapproximately at land surface at each ground-water observa-tion well.
Low tide is the minimum height reached by each fallingtide. The high-low and low-low tides are the higher and lowerof the two low tides, respectively, of each tidal day. See NOAAweb site: http://www.co-ops.nos.noaa.gov/tideglos.html
Macrophytes are the macroscopic plants in the aquaticenvironment. The most common macrophytes are the rootedvascular plants that are usually arranged in zones in aquaticecosystems and restricted in the area by the extent of illumi-nation through the water and sediment deposition along theshoreline.
Measuring point (MP) is an arbitrary permanent refer-ence point from which the distance to the water surface in awell is measured to obtain the water level.
Membrane filter is a thin microporous material of spe-cific pore size used to filter bacteria, algae, and other verysmall particles from water.
Metamorphic stage refers to the stage of developmentthat an organism exhibits during its transformation from animmature form to an adult form. This developmental processexists for most insects, and the degree of difference from theimmature stage to the adult form varies from relatively slightto pronounced, with many intermediates. Examples of meta-morphic stages of insects are egg-larva-adult or egg-nymph-adult.
Methylene blue active substances (MBAS) are appar-ent detergents. The determination depends on the formationof a blue color when methylene blue dye reacts with syntheticanionic detergent compounds.
Micrograms per gram (µg/g) is a unit expressing theconcentration of a chemical constituent as the mass (micro-grams) of the element per unit mass (gram) of materialanalyzed.
Micrograms per kilogram (UG/KG, µg/kg) is a unitexpressing the concentration of a chemical constituent as themass (micrograms) of the constituent per unit mass (kilo-gram) of the material analyzed. One microgram per kilogramis equivalent to 1 part per billion.
Micrograms per liter (µg/L) is a unit expressing theconcentration of chemical constituents in solution as mass(micrograms) of solute per unit volume (liter) of water. Onethousand micrograms per liter is equivalent to one milligramper liter.
Microsiemens per centimeter (US/CM, µS/cm) is aunit expressing the amount of electrical conductivity of asolution as measured between opposite faces of a centimeter

27WATER RESOURCES DATA FOR MASSACHUSETTS AND RHODE ISLAND, 2000
cube of solution at a specified temperature. Siemens is theInternational System of Units nomenclature. It is synony-mous with mhos and is the reciprocal of resistance in ohms.
Milligrams per liter (mg/L) is a unit for expressing theconcentration of chemical constituents in solution. Milli-grams per liter represents the mass of solute per unit volume(liter) of water. Concentration of suspended sediment also isexpressed in milligrams per liter and is based on the mass ofdry sediment per liter of water-sediment mixture.
Miscellaneous site, or miscellaneous station, is a sitewhere streamflow, sediment, and/or water-quality data arecollected once, or more often on a random or discontinuousbasis.
Multiple-plate samplers are artificial substrates ofknown surface area used for obtaining benthic invertebratesamples. They consist of a series of spaced, hardboard plateson an eyebolt.
National Geodetic Vertical Datum of 1929 (NGVD of1929), is a geodetic datum derived from a general adjustmentof the first order level nets of both the United States and Can-ada. It was formerly called “Sea Level Datum of 1929” or“mean sea level” in this series of reports. Although the datumwas derived from the average sea level over a period of manyyears at 26 tide stations along the Atlantic, Gulf of Mexico,and Pacific Coasts, it does not necessarily represent localmean sea level at any particular place.
National Stream Quality Accounting Network(NASQAN), is a nationwide data-collection networkdesigned by the U.S. Geological Survey to meet many of theinformation needs of government agencies and other groupsinvolved in natural or regional water-quality planning andmanagement. The 500 or so sites in NASQAN are generallylocated at the downstream ends of hydrologic accountingunits designated by the U.S. Geological Survey Office ofWater Data Coordination in consultation with the WaterResources Council. The objectives of NASQAN are (1) toobtain information on the quality and quantity of water mov-ing within and from the United States through a systematicand uniform process of data collection, summarization, anal-ysis, and reporting such that the data may be used for,(2) description of the areal variability of water quality in theNation’s rivers through analysis of data from this and otherprograms, (3) detection of changes or trends with time in thepattern of occurrence of water-quality characteristics, and(4) providing a nationally consistent data base useful forwater-quality assessment and hydrologic research.
National Trends Network (NTN) is a 150-station net-work for sampling atmospheric deposition in the UnitedStates. The purpose of the network is to determine the vari-ability, both in location and in time, of the composition ofatmospheric deposition, which includes snow, rain, dust-particles, aerosols, and gases. The core from which the NTNwas built was the already-existing deposition-monitoring net-work of the National Atmospheric Deposition Program.
The National Water Quality Assessment (NAWQA)Program of the U.S.Geological Survey is a long-term pro-gram with goals to describe the status and trends of water-quality conditions for a large, diverse and geographically dis-tributed part of the Nation’s ground- and surface-waterresources, and to identify, describe and explain the major nat-ural and human factors that affect these observed conditionsand trends.
Assessment activities have begun in more than one-thirdof the study units and ultimately will be conducted in 60 studyunits (major watersheds and aquifer systems) that represent awide range of environmental settings nationwide and thataccount for a large percentage of the Nation’s water use. Awide array of chemical constituents will be measured inground water, surface water, streambed sediments and fishtissues. The coordinated application of comparative hydro-logic studies at a wide range of spatial and temporal scaleswill provide information for decision making by water-resources managers and a foundation for aggregation andcomparison of findings to address water-quality issues ofregional and national interest.
Nephelometric turbidity unit (NTU) is the measure-ment for reporting turbidity that is based on use of a standardsuspension of Formazin. Turbidity measured in NTU usesnephelometric methods that depend on passing specific lightof a specific wavelength through the sample.
Open or screened interval is the length of unscreenedopening or of well screen through which water enters a well,in feet below land surface.
Organic carbon (OC) is a measure of organic matterpresent in aqueous solution, suspension, or bottom sediments.May be reported as dissolved organic carbon (DOC), sus-pended organic carbon (SOC), or total organic carbon (TOC).
Organism count/area refers to the number of organismscollected and enumerated in a sample and adjusted to thenumber per area habitat, usually square meter (m2), acre, orhectare. Periphyton, benthic organisms, and macrophytes areexpressed in these terms.

28 WATER RESOURCES DATA FOR MASSACHUSETTS AND RHODE ISLAND, 2000
Organism count/volume refers to the number of organ-isms collected and enumerated in a sample and adjusted to thenumber per sample volume, usually milliliter or liter. Num-bers of planktonic organisms can be expressed in these terms.
Total organism count is the total number of organ-isms collected and enumerated in any particular sample.
Organochlorine compounds are any chemicals thatcontain carbon and chlorine. Organochlorine compounds thatare important in investigations of water, sediment, and bio-logical quality include certain pesticides and industrialcompounds.
Parameter Code is a 5-digit number used in the Sur-vey’s computerized data system, WATSTORE, to uniquelyidentify a specific constituent. The codes used in WAT-STORE are the same as those used in the U.S. EnvironmentalProtection Agency data system, STORET. The Environmen-tal Protection Agency assigns and approves all requests fornew codes.
Partial-record station is a particular site where limitedstreamflow and (or) water-quality data are collected system-atically over a period of years for use in hydrologic analyses.
Particle size is the diameter, in millimeters, of a particledetermined by either sieve or sedimentation methods. Sedi-mentation methods (pipet, bottom-withdrawal tube, visual-accumulation tube) determine fall diameter of particles ineither distilled water (chemically dispersed) or in native water(the river water at the time and point of sampling).
Particle-size classification used in this report agreeswith the recommendations made by the American Geophysi-cal Union Subcommittee on Sediment Terminology. Theclassification is as follows:
Classification Size (mm) Method of analysis
Clay 0.00024–0.004 SedimentationSilt 0.004–0.062 SedimentationSand 0.062–2.0 Sedimentation or sieveGravel 2.0–64.0 Sieve
The particle-size distributions given in this report are notnecessarily representative of all particles in transport in thestream. Most of the organic matter is removed, and thesample is subjected to mechanical and chemical dispersionbefore analysis in distilled water. Chemical dispersion is notused for native-water analysis.
Percent composition is a unit for expressing the ratio ofa particular part of a sample or population to the total sampleor population, in terms of types, numbers, mass, or volume.
Periodic station is a site where stage, discharge, sedi-ment, chemical, or other hydrologic measurements are madeone or more times during a year, but at a frequency insuffi-cient to develop a daily record.
Periphyton is the assemblage of microorganismsattached to and living upon submerged solid surfaces. Whileprimarily consisting of algae, they also include bacteria,fungi, protozoa, rotifers, and other small organisms.
Pesticides are chemical compounds used to controlundesirable organisms. Major categories of pesticides includeinsecticides, miticides, fungicides, herbicides, androdenticides.
pH of water is the negative logarithm of the hydrogen-ion activity. Solutions with pH less than 7 are termed “acidic,”and solutions with a pH greater than 7 are termed “basic.”Solutions with a pH of 7 are neutral. The presence and con-centration of many dissolved chemical constituents found inwater are, in part, influenced by the hydrogen-ion activity ofwater. Biological processes including growth, distribution oforganisms, and toxicity of the water to organisms are alsoinfluenced, in part, by the hydrogen-ion activity of water.
Picocurie (PC, pCi) is one trillionth (1 × l0 -12) of theamount of radioactivity represented by a curie (Ci). A curie isthe amount of radioactivity that yields 3.7 × 10¹⁰ radioactivedisintegrations per second. A picocurie yields 2.22 dpm (dis-integrations per minute).
Plankton is the community of suspended, floating, orweakly swimming organisms that live in the open water oflakes and rivers.
Phytoplankton is the plant part of the plankton.They are usually microscopic and their movement is subjectto the water currents. Phytoplankton growth is dependentupon solar radiation and nutrient substances. Because theyare able to incorporate as well as release materials to the sur-rounding water, the phytoplankton have a profound effectupon the quality of the water. They are the primary food pro-ducers in the aquatic environment and are commonly knownas algae.
Blue-green algae are a group of phytoplanktonorganisms having a blue pigment, in addition to the green pig-ment called chlorophyll. Blue-green algae often causenuisance conditions in water.
Diatoms are the unicellular or colonial algae hav-ing a siliceous shell. Their concentrations are expressed asnumber of cells per milliliter of sample.
Green algae have chlorophyll pigments similar incolor to those of higher green plants. Some forms producealgae mats or floating “moss” in lakes. Their concentrationsare expressed as number of cells per milliliter of sample.
Zooplankton is the animal part of the plankton.Zooplankton are capable of extensive movements within thewater column and are often large enough to be seen with theunaided eye. Zooplankton are secondary consumers feeding

29WATER RESOURCES DATA FOR MASSACHUSETTS AND RHODE ISLAND, 2000
upon bacteria, phytoplankton, and detritus. Because they arethe grazers in the aquatic environment, the zooplankton are avital part of the aquatic food web. The zooplankton commu-nity is dominated by small crustaceans and rotifers.
Polychlorinated biphenyls (PCB’s) are industrialchemicals that are mixtures of chlorinated biphenyl com-pounds having various percentages of chlorine. They aresimilar in structure to organochlorine insecticides.
Polychlorinated naphthalenes (PCN’s) are industrialchemicals that are mixtures of chlorinated naphthalene com-pounds. They have properties and applications similar topolychlorinated biphenyls (PCB’s) and have been identifiedin commercial PCB preparations.
Precipitation is falling products of condensation in theatmosphere as rain, snow, sleet, and hail.
Primary productivity is a measure of the rate at whichnew organic matter is formed and accumulated throughphotosynthetic and chemosynthetic activity of producerorganisms (chiefly, green plants). The rate of primaryproduction is estimated by measuring the amount of oxygenreleased (oxygen method) or the amount of carbon assimi-lated by the plants (carbon method).
Primary productivity (carbon method) isexpressed as milligrams of carbon per area per unit time[mg C/(m2/time)] for periphyton and macrophytes or per vol-ume [mg C/(m3/time)] for phytoplankton. Carbon methoddefines the amount of carbon dioxide consumed as measuredby radioactive carbon (carbon-14). The carbon-14 method isof greater sensitivity than the oxygen light and dark bottlemethod and is preferred for use in unenriched waters. Unittime may be either the hour or day, depending on the incuba-tion period.
Primary productivity (oxygen method) isexpressed as milligrams of oxygen per area per unit time[mg O/(m2/time)] for periphyton and macrophytes or per vol-ume [mg O/(m3/time)] for phytoplankton. Oxygen methoddefines production and respiration rates as estimated fromchanges in the measured dissolved-oxygen concentration.The oxygen light and dark bottle method is preferred if therate of primary production is sufficient for accurate measure-ments to be made within 24 hours. Unit time may be either thehour or day, depending on the incubation period.
Radiochemical program is a network of regularly sam-pled water-quality stations where samples are collected to beanalyzed for radioisotopes. The streams that are sampled rep-resent major drainage basins in the conterminous UnitedStates.
Radioisotopes are isotopic forms of an element thatexhibit radioactivity. Isotopes are varieties of a chemical ele-ment that differ in atomic weight, but are very nearly alike inchemical properties. The difference arises because the atomsof the isotopic forms of an element differ in the number ofneutrons in the nucleus; for example, ordinary chlorine is amixture of isotopes having atomic weights of 35 and 37, andthe natural mixture has an atomic weight of about 35.453.Many of the elements similarly exist as mixtures of isotopes,and a great many new isotopes have been produced in theoperation of nuclear devices such as the cyclotron. There are275 isotopes of the 81 stable elements, in addition to morethan 800 radioactive isotopes.
Recoverable from bottom material is the amount of agiven constituent that is in solution after a representative sam-ple of bottom material has been digested by a method (usuallyusing an acid or mixture of acids) that results in dissolution ofreadily soluble substances. Complete dissolution of allbottom material is not achieved by the digestion treatmentand thus the determination represents less than the totalamount (that is, less than 95 percent) of the constituent in thesample. To achieve comparability of analytical data, equiva-lent digestion procedures would be required of alllaboratories performing such analyses because differentdigestion procedures are likely to produce different analyticalresults.
Recurrence interval, also referred to as return period, isthe average time, usually expressed in years, between occur-rences of hydrologic events of a specified type (such asexceedances of a specified high flow or non-exceedance of aspecified low flow). The terms “return period” and “recur-rence interval” do not imply regular cyclic occurrence. Theactual times between occurrences vary randomly, with mostof the times being less than the average and a few being sub-stantially greater than the average. For example, the 100-yearflood is the flow rate that is exceeded by the annual maximumpeak flow at intervals whose average length is 100 years (thatis, once in 100 years, on average); almost two-thirds of allexceedances of the 100-year flood occur less than 100 yearsafter the previous exceedance, half occur less than 70 yearsafter the previous exceedance, and about one-eighth occurmore than 200 years after the previous exceedance. Similarly,the 7-day 10-year low flow (7Q10) is the flow rate belowwhich the annual minimum 7-day-mean flow dips at intervalswhose average length is 10 years (that is, once in 10 years, onaverage); almost two-thirds of the non-exceedances of the7Q10 occur less than 10 years after the previous non-exceed-ance, half occur less than 7 years after, and about one-eighthoccur more than 20 years after the previous non-exceedance.The recurrence interval for annual events is the reciprocal of

30 WATER RESOURCES DATA FOR MASSACHUSETTS AND RHODE ISLAND, 2000
the annual probability of occurrence. Thus, the 100-yearflood has a 1-percent chance of being exceeded by the maxi-mum peak flow in any year, and there is a 10-percent chancein any year that the annual minimum 7-day-mean flow will beless than the 7Q10.
Return period is the average time interval betweenoccurrences of a hydrological event of a given or greater mag-nitude, usually expressed in years. May also be calledrecurrence interval.
River mile is the distance of a point on a river measuredin miles from the river’s mouth along the low-water channel.
River mileage is the linear distance along the meander-ing path of a stream channel determined in accordance withBulletin No. 14 (October 1968) of the Water ResourcesCouncil.
Runoff in inches (IN., in.) shows the depth to which thedrainage area would be covered if all the runoff for a giventime period were uniformly distributed on it.
Sea Level: In this report “sea level” refers to the NationalGeodetic Vertical Datum of 1929 (NGVD)--a geodetic datumderived from a general adjustment of the first-order level netsof the United States and Canada, formerly called Sea LevelDatum of 1929.
Sediment is solid material that originates mostly fromdisintegrated rocks and is transported by, suspended in, ordeposited from water; it includes chemical and biochemicalprecipitates and decomposed organic material, such ashumus. The quantity, characteristics, and cause of the occur-rence of sediment in streams are influenced by environmentalfactors. Some major factors are degree of slope, length ofslope, soil characteristics, land usage, and quantity and inten-sity of precipitation.
Bed load is the sediment that is transported in astream by rolling, sliding, or skipping along the bed and veryclose to it. In this report, bed load is considered to consist ofparticles in transit within 0.25 ft of the streambed.
Bed load discharge (tons per day) is the quantity ofbed load measured by dry weight that moves past a section asbed load in a given time.
Suspended sediment is the sediment that at anygiven time is maintained in suspension by the upward compo-nents of turbulent currents or that exists in suspension as acolloid.
Mean concentration (sediment), is the time-weighted concentration of suspended sediment passing astream section during a 24-hour day.
Suspended-sediment concentration is the velocity-weighted concentration of suspended sediment in the sam-pled zone (from the water surface to a point approximately0.3 ft above the bed) expressed as milligrams of dry sedimentper liter of water-sediment mixture (mg/L). The entire sampleis used for the analysis.
Suspended-sediment discharge (tons/day) is therate at which dry mass of sediment passes a section of astream or is the quantity of sediment, as measured by drymass or volume, that passes a section in a given time. It is cal-culated in units of tons per day as follows: concentration(mg/L) × discharge (ft3/s) × 0.0027.
Suspended-sediment load is a general term thatrefers to material in suspension. It is not synonymous witheither discharge or concentration.
Total sediment discharge (tons/day) is the sum ofthe suspended-sediment discharge and the bed-loaddischarge. It is the total quantity of sediment, as measured bydry mass or volume, that passes a section during a given time.
Total sediment load or total load is a term thatrefers to the total sediment (bed load plus suspended-sedi-ment load) that is in transport. The term needs to be qualified,such as “annual suspended-sediment load” or “sand-size sus-pended-sediment load,” and so on. It is not synonymous withtotal sediment discharge.
7-day 10-year low flow (7Q10) is the discharge at the10-year recurrence interval taken from a frequency curve ofannual values of the lowest mean discharge for 7 consecutivedays (the 7-day low flow).
Sodium-adsorption-ratio (SAR) is the expression ofrelative activity of sodium ions in exchange reactions withinsoil and is an index of sodium or alkali hazard to the soil.Waters range in respect to sodium hazard from those whichcan be used for irrigation on almost all soils to those whichare generally unsatisfactory for irrigation.
Solute is any substance that is dissolved in water.
Specific conductance is a measure of the ability of awater to conduct an electrical current. It is expressed inmicrosiemens per centimeter at 25˚. Specific conductance isrelated to the type and concentration of ions in solution andcan be used for approximating the dissolved-solids content ofthe water. Commonly, the concentration of dissolved solids(in milligrams per liter) is about 65 percent of the specificconductance (in microsiemens). This relation is not constantfrom stream to stream, and it may vary in the same sourcewith changes in the composition of the water.
Stable isotope ratio (per MILL/MIL) is a unit express-ing the ratio of the abundance of two radioactive isotopes.Isotope ratios are used in hydrologic studies to determine the

31WATER RESOURCES DATA FOR MASSACHUSETTS AND RHODE ISLAND, 2000
age or source of specific waters, to evaluate mixing of differ-ent waters, as an aid in determining reaction rates, and otherchemical or hydrologic processes.
Stage-discharge relation is the relation between gageheight (stage) and volume of water, per unit of time, flowingin a channel.
Streamflow is the discharge that occurs in a naturalchannel. Although the term “discharge” can be applied to theflow of a canal, the word “streamflow” uniquely describes thedischarge in a surface stream course. The term “streamflow”is more general than “runoff” as streamflow may be appliedto discharge whether or not it is affected by diversion orregulation.
Substrate is the physical surface upon which an organ-ism lives
Natural substrate refers to any naturally occurringimmersed or submersed solid surface, such as a rock or tree,upon which an organism lives.
Artificial substrate is a device which is purposelyplaced in a stream or lake for colonization of organisms. Theartificial substrate simplifies the community structure bystandardizing the substrate from which each sample is taken.Examples of artificial substrates are basket samplers (made ofwire cages filled with clean streamside rocks) and multiplatesamplers (made of hardboard) for benthic organism collec-tion, and plexiglass strips for periphyton collection.
Surface area of a lake is that area outlined on the latestSurvey topographic map as the boundary of the lake and mea-sured by a planimeter in acres. In localities not covered bytopographic maps, the areas are computed from the best mapsavailable at the time planimetered. All areas shown are thosefor the stage when the planimetered map was made.
Surficial bed material is the part (0.1 to 0.2 ft) of thebed material that is sampled using U.S. Series Bed-MaterialSamplers.
Suspended (as used in tables of chemical analyses)refers to the amount (concentration) of undissolved materialin a water-sediment mixture. It is associated with the materialretained on a 0.45-micrometer filter.
Suspended, recoverable is the amount of a given con-stituent that is in solution after the part of a representativewater-suspended sediment sample that is retained on a 0.45-mm membrane filter has been digested by a method (usuallyusing a dilute acid solution) that results in dissolution of onlyreadily soluble substances. Complete dissolution of all theparticulate matter is not achieved by the digestion treatmentand thus the determination represents something less than the“total” amount (that is, less than 95 percent) of the constituentpresent in the sample. To achieve comparability of analytical
data, equivalent digestion procedures are required of all labo-ratories performing such analyses because different digestionprocedures are likely to produce different analytical results.
Determinations of “suspended, recoverable” constituentsare made either by analyzing portions of the material col-lected on the filter or, more commonly, by difference, basedon determinations of (1) dissolved and (2) total recoverableconcentrations of the constituent.
Suspended, total is the total amount of a given constitu-ent in the part of a representative water-suspended sedimentsample that is retained on a 0.45-mm membrane filter. Thisterm is used only when the analytical procedure assures mea-surement of at least 95 percent of the constituent determined.A knowledge of the expected form of the constituent in thesample, as well as the analytical methodology used, isrequired to determine when the results should be reported as“suspended, total.”
Determinations of “suspended, total” constituents aremade either by analyzing portions of the material collected onthe filter or, more commonly, by difference, based on deter-minations of (1) dissolved and (2) total concentrations of theconstituent.
Synoptic Studies are short-term investigations of spe-cific water-quality conditions during selected seasonal orhydrologic periods to provide improved spatial resolution forcritical water-quality conditions. For the period and condi-tions sampled, they assess the spatial distribution of selectedwater-quality conditions in relation to causative factors, suchas land use and contaminant sources.
Taxonomy is the division of biology concerned with theclassification and naming of organisms. The classification oforganisms is based upon a hierarchical scheme beginningwith Kingdom and ending with Species at the base. Thehigher the classification level, the fewer features the organ-isms have in common. For example, the taxonomy of aparticular mayfly, Hexagenia limbata, is the following:
Kingdom AnimalPhylum ArthropodaClass InsectaOrder EphemeropteraFamily EphemeridaeGenus HexageniaSpecies limbata
Thermograph is an instrument that continuouslyrecords variations of temperature on a chart. The more gen-eral term “temperature recorder” is used in the table headingsand refers to any instrument that records temperature whetheron a chart, a tape, or any other medium.

32 WATER RESOURCES DATA FOR MASSACHUSETTS AND RHODE ISLAND, 2000
Time-weighted average is computed by multiplying thenumber of days in the sampling period by the concentrationsof individual constituents for the corresponding period anddividing the sum of the products by the total number of days.A time-weighted average represents the composition of waterthat would be contained in a vessel or reservoir that hadreceived equal quantities of water from the stream each dayfor the year.
Tons per acre-foot indicates the dry mass of dissolvedsolids in 1 acre-ft of water. It is computed by multiplying theconcentration of the constituent, in milligrams per liter, by0.00136.
Tons per day (T/DAY) is the quantity of a substance insolution or suspension that passes a stream section during a24-hour period.
Total is the total amount of a given constituent in a rep-resentative water-suspended sediment sample, regardless ofthe constituent’s physical or chemical form. This term is usedonly when the analytical procedure assures measurement ofat least 95 percent of the constituent present in both the dis-solved and suspended phases of the sample. A knowledge ofthe expected form of the constituent in the sample, as well asthe analytical methodology used, is required to judge whenthe results should be reported as “total.” (Note that the word“total” does double duty here, indicating both that the sampleconsists of a water-suspended sediment mixture and that theanalytical method determined all of the constituent in thesample.)
Total discharge is the total quantity of any individualconstituent, as measured by dry mass or volume, that passesthrough a stream cross-section per unit of time. This termneeds to be qualified, such as “total sediment discharge,”“total chloride discharge,” and so on.
Total in bottom material is the total amount of a givenconstituent in a representative sample of bottom material.This term is used only when the analytical procedure assuresmeasurement of at least 95 percent of the constituent deter-mined. A knowledge of the expected form of the constituentin the sample, as well as the analytical methodology used, isrequired to judge when the results should be reported as “totalin bottom material.”
Total length (fish) is the straight-line distance from theanterior point of a fish specimen’s snout, with the mouthclosed, to the posterior end of the caudal (tail) fin, with thelobes of the caudal fin squeezed together.
Total load refers to all of a constituent in transport.When referring to sediment, it includes suspended load plusbed load.
Total, recoverable is the amount of a given constituentthat is in solution after a representative water-suspended sed-iment sample has been digested by a method (usually using adilute acid solution) that results in dissolution of only readilysoluble substances. Complete dissolution of all particulatematter is not achieved by the digestion treatment, thus thedetermination represents something less than the “total”amount (that is, less than 95 percent) of the constituentpresent in the dissolved and suspended phases of the sample.To achieve comparability of analytical data, equivalent diges-tion procedures are required of all laboratories performingsuch analyses because different digestion procedures arelikely to produce different analytical results.
Tritium network is a network of stations which has beenestablished to provide baseline information on the occurrenceof tritium in the Nation’s surface waters. In addition to thesurface water stations in the network, tritium data are alsoobtained at a number of precipitation stations. The purpose ofthe precipitation stations is to provide an estimate sufficientfor hydrologic studies of the tritium input to the UnitedStates.
Turbidity is a measurement of the collective opticalproperties of a water sample that cause light to be scatteredand absorbed rather than transmitted in straight lines; thehigher the intensity of scattered light, the higher the turbidity.Turbidity is expressed in nephelometric turbidity units (NTU)or Formazin turbidity units (FTU) depending on the methodand equipment used.
Volatile organic compounds (VOC’s) are organic com-pounds that can be isolated from the water phase of a sampleby purging the water sample with inert gas, such as helium,and subsequently analyzed by gas chromatography. ManyVOC’s are manmade chemicals that are used and produced inthe manufacture of paints, adhesives, petroleum products,pharmaceuticals, and refrigerants. They are often compo-nents of fuels, solvents, hydraulic fluids, paint thinners, anddry cleaning agents commonly used in urban settings. VOCcontamination of drinking-water supplies is a human healthconcern because many are toxic and are known or suspectedhuman carcinogens (U.S. Environmental Protection Agency,1996).
Water level is the water-surface elevation or stage of thefree surface of a body of water above or below any datum (see“Gage height”), or the surface of water standing in a well,usually indicative of the position of the water table or otherpotentiometric surface.
Water table is the surface of a ground-water body atwhich the water is at atmospheric pressure.

33WATER RESOURCES DATA FOR MASSACHUSETTS AND RHODE ISLAND, 2000
Water-table aquifer is an unconfined aquifer withinwhich is found the water table.
Water year in Geological Survey reports dealing withsurface-water supply is the 12-month period October 1through September 30. The water year is designated by thecalendar year in which it ends and which includes 9 of the 12months. Thus, the year ending September 30, 1994, is calledthe “1994 water year.”
WDR is used as an abbreviation for “Water-DataReport” in the REVISED RECORDS paragraph to refer toState annual hydrologic-data reports (WRD was used as anabbreviation for “Water-Resources Data” in reports publishedprior to 1976).
Weighted average is used in this report to indicate dis-charge-weighted average. It is computed by multiplying thedischarge for a sampling period by the concentrations of indi-vidual constituents for the corresponding period and dividingthe sum of the products by the sum of the discharges. A dis-charge-weighted average approximates the composition ofwater that would be found in a reservoir containing all thewater passing a given location during the water year afterthorough mixing in the reservoir.
Well is an excavation (pit, hole, tunnel), generally cylin-drical in form and often walled in, drilled, dug, driven, bored,or jetted into the ground to such a depth as to penetrate water-yielding geologic material and allow the water to flow or tobe pumped to the surface.
WSP is used as an abbreviation for “Water-SupplyPaper” in reference to previously published reports.
PUBLICATIONS OF TECHNIQUES OF WATER-RESOURCES INVESTIGATIONS
The U.S.G.S. publishes a series of manuals describingprocedures for planning and conducting specialized work inwater-resources investigations. The material is grouped undermajor subject headings called books and is further dividedinto sections and chapters. For example, section A of book 3(Applications of Hydraulics) pertains to surface water. Thechapter, the unit of publication, is limited to a narrow field ofsubject matter. This format permits flexibility in revision andpublication as the need arises.
The reports listed below are for sale by the U.S.G.S.,Information Services, Box 25286, Federal Center, Denver,Colorado 80225 (authorized agent of the Superintendent ofDocuments, Government Printing Office). Prepayment isrequired. Remittance should be made in the form of a checkor money order payable to the “U.S. Geological Survey.”
Prices are not included because they are subject to change.Current prices can be obtained by writing to the aboveaddress. When ordering or inquiring about prices for any ofthese publications, please give the title, book number, chapternumber, and mention the “U.S. Geological Survey Tech-niques of Water-Resources Investigations.”
Book 1. Collection of Water Data by Direct
Measurement
Section D. Water Quality
1-D1. Water temperature—influential factors, field measurement, and data presentation, by H. H. Stevens, Jr., J.F. Ficke, and G. F. Smoot: USGS–TWRI book 1, chap. D1. 1975. 65 p.
1-D2. Guidelines for collection and field analysis of ground-water samples for selected unstable constituents, by W.W. Wood: USGS–TWRI book 1, chap. D2. 1976. 24 p.
Book 2. Collection of Environmental Data
Section D. Surface Geophysical Methods
2-D1. Application of surface geophysics to ground-water investigations, by A.A. R. Zohdy, G.P. Eaton, and D.R. Mabey: USGS–TWRI book 2, chap. D1. 1974. 116 p.
2-D2. Application of seismic-refraction techniques to hydrologic studies, by F.P. Haeni: USGS–TWRI book 2, chap. D2. 1988. 86 p.
Section E. Subsurface Geophysical Methods
2-E1. Application of borehole geophysics to water-resources investigations, by W.S. Keys and L.M. MacCary: USGS–TWRI book 2, chap. E1. 1971. 126 p.
2-E2. Borehole geophysics applied to ground-water investigations, by W.S. Keys: USGS–TWRI book 2, chap. E2. 1990. 150 p.
Section F. Drilling and Sampling Methods
2-F1. Application of drilling, coring, and sampling techniques to test holes and wells, by Eugene Shuter and W.E. Teasdale: USGS–TWRI book 2, chap. F1. 1989. 97 p.
Book 3. Applications of Hydraulics
Section A. Surface-Water Techniques
3-A1. General field and office procedures for indirect discharge measurements, by M.A. Benson and Tate Dalrymple: USGS–TWRI book 3, chap. A1. 1967. 30 p.

34 WATER RESOURCES DATA FOR MASSACHUSETTS AND RHODE ISLAND, 2000
3-A2. Measurement of peak discharge by the slope-area method, by Tate Dalrymple and M.A. Benson: USGS–TWRI book 3, chap. A2. 1967. 12 p.
3-A3. Measurement of peak discharge at culverts by indirect methods, by G.L. Bodhaine: USGS–TWRI book 3, chap. A3. 1968. 60 p.
3-A4. Measurement of peak discharge at width contractions by indirect methods, by H.F. Matthai: USGS-TWRI book 3, chap. A4. 1967. 44 p.
3-A5. Measurement of peak discharge at dams by indirect methods, by Harry Hulsing: USGS–TWRI book 3. chap. A5. 1967. 29 p.
3-A6. General procedure for gaging streams, by R.W. Carter and Jacob Davidian: USGS–TWRI book 3, chap. A6. 1968. 13 p.
3-A7. Stage measurement at gaging stations, by T.J. Buchanan and W.P. Somers: USGS–TWRI book 3, chap. A7. 1968. 28 p.
3-A8. Discharge measurements at gaging stations, by T.J. Buchanan and W.P. Somers: USGS–TWRI book 3, chap. A8. 1969. 65 p.
3-A9. Measurement of time of travel in streams by dye tracing, by F.A. Kilpatrick and J.F. Wilson, Jr.: USGS–TWRI book 3, chap. A9. 1989. 27 p.
3-Al0. Discharge ratings at gaging stations, by E.J. Kennedy: USGS–TWRI book 3, chap. A10. 1984. 59 p.
3-A11. Measurement of discharge by the moving-boat method, by G.F. Smoot and C.E. Novak: USGS–TWRI book 3, chap. A11. 1969. 22 p.
3-A12. Fluorometric procedures for dye tracing, Revised, by J.F. Wilson, Jr., E.D. Cobb, and F.A. Kilpatrick: USGS–TWRI book 3, chap. A12. 1986. 34 p.
3-A13. Computation of continuous records of streamflow, by E.J. Kennedy: USGS–TWRI book 3, chap. A13. 1983. 53 p.
3-A14. Use of flumes in measuring discharge, by F.A. Kilpatrick and V.R. Schneider: USGS–TWRI book 3, chap. A14. 1983. 46 p.
3-A15. Computation of water-surface profiles in open channels, by Jacob Davidian: USGS–TWRI book 3, chap. A15. 1984. 48 p.
3-A16. Measurement of discharge using tracers, by F.A. Kilpatrick and E.D. Cobb: USGS–TWRI book 3, chap. A16. 1985. 52 p.
3-A17. Acoustic velocity meter systems, by Antonius Laenen: USGS–TWRI book 3, chap. A17. 1985. 38 p.
3-A18. Determination of stream reaeration coefficients by use of tracers, by F.A. Kilpatrick, R.E. Rathbun, Nobuhiro Yotsukura, G.W. Parker, and L.L. DeLong: USGS–TWRI book 3, chap. A18. 1989. 52 p.
3-A19. Levels at streamflow gaging stations, by E.J. Kennedy: USGS–TWRI book 3, chap. A19. 1990. 31 p.
3-A20. Simulation of soluble waste transport and buildup in surface waters using tracers, by F.A. Kilpatrick: USGS–TWRI book 3, chap. A20. 1993. 38 p.
3-A21 Stream-gaging cableways, by C. Russell Wagner: USGS–TWRI book 3, chap. A21. 1995. 56 p.
Section B. Ground-Water Techniques
3-B1. Aquifer-test design, observation, and data analysis, by R.W. Stallman: USGS–TWRI book 3, chap. B1. 1971. 26 p.
3-B2. Introduction to ground-water hydraulics, a programed text for self-instruction, by G.D. Bennett: USGS–TWRI book 3, chap. B2. 1976. 172 p.
3-B3. Type curves for selected problems of flow to wells in confined aquifers, by J.E. Reed: USGS–TWRI book 3, chap. B3. 1980. 106 p.
3-B4. Regression modeling of ground-water flow, by R.L. Cooley and R.L. Naff: USGS–TWRI book 3, chap. B4. 1990. 232 p.
3-B4. Supplement 1. Regression modeling of ground-water flow --Modifications to the computer code for nonlinear regression solution of steady-state ground-water flow problems, by R.L. Cooley: USGS–TWRI book 3, chap. B4. 1993. 8 p.
3-B5. Definition of boundary and initial conditions in the analysis of saturated ground-water flow systems—An introduction, by O.L. Franke, T.E. Reilly, and G.D. Bennett: USGS–TWRI book 3, chap. B5. 1987. 15 p.
3-B6. The principle of superposition and its application in ground-water hydraulics, by T.E. Reilly, O.L. Franke, and G.D. Bennett: USGS–TWRI book 3, chap. B6. 1987. 28 p.
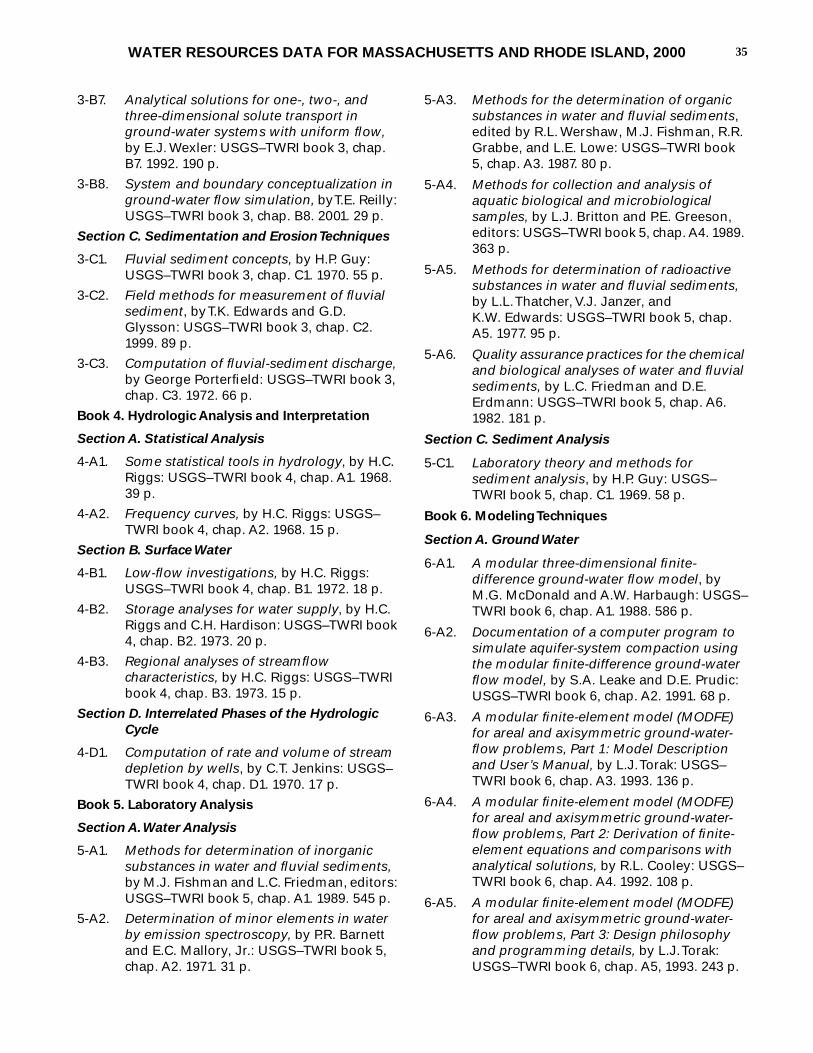
35WATER RESOURCES DATA FOR MASSACHUSETTS AND RHODE ISLAND, 2000
3-B7. Analytical solutions for one-, two-, and three-dimensional solute transport in ground-water systems with uniform flow, by E.J. Wexler: USGS–TWRI book 3, chap. B7. 1992. 190 p.
3-B8. System and boundary conceptualization in ground-water flow simulation, by T.E. Reilly: USGS–TWRI book 3, chap. B8. 2001. 29 p.
Section C. Sedimentation and Erosion Techniques
3-C1. Fluvial sediment concepts, by H.P. Guy: USGS–TWRI book 3, chap. C1. 1970. 55 p.
3-C2. Field methods for measurement of fluvial sediment, by T.K. Edwards and G.D. Glysson: USGS–TWRI book 3, chap. C2. 1999. 89 p.
3-C3. Computation of fluvial-sediment discharge, by George Porterfield: USGS–TWRI book 3, chap. C3. 1972. 66 p.
Book 4. Hydrologic Analysis and Interpretation
Section A. Statistical Analysis
4-A1. Some statistical tools in hydrology, by H.C. Riggs: USGS–TWRI book 4, chap. A1. 1968. 39 p.
4-A2. Frequency curves, by H.C. Riggs: USGS–TWRI book 4, chap. A2. 1968. 15 p.
Section B. Surface Water
4-B1. Low-flow investigations, by H.C. Riggs: USGS–TWRI book 4, chap. B1. 1972. 18 p.
4-B2. Storage analyses for water supply, by H.C. Riggs and C.H. Hardison: USGS–TWRI book 4, chap. B2. 1973. 20 p.
4-B3. Regional analyses of streamflow characteristics, by H.C. Riggs: USGS–TWRI book 4, chap. B3. 1973. 15 p.
Section D. Interrelated Phases of the Hydrologic
Cycle
4-D1. Computation of rate and volume of stream depletion by wells, by C.T. Jenkins: USGS–TWRI book 4, chap. D1. 1970. 17 p.
Book 5. Laboratory Analysis
Section A. Water Analysis
5-A1. Methods for determination of inorganic substances in water and fluvial sediments, by M.J. Fishman and L.C. Friedman, editors: USGS–TWRI book 5, chap. A1. 1989. 545 p.
5-A2. Determination of minor elements in water by emission spectroscopy, by P.R. Barnett and E.C. Mallory, Jr.: USGS–TWRI book 5, chap. A2. 1971. 31 p.
5-A3. Methods for the determination of organic substances in water and fluvial sediments, edited by R.L. Wershaw, M.J. Fishman, R.R. Grabbe, and L.E. Lowe: USGS–TWRI book 5, chap. A3. 1987. 80 p.
5-A4. Methods for collection and analysis of aquatic biological and microbiological samples, by L.J. Britton and P.E. Greeson, editors: USGS–TWRI book 5, chap. A4. 1989. 363 p.
5-A5. Methods for determination of radioactive substances in water and fluvial sediments, by L.L. Thatcher, V.J. Janzer, and K.W. Edwards: USGS–TWRI book 5, chap. A5. 1977. 95 p.
5-A6. Quality assurance practices for the chemical and biological analyses of water and fluvial sediments, by L.C. Friedman and D.E. Erdmann: USGS–TWRI book 5, chap. A6. 1982. 181 p.
Section C. Sediment Analysis
5-C1. Laboratory theory and methods for sediment analysis, by H.P. Guy: USGS–TWRI book 5, chap. C1. 1969. 58 p.
Book 6. Modeling Techniques
Section A. Ground Water
6-A1. A modular three-dimensional finite-difference ground-water flow model, by M.G. McDonald and A.W. Harbaugh: USGS–TWRI book 6, chap. A1. 1988. 586 p.
6-A2. Documentation of a computer program to simulate aquifer-system compaction using the modular finite-difference ground-water flow model, by S.A. Leake and D.E. Prudic: USGS–TWRI book 6, chap. A2. 1991. 68 p.
6-A3. A modular finite-element model (MODFE) for areal and axisymmetric ground-water-flow problems, Part 1: Model Description and User’s Manual, by L.J. Torak: USGS–TWRI book 6, chap. A3. 1993. 136 p.
6-A4. A modular finite-element model (MODFE) for areal and axisymmetric ground-water-flow problems, Part 2: Derivation of finite-element equations and comparisons with analytical solutions, by R.L. Cooley: USGS–TWRI book 6, chap. A4. 1992. 108 p.
6-A5. A modular finite-element model (MODFE) for areal and axisymmetric ground-water-flow problems, Part 3: Design philosophy and programming details, by L.J. Torak: USGS–TWRI book 6, chap. A5, 1993. 243 p.

36 WATER RESOURCES DATA FOR MASSACHUSETTS AND RHODE ISLAND, 2000
6-A6. A coupled surface-water and ground-water flow model (MODBRANCH) for simulation of stream-aquifer interaction, by Eric D. Swain and Eliezer J. Wexler: USGS–TWRI book 6, chap. A5,1996. 125 p.
Book 7. Automated Data Processing and
Computations
Section C. Computer Programs
7-C1. Finite difference model for aquifer simulation in two dimensions with results of numerical experiments, by P.C. Trescott, G.F. Pinder, and S.P. Larson: USGS–TWRI book 7, chap. C1. 1976. 116 p.
7-C2. Computer model of two-dimensional solute transport and dispersion in ground water, by L.F. Konikow and J.D. Bredehoeft: USGS–TWRI book 7, chap. C2. 1978. 90 p.
7-C3. A model for simulation of flow in singular and interconnected channels, by R.W. Schaffranek, R.A. Baltzer, and D.E. Goldberg: USGS–TWRI book 7, chap. C3. 1981. 110 p.
Book 8. Instrumentation
Section A. Instruments for Measurement of Water
Level
8-A1. Methods of measuring water levels in deep wells, by M.S. Garber and F.C. Koopman: USGS–TWRI book 8, chap. A1. 1968. 23 p.
8-A2. Installation and service manual for U.S. Geological Survey manometers, by J.D. Craig: USGS–TWRI book 8, chap. A2. 1983. 57 p.
Section B. Instruments for Measurement of
Discharge
8-B2. Calibration and maintenance of vertical-axis type current meters, by G.F. Smoot and C.E. Novak: USGS–TWRI book 8, chap. B2. 1968. 15 p.
Book 9. Handbooks for Water-Resources
Investigations
Section A. National Field Manual for the Collection
of Water-Quality Data
9-A1. National Field Manual for the Collection of Water-Quality Data: Preparations for Water Sampling, by F.D. Wilde, D.B. Radtke, Jacob Gibs, and R.T. Iwatsubo: USGS–TWRI book 9, chap. A1. 1998. 47 p.
9-A2. National Field Manual for the Collection of Water-Quality Data: Selection of Equipment for Water Sampling, edited by F.D. Wilde, D.B. Radtke, Jacob Gibs, and R.T. Iwatsubo: USGS–TWRI book 9, chap. A2. 1998. 94 p.
9-A3. National Field Manual for the Collection of Water-Quality Data: Cleaning of Equipment for Water Sampling, edited by F.D. Wilde, D.B. Radtke, Jacob Gibs, and R.T. Iwatsubo: USGS–TWRI book 9, chap. A3. 1998. 75 p.
9-A4. National Field Manual for the Collection of Water-Quality Data: Collection of Water Samples, edited by F.D. Wilde, D.B. Radtke, Jacob Gibs, and R.T. Iwatsubo: USGS–TWRI book 9, chap. A4. 1999. 156 p.
9-A5. National Field Manual for the Collection of Water-Quality Data: Processing of Water Samples, edited by F.D. Wilde, D.B. Radtke, Jacob Gibs, and R.T. Iwatsubo: USGS–TWRI book 9, chap. A5. 1999, 149 p.
9-A6. National Field Manual for the Collection of Water-Quality Data: Field Measurements, edited by F.D. Wilde and D.B. Radtke: USGS–TWRI book 9, chap. A6. 1998. Variously paginated.
9-A7. National Field Manual for the Collection of Water-Quality Data: Biological Indicators, edited by D.N. Myers and F.D. Wilde: USGS–TWRI book 9, chap. A7. 1997 and 1999. Variously paginated.
9-A8. National Field Manual for the Collection of Water-Quality Data: Bottom-material samples, by D.B. Radtke: USGS–TWRI book 9, chap. A8. 1998. 48 p.
9-A9. National Field Manual for the Collection of Water-Quality Data: Safety in Field Activities, by S.L. Lane and R.G. Fay: USGS–TWRI book 9, chap. A9. 1998. 60 p.

37WATER RESOURCES DATA FOR MASSACHUSETTS AND RHODE ISLAND, 2000
Remark Codes
The following remark codes may appear with the water-quality data in this section:
PRINT OUTPUT REMARK
E Estimated value.
> Actual value is known to be greater than the value shown.
< Actual value is known to be less than the value shown.
K Results based on colony count outside the acceptance range (non-ideal colony count).
L Biological organism count less than 0.5 percent(organism may be observed rather than counted).
D Biological organism count equal to or greater than 15 percent (dominant).
& Biological organism estimated as dominant.
V Analyte was detected in both the environmentalsample and the associated blanks.
Dissolved Trace-Element Concentrations
NOTE-- Traditionally, dissolved trace-element concentrations have been reported at the microgram per liter (µg/L) level. Recent evidence, mostly from large rivers, indicates that actual dissolved-phase concentrations for a number of trace elements are within the range of 10’s to 100’s of nanograms per liter (ng/L). Data above the µg/L level should be viewed with caution. Such data may actually represent elevated environmental concentrations from natural or human causes; however, these data could reflect contamination introduced during sampling, processing, or analysis. To confidently produce dissolved trace-element data with insignificant contamination, the U.S. Geological Survey began using new trace-element protocols at some stations in water year 1994.
Change in National Trends Network Procedures
NOTE-- Sample handling procedures at all National Trends Network stations were changed substantially on January 11, 1994, in order to reduce contamination from the sample shipping container. The data for samples before and after that date are different and not directly comparable. A tabular summary of the differences based on a special intercomparison study, is available from the NADP/NTN Coordination Office, Colorado State University, Fort Collins, CO 80523 (Telephone: 303-491-5643).