the economic and fiscal impacts of development near...
TRANSCRIPT
Section I: ECONOMIC AND FISCAL IMPACTS OF THE DART LIGHT RAIL SYSTEM: 1999 - 2013
University of North Texas Economics Research Group Pg. 1
The Economic and Fiscal Impacts of Development near DART Stations
Prepared for Dallas Area Rapid Transit
Prepared by
Michael C. Carroll, Ph.D. Christopher Carlyle
Michael Seman, Ph.D.
May 2017
Section I: ECONOMIC AND FISCAL IMPACTS OF THE DART LIGHT RAIL SYSTEM: 1999 - 2013
University of North Texas Economics Research Group Pg. 2
TABLE OF CONTENTS Section I: Economic and Fiscal Impacts of the DART Light Rail System: 1999 - 2013 ............... 3
Introduction ................................................................................................................................. 3
Review of Economic Impact Studies .......................................................................................... 3
The Initial Economic Impacts of the DART LRT System (1999) .......................................... 3
An Assessment of the DART LRT on Taxable Property Valuations and Transit-Oriented Development (2002) ............................................................................................................... 5
The Estimated Value of New Investment Adjacent to DART LRT Stations: 1999 – 2005 ... 6
Assessment of the Potential Fiscal Impacts of Existing and Proposed Transit-Oriented Development in the DART Service Area (2007) .................................................................... 7
Economic and Fiscal Impacts of DART Light Rail System Buildout and System Operations (2009) ...................................................................................................................................... 8
Developmental Impacts of the DART Light Rail System (2013)........................................... 9
Conclusion ................................................................................................................................ 11
Section II: The Economic Impact of Public Projects at DART Stations ...................................... 12
Selected Highlights ................................................................................................................... 12
Methodology ............................................................................................................................. 12
Results ....................................................................................................................................... 15
Public Project Impacts .......................................................................................................... 15
Fiscal Impacts ....................................................................................................................... 17
Section III: The Economic and Fiscal Impacts of Development near DART Stations 2014 – 2015....................................................................................................................................................... 18
Executive Summary .................................................................................................................. 18
Highlights .................................................................................................................................. 18
Introduction ............................................................................................................................... 19
Methodology and Data .............................................................................................................. 19
Results ....................................................................................................................................... 20
Projects: Completed or Under Construction – Total............................................................. 20
Projects: Completed or Under Construction – Non-Residential ........................................... 21
Projects: Completed or Under Construction – Multi-Family Residential Impacts ............... 22
Projects: Completed or Under Construction – Single-Family Residential ........................... 22
Projects: Planned or Proposed – Totals ................................................................................ 23
Projects: Planned or Proposed – Non-Residential ................................................................ 24
Projects: Planned or Proposed – Multi-Family Residential Impacts .................................... 25
Conclusion ................................................................................................................................ 25
Section I: ECONOMIC AND FISCAL IMPACTS OF THE DART LIGHT RAIL SYSTEM: 1999 - 2013
University of North Texas Economics Research Group Pg. 3
SECTION I: ECONOMIC AND FISCAL IMPACTS OF THE DART LIGHT
RAIL SYSTEM: 1999 - 2013
INTRODUCTION
Since 1996, the DART Light Rail Transit (LRT) system has moved millions of people and
sparked billions of dollars in development in the Dallas-Fort Worth economy. Since 1999, the
University of North Texas and DART have partnered to derive the economic impacts of
development near light rail stations. As noted numerous times below, property values near DART
LRT stations far exceed and grow much faster than those in similar areas without a light rail station.
As DART celebrates the 20th anniversary of opening its light rail system in DFW, the Economics
Research Group (formerly The Center for Economic Development and Research, CEDR) at the
University of North Texas has compiled a review of the six studies done from 1999 to 2013. The
purpose of this study is to merge all former UNT-DART studies and derive a comprehensive dollar
value of properties near DART LRT stations since inception.
REVIEW OF ECONOMIC IMPACT STUDIES
The Initial Economic Impacts of the DART LRT System (1999)
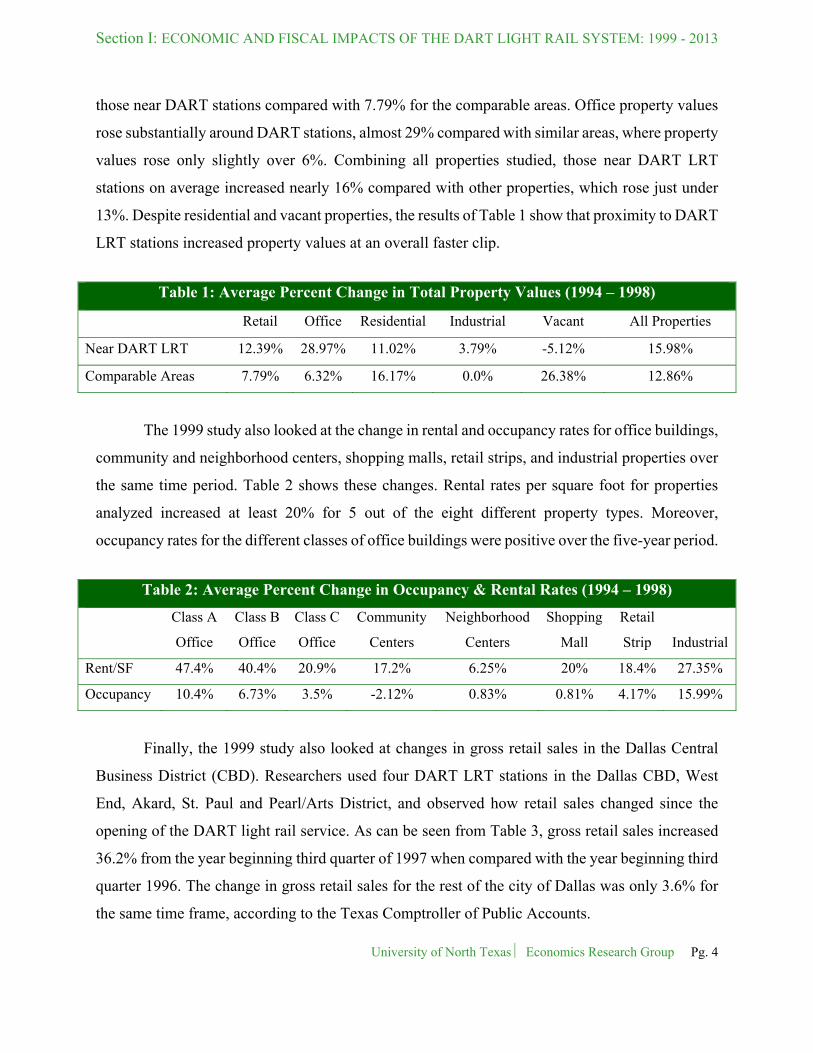
In 1999, this office began the collaboration between UNT and DART. This first study
concentrated on the change in property values, occupancy and rental rates, and retail sales of
properties located near DART LRT stations from 1994 to 1998.
The study first compared nearly 700 commercial and residential property values within a
quarter-mile1 of 15 DART LRT stations with 160 properties in eight comparable areas. These
comparable areas were deemed similar in both usage and neighborhood characteristics as those
properties near DART stations. As seen from Table 1, retail property values increased 12.39% for
1 This radius has been shown to be the benchmark when considering the positive impact development has on surrounding areas.
Section I: ECONOMIC AND FISCAL IMPACTS OF THE DART LIGHT RAIL SYSTEM: 1999 - 2013
University of North Texas Economics Research Group Pg. 4
those near DART stations compared with 7.79% for the comparable areas. Office property values
rose substantially around DART stations, almost 29% compared with similar areas, where property
values rose only slightly over 6%. Combining all properties studied, those near DART LRT
stations on average increased nearly 16% compared with other properties, which rose just under
13%. Despite residential and vacant properties, the results of Table 1 show that proximity to DART
LRT stations increased property values at an overall faster clip.
Table 1: Average Percent Change in Total Property Values (1994 – 1998)
Retail Office Residential Industrial Vacant All Properties
Near DART LRT 12.39% 28.97% 11.02% 3.79% -5.12% 15.98%
Comparable Areas 7.79% 6.32% 16.17% 0.0% 26.38% 12.86%
The 1999 study also looked at the change in rental and occupancy rates for office buildings,
community and neighborhood centers, shopping malls, retail strips, and industrial properties over
the same time period. Table 2 shows these changes. Rental rates per square foot for properties
analyzed increased at least 20% for 5 out of the eight different property types. Moreover,
occupancy rates for the different classes of office buildings were positive over the five-year period.
Table 2: Average Percent Change in Occupancy & Rental Rates (1994 – 1998)
Class A
Office
Class B
Office
Class C
Office
Community
Centers
Neighborhood
Centers
Shopping
Mall
Retail
Strip Industrial
Rent/SF 47.4% 40.4% 20.9% 17.2% 6.25% 20% 18.4% 27.35%
Occupancy 10.4% 6.73% 3.5% -2.12% 0.83% 0.81% 4.17% 15.99%
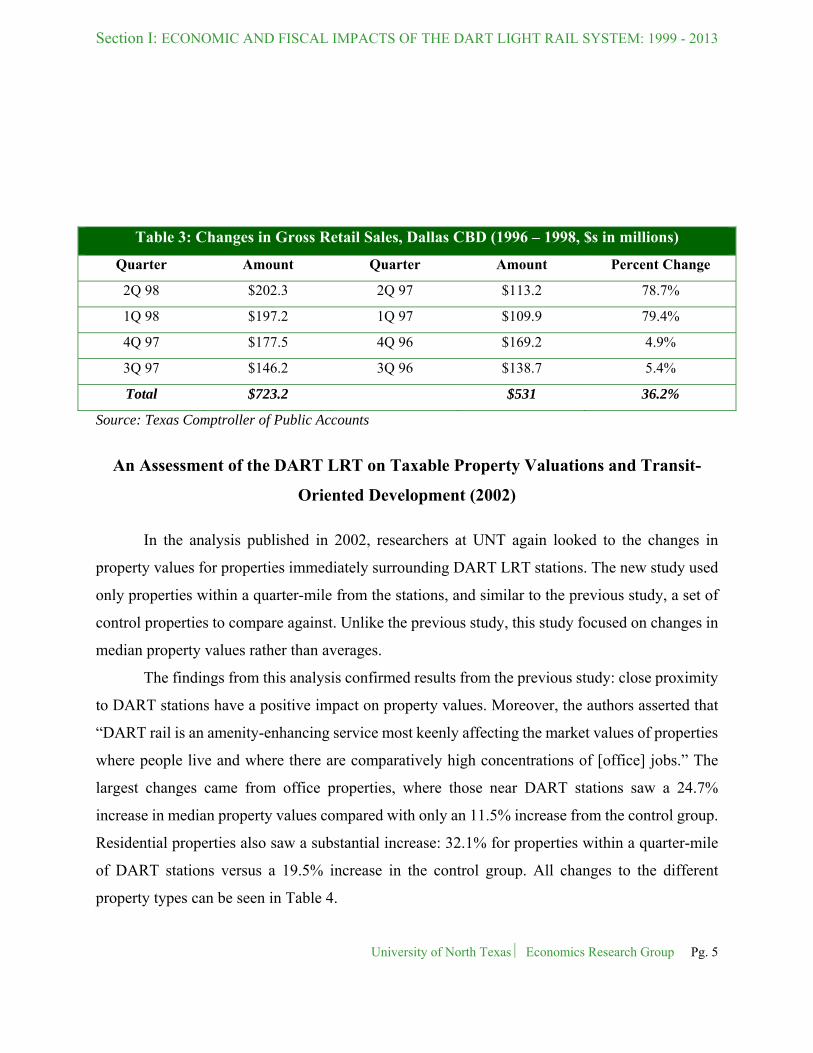
Finally, the 1999 study also looked at changes in gross retail sales in the Dallas Central
Business District (CBD). Researchers used four DART LRT stations in the Dallas CBD, West
End, Akard, St. Paul and Pearl/Arts District, and observed how retail sales changed since the
opening of the DART light rail service. As can be seen from Table 3, gross retail sales increased
36.2% from the year beginning third quarter of 1997 when compared with the year beginning third
quarter 1996. The change in gross retail sales for the rest of the city of Dallas was only 3.6% for
the same time frame, according to the Texas Comptroller of Public Accounts.
Section I: ECONOMIC AND FISCAL IMPACTS OF THE DART LIGHT RAIL SYSTEM: 1999 - 2013
University of North Texas Economics Research Group Pg. 5
Table 3: Changes in Gross Retail Sales, Dallas CBD (1996 – 1998, $s in millions)
Quarter Amount Quarter Amount Percent Change
2Q 98 $202.3 2Q 97 $113.2 78.7%
1Q 98 $197.2 1Q 97 $109.9 79.4%
4Q 97 $177.5 4Q 96 $169.2 4.9%
3Q 97 $146.2 3Q 96 $138.7 5.4%
Total $723.2 $531 36.2%
Source: Texas Comptroller of Public Accounts
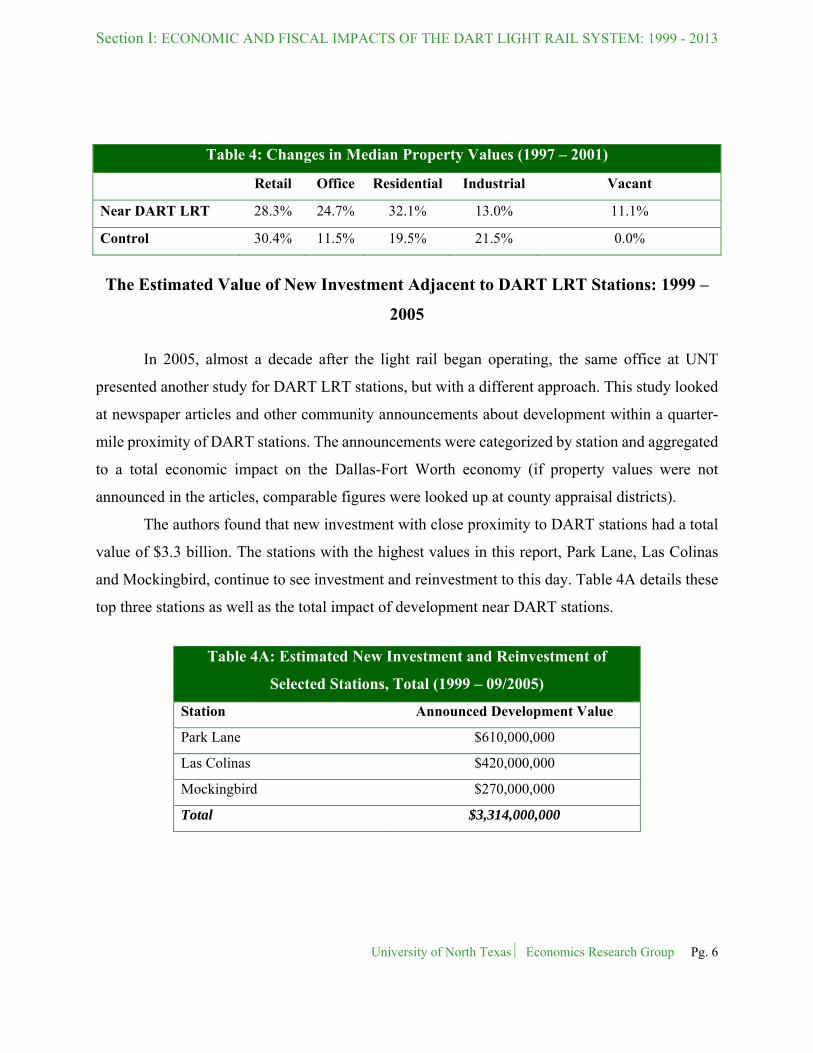
An Assessment of the DART LRT on Taxable Property Valuations and Transit-
Oriented Development (2002)
In the analysis published in 2002, researchers at UNT again looked to the changes in
property values for properties immediately surrounding DART LRT stations. The new study used
only properties within a quarter-mile from the stations, and similar to the previous study, a set of
control properties to compare against. Unlike the previous study, this study focused on changes in
median property values rather than averages.
The findings from this analysis confirmed results from the previous study: close proximity
to DART stations have a positive impact on property values. Moreover, the authors asserted that
“DART rail is an amenity-enhancing service most keenly affecting the market values of properties
where people live and where there are comparatively high concentrations of [office] jobs.” The
largest changes came from office properties, where those near DART stations saw a 24.7%
increase in median property values compared with only an 11.5% increase from the control group.
Residential properties also saw a substantial increase: 32.1% for properties within a quarter-mile
of DART stations versus a 19.5% increase in the control group. All changes to the different
property types can be seen in Table 4.
Section I: ECONOMIC AND FISCAL IMPACTS OF THE DART LIGHT RAIL SYSTEM: 1999 - 2013
University of North Texas Economics Research Group Pg. 6
Table 4: Changes in Median Property Values (1997 – 2001)
Retail Office Residential Industrial Vacant
Near DART LRT 28.3% 24.7% 32.1% 13.0% 11.1%
Control 30.4% 11.5% 19.5% 21.5% 0.0%
The Estimated Value of New Investment Adjacent to DART LRT Stations: 1999 –
2005
In 2005, almost a decade after the light rail began operating, the same office at UNT
presented another study for DART LRT stations, but with a different approach. This study looked
at newspaper articles and other community announcements about development within a quarter-
mile proximity of DART stations. The announcements were categorized by station and aggregated
to a total economic impact on the Dallas-Fort Worth economy (if property values were not
announced in the articles, comparable figures were looked up at county appraisal districts).
The authors found that new investment with close proximity to DART stations had a total
value of $3.3 billion. The stations with the highest values in this report, Park Lane, Las Colinas
and Mockingbird, continue to see investment and reinvestment to this day. Table 4A details these
top three stations as well as the total impact of development near DART stations.
Table 4A: Estimated New Investment and Reinvestment of
Selected Stations, Total (1999 – 09/2005)
Station Announced Development Value
Park Lane $610,000,000
Las Colinas $420,000,000
Mockingbird $270,000,000
Total $3,314,000,000

Section I: ECONOMIC AND FISCAL IMPACTS OF THE DART LIGHT RAIL SYSTEM: 1999 - 2013
University of North Texas Economics Research Group Pg. 7
Assessment of the Potential Fiscal Impacts of Existing and Proposed Transit-
Oriented Development in the DART Service Area (2007)
The following research done by this department again looks back at the property values
surrounding DART stations since 1999 in tandem with the fiscal impacts of those property values.
This report is an update of the previous. Methods used to acquire these property values were similar
to the previous report (newspaper announcements for values and locations of development
projects), but the authors of this report also utilized work in the field to identify projects not
announced in local publications. The study found that values that could be directly attributed to
the existence of a nearby DART station totaled $4.26 billion, (values were excluded if the
development would have occurred with or without the station, such as with a convenience store)
as detailed in Table 5.
Table 5: Potential Fiscal Impacts of Existing & Proposed TOD
Description Value
Announced Value $ 4,902,800,000
Announced Value Attributable to DART $ 4,255,700,000
Cities (Annually)
Taxable Property Value $ 2,843,779,000
Property Tax Revenues $ 16,785,000
Taxable Retail Sales $ 665,552,000
Sales Tax Revenues $ 6,656,000
Total Revenue to Cities $ 23,531,000
Total State and Local Tax Revenues $ 127,095,000
The results from this 2007 study update those done in the 2005 research. The value of
properties near DART stations in the 2005 study ($3.3 billion) increased nearly 50% in the 2007
study ($4.9 billion) due to higher property values and more new development. While some of this
increase comes from properties that might have been overlooked in the 2005 study, overall
development in the North Texas region increased in this time period as well, with an emphasis on
transit-oriented development. The authors gave a favorable outlook for more development around

Section I: ECONOMIC AND FISCAL IMPACTS OF THE DART LIGHT RAIL SYSTEM: 1999 - 2013
University of North Texas Economics Research Group Pg. 8
DART stations when ridership and support for expansion were taken into account, and they
anticipated that property values would continue to rise.
Economic and Fiscal Impacts of DART Light Rail System Buildout and System
Operations (2009)
In 2009, DART was on the brink of finishing major extensions and opening new lines for
the light rail system. The next study conducted by CEDR for DART looked at the capital projects
in line with the completion of these DART lines as well as the projected impacts of operating
expenditures for fiscal years 2009 and 2014.
In Table 6, the total impact of buildout of the Green Line and Orange Line, and extensions
of the Blue Line are outlined. According to this report, expenditures for these lines totaled $2.3
billion, which, when run through the economic input-output model, had a total economic impact
of $4.06 billion on the local economy. Additionally, these expenditures caused labor income in the
area to increase by $1.5 billion and the creation of over 32,000 jobs. Almost $100 million in taxes
were also generated from the spending on the completion of these DART light rail lines.
Table 6: Economic & Fiscal Impacts from DART System Buildout (All Lines)
Description Impact
Total Expenditures $2,337,000,000
Economic Activity $ 4,059,672,000
Labor Income $ 1,520,157,000
Employment 32,095
Other Property Income $ 432,140,000
Indirect Business Taxes $ 99,986,000
Moreover, this study aimed to estimate the operations spending in 2009 and 2014. DART
operations spending supports other spending throughout the local economy despite DART’s being
a public entity. The spending helps to create direct impacts for local business and employees, as
well as creating new jobs and subsequently, tax revenues. According to this 2009 report, DART
spent $411 million (Table 7) on operations, which include wages and salaries, goods, and services
to support DART on a day-to-day basis. The operations spending, in turn, created a total economic
Section I: ECONOMIC AND FISCAL IMPACTS OF THE DART LIGHT RAIL SYSTEM: 1999 - 2013
University of North Texas Economics Research Group Pg. 9
impact of nearly $544 million, almost 5,000 jobs and taxes above $11 million. The paper also
estimated what spending on operations might look like in 2014. This produced $501 million of
direct spending causing a total economic impact of $663 million, over 5,300 jobs and taxes greater
than $13 million (Table 7).
Table 7: Economic and Fiscal Impacts of DART Operations
Description 2009 2014
Total Expenditures $ 411,000,000 $501,000,000
Economic Activity $ 543,984,000 $663,106,000
Labor Income $325,921,000 $412,013,000
Employment 4,955 5,327
Other Property Income $ 49,626,000 $60,494,000
Indirect Business Taxes $ 11,289,000 $13,760,000
Developmental Impacts of the DART Light Rail System (2013)
In the most recent study done by this office, property values surrounding DART stations
were again compared against a set of control property values in similar locations. Like previous
studies, the properties within close proximity to DART stations must have been within a quarter-
mile radius of the station – a distance researchers agree yields a positive association with increased
development.2 3 4 On top of this support for the quarter-mile distance, the authors conducted further
analysis to verify its validity.
The analysis done in this study finds that, from 1996 to 2013, new development occurring
within three years of the opening of a DART station (and still existing) had a value of $1.5 billion
compared with $601 million for the control properties (Table 8). Similarly, the tax revenue
generated from the DART station properties outpaced control properties by $22 million ($36
million for DART versus $14 million for control).
2 Bollinger, C. & Ihlanfeldt, K. (1997). The impact of rapid rail transit on economic development: The case of Atlanta’s MARTA. Journal of Urban Economics, 42, 179-204. 3 Cervero, R. & Landis, J. (1997). Twenty years of the Bay Area Rapid Transit System: Land Use and Development Impacts. Transportation Research A, 31(4), 309-333. 4 Weinberger, R. (2000). Commercial Rents and Transportation Improvements: The Case of Santa Clara County’s Light Rail. Cambridge, MA. Lincoln Institute for Land Policy.

Section I: ECONOMIC AND FISCAL IMPACTS OF THE DART LIGHT RAIL SYSTEM: 1999 - 2013
University of North Texas Economics Research Group Pg. 10
Table 8: Estimated 2013 Property Values and Tax Contributions
Property Type
Est. Value of All Properties Est. Tax Contributions Tax
Differential DART Control DART Control
Industrial $23,473,050 $19,481,050 $556,311 $461,701 $94,610
Multi-Family $751,646,900 $169,555,466 $17,814,032 $4,018,465 $13,795,567
Office $224,798,649 $45,121,010 $5,327,728 $1,069,368 $4,258,360
Retail $393,286,515 $300,039,538 $9,320,890 $7,110,937 $2,209,953
Single Family $140,960,100 $67,550,410 $3,340,754 $1,600,945 $1,739,810
Total $1,534,165,214 $601,747,474 $36,359,716 $14,261,415 $22,098,300
The 2013 analysis then looked to announced values of upcoming planned and proposed
development projects. As seen from Table 5 (page 7), the 2007 study found $4.9 billion in existing
and planned development. When this 2013 study was conducted, the authors found, as expected,
that some properties slated for future development in the 2007 study were either paused or did not
come to fruition, most likely because of the recession. In this analysis, when the properties were
updated, planned and proposed developments near DART stations had a total value of $3.8 billion.
This summed together with the $1.5 billion of existing property values above makes total property
values since 1996 worth $5.3 billion.
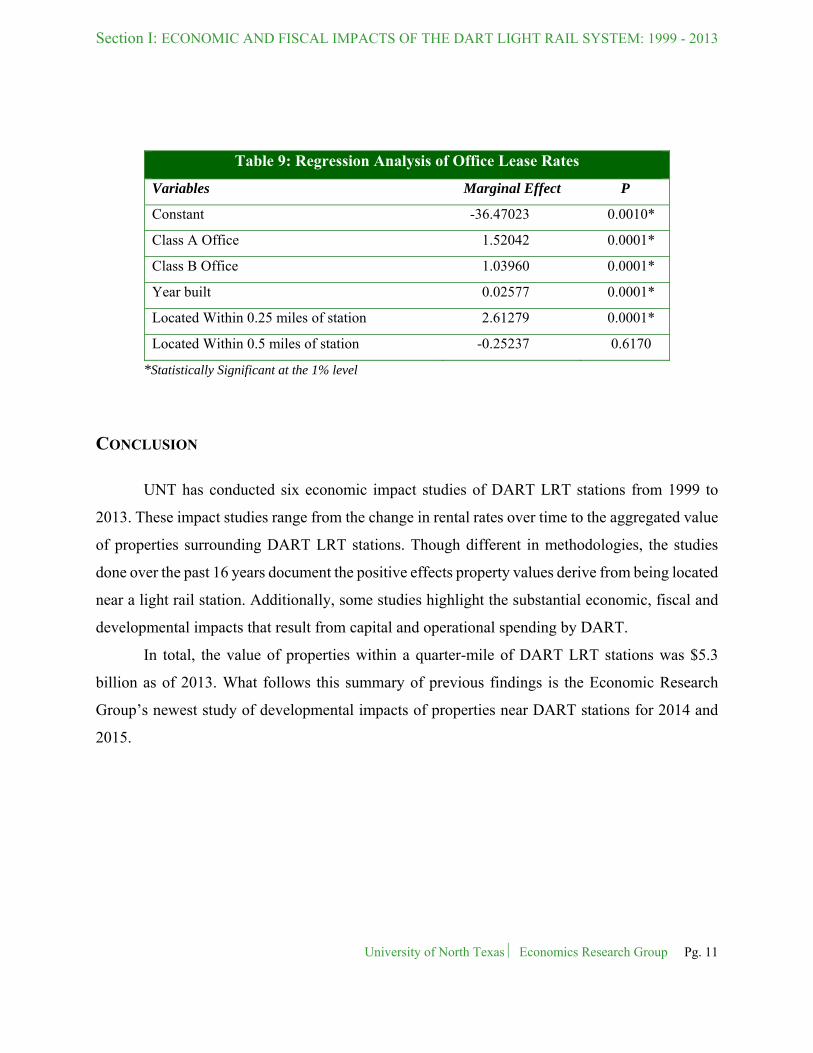
In the second section of the 2013 study, the authors looked at the effect of different office
classes, ages of the structures, and whether the properties were within a quarter-mile or between a
quarter-mile and a half-mile all on office lease rates. Regression analysis was used to estimate the
effect of these variables. The most notable finding of this analysis shows that properties located
within a quarter-mile of a DART station gained a $2.61 statistically significant5 premium while
controlling for office class and age of the building (Table 9). Furthermore, properties outside the
quarter-mile radius did not attain the statistical significance nor the positive premium. This aligns
with what has been studied in the literature and with the results of past studies done by this office.
5 Seen from the p-value, which tells us the probability of getting a result at least as extreme as the one observed.
Section I: ECONOMIC AND FISCAL IMPACTS OF THE DART LIGHT RAIL SYSTEM: 1999 - 2013
University of North Texas Economics Research Group Pg. 11
Table 9: Regression Analysis of Office Lease Rates
Variables Marginal Effect P
Constant -36.47023 0.0010*
Class A Office 1.52042 0.0001*
Class B Office 1.03960 0.0001*
Year built 0.02577 0.0001*
Located Within 0.25 miles of station 2.61279 0.0001*
Located Within 0.5 miles of station -0.25237 0.6170
*Statistically Significant at the 1% level
CONCLUSION
UNT has conducted six economic impact studies of DART LRT stations from 1999 to
2013. These impact studies range from the change in rental rates over time to the aggregated value
of properties surrounding DART LRT stations. Though different in methodologies, the studies
done over the past 16 years document the positive effects property values derive from being located
near a light rail station. Additionally, some studies highlight the substantial economic, fiscal and
developmental impacts that result from capital and operational spending by DART.
In total, the value of properties within a quarter-mile of DART LRT stations was $5.3
billion as of 2013. What follows this summary of previous findings is the Economic Research
Group’s newest study of developmental impacts of properties near DART stations for 2014 and
2015.

Section II: THE ECONOMIC IMPACT OF PUBLIC PROJECTS AT DART STATIONS
University of North Texas Economics Research Group Pg. 12
SECTION II: THE ECONOMIC IMPACT OF PUBLIC PROJECTS AT
DART STATIONS
This memorandum details the economic impact of public projects within a quarter-mile of DART
stations. The projects were not included in previous University of North Texas projects as the
amounts were previously not available. The analysis in the memorandum covers projects that were
developed from DART’s early construction and therefore includes more projects completed in
2014-2015. This report excludes downtown stations because of their closeness to one another and
the resulting overlap in the quarter-mile criteria.
SELECTED HIGHLIGHTS
Public development had a property value of $1.81 billion
Public development produced an economic impact of $3.36 billion for the Dallas-Fort
Worth region
Public development near DART stations created 20,741 construction jobs in the Dallas-
Fort Worth region
Public development created $1.3 billion in employee compensation
Public development generated $105 million in state and local taxes, and $278 million in
federal tax revenue
METHODOLOGY
To understand how money being spent developing properties within a quarter-mile of a
DART station ripples through a regional economy, the first step is to define the region in question.
This study uses the Dallas-Fort Worth region for analysis as its economy is strongly integrated.
The U.S. Office of Management and Budget’s (OMB) definition of the “Dallas-Fort Worth-
Arlington Metropolitan Statistical Area” is used and the counties included are Collin, Dallas,
Denton, Ellis, Hood, Hunt, Johnson, Kaufman, Parker, Rockwall, Somervell, Tarrant and Wise.
Next, the values of the selected properties are placed into an Input/Output economic model that

Section II: THE ECONOMIC IMPACT OF PUBLIC PROJECTS AT DART STATIONS
University of North Texas Economics Research Group Pg. 13
examines how the money being spent on property development ripples through a regional
economy. Input/Output methodology allows for insight into forward and backward linkages that
are present in any regional economy, highlighting how they add value to the initial dollar spent.
The model – in this case facilitated by the IMPLAN software package – measures the total annual
economic activity that results from inter- and intra-industry transactions.
IMPLAN is an industry standard Input/Output tool used to calculate the direct, indirect and
induced impacts of spending and employment. The model first breaks the economy into 536
separate sectors, with each sector representing an individual industry, and then it uses a sectoring
scheme developed by the IMPLAN Group. This scheme is closely related to the Bureau of
Economic Analysis (BEA) REIS model and is a 536 X 536 (row x column) matrix showing all the
economic activity among the individual sectors. The entries in the matrix are based on the dollar
amount that each industry sells to (and purchases from) other industries in a regional economy. It
measures the amount of final consumption by the residents of the region as well as how much each
industry exports from the area. The model uses data collected at the county level, which are
obtained from the IMPLAN Group and the BEA. County data are in turn aggregated or “rolled-
up” to form service areas such as local regions, states or larger geographic regions, such as the
Southwest. Input/Output models are able to estimate economic impacts because the flow of goods
and services within an economic region is relatively stable. Predictions can be made of an
industry’s total economic impact by examining the purchasing patterns of the individual sectors.
The BEA collects extensive data on these regional trade flows and reports its findings annually.
After the region is selected and the data on spending are entered, how the spending flows
through the region and impacts it can be calculated. The three levels of spending impacts analyzed
are direct, indirect and induced. The direct impact includes the purchases of resources (labor, goods
and services) by real estate developers, builders and construction companies for the completion of
a project. The indirect impact occurs through industry-to-industry purchases made by regional
suppliers. Finally, the induced impact reflects the change in household demand as the employees
of real estate developers, builders and construction companies and the employees of their suppliers
earn dollars for consumer spending. Therefore, the total impact to the economy is the summation
of the direct, indirect and induced components. The indirect and induced portions are commonly
known as the multipliers and their impacts often referred to as the “multiplier effect.” It shows
how the initial (direct) spending get multiplied through the economy. Calculating the multipliers
Section II: THE ECONOMIC IMPACT OF PUBLIC PROJECTS AT DART STATIONS
University of North Texas Economics Research Group Pg. 14
based on the supplier relationships and employee consumption patterns is much more accurate
than simple multiplier tables.
The effects that the three levels of impacts and related spending have on employment is
also calculated in the IMPLAN economic model. Employment is the total number of full-time
wage and salary employees, plus the number of self-employed workers in a particular industry.
Part-time workers’ hours are aggregated into full-time equivalents (2,080 hours), and reported with
the full-time workers. An IMPLAN economic model will draw from multiple sources of data to
offer employment estimates. This is due to the differences in how employment data is gathered by
varying government agencies. In general, because of nondisclosure rules, the employment figure
reported by government agencies often underestimates true employment in a given county. In
accordance with U.S. Code Title 13, Section 9, no datum is published that would disclose the
operations of an individual employer or put an individual employer at an unfair disadvantage.
By carefully combining employment figures reported by the U.S. Department of Labor,
Bureau of Economic Analysis, U.S. Census Bureau and Internal Revenue Service, a fairly
comprehensive employment figure can be reconstructed. The raw data are then “sectored” into
the appropriate North American Industry Classification System (NAICS) and, in turn, combined
into the necessary industry vectors and IMPLAN matrices. The result of this process is a “total
employment” impact figure that is a result of the three levels of economic impacts associated with
the initial spending. An IMPLAN economic model also calculates employee compensation, which
includes all salaries, wages and benefits paid to the industry’s employees resulting from the direct,
indirect and induced employment impacts. The figure includes the proprietors’ income of self-
employed people in the industry. The figures reported are gross amounts and taken from the
IMPLAN data set.
Input/Output methodology and IMPLAN software allow one to leverage and integrate the
enormous amount of data collected by government agencies. As such, a reliable model of how
spending affects a regional economy can be developed. These models take into account not only
how money is initially spent in the “direct” stage of an event, but also inter- and intra-industry
transactions. These transactions establish forward and backward linkages in a regional economy
during the “indirect” and “induced” stages. In addition to spending, these models also estimate the
resulting change in employment. The end product is a comprehensive economic analysis of a given
event and its effect on a region.

Section II: THE ECONOMIC IMPACT OF PUBLIC PROJECTS AT DART STATIONS
University of North Texas Economics Research Group Pg. 15
RESULTS
The following section reports the economic impact of public projects within a quarter-mile
of DART Light Rail stations. The table below details the direct, indirect, induced and total effects
on employment, labor income, value added and output as a result of the development projects.
These effects show the dollar amount of the output and employment impacts for development
spending in the DFW area.
Public Project Impacts
Spending on public projects includes properties built for health care, city halls, school
campuses and other public use properties. To correctly analyze the development spending impact,
properties were held to a strict quarter-mile radius around DART stations. The dollar amounts and
announcements were derived using information from The Dallas Morning News, Dallas Business
Journal and other local sources. The property values have been cross-checked with the Dallas and
Collin county central appraisal districts and verified using a third-party firm (Cushman &
Wakefield). A list of the properties used follows (Table 1).
Table 1: Public Properties within 1/4 mile of DART Stations
Station Project Name
Irving Convention Center Irving Convention Center
Mockingbird Bush Library
Galatyn Park Eisemann Center
Cedars DCCCD District Office
Dallas Police Headquarters
Downtown Plano Courtyard Theater
Hatcher Hatcher Station Health Center
Illinois DART Police Station
Baylor Medical Center Sammons Cancer Center
Downtown Rowlett Rowlett City Hall
Rowlett Public Library
SW Medical Center/Parkland New Parkland Hospital
UNT Dallas UNT Dallas
Section II: THE ECONOMIC IMPACT OF PUBLIC PROJECTS AT DART STATIONS
University of North Texas Economics Research Group Pg. 16
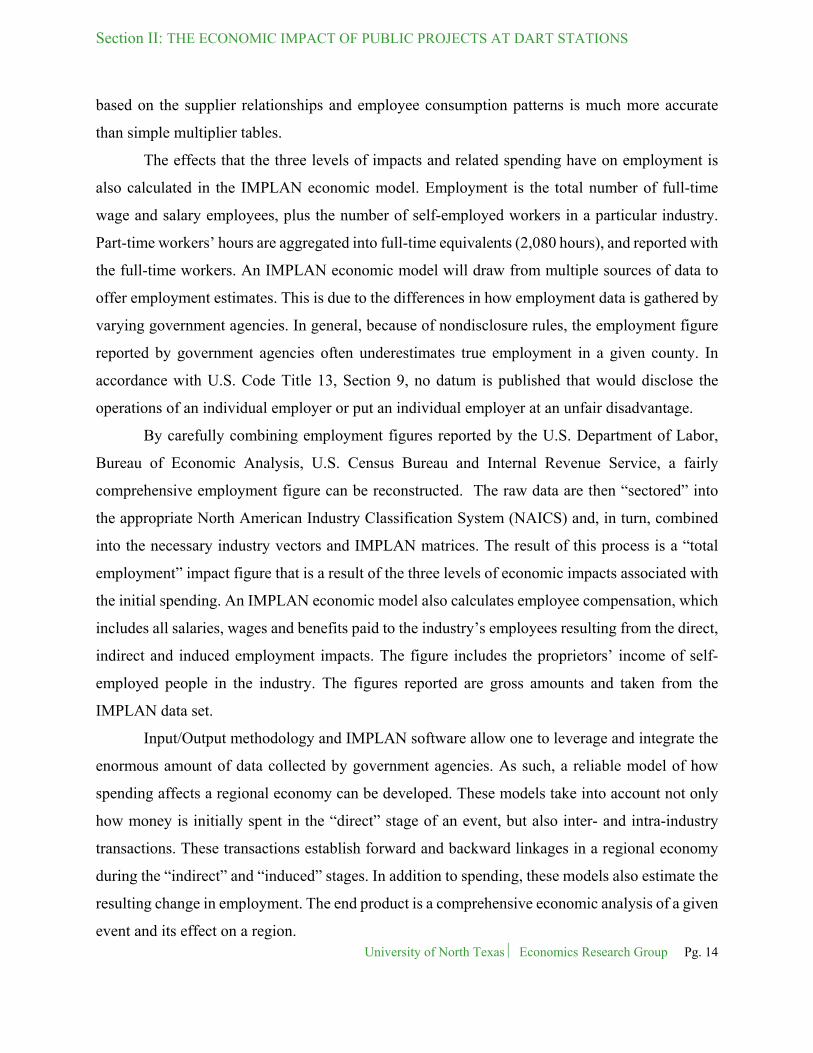
After making the appropriate adjustments, public property spending amounted to
$1,815,333,100. This direct impact generated an additional $682,884,872 of indirect activity as
contractors and construction firms purchased raw materials. Finally, the induced impacts amounted
to $858,142,497, which represents the spending of wages by employees of those suppliers in the
study area. The total economic impact (summation of the direct, indirect and induced effects) from
development spending within a quarter-mile of DART stations amounts to $3,356,360,469 as
shown in Table 2.
Table 2: Impact Summary of Public Properties
Impact Type Employment Labor Income Value Added Output
Direct Effect 12,046 $739,317,390 $938,939,188 $1,815,333,100
Indirect Effect 3,206 $239,001,840 $374,503,750 $682,884,872
Induced Effect 5,490 $292,459,862 $510,154,127 $858,142,497
Total Effect 20,741 $1,270,779,092 $1,823,597,065 $3,356,360,469
Also from Table 2, the description of employment created by public development spending
can be seen. The jobs created by the direct spending total 12,046. Additionally, indirect and
induced effects generated 3,206 and 5,490 jobs, respectively. The total number of jobs created as
a consequence of development of public properties amounts to 20,741. Moreover, value added, a
measure that can be seen as gross regional product, shows how the development of public projects
adds to the local economy. Total value added summed to $1,823,597,065 for public projects.
Section II: THE ECONOMIC IMPACT OF PUBLIC PROJECTS AT DART STATIONS
University of North Texas Economics Research Group Pg. 17
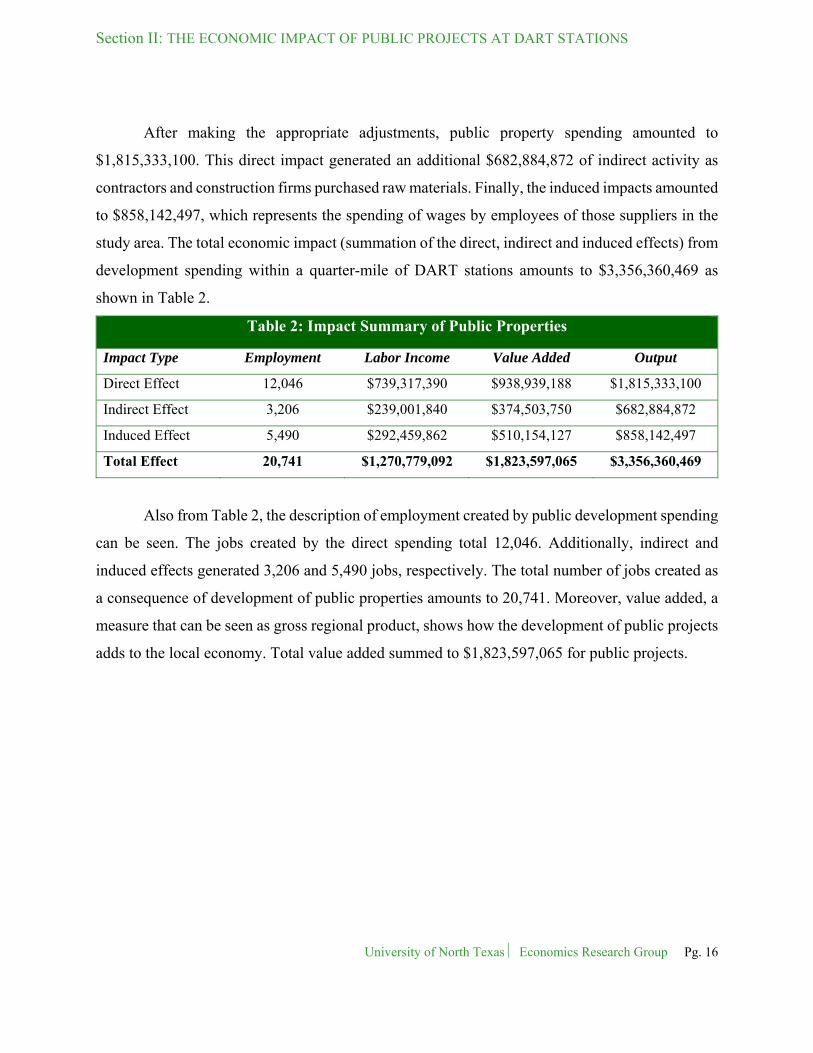
Fiscal Impacts
The effects of public projects within a quarter-mile radius of DART stations generated a
total of $278,141,545 in federal tax revenue and $105,302,562 in state and local taxes. For ease of
comparison, the various federal, state and local taxes have been grouped into four categories:
employee compensation-related taxes, production-related, household and corporate taxes. State
and local and federal details are presented in Table 3.
Table 3: Tax Impacts of Public Properties
Description Total State and Local Tax Total Federal Tax
Employee Compensation $1,342,609 $112,220,297
Proprietor Income N/A $10,570,114
Tax on Production and
Imports $94,555,162 $16,891,166
Households $9,096,993 $105,446,215
Corporations $307,798 $33,013,753
Total $105,302,562 $278,141,545

Section III: THE ECONOMIC AND FISCAL IMPACTS OF DEVELOPMENT NEAR DART STATIONS 2014 – 2015
University of North Texas Economics Research Group Pg. 18
SECTION III: THE ECONOMIC AND FISCAL IMPACTS OF
DEVELOPMENT NEAR DART STATIONS 2014 – 2015
EXECUTIVE SUMMARY
The purpose of this document is to identify and calculate economic impacts of real estate
development projects within a quarter-mile radius of DART light-rail stations. The study is a
follow-up to the 2013 analysis completed by this office and analyzes development projects in 2014
and 2015. The values of all projects included in the analysis were determined through a
combination of steps, including the use of their estimated values as published in the sources
analyzed, cross-checking the properties with the Dallas and Collin county appraisal districts where
possible, and augmenting all information with a review by analysts at Cushman & Wakefield.
IMPLAN software was used to create an economic input-output model to measure the direct,
indirect and induced impacts of the development projects on the Dallas-Fort Worth region.
HIGHLIGHTS
A total of 27 private projects were announced in the two-year period, 16 of which were
characterized as “Completed or Under Construction” and 11 as “Planned or Proposed.”
Projects “Completed or Under Construction” are responsible for $2.03 billion in total
spending throughout the region supporting over 12,000 jobs paying $703 million in
salaries, wages and benefits.
Projects “Completed or Under Construction” generated $69 million in state and local tax
revenue.
Potential spending for projects “Planned or Proposed” could result in $5.1 billion of total
spending in the region, which would support over 31,000 jobs and pay almost $2 billion.
Potential spending for projects “Planned or Proposed” could generate $160 million in state
and local tax revenue.
Section III: THE ECONOMIC AND FISCAL IMPACTS OF DEVELOPMENT NEAR DART STATIONS 2014 – 2015
University of North Texas | Economics Research Group Pg. 19
INTRODUCTION
In 2013, our office examined the economic impacts associated with construction near
DART rail stations. This study is a follow-up to that analysis and examines the impacts of projects
that were proposed, planned, underway or completed near DART stations in 2014 and 2015. As
with the previous study, construction activity is only considered if it took place within a quarter-
mile of a DART station. Further, this study does not include downtown stations. While our focus
is only on projects within a quarter-mile of a DART station, it is likely that the effects of station
proximity spread beyond this impact zone.
METHODOLOGY AND DATA
The underlying data used for the calculation of impacts – the real estate development
projects – were gathered through an ongoing review of publicly announced projects in publications
such as The Dallas Morning News, Dallas Business Journal and assorted community newspapers
and online resources. A total of 27 projects were identified, then organized by type and status of
completion. First, details of the projects were examined, which helped assign them to one of four
categories: “Non-Residential,” “Multi-Family,” “Single-Family,” and “Health Care.” The next
step was to establish their stage of completion. Of the total number of projects, 16 were assessed
as “Completed or Under Construction” and 11 as “Planned or Proposed.” Intermittent consultation
with a DART representative over the two-year period helped refine what emerged as a database of
properties proposed, planned, underway or completed during 2014 and 2015. The values of all
projects included in the database were determined through a combination of steps, including the
use of their estimated values as published in the sources analyzed, cross-checking the properties
with the Dallas and Collin county appraisal districts where possible, and augmenting all
information with a review for accuracy by commercial real estate analysts.
To understand how the effects of development projects constructed within a quarter-mile
of DART stations ripple throughout the economy of the Dallas-Fort Worth region, IMPLAN was
used to create economic models based on the spending data provided. To better understand this
process, a brief look at how impacts are calculated for the development of a property is helpful.
Direct effects are the result of the money initially spent in the region by real estate developers,

Section III: THE ECONOMIC AND FISCAL IMPACTS OF DEVELOPMENT NEAR DART STATIONS 2014 – 2015
University of North Texas | Economics Research Group Pg. 20
builders and construction companies for the completion of a project. This includes money spent to
pay employee salaries, purchase supplies and maintain other operating expenses. Indirect effects
are the result of business-to-business transactions. When suppliers to the companies driving the
development (e.g., an accounting firm) purchase services or supplies, they create the indirect
effect. When the employees of the real estate developers, builders, construction companies and
their suppliers spend their income, this causes the induced effect. If the sum of all the activity from
direct, indirect and induced impacts is greater than the combined spending of the developer, this
is referred to as the multiplier effect. For more detail concerning how the economic impacts were
calculated in this study, please see Appendix A.
RESULTS
What follows are descriptions of the economic and fiscal impacts for “Projects: Completed
and Under Construction” and “Projects: Planned or Proposed.” It should be noted that the
economic impacts for projects not yet in the construction phase are offered as economic scenarios
of what may happen if the projects in question come to fruition. It is reasonable to assume that
some of the projects planned or proposed may never make it to the construction phase. It is also
important to keep in mind that while dollar values are associated with projects as they are
announced, once reaching the construction phase projects may be expanded or contracted in scale
and material costs may have fluctuated from initial projections. These uncertainties can result in
direct spending on a project that is higher or lower than previous expectations.
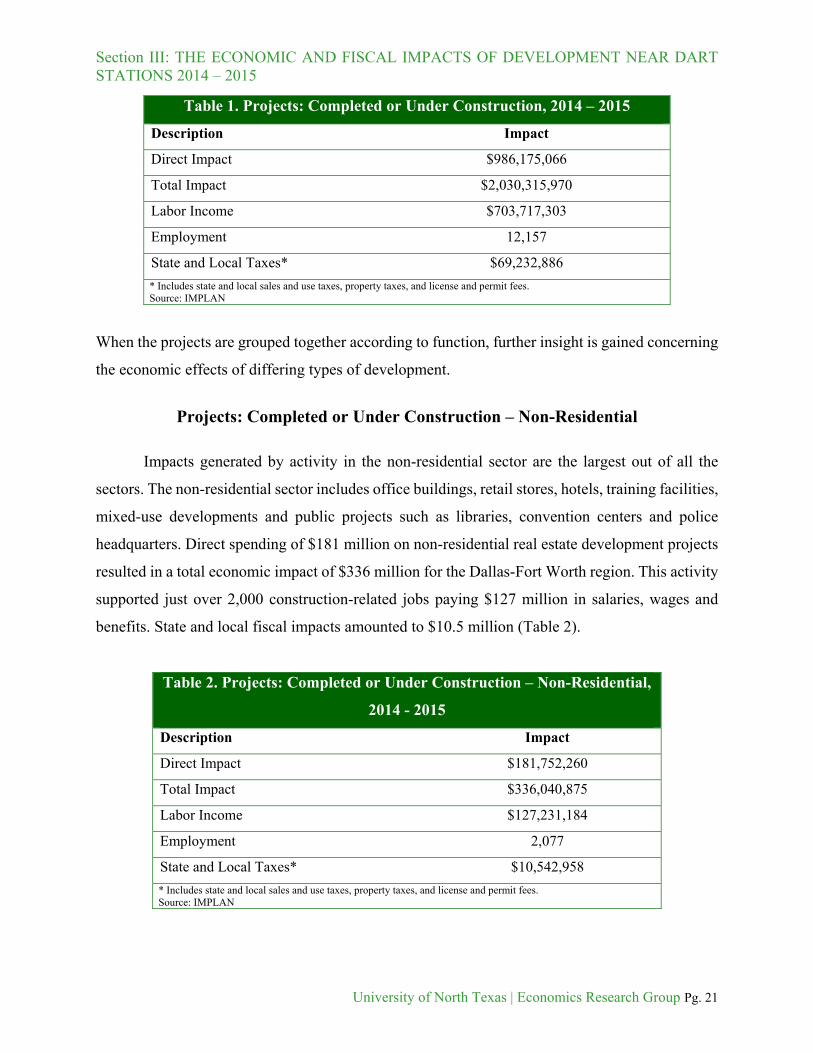
Projects: Completed or Under Construction – Total
Construction activity within a quarter mile of DART rail stations in 2014 and 2015 resulted
in significant economic activity for the Dallas-Fort Worth region. The projects either in the
construction phase or completed in this time frame resulted in over $986 million in direct spending
and a total economic impact of $2.03 billion for the region. This activity created more than 12,000
construction-related jobs paying almost $69 million in salaries, wages and benefits (Table 1).
Section III: THE ECONOMIC AND FISCAL IMPACTS OF DEVELOPMENT NEAR DART STATIONS 2014 – 2015
University of North Texas | Economics Research Group Pg. 21
Table 1. Projects: Completed or Under Construction, 2014 – 2015
Description Impact
Direct Impact $986,175,066
Total Impact $2,030,315,970
Labor Income $703,717,303
Employment 12,157
State and Local Taxes* $69,232,886
* Includes state and local sales and use taxes, property taxes, and license and permit fees. Source: IMPLAN
When the projects are grouped together according to function, further insight is gained concerning
the economic effects of differing types of development.
Projects: Completed or Under Construction – Non-Residential
Impacts generated by activity in the non-residential sector are the largest out of all the
sectors. The non-residential sector includes office buildings, retail stores, hotels, training facilities,
mixed-use developments and public projects such as libraries, convention centers and police
headquarters. Direct spending of $181 million on non-residential real estate development projects
resulted in a total economic impact of $336 million for the Dallas-Fort Worth region. This activity
supported just over 2,000 construction-related jobs paying $127 million in salaries, wages and
benefits. State and local fiscal impacts amounted to $10.5 million (Table 2).
Table 2. Projects: Completed or Under Construction – Non-Residential,
2014 - 2015
Description Impact
Direct Impact $181,752,260
Total Impact $336,040,875
Labor Income $127,231,184
Employment 2,077
State and Local Taxes* $10,542,958
* Includes state and local sales and use taxes, property taxes, and license and permit fees. Source: IMPLAN
Section III: THE ECONOMIC AND FISCAL IMPACTS OF DEVELOPMENT NEAR DART STATIONS 2014 – 2015
University of North Texas | Economics Research Group Pg. 22
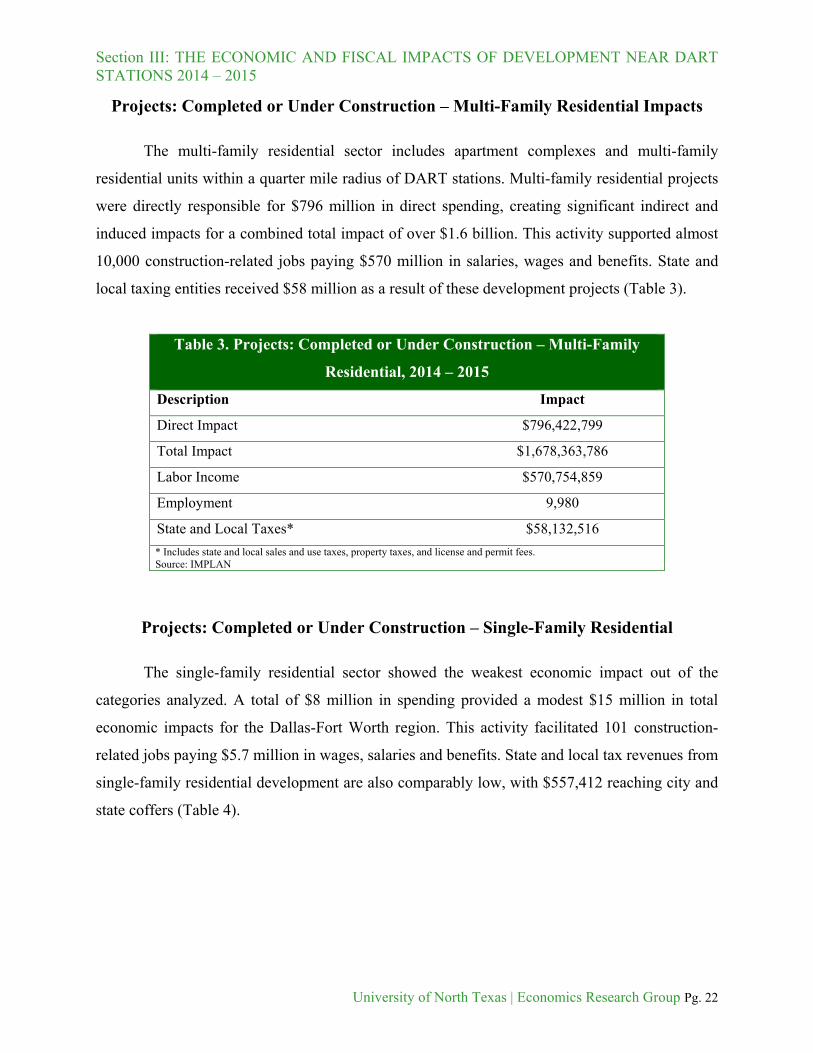
Projects: Completed or Under Construction – Multi-Family Residential Impacts
The multi-family residential sector includes apartment complexes and multi-family
residential units within a quarter mile radius of DART stations. Multi-family residential projects
were directly responsible for $796 million in direct spending, creating significant indirect and
induced impacts for a combined total impact of over $1.6 billion. This activity supported almost
10,000 construction-related jobs paying $570 million in salaries, wages and benefits. State and
local taxing entities received $58 million as a result of these development projects (Table 3).
Table 3. Projects: Completed or Under Construction – Multi-Family
Residential, 2014 – 2015
Description Impact
Direct Impact $796,422,799
Total Impact $1,678,363,786
Labor Income $570,754,859
Employment 9,980
State and Local Taxes* $58,132,516
* Includes state and local sales and use taxes, property taxes, and license and permit fees. Source: IMPLAN
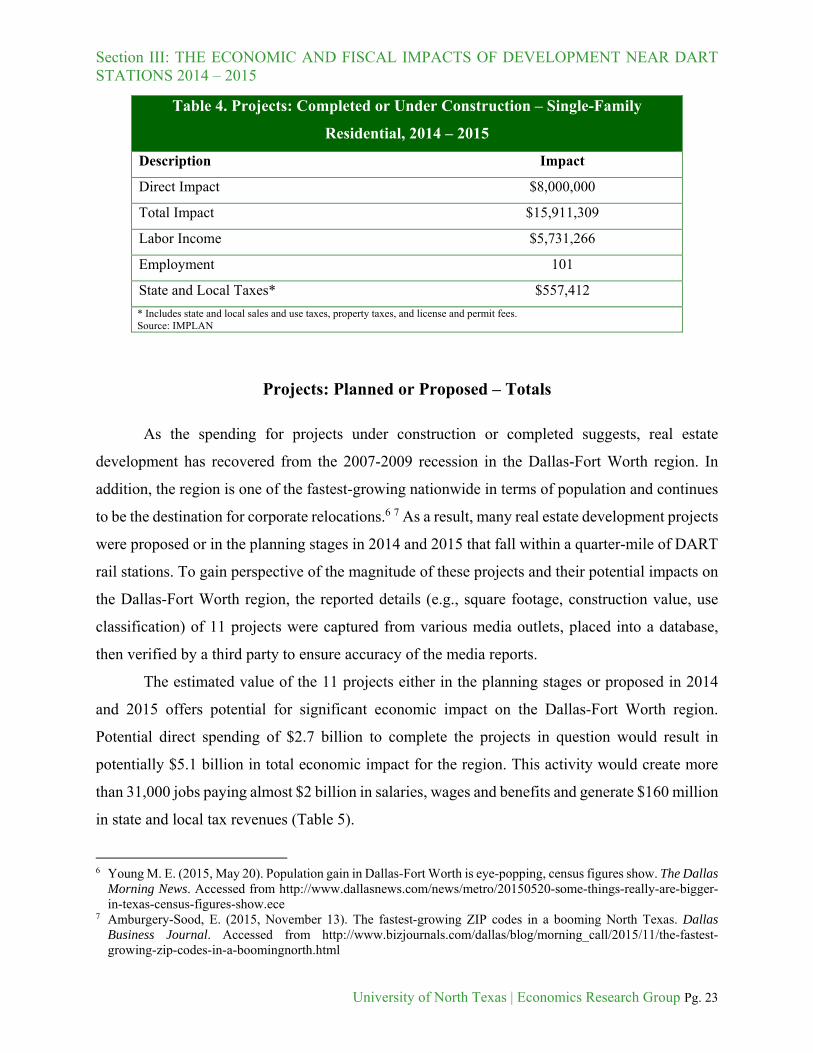
Projects: Completed or Under Construction – Single-Family Residential
The single-family residential sector showed the weakest economic impact out of the
categories analyzed. A total of $8 million in spending provided a modest $15 million in total
economic impacts for the Dallas-Fort Worth region. This activity facilitated 101 construction-
related jobs paying $5.7 million in wages, salaries and benefits. State and local tax revenues from
single-family residential development are also comparably low, with $557,412 reaching city and
state coffers (Table 4).
Section III: THE ECONOMIC AND FISCAL IMPACTS OF DEVELOPMENT NEAR DART STATIONS 2014 – 2015
University of North Texas | Economics Research Group Pg. 23
Table 4. Projects: Completed or Under Construction – Single-Family
Residential, 2014 – 2015
Description Impact
Direct Impact $8,000,000
Total Impact $15,911,309
Labor Income $5,731,266
Employment 101
State and Local Taxes* $557,412
* Includes state and local sales and use taxes, property taxes, and license and permit fees. Source: IMPLAN
Projects: Planned or Proposed – Totals
As the spending for projects under construction or completed suggests, real estate
development has recovered from the 2007-2009 recession in the Dallas-Fort Worth region. In
addition, the region is one of the fastest-growing nationwide in terms of population and continues
to be the destination for corporate relocations.6 7 As a result, many real estate development projects
were proposed or in the planning stages in 2014 and 2015 that fall within a quarter-mile of DART
rail stations. To gain perspective of the magnitude of these projects and their potential impacts on
the Dallas-Fort Worth region, the reported details (e.g., square footage, construction value, use
classification) of 11 projects were captured from various media outlets, placed into a database,
then verified by a third party to ensure accuracy of the media reports.
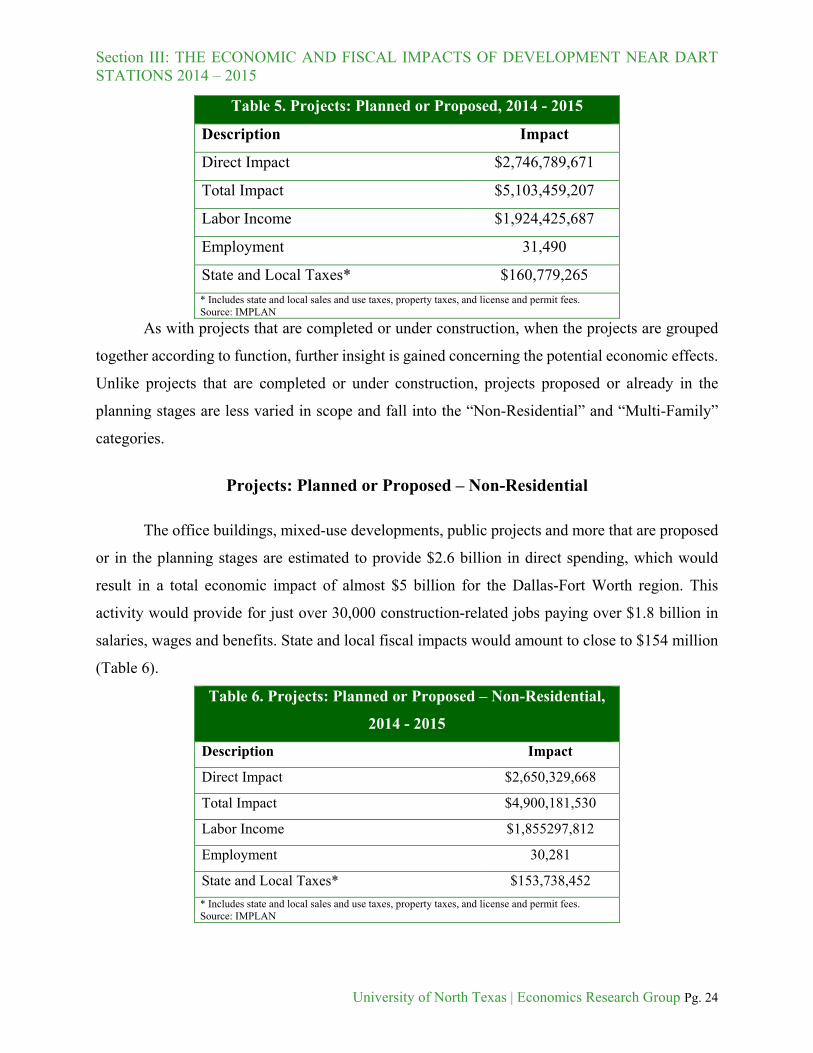
The estimated value of the 11 projects either in the planning stages or proposed in 2014
and 2015 offers potential for significant economic impact on the Dallas-Fort Worth region.
Potential direct spending of $2.7 billion to complete the projects in question would result in
potentially $5.1 billion in total economic impact for the region. This activity would create more
than 31,000 jobs paying almost $2 billion in salaries, wages and benefits and generate $160 million
in state and local tax revenues (Table 5).
6 Young M. E. (2015, May 20). Population gain in Dallas-Fort Worth is eye-popping, census figures show. The Dallas
Morning News. Accessed from http://www.dallasnews.com/news/metro/20150520-some-things-really-are-bigger-in-texas-census-figures-show.ece
7 Amburgery-Sood, E. (2015, November 13). The fastest-growing ZIP codes in a booming North Texas. Dallas Business Journal. Accessed from http://www.bizjournals.com/dallas/blog/morning_call/2015/11/the-fastest-growing-zip-codes-in-a-boomingnorth.html
Section III: THE ECONOMIC AND FISCAL IMPACTS OF DEVELOPMENT NEAR DART STATIONS 2014 – 2015
University of North Texas | Economics Research Group Pg. 24
Table 5. Projects: Planned or Proposed, 2014 - 2015
Description Impact
Direct Impact $2,746,789,671
Total Impact $5,103,459,207
Labor Income $1,924,425,687
Employment 31,490
State and Local Taxes* $160,779,265
* Includes state and local sales and use taxes, property taxes, and license and permit fees. Source: IMPLAN
As with projects that are completed or under construction, when the projects are grouped
together according to function, further insight is gained concerning the potential economic effects.
Unlike projects that are completed or under construction, projects proposed or already in the
planning stages are less varied in scope and fall into the “Non-Residential” and “Multi-Family”
categories.
Projects: Planned or Proposed – Non-Residential
The office buildings, mixed-use developments, public projects and more that are proposed
or in the planning stages are estimated to provide $2.6 billion in direct spending, which would
result in a total economic impact of almost $5 billion for the Dallas-Fort Worth region. This
activity would provide for just over 30,000 construction-related jobs paying over $1.8 billion in
salaries, wages and benefits. State and local fiscal impacts would amount to close to $154 million
(Table 6).
Table 6. Projects: Planned or Proposed – Non-Residential,
2014 - 2015
Description Impact
Direct Impact $2,650,329,668
Total Impact $4,900,181,530
Labor Income $1,855297,812
Employment 30,281
State and Local Taxes* $153,738,452
* Includes state and local sales and use taxes, property taxes, and license and permit fees. Source: IMPLAN
Section III: THE ECONOMIC AND FISCAL IMPACTS OF DEVELOPMENT NEAR DART STATIONS 2014 – 2015
University of North Texas | Economics Research Group Pg. 25
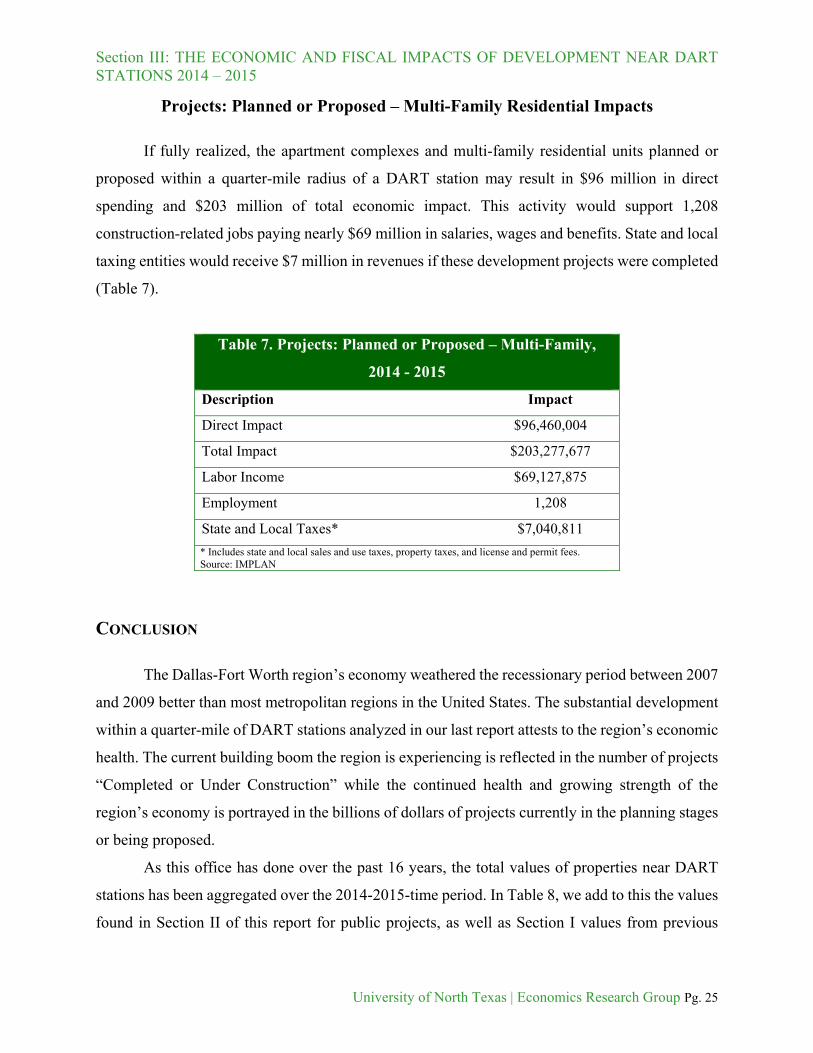
Projects: Planned or Proposed – Multi-Family Residential Impacts
If fully realized, the apartment complexes and multi-family residential units planned or
proposed within a quarter-mile radius of a DART station may result in $96 million in direct
spending and $203 million of total economic impact. This activity would support 1,208
construction-related jobs paying nearly $69 million in salaries, wages and benefits. State and local
taxing entities would receive $7 million in revenues if these development projects were completed
(Table 7).
Table 7. Projects: Planned or Proposed – Multi-Family,
2014 - 2015
Description Impact
Direct Impact $96,460,004
Total Impact $203,277,677
Labor Income $69,127,875
Employment 1,208
State and Local Taxes* $7,040,811
* Includes state and local sales and use taxes, property taxes, and license and permit fees. Source: IMPLAN
CONCLUSION
The Dallas-Fort Worth region’s economy weathered the recessionary period between 2007
and 2009 better than most metropolitan regions in the United States. The substantial development
within a quarter-mile of DART stations analyzed in our last report attests to the region’s economic
health. The current building boom the region is experiencing is reflected in the number of projects
“Completed or Under Construction” while the continued health and growing strength of the
region’s economy is portrayed in the billions of dollars of projects currently in the planning stages
or being proposed.
As this office has done over the past 16 years, the total values of properties near DART
stations has been aggregated over the 2014-2015-time period. In Table 8, we add to this the values
found in Section II of this report for public projects, as well as Section I values from previous
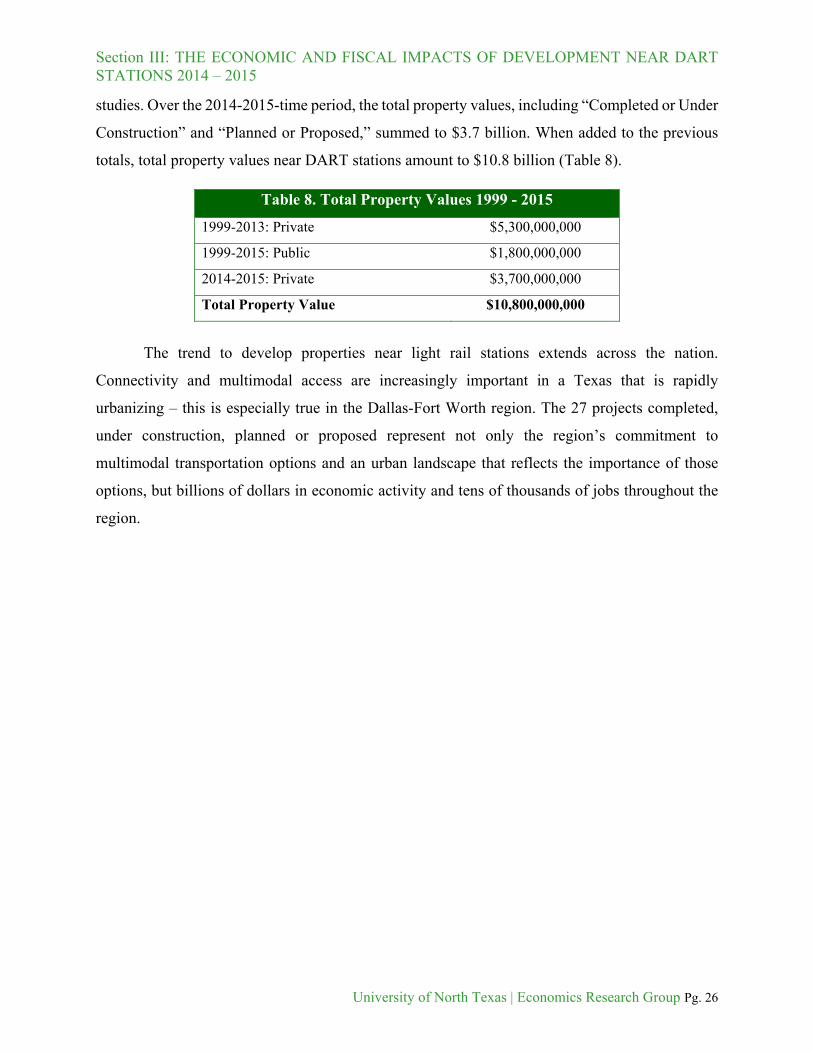
Section III: THE ECONOMIC AND FISCAL IMPACTS OF DEVELOPMENT NEAR DART STATIONS 2014 – 2015
University of North Texas | Economics Research Group Pg. 26
studies. Over the 2014-2015-time period, the total property values, including “Completed or Under
Construction” and “Planned or Proposed,” summed to $3.7 billion. When added to the previous
totals, total property values near DART stations amount to $10.8 billion (Table 8).
The trend to develop properties near light rail stations extends across the nation.
Connectivity and multimodal access are increasingly important in a Texas that is rapidly
urbanizing – this is especially true in the Dallas-Fort Worth region. The 27 projects completed,
under construction, planned or proposed represent not only the region’s commitment to
multimodal transportation options and an urban landscape that reflects the importance of those
options, but billions of dollars in economic activity and tens of thousands of jobs throughout the
region.
Table 8. Total Property Values 1999 - 2015
1999-2013: Private $5,300,000,000
1999-2015: Public $1,800,000,000
2014-2015: Private $3,700,000,000
Total Property Value $10,800,000,000