economic and fiscal impacts of expanding the natural gas
TRANSCRIPT

Economic and Fiscal Impacts of Expanding the Natural Gas Infrastructure in Maryland
Prepared for The Maryland Natural Gas LDCs
January 25, 2016
Towson, Maryland 21252 | 410-704-7374| www.towson.edu/resi

Economic and Fiscal Impacts of Expanding the Natural Gas Infrastructure in Maryland RESI of Towson University
2
Table of Contents Table of Figures ............................................................................................................................... 3 Acknowledgements ......................................................................................................................... 5 1.0 Executive Summary .............................................................................................................. 6
1.1 Current Natural Gas Infrastructure in Maryland.............................................................. 6 1.2 Economic Impacts Associated with Expansion ................................................................ 7 1.3 Fiscal Impacts Associated with Expansion ....................................................................... 7 1.4 Environmental and Health Impacts from Expansion ....................................................... 8
2.0 Introduction/Overview ........................................................................................................ 9 2.1 Study Assumptions ........................................................................................................... 9 2.2 Literature Review ........................................................................................................... 10 2.3 Expansion Programs ....................................................................................................... 11
3.0 Current Natural Gas Infrastructure in Maryland ............................................................... 12 4.0 Cost Savings ....................................................................................................................... 16 5.0 Economic and Fiscal Impacts Associated with Expansion ................................................. 21
5.1 Methodology Overview—Residential Customers .......................................................... 21 5.2 Methodology Overview—Commercial and Industrial Customers ................................. 25 5.3 REMI PI+ Model .............................................................................................................. 27 5.4 Economic and Fiscal Impacts during Investment Phase ................................................ 28 5.5 Economic and Fiscal Impacts during Operation Phase .................................................. 33
6.0 Environmental and Health Impacts from Expansion ......................................................... 35 7.0 Conclusion .......................................................................................................................... 38 8.0 References ......................................................................................................................... 39 Appendix A—Detailed Methodology ............................................................................................ 43 Appendix B—Detailed Economic Impacts .................................................................................... 50
B.1 Detailed Economic Impacts for Construction of Expansion by Year, County, and Type 50 B.2 Detailed Economic Impacts after Expansion by Year, County, and Type ...................... 61

Economic and Fiscal Impacts of Expanding the Natural Gas Infrastructure in Maryland RESI of Towson University
3
Table of Figures
Figure 1: States Engaged in Natural Gas Expansion ..................................................................... 12 Figure 2: Service and Franchise Areas by LDC, 2015 .................................................................... 13 Figure 3: Current Natural Gas Distribution Lines by County, 2015 .............................................. 14 Figure 4: Current Natural Gas Customers in Maryland by Type by County, 2015 ....................... 15 Figure 5: Economic Baseline Variables by County for Maryland, 2015 ........................................ 17 Figure 6: Current Costs and Savings to Maryland Households using Natural Gas, 2015 ............. 18 Figure 7: Household Savings of Natural Gas ............................................................................... 19 Figure 8: Total Household Costs using Other Energy Sources, 2015 ............................................ 19 Figure 9: Current Costs and Savings to Maryland Commercial/Industrial Establishments using Natural Gas, 2015 ......................................................................................................................... 20 Figure 10: Total Commercial/Industrial Establishments Costs Using Other Energy Sources, 2015....................................................................................................................................................... 20 Figure 11: Current Natural Gas Customers in Maryland by Type by County, 2015 ..................... 22 Figure 12 Forecasted New Residential Customers as a Result of Expansion by County, 2026 .... 24 Figure 13: Estimated Commercial and Industrial Natural Gas Customers by 2026 ..................... 26 Figure 14: Estimated Total Natural Gas Customers by Type by County, 2026 ............................. 29 Figure 15: Potential Natural Gas Construction Costs for Line Expansions by County .................. 31 Figure 16: Construction Phase Economic Impacts to Maryland, 2016–2026 ............................... 32 Figure 17: Fiscal Impacts to Maryland, 2016–2026 ...................................................................... 33 Figure 18: Total Conversion Cost and Savings Estimates, 2016–2026 ......................................... 34 Figure 19: Annual Economic Impacts to Maryland, 2016–2026 ................................................... 34 Figure 20: Annual Fiscal Impacts to Maryland, 2016–2026 .......................................................... 35 Figure 21: Current Natural Gas Mains and Capacity Loads, 2014 ................................................ 46 Figure 22: Commercial and Industrial Natural Gas Customers by County for 2016 and 2026 .... 47 Figure 23: Commercial and Industrial Natural Gas Customers by County for 2015 .................... 48 Figure 24: Commercial and Industrial Natural Gas Savings for All Establishments Weighted by Size Category ................................................................................................................................. 49 Figure 25: Economic Impacts from Natural Gas Expansion by County, 2016 .............................. 50 Figure 26: Economic Impacts from Natural Gas Expansion by County, 2017 .............................. 51 Figure 27: Economic Impacts from Natural Gas Expansion by County, 2018 .............................. 52 Figure 28: Economic Impacts from Natural Gas Expansion by County, 2019 .............................. 53 Figure 29: Economic Impacts from Natural Gas Expansion by County, 2020 .............................. 54 Figure 30: Economic Impacts from Natural Gas Expansion by County, 2021 .............................. 55 Figure 31: Economic Impacts from Natural Gas Expansion by County, 2022 .............................. 56 Figure 32: Economic Impacts from Natural Gas Expansion by County, 2023 .............................. 57 Figure 33: Economic Impacts from Natural Gas Expansion by County, 2024 .............................. 58 Figure 34: Economic Impacts from Natural Gas Expansion by County, 2025 .............................. 59 Figure 35: Economic Impacts from Natural Gas Expansion by County, 2026 .............................. 60 Figure 36: Economic Impacts from Natural Gas Expansion by County, 2016 .............................. 61 Figure 37: Economic Impacts from Natural Gas Expansion by County, 2017 .............................. 62

Economic and Fiscal Impacts of Expanding the Natural Gas Infrastructure in Maryland RESI of Towson University
4
Figure 38: Economic Impacts from Natural Gas Expansion by County, 2018 .............................. 63 Figure 39: Economic Impacts from Natural Gas Expansion by County, 2019 .............................. 64 Figure 40: Economic Impacts from Natural Gas Expansion by County, 2020 .............................. 65 Figure 41: Economic Impacts from Natural Gas Expansion by County, 2021 .............................. 66 Figure 42: Economic Impacts from Natural Gas Expansion by County, 2022 .............................. 67 Figure 43: Economic Impacts from Natural Gas Expansion by County, 2023 .............................. 68 Figure 44: Economic Impacts from Natural Gas Expansion by County, 2024 .............................. 69 Figure 45: Economic Impacts from Natural Gas Expansion by County, 2025 .............................. 70 Figure 46: Economic Impacts from Natural Gas Expansion by County, 2026 .............................. 71

Economic and Fiscal Impacts of Expanding the Natural Gas Infrastructure in Maryland RESI of Towson University
5
Acknowledgements Project Management Daraius Irani, Ph.D., Chief Economist Raquel Frye, Managing Director Research Team Regina Asala-Butler, Research Associate Catherine Menking, Research Assistant Susan Steward, Senior Economist RESI would like to thank all those who assisted with data collection, analysis, and feedback during the study period.

Economic and Fiscal Impacts of Expanding the Natural Gas Infrastructure in Maryland RESI of Towson University
6
1.0 Executive Summary RESI calculated the economic and fiscal impacts of an expansion of the natural gas infrastructure on industrial, commercial, and residential users for a projected ten-year period from 2016 through 2026. Beyond the economic and fiscal impacts, this report briefly addresses the environmental and health impacts of such an expansion. 1.1 Current Natural Gas Infrastructure in Maryland The U.S. Energy Information Administration (EIA) estimates that nearly 44.2 percent of all Maryland households use natural gas as a main heating source, a percentage which ranks natural gas number one in heating energy use.1 According to their own customer data, Maryland Natural Gas Local Distribution Companies currently service more than 1.1 million Maryland households with natural gas. An additional 67,986 of their commercial and industrial establishments also use natural gas every day. Natural gas is now readily recognized as a lower-cost and abundant source of energy. U.S. natural gas consumption is growing for a variety of reasons—not only through households’ and businesses’ increased adoption but also through statewide infrastructure expansion efforts. In particular, several states, including the majority of those surrounding Maryland, are “increasingly adopting innovative regulatory mechanisms to align utility incentives with policy goals of improving energy usage, providing access to natural gas, and reducing emissions.”2 Households and establishments stand to realize considerable savings when making the switch from other energy sources to natural gas. 1.2 Natural Gas Cost Savings in Maryland As consumers of natural gas, Maryland residents and businesses benefit from significant savings when compared with other energy sources. Annually, households using natural gas could save on average:
$806 more than households using heating oil,
$1,172 more than households using electricity, and
$1,705 more than households using propane. While households comprise the greatest share of natural gas users, commercial and industrial entities benefit from higher savings due to greater energy needs. When compared to other energy sources, Maryland commercial and industrial entities using natural gas could save on average:
$12,615 more than entities using heating oil,
1 U.S. Energy Information Administration, “Maryland State Energy Profile,” accessed November 4, 2015, http://www.eia.gov/state/print.cfm?sid=MD. 2 American Gas Association, “Got Growth? Defining US Gas Utility Growth in an Era of Efficiency and Natural Gas Resource Abundance,” September 18, 2015, 10, accessed November 4, 2015, https://www.aga.org/sites/default/files/ea_2015-4_got_growth.pdf.

Economic and Fiscal Impacts of Expanding the Natural Gas Infrastructure in Maryland RESI of Towson University
7
$10,730 compared to using electricity, and
$25,650 more than those using propane. 1.2 Economic Impacts Associated with Expansion RESI estimated that 134 additional miles of lines will be added to the existing State infrastructure to accommodate potential new customers.3 The results of this construction investment and resulting conversion activity would yield significant benefits to the State.
Over ten years, an average of 7,318 jobs would be supported each year.
New natural gas pipelines, household conversions, and hookups would add an average $395.7 million in output and $349.7 million in wages each year to Maryland’s economy.
Using the difference between existing forecasted natural gas demand and RESI’s new natural gas demand estimates due to expansion, RESI estimated that the costs savings would annually support an average of 1,306 jobs with an average wage of $61,417, $80.2 million in wages, and $185.7 million in output. 1.3 Fiscal Impacts Associated with Expansion RESI also estimated the following fiscal impacts as a result of the expansion of new lines.
Nearly $19.5 million yearly in state and local tax revenues will be created for Maryland on average over the ten-year period.
Of that total, the largest revenues will be property tax revenues, at an average of $6.0 million per year.
Average annual sales and income will account for $5.6 million and $4.2 million, respectively, of new tax revenues collected throughout the investment in new lines and conversions.
RESI estimated the following fiscal impacts related to Maryland residents increasing their demand for natural gas.
An average of nearly $5.9 million in new state and local tax revenues will accrue annually over the ten years.
The largest portion of new revenues will be property tax revenues—a gain of $1.8 million on average per year from 2016 to 2026.
Sales and income tax revenues will account for the second highest contribution to fiscal rolls from 2016 to 2026, contributing on average $1.7 million and $1.3 million, respectively, per year.
3 The mileage of pipeline required to reach areas that are more remote from existing infrastructure would be much longer. The longer, higher pressure pipelines that would be needed to reach these remote areas would most likely be constructed by interstate pipeline companies, which are federally regulated, rather than LDCs.

Economic and Fiscal Impacts of Expanding the Natural Gas Infrastructure in Maryland RESI of Towson University
8
1.4 Environmental and Health Impacts from Expansion The expansion of natural gas infrastructure and household conversions should be viewed as an opportunity to reduce greenhouse emissions when compared to high-carbon options such as coal and oil and should be considered among the suite of greenhouse gas emissions reduction tools. Today, the increased conversion to natural gas from carbon-intensive, coal-based generation has contributed to lower carbon emissions in the U.S. In addition, improving Maryland households’ access to natural gas can help the state continue to meet its Regional Greenhouse Gas Initiative (RGGI) targets. The reduction of emissions from electricity generators switching to natural gas was a significant contributor to CO2 emissions levels that were lower than expected during the RGGI baseline period in 2007.4 As well as the environmental impacts, scientists have theorized a strong link between carbon-reduction strategies and positive health outcomes.5 Strategies that reduce greenhouse gas—such as moving away from carbon-depending energy sources—can reduce indoor and outdoor air pollution, improve water quality, and help to decrease health concerns associated with poor air quality.
4 Maryland Department of the Environment, “Regional Greenhouse Gas Initiative and the Maryland CO2 Budget Trading Program,” accessed December 21, 2015, https://www.mwcog.org/uploads/committee-documents/bV1dVl1d20120913081025.pdf. 5 Margaret Chan, “Cutting carbon, improving health,” The Lancet (2009): 2, accessed December 21, 2015, http://www.who.int/globalchange/publications/LCT_Climate_09cmt7843.pdf.

Economic and Fiscal Impacts of Expanding the Natural Gas Infrastructure in Maryland RESI of Towson University
9
2.0 Introduction/Overview A group of Maryland Natural Gas Local Distribution Companies6 (MD Natural Gas LDCs) tasked the Regional Economic Studies Institute (RESI) of Towson University with completing an economic and fiscal impact analysis of expanding the LDCs’ natural gas infrastructure in Maryland.7 Beyond the economic and fiscal impacts, this report briefly addresses environmental and health impacts of such an expansion. For this analysis, RESI examined the expansion of the natural gas infrastructure on industrial, commercial, and residential users for a projected ten-year period of construction, expansion, and installation from 2016 through 2026. 2.1 Study Assumptions To analyze the potential economic and fiscal impacts associated with expansion of natural gas service in Maryland, RESI analyzed the ten-year period from 2016 through 2026. RESI relied on data that the MD Natural Gas LDCs provided to develop a base market of current natural gas consumption. RESI estimated the universe of existing homes that could potentially convert to natural gas using publicly available data on household counts. Using both sets of data, RESI established a possible base from which future impacts associated with the construction of new pipelines and households converting to natural gas could be estimated. To analyze the current market size, RESI relied on data that the MD Natural Gas LDCs provided regarding current household customers. Households were divided into two categories: (1) current natural gas customers as reported by the MD Natural Gas LDCs and (2) the total universe of households within Maryland (or current non-serviced households). The non-serviced household units are those units within Maryland that could be serviced, but either have not converted or do not have access to convert to natural gas. Analyzing historical trends associated with conversion indicated that the rates of conversion for existing households within a region that have access to natural gas pipelines tends to be approximately 17 to 23 percent over a six-year period.8 For households on newly constructed service lines, RESI found that, for the Northeast region, an estimated 50 to 60 percent of new homes constructed will choose natural gas.9 Using these rates, RESI estimated the potential number of households that would become new customers over the ten-year period.
6 Baltimore Gas and Electric, Chesapeake Utilities, Columbia Gas, Elkton Gas, and Washington Gas. 7 Maryland Natural Gas LDCs, or local distribution companies, provide natural gas distribution and sales service to retail customers and are regulated by the Public Service Commission of Maryland. 8 Richard Ready, Ph.D., “Analysis of Potential Demand for the Extension and Expansion of Natural Gas Distribution Infrastructure in Pennsylvania: A Report in Response to Senate Resolution,” The Center for Rural Pennsylvania (November 2013): 29, accessed November 4, 2015, www.rural.palegislature.us/documents/reports/Natural-Gas-Infrastructure-SR29.pdf. 9 U.S. Energy Information Administration, “Everywhere but Northeast, fewer homes choose natural gas as heating fuel,” September 25, 2014, accessed December 22, 2015, https://www.eia.gov/todayinenergy/detail.cfm?id=18131.

Economic and Fiscal Impacts of Expanding the Natural Gas Infrastructure in Maryland RESI of Towson University
10
In addition to the rates of conversion to natural gas, RESI made assumptions regarding the potential areas of expansion and construction costs. Using the National Pipeline Mapping System (NPMS), RESI estimated the miles from current pipelines to feasible areas of expansion (based on household density), then multiplied the distance by cost per mile of expansion. Finally, to determine the potential savings to commercial and industrial entities, RESI used data that the MD Natural Gas LDCs provided to analyze the current loads of use for commercial and industrial entities. RESI estimated future loads and costs using the current database of known establishments by size category by NAICS codes according to County Business Patterns data. To estimate the potential economic impacts, RESI weighted the current loads by business size category and applied the costs/savings to the estimated conversions by County. This analysis is further discussed in Appendix A. To develop some of the key assumptions for the study, RESI conducted a literature review of similar studies and expansion efforts in other states. These studies and findings associated provided a base for all assumptions and estimation methods in this report. 2.2 Literature Review Studies regarding natural gas infrastructure expansion in states such as Alaska, Pennsylvania, and Connecticut have been published. The study completed for Fairbanks, Alaska, was an in-depth analysis of both possible natural gas demand using current conversion rates and possible demand derived from business interviews and a household survey.10 The study assumed that conversion decisions depend on at least three variables: cost of installation, annual energy costs/savings, and repayment timeframe.11 In addition, the researchers found that conversion decisions also depend on resident age (older populations have higher conversion rates) and mobility (highly transient areas have lower conversion rates). 12 To estimate household demand, the Pennsylvania study sought to measure the willingness to pay (WTP) and possible conversion rates when customers were presented with an option to convert to natural gas. The study relied on a customer phone survey administered in summer 2013. The survey specifically presented homeowner survey respondents with different scenarios regarding the upfront costs to connect/convert to natural gas and the anticipated annual savings that would result, and were asked whether they would or would not connect/convert under those scenarios.13
10 Cardno ENTRIX, “IEP Natural Gas Conversion Analysis: Fairbanks LNG Distribution System Demand Analysis,” January 14, 2014, ES-2, accessed November 4, 2015, http://www.interiorenergyproject.com/Resources%20and%20Documents/IEP_Conversion_Analysis_Final.pdf. 11 Ibid, ES-3. 12 Ibid, 2-5. 13 Ready, “Analysis of Potential Demand for the Extension and Expansion of Natural Gas Distribution Infrastructure in Pennsylvania: A Report in Response to Senate Resolution,” 29.

Economic and Fiscal Impacts of Expanding the Natural Gas Infrastructure in Maryland RESI of Towson University
11
The survey included nine different scenarios regarding conversion cost estimates and payback timeframes. Findings indicated that the cost of conversion may be a less important factor when considering the change to natural gas in cases where the benefit of a smaller payback period outweighs the upfront costs over time. Nevertheless, the study found that half (or even more) of Pennsylvania households would not connect to natural gas regardless of the upfront cost or payback period of their investment.14 In 2011, Connecticut measured the economic impact of expanding natural gas access in the state. The study assumed that all “utilities pay for the infrastructure buildout and home and business owners pay for equipment conversion.”15 In addition, the analyses concluded that the largest impacts to jobs, taxes, and output occurred during the buildout and conversion period. The economic impacts during this period were significant—amounting to approximately 8,000 jobs per year for the first five years, and 3,100 for the last four.16 The impacts were significant in this study mostly as a result of the high conversion rates—and volume of conversions to natural gas—for the residential, commercial, and industrial sectors. In addition, the number of oil users within the Connecticut region is sizeable. In a region with high consumption and colder winters, the cost/benefit of switching favored conversion to natural gas. 2.3 Expansion Programs U.S. natural gas consumption is growing for a variety of reasons—due not only to households’ and businesses’ increased adoption but also to statewide infrastructure expansion efforts. In particular, several states, the majority of those surrounding Maryland, are “increasingly adopting innovative regulatory mechanisms to align utility incentives with policy goals of improving energy usage, providing access to natural gas, and reducing emissions.”17 As shown in Figure 1, a number of states have engaged in or are currently pursuing natural gas expansion efforts to bring online households and businesses that are currently underserved by existing infrastructure. These investments are predicated on a recognition that access to natural gas enables both economic and environmental benefits. Programs employ a multitude of methods, including incentives for converting, funding for infrastructure expansion, and cost recovery programs for providers. While some of these programs have been implemented through legislation, others are part of state energy strategies
14 Ready, “Analysis of Potential Demand for the Extension and Expansion of Natural Gas Distribution Infrastructure in Pennsylvania: A Report in Response to Senate Resolution 29,” 6. 15 Stanley McMillen, Ph.D., and Nandika Prakash, “The Economic Impact of Expanding Natural Gas Use in Connecticut,” Department of Economic and Community Development (December 2011): 1, accessed November 4, 2015, www.ct.gov/deep/lib/deep/energy/cep/decd-the_economic_impact_of_expanding_natural_gas_use_in_connecticut.pdf. 16 Ibid. 17 American Gas Association, “Got Growth? Defining US Gas Utility Growth in an Era of Efficiency and Natural Gas Resource Abundance,” 10.

Economic and Fiscal Impacts of Expanding the Natural Gas Infrastructure in Maryland RESI of Towson University
12
or provider initiatives. Through increases in availability and affordability, these programs seek to expand residents’ natural gas utilization. Figure 1: States Engaged in Natural Gas Expansion
Sources: American Gas Association, RESI
3.0 Current Natural Gas Infrastructure in Maryland The U.S. Energy Information Administration (EIA) estimates that nearly 44.2 percent of all Maryland households use natural gas as a main heating source, ranking it number one in heating energy use.18 In Maryland, the majority of residents and firms across all counties have the opportunity to be serviced by natural gas. Figure 2 represents the current natural gas service areas for each of the five gas utilities that commissioned this report.
18 U.S. Energy Information Administration, “Maryland State Energy Profile,” accessed November 4, 2015, http://www.eia.gov/state/print.cfm?sid=MD.

Economic and Fiscal Impacts of Expanding the Natural Gas Infrastructure in Maryland RESI of Towson University
13
Figure 2: Service and Franchise Areas by LDC, 2015
Source: MD Natural Gas LDCs, CGIS

Economic and Fiscal Impacts of Expanding the Natural Gas Infrastructure in Maryland RESI of Towson University
14
As shown in Figure 2, Central Maryland and parts of Western and Eastern Maryland are currently serviced by MD Natural Gas LDCs such as Baltimore Gas and Electric (BGE), Washington Gas, Columbia Gas, Chesapeake Utilities, Easton Utilities, and Elkton Gas. The state is also serviced by other smaller utilities that were not part of this study.19 To operate distribution pipelines, Maryland public utilities have been granted franchises from the Maryland Public Service Commission (MD PSC).20 The MD PSC also reviews small utilities’ prices and purchasing to ensure safety, reliability, and “reasonable costs.”21 Specific pipeline locations and franchise areas for all utilities that commissioned this study were not available for this report. However, to provide more detail regarding the current natural gas infrastructure in Maryland, Figure 3 details active natural gas distribution lines by county. Figure 3: Current Natural Gas Distribution Lines by County, 2015
County Transmission Lines
Allegany County Yes Anne Arundel Yes Baltimore City Yes Baltimore County Yes Calvert County Yes Caroline County Yes Carroll County Yes Cecil County Yes Charles County Yes Dorchester County Yes Frederick County Yes Garrett County Yes Harford County Yes Howard County Yes Kent County No Montgomery County Yes Prince George’s County Yes Queen Anne’s County No St. Mary’s County Yes Somerset County No Talbot County Yes Washington County Yes Wicomico County Yes Worcester County Yes
Sources: NPMS, RESI
19 “Consumer Corner - Natural Gas,” Maryland Office of People’s Counsel, accessed January 8, 2016, http://www.opc.state.md.us/ConsumerCorner/NaturalGas.aspx. 20 Ibid. 21 Ibid.

Economic and Fiscal Impacts of Expanding the Natural Gas Infrastructure in Maryland RESI of Towson University
15
To quantify the current natural gas customer base, the MD Natural Gas LDCs provided data that RESI used to determine the breakdown of their current customers across counties. Figure 4 reports the current natural gas customer base by county. 22
Figure 4: Current Natural Gas Customers in Maryland by Type by County, 201523
County Residential Commercial/Industrial Total
Allegany County 15,579 1,490 17,069 Anne Arundel 93,622 7,142 100,764 Baltimore City 190,532 12,719 203,251 Baltimore County 204,374 14,195 218,569 Calvert County 1177 315 1,492 Caroline County 0 0 0 Carroll County 14,034 1,581 15,615 Cecil County 6,387 546 6,933 Charles County 16,882 801 17,683 Dorchester County 0 0 0 Frederick County 27,195 2,944 30,139 Garrett County 1548 341 1,889 Harford County 42,888 3,050 45,938 Howard County 55,129 4,080 59,209 Kent County 0 0 0 Montgomery County 228,307 11,284 239,591 Prince George’s County 174,605 11,650 186,255 Queen Anne’s County 0 0 0 St. Mary’s County 5,599 396 5,995 Somerset County 0 0 0 Talbot County 0 0 0 Washington County 11,970 1,947 13,917 Wicomico County 0 0 0 Worcester County 2,400 0 2,400
Total 1,092,228 74,481 1,166,709
Sources: Maryland Natural Gas LDC, RESI The existing residential, commercial, and industrial establishments served as a variable to evaluate customer savings, usage, and potential conversions in Sections 4.0 and 5.0. Note that a zero does not necessarily indicate a lack of natural gas customers in a specific county as these
22Only data provided by MD Natural Gas LDCs is reported in Figure 4 and does not represent to total universe of current household customers in Maryland. 23 Establishments listed here may include self-employed establishments. For Baltimore City, these establishments are approximately 44,000 as of ACS 2013 Estimates.

Economic and Fiscal Impacts of Expanding the Natural Gas Infrastructure in Maryland RESI of Towson University
16
numbers only reflect data that the LDCs that commissioned report provided to RESI during the study period.
4.0 Cost Savings Natural gas is now readily recognized as a lower-cost and abundant source of energy. Households and establishments stand to realize considerable savings when making the switch from other energy sources to natural gas. To estimate current market savings, RESI relied on a number of data sources. For instance, the MD PSC tracks data regarding natural gas service, providers, and natural gas costs within Maryland on a quarterly basis. RESI combined industry data from the Natural Gas LDCs and federal data sources (i.e., Bureau of Labor Statistics (BLS), American Community Survey (ACS) and EIA) for data on consumption and pricing. RESI developed current market demographic data across all counties within Maryland. Figure 5 reports relevant baseline economic data for each county.

Economic and Fiscal Impacts of Expanding the Natural Gas Infrastructure in Maryland RESI of Towson University
17
Figure 5: Economic Baseline Variables by County for Maryland, 2015
County Total Number of Establishments Total Number of Households
Allegany County 1,613 33,271 Anne Arundel 13,750 214,191 Baltimore City 12,280 296,256 Baltimore County 19,782 335,679 Calvert County 1,688 33,996 Caroline County 585 13,482 Carroll County 4,255 62,499 Cecil County 1,784 41,431 Charles County 2,622 55,645 Dorchester County 717 16,607 Frederick County 5,955 90,910 Garrett County 906 18,889 Harford County 5,319 96,312 Howard County 8,946 110,576 Kent County 636 10,585 Montgomery County 26,739 377,824 Prince George’s County 14,281 328,432 Queen Anne’s County 1,348 20,285 St. Mary’s County 1,928 41,847 Somerset County 366 11,116 Talbot County 1,467 19,742 Washington County 3,426 60,804 Wicomico County 2,530 41,240 Worcester County 2,109 55,666
Total 135,032 2,387,285
Sources: ACS, REMI PI+, CBP, RESI Figure 5 represents the universe of total establishment and households in Maryland. However, it is important to note that, for a variety of reasons, the total universe may not have the ability to connect to natural gas and therefore may be unable to obtain service even through an expansion of the current system. For example, the existing distance from transmission or distribution lines could prohibit expansion in certain areas without some form of large-scale external funding. Other factors could include outdated zoning laws24 or low population density in more rural areas of the state. As reported in Figure 4, there are more than 1.1 million residential units and 74,481 commercial and industrial entities using natural gas as an energy source in Maryland. Using information
24 “WASHINGTON GAS LIGHT COMPANY v. PRINCE GEORGE COUNTY COUNCIL,” FindLaw, March 25, 2013, accessed November 18, 2015, http://caselaw.findlaw.com/us-4th-circuit/1625809.html.
Economic and Fiscal Impacts of Expanding the Natural Gas Infrastructure in Maryland RESI of Towson University
18
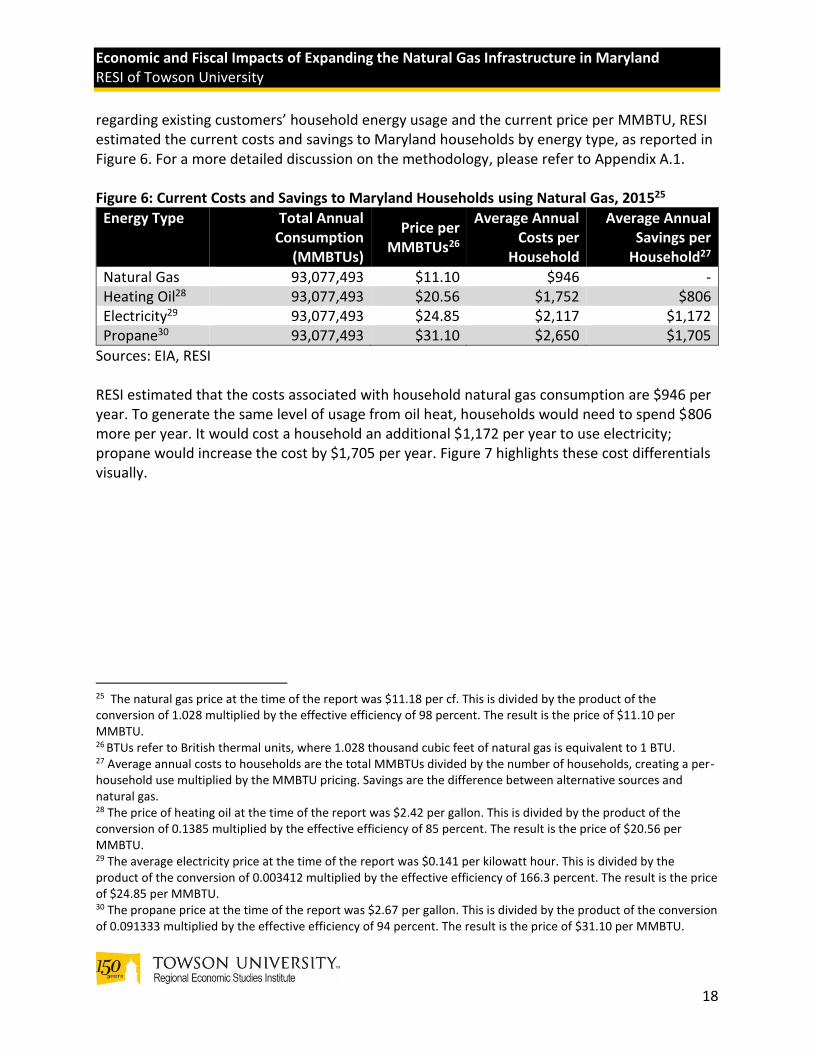
regarding existing customers’ household energy usage and the current price per MMBTU, RESI estimated the current costs and savings to Maryland households by energy type, as reported in Figure 6. For a more detailed discussion on the methodology, please refer to Appendix A.1. Figure 6: Current Costs and Savings to Maryland Households using Natural Gas, 201525
Energy Type Total Annual Consumption
(MMBTUs)
Price per MMBTUs26
Average Annual Costs per
Household
Average Annual Savings per
Household27
Natural Gas 93,077,493 $11.10 $946 - Heating Oil28 93,077,493 $20.56 $1,752 $806 Electricity29 93,077,493 $24.85 $2,117 $1,172 Propane30 93,077,493 $31.10 $2,650 $1,705
Sources: EIA, RESI RESI estimated that the costs associated with household natural gas consumption are $946 per year. To generate the same level of usage from oil heat, households would need to spend $806 more per year. It would cost a household an additional $1,172 per year to use electricity; propane would increase the cost by $1,705 per year. Figure 7 highlights these cost differentials visually.
25 The natural gas price at the time of the report was $11.18 per cf. This is divided by the product of the conversion of 1.028 multiplied by the effective efficiency of 98 percent. The result is the price of $11.10 per MMBTU. 26 BTUs refer to British thermal units, where 1.028 thousand cubic feet of natural gas is equivalent to 1 BTU. 27 Average annual costs to households are the total MMBTUs divided by the number of households, creating a per-household use multiplied by the MMBTU pricing. Savings are the difference between alternative sources and natural gas.
28 The price of heating oil at the time of the report was $2.42 per gallon. This is divided by the product of the conversion of 0.1385 multiplied by the effective efficiency of 85 percent. The result is the price of $20.56 per MMBTU. 29 The average electricity price at the time of the report was $0.141 per kilowatt hour. This is divided by the product of the conversion of 0.003412 multiplied by the effective efficiency of 166.3 percent. The result is the price of $24.85 per MMBTU. 30 The propane price at the time of the report was $2.67 per gallon. This is divided by the product of the conversion of 0.091333 multiplied by the effective efficiency of 94 percent. The result is the price of $31.10 per MMBTU.

Economic and Fiscal Impacts of Expanding the Natural Gas Infrastructure in Maryland RESI of Towson University
19
Figure 7: Household Savings of Natural Gas31 32 33
Sources: EIA, HVAC Partners, Piktochart, RESI The total possible savings for households using natural gas instead of other energy sources in Maryland is reported by various energy types in Figure 8. Figure 8: Total Household Costs using Other Energy Sources, 2015
Energy Type
Total Household Costs using Other
Total Household Costs with Natural Gas
Total Possible Savings to Maryland Households
Heating Oil $1,913,336,446 $1,032,921,436 $880,415,009
Electricity $2,312,652,024 $1,032,921,436 $1,279,730,588 Propane $2,894,678,677 $1,032,921,436 $1,861,757,240
Sources: EIA, RESI
31 American Gas Association, “Got Growth? Defining US Gas Utility Growth in an Era of Efficiency and Natural Gas Resource Abundance,” 17. 32 Southwest Gas, “Why Natural Gas,” accessed November 16, 2015, http://www.swgasliving.com/content/why-natural-gas. 33 International Comfort Products, LLC, “Oil Furnaces,” 2010, accessed November 16, 2015, http://dms.hvacpartners.com/docs/1011/Public/07/09comfor747_Entry_Oil_Furnace_ICP_22572.pdf.

Economic and Fiscal Impacts of Expanding the Natural Gas Infrastructure in Maryland RESI of Towson University
20
The total possible savings to Maryland from households consuming natural gas ranges from $880.4 million to nearly $1.9 billion per year in energy costs. As noted above, this translates to a range of $806 to $1,705 in annual energy savings per household. Maryland commercial and industrial entities also save from consuming natural gas compared to other energy sources. To estimate the total potential costs, RESI used a similar method and energy prices to that of the household calculations and derived annual savings to all Maryland commercial and industrial establishments. Figure 9 reports the average annual costs of natural gas and other energy sources for commercial/industry establishments. Figure 9: Current Costs and Savings to Maryland Commercial/Industrial Establishments using Natural Gas, 2015
Energy Type Total Annual Consumption
(MMBTUs)
Price per million BTUs34
Average Annual Costs per
Establishment
Average Annual Savings per
Establishment35
Natural Gas 92,084,690 $10.35 $12,800 - Heating Oil 92,084,690 $20.56 $25,415 $12,615 Electricity 92,084,690 $19.03 $23,529 $10,730 Propane 92,084,690 $31.10 $38,450 $25,650
Sources: EIA, RESI Maryland commercial and industrial establishments that use natural gas spend approximately $12,800 per year in energy costs. Other energy sources cost $10,730 to $25,650 more per year. The total energy costs and possible savings if establishments convert to natural gas is reported in Figure 10. Figure 10: Total Commercial/Industrial Establishments Costs Using Other Energy Sources, 2015
Energy Type Total Establishment Costs using Other
Total Establishment Costs with Natural Gas
Total Savings to Maryland Establishments
Heating Oil $1,892,928,008 $953,350,390 $939,577,619 Electricity $1,752,498,630 $953,350,390 $799,148,240 Propane $2,863,802,838 $953,350,390 $1,910,452,448
Sources: EIA, RESI
34 BTUs refer to British thermal units, where 1.028 thousand cubic feet of natural gas is equivalent to 1 MMBTU. 35 Average annual costs to establishments is the total MMBTUs divided by the number of establishments creating a per establishment use multiplied by the MMBTU pricing. Savings are the difference between alternative sources and natural gas.

Economic and Fiscal Impacts of Expanding the Natural Gas Infrastructure in Maryland RESI of Towson University
21
The total possible savings to Maryland commercial and residential establishments from consuming natural gas ranges from $799.1 million to $1.9 billion per year. For more details on the methodology and calculations for the results above, please refer to Appendix A.1.
5.0 Economic and Fiscal Impacts Associated with Expansion Using data provided by the Natural Gas LDCs and government databases, RESI constructed a series of economic and fiscal impacts associated with expansion of the natural gas infrastructure in Maryland.
Section 5.1 discusses the methodology of the analysis regarding construction of the lines as well as the potential conversion rates.
Section 5.2 discusses the methodology associated with the establishment data and estimates for the analysis of newly converted business entities.
Section 5.3 introduces the REMI PI+ model used within the economic and fiscal impacts analysis.
Section 5.4 discusses the economic impacts of the construction phase of the new lines and the results by county.
Section 5.5 reports the overall economic and fiscal impacts associated with the current market and the future market of natural gas consumption in Maryland by county.
5.1 Methodology Overview—Residential Customers To estimate the current and potential demand for natural gas in Maryland, RESI requested data from the Natural Gas LDCs regarding residential and commercial/industrial establishment consumption to date. To determine the universe of households, RESI relied on the American Community Survey (ACS) 5-year 2013 estimates. The breakdown of customers is reported in Figure 4 in Section 3.0 and again here in Figure 11.

Economic and Fiscal Impacts of Expanding the Natural Gas Infrastructure in Maryland RESI of Towson University
22
Figure 11: Current Natural Gas Customers in Maryland by Type by County, 2015
County Residential Commercial/Industrial Total
Allegany County 15,579 1,490 17,069 Anne Arundel 93,622 7,142 100,764 Baltimore City 190,532 12,719 203,251 Baltimore County 204,374 14,195 218,569 Calvert County 1,177 315 1,492 Caroline County 0 0 0 Carroll County 14,034 1,581 15,615 Cecil County 6,387 546 6,933 Charles County 16,882 801 17,683 Dorchester County 0 0 0 Frederick County 27,195 2,944 30,139 Garrett County 1,548 341 1,889 Harford County 42,888 3,050 45,938 Howard County 55,129 4,080 59,209 Kent County 0 0 0 Montgomery County 228,307 11,284 239,591 Prince George’s County 174,605 11,650 186,255 Queen Anne’s County 0 0 0 St. Mary’s County 5,599 396 5,995 Somerset County 0 0 0 Talbot County 0 0 0 Washington County 11,970 1,947 13,917 Wicomico County 0 0 0 Worcester County 2,400 0 2,400
Total 1,092,228 74,481 1,166,709
Sources: Maryland Natural Gas LDC, RESI Analyzing the data provided by the MD Natural Gas LDCs, RESI found that more than 1.1 million residential units in Maryland use natural gas, and of currently available data, 74,481 commercial/industrial establishments use natural gas. As noted in Figure 3 in Section 3.0, more than 90 percent of Maryland counties report a natural gas transmission line or a pipeline. It is important to note that, in some areas, the lines run along borders, allowing for residents from adjacent counties the ability to access natural gas for use. To estimate the potential existing households that will be serviced by the expansion of lines for natural gas distribution, RESI reviewed the current transmission lines and the density of areas nearby. Measuring distance from current lines into other densely populated regions, RESI estimated approximately 134.1 miles of new lines would be needed to meet the highest demand markets. After establishing the theoretical lines, RESI estimated the conversion rate of existing households to be approximately 3.2 percent annually using historical natural gas

Economic and Fiscal Impacts of Expanding the Natural Gas Infrastructure in Maryland RESI of Towson University
23
conversion rates and an assumption of increased demand to account for the additional households that will now be serviced through the infrastructure expansion. RESI based additional customers as a result of potential new housing construction on estimates from REMI PI+’s population forecast and the Maryland Department of Planning’s estimated people per household forecast. RESI applied the population forecast from 2016 through 2026 to derive the individuals per household and determine the total new housing demand needed through 2026. Using information collected on household counts from the ACS, RESI estimated the feasible gaps in current housing available for new residents by region. It is important to note that, in the last ten years, nearly 65 percent of constructed households have chosen natural gas for heating and cooking needs.36 RESI used this estimate to derive an additional potential customer base for natural gas associated with newly constructed homes through 2026. Figure 12 estimates the potential new residential customers of natural gas by 2026.
36 U.S. Energy Information Administration. “Natural Gas and the Environment.” Accessed December 21, 2015.

Economic and Fiscal Impacts of Expanding the Natural Gas Infrastructure in Maryland RESI of Towson University
24
Figure 12 Forecasted New Residential Customers as a Result of Expansion by County, 2026
County Residential Customers
(2015)
Existing Home Conversions
Customers from New Housing Construction
Total Residential Customers by
2026
Allegany County 15,579 3,008 62 18,649 Anne Arundel 93,622 20,497 7,318 121,437 Baltimore City 190,532 20,449 354 211,335 Baltimore County
204,374 28,569 4,702 237,645
Calvert County 1,177 5,697 21 6,895 Caroline County 0 2,292 11 2,303 Carroll County 14,034 8,239 122 22,395 Cecil County 6,387 5,957 34 12,378 Charles County 16,882 7,533 854 25,269 Dorchester County
0 2,823 21 2,844
Frederick County 27,195 12,079 3,368 42,642 Garrett County 1,548 2,948 46 4,542 Harford County 42,888 9,086 2,586 54,560 Howard County 55,129 9,542 5,764 70,435 Kent County 0 1,799 21 1,820 Montgomery County
228,307 2,455 13,770 244,532
Prince George’s County
174,605 34,866 8,232 217,703
Queen Anne’s County
0 0 0 0
St. Mary’s County
5,599 6,603 29 12,231
Somerset County
0 1,890 18 1,908
Talbot County 0 0 0 0 Washington County
11,970 8,302 34 20,306
Wicomico County
0 7,011 33 7,044
Worcester County
2,400 9,055 229 11,684
Total 1,092,228 210,700 47,627 1,350,555
Sources: Natural Gas LDCs, ACS, RESI

Economic and Fiscal Impacts of Expanding the Natural Gas Infrastructure in Maryland RESI of Towson University
25
RESI estimated that a total of 47,627 newly constructed households will become natural gas customers within Maryland by 2026. RESI also assumed that roughly 210,700 existing households will convert to natural gas over this ten-year period. Conversions are based on data that Maryland Natural Gas LDCs provided as well as current historical conversion patterns. More households may convert past 2026, but this report focuses only on households converting until that point. Using the data calculated within this section and in Sections 3.0 and 4.0, RESI created inputs for the REMI PI+ input/output model to complete the economic and fiscal impact analysis. More information on the REMI PI+ model is included in Section 5.2. 5.2 Methodology Overview—Commercial and Industrial Customers RESI employed a methodology similar to the methodology detailed in Section 5.1 to examine the current commercial and industrial customers of natural gas within Maryland and estimate the potential total customers by 2026. Using data that the Maryland Natural Gas LDCs provided regarding current commercial and industrial natural gas customers, RESI found that a total of 74,481 establishments used natural gas in Maryland as of 2015. Reviewing Figure 11 in Section 5.1, RESI used this total as the current number of natural gas customers for commercial and industrial use as of 2016. Using a historical rate of conversion among establishments for the past ten years and information that the Maryland Natural Gas LDCs provided regarding potential future conversions, RESI estimated the change in commercial and industrial customers of natural gas. The base as of 2015, the estimated number of conversions, and the total new customer base are provided in Figure 13.

Economic and Fiscal Impacts of Expanding the Natural Gas Infrastructure in Maryland RESI of Towson University
26
Figure 13: Estimated Commercial and Industrial Natural Gas Customers by 2026
County Establishment
Customers as of 2015 New Establishment
Conversions Total Establishment Customers by 2026
Allegany County 1,490 59 1,549 Anne Arundel 7,142 1,322 8,464 Baltimore City 12,719 246 12,965 Baltimore County 14,195 1,117 15,312 Calvert County 315 273 588 Caroline County 0 12 12 Carroll County 1,581 535 2,116 Cecil County 546 248 794 Charles County 801 384 1,185 Dorchester County 0 14 14 Frederick County 2,944 764 3,708 Garrett County 341 118 459 Harford County 3,050 454 3,504 Howard County 4,080 973 5,053 Kent County 0 13 13 Montgomery County
11,284 3,040 14,324
Prince George’s County
11,650 1,500 13,150
Queen Anne’s County
0 0 0
St. Mary’s County 396 381 777 Somerset County 0 7 7 Talbot County 0 0 0 Washington County
1,947 377 2,324
Wicomico County 0 51 51 Worcester County 0 42 42
Total 74,481 11,929 86,410
Sources: Maryland Natural Gas LDC, RESI Using County Business Patterns data, RESI estimated the total establishment counts by County. Applying a historical growth rate of establishments across counties, RESI then estimated the potential number of establishments that could convert to natural gas each year. As reported in Figure 13, RESI estimated that an additional 11,929 commercial and industrial establishments within Maryland will convert to natural gas by 2026, bringing the total commercial and industrial consumer base for natural gas to 86,410 customers by 2026. These customers were phased in over the ten-year period with regard to new builds and conversions. The investment costs associated with the conversion and hook-ups to natural gas were phased into budgets

Economic and Fiscal Impacts of Expanding the Natural Gas Infrastructure in Maryland RESI of Towson University
27
over a five-year period, similar to the residential household investment terms. Using the estimates in Sections 5.1 and 5.2, RESI established a feasible set of variables to determine consumption of natural gas over the ten-year period between 2016 and 2026 within Maryland as a result of expanding natural gas service. These inputs were used within the REMI PI+ model to estimate potential economic and fiscal impacts as a result of investments and savings to Maryland’s economy. The REMI PI+ model is discussed in more detail in Section 5.3. 5.3 REMI PI+ Model RESI used the REMI PI+ model to analyze the potential impact from natural gas expansion in Maryland. The REMI PI+ model is a high-end dynamic modeling tool used by various federal and state government agencies in economic policy analysis. Utilization of REMI PI+ helps RESI to build a sophisticated model that is calibrated to the specific demographic features of the study area—in this case, Maryland. This model enumerates the economic and fiscal impacts of each dollar earned and spent by the following: employees relating to the economic events, other supporting vendors (business services, retail, etc.), each dollar spent by these vendors on other firms, and each dollar spent by the households of the event’s employees, other vendors’ employees, and other businesses’ employees. The REMI PI+ model also accounts for changes to the economy over time including tax changes, inflation, the recession, and sequestration. REMI PI+ and IMPLAN are both economic policy analysis models, and both are used by state and federal government. However, each model has attributes that may lead to different results even when analyzing the same data. These differing results can be attributed to the various differences between the two models:
The length of time of analysis,
The inclusion of external factors,
The elasticity of the labor supply, and
The multipliers. When comparing the models, IMPLAN is a static model, meaning that it analyzes the data for a single year at a time. REMI PI+ is a dynamic model, meaning it analyzes the data over a period and that future impacts are dependent on changes in the previous years. The main strength of the REMI PI+ model being dynamic is that it allows researchers to examine policy changes with respect to inflation and price effects. This method allows for increased demand and employment constraints from the previous years to shift inflation and wage changes in later years. In addition to these differences between REMI PI+ and IMPLAN, IMPLAN assumes a perfectly elastic labor supply. Under this assumption, IMPLAN expects that, regardless of the data being analyzed, Maryland will have the necessary labor to meet the expected demand. This assumption can be misleading in industries such as the bioscience industry, which requires highly-skilled workers. Realistically, some cross-state collaboration or hiring of out-of-state employees with the expectation of relocation may need to occur to acquire an appropriately

Economic and Fiscal Impacts of Expanding the Natural Gas Infrastructure in Maryland RESI of Towson University
28
skilled workforce for such an industry. Under the REMI PI+ model, these constraints on the labor supply are built into the model based on current labor supply and growth estimates by sector. The REMI PI+ model then allows researchers to look at the economic migration based on job opportunities within the region to estimate the labor that would seek to relocate as well as the potential for Maryland jobs to go to other states due to a shortage in labor demand. The multipliers used by each model also vary, which can have an impact on results. IMPLAN and REMI PI+ are each built on a set of multipliers based on historical data created for each state by the Bureau of Economic Analysis. Both models are based on the concept of input/output modeling. Within these models, an input or change to the economy is entered into the model. The model uses the multipliers to generate the potential economic impacts (jobs, output, and wages) that might result from this economic activity. The difference between the models, however, are the interaction and constraints built within each tool. 5.4 Economic and Fiscal Impacts during Investment Phase RESI assumed that investment for infrastructure expansion and residential conversions and new residential hookups will occur during the ten-year period. RESI defined the construction of new lines and newly added households consuming natural gas as the investment phase. To estimate the potential economic and fiscal impacts associated with expansion of Maryland’s current natural gas infrastructure, RESI used the information regarding current and estimated customers as determined in Sections 5.1 and 5.2. The total customers by type are reported in Figure 14.

Economic and Fiscal Impacts of Expanding the Natural Gas Infrastructure in Maryland RESI of Towson University
29
Figure 14: Estimated Total Natural Gas Customers by Type by County, 2026
County Residential Customers
Establishment Customers
Total Natural Gas Customers
Allegany County 18,649 1,549 20,198 Anne Arundel 121,437 8,464 129,901 Baltimore City 211,335 12,965 224,300 Baltimore County 237,645 15,312 252,957 Calvert County 6,895 588 7,483 Caroline County 2,303 12 2,315 Carroll County 22,395 2,116 24,511 Cecil County 12,378 794 13,172 Charles County 25,269 1,185 26,454 Dorchester County 2,844 14 2,858 Frederick County 42,642 3,708 46,350 Garrett County 4,542 459 5,001 Harford County 54,560 3,504 58,064 Howard County 70,435 5,053 75,488 Kent County 1,820 13 1,833 Montgomery County
244,532 14,324 258,856
Prince George’s County
217,703 13,150 230,853
Queen Anne’s County
0 0 0
St. Mary’s County 12,231 777 13,008 Somerset County 1,908 7 1,915 Talbot County 0 0 0 Washington County
20,306 2,324 22,630
Wicomico County 7,044 51 7,095 Worcester County 11,684 42 11,726
Total 1,350,555 86,410 1,436,965
Sources: Maryland Natural Gas LDC, RESI According to Figure 14, RESI estimated that there will be nearly 1.4 million natural gas customers in Maryland by 2026. Of those 1.4 million, nearly 94 percent will be residential and the remaining 6 percent will be commercial and industrial establishments in Maryland. The estimates in Figure 14 established a base of customers who will pay for conversion or new hook-up costs for natural gas in Maryland. For this analysis, RESI included the costs of hooking up to natural gas lines as part of the investment and construction phase. RESI assumed approximately $6,500 in conversion costs to households switching to natural gas, with business

Economic and Fiscal Impacts of Expanding the Natural Gas Infrastructure in Maryland RESI of Towson University
30
costs varying depending on the size of the establishment.37 RESI phased in total household conversions over the ten-year period for an overall conversion of close to 3.2 percent each year from the base of total customers as of 2015. Using the dollar calculation of conversion costs for each energy type and a factor for rebates and credits, RESI used these totals to measure the impacts to the state as an increase in demand for specialized services by HVAC professionals and services. RESI distributed these figures across counties to establish the overall economic and fiscal impacts associated with a change to natural gas. In addition to the costs of conversion, RESI examined the costs of gas infrastructure expansion to allow for more residents and establishments to access natural gas. Using information from the National Pipeline Mapping Service, RESI estimated the regions that would most likely be expanded by comparing household density information overlaid with current transmission lines. RESI based costs for new pipelines by type on historical cost estimates over the last ten years for materials, labor, and right-of-way.38 Newly constructed lines were estimated based on cost of expanding existing lines within the state; however, larger load capacity expansion based on lines crossing state lines may be needed in future infrastructure improvements if demand continues increasing past 2026. Figure 15 details the potential expansion areas, including line type and average cost per project.39
37 Average costs of conversion and hookup ranged from $3,000 to $10,000 across several states and sources with boiler maintenance represented as the net between $50 for natural gas annually and $150 for scrubbing of oil burner. 38 Christopher E. Smith, “Oil Pipelines Lead Way in Strong 2014,” Oil and Gas Journal (September 7, 2015), accessed December 22, 2015, http://digital.ogj.com/ogjournal/20150907?pg=1#pg1. 39 U.S. Energy Information Administration, “Natural Gas Pipeline Projects,” October 2015, accessed November 12, 2015, http://www.eia.gov/naturalgas/data.cfm.

Economic and Fiscal Impacts of Expanding the Natural Gas Infrastructure in Maryland RESI of Towson University
31
Figure 15: Potential Natural Gas Construction Costs for Line Expansions by County
County Cost
Allegany County $35.4 million Anne Arundel $28.4 million Baltimore City $10.1 million Baltimore County $12.9 million Calvert County $18.8 million Caroline County $39.8 million Carroll County $25.9 million Cecil County $18.0 million Charles County $15.0 million Dorchester County $12.4 million Frederick County $16.6 million Garrett County $0 Harford County $10.2 million Howard County $9.5 million Kent County $18.6 million Montgomery County $7.1 million Prince George’s County $8.3 million Queen Anne’s County $0 St. Mary’s County $12.2 million Somerset County $2.7 million Talbot County $0 Washington County $12.1 million Wicomico County $12.6 million Worcester County $0
Total $326.6 million
Sources: Natural Gas LDCs, ACS, RESI Total projects for expansion of current lines would cost roughly $326.6 million. These lines were considered at a given price per mile to reach other high population density areas. The costs above do not include conversion costs borne by households and businesses. These costs are estimated separately. It is reasonable that although a new line may not be added to a region, conversions may still occur based on the existing lines, as homes willing or able to be serviced with natural gas will be located within these areas. Therefore, the cost of construction of new lines in Figure 15 may be shown as zero, but households and businesses conversions within those counties may still occur over the ten-year period based on current infrastructure. Given the length required to reach customers in some cases as well as the cap on potential spending, RESI estimated that the timeline for this construction may take close to ten years. These lines are considered those of first priority as they will meet customers in the most densely populated areas of counties. There may be continued expansion and construction

Economic and Fiscal Impacts of Expanding the Natural Gas Infrastructure in Maryland RESI of Towson University
32
activities related to these lines past 2026, but for the purpose of this analysis, RESI focused on the immediate ten years after 2016 legislation is approved. In addition, it is important to note the significant investments necessary to reach certain areas of the state. For the purposes of this report, RESI assumed that these expansion efforts would move forward regardless of the costs. Considering the feasibility of these expansion efforts is outside the scope of this study. Economic Impacts Using the estimated potential costs of conversions based on new customers and feasible infrastructure improvements over the ten-year period, RESI estimated the impacts from 2016 through 2026. RESI used the spending and activity attributed to the construction of these pipelines as an input in the REMI PI+ model to determine the impacts of the investment phase as a result of expanding the infrastructure. Figure 16 shows these results. Figure 16: Construction Phase Economic Impacts to Maryland, 2016–2026
Year Jobs Output Wages
2016 521 $24,414,100 $19,916,600 2017 885 $47,226,000 $36,499,000 2018 973 $54,214,500 $43,331,100 2019 1,376 $75,668,400 $63,735,900 2020 2,094 $113,281,300 $100,727,100 2021 3,214 $172,653,200 $160,877,200 2022 4,955 $265,701,300 $258,335,200 2023 7,656 $411,315,900 $376,605,250 2024 11,864 $639,076,200 $575,855,275 2025 18,412 $995,308,000 $877,922,800 2026 28,548 $1,554,252,600 $1,332,527,150
Average 7,318 $395,737,409 $349,666,598
Sources: REMI PI+, RESI These economic impacts include households converting to natural gas and construction of new lines. These are considered investments that both LDCs and customers made within the region. RESI assumed that all conversions and construction of pipelines may exceed ten years but only reported the first ten years. As reported in Figure 16, during this period of investment, an average of 7,318 jobs will be supported each year, and $395.7 million in output and $349.7 million in wages, on average, will be added to the economy over the ten-year period. The expansion of the natural gas lines will also have a considerable fiscal impact on Maryland, as reported in Figure 17.

Economic and Fiscal Impacts of Expanding the Natural Gas Infrastructure in Maryland RESI of Towson University
33
Figure 17: Fiscal Impacts to Maryland, 2016–2026 Year Property Income Sales Payroll Other Total
2016 $322,229 $226,495 $299,132 $6,025 $197,447 $1,051,329 2017 $576,779 $405,418 $535,436 $10,785 $353,424 $1,881,842 2018 $673,696 $473,540 $625,405 $12,597 $412,810 $2,198,047 2019 $980,834 $689,427 $910,528 $18,339 $601,010 $3,200,138 2020 $1,527,753 $1,073,856 $1,418,244 $28,566 $936,137 $4,984,556 2021 $2,404,013 $1,689,779 $2,231,693 $44,950 $1,473,069 $7,843,503 2022 $3,807,788 $2,676,491 $3,534,846 $71,197 $2,333,237 $12,423,559 2023 $6,048,613 $4,251,565 $5,615,049 $113,096 $3,706,312 $19,734,634 2024 $9,638,690 $6,775,027 $8,947,789 $180,223 $5,906,146 $31,447,875 2025 $15,371,865 $10,804,871 $14,270,011 $287,421 $9,419,173 $50,153,341 2026 $24,507,806 $17,226,517 $22,751,089 $458,243 $15,017,258 $79,960,914
Average $5,987,279 $4,208,453 $5,558,111 $111,949 $3,668,729 $19,534,522
Sources: REMI PI+, RESI The average annual fiscal impact as a result of natural gas expansion within Maryland will be approximately $19.5 million. The largest fiscal impacts will be generated as a result of increased property tax revenues, accounting for nearly $6.0 million on average each year. The second largest fiscal impacts are sales tax revenues, which will add $5.6 million on average each year. To view this information by county, please refer to Appendix B. 5.5 Economic and Fiscal Impacts during Operation Phase In Section 4.0, RESI estimated the potential savings associated with natural gas consumption over other forms of energy for household and establishments. RESI expanded upon the information from the Maryland Natural Gas LDCs by extrapolating these savings estimates across the forecasted schedule of conversions for residential and establishments and the newly constructed households over the next ten years. RESI estimated the feasible savings associated with those converting to natural gas over the ten-year period, growing exponentially as new conversions occur by year. Savings in this analysis are the net from the annualized cost from the investment made in Section 5.4. Overall, households would invested in a given year, but payback for the investment may take ten years. This estimate of an approximate ten-year payback is comparable to options established by Pennsylvania studies.40 Using the information regarding possible natural gas demand, RESI applied a conversion schedule to each group over a ten-year period beginning in 2016. Using the phased-in totals, RESI estimated the total incremental savings from 2016 through 2026 and the total realized costs incrementally distributed over time based on a five-year investment. These estimates are reported in Figure 18.
40 Ready, “Analysis of Potential Demand for the Extension and Expansion of Natural Gas Distribution Infrastructure in Pennsylvania,” 6.

Economic and Fiscal Impacts of Expanding the Natural Gas Infrastructure in Maryland RESI of Towson University
34
Figure 18: Total Conversion Cost and Savings Estimates, 2016–2026
Customer Type Total Ten-Year
Savings Total Cost of
Investment Total Net Ten-Year
Savings
Residential $1,047,634,112 $785,323,703 $262,310,409 Commercial/Industrial $1,071,548,437 $96,628,626 $974,919,811
Sources: Natural Gas LDCs, RESI As reported in Figure 18, the total net savings over the ten years for households is roughly $262.3 million, and establishments would realize $974.9 million in savings. RESI accounted for the costs reported in Figure 18 in the investment phase of this analysis. To avoid double-counting, RESI analyzed the net savings reported in the fourth column of Figure 18 for the economic and fiscal impacts reported in Figure 19 and Figure 20. RESI modeled savings as a result of reduced energy costs in the REMI PI+ model as a reduction for production costs to establishments and an increase in household disposable income. Presumably, as households save more over time because of their reduced energy costs, incremental savings will be subsequently redistributed among other household spending categories, such as new consumer goods or services. A reduction in the production costs to establishments within Maryland would potentially allow these establishments to consider expanding operations and investing in new production capital. Using the net savings to households and establishments, as reported above, RESI estimated changes to jobs, output, and wages, as reported in Figure 19. Figure 19: Annual Economic Impacts to Maryland, 2016–2026
Year Jobs Output Wages
2016 429 $50,166,000 $20,073,000 2017 589 $70,724,400 $28,956,600 2018 755 $92,491,200 $38,611,200 2019 907 $114,605,400 $48,311,400 2020 1,057 $138,210,600 $58,756,200 2021 1,226 $165,820,800 $70,914,600 2022 1,413 $197,698,800 $84,976,800 2023 1,626 $235,245,000 $101,687,400 2024 1,887 $280,892,400 $122,498,400 2025 2,222 $338,607,600 $149,517,600 2026 2,251 $358,069,200 $157,843,800
Average 1,306 $185,684,673 $80,195,182
Sources: REMI PI+, RESI The savings associated with households and establishments converting to natural gas will support an average of 1,306 jobs and contribute on average $185.7 million in output and $80.2 million in wages each year from 2016 through 2026. When analyzing detailed employment

Economic and Fiscal Impacts of Expanding the Natural Gas Infrastructure in Maryland RESI of Towson University
35
impacts, RESI noticed that the jobs created from the conversion yielded an average salary of approximately $61,417. This activity is projected to increase jobs within the construction, retail trade, and heath care and social assistance industries. Furthermore, the population within several regions is expected to grow over this period, and the increase in lower-cost heating amenities may make some areas with a lower cost of living more attractive to low-income or fixed-income individuals. RESI projected the increase in population to peak in 2023, adding more than 5,800 new residents. RESI then estimated the following fiscal impacts associated with net savings for conversion to natural gas from 2016 through 2026. These findings are reported in Figure 20. Figure 20: Annual Fiscal Impacts to Maryland, 2016–2026
Year Property Income Sales Payroll Other Total
2018 $543,860 $382,279 $504,876 $10,169 $333,252 $1,774,436 2019 $716,344 $503,517 $664,996 $13,394 $438,943 $2,337,194 2020 $912,619 $641,479 $847,203 $17,064 $559,211 $2,977,577 2021 $1,112,559 $782,017 $1,032,811 $20,802 $681,725 $3,629,916 2022 $1,330,266 $935,043 $1,234,913 $24,873 $815,126 $4,340,220 2023 $1,590,771 $1,118,151 $1,476,744 $29,744 $974,751 $5,190,161 2024 $1,895,229 $1,332,155 $1,759,379 $35,437 $1,161,309 $6,183,508 2025 $2,261,135 $1,589,350 $2,099,057 $42,278 $1,385,519 $7,377,339 2026 $2,723,913 $1,914,636 $2,528,663 $50,931 $1,669,089 $8,887,231 2027 $3,329,324 $2,340,179 $3,090,678 $62,251 $2,040,057 $10,862,489 2028 $3,491,544 $2,454,204 $3,241,271 $65,284 $2,139,458 $11,391,761
Average $1,809,778 $1,272,092 $1,680,054 $33,839 $1,108,949 $5,904,712
Sources: REMI PI+, RESI The ten-year period of natural gas conversions in Maryland will contribute close to $5.9 million in average fiscal revenues each year. The largest contribution in fiscal revenues will come from increased property tax revenues, which will add an average of $1.8 million each year. Sales tax revenues and income tax revenues will also contribute a large portion—$1.7 million and $1.3 million each year on average, respectively. Expanding and converting to natural gas has an economic incentive for many households, as the increased savings will help reduce the energy burden and increase the disposable household income for those in lower median income regions of the state. Commercial and industrial entities may find that conversion have larger upfront costs; however, they can significantly reduce their energy costs and therefore improve profits over time.
6.0 Environmental and Health Impacts from Expansion This section briefly outlines potential environmental and health impacts from the expansion of natural gas infrastructure in the state. The core focus of this report is to measure the economic

Economic and Fiscal Impacts of Expanding the Natural Gas Infrastructure in Maryland RESI of Towson University
36
and fiscal impacts; nevertheless, it is important to examine how environmental and health impacts could potentially influence those figures. The analysis in this section is merely a brief overview of the impacts found in existing literature. It should be noted that any costs savings or cost increases due to environmental and health impacts are not captured in the economic and fiscal impacts reported in Section 5.0. Environmental Impacts The increased conversion to natural gas from carbon-intensive coal-based generation has contributed to lower carbon emissions in the U.S. in recent years.41 Carbon emissions from natural gas combustion are up to 60 percent lower per unit of electricity generated as compared to coal.42 While critics argue whether natural gas has a greater impact on global warming because of methane leakages, a study concluded that it would take a methane leakage rate of 9.3 percent over 100 years to make natural gas worse than existing energy generating coal plants.43 For newer, higher efficiency coal generation, the rate is 6.1 percent.44 According to the EPA, natural gas leakage rates are around 1.5 percent during production, transmission, storage, and distribution.45 Newer and more efficient pipelines bring those rates even lower.46 Additionally, regions utilizing plastic and protected steel piping show lower methane emission rates than areas with older distribution systems (34 percent in the eastern U.S. versus less than 20 percent in the west).47 These figures are encouraging for further reducing distribution leaks as older pipelines continue to be replaced and new expansions are completed with low-emission plastic.48 The expansion of natural gas infrastructure and household conversions should be viewed as an opportunity to reduce greenhouse emissions when compared to high-carbon options such as coal and oil.49 The Regional Greenhouse Gas Initiative (RGGI), which Maryland joined in 2007, is intended to reduce carbon dioxide (CO2) emissions from electricity generating plants by setting targets for emissions reductions.
41 Zeke Hausfather, “Bounding the climate viability of natural gas as a bridge fuel to displace coal,” Energy Policy (2015): 286, accessed September 30, 2015, http://ac.els-cdn.com/S0301421515300239/1-s2.0-S0301421515300239-main.pdf?_tid=4183306c-6796-11e5-b676-00000aacb35f&acdnat=1443633254_8be922b699e75e85bb1037db16fd1628. 42 Ibid. 43 Zeke Hausfather. “Climate Impacts of Coal and Natural Gas,” Berkeley Earth (2014): 3, accessed December 2, 2015 http://static.berkeleyearth.org/pdf/climate-impacts-of-coal-and-natural-gas.pdf. 44 Ibid. 45 Ibid. 46 Brian K. Lamb et al., “Direct measurements show decreasing methane emissions from natural gas local distribution systems in the Unites States,” Environmental Science & Technology (2015): 5163, accessed December 21, 2015, DOI: 10.1021/es505116p. 47 Ibid, 5166. 48 Ibid.

Economic and Fiscal Impacts of Expanding the Natural Gas Infrastructure in Maryland RESI of Towson University
37
Improving the access to natural gas for Maryland households can help the state in meeting its RGGI targets. The reduction of emissions from electricity generators switching to natural gas was a significant reason for CO2 emissions that were lower than expected during the RGGI baseline period in 2007.50 Further investments in expanding the natural gas infrastructure could have even more positive impacts on CO2 emissions in the state during the ten-year investment and operation timeframe as described in this study. Health Impacts Scientists have theorized a strong link between carbon-reduction strategies and positive health outcomes.51 Strategies to reduce greenhouse gas can reduce indoor and outdoor air pollution and improve water quality.52 More importantly, “many mitigation-related health impacts accrue sooner than the impacts projected from climate change.”53 The expansion of natural gas pipelines facilitates access to direct energy for residential, industrial, and commercial consumers, which reduces truck traffic as a result. Measures that help to further limit existing greenhouse gas emissions from the transportation sector can “reduce direct emissions of criteria and toxic pollutants emitted.”54 There is added convenience from direct pipeline distribution as compared with reliance on oil or propane delivery trucks for transportation, especially during adverse weather conditions when travel is difficult.55 Households’ adoption of natural gas also has a significant impact on greenhouse gas emissions. For instance, “Department of Energy (DOE) analyses indicates that every 10,000 U.S. homes powered with natural gas instead of coal avoids the annual emissions of 1,900 tons of NOx, 3,900 tons of SO2, and 5,200 tons of particulates.”56 These types of emissions have been linked with numerous health problems including asthma, bronchitis, lung cancer, and heart disease.57 The ability for more than 258,327 households and 11,929 commercial and industrial establishments (which generally use more energy per capita than households) to utilize natural
50 Maryland Department of the Environment, “Regional Greenhouse Gas Initiative and the Maryland CO2 Budget Trading Program,” accessed December 21, 2015, https://www.mwcog.org/uploads/committee-documents/bV1dVl1d20120913081025.pdf. 51 Chan, “Cutting carbon, improving health,” 2. 52 Justin V. Remais et al., “Estimating the Health Effects of Greenhouse Gas Mitigation Strategies: Addressing Parametric, Model and Valuation Challenges,” Environmental Health Perspectives (2014): 448, accessed December 21, 2015, http://ehp.niehs.nih.gov/wp-content/uploads/122/5/ehp.1306744.pdf. 53 Ibid, 447. 54 American Lung Association of California, “Air Quality and Health Impacts of Greenhouse Gas Emissions and Global Warming,” (August 2004): 2, accessed December 21, 2015, http://www.dnrec.delaware.gov/dwhs/Info/Regs/Documents/alac_impacts_fs.pdf. 55 Public Service Electric and Gas Company, “Advantages of Natural Gas,” accessed November 5, 2015 https://www.pseg.com/home/customer_service/gas_conversion/advantages.jsp. 56 Union of Concerned Scientists, “Environmental Impacts of Natural Gas,” accessed December 21, 2015, http://www.ucsusa.org/clean_energy/our-energy-choices/coal-and-other-fossil-fuels/environmental-impacts-of-natural-gas.html. 57 Ibid.

Economic and Fiscal Impacts of Expanding the Natural Gas Infrastructure in Maryland RESI of Towson University
38
gas could have significant air quality impacts and health impacts for the state in the next ten years.
7.0 Conclusion The expansion of the natural gas infrastructure in Maryland would benefit customers of natural gas as well as provide significant positive contributions to the state’s economy, climate, and health.58 The more than 1.1 million Maryland households using natural gas to date save nearly $806 more than those using heating oil, $1,172 more than those using electricity, and $1,705 more than those using propane. Maryland commercial and industrial establishments that currently consume natural gas also save nearly $12,615 more than businesses using heating oil, $10,730 more than businesses using electricity, and $25,650 more than businesses using propane each year. If natural gas service areas in Maryland are expanded to meet the needs of more customers, RESI found that Maryland could support an average 7,318 jobs each year during the investment phase. After the initial investment phase, savings to Maryland consumers from switching to natural gas would support an average 1,306 jobs each year from 2016 through 2026. Expansion and conversion of Maryland’s natural gas infrastructure would have positive impacts on output and wages as well. During the investment phase, Maryland’s output would increase by an average $395.7 million each year and $185.7 million post-conversion each year. Wages would increase from 2016 to 2026, adding an average $349.7 million each year as a result of construction and conversions and an additional $80.2 million as a result of households’ and businesses’ reduced energy costs. As a result of the infrastructure changes, conversions, and savings, state and local fiscal revenues would increase by an average $19.5 million for each year during investment, with an average annual increase of $5.9 million associated with the energy cost savings to households and establishments. Based on the investment of roughly $326.6 million, RESI concludes that the potential total fiscal benefit over the ten-year period would be in excess of $279.8 million.
58 As noted on Page 14, extension of pipelines to areas that are remote from existing LDC infrastructure and that have lower population density would likely require some form of large-scale external funding.

Economic and Fiscal Impacts of Expanding the Natural Gas Infrastructure in Maryland RESI of Towson University
39
8.0 References American Gas Association. “Choosing Natural Gas Appliances Can Double Energy Savings.” May
7, 2014. Accessed November 4, 2015. https://www.aga.org/news/news-releases/choosing-natural-gas-appliances-can-double-energy-savings.
American Gas Association. “Dispatching Direct Use: Achieving Greenhouse Gas Reductions with
Natural Has in Homes and Businesses.” Accessed November 5, 2015. https://www.aga.org/sites/default/files/dispatching_direct_use_-_achieving_greenhouse_gas_reductions_the_use_of_natural_gas_in_homes_and_businesses.pdf.
American Gas Association. “Environmental Benefits of Natural Gas.” Accessed October 5, 2015.
https://www.aga.org/environmental-benefits-natural-gas. American Gas Association. “Got Growth? Defining US Gas Utility Growth in an Era of Efficiency
and Natural Gas Resource Abundance.” September 18, 2015. Accessed November 4, 2015. https://www.aga.org/sites/default/files/ea_2015-4_got_growth.pdf.
American Lung Association of California, “Air Quality and Health Impacts of Greenhouse Gas
Emissions and Global Warming,” August 2004, accessed December 21, 2015, http://www.dnrec.delaware.gov/dwhs/Info/Regs/Documents/alac_impacts_fs.pdf.
Cardno ENTRIX. “IEP Natural Gas Conversion Analysis: Fairbanks LNG Distribution System
Demand Analysis.” January 14, 2014. Accessed November 4, 2015. http://www.interiorenergyproject.com/Resources%20and%20Documents/IEP_Conversion_Analysis_Final.pdf.
Chan, Margaret. “Cutting carbon, improving health.” The Lancet (November 25, 2009).
Accessed December 21, 2015. DOI: 10.1016/50140-6736(09)61993-0. “Consumer Corner - Natural Gas.” Maryland Office of People’s Counsel. Accessed January 8,
2016. http://www.opc.state.md.us/ConsumerCorner/NaturalGas.aspx. Energtek. “Why Natural Gas?” Accessed December 16, 2015. http://energtek.com/why-
naturalgas. FindLaw. “WASHINGTON GAS LIGHT COMPANY v. PRINCE GEORGE COUNTY COUNCIL.” March
25, 2013. Accessed November 18, 2015. http://caselaw.findlaw.com/us-4th-circuit/1625809.html.

Economic and Fiscal Impacts of Expanding the Natural Gas Infrastructure in Maryland RESI of Towson University
40
Hausfather, Zeke. “Bounding the climate viability of natural gas as a bridge fuel to displace coal.” Energy Policy 86 (November 2015): 286–294. Accessed September 30, 2015. DOI: 10.1016/j.enpol.2015.07.012.
Hausfather, Zeke. “Climate Impacts of Coal and Natural Gas.” Berkeley Earth (2014). Accessed
December 2, 2015. http://static.berkeleyearth.org/pdf/climate-impacts-of-coal-and-natural-gas.pdf.
International Comfort Products, LLC. “Oil Furnaces.” 2010. Accessed November 16, 2015.
http://dms.hvacpartners.com/docs/1011/Public/07/09comfor747_Entry_Oil_Furnace_ICP_2257
2.pdf. Johnson, Nels, Tamara Gagnolet, Rachel Ralls, and Jessica Stevens. “Natural Gas Pipelines.” The
Nature Conservancy - Pennsylvania Chapter. (December 16, 2011). Accessed September 30, 2015. http://www.nature.org/ourinitiatives/regions/northamerica/unitedstates/pennsylvania/ng-pipelines.pdf.
Lamb, Brian K., Steven L. Edburg, Thomas W. Ferrara, Touché Howard, Matthew R. Harrison,
Charles E. Kolb, Amy Townsend-Small, Wesley Dyck, Antonio Possolo, and James R. Whetstone. “Direct measurements show decreasing methane emissions from natural gas local distribution systems in the Unites States.” Environmental Science & Technology 49 (2015): 5161–5169. Accessed December 21, 2015. DOI: 10.1021/es505116p.
Maryland Department of the Environment. “Regional Greenhouse Gas Initiative and the
Maryland CO2 Budget Trading Program.” Accessed December 21, 2015. https://www.mwcog.org/uploads/committee-documents/bV1dVl1d20120913081025.pdf.
Natural Fuel. “Natural Gas: Earth and Sky Friendly.” Accessed December 21, 2015.
http://www.natfuel.com/natural_gas_environment.aspx. Public Service Electric and Gas Company. “Advantages of Natural Gas.” Accessed November 5,
2015. https://www.pseg.com/home/customer_service/gas_conversion/advantages.jsp.
Ready, Ph.D., Richard. “Analysis of Potential Demand for the Extension and Expansion of Natural Gas Distribution Infrastructure in Pennsylvania: A Report in Response to Senate Resolution 29.” The Center for Rural Pennsylvania (November 2013). Accessed November 4, 2015. http://www.rural.palegislature.us/documents/reports/Natural-Gas-Infrastructure-SR29.pdf.

Economic and Fiscal Impacts of Expanding the Natural Gas Infrastructure in Maryland RESI of Towson University
41
Remais, Justin V., Jeremy J. Hess, Kristie L. Ebi, Anil Markandya, John M. Balbus, Paul Wilkinson, Andy Haines, and Zaid Chalabi. “Estimating the Health Effects of Greenhouse Gas Mitigation Strategies: Addressing Parametric, Model and Valuation Challenges.” Environmental Health Perspectives 122 (May 2014): 447–455. Accessed December 21, 2015. http://ehp.niehs.nih.gov/wp-content/uploads/122/5/ehp.1306744.pdf.
Silverman, Dennis. “Energy Units and Conversions.” U.C. Irvine Website. Accessed November 1,
2015. http://www.physics.uci.edu/~silverma/units.html. Smith, Christopher E. “Oil Pipelines Lead Way in Strong 2014,” Oil and Gas Journal (September
7, 2015). Accessed December 22, 2015. http://digital.ogj.com/ogjournal/20150907?pg=1#pg1.
Southwest Gas. “Why Natural Gas.” Accessed October 21, 2015.
http://www.swgasliving.com/content/why-natural-gas. McMillen, Ph.D., Stanley and Nandika Prakash. “The Economic Impact of Expanding Natural Gas
Use in Connecticut.” Department of Economic and Community Development (December 2011). Accessed November 4, 2015. http://www.ct.gov/deep/lib/deep/energy/cep/decd-the_economic_impact_of_expanding_natural_gas_use_in_connecticut.pdf.
U.S. Department of Transportation. “The State of the National Pipeline Infrastructure.”
Accessed September 30, 2015. https://opsweb.phmsa.dot.gov/pipelineforum/docs/Secretarys%20Infrastructure%20Report_Revised%20per%20PHC_103111.pdf.
U.S. Energy Information Administration. “Energy Unit Calculators Explained.” Accessed
November 2, 2015. http://www.eia.gov/Energyexplained/?page=about_energy_units. U.S. Energy Information Administration. “Everywhere but Northeast, fewer homes choose
natural gas as heating fuel.” September 25, 2014. Accessed December 22, 2015. https://www.eia.gov/todayinenergy/detail.cfm?id=18131.
U.S. Energy Information Administration. “Maryland State Energy Profile.” Accessed November
4, 2015. http://www.eia.gov/state/print.cfm?sid=MD. U.S. Energy Information Administration. “Natural Gas and the Environment.” Accessed
December 21, 2015. http://www.eia.gov/pub/oil_gas/natural_gas/analysis_publications/natural_gas_1998_issues_trends/pdf/chapter2.pdf.
Economic and Fiscal Impacts of Expanding the Natural Gas Infrastructure in Maryland RESI of Towson University
42
U.S. Energy Information Administration. “Natural Gas Annual Prices, Maryland, Commercial and Industrial.” Accessed November 5, 2015. http://www.eia.gov/dnav/ng/ng_pri_sum_a_EPG0_PCS_DMcf_a.htm.
U.S. Energy Information Administration. “Natural Gas Annual Prices, Maryland, Residential.”
Accessed November 5, 2015. http://www.eia.gov/dnav/ng/ng_pri_sum_a_EPG0_PRS_DMcf_a.htm.
U.S. Energy Information Administration. “Natural Gas Annual Respondent Query System,
Maryland, 2014, All Companies Commercial and Industrial Consumption.” Accessed November 5, 2015. http://www.eia.gov/cfapps/ngqs/ngqs.cfm?f_report=RP1.
U.S. Energy Information Administration. “Natural Gas Annual Respondent Query System,
Maryland, 2014, All Companies Residential Consumption.” Accessed November 5, 2015. http://www.eia.gov/cfapps/ngqs/ngqs.cfm?f_report=RP1.
U.S. Energy Information Administration. “Natural Gas Pipeline Projects.” October 2015.
Accessed November 12, 2015. http://www.eia.gov/naturalgas/data.cfm. U.S. Environmental Protection Agency. “Consumers – Energy Efficiency and Wood-Burning
Stoves and Fireplaces.” Accessed September 30, 2015. http://www.epa.gov/burnwise/energyefficiency.html.
Union of Concerned Scientists. “Environmental Impacts of Natural Gas.” Accessed December
21, 2015. http://www.ucsusa.org/clean_energy/our-energy-choices/coal-and-other-fossil-fuels/environmental-impacts-of-natural-gas.html.

Economic and Fiscal Impacts of Expanding the Natural Gas Infrastructure in Maryland RESI of Towson University
43
Appendix A—Detailed Methodology To analyze the potential economic and fiscal impacts associated with natural gas expansion in Maryland, RESI completed a series of calculations to determine inputs to the REMI PI+ input/output model. These calculations are based on assumptions denoted within this appendix and calculations as drawn from the assumptions.
Section A.1 will provide the detailed assumptions and calculations associated with the current natural gas infrastructure and savings as reported in Section 4.0 of the report.
Section A.2 will address the underlying assumptions and methodology associated with calculating the expansion potential for the economic and fiscal impact analysis reported in Section 4.0.
A.1 Assumptions and Methodology Associated with Current Market Consumption In Section 4.0, RESI analyzed the current market consumption of natural gas in Maryland. Within this section, RESI estimated the total customers by type, residential or establishment, and the costs/savings associated with consuming natural gas. This appendix reports the assumptions and calculations used within the estimations of Figures 6 through 10. To estimate the potential costs and savings to households, RESI researched the natural gas consumption in Maryland for the previous year for residential units and commercial and industrial units. In Section 5.0, RESI used industry-level data that the Maryland Natural Gas LDCs provided to estimate the breakdown by establishment type. The following series of assumptions are considered within the costs/savings analysis provided in Section 4.0 regarding use, consumption, and pricing.
Total residential consumption in Maryland as of 2014: 90,542,308 thousands of cubic feet of natural gas59
Total commercial and industrial consumption in Maryland as of 2014: 89,576,547 thousand cubic feet of natural gas60
Price per MMBTU of natural gas (residential): $12.2161
Average price per MMBTU of natural gas (commercial and industrial): $10.4362
Conversion factor of million BTU per one thousand cubic feet of natural gas: 1.028 million BTUs per thousand cubic feet of natural gas63
59 U.S. Energy Information Administration, “Natural Gas Annual Respondent Query System, Maryland, 2014, All Companies Residential Consumption,” accessed November 5, 2015, http://www.eia.gov/cfapps/ngqs/ngqs.cfm?f_report=RP1 60 Ibid. 61 U.S. Energy Information Administration, “Natural Gas Annual Prices, Maryland, Residential,” accessed November 5, 2015, http://www.eia.gov/dnav/ng/ng_pri_sum_a_EPG0_PRS_DMcf_a.htm 62 U.S. Energy Information Administration, “Natural Gas Annual Prices, Maryland, Commercial and Industrial,” accessed November 5, 2015, http://www.eia.gov/dnav/ng/ng_pri_sum_a_EPG0_PCS_DMcf_a.htm 63 U.S. Energy Information Administration, “Energy Unit Calculators Explained,” accessed November 2, 2015, http://www.eia.gov/Energyexplained/?page=about_energy_units

Economic and Fiscal Impacts of Expanding the Natural Gas Infrastructure in Maryland RESI of Towson University
44
To estimate the potential household and establishment costs associated with consumption of natural gas, RESI first converted the units of natural gas into BTUs for comparison against other energy types. A BTU is defined as a British thermal unit, the “amount of heat needed to raise one pound of water by one degree of Fahrenheit.”64 To translate the consumption of natural gas into BTUs, RESI used the following equation:
𝑀𝑖𝑙𝑙𝑖𝑜𝑛 𝐵𝑇𝑈𝑠 𝐶𝑜𝑛𝑠𝑢𝑚𝑒𝑑𝑖𝑡
= 𝐴𝑚𝑜𝑢𝑛𝑡 𝑜𝑓 𝑁𝑎𝑡𝑢𝑟𝑎𝑙 𝐺𝑎𝑠 𝐶𝑜𝑛𝑠𝑢𝑚𝑒𝑑 𝑖𝑛 𝑡ℎ𝑜𝑢𝑠𝑎𝑛𝑑 𝑐𝑢𝑏𝑖𝑐 𝑓𝑒𝑒𝑡𝑖𝑡
∗ 1.028 𝑚𝑖𝑙𝑙𝑖𝑜𝑛 𝐵𝑇𝑈𝑠 𝑝𝑒𝑟 𝑡ℎ𝑜𝑢𝑠𝑎𝑛𝑑 𝑐𝑢𝑏𝑖𝑐 𝑓𝑒𝑒𝑡 Where in the previous equation: 𝑖 represents the type of entity, residential or establishment; and 𝑡 represents the time of consumption (in this case, 2014). Using this equation, RESI estimated that Maryland residential units consumed approximately 93,077,493 million BTUs of energy in 2014. Commercial and industrial establishments consumed 92,084,690 million BTUs of energy in 2014. Both consumption totals are based solely on consumption of natural gas and no other energy consumption during that period. These totals were then multiplied by MMBTU price of natural gas consumed to estimate the total costs to residential and establishment units in Maryland. These results are reported in Figures 8 and 10 in Section 4.0. Next, RESI estimated the difference in costs associated with consumption by examining other potential energy sources as substitutes for natural gas. RESI compared heating oil, propane, and electricity against natural gas to assess the potential costs and savings for current users. These costs do not include costs of conversion but rather assume that a choice was made for consuming natural gas at some point. Therefore, the consumer bore the cost of hook up and infrastructure at that time. This analysis examines “what if” a Maryland consumer did not consume natural gas and instead consumed a different energy source in 2014. For this analysis, RESI examined the costs differences associated with the consumption of BTUs. Therefore, all units are in MMBTUs. A.2 Assumptions and Methodology Associated with Forecasted Customers Using Natural Gas In Section A.1, RESI established a series of assumptions and methods of determining the current market for natural gas consumption in Maryland. This section builds from those estimates to assess two data points: construction and operation service changes.
64 Dennis Silverman, “Energy Units and Conversions,” U.C. Irvine Website, accessed November 1, 2015, http://www.physics.uci.edu/~silverma/units.html.

Economic and Fiscal Impacts of Expanding the Natural Gas Infrastructure in Maryland RESI of Towson University
45
Under the construction phase, RESI assumed that there is some level of expansion associated with the current natural gas infrastructure. This may include simple expansions from current mains or larger mains within the region. During the construction phase, RESI assumed the following.
Expansion of current mains will occur in the highest density of potential customer bases.
Customers that are currently on-main may convert during this period.
Customers may experience a slight rate increase associated with the cost of expansion.
The timeline for mains from approval to construction is based on historical expansion data from EIA reports.
To develop a feasible construction period, RESI analyzed the current transmission line documents indicating the current locations of natural gas lines that allow for flow of natural gas within, from, and to Maryland. Figure 21 documents this information and the capacity loads per main.

Economic and Fiscal Impacts of Expanding the Natural Gas Infrastructure in Maryland RESI of Towson University
46
Figure 21: Current Natural Gas Mains and Capacity Loads, 2014 Main Name State To County To State From County From Capacity
(mmcfd)
Columbia Trans Gas Corp
WV Mineral MD Allegany 5
Columbia Trans Gas Corp
PA Lancaster MD Cecil 206
Transcontinental Gas P L Co
PA York MD Harford 2050
Transcontinental Gas P L Co
MD Montgomery VA Fairfax 2265
Columbia Gas Trans Corp
MD Washington PA Fulton 57
Columba Gas Trans Corp
MD Montgomery VA Fairfax 1180
Columbia Gas Trans Corp
MD Garrett WV Mineral 4
Cove Point LNF LP
MD Charles VA Fairfax 2233
Cove Point LNF LP
VA Fairfax MD Charles 2233
Dominion Transmission Co
MD Washington PA Franklin 769
Dominion Transmission Co
MD Montgomery VA Loudoun 700
Texas Eastern Trans Corp
PA Franklin MD Washington 300
Washington Gas and Light Co
DC Washington D.C. MD Montgomery 80
Eastern Shore Nat Gas Co
DE New Castle MD Cecil 145
Texas Eastern Trans Corp
MD Garrett PA Fayette 300
Eastern Shore Nat Gas Co
DE Sussex MD Dorchester 22
Eastern Shore Nat Gas Co
PA Chester MD Cecil 145
Sources: EIA, RESI As noted in Figure 21, there are several existing lines running through Maryland. RESI used this information to assess where potential future types of lines may need to be constructed to meet the new household demand as described in Section 5.3. A.3 Weighting by Size Category of Business Establishment Using information provided by the Maryland Natural Gas LDCs on current and potential establishment customers, RESI estimated the following total customer counts as of 2016 and 2026. These commercial and industrial counts are provided in Figure 22.

Economic and Fiscal Impacts of Expanding the Natural Gas Infrastructure in Maryland RESI of Towson University
47
Figure 22: Commercial and Industrial Natural Gas Customers by County for 2016 and 2026
County Commercial and Industrial Customers
2016
Commercial and Industrial Customers
2026
Net Difference from 2016-2026
Allegany County 1,490 59 1,549 Anne Arundel 7,142 1,322 8,464 Baltimore City 12,719 246 12,965 Baltimore County 14,195 1,117 15,312 Calvert County 315 273 588 Caroline County 0 12 12 Carroll County 1,581 535 2,116 Cecil County 546 248 794 Charles County 801 384 1,185 Dorchester County 0 14 14 Frederick County 2,944 764 3,708 Garrett County 341 118 459 Harford County 3,050 454 3,504 Howard County 4,080 973 5,053 Kent County 0 13 13 Montgomery County 11,284 3,040 14,324 Prince George’s County
11,650 1,500 13,150
Queen Anne’s County
0 0 0
St. Mary’s County 396 381 777 Somerset County 0 7 7 Talbot County 0 0 0 Washington County 1,947 377 2,324 Wicomico County 0 51 51 Worcester County 0 42 42
Total 74,481 11,929 86,410
Sources: Maryland Natural Gas LDCs, CBP, RESI As noted in Figure 22, RESI estimated that the total number of establishment customers for natural gas will increase by 11,929 by 2026. To quantify and assess demand loads, RESI weighted the demands based on potential share by each county. To estimate the potential share, RESI examined the current share of establishments by size category. Three size categories were assigned based on the potential number of employees each establishment may have employed. The following list establishes the size categories based on employment.
Small establishments are those with more than one employee but fewer than or equal to 49 employees.

Economic and Fiscal Impacts of Expanding the Natural Gas Infrastructure in Maryland RESI of Towson University
48
Medium establishments are those with 50 or more employees but fewer than or equal to 499 employees.
Large establishments are those with more than 499 employees. Using the categories above, RESI redistributed each county’s universe of establishments based on County Business Pattern data, which includes both serviced and non-serviced establishments for natural gas. Figure 23 outlines this information for 2015. Figure 23: Commercial and Industrial Natural Gas Customers by County for 2015
County Small Establishments (<49 employees)
Medium Establishments (<499
employees)
Large Establishments (>499 employees)
Allegany County 1,533 76 4 Anne Arundel 12,896 831 23 Baltimore City 11,461 766 53 Baltimore County 18,577 1,165 40 Calvert County 1,636 50 2 Caroline County 561 22 2 Carroll County 4,094 157 4 Cecil County 1,709 68 7 Charles County 2,503 117 2 Dorchester County 687 29 1 Frederick County 5,638 307 10 Garrett County 871 33 2 Harford County 5,057 256 6 Howard County 8,252 672 22 Kent County 620 15 1 Montgomery County 25,206 1,464 69 Prince George’s County
13,285 968 28
Queen Anne’s County
1,310 38 0
St. Mary’s County 1,818 108 2 Somerset County 353 13 0 Talbot County 1,406 60 1 Washington County 3,224 192 10 Wicomico County 2,396 131 3 Worcester County 2,059 49 1
Total 127,152 7,587 293
Sources: CBP, RESI

Economic and Fiscal Impacts of Expanding the Natural Gas Infrastructure in Maryland RESI of Towson University
49
According to Figure 23, approximately 94.2 percent of establishments fall within the range of fewer than 49 employees. Using the share by size of establishments against the total establishment count, RESI applied these percentages to the total consumption of natural gas by county as forecasted by PJM. The share by size was then tabulated against the costs for natural gas costs per MMBTU versus other heating sources. The savings by each compared fuel type are reported in Figure 24. Figure 24: Commercial and Industrial Natural Gas Savings for All Establishments Weighted by Size Category
County Small Establishments
(<49 employees)
Medium Establishments (<499
employees)
Large Establishments (>499 employees)
Heating Oil vs. Natural Gas
$55,655,321 $229,165,566 $654,756,735
Electricity vs. Natural Gas
$47,337,070 $194,914,455 $556,896,718
Propane vs. Natural Gas
$113,164,514 $465,964,609 $1,331,323,332
Average $72,052,302 $296,681,543 $847,658,928
Sources: Maryland Natural Gas LDCs, CBP, RESI As noted in Figure 24, the average savings each year using natural gas for each size category amounted to the following.
Small establishments currently using natural gas save a combined average of $72.1 million each year in energy costs.
Medium establishments currently using natural gas save a combined average of $296.7 million per year in energy costs.
Large establishments currently using natural gas save a combined average of $847.7 million per year in energy costs.

Economic and Fiscal Impacts of Expanding the Natural Gas Infrastructure in Maryland RESI of Towson University
50
Appendix B—Detailed Economic Impacts B.1 Detailed Economic Impacts for Construction of Expansion by Year, County, and Type Figure 25: Economic Impacts from Natural Gas Expansion by County, 2016
County Jobs Output Wages
Allegany County 56 $2,644,862 $2,157,633 Anne Arundel 45 $2,126,469 $1,734,737 Baltimore City 16 $756,265 $616,948 Baltimore County 21 $961,306 $784,217 Calvert County 30 $1,408,389 $1,148,940 Caroline County 64 $2,975,470 $2,427,337 Carroll County 41 $1,934,056 $1,577,769 Cecil County 29 $1,344,472 $1,096,797 Charles County 24 $1,124,067 $916,994 Dorchester County 20 $925,702 $755,172 Frederick County 26 $1,239,779 $1,011,390 Garrett County 0 $0 $0 Harford County 16 $760,398 $620,319 Howard County 15 $714,113 $582,561 Kent County 30 $1,388,553 $1,132,757 Montgomery County 11 $531,105 $433,267 Prince George’s County 13 $621,543 $507,044 Queen Anne’s County 0 $0 $0 St. Mary’s County 19 $910,144 $742,480 Somerset County 4 $198,365 $161,822 Talbot County 0 $0 $0 Washington County 19 $906,810 $739,760 Wicomico County 20 $942,232 $768,657 Worcester County 0 $0 $0
Sources: REMI PI+, RESI

Economic and Fiscal Impacts of Expanding the Natural Gas Infrastructure in Maryland RESI of Towson University
51
Figure 26: Economic Impacts from Natural Gas Expansion by County, 2017
County Jobs Output Wages
Allegany County 96 $5,116,153 $3,954,061 Anne Arundel 77 $4,113,387 $3,179,065 Baltimore City 27 $1,462,900 $1,130,614 Baltimore County 35 $1,859,525 $1,437,149 Calvert County 51 $2,724,352 $2,105,537 Caroline County 108 $5,755,672 $4,448,318 Carroll County 70 $3,741,187 $2,891,407 Cecil County 49 $2,600,711 $2,009,981 Charles County 41 $2,174,365 $1,680,476 Dorchester County 34 $1,790,654 $1,383,921 Frederick County 45 $2,398,197 $1,853,466 Garrett County 0 $0 $0 Harford County 28 $1,470,894 $1,136,792 Howard County 26 $1,381,361 $1,067,596 Kent County 50 $2,685,980 $2,075,882 Montgomery County 19 $1,027,357 $794,001 Prince George’s County 23 $1,202,296 $929,204 Queen Anne’s County 0 $0 $0 St. Mary’s County 33 $1,760,559 $1,360,662 Somerset County 7 $383,711 $296,555 Talbot County 0 $0 $0 Washington County 33 $1,754,110 $1,355,678 Wicomico County 34 $1,822,630 $1,408,634 Worcester County 0 $0 $0
Sources: REMI PI+, RESI

Economic and Fiscal Impacts of Expanding the Natural Gas Infrastructure in Maryland RESI of Towson University
52
Figure 27: Economic Impacts from Natural Gas Expansion by County, 2018
County Jobs Output Wages
Allegany County 105 $5,873,241 $4,694,205 Anne Arundel 85 $4,722,086 $3,774,141 Baltimore City 30 $1,679,380 $1,342,249 Baltimore County 38 $2,134,697 $1,706,163 Calvert County 56 $3,127,501 $2,499,664 Caroline County 119 $6,607,396 $5,280,981 Carroll County 77 $4,294,808 $3,432,638 Cecil County 54 $2,985,564 $2,386,221 Charles County 45 $2,496,127 $1,995,037 Dorchester County 37 $2,055,634 $1,642,972 Frederick County 49 $2,753,082 $2,200,409 Garrett County 0 $0 $0 Harford County 30 $1,688,557 $1,349,584 Howard County 28 $1,585,775 $1,267,435 Kent County 55 $3,083,452 $2,464,458 Montgomery County 21 $1,179,385 $942,627 Prince George’s County 25 $1,380,212 $1,103,138 Queen Anne’s County 0 $0 $0 St. Mary’s County 36 $2,021,086 $1,615,359 Somerset County 8 $440,493 $352,065 Talbot County 0 $0 $0 Washington County 36 $2,013,683 $1,609,442 Wicomico County 38 $2,092,342 $1,672,311 Worcester County 0 $0 $0
Sources: REMI PI+, RESI

Economic and Fiscal Impacts of Expanding the Natural Gas Infrastructure in Maryland RESI of Towson University
53
Figure 28: Economic Impacts from Natural Gas Expansion by County, 2019
County Jobs Output Wages
Allegany County 149 $8,197,415 $6,904,727 Anne Arundel 120 $6,590,722 $5,551,400 Baltimore City 43 $2,343,948 $1,974,320 Baltimore County 54 $2,979,445 $2,509,603 Calvert County 79 $4,365,123 $3,676,767 Caroline County 168 $9,222,092 $7,767,818 Carroll County 109 $5,994,360 $5,049,081 Cecil County 76 $4,167,019 $3,509,903 Charles County 63 $3,483,901 $2,934,509 Dorchester County 52 $2,869,095 $2,416,654 Frederick County 70 $3,842,538 $3,236,591 Garrett County 0 $0 $0 Harford County 43 $2,356,757 $1,985,109 Howard County 40 $2,213,302 $1,864,276 Kent County 78 $4,303,643 $3,624,982 Montgomery County 30 $1,646,094 $1,386,514 Prince George’s County 35 $1,926,393 $1,622,611 Queen Anne’s County 0 $0 $0 St. Mary’s County 51 $2,820,875 $2,376,038 Somerset County 11 $614,806 $517,855 Talbot County 0 $0 $0 Washington County 51 $2,810,542 $2,367,335 Wicomico County 53 $2,920,329 $2,459,809 Worcester County 0 $0 $0
Sources: REMI PI+, RESI

Economic and Fiscal Impacts of Expanding the Natural Gas Infrastructure in Maryland RESI of Towson University
54
Figure 29: Economic Impacts from Natural Gas Expansion by County, 2020
County Jobs Output Wages
Allegany County 227 $12,272,148 $10,912,109 Anne Arundel 182 $9,866,807 $8,773,336 Baltimore City 65 $3,509,067 $3,120,181 Baltimore County 82 $4,460,454 $3,966,132 Calvert County 121 $6,534,919 $5,810,698 Caroline County 255 $13,806,167 $12,276,123 Carroll County 166 $8,974,008 $7,979,480 Cecil County 115 $6,238,342 $5,546,989 Charles County 96 $5,215,663 $4,637,646 Dorchester County 79 $4,295,252 $3,819,238 Frederick County 106 $5,752,570 $5,115,051 Garrett County 0 $0 $0 Harford County 65 $3,528,243 $3,137,231 Howard County 61 $3,313,480 $2,946,269 Kent County 119 $6,442,878 $5,728,857 Montgomery County 46 $2,464,327 $2,191,222 Prince George’s County 53 $2,883,955 $2,564,346 Queen Anne’s County 0 $0 $0 St. Mary’s County 78 $4,223,063 $3,755,049 Somerset County 17 $920,411 $818,408 Talbot County 0 $0 $0 Washington County 78 $4,207,594 $3,741,295 Wicomico County 81 $4,371,953 $3,887,439 Worcester County 0 $0 $0
Sources: REMI PI+, RESI

Economic and Fiscal Impacts of Expanding the Natural Gas Infrastructure in Maryland RESI of Towson University
55
Figure 30: Economic Impacts from Natural Gas Expansion by County, 2021
County Jobs Output Wages
Allegany County 348 $18,704,108 $17,428,374 Anne Arundel 280 $15,038,103 $14,012,413 Baltimore City 100 $5,348,206 $4,983,426 Baltimore County 127 $6,798,224 $6,334,544 Calvert County 185 $9,959,938 $9,280,609 Caroline County 392 $21,042,122 $19,606,921 Carroll County 255 $13,677,379 $12,744,498 Cecil County 177 $9,507,922 $8,859,423 Charles County 148 $7,949,246 $7,407,059 Dorchester County 122 $6,546,438 $6,099,931 Frederick County 163 $8,767,551 $8,169,550 Garrett County 0 $0 $0 Harford County 100 $5,377,431 $5,010,658 Howard County 94 $5,050,109 $4,705,661 Kent County 183 $9,819,657 $9,149,896 Montgomery County 70 $3,755,906 $3,499,730 Prince George’s County 82 $4,395,465 $4,095,668 Queen Anne’s County 0 $0 $0 St. Mary’s County 120 $6,436,414 $5,997,411 Somerset County 26 $1,402,808 $1,307,128 Talbot County 0 $0 $0 Washington County 119 $6,412,837 $5,975,442 Wicomico County 124 $6,663,338 $6,208,858 Worcester County 0 $0 $0
Sources: REMI PI+, RESI

Economic and Fiscal Impacts of Expanding the Natural Gas Infrastructure in Maryland RESI of Towson University
56
Figure 31: Economic Impacts from Natural Gas Expansion by County, 2022
County Jobs Output Wages
Allegany County 537 $28,784,325 $27,986,330 Anne Arundel 432 $23,142,597 $22,501,010 Baltimore City 154 $8,230,518 $8,002,341 Baltimore County 195 $10,461,995 $10,171,955 Calvert County 286 $15,327,653 $14,902,721 Caroline County 604 $32,382,366 $31,484,622 Carroll County 393 $21,048,538 $20,465,004 Cecil County 273 $14,632,032 $14,226,385 Charles County 228 $12,233,338 $11,894,190 Dorchester County 188 $10,074,514 $9,795,216 Frederick County 252 $13,492,652 $13,118,592 Garrett County 0 $0 $0 Harford County 154 $8,275,493 $8,046,070 Howard County 145 $7,771,768 $7,556,309 Kent County 282 $15,111,771 $14,692,823 Montgomery County 108 $5,780,078 $5,619,836 Prince George’s County 126 $6,764,316 $6,576,788 Queen Anne’s County 0 $0 $0 St. Mary’s County 185 $9,905,194 $9,630,590 Somerset County 40 $2,158,824 $2,098,975 Talbot County 0 $0 $0 Washington County 184 $9,868,911 $9,595,313 Wicomico County 191 $10,254,416 $9,970,130 Worcester County 0 $0 $0
Sources: REMI PI+, RESI

Economic and Fiscal Impacts of Expanding the Natural Gas Infrastructure in Maryland RESI of Towson University
57
Figure 32: Economic Impacts from Natural Gas Expansion by County, 2023
County Jobs Output Wages
Allegany County 829 $44,559,250 $40,798,927 Anne Arundel 667 $35,825,637 $32,802,337 Baltimore City 237 $12,741,160 $11,665,943 Baltimore County 301 $16,195,573 $14,828,841 Calvert County 442 $23,727,800 $21,725,429 Caroline County 933 $50,129,156 $45,898,793 Carroll County 606 $32,583,951 $29,834,215 Cecil County 422 $22,650,952 $20,739,455 Charles County 352 $18,937,681 $17,339,544 Dorchester County 290 $15,595,737 $14,279,624 Frederick County 389 $20,887,148 $19,124,497 Garrett County 0 $0 $0 Harford County 238 $12,810,784 $11,729,691 Howard County 224 $12,030,997 $11,015,710 Kent County 435 $23,393,606 $21,419,437 Montgomery County 167 $8,947,785 $8,192,688 Prince George’s County 195 $10,471,424 $9,587,748 Queen Anne’s County 0 $0 $0 St. Mary’s County 285 $15,333,624 $14,039,631 Somerset County 62 $3,341,944 $3,059,920 Talbot County 0 $0 $0 Washington County 284 $15,277,457 $13,988,204 Wicomico County 295 $15,874,233 $14,534,618 Worcester County 0 $0 $0
Sources: REMI PI+, RESI

Economic and Fiscal Impacts of Expanding the Natural Gas Infrastructure in Maryland RESI of Towson University
58
Figure 33: Economic Impacts from Natural Gas Expansion by County, 2024
County Jobs Output Wages
Allegany County 1,285 $69,233,297 $62,384,359 Anne Arundel 1,033 $55,663,571 $50,157,025 Baltimore City 368 $19,796,396 $17,838,028 Baltimore County 467 $25,163,641 $22,674,315 Calvert County 684 $36,866,731 $33,219,671 Caroline County 1,446 $77,887,459 $70,182,404 Carroll County 940 $50,626,849 $45,618,563 Cecil County 653 $35,193,593 $31,712,049 Charles County 546 $29,424,151 $26,513,353 Dorchester County 450 $24,231,654 $21,834,526 Frederick County 602 $32,453,108 $29,242,668 Garrett County 0 $0 $0 Harford County 370 $19,904,573 $17,935,503 Howard County 347 $18,692,990 $16,843,777 Kent County 675 $36,347,481 $32,751,789 Montgomery County 258 $13,902,493 $12,527,182 Prince George’s County 302 $16,269,825 $14,660,324 Queen Anne’s County 0 $0 $0 St. Mary’s County 442 $23,824,399 $21,467,559 Somerset County 96 $5,192,497 $4,678,827 Talbot County 0 $0 $0 Washington County 441 $23,737,130 $21,388,923 Wicomico County 458 $24,664,362 $22,224,428 Worcester County 0 $0 $0
Sources: REMI PI+, RESI

Economic and Fiscal Impacts of Expanding the Natural Gas Infrastructure in Maryland RESI of Towson University
59
Figure 34: Economic Impacts from Natural Gas Expansion by County, 2025
County Jobs Output Wages
Allegany County 1,995 $107,825,099 $95,108,361 Anne Arundel 1,604 $86,691,380 $76,467,122 Baltimore City 570 $30,831,239 $27,195,047 Baltimore County 725 $39,190,276 $34,568,231 Calvert County 1,062 $57,416,865 $50,645,202 Caroline County 2,244 $121,303,236 $106,996,906 Carroll County 1,459 $78,847,104 $69,547,989 Cecil County 1,014 $54,811,092 $48,346,750 Charles County 848 $45,825,667 $40,421,054 Dorchester County 698 $37,738,785 $33,287,926 Frederick County 935 $50,543,015 $44,582,044 Garrett County 0 $0 $0 Harford County 573 $30,999,716 $27,343,654 Howard County 539 $29,112,777 $25,679,258 Kent County 1,047 $56,608,177 $49,931,890 Montgomery County 401 $21,651,976 $19,098,373 Prince George’s County 469 $25,338,898 $22,350,465 Queen Anne’s County 0 $0 $0 St. Mary’s County 686 $37,104,519 $32,728,465 Somerset County 150 $8,086,882 $7,133,127 Talbot County 0 $0 $0 Washington County 684 $36,968,605 $32,608,581 Wicomico County 711 $38,412,692 $33,882,354 Worcester County 0 $0 $0
Sources: REMI PI+, RESI

Economic and Fiscal Impacts of Expanding the Natural Gas Infrastructure in Maryland RESI of Towson University
60
Figure 35: Economic Impacts from Natural Gas Expansion by County, 2026
County Jobs Output Wages
Allegany County 3,093 $168,377,467 $144,357,196 Anne Arundel 2,487 $135,375,484 $116,063,185 Baltimore City 884 $48,145,432 $41,277,136 Baltimore County 1,124 $61,198,733 $52,468,288 Calvert County 1,647 $89,661,001 $76,870,207 Caroline County 3,479 $189,424,651 $162,401,845 Carroll County 2,262 $123,126,023 $105,561,199 Cecil County 1,572 $85,591,879 $73,381,575 Charles County 1,314 $71,560,424 $61,351,808 Dorchester County 1,082 $58,932,114 $50,525,019 Frederick County 1,450 $78,926,938 $67,667,436 Garrett County 0 $0 $0 Harford County 889 $48,408,522 $41,502,694 Howard County 835 $45,461,916 $38,976,443 Kent County 1,624 $88,398,170 $75,787,528 Montgomery County 621 $33,811,282 $28,987,856 Prince George’s County 727 $39,568,705 $33,923,941 Queen Anne’s County 0 $0 $0 St. Mary’s County 1,064 $57,941,658 $49,675,859 Somerset County 232 $12,628,310 $10,826,790 Talbot County 0 $0 $0 Washington County 1,060 $57,729,417 $49,493,896 Wicomico County 1,102 $59,984,473 $51,427,251 Worcester County 0 $0 $0
Sources: REMI PI+, RESI

Economic and Fiscal Impacts of Expanding the Natural Gas Infrastructure in Maryland RESI of Towson University
61
B.2 Detailed Economic Impacts after Expansion by Year, County, and Type Figure 36: Economic Impacts from Natural Gas Expansion by County, 2016
County Jobs Output Wages
Allegany County 47 $5,434,653 $2,174,576 Anne Arundel 37 $4,369,461 $1,748,359 Baltimore City 13 $1,553,971 $621,793 Baltimore County 17 $1,975,287 $790,375 Calvert County 25 $2,893,953 $1,157,962 Caroline County 52 $6,113,985 $2,446,398 Carroll County 34 $3,974,090 $1,590,159 Cecil County 24 $2,762,615 $1,105,410 Charles County 20 $2,309,728 $924,195 Dorchester County 16 $1,902,129 $761,102 Frederick County 22 $2,547,494 $1,019,333 Garrett County 0 $0 $0 Harford County 13 $1,562,463 $625,191 Howard County 13 $1,467,356 $587,136 Kent County 24 $2,853,193 $1,141,653 Montgomery County 9 $1,091,313 $436,669 Prince George’s County 11 $1,277,144 $511,025 Queen Anne’s County 0 $0 $0 St. Mary’s County 16 $1,870,160 $748,310 Somerset County 3 $407,599 $163,093 Talbot County 0 $0 $0 Washington County 16 $1,863,310 $745,569 Wicomico County 17 $1,936,095 $774,693 Worcester County 0 $0 $0
Sources: REMI PI+, RESI

Economic and Fiscal Impacts of Expanding the Natural Gas Infrastructure in Maryland RESI of Towson University
62
Figure 37: Economic Impacts from Natural Gas Expansion by County, 2017
County Jobs Output Wages
Allegany County 64 $7,661,815 $3,136,967 Anne Arundel 51 $6,160,099 $2,522,121 Baltimore City 18 $2,190,800 $896,976 Baltimore County 23 $2,784,775 $1,140,167 Calvert County 34 $4,079,916 $1,670,435 Caroline County 72 $8,619,541 $3,529,088 Carroll County 47 $5,602,702 $2,293,907 Cecil County 32 $3,894,756 $1,594,625 Charles County 27 $3,256,271 $1,333,211 Dorchester County 22 $2,681,635 $1,097,938 Frederick County 30 $3,591,476 $1,470,453 Garrett County 0 $0 $0 Harford County 18 $2,202,772 $901,878 Howard County 17 $2,068,690 $846,981 Kent County 34 $4,022,453 $1,646,908 Montgomery County 13 $1,538,542 $629,923 Prince George’s County 15 $1,800,526 $737,187 Queen Anne’s County 0 $0 $0 St. Mary’s County 22 $2,636,566 $1,079,486 Somerset County 5 $574,636 $235,273 Talbot County 0 $0 $0 Washington County 22 $2,626,908 $1,075,532 Wicomico County 23 $2,729,521 $1,117,544 Worcester County 0 $0 $0
Sources: REMI PI+, RESI

Economic and Fiscal Impacts of Expanding the Natural Gas Infrastructure in Maryland RESI of Towson University
63
Figure 38: Economic Impacts from Natural Gas Expansion by County, 2018
County Jobs Output Wages
Allegany County 82 $10,019,886 $4,182,883 Anne Arundel 66 $8,055,988 $3,363,038 Baltimore City 23 $2,865,061 $1,196,043 Baltimore County 30 $3,641,843 $1,520,317 Calvert County 44 $5,335,589 $2,227,385 Caroline County 92 $11,272,372 $4,705,743 Carroll County 60 $7,327,042 $3,058,733 Cecil County 42 $5,093,442 $2,126,299 Charles County 35 $4,258,452 $1,777,725 Dorchester County 29 $3,506,960 $1,464,009 Frederick County 38 $4,696,822 $1,960,726 Garrett County 0 $0 $0 Harford County 24 $2,880,717 $1,202,579 Howard County 22 $2,705,369 $1,129,378 Kent County 43 $5,260,440 $2,196,013 Montgomery County 16 $2,012,058 $839,950 Prince George’s County 19 $2,354,673 $982,977 Queen Anne’s County 0 $0 $0 St. Mary’s County 28 $3,448,020 $1,439,404 Somerset County 6 $751,491 $313,716 Talbot County 0 $0 $0 Washington County 28 $3,435,390 $1,434,131 Wicomico County 29 $3,569,584 $1,490,152 Worcester County 0 $0 $0
Sources: REMI PI+, RESI

Economic and Fiscal Impacts of Expanding the Natural Gas Infrastructure in Maryland RESI of Towson University
64
Figure 39: Economic Impacts from Natural Gas Expansion by County, 2019
County Jobs Output Wages
Allegany County 98 $12,415,593 $5,233,738 Anne Arundel 79 $9,982,136 $4,207,926 Baltimore City 28 $3,550,083 $1,496,522 Baltimore County 36 $4,512,590 $1,902,263 Calvert County 52 $6,611,303 $2,786,966 Caroline County 111 $13,967,542 $5,887,955 Carroll County 72 $9,078,902 $3,827,171 Cecil County 50 $6,311,260 $2,660,484 Charles County 42 $5,276,627 $2,224,339 Dorchester County 34 $4,345,457 $1,831,808 Frederick County 46 $5,819,809 $2,453,315 Garrett County 0 $0 $0 Harford County 28 $3,569,483 $1,504,700 Howard County 27 $3,352,210 $1,413,109 Kent County 52 $6,518,186 $2,747,713 Montgomery County 20 $2,493,131 $1,050,968 Prince George’s County 23 $2,917,664 $1,229,928 Queen Anne’s County 0 $0 $0 St. Mary’s County 34 $4,272,424 $1,801,022 Somerset County 7 $931,169 $392,530 Talbot County 0 $0 $0 Washington County 34 $4,256,775 $1,794,425 Wicomico County 35 $4,423,055 $1,864,519 Worcester County 0 $0 $0
Sources: REMI PI+, RESI

Economic and Fiscal Impacts of Expanding the Natural Gas Infrastructure in Maryland RESI of Towson University
65
Figure 40: Economic Impacts from Natural Gas Expansion by County, 2020
County Jobs Output Wages
Allegany County 114 $14,972,824 $6,365,259 Anne Arundel 92 $12,038,151 $5,117,668 Baltimore City 33 $4,281,292 $1,820,066 Baltimore County 42 $5,442,046 $2,313,527 Calvert County 61 $7,973,029 $3,389,500 Caroline County 129 $16,844,427 $7,160,916 Carroll County 84 $10,948,878 $4,654,596 Cecil County 58 $7,611,186 $3,235,673 Charles County 49 $6,363,450 $2,705,235 Dorchester County 40 $5,240,488 $2,227,841 Frederick County 54 $7,018,511 $2,983,715 Garrett County 0 $0 $0 Harford County 33 $4,304,687 $1,830,012 Howard County 31 $4,042,663 $1,718,620 Kent County 60 $7,860,733 $3,341,761 Montgomery County 23 $3,006,640 $1,278,185 Prince George’s County 27 $3,518,614 $1,495,836 Queen Anne’s County 0 $0 $0 St. Mary’s County 39 $5,152,413 $2,190,398 Somerset County 9 $1,122,962 $477,394 Talbot County 0 $0 $0 Washington County 39 $5,133,540 $2,182,374 Wicomico County 41 $5,334,069 $2,267,623 Worcester County 0 $0 $0
Sources: REMI PI+, RESI

Economic and Fiscal Impacts of Expanding the Natural Gas Infrastructure in Maryland RESI of Towson University
66
Figure 41: Economic Impacts from Natural Gas Expansion by County, 2021
County Jobs Output Wages
Allegany County 133 $17,963,931 $7,682,420 Anne Arundel 107 $14,443,000 $6,176,665 Baltimore City 38 $5,136,562 $2,196,692 Baltimore County 48 $6,529,198 $2,792,264 Calvert County 71 $9,565,793 $4,090,888 Caroline County 149 $20,209,422 $8,642,722 Carroll County 97 $13,136,124 $5,617,769 Cecil County 68 $9,131,665 $3,905,230 Charles County 56 $7,634,671 $3,265,028 Dorchester County 46 $6,287,376 $2,688,847 Frederick County 62 $8,420,593 $3,601,134 Garrett County 0 $0 $0 Harford County 38 $5,164,630 $2,208,696 Howard County 36 $4,850,261 $2,074,253 Kent County 70 $9,431,064 $4,033,270 Montgomery County 27 $3,607,273 $1,542,679 Prince George’s County 31 $4,221,524 $1,805,369 Queen Anne’s County 0 $0 $0 St. Mary’s County 46 $6,181,706 $2,643,656 Somerset County 10 $1,347,295 $576,181 Talbot County 0 $0 $0 Washington County 46 $6,159,062 $2,633,972 Wicomico County 47 $6,399,650 $2,736,862 Worcester County 0 $0 $0
Sources: REMI PI+, RESI

Economic and Fiscal Impacts of Expanding the Natural Gas Infrastructure in Maryland RESI of Towson University
67
Figure 42: Economic Impacts from Natural Gas Expansion by County, 2022
County Jobs Output Wages
Allegany County 153 $21,417,383 $9,205,826 Anne Arundel 123 $17,219,576 $7,401,484 Baltimore City 44 $6,124,033 $2,632,291 Baltimore County 56 $7,784,395 $3,345,964 Calvert County 81 $11,404,756 $4,902,102 Caroline County 172 $24,094,556 $10,356,554 Carroll County 112 $15,661,461 $6,731,760 Cecil County 78 $10,887,170 $4,679,628 Charles County 65 $9,102,388 $3,912,476 Dorchester County 54 $7,496,084 $3,222,039 Frederick County 72 $10,039,398 $4,315,231 Garrett County 0 $0 $0 Harford County 44 $6,157,498 $2,646,675 Howard County 41 $5,782,693 $2,485,573 Kent County 80 $11,244,126 $4,833,058 Montgomery County 31 $4,300,749 $1,848,589 Prince George’s County 36 $5,033,085 $2,163,369 Queen Anne’s County 0 $0 $0 St. Mary’s County 53 $7,370,099 $3,167,887 Somerset County 11 $1,606,304 $690,437 Talbot County 0 $0 $0 Washington County 52 $7,343,103 $3,156,283 Wicomico County 55 $7,629,943 $3,279,575 Worcester County 0 $0 $0
Sources: REMI PI+, RESI

Economic and Fiscal Impacts of Expanding the Natural Gas Infrastructure in Maryland RESI of Towson University
68
Figure 43: Economic Impacts from Natural Gas Expansion by County, 2023
County Jobs Output Wages
Allegany County 176 $25,484,891 $11,016,142 Anne Arundel 142 $20,489,852 $8,856,978 Baltimore City 50 $7,287,086 $3,149,928 Baltimore County 64 $9,262,778 $4,003,944 Calvert County 94 $13,570,704 $5,866,095 Caroline County 198 $28,670,502 $12,393,159 Carroll County 129 $18,635,826 $8,055,554 Cecil County 90 $12,954,819 $5,599,872 Charles County 75 $10,831,078 $4,681,860 Dorchester County 62 $8,919,712 $3,855,650 Frederick County 83 $11,946,042 $5,163,816 Garrett County 0 $0 $0 Harford County 51 $7,326,906 $3,167,141 Howard County 48 $6,880,920 $2,974,358 Kent County 92 $13,379,568 $5,783,474 Montgomery County 35 $5,117,530 $2,212,112 Prince George’s County 41 $5,988,949 $2,588,793 Queen Anne’s County 0 $0 $0 St. Mary’s County 61 $8,769,801 $3,790,849 Somerset County 13 $1,911,367 $826,211 Talbot County 0 $0 $0 Washington County 60 $8,737,677 $3,776,963 Wicomico County 63 $9,078,992 $3,924,500 Worcester County 0 $0 $0
Sources: REMI PI+, RESI

Economic and Fiscal Impacts of Expanding the Natural Gas Infrastructure in Maryland RESI of Towson University
69
Figure 44: Economic Impacts from Natural Gas Expansion by County, 2024
County Jobs Output Wages
Allegany County 204 $30,430,029 $13,270,668 Anne Arundel 164 $24,465,743 $10,669,617 Baltimore City 58 $8,701,086 $3,794,582 Baltimore County 74 $11,060,145 $4,823,377 Calvert County 109 $16,203,990 $7,066,631 Caroline County 230 $34,233,782 $14,929,502 Carroll County 149 $22,251,958 $9,704,176 Cecil County 104 $15,468,598 $6,745,923 Charles County 87 $12,932,762 $5,640,034 Dorchester County 72 $10,650,510 $4,644,734 Frederick County 96 $14,264,076 $6,220,626 Garrett County 0 $0 $0 Harford County 59 $8,748,633 $3,815,317 Howard County 55 $8,216,108 $3,583,080 Kent County 107 $15,975,765 $6,967,101 Montgomery County 41 $6,110,546 $2,664,836 Prince George’s County 48 $7,151,057 $3,118,607 Queen Anne’s County 0 $0 $0 St. Mary’s County 70 $10,471,510 $4,566,671 Somerset County 15 $2,282,252 $995,300 Talbot County 0 $0 $0 Washington County 70 $10,433,153 $4,549,943 Wicomico County 73 $10,840,698 $4,727,676 Worcester County 0 $0 $0
Sources: REMI PI+, RESI

Economic and Fiscal Impacts of Expanding the Natural Gas Infrastructure in Maryland RESI of Towson University
70
Figure 45: Economic Impacts from Natural Gas Expansion by County, 2025
County Jobs Output Wages
Allegany County 241 $36,682,512 $16,197,750 Anne Arundel 194 $29,492,740 $13,022,991 Baltimore City 69 $10,488,906 $4,631,544 Baltimore County 87 $13,332,682 $5,887,259 Calvert County 128 $19,533,438 $8,625,302 Caroline County 271 $41,267,826 $18,222,469 Carroll County 176 $26,824,087 $11,844,605 Cecil County 122 $18,646,944 $8,233,856 Charles County 102 $15,590,068 $6,884,044 Dorchester County 84 $12,838,879 $5,669,212 Frederick County 113 $17,194,928 $7,592,695 Garrett County 0 $0 $0 Harford County 69 $10,546,222 $4,656,853 Howard County 65 $9,904,278 $4,373,392 Kent County 126 $19,258,319 $8,503,819 Montgomery County 48 $7,366,085 $3,252,613 Prince George’s County 57 $8,620,390 $3,806,471 Queen Anne’s County 0 $0 $0 St. Mary’s County 83 $12,623,100 $5,573,932 Somerset County 18 $2,751,188 $1,214,831 Talbot County 0 $0 $0 Washington County 83 $12,576,861 $5,553,514 Wicomico County 86 $13,068,145 $5,770,448 Worcester County 0 $0 $0
Sources: REMI PI+, RESI

Economic and Fiscal Impacts of Expanding the Natural Gas Infrastructure in Maryland RESI of Towson University
71
Figure 46: Economic Impacts from Natural Gas Expansion by County, 2026
County Jobs Output Wages
Allegany County 244 $38,790,854 $17,099,755 Anne Arundel 196 $31,187,846 $13,748,203 Baltimore City 70 $11,091,760 $4,889,461 Baltimore County 89 $14,098,983 $6,215,103 Calvert County 130 $20,656,130 $9,105,620 Caroline County 274 $43,639,710 $19,237,225 Carroll County 178 $28,365,812 $12,504,196 Cecil County 124 $19,718,684 $8,692,376 Charles County 104 $16,486,113 $7,267,396 Dorchester County 85 $13,576,799 $5,984,914 Frederick County 114 $18,183,213 $8,015,510 Garrett County 0 $0 $0 Harford County 70 $11,152,370 $4,916,180 Howard County 66 $10,473,530 $4,616,934 Kent County 128 $20,365,198 $8,977,372 Montgomery County 49 $7,789,454 $3,433,741 Prince George’s County 57 $9,115,851 $4,018,443 Queen Anne’s County 0 $0 $0 St. Mary’s County 84 $13,348,617 $5,884,328 Somerset County 18 $2,909,314 $1,282,482 Talbot County 0 $0 $0 Washington County 84 $13,299,721 $5,862,773 Wicomico County 87 $13,819,242 $6,091,788 Worcester County 0 $0 $0
Sources: REMI PI+, RESI
END OF DOCUMENT