the economic and fiscal impacts of adriaen’s landing
TRANSCRIPT
Connecticut Department of Economic and Community DevelopmentThe Economic and Fiscal Impacts of Adriaen’s Landing
THE ECONOMIC AND FISCAL IMPACTS OF
ADRIAEN’S LANDING
DEPARTMENT OF ECONOMIC AND COMMUNITY DEVELOPMENT
Prepared for the
Capital City Economic Development Authority
July 2008

Connecticut Department of Economic and Community DevelopmentThe Economic and Fiscal Impacts of Adriaen’s Landing
Authored by:
Nandika Prakash and
Stanley McMillen, Ph.D.
Research Assistance by:
Kolie Sun
Connecticut Department of Economic and Community DevelopmentThe Economic and Fiscal Impacts of Adriaen’s Landing
TABLE OF CONTENTS
EXECUTIVE SUMMARY ...................................................................................................... i
Economic and Fiscal Impacts ............................................................................................ ii
INTRODUCTION.................................................................................................................. 4
Adriaen’s Landing Overview............................................................................................. 4Methodology Overview ..................................................................................................... 5
Economic Impacts ........................................................................................................ 5Modeling Strategy ............................................................................................................ 6
Connecticut Convention Center .................................................................................... 7Estimating Visitor Spending.......................................................................................... 8The Marriott Hotel........................................................................................................12Parking Revenues .......................................................................................................12Connecticut Science Center ........................................................................................13Front Street .................................................................................................................14State Assistance for Adriaen’s Landing .......................................................................21
RESULTS ...........................................................................................................................23
Economic Impact.............................................................................................................23Fiscal Impact ...................................................................................................................25
APPENDIX B: THE REMI MODEL .....................................................................................28
Model Overview...............................................................................................................30Understanding the Model ................................................................................................32Output Block....................................................................................................................33Labor and Capital Demand Block ....................................................................................34Population and Labor Supply Block .................................................................................34Wage, Price and Profit Block ...........................................................................................35Market Shares Block .......................................................................................................36The Complete Model .......................................................................................................36

Connecticut Department of Economic and Community DevelopmentThe Economic and Fiscal Impacts of Adriaen’s Landing
i
EXECUTIVE SUMMARY
The Capital City Economic Development Authority (CCEDA) asked the Connecticut
Department of Economic and Community Development (DECD) to conduct an economic
and fiscal impact study of the complete Adriaen’s Landing complex, namely the Connecticut
Convention Center, the Marriott Hotel and the Westside Parking Garage, and the future
Science Center and Front Street developments.
Construction of Adriaen’s Landing began in 2000. The Convention Center, Marriott Hotel,
and Westside Parking Garage have been in operation since 2005. The Science Center is
expected to open in spring 2009, and construction on the Front Street developments will
begin in 2009 and is expected to be complete by 2013.
The Front Street development will contain retail, entertainment, restaurant, office and
residential spaces and will complement the Convention Center, Marriott Hotel and the
Science Center providing attractive shopping and dining venues and new housing in the
Hartford central business district.
Economic and Fiscal Impacts
DECD obtained construction, sales and estimated sales data for the existing Adriaen’s
Landing components, and estimates future sales based on assumptions consistent with
each facility’s own projections. DECD estimates the economic and fiscal impacts of the
Front Street developments using construction costs and sales and employment estimates
based on the areas (square footage) for the retail, restaurant, entertainment and office
spaces.
The economic and fiscal impacts (that is, changes from the no-build or baseline forecast) for
Adriaen’s Landing appear in Table 1. The values for jobs, population, gross regional
product, personal income and net state revenue represent the annual average increases in
these variables above the baseline forecast of the Hartford County and state economies. In
other words, we expect Adriaen’s Landing to benefit Hartford County and the State of
Connecticut by the amounts in Table 1 on average annually. DECD counts the construction
employment and related expenditure in the future impact results in Table 1 as they are part
Connecticut Department of Economic and Community DevelopmentThe Economic and Fiscal Impacts of Adriaen’s Landing
ii
of the current and near-term economic development in Hartford. The developments are
financed by private, federal and state funding. The state provides bond-financed grants to
assist the Front Street and Science Center developments. The 31-year period over which
the impact is measured (1999-2030) encompasses each construction phase and includes
the 20 years that the state will pay debt service on each bond issue.
The employment created represents the new jobs in the region as a result of new economic
activity generated by the Adriaen’s Landing developments. That population increases less
than the number of jobs on average annually implies the labor force participation rate
increases (that is, some unemployed workers who were not looking for work entered the
labor force). Gross product represents the annual average increase in the value added at
the county and state levels due to ongoing operations of the Adriaen’s Landing
developments. Personal income increases represent the effects of the Adriaen’s Landing
activity on people’s pocketbooks as incomes generated through ongoing operations ripple
through the economy.
State revenue appearing in Table 1 represents the annual average increase in the variety of
taxes and fees thrown off by the ongoing operations of the Adriaen’s Landing developments.
State expenditure represents the annual average increase in the variety of spending due to
the ongoing operations of the Adriaen’s Landing developments and is primarily in response
to the population increase that requires increased public services.
Table 1: Economic and Fiscal Impact of Adriaen’s Landing
in 2006 Dollars, 1999-2030
Hartford County State
Employment (jobs) 1,680 jobs 1,852 jobs
Population 1,306 persons 1,708 persons
Gross Product $145,884,753 $164,414,467
Personal Income $77,798,938 $109,960,096
State Revenue $11,400,240 $14,612,635
State Expenditure $5,255,870 $6,733,090
Net State Revenue $6,144,371 $7,879,545
Source: DECD calculations using REMI output

Connecticut Department of Economic and Community DevelopmentThe Economic and Fiscal Impacts of Adriaen’s Landing
iii
The fiscal impact for the City of Hartford appears in Table 2 and represents the annual
average changes in tax revenue arising from additions to the Grand List and municipal
expenditure due to the construction and operations that phase in over a period of several
years.
Table 2: Average Annual Fiscal Impact for City of Hartford
in 2006 Dollars, 1999-2030
Local Revenue $29,341,071
Local Expenditure $2,887,195
Net Local Revenue $26,453,876
Source: DECD calculations using REMI output
Connecticut Department of Economic and Community DevelopmentThe Economic and Fiscal Impacts of Adriaen’s Landing
4
INTRODUCTION
Adriaen’s Landing Overview
In 2001, the State of Connecticut, the City of Hartford and local economic development
organizations began a major renovation project in Hartford known as Adriaen’s Landing.
The project consists of a Convention Center, an adjacent Marriott Hotel, a Science Center,
and a new residential, retail and entertainment district and parking garages known as Front
Street. The Convention Center, Marriott Hotel, and the Westside Parking Garage are
complete and in operation; the Science Center (including its parking facility) is expected to
open in 2009, and construction of the Front Street components is underway.
The Capital City Economic Development Authority (CCEDA) asked the Connecticut
Department of Economic and Community Development (DECD) to conduct an economic
impact study of the complete Adriaen’s Landing complex. This encompasses the existing
structures (the Convention Center, Marriott Hotel, and the Westside Parking Garage) and
the proposed future developments (the Science Center and Front Street). The study
incorporates actual and estimated construction costs, fit-out costs, sales revenues of each
development, parking revenues, visitor spending, apartment rental revenues, and consumer
spending of new tenants.
CCEDA obtained actual and estimated construction, fit-out and sales data from the
Convention Center, Marriott Hotel, Science Center and the existing parking facilities (in
addition to Westside Parking Garage, each development has its own parking facility) and
provided it to DECD. The economic and fiscal impact of these developments derive from
three components: spending by visitors to these facilities, total sales of the facilities
themselves, and total purchases made by these facilities to support their sales (purchases
are the goods and services, including labor that the facilities purchase from the regional
economy). These components are the long-run drivers of economic value for the region as
the construction phase effects rapidly dissipate.
Both the Convention Center and Marriott Hotel have been in operation since 2005-2006 and
have expansions planned. The Westside Garage has been open since 2005. The Science
Connecticut Department of Economic and Community DevelopmentThe Economic and Fiscal Impacts of Adriaen’s Landing
5
Center is expected to open in spring 2009. The methodology and assumptions used by
DECD to estimate future sales of these developments is explained in the following section.
Construction of the Front Street complex will occur in two phases. The first phase and a
planned extension (Phase 1 and Phase 1a) include construction of a pedestrian overpass,
public infrastructure improvements, parking garage and restaurant/retail/entertainment
spaces. The second phase (Phase 2) includes restaurant/retail/entertainment spaces, a
parking garage, office space and residential units. The sales, employment and amenities
that flow from these new structures drive their economic and fiscal impact on the region.
The following section details the methodology and assumptions used by DECD to estimate
the potential sales and employment impact of these developments.
Methodology Overview
Economic Impacts
Economic benefits generally separate into three types of economic impact: direct, indirect,
and induced. Direct impacts are those arising from the initial spending by the industry
studied, such as payroll for employees and contract workers, goods and services
purchases, and rent and permit fees. Direct impacts include the jobs in the industries under
consideration. Indirect impacts arise as the businesses and governments that supply the
goods, services, permits, rents, and other things to an industry in turn buy goods and
services from other places. A caterer buying produce from a local supplier to serve on a
movie set is an example of this kind of impact. Induced impacts represent the additional
income earned and spent by workers and business owners due to their participation in and
support of a particular industry. For example, the profits and wages earned by a catering
business supplying a movie production creates additional income for the caterer and his or
her employees. When these workers spend the income they earn in Connecticut to buy
local goods and services, they generate induced impacts for the state. The total impact is
the sum of the direct, indirect and induced impacts.
Indirect and induced impacts are the phenomena that produce the “ripple effects” that
industries such as the film and video industries have on a local economy. These impacts

Connecticut Department of Economic and Community DevelopmentThe Economic and Fiscal Impacts of Adriaen’s Landing
6
explain the boost to a local economy that production companies create as they spend their
money on a project. Subsequent spending ripples outward through the economy, affecting
a number of industries not directly related to the production of an event held at the
Convention Center or Marriott Hotel, or exhibitions at the Science Center or Front Street
retail and entertainment sales.
Modeling Strategy
To obtain the economic and fiscal impact of the entire Adriaen’s Landing project, DECD
entered the construction and operations information from each component as ‘policy
variable’ inputs into the REMI model. The results from the model provide the total economic
and fiscal impact (the sum of the direct, indirect and induced effects) that the development
has on the county and state. REMI’s first input year is 2006; therefore the start date of the
construction and subsequent operations of each component is time-shifted so that the first
input can be made in 2006. The dollar values of all the inputs were therefore compounded
(by an inflation rate of 3%) to accurately reflect the real value of the investments. Time-
shifting essentially moves the project forward in time. This does not affect the final outcome
as all dollar values in the final results are converted to 2006 (fixed) dollars.
Before the construction of Adriaen’s Landing began in 2000, the state issued $3 million in
general obligation bonds in 1999 to partially finance state funding of the development. We
take this event as the commencement of the project. Time-shifting it to 2006 entails
compounding income and expenditure dollars over seven years, and each subsequent
pecuniary input was similarly compounded over seven years to adjust for inflation and
maintain its real value. The study period is 31 years (1999-2030, or 2006-2037 in REMI);
this is the period over which the state government pays debt service on the bonds it issued
to finance the state’s spending on Adriaen’s Landing. All construction is completed over the
first 14 years, so the results include 17 years during which all components of Adriaen’s
Landing are fully operational.
For the existing components of Adriaen’s Landing, we have actual construction and fit-out
costs and sales data for 2005-2008. We also have projected sales from the Marriott Hotel,
the Science Center and the existing parking facilities for the next few years. Both the
Convention Center and the Marriott Hotel have future expansions planned and included
Connecticut Department of Economic and Community DevelopmentThe Economic and Fiscal Impacts of Adriaen’s Landing
7
expected construction costs for these expansions in their data. Payments for furniture,
fixtures and equipment (FF&E), or fit-out costs, are usually made to wholesale sellers, and
not all such purchases are made in-state. We assume that 40% of FF&E impacts the state.
Connecticut Convention Center
Construction on the Convention Center began in 2000 it became operational in 2006.
Construction of an expansion is ongoing and is expected to continue through 2010. Total
construction costs for the Convention Center were approximately $410.5 million by the end
of 2007, and are expected to total $422.5 million by 2010, when all construction is expected
to be completed. In addition to the direct construction cost, there were costs associated with
the acquisition of the land on which the Convention Center was built and its preparation for
construction including moving Connecticut Natural Gas (CNG) office space.
Investments such as the Convention Center are undertaken because of the prospective
long-term benefits these types of structures can produce. The Convention Center earns
revenue through the rental of its facility, from the provision of event services, from food and
beverage sales, and from other sources. The Convention Center hosted 285 events in
2006 and its total revenues from all sources were $7.6 million. In 2007, it hosted 204 events
and realized almost $7.9 million in sales. Its expected revenues for 2008 are $7.4 million.
Bookings at the Convention Center have been rising and have exceeded expectations in the
first few years of operation. The impact will increase as the Convention Center hosts more
multiple-day events and regional and national events that attract more out-of-state visitors
(currently the majority of events are one-day events and/or events with an attendee base
primarily in Connecticut). As Hartford and the Convention Center market themselves as an
attractive venue for regional and national events, the visitor base will widen and the
economic and fiscal impact of these establishments will increase. We estimate that the
Convention Center’s revenues rise by 4% a year from 2009 to 2012. Assuming an inflation
rate of 3%, this translates into a real increase in revenues of 1% a year, which is a
conservative estimate.
By 2013, all phases of the Front Street developments are expected to be complete, and this
will increase the attractiveness of the area as a venue for events. The introduction of mixed-
Connecticut Department of Economic and Community DevelopmentThe Economic and Fiscal Impacts of Adriaen’s Landing
8
use residential and retail establishments into the area will increase the attractiveness of the
region and increase both the number of events and attendees in Hartford. We therefore
conservatively estimate that revenues increase by 4.5% per year beginning in 2013. This
translates into a real increase of 1.5% a year. We assume this rate of change continues
through the end of the study period.
Convention Center events draw attendees (visitors) from both in-state and out-of-state, and
these visitors spend money in the area while attending the event. This visitor spending is a
further economic impact of Adriaen’s Landing and needs to be included in an estimate of its
total economic effects.
Estimating Visitor Spending
Convention Center attendees and hotel guests are visitors to the region and their spending
is an integral part of the travel and tourism impact on our economy. The spending flows
directly into the local economy and creates additional economic activities referred to as the
ripple or multiplier effect.
We reviewed several studies on visitor spending patterns. A 2006 study of the Monona
Terrace Community and Convention Center in Madison, Wisconsin, estimated that
convention attendees spent an average of $738 per event. This study took the latest
estimates of convention attendee spending from the Destination Marketing Association
International (DMAI) 2005 ExPact study, and adjusted them downwards to reflect the “small
market” definition of Madison and 2005 Monona Terrace actual data. The average length of
stay for an event was 3.56 nights. In 2003, C.H. Johnson Consulting, Inc. studied
convention spending in Peoria, Illinois, and found convention attendees spent an average of
$198 per day, and sporting event visitors spent approximately $57 per day in that area.
During FY 2003 and 2004, the San Jose Convention & Visitors Bureau estimated that
convention and meeting attendees spent an average of $117 per day, and day-trippers
spent an average of $58 while visiting the city. The different characteristics between
“business” and “leisure” travelers reflect in their spending patterns.
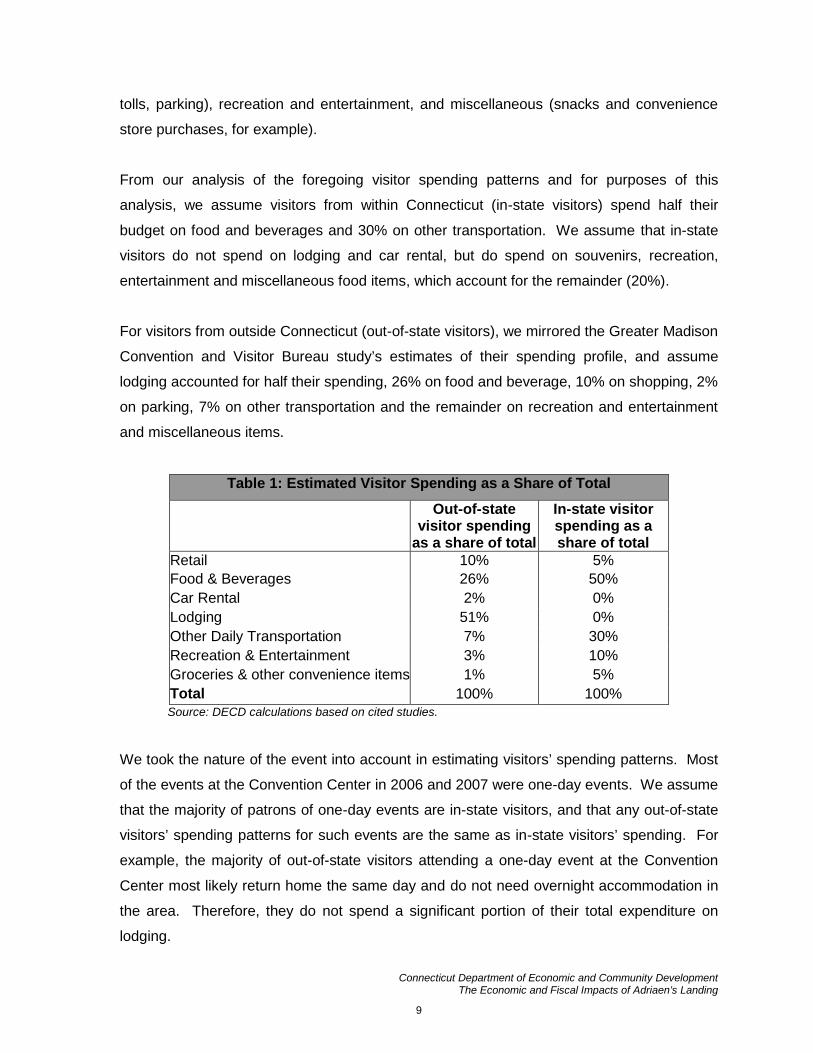
Based on the above studies, we identified spending profiles in the following categories:
retail, food and beverages, car rental, lodging, other transportation (fuel, maintenance and
Connecticut Department of Economic and Community DevelopmentThe Economic and Fiscal Impacts of Adriaen’s Landing
9
tolls, parking), recreation and entertainment, and miscellaneous (snacks and convenience
store purchases, for example).
From our analysis of the foregoing visitor spending patterns and for purposes of this
analysis, we assume visitors from within Connecticut (in-state visitors) spend half their
budget on food and beverages and 30% on other transportation. We assume that in-state
visitors do not spend on lodging and car rental, but do spend on souvenirs, recreation,
entertainment and miscellaneous food items, which account for the remainder (20%).
For visitors from outside Connecticut (out-of-state visitors), we mirrored the Greater Madison
Convention and Visitor Bureau study’s estimates of their spending profile, and assume
lodging accounted for half their spending, 26% on food and beverage, 10% on shopping, 2%
on parking, 7% on other transportation and the remainder on recreation and entertainment
and miscellaneous items.
Table 1: Estimated Visitor Spending as a Share of Total
Out-of-statevisitor spending
as a share of total
In-state visitorspending as ashare of total
Retail 10% 5%
Food & Beverages 26% 50%
Car Rental 2% 0%
Lodging 51% 0%
Other Daily Transportation 7% 30%
Recreation & Entertainment 3% 10%
Groceries & other convenience items 1% 5%
Total 100% 100%Source: DECD calculations based on cited studies.
We took the nature of the event into account in estimating visitors’ spending patterns. Most
of the events at the Convention Center in 2006 and 2007 were one-day events. We assume
that the majority of patrons of one-day events are in-state visitors, and that any out-of-state
visitors’ spending patterns for such events are the same as in-state visitors’ spending. For
example, the majority of out-of-state visitors attending a one-day event at the Convention
Center most likely return home the same day and do not need overnight accommodation in
the area. Therefore, they do not spend a significant portion of their total expenditure on
lodging.
Connecticut Department of Economic and Community DevelopmentThe Economic and Fiscal Impacts of Adriaen’s Landing
10
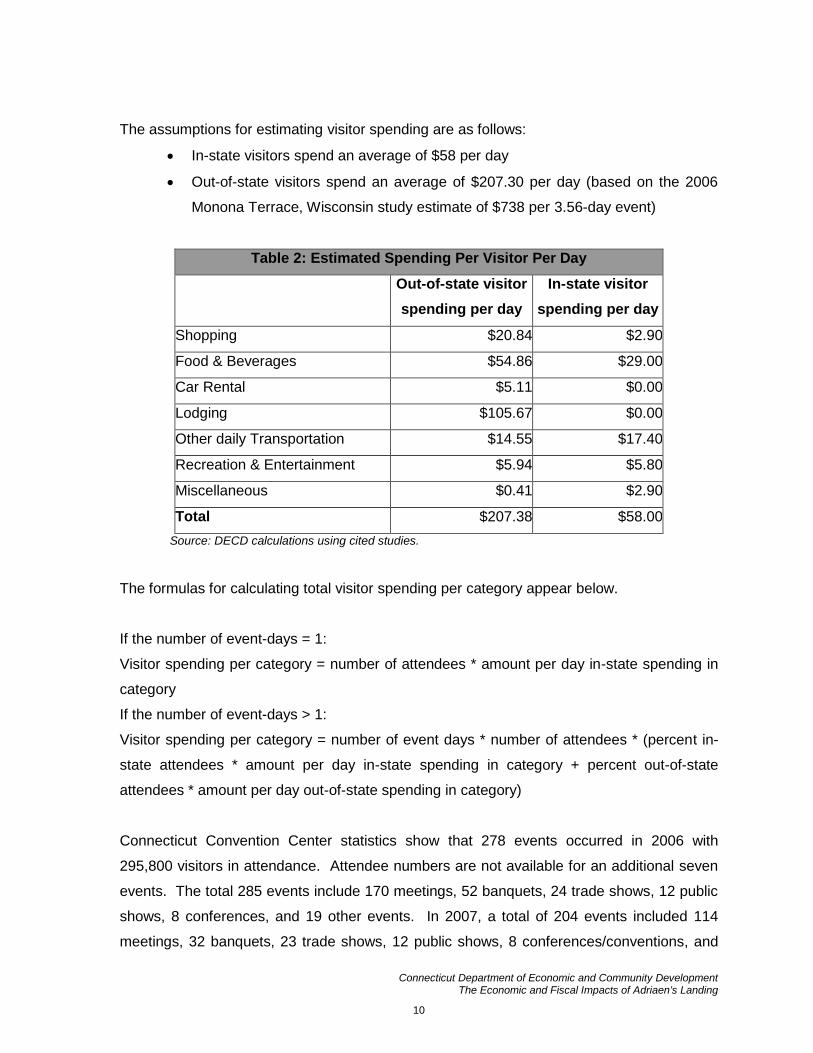
The assumptions for estimating visitor spending are as follows:
In-state visitors spend an average of $58 per day
Out-of-state visitors spend an average of $207.30 per day (based on the 2006
Monona Terrace, Wisconsin study estimate of $738 per 3.56-day event)
Table 2: Estimated Spending Per Visitor Per Day
Out-of-state visitor
spending per day
In-state visitor
spending per day
Shopping $20.84 $2.90
Food & Beverages $54.86 $29.00
Car Rental $5.11 $0.00
Lodging $105.67 $0.00
Other daily Transportation $14.55 $17.40
Recreation & Entertainment $5.94 $5.80
Miscellaneous $0.41 $2.90
Total $207.38 $58.00
Source: DECD calculations using cited studies.
The formulas for calculating total visitor spending per category appear below.
If the number of event-days = 1:
Visitor spending per category = number of attendees * amount per day in-state spending in
category
If the number of event-days > 1:
Visitor spending per category = number of event days * number of attendees * (percent in-
state attendees * amount per day in-state spending in category + percent out-of-state
attendees * amount per day out-of-state spending in category)
Connecticut Convention Center statistics show that 278 events occurred in 2006 with
295,800 visitors in attendance. Attendee numbers are not available for an additional seven
events. The total 285 events include 170 meetings, 52 banquets, 24 trade shows, 12 public
shows, 8 conferences, and 19 other events. In 2007, a total of 204 events included 114
meetings, 32 banquets, 23 trade shows, 12 public shows, 8 conferences/conventions, and
Connecticut Department of Economic and Community DevelopmentThe Economic and Fiscal Impacts of Adriaen’s Landing
11
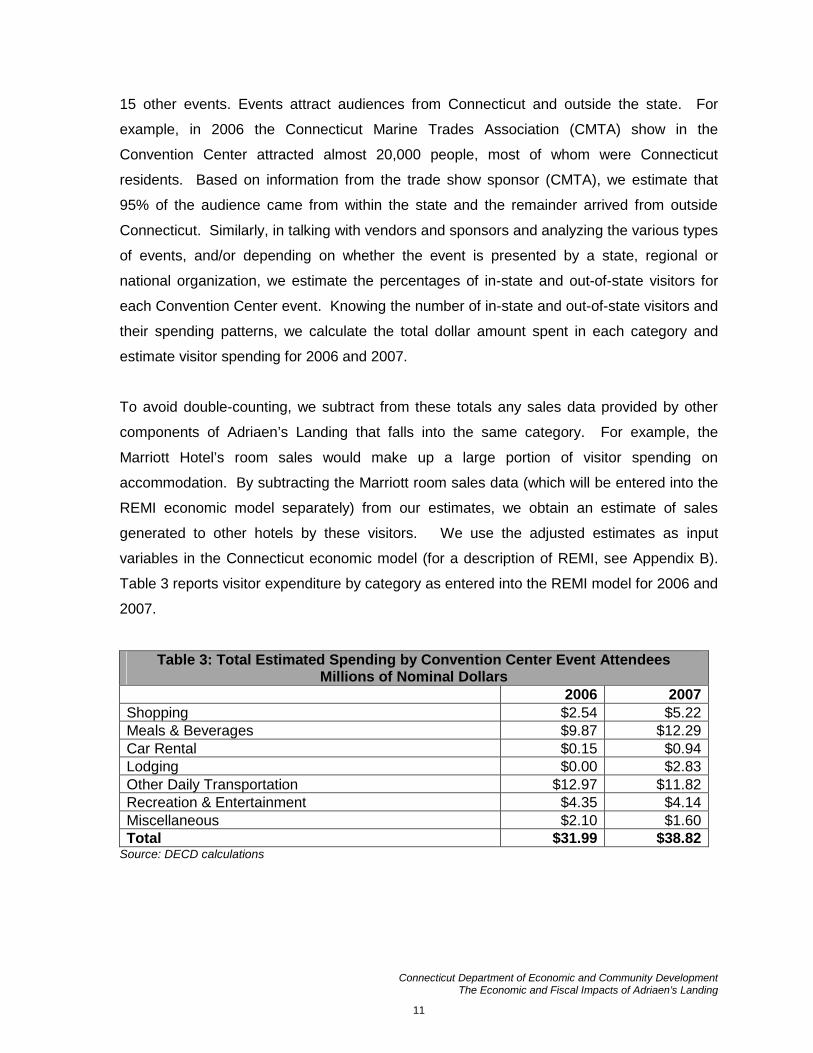
15 other events. Events attract audiences from Connecticut and outside the state. For
example, in 2006 the Connecticut Marine Trades Association (CMTA) show in the
Convention Center attracted almost 20,000 people, most of whom were Connecticut
residents. Based on information from the trade show sponsor (CMTA), we estimate that
95% of the audience came from within the state and the remainder arrived from outside
Connecticut. Similarly, in talking with vendors and sponsors and analyzing the various types
of events, and/or depending on whether the event is presented by a state, regional or
national organization, we estimate the percentages of in-state and out-of-state visitors for
each Convention Center event. Knowing the number of in-state and out-of-state visitors and
their spending patterns, we calculate the total dollar amount spent in each category and
estimate visitor spending for 2006 and 2007.
To avoid double-counting, we subtract from these totals any sales data provided by other
components of Adriaen’s Landing that falls into the same category. For example, the
Marriott Hotel’s room sales would make up a large portion of visitor spending on
accommodation. By subtracting the Marriott room sales data (which will be entered into the
REMI economic model separately) from our estimates, we obtain an estimate of sales
generated to other hotels by these visitors. We use the adjusted estimates as input
variables in the Connecticut economic model (for a description of REMI, see Appendix B).
Table 3 reports visitor expenditure by category as entered into the REMI model for 2006 and
2007.
Table 3: Total Estimated Spending by Convention Center Event AttendeesMillions of Nominal Dollars
2006 2007Shopping $2.54 $5.22Meals & Beverages $9.87 $12.29Car Rental $0.15 $0.94Lodging $0.00 $2.83Other Daily Transportation $12.97 $11.82Recreation & Entertainment $4.35 $4.14Miscellaneous $2.10 $1.60Total $31.99 $38.82
Source: DECD calculations

Connecticut Department of Economic and Community DevelopmentThe Economic and Fiscal Impacts of Adriaen’s Landing
12
We estimated future visitor spending sales in each category based on the same rates of
increase as Convention Center revenues; 4% a year from 2008 to 2012, and 4.5% a year
from 2013 onwards.
The Marriott Hotel
Construction on the Marriott Hotel began in 2002 and it began operations in the summer of
2005. Its total construction cost was approximately $82.4 million. An expansion is planned
for 2011-2012, and is expected to cost another $92 million. The hotel has spent $11.2
million on furniture, fixtures and equipment (FF&E) by 2007, and will continue to make these
expenditures into the future in keeping with industry standards. The hotel estimates that
real FF&E expenditures will stabilize beginning in 2014, after the expansion is completed
(i.e., expenditures in this category will increase at 3% a year after 2014, at the assumed rate
of inflation).
Data provided by CCEDA shows that the Marriott Hotel’s total sales in 2007 were
approximately $25.6 million. Of this total, $8.9 million was restaurant sales, and another
$141,000 was spa and gift shop sales. Room sales amounted to almost $16.6 million. The
Marriott expects its sales to stabilize in 2010 and then increase at a rate of 3% until 2013,
when it forecasts an increase in room sales of almost 70%, to coincide with the opening of
its expansion and the completion of the Front Street developments. The hotel expects sales
in all its categories to increase at a steady rate of 3% beyond 2013, and we make the same
assumption through the end of the study period.
Parking Revenues
Parking garages are another essential component of the Adriaen’s Landing redevelopment
project. The provision of parking facilities with easy access is critical for attracting visitors to
any venue. The Westside Parking Garage, also known as Garage B, is one of the currently
completed parking components of Adriaen’s Landing, and the Convention Center and
Marriott Hotel have an adjacent parking garage. Construction on the Westside Garage
began and related site infrastructure began in 2003 and cost $32.6 million. Currently there
are approximately 600 parking spaces available in these facilities (2,300 at the Convention
Connecticut Department of Economic and Community DevelopmentThe Economic and Fiscal Impacts of Adriaen’s Landing
13
Center/Marriott and 600 at the Westside Garage). LAZ Parking operates the Adriaen’s
Landing parking facilities.
Revenue data from LAZ Parking shows that in 2007, the existing parking facilities’ sales
totaled $5 million. This includes revenue from contract parkers, who are mostly employees
of area businesses, and transient parkers, who are visitors to the region. LAZ Parking
estimates that the total revenue from these facilities will reach $9.8 million by 2013. This
does not include the parking space that will become available with the completion of the
Science Center and the two parking garages planned for Front Street. DECD therefore
revised the future estimates by accounting for these additional spaces. We adjusted LAZ
Parking’s projected future sales upward with the percentage increase in parking spaces that
become available with the opening of each parking facility. Accordingly, we increase LAZ
Parking’s revenue projection for 2009 by 16% (460 new parking spaces added to the
existing 2,900 with the opening of the Science Center garage), estimate revenue for 2010
using LAZ’s projected increase, then increase that estimate by 9% (300 new parking spaces
added to the existing 3,360 with the opening of a Front Street parking garage under Phase 1
in 2010). We project the following years’ revenues using the same percentage increase as
LAZ Parking, then increase the projection for 2013 by a further 6% (another 225 spaces
added to the existing 3,660 with the opening of the Phase 2 parking garage in Front Street).
We assume parking revenues increase by 4.5% a year beyond 2013, the same rate as the
assumed increase in Convention Center sales.
Connecticut Science Center
Hartford visionaries, developers, politicians and the public conceived the Connecticut
Science Center as an educational destination for students and families and that would offer
regional appeal to tourists and convention attendees. It will be a 144,000 square foot
building, which will contain 40,000 square feet of exhibits, a 200-seat theater, four
classrooms/labs, a function room, and a parking facility with 460 parking spaces. The
Science Center parking garage will provide parking for Riverfront events and alleviate the
current parking shortage in the area.
Connecticut Department of Economic and Community DevelopmentThe Economic and Fiscal Impacts of Adriaen’s Landing
14
Construction of the Science Center began in January 2006 and stakeholders expect it to
open in spring 2009. Construction costs will amount to $166.6 million, and project
development costs (costs incurred to plan and manage development of the Center during
the construction phase) amount to another $12.5 million. Furniture, equipment, and fixtures
(FF&E) and exhibit costs expenditures are expected to total $20.6 million by the end of
2009. FF&E and exhibit costs are an ongoing expense for the Science Center as older
exhibits are replaced with newer ones, and current projections expect these costs to
stabilize at approximately $760,000 per year by 2013, and increase by 3% a year
afterwards. We assume this projection holds through the end of the study period.
The Science Center’s sales revenues include admission and program revenue, membership
revenues, café and gift shop sales, and rental revenues. It expects a total of $4.2 million in
sales revenue in 2009 after its opening, and expects sales to stabilize at $5.9 million in
2013. Sales in each category are projected to increase at 3% a years beyond 2013, and
we assume this projection holds through the end of our study period. DECD assumes
Science Center admissions are net new to the region as there are few if any substitutes
from which attendance will be diverted.
Front Street
Front Street is a residential and retail/restaurant/entertainment district that is currently under
development across from the Convention Center. The completion of Front Street is
expected to benefit the area in a variety of ways. First, the introduction of retail,
entertainment and restaurants to an area of Hartford that is lacking such options attracts
customers to the area. Many of these visitors would be Connecticut residents who
previously would not have considered patronizing the area due to the lack of suitable
venues. Second, these developments will make the Convention Center and Marriott Hotel
more attractive as locations for hosting events, and will make them more competitive with
other similar venues across the country. Convention Center event attendees and Marriott
Hotel event attendees will find local retail, entertainment and restaurant establishments
attractive and stay longer and spend more money locally than before these developments
existed. Third, the residential component of Front Street (305 rental units) will attract new
Connecticut Department of Economic and Community DevelopmentThe Economic and Fiscal Impacts of Adriaen’s Landing
15
residents to the city, and these new residents will spend a portion of their incomes in the
retail, restaurant and entertainment venues in the area.
The construction of Front Street will broadly span two phases. Under Phase 1, there will be
two blocks (A and B) consisting of 70,000 square feet of restaurant/retail/entertainment
space (70% for restaurant/entertainment, 25% for retail) and a new 300-space parking
garage (Garage A); refer to Figure 1. Developers expect construction to take 2 years,
commencing in 2008. Construction of the retail/restaurant/entertainment section is expected
to cost $22.3 million, and the parking garage, $12 million. A planned extension of this
phase, named Phase 1a, is an additional 12,000 square foot retail section that developers
expect to complete in 2010, at a cost of $5.7 million. The state will construct public
improvements in the Front Street area and a pedestrian bridge across Grove Street during
this time period. The total cost of these infrastructure improvements is expected to be $10
million.
Under Phase 2, developers plan an additional two blocks (named C and D) of approximately
305 residential units and 136,000 square feet of restaurant/retail/entertainment space. As in
Phase 1, 70% of the latter is expected to be for restaurant/entertainment space, and 25% for
retail. Block C will have a two-floor parking facility with approximately 225 spaces. Phase 2
also includes the redevelopment of the Hartford Times Building, which developers will
convert to 20,000 square feet of retail space and 40,000 square feet of office space.
Developers expect construction to begin in 2011 and take two years to complete.
Construction of the residential units is projected to cost $199 million. The
restaurant/retail/entertainment space (including the Hartford Times building’s retail portion)
is expected to cost $79.6 million, the office space $16.3 million, and the parking garage,
$12.2 million.

Connecticut Department of Economic and Community DevelopmentThe Economic and Fiscal Impacts of Adriaen’s Landing
16
Figure 1: Front Street Layout

Connecticut Department of Economic and Community DevelopmentThe Economic and Fiscal Impacts of Adriaen’s Landing
17
We further approximate FF&E costs for each phase using $83 per square foot estimate for
retail space, a $150 per square foot estimate for restaurant space, and a $75 per square
foot estimate for office space (all in current dollars). H.B. Nitkin Inc. provided FF&E cost
estimates and these were based on other recent developments the company has
completed. When a range was available, we used the midpoint as our FF&E cost. We
assume the FF&E expenditures for residential and parking are included in the construction
estimates (the developer will furnish residential units with basic appliances). Front Street
construction data appears in Table 7.
Table 7: Front Street Construction Cost Estimates(Nominal Dollars)
Description of DevelopmentArea in GrossSquare Feet
ConstructionCosts
FF&EEstimates
40%Entered
into REMI
Phase 1 (2009-2010)
Entertainment/Restaurant/Retail 70,000 $22,333,790 $9,327,500 $3,731,000
Parking Garage 300 spaces $12,000,000
Pedestrian Overpass $6,900,000
Infrastructure Improvements $3,150,000
Phase 1A (2011)
Entertainment/Restaurant/Retail 12,000 $5,668,704 $996,000 $398,400
Phase 2 (2012-2013)
Entertainment/Restaurant/Retail 156,000 $79,588,604 $19,782,000 $7,912,800
Residential 380,500 $198,783,762
Office 40,000 $16,325,867 $3,000,000 $1,200,000
Parking Garage 225 Spaces $12,244,400Source: CCEDA and DECD calculations
DECD enters the construction estimates for retail/restaurant/entertainment spaces, office
space, and parking facilities into the REMI model as translator variables for “commercial and
institutional buildings” (Appendix B presents an overview of the REMI model). The translator
variable DECD uses for residential construction is “new multifamily residential unit
construction” that provides more specific sector demand. The public improvements on and
Connecticut Department of Economic and Community DevelopmentThe Economic and Fiscal Impacts of Adriaen’s Landing
18
around Front Street and the pedestrian footbridge construction were entered into REMI
using the “highway, street, bridge and tunnel construction” translator variable. As before, we
assume FF&E purchases are wholesale sector purchases made in Connecticut; 40% of
FF&E purchases are therefore made in and benefit the state. We divide construction costs
equally among the number of years over which construction takes place, and we assume
FF&E purchases occur in the final year of construction.
Once the Front Street structures are built, they generate sales, jobs and tax revenue.
DECD categorizes sales arising from the Front Street developments as follows: net new
sales from the retail/entertainment establishments, net new sales from restaurants, rental
revenues from the residential units, net new household consumption from the new
residential tenants, new employment in the office space, and parking revenues from the
parking facilities.
According to the Front Street developer, restaurants will occupy 75% of the
restaurant/retail/entertainment space, and retail/entertainment will occupy the remaining
25%. We estimate sales from each of these venues using sales per square foot estimates
from the Urban and Land Institute [ULI] (Dollars and Cents of Shopping Centers, 2004). We
used the sales per square foot estimates for a “community shopping center” as the total
square feet of the Front Street retail developments fall within the range specified for such
establishments in the ULI report. Because the ULI data is from 2004, we calculated the
sales per square foot for the years following 2004 based on an inflation rate of 3%.1 For the
retail establishments, we calculate the sales per square foot by taking the average of
“clothing and accessories” stores and “other retail” stores from the ULI report, which amount
to $261 per square foot in 2011 which is the first full year of Phase 1 retail operations (we
include entertainment in the retail space). The same estimate for “food services”, which we
use for restaurant sales, is $345 per square foot in 2011. We calculate total sales per year
by multiplying this number by the total square foot area of each commercial establishment
category. We assume sales do not reach their potential per square foot estimate in the first
year, and we ramp up sales over three years. Therefore, in the first year of Front Street
operations, the retail establishments and restaurants achieve 50% of their maximum
possible sales (according to the sales per square foot estimate), in the second year they
1 This represents no ‘real’ increase in sales, that is, the number of items sold; only the items’ prices increase.
Connecticut Department of Economic and Community DevelopmentThe Economic and Fiscal Impacts of Adriaen’s Landing
19
achieve 75%, and reach 100% in the third year. DECD assumes sales volume increases by
4% a year after the third year.2 Phases 1a and 2 follow the same assumed sales trend.
DECD assumes that 90% of the restaurant/retail/entertainment sales are net new to the
region (that is, only 10% of retail and restaurant sales elsewhere in Hartford County is lost
due to Front Street). The reason we use a high net new sales figure is the nature of the
Front Street development itself. It is not located in an area with a high concentration of
restaurants or retail businesses. Instead, it is close to museums and the Convention Center
the Marriott Hotel, and the Science Center. Therefore, we assume most of the sales will be
to visitors from outside the region to events at these venues. Without Front Street,
Convention Center, Science Center and other event visitors are likely to leave the area after
their event and not shop or eat locally. Because we expect visitor traffic to generate most of
the restaurant/retail/entertainment business to Front Street, we think a high net new retail
sales figure is reasonable.
There are 305 residential units planned for Front Street. According to the developer, these
units will be for rent. The developer provided a rental rate of $2.25 per square foot per
month when the first units become available (in fiscal year 2011) with an increase in rent of
3% each year thereafter (a standard inflation estimate). We compare this rate with currently
available rates for similar housing in the Hartford area. The Connecticut Housing Finance
Authority (CHFA) provided us with tenant profile data from the Trumbull on the Park
apartment complex in Hartford, and this data shows an average rental rate of $1.95 per
square foot in 2007. This compares favorably with the rate provided by the developer (a
rate of $1.95 per square foot in 2007 will amount to a rate of $2.20 per square foot in 2011
with a 3% inflation rate). We assume occupancy ramps up over 5 years in 20% increments,
as the area becomes more vibrant with new business activity and economic and cultural
development. We assume as well that 30% of the rental revenue is net new to the region to
begin with, as most relocation may happen within the county. We also assume that the net
new revenue increases by 10% increments as other vacated residential units in the county
fill up. This will happen as people from outside the region, especially those who need to
come to Hartford County on a regular basis, such as for employment, will begin to consider
the area suitable for living, especially as the Front Street developments make the area more
attractive. In addition, the homes of those new Front Street residents who do relocate from
2 This represents growth in the number of items sold, not their prices.
Connecticut Department of Economic and Community DevelopmentThe Economic and Fiscal Impacts of Adriaen’s Landing
20
within Hartford County may sell to new residents moving into the County.3 DECD enters
rental revenue into REMI as real estate sales category (NAICS code 531) that includes
income from property rental and management.
New residents make purchases in the region to which they have moved. We assume that
average household income in the new residential rental units is $80,000 in 2007 dollars.
This is the same as the median gross income of Trumbull in the Park tenants, according to
the 2007 tenant profile data provided by CHFA. We assume 74% of household income is
spent on purchasing goods and services (consumer spending). We assume that 30% of this
spending is net new to the region (because some residents relocated within Hartford County
and displaced spending elsewhere in the County). We allocate the total spending into the
categories listed in REMI using the household consumption category shares for this income
group as listed in the Bureau of Labor Statistics’ Consumer Expenditure Survey4 contained
in the REMI regional control forecast (the baseline or status quo forecast). Household
consumption spending increases over the years follow the occupancy pattern, and increase
3% per year (that is, spending is constant in real terms assuming an inflation rate of 3%)
after full occupancy in each residential block obtains.
We assume workers in the new office space are net new to the region; that is, we assume
the employer(s) relocate to Hartford from outside the region (Hartford County), or if they
already have office space in Hartford, bring in new workers (that is, expand their operations)
instead of moving employees already in the city. Assuming one office worker per 250
square feet, we arrive at an estimate of 160 workers in 2014, when the three floors of office
space in the Hartford Times building are occupied. We hold the number of workers constant
for future years. DECD assumes employment to be in the professional and technical
services sector (NAICS sector 541) in the Front Street office spaces.
As we explicitly construct the physical plant using data from the Science Center and Front
Street developers with REMI inputs, we nullify investment spending in the REMI model in
the amount of the sales at the Convention Center, Marriott Hotel, parking garages,
Connecticut Science Center, sales at the Front Street restaurant/entertainment/retail
establishments, Front Street residential rental revenues, and in the amount of the estimated
3 This is a trend in which empty nesters and newly-retired persons downsize and relocate to cities to be close to cultural and other urban amenities.
4 http://stats.bls.gov/cex/2006/share/higherincome.pdf
Connecticut Department of Economic and Community DevelopmentThe Economic and Fiscal Impacts of Adriaen’s Landing
21
office employment. If we did not suppress the concomitant investment spending for the
capital required to support the sales and/or labor employed, the REMI model would
automatically create the capital to support these activities and we would double count. We
do not nullify new investment generated by new consumer spending and wholesale trade
increases due to FF&E purchases as these activities may create new and/or expanded
businesses in the region and in the state (as restaurants, shops, and personal service
establishments expand as the population and visitors increase). We increase the
residential and non-residential capital stock in Hartford County by the amount of the
construction and fit-out expenses in the appropriate year to account for the new buildings,
equipment and public improvements that did not exist there prior to the developments.
State Assistance for Adriaen’s Landing
The state has already provided and is planning to provide assistance to all components of
Adriaen’s Landing in the form of grants. The state assistance is summarized in Table 8
below. To date, the state has invested $568.31 million in these projects of which $315.8
million was bonded between 1999 and 2008. The remainder, $252.51 million, emanated
from state appropriations or CCEDA revenue bonds. Projected state investment for Front
Street (in 2009 and 2011) totals $35.59 million of which $35.09 million will be bonded ($0.5
million for the pedestrian overpass will emanate from state appropriation or CCEDA revenue
bonds). Total funding for Adriaen’s Landing includes state, federal and private inputs.
Federal funding includes $10 million invested to date and $16.7 million expected for Front
Street; private funding includes $236 million invested to date and another $305.1 million
expected for Front Street. The total investment from 2000 through 2012 is expected to be
$1,172 million.

Connecticut Department of Economic and Community DevelopmentThe Economic and Fiscal Impacts of Adriaen’s Landing
22
Table 8: State Assistance for Adriaen's Landing(Millions of Nominal Dollars)
Total StateAssistance
Amount forwhich debtservice is
paid by thestate
Amount and Year ofBond Sale/Receipt of
Grant
Amount Year
Convention Center $426.14 $190.00 $3.00 1999
$33.00 2000
$154.00 2001
Marriott Hotel $3.00 $3.00 $3.00 2001
Science Center $139.17 $122.80 $15.00 2000
$92.30 2003
$15.50 2008
Parking Facilities - - - -
Front Street:
Entertainment/Rest/Retail $6.00 $6.00 $6.00 2009
Parking Garages $15.34 $15.34 $3.10 2009
$12.24 2011
Pedestrian Overpass $0.50 - - -
Public Infrastructure $1.75 $1.75 $1.75 2009
Residential $12.00 $12.00 $12.00 2011
Office - - - -Source: CCEDA
We assume that the grants are given by the state in the same year as the bond issue. We
assume the bonds carry 5.3% interest, for which the state pays debt service over 20 years,
and the payments commence the same year as the grant. DECD assumes state
government spending decreases each year by the amount of the debt service payment
(amortized over 20 years).
Connecticut Department of Economic and Community DevelopmentThe Economic and Fiscal Impacts of Adriaen’s Landing
23
RESULTS
Our results presented below show how Adriaen’s Landing benefits the City of Hartford,
Hartford County, and the state as a whole. The operations of the Adriaen’s Landing facilities
create jobs in the state, and increased jobs lead to increased economic activity. The actual
increase in jobs exceeds the direct employment created by the facilities themselves, as their
sales and purchases create additional demand for goods and services. This is the indirect
and induced economic impact of these developments (the multiplier effect). The state’s
population increases, as more people are attracted to the County and the state due to the
increased economic activity. The increase in employment drives up personal income in the
state. State and local revenues increase as more people pay taxes, and the increase in
economic activity drives up business earnings, which in turn leads to higher tax revenues
from the corporate sector. State expenditures rise as the increase in population drives up
the demand for public services such as public education, public safety, public health and
public works.
Economic Impact
Table 9 presents REMI results for the total economic impact (direct, indirect and induced) of
Adriaen’s Landing. Table 9 shows the average annual increase in key economic variables
over the study period. The numbers in Table 9 represent the average annual increase in
each of the variables above the REMI control forecast, which represents the status quo. For
example, for the study period (1999-2030), total employment in Hartford County in a given
year will be 1,680 jobs higher than the baseline forecast on average, that is, with the
developments than without them.
Table 9: Average Annual Impact Adriaen’s Landing
1999-2030
Hartford County State of Connecticut
Total Employment 1,680 1,852
Total GRP (Millions 2006 $) $145.88 $164.41
Personal Income (Millions 2006 $) $77.80 $109.96
Population 1,306 1,708
Source: DECD calculations using REMI output

Connecticut Department of Economic and Community DevelopmentThe Economic and Fiscal Impacts of Adriaen’s Landing
24
Total jobs in the state will be 1,852 higher than the baseline forecast on average each year,
that is, with the developments than without them. Gross State Product (GSP) in 2006
dollars or real terms (that is, adjusted for inflation) will be $145.9 million higher in Hartford
County and $164 million higher in the state than the baseline forecast on average, that is,
with the developments than without them. The average annual increase in personal income
in 2006 dollars for Hartford County residents will be $77.8 million, and $110 million for the
state as a whole (personal income is the broadest measure of income and represents
income form all sources). Population increases in Hartford County by an annual average of
1,306 persons, and in the state, by an average 1,708 persons.
Chart 1: Changes in Employment and Population in Hartford County
-0.5
0
0.5
1
1.5
2
2.5
3
1999
2002
2005
2008
2011
2014
2017
2020
2023
2026
2029
Th
ou
san
ds
Hartford County Employment Hartford County Population
Source: DECD calculations using REMI output
The decline in employment in 2001 and 2005 relative to the baseline reflects the change in
construction jobs as the Convention Center, Marriot Hotel, and Westside Garage are built
and completed. The decline in employment in 2009 and 2010 relative to the baseline
reflects the reduction in construction jobs after the completion of the Science Center and
Phase 1 of Front Street, and the following increase represents the pickup in construction
jobs with the commencement of Front Street Phase 2 construction. Jobs as a whole stay
steady then settle at a higher level with the full operation of Front Street. The increase in
Connecticut Department of Economic and Community DevelopmentThe Economic and Fiscal Impacts of Adriaen’s Landing
25
population is a result of people moving into the county with the increase in jobs and the
improved attractiveness of the area.
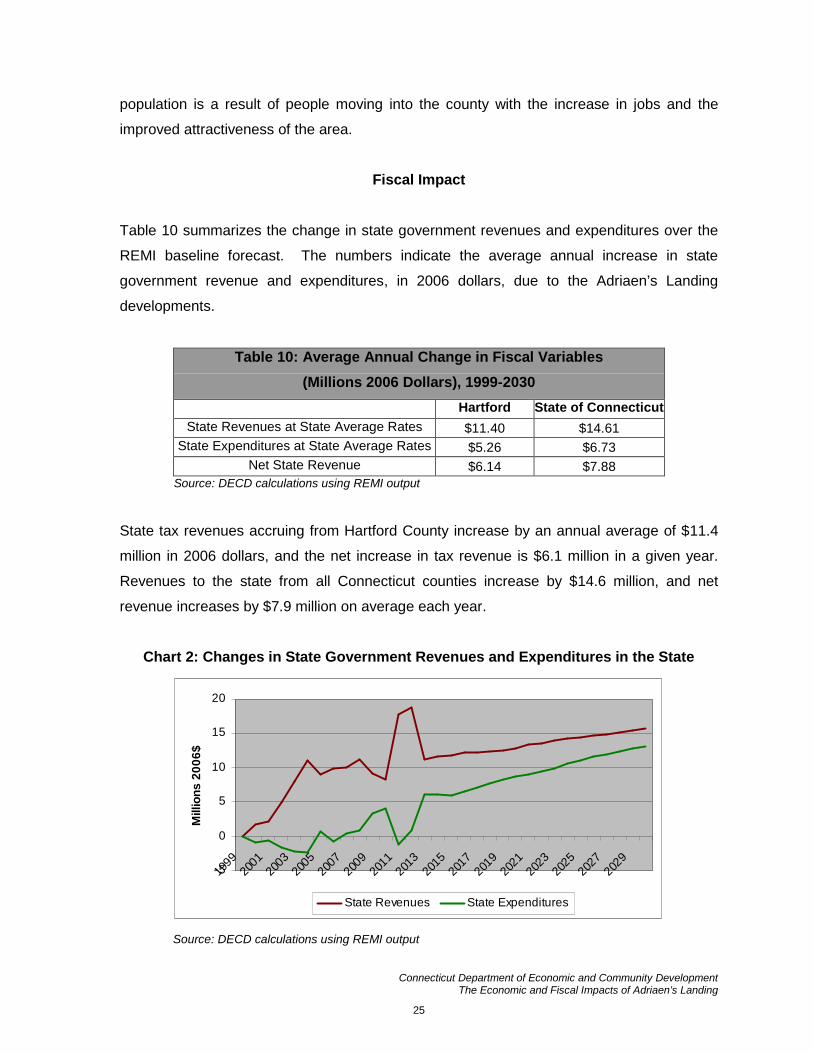
Fiscal Impact
Table 10 summarizes the change in state government revenues and expenditures over the
REMI baseline forecast. The numbers indicate the average annual increase in state
government revenue and expenditures, in 2006 dollars, due to the Adriaen’s Landing
developments.
Table 10: Average Annual Change in Fiscal Variables
(Millions 2006 Dollars), 1999-2030
Hartford State of Connecticut
State Revenues at State Average Rates $11.40 $14.61
State Expenditures at State Average Rates $5.26 $6.73
Net State Revenue $6.14 $7.88Source: DECD calculations using REMI output
State tax revenues accruing from Hartford County increase by an annual average of $11.4
million in 2006 dollars, and the net increase in tax revenue is $6.1 million in a given year.
Revenues to the state from all Connecticut counties increase by $14.6 million, and net
revenue increases by $7.9 million on average each year.
Chart 2: Changes in State Government Revenues and Expenditures in the State
-5
0
5
10
15
20
1999
2001
2003
2005
2007
2009
2011
2013
2015
2017
2019
2021
2023
2025
2027
2029
Mill
ion
s2
00
6$
State Revenues State Expenditures
Source: DECD calculations using REMI output
Connecticut Department of Economic and Community DevelopmentThe Economic and Fiscal Impacts of Adriaen’s Landing
26
Chart 2 shows that tax revenue to the state increases with construction then declines once
construction is complete. As new residents settle in Hartford County, employment and retail
sales increase, and tax revenue to the state picks up again. Expenditures initially are lower
than the baseline. This is during construction phases, and reflects the decline in
government payments for social programs as construction and related workers are
employed (some workers work more hours, some workers come off unemployment and
some retirees come out of retirement for the project’s construction period). State
expenditures rise steadily once construction is completed. The increase in population in the
state drives the rise in expenditure as the demand for public services increases. As the
county and the state attract more people, government expenditure on education,
transportation and other government services increase to meet the needs of the larger
population. Net government revenues, however, remain positive throughout the period of
the study reflecting the overall positive contribution of Adriaen’s Landing to the region’s
(Hartford County) and the state’s economy.
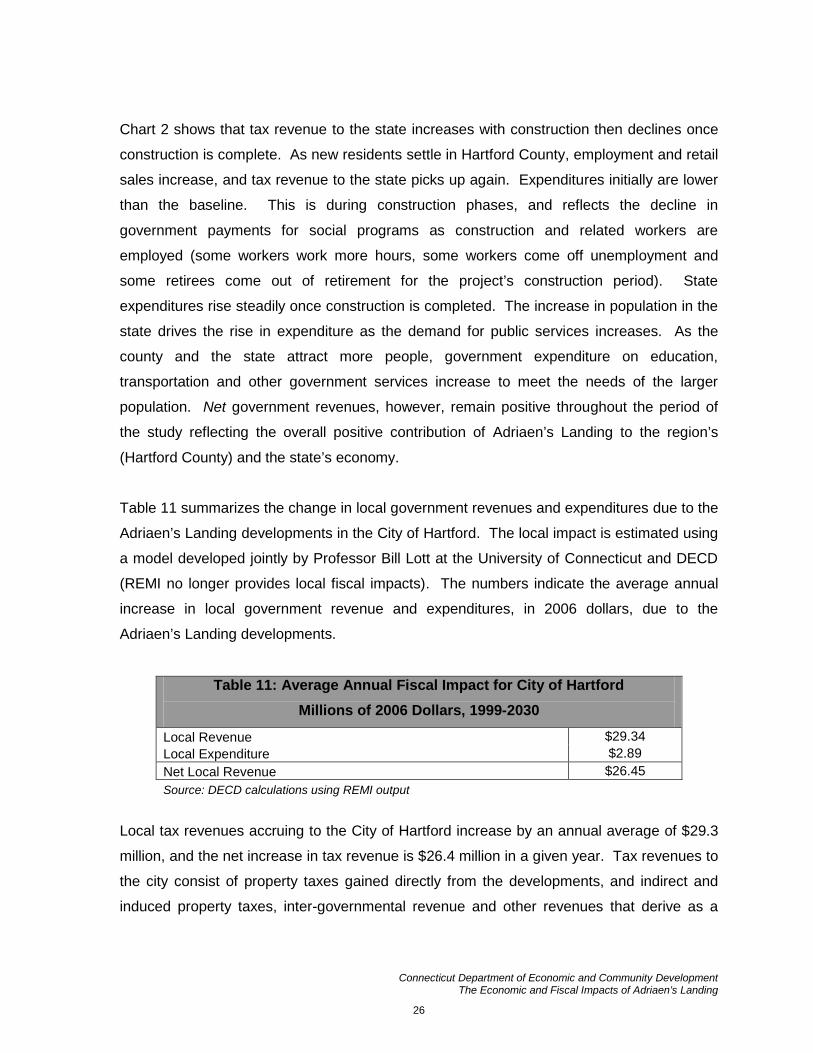
Table 11 summarizes the change in local government revenues and expenditures due to the
Adriaen’s Landing developments in the City of Hartford. The local impact is estimated using
a model developed jointly by Professor Bill Lott at the University of Connecticut and DECD
(REMI no longer provides local fiscal impacts). The numbers indicate the average annual
increase in local government revenue and expenditures, in 2006 dollars, due to the
Adriaen’s Landing developments.
Table 11: Average Annual Fiscal Impact for City of Hartford
Millions of 2006 Dollars, 1999-2030
Local Revenue $29.34
Local Expenditure $2.89
Net Local Revenue $26.45
Source: DECD calculations using REMI output
Local tax revenues accruing to the City of Hartford increase by an annual average of $29.3
million, and the net increase in tax revenue is $26.4 million in a given year. Tax revenues to
the city consist of property taxes gained directly from the developments, and indirect and
induced property taxes, inter-governmental revenue and other revenues that derive as a
Connecticut Department of Economic and Community DevelopmentThe Economic and Fiscal Impacts of Adriaen’s Landing
27
result of the increased population in the city. The increase in expenditures occurs as the
city spends more on services to accommodate the increased population.
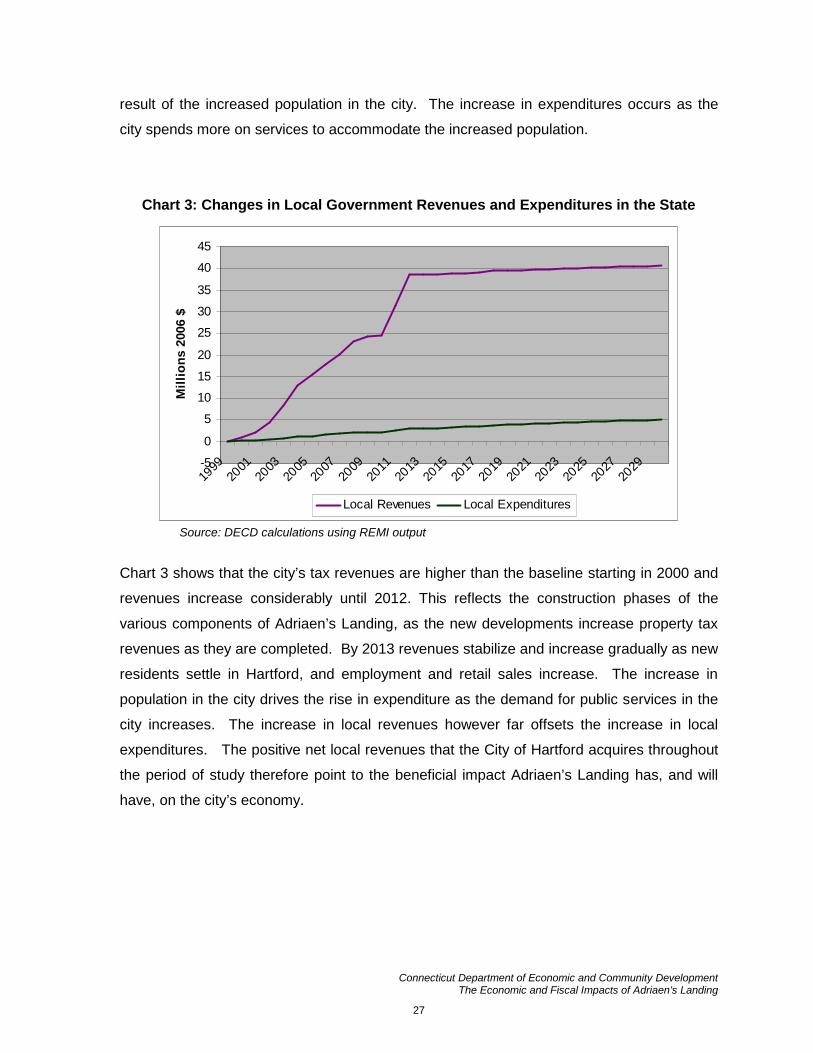
Chart 3: Changes in Local Government Revenues and Expenditures in the State
-5
0
5
10
15
20
25
30
35
40
45
1999
2001
2003
2005
2007
2009
2011
2013
2015
2017
2019
2021
2023
2025
2027
2029
Mil
lio
ns
2006
$
Local Revenues Local Expenditures
Source: DECD calculations using REMI output
Chart 3 shows that the city’s tax revenues are higher than the baseline starting in 2000 and
revenues increase considerably until 2012. This reflects the construction phases of the
various components of Adriaen’s Landing, as the new developments increase property tax
revenues as they are completed. By 2013 revenues stabilize and increase gradually as new
residents settle in Hartford, and employment and retail sales increase. The increase in
population in the city drives the rise in expenditure as the demand for public services in the
city increases. The increase in local revenues however far offsets the increase in local
expenditures. The positive net local revenues that the City of Hartford acquires throughout
the period of study therefore point to the beneficial impact Adriaen’s Landing has, and will
have, on the city’s economy.
Connecticut Department of Economic and Community DevelopmentThe Economic and Fiscal Impacts of Adriaen’s Landing
28
APPENDIX B: THE REMI MODEL
The Connecticut REMI model is a dynamic, multi-sector, regional model developed and
maintained for the Connecticut Center for Economic Analysis by Regional Economic
Models, Inc. of Amherst, Massachusetts. This model provides detail on all eight counties in
the State of Connecticut and any combination of these counties. The REMI model includes
all of the major inter-industry linkages among 466 private industries, aggregated into 67
major industrial sectors. With the addition of farming and three public sectors (state and
local government, civilian federal government, and military), there are 70 sectors
represented in the model for the eight counties.
The REMI model is based on a national input-output (I/O) model that the U.S. Department of
Commerce (DoC) developed and continues to maintain. Modern input-output models are
largely the result of groundbreaking research by Nobel laureate Wassily Leontief. Such
models focus on the inter-relationships between industries and provide information about
how changes in specific variables—whether economic variable such as employment or
prices in a certain industry or other variables like population affect factor markets,
intermediate goods production, and final goods production and consumption.
The REMI Connecticut model takes the U.S. I/O “table” results and scales them according to
traditional regional relationships and current conditions, allowing the relationships to adapt
at reasonable rates to changing conditions. Listed below are some salient structural
characteristics of the REMI model:
REMI determines consumption on an industry-by-industry basis, and models real
disposable income in Keynesian fashion, that is, with prices fixed in the short run and
GDP (Gross Domestic Product) determined solely by aggregate demand.
The demand for labor, capital, fuel, and intermediate inputs per unit of output
depends on relative prices of inputs. Changes in relative prices cause producers to
substitute cheaper inputs for relatively more expensive inputs.
Connecticut Department of Economic and Community DevelopmentThe Economic and Fiscal Impacts of Adriaen’s Landing
29
Supply of and demand for labor in a sector determine the wage level, and these
characteristics are factored by regional differences. The supply of labor depends on
the size of the population and the size of the workforce.
Migration—that affects population size—depends on real after-tax wages as well as
employment opportunities and amenity value in a region relative to other areas.
Wages and other measures of prices and productivity determine the cost of doing
business. Changes in the cost of doing business will affect profits and/or prices in a
given industry. When the change in the cost of doing business is specific to a region,
the share of the local and U.S. market supplied by local firms is also affected.
Market shares and demand determine local output.
“Imports” and “exports” between states are related to relative prices and relative
production costs.
Property income depends only on population and its distribution adjusted for
traditional regional differences, not on market conditions or building rates relative to
business activity.
Estimates of transfer payments depend on unemployment details of the previous
period, and total government expenditures are proportional to population size.
Federal military and civilian employment is exogenous and maintained at a fixed
share of the corresponding total U.S. values, unless specifically altered in the
analysis.
Because the each variable in the REMI model is related, a change in one variable
affects many others. For example, if wages in a certain sector rise, the relative
prices of inputs change and may cause the producer to substitute capital for labor.
This changes demand for inputs, which affects employment, wages, and other
variables in those industries. Changes in employment and wages affect migration
and the population level that in turn affect other employment variables. Such chain-
reactions continue in time across all sectors in the model. Depending on the
analysis performed, the nature of the chain of events cascading through the model
economy can be as informative for the policymaker as the final aggregate results.
Because REMI generates extensive sectoral detail, it is possible for experienced
economists in this field to discern the dominant causal linkages involved in the
results.

Connecticut Department of Economic and Community DevelopmentThe Economic and Fiscal Impacts of Adriaen’s Landing
30
The REMI model is a structural model, meaning that it clearly includes cause-and-effect
relationships. The model shares two key underlying assumptions with mainstream
economic theory: households maximize utility and producers maximize profits. In the model,
businesses produce goods to sell to other firms, consumers, investors, governments and
purchasers outside the region. The output is produced using labor, capital, fuel and
intermediate inputs. The demand for labor, capital and fuel per unit output depends on their
relative costs, because an increase in the price of one of these inputs leads to substitution
away from that input to other inputs. The supply of labor in the model depends on the
number of people in the population and the proportion of those people who participate in the
labor force. Economic migration affects population size and its growth rate. People move
into an area if the real after-tax wage rates or the likelihood of being employed increases in
a region.
Supply of and demand for labor in the model determine the real wage rate. These wage
rates, along with other prices and productivity, determine the cost of doing business for each
industry in the model. An increase in the cost of doing business causes either an increase
in price or a cut in profits, depending on the market supplied by local firms. This market
share combined with the demand described above determines the amount of local output.
The model has many other feedbacks. For example, changes in wages and employment
impact income and consumption, while economic expansion changes investment and
population growth impacts government spending.
Model Overview
Figure B-1.1 is a pictorial representation of the model. The Output block shows a factory
that sells to all the sectors of final demand as well as to other industries. The Labor and
Capital Demand block shows how labor and capital requirements depend on both output
and their relative costs. Population and Labor Supply are shown as contributing to demand
and to wage determination in the product and labor market. The feedback from this market
shows that economic migrants respond to labor market conditions. Demand and supply
interact in the Wage, Price and Profit block. Once prices and profits are established, they
determine market shares, which along with components of demand, determine output.

Connecticut Department of Economic and Community DevelopmentThe Economic and Fiscal Impacts of Adriaen’s Landing
31
The REMI model brings together the above elements to determine the value of each of the
variables in the model for each year in the baseline forecasts. The model includes each
inter-industry relationship that is in an input-output model in the Output block, but goes well
beyond the input-output model by including the relationships in all of the other blocks shown
in Figure B-1.1.
In order to broaden the model in this way, it is necessary to estimate key relationships
econometrically. This is accomplished by using extensive data sets covering all areas of the
country. These large data sets and two decades of research effort have enabled REMI to
simultaneously maintain a theoretically sound model structure and build a model based on
all the relevant data available. The model has strong dynamic properties, which means that
it forecasts not only what will happen, but also when it will happen. This results in long-term
predictions that have general equilibrium properties. This means that the long-term
properties of general equilibrium models are preserved without sacrificing the accuracy of
event timing predictions and without simply taking elasticity estimates from secondary
sources.
Figure B-1.1
Connecticut Department of Economic and Community DevelopmentThe Economic and Fiscal Impacts of Adriaen’s Landing
32
Understanding the Model
In order to understand how the model works, it is critical to know how the key variables in
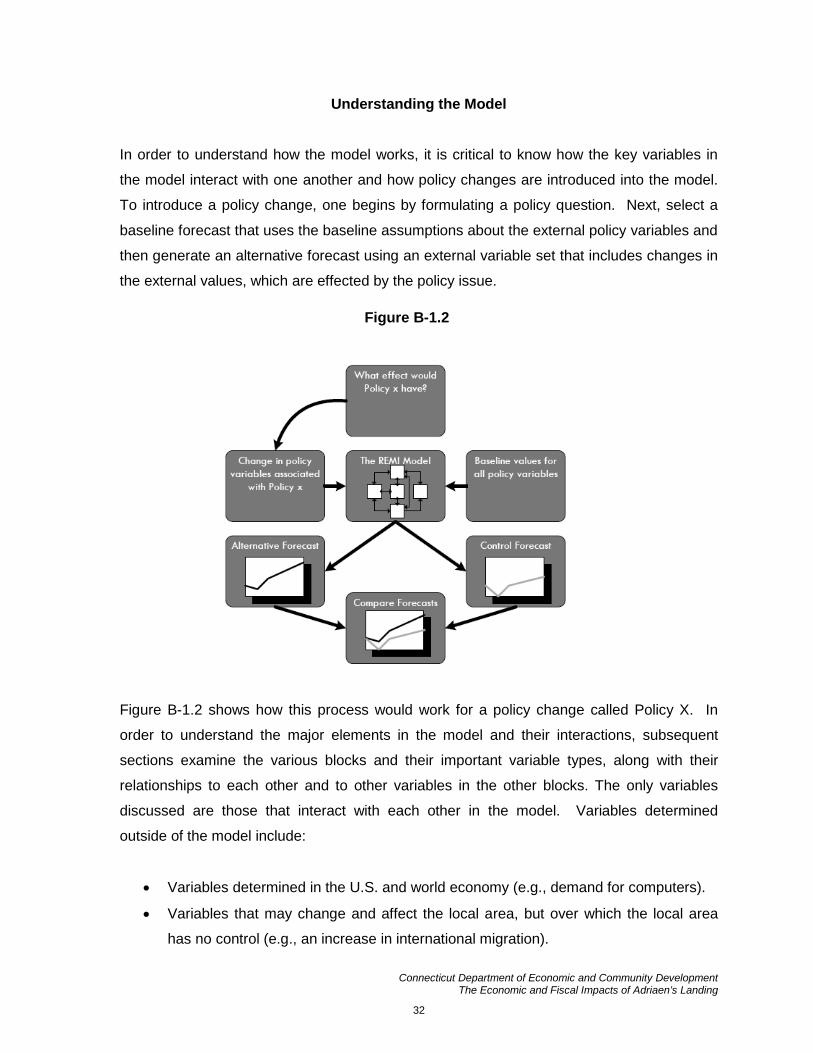
the model interact with one another and how policy changes are introduced into the model.
To introduce a policy change, one begins by formulating a policy question. Next, select a
baseline forecast that uses the baseline assumptions about the external policy variables and
then generate an alternative forecast using an external variable set that includes changes in
the external values, which are effected by the policy issue.
Figure B-1.2 shows how this process would work for a policy change called Policy X. In
order to understand the major elements in the model and their interactions, subsequent
sections examine the various blocks and their important variable types, along with their
relationships to each other and to other variables in the other blocks. The only variables
discussed are those that interact with each other in the model. Variables determined
outside of the model include:
Variables determined in the U.S. and world economy (e.g., demand for computers).
Variables that may change and affect the local area, but over which the local area
has no control (e.g., an increase in international migration).
Figure B-1.2

Connecticut Department of Economic and Community DevelopmentThe Economic and Fiscal Impacts of Adriaen’s Landing
33
Variables that are under control of local policy (e.g., local tax rates).
For simplicity, the last two categories are called policy variables. Changes in these
variables are automatically entered directly into the appropriate place in the model structure.
Therefore, the diagram showing the model structure also serves as a guide to the
organization of the policy variables (see Figure B-1.3).
Output Block
The Output Block variables are:
State and Local Government Spending
Investment
Exports
Consumption
Real Disposable Income
These variables interact with each other to determine output and depend on variable values
determined in other blocks as follows:
Variables in the Output Block Variables Outside of the
Output Block that are
Included in its Determinants
State and Local Government Spending Population
Investment Optimal Capital Stock (also the actual
capital stock)
Output Share of Local Market
(The proportion of local demand
supplied locally, called the Regional
Purchase Coefficient)
Connecticut Department of Economic and Community DevelopmentThe Economic and Fiscal Impacts of Adriaen’s Landing
34
Exports The Regional Share of Interregional and
International Trade
Real Disposable Income Employment, Wage Rates and the
Consumer Expenditure Price Index
Labor and Capital Demand Block
The Labor and Capital Demand block has only three types of key variables:
Employment - determined by the labor/output ratio and the output in each industry,
determined in the Output block.
Optimal Capital Stock - depends on relative labor, capital and fuel costs and the
amount of employment.
Labor/Output Ratio - depends on relative labor, capital and fuel costs.
Simply put, if the cost of labor increases relative to the cost of capital, the labor per unit of
output falls and the capital per unit of labor increases.
Population and Labor Supply Block
The model predicts population for 600 cohorts segmented by age, ethnicity and gender. This
block also calculates the demographic processes - births, deaths and aging. The models
deal with different population sectors as follows:
Retired Migrants are based on past patterns for each age cohort 65 and over.
International migrants follow past regional distributions by country of origin.
Military and college populations are treated as special populations that do not follow
normal demographic processes.
Economic migrants are those who are sensitive to changes in quality of life and
relative economic conditions in the regional economies. The economic variables that
change economic migration are employment opportunity and real after-tax wage
rates.
Connecticut Department of Economic and Community DevelopmentThe Economic and Fiscal Impacts of Adriaen’s Landing
35
This block allows the determination of the size of the labor force by predicting the labor force
participation rates for age, ethnicity and gender cohorts, which are then applied to their
respective cohorts and summed. The key variables that change participation rates within
the model are the ratio of employment to the relevant population (labor market tightness)
and the real after-tax wage rates.
Wage, Price and Profit Block
Variables contained within the Wage, Price and Profit block are:
Employment Opportunity
Wage Rate
Production Costs
Housing Price
Consumer Price Deflator
Real Wage Rate
Industry Sales Price
Profitability
The wage rate is determined by employment opportunity and changes in employment
demand by occupation for occupations that require lengthy training. The housing price
increases when population density increases. The Consumer Expenditure Price Index is
based on relative commodity prices, weighted by their share of U.S. nominal personal
consumption expenditures. The model uses the price index to calculate the real after-tax
wage rate for potential migrants that includes housing price directly, while the price index
used to deflate local income uses the local sales price of construction. Wage rates affect
production costs, as well as other costs, and they in turn determine profitability or sales
prices, depending on whether the type of industry involved serves mainly local or external
markets. For example, a cost increase for all local grocery stores results in an increase in
their prices, while an increase in costs for a motor vehicle factory reduces its profitability of
production at that facility but may not increase their prices worldwide.
Connecticut Department of Economic and Community DevelopmentThe Economic and Fiscal Impacts of Adriaen’s Landing
36
Market Shares Block
The Market Shares Block consists of:
Share of Local Market
Share of External Market
An increase in prices leads to some substitution away from local suppliers toward external
suppliers. In addition, a reduction in profitability for local factories leads to less expansion of
these factories relative to those located in areas where profits have not decreased. These
responses occur because the U.S. is a relatively open economy where firms can move to
the area that is most advantageous for their business.
The Complete Model
Figure B-1.3 illustrates the entire model and its components and linkages. This diagram is
helpful in understanding the complex relationships shared by variables within the various
blocks discussed above, as well as their relationships to variables in other blocks.

Connecticut Department of Economic and Community DevelopmentThe Economic and Fiscal Impacts of Adriaen’s Landing
37
Figure B-1.3