fiscal and economic impacts of proposed land use alternatives
TRANSCRIPT

South Fremont / Warm Springs Area Impact Analyses
Fiscal and Economic Impacts of Proposed Land Use Alternatives
January 2012
prepared for:
City of Fremont

South Fremont / Warm Springs Impact Analyses -2-
Table of Contents
I. INTRODUCTION ............................................................................................................... 5 Purpose of Report ............................................................................................................................ 5
Project Background .......................................................................................................................... 5
Report Organization ......................................................................................................................... 6
II. SUMMARY OF FINDINGS ............................................................................................... 8 Overview of Land Use Alternatives .................................................................................................. 8
Fiscal Impacts .................................................................................................................................. 9 Alternative Land Value Scenario Findings .............................................................................................. 11
Employment, Occupation, and Wage Profiles ............................................................................... 12
Economic Impacts .......................................................................................................................... 15 Overview .................................................................................................................................................. 15 Employment Impacts ................................................................................................................................ 16 Impacts from New Households ................................................................................................................ 18 Total Employment and Household Impacts ............................................................................................. 19
III. PROPOSED LAND USE ALTERNATIVES .................................................................... 20
IV. FISCAL IMPACT ANALYSIS ASSUMPTIONS AND APPROACH ................................ 22 Purpose of Fiscal Impact Analysis .......................................................................................................... 22 General Assumptions ............................................................................................................................... 22 Estimating Revenues ................................................................................................................................ 25 Estimating Expenses ................................................................................................................................ 32 Analysis Findings .................................................................................................................................... 37
Alternative Land Value Scenario .................................................................................................... 39
V. ECONOMIC IMPACT ANALYSIS ASSUMPTIONS AND APPROACH ......................... 42 Understanding Economic Impact Analysis ..................................................................................... 42
Overall Approach .................................................................................................................................... 43 Overarching Assumptions ........................................................................................................................ 44
Employment and Occupation Analysis .......................................................................................... 45 Approach ................................................................................................................................................. 45 Results of Employment and Occupation Analysis .................................................................................... 47
Employment Impact Analysis ......................................................................................................... 50 Approach ................................................................................................................................................. 50 Results of Employment Impact Analysis .................................................................................................. 50 Impact of Land Use Alternatives Compared to NUMMI Facility ............................................................ 51
Household Impact Analysis ............................................................................................................ 53 Approach ................................................................................................................................................. 53 Results of Analysis ................................................................................................................................... 54
Conclusion ..................................................................................................................................... 55
APPENDIX: LAND USE ALTERNATIVE MAPS ....................................................................... 57

South Fremont / Warm Springs Impact Analyses -3-
Tables Table 1: Land Use Assumptions ................................................................................................................... 8 Table 2: Annual General Fund Revenues and Expenses at Full Build-Out of Alternatives (2010 dollars) 10 Table 3: Annual General Fund Revenues and Expenses at Full Build-Out of Alternatives Under Alternative Land Value Scenario (2010 dollars) ........................................................................................ 11 Table 4: Top Occupations Associated with Proposed Land Use Alternatives ............................................ 13 Table 5. Jobs and Aggregate Annual Compensation Associated with Land Use Alternatives, by Land Use Designation ................................................................................................................................................. 14 Table 6. Potential Regional Economic Impacts of Employment Uses ....................................................... 16 Table 7. Potential Regional Economic Impact of Residential Uses ............................................................ 18 Table 8. Total Potential Regional Economic Impact of the Land Use Alternatives ................................... 19 Table 9: Residential and Commercial Land Use Assumptions for Fiscal Impact Analysis ....................... 21 Table 10: Current Service Population Assumptions ................................................................................... 23 Table 11: Value, Turnover, and Vacancy Rate Assumptions ..................................................................... 24 Table 12: Service Population Growth for Land Use Alternatives .............................................................. 24 Table 13: Property Tax Rates ..................................................................................................................... 25 Table 14: Assessed Property Values of Land Use Alternatives, 2010 Dollars ........................................... 26 Table 15: Annual Secured Property Tax Revenue, 2010 Dollars ............................................................... 26 Table 16: Annual Property Transfer Tax Revenue, 2010 Dollars .............................................................. 27 Table 17: Annual Unsecured Property Tax Assumptions and Revenue ..................................................... 28 Table 18: Taxable Sales per Square Foot and Tax Rates ............................................................................ 29 Table 19: Annual Sales Tax Revenue ......................................................................................................... 29 Table 20: Property Tax In-Lieu of VLF Assumptions ................................................................................ 30 Table 21: Annual License Fee In-Lieu of VLF Revenue ............................................................................ 30 Table 22: Annual General Fund Revenue per Capita ................................................................................. 31 Table 23: Total Annual Revenues Calculated on a Per Capita Basis.......................................................... 31 Table 24: Police Department Cost Assumptions ........................................................................................ 32 Table 25: Calculation of Additional Costs for Police Service .................................................................... 33 Table 26: Fire Department Annual General Fund Costs Assumptions and Results ................................... 34 Table 27: Street Maintenance Cost Assumptions and Results .................................................................... 35 Table 28: Park and Median Maintenance Cost Assumptions and Results .................................................. 36 Table 29: Annual General Fund Cost per Capita ........................................................................................ 37 Table 30: Total Costs Calculated on a per Capita Basis ............................................................................. 37 Table 31: Summary of General Fund Revenues and Costs ......................................................................... 38 Table 32: Baseline and Alternative Values ................................................................................................. 39 Table 33: Assessed Property Values of Land Use Alternatives, Under Higher Land Values .................... 40 Table 34: Annual Secured Property Tax Revenue Under Higher Land Values .......................................... 40 Table 35: Summary of General Fund Revenues and Costs Under Higher Land Value Scenario ............... 41 Table 36: Residential and Commercial Land Use Assumptions ................................................................. 44 Table 37. Proposed Land Use Alternatives: Employment by Industry Sector ............................................ 46 Table 38. Top Occupations Associated with Proposed Land Use Alternatives .......................................... 48 Table 39. Average Annual Earnings per Worker by Land Use Alternative ............................................... 48 Table 40. Jobs and Aggregate Annual Compensation Associated with Land Use Alternatives, by Land Use Designation .......................................................................................................................................... 49 Table 41. Potential Regional Economic Impacts of Employment Uses ..................................................... 51 Table 42. Effective Earnings, Jobs, and Output Multipliers* for Employment Uses ................................. 51 Table 43. Inputs of Household Economic Impact Analysis ........................................................................ 54

South Fremont / Warm Springs Impact Analyses
-4-
Table 44. Potential Regional Economic Impact of Residential Uses .......................................................... 54 Table 45. Total Potential Regional Economic Impact of the Land Use Alternatives ................................. 55

South Fremont / Warm Springs Impact Analyses -5-
PURPOSE OF REPORT This report presents the findings of Strategic Economics’ fiscal and economic impact analyses of the three land use alternatives proposed for the South Fremont / Warm Springs Area (“Study Area”) by Perkins + Will in association with Strategic Economics, Economic and Planning Systems, Fehr and Peers, and BKF Engineers. The analyses provide a means of projecting and comparing the land use alternatives’ respective impacts on the City of Fremont’s finances, and on the regional economy. The fiscal impact analysis is best used to understand major cost and revenue drivers, and the magnitude of different outcomes from each land use alternative. The fiscal impact analysis compares the impact of the land use alternatives on the City’s General Fund, which is the primary account used to pay for services not covered by user fees. It is a “static” analysis – that is, it assesses annual revenues and costs upon full build out of potential development under the land use alternatives. As with any projection of the distant future, the results are driven by the inputs. The inputs, and methods for deriving them, are described in detail, and the land use alternatives themselves were informed by market analyses. However, actual conditions will vary since full build out of development under the land use alternatives may take over thirty years, and as the Land Use Alternatives considered herein may vary from the land use types, intensities and patterns that ultimately develop in the Study Area. The economic impact analysis compares the regional economic impact of employment and housing proposed under the land use alternatives. The analysis first provides an employment profile of each alternative, including total number of projected jobs by land use type, general occupational mix associated with these jobs, and a simple breakdown of general wage and salary levels associated with the total jobs by occupation. The analysis then calculates the “ripple effects” of this new housing and employment on the nine-county Bay Area region – that is, it calculates the additional spending and employment generated by recirculation of dollars spent by manufacturers on suppliers, households on consumer goods, etc. The fiscal and economic comparisons provide additional insights for the Fremont community to consider while assessing which land use alternative – or components of the alternatives – best balances the community’s economic, fiscal, and social goals for development within the Study Area.
PROJECT BACKGROUND The New United Motor Manufacturing Inc. (NUMMI) plant, located in the Warm Springs Industrial District, was a major, longstanding component of the City of Fremont’s diverse industrial base until its closure in 2010. The closure resulted in the loss of 4,700 jobs at the site, and affected an estimated 300 companies in California representing an estimated 30,000 jobs. To address the loss of these jobs and economic benefits, the U.S. Economic Development Administration (EDA) awarded the City of Fremont with a $333,000 grant to prepare four studies related to the reuse of the NUMMI plant, its associated land holdings to the north and south of the plant, and the surrounding industrial lands:
1. Economic and Market Strategic Plan 2. Land Use Alternatives Analysis 3. Infrastructure and Cost Analysis 4. Financial Assessment
I. INTRODUCTION

South Fremont / Warm Springs Impact Analyses
-6-
This report is one of two which comprise the “Financial Assessment” study. The second report, being prepared by Economic & Planning Systems, will describe the results of analyses evaluating the critical feasibility and infrastructure financing challenges associated with the three land use alternatives. The land use alternatives considered in these reports were developed as a result of community input, market analysis, and outside expert opinions regarding reuse and redevelopment strategies. Since the EDA grant was obtained, NUMMI formally vacated the plant, which was sold to Tesla Motors for production of its electrical vehicles; Tesla Motors estimates it will eventually employ 1,200 workers at the site. In early 2011, the City learned that vacant land north and south of the Tesla Motors plant had been sold to Union Pacific Railroad (UPRR). UPRR’s final intended uses of the sites are unclear, but this ownership presents possible but unknown constraints on the City’s land use planning for the area. The study has moved forward while recognizing these additional constraints, focusing on an approximate 850-acre Study Area that includes the three former NUMMI parcels and 480 additional acres spread among a number of different ownerships. Figure 1 shows the Study Area boundaries, context, and opportunity sites considered in the land use alternatives. The Study Area includes the proposed Warm Springs Bay Area Rapid Transit station (projected to open in 2015), which offers opportunities for housing or employment development to take advantage of new transit. As shown, the Tesla Factory and various other industrial sites were not included in the alternatives since their use is considered unlikely to change in the foreseeable future. Therefore the fiscal and economic analyses focused on new development (“opportunity sites”) possible under the land use alternatives, although the economic impact analysis includes an informational comparison to the former NUMMI factory.
REPORT ORGANIZATION This report consists of the following sections:
Summary of Findings: Briefly describes the land use alternatives and the major findings regarding fiscal impacts, employment mix and wages, and economic impacts.
Proposed Land Use Alternatives: Describes the land use alternatives in detail.
Fiscal Impact Analysis Assumptions and Approach: Describes the assumptions used to build the fiscal impact analysis, the approach used to calculate the findings, and other considerations regarding property values.
Economic Impact Analysis and Approach: Describes the assumptions used to produce industry, occupation, and wage findings, and the assumptions and economic impact findings for the land use alternatives and NUMMI. This section includes a detailed description of the significance and usefulness of economic impact analysis.

South Fremont / Warm Springs Impact Analyses -7-
Figure 1: Study Area Boundaries (in Red) and Opportunity Sites (Highlighted in Yellow)
Source: Perkins + Will, 2011. Note: “Opportunity Sites” are vacant or under‐utilized parcels and parcels more likely to change land uses.

South Fremont / Warm Springs Impact Analyses -8-
OVERVIEW OF LAND USE ALTERNATIVES Perkins + Will produced three land use alternatives for the opportunity sites shown in Figure 1. The three land use alternatives envision development of varying mixes of industrial, commercial, residential, and retail uses on the opportunity sites, although all are primarily employment-focused. Each land use alternative is described below.
“Alternative 1: Innovation Center/Manufacturing” envisions development of industrial and
commercial uses on the opportunity sites to form a “Center for Innovation.” This scenario represents the greatest concentration of traditional industrial uses, complemented by a new emphasis on innovative practices and research and development.
“Alternative 2: Innovation Campus/Residential TOD” envisions establishment of a large
innovation campus with a mix of commercial and research and development uses, plus residential development near the BART station buffered by lower-intensity commercial uses, supporting a supporting a more traditional transit-oriented development approach. This scenario includes a mix of uses on the opportunity sites, but largely isolates housing from employment.
“Alternative 3: Innovation District/Residential Mixed-Use” envisions a mixed-use living and
working district, with a mix of office, research and development, industrial, housing, and retail uses included on the opportunity sites. This scenario creates two distinct residential neighborhoods, both well-integrated with the employment uses, but isolated from heavier industrial uses.
Perkins + Will created ranges of possible growth under each land use alternative, but for purposes of analysis Strategic Economics used the assumptions below.
Table 1: Land Use Assumptions
Square Feet/Residential Units
Proposed Land Use Categories Alt. 1 Alt. 2 Alt. 3
Residential
Multi‐Family Residential 0 3,200 3,900
Commercial
Industrial ‐ General/Manufacturing 3,055,000 1,783,000 471,000
Industrial ‐ Technology/R&D 180,000 220,000 941,000
Commercial/Industrial ‐ High Tech Office/R&D Blend 1,126,000 3,077,000 3,370,000
Commercial ‐ High Tech Office 4,024,000 1,470,000 1,470,000
Commercial ‐ Retail Center 0 0 105,000
Total 8,385,000 6,551,000 6,356,000
Source: Perkins + Will, 2011; Strategic Economics, 2011.
Note: Totals may not sum due to rounding.
II. SUMMARY OF FINDINGS

South Fremont / Warm Springs Impact Analyses
-9-
FISCAL IMPACTS
As shown in Table 2, growth under all three plan alternatives is likely to have a positive fiscal impact on the General Fund. Projected results under land use Alternative 3 indicate the greatest potential amount of total annual revenue to the General Fund, while those under Alternative 1 indicate the highest ratio of revenue to costs.
Potential projected increases in assessed value are significant and drive significant revenue.
Property taxes are the largest General Fund revenue sources for all three alternatives. Furthermore, property taxes, vehicle license fee revenue, and property transfer tax are all driven by the increased assessed values under the plan alternatives; together they comprise the majority of revenues gained under Alternatives 2 and 3. In contrast, sales tax under Alternative 1 is a relatively high share of revenue due to the likely business-to-business transactions occurring in that scenario.
Public safety drives the greatest potential costs for all plan alternatives, with police and fire
services comprising the majority of new General Fund costs under all three alternatives. This finding is consistent with the City’s current budget, under which public safety services comprise over sixty percent of existing General Fund expenditures and transfers out.
Given the long time-frame and number of assumptions involved in projecting these fiscal impacts, exact conditions may vary from these results. Further, it should be noted that these fiscal impact findings are one of many considerations in selecting which land use alternative best suits the preferences and needs of the Fremont community.

South Fremont / Warm Springs Impact Analyses
-10-
Table 2: Annual General Fund Revenues and Expenses at Full Build-Out of Alternatives (2010 dollars)
Alternative 1 Alternative 2 Alternative 3
Revenue
Property Tax $ 2,150,000 $ 3,590,000 $ 4,050,000
Property Transfer Tax $ 50,000 $ 140,000 $ 170,000
Sales Tax $ 2,070,000 $ 1,620,000 $ 1,870,000
Vehicle License Fee $ 580,000 $ 1,050,000 $ 1,200,000
Per Capita Revenue $ 2,000,000 $ 1,960,000 $ 2,160,000
Subtotal $ 6,840,000 $ 8,360,000 $ 9,440,000
Costs
Police Cost $ 540,000 $ 1,020,000 $ 1,180,000
Fire Cost $ 1,970,000 $ 1,970,000 $ 1,970,000
Street Maintenance Cost $ 30,000 $ 30,000 $ 30,000
Parks and Medians Cost $ 60,000 $ 100,000 $ 100,000
Per Capita Cost $ 970,000 $ 1,840,000 $ 2,120,000
Subtotal $ 3,570,000 $ 4,950,000 $ 5,400,000
Net Revenue $ 3,270,000 $ 3,410,000 $ 4,040,000
Net Revenue as % of 48% 41% 43%
Total Revenue
Source: Strategic Economics, 2011.
South Fremont / Warm Springs Impact Analyses
-11-
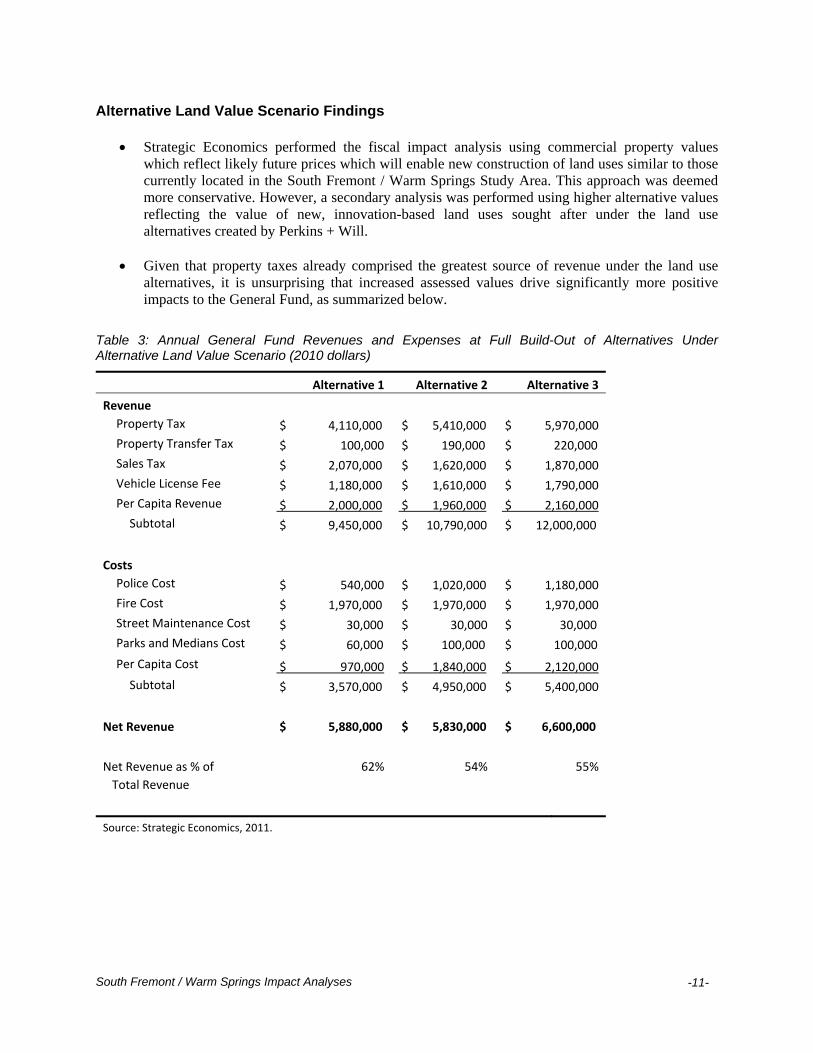
Alternative Land Value Scenario Findings
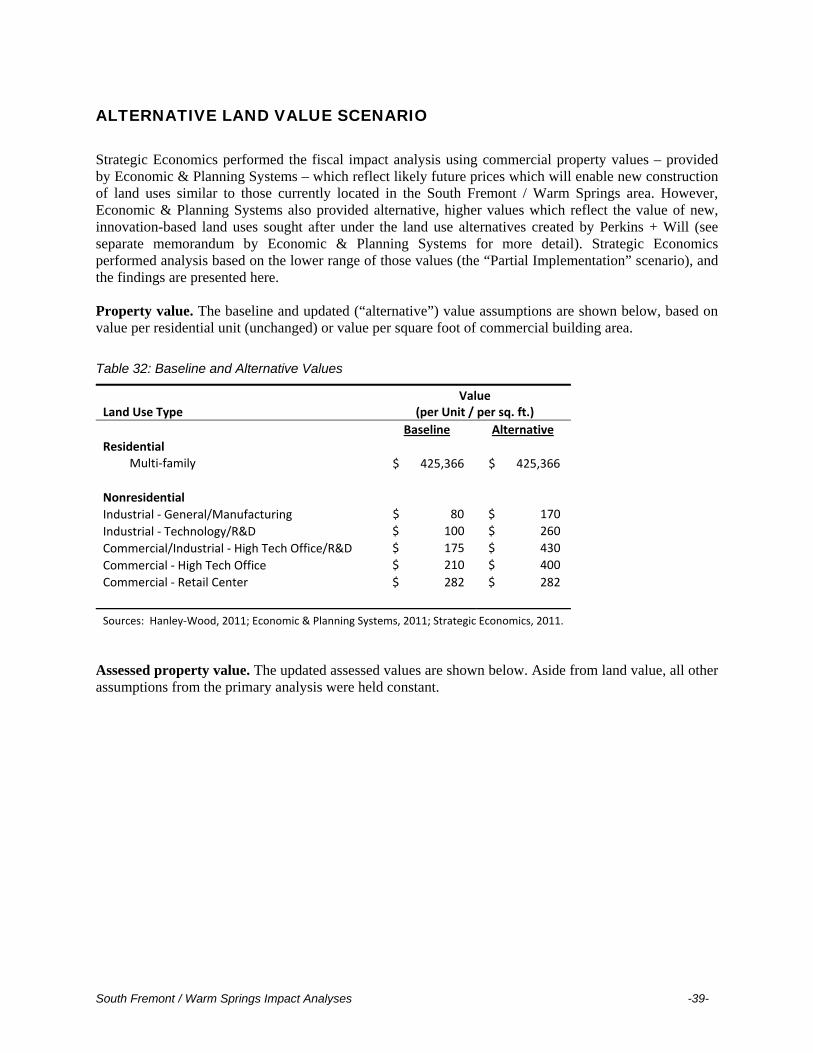
Strategic Economics performed the fiscal impact analysis using commercial property values which reflect likely future prices which will enable new construction of land uses similar to those currently located in the South Fremont / Warm Springs Study Area. This approach was deemed more conservative. However, a secondary analysis was performed using higher alternative values reflecting the value of new, innovation-based land uses sought after under the land use alternatives created by Perkins + Will.
Given that property taxes already comprised the greatest source of revenue under the land use
alternatives, it is unsurprising that increased assessed values drive significantly more positive impacts to the General Fund, as summarized below.
Table 3: Annual General Fund Revenues and Expenses at Full Build-Out of Alternatives Under Alternative Land Value Scenario (2010 dollars)
Alternative 1 Alternative 2 Alternative 3
Revenue
Property Tax $ 4,110,000 $ 5,410,000 $ 5,970,000
Property Transfer Tax $ 100,000 $ 190,000 $ 220,000
Sales Tax $ 2,070,000 $ 1,620,000 $ 1,870,000
Vehicle License Fee $ 1,180,000 $ 1,610,000 $ 1,790,000
Per Capita Revenue $ 2,000,000 $ 1,960,000 $ 2,160,000
Subtotal $ 9,450,000 $ 10,790,000 $ 12,000,000
Costs
Police Cost $ 540,000 $ 1,020,000 $ 1,180,000
Fire Cost $ 1,970,000 $ 1,970,000 $ 1,970,000
Street Maintenance Cost $ 30,000 $ 30,000 $ 30,000
Parks and Medians Cost $ 60,000 $ 100,000 $ 100,000
Per Capita Cost $ 970,000 $ 1,840,000 $ 2,120,000
Subtotal $ 3,570,000 $ 4,950,000 $ 5,400,000
Net Revenue $ 5,880,000 $ 5,830,000 $ 6,600,000
Net Revenue as % of 62% 54% 55%
Total Revenue
Source: Strategic Economics, 2011.

South Fremont / Warm Springs Impact Analyses
-12-
EMPLOYMENT, OCCUPATION, AND WAGE PROFILES
Strategic Economics modeled employment, occupation, and wage profiles for each land use alternative, based on the industries and occupations most likely to be found within each land use category. The results are summarized below.
Table 4, on the following page, shows the top occupations associated with the three land use
alternatives, and the average wages associated with each of those occupations in the East Bay. Computer and mathematical occupations (e.g. software developers, computer systems analysts, and computer support specialists) account for the largest share of jobs in each alternative, because workers with these skills are employed by the types of technology-related manufacturing, R&D, and high-tech office uses likely to locate in the Study Area. Office and administrative support jobs also account for a significant share of employment in each alternative because these workers are employed by most industries.
Alternative 1, which is more heavily weighted towards manufacturing, provides more production and installation/repair/maintenance jobs. Alternatives 2 and 3 include relatively more jobs associated with R&D and office uses, such as management, architecture and engineering, and the sciences. Alternative 3 also includes more jobs associated with retail, restaurants, and personal services (e.g. sales people, cashiers, food preparation workers, hairstylists, etc.), although the amount of space allocated to retail uses in Alternative 3 is too small to have significant impact on the occupation results.
Table 5, on page 14, shows the total jobs and compensation associated with each land use alternative. Alternative 1 has the potential to generate more than $2.3 billion in aggregate annual compensation; Alternative 2 could generate almost $1.8 billion in earnings; and Alternative 3 could generate more than $1.9 billion. Although Alternatives 2 and 3 have more highly-paid jobs as a share of total employment (and thus higher average earnings), Alternative 1 has the potential to generate the highest total compensation because this alternative reserves the most space for employment uses.

South Fremont / Warm Springs Impact Analyses
-13-
Table 4: Top Occupations Associated with Proposed Land Use Alternatives
Alternative 1 Alternative 2 Alternative 3 Average Annual Wage* Occupation Type Jobs % of Total Jobs % of Total Jobs % of Total (Oakland‐Fremont MSA)
Computer and Mathematical 6,000 26% 3,800 22% 4,200 22% $85,400
Office and Administrative Support 3,600 16% 2,700 15% 2,900 15% $41,370
Production 2,100 9% 1,600 9% 1,200 6% $37,890
Installation, Maintenance, and Repair 2,000 9% 1,300 7% 1,300 7% $53,130
Management 1,900 8% 1,500 9% 1,700 9% $121,970
Architecture and Engineering 1,900 8% 1,600 9% 1,900 10% $90,170
Sales and Related 1,700 7% 1,200 7% 1,300 7% $43,420
Business and Financial Operations 1,600 7% 1,200 7% 1,400 7% $77,810
Transportation and Material Moving 700 3% 600 3% 400 2% $38,980
Life, Physical, and Social Sciences 500 2% 900 5% 1,200 6% $79,470
Other 1,100 5% 1,200 7% 1,500 8% N/A
Total (All Occupations) 23,200 100% 17,700 100% 18,800 100% $56,360
Source: OES, 2010; BLS, 2010 and 2011; Strategic Economics, 2011. *Does not include benefits.

South Fremont / Warm Springs Impact Analyses -14-
Table 5: Jobs and Aggregate Annual Compensation Associated with Land Use Alternatives, by Land Use Designation
Land Use Designation Jobs Aggregate
Compensation
Average Compensation
per Job
Alternative 1
Industrial ‐ General/Manufacturing 4,000 $ 305,700,000 $ 76,300
Industrial ‐ Technology/R&D 400 $ 42,800,000 $ 103,600
Commercial/Industrial ‐ High Tech Office/R&D Blend 3,400 $ 348,200,000 $ 103,300
Commercial ‐ High Tech Office 15,400 $ 1,631,800,000 $ 106,100
Commercial ‐ Retail Center ‐‐ ‐‐ ‐‐
Total 23,200 $ 2,328,500,000 $ 100,500
Alternative 2
Industrial ‐ General/Manufacturing 2,300 $ 178,400,000 $ 76,300
Industrial ‐ Technology/R&D 500 $ 52,500,000 $ 103,600
Commercial/Industrial ‐ High Tech Office/R&D Blend 9,200 $ 951,500,000 $ 103,300
Commercial ‐ High Tech Office 5,600 $ 596,000,000 $ 106,100
Commercial ‐ Retail Center ‐‐ ‐‐ ‐‐
Total 17,700 $ 1,778,400,000 $ 100,600
Alternative 3
Industrial ‐ General/Manufacturing 600 $ 47,100,000 $ 76,300
Industrial ‐ Technology/R&D 2,200 $ 223,800,000 $ 103,600
Commercial/Industrial ‐ High Tech Office/R&D Blend 10,100 $ 1,042,100,000 $ 103,300
Commercial ‐ High Tech Office 5,600 $ 596,000,000 $ 106,100
Commercial ‐ Retail Center 300 $ 13,700,000 $ 42,500
Total 18,800 $ 1,922,700,000 $ 102,300
Sources: BLS, 2010 and 2011; Strategic Economics, 2011.
Note: Totals may not sum due to rounding.
South Fremont / Warm Springs Impact Analyses
-15-
ECONOMIC IMPACTS
Overview Economic impact analysis measures the effects of a dollar spent by a business or household rippling through the economy as suppliers and workers pay their workers and purchase inputs, and the workers in turn purchase household goods and services. The sum of these effects describes the total value of the jobs and households to the economy. The economic ripple effects fall into three categories:
Direct effects are the initial changes in employment, earnings,1 and output generated by the industry, firm, or project under study, such as the businesses located in the Study Area.
Indirect effects occur in industries that provide inputs or respond to the demand generated by the industry, firm, or project under study.
Induced effects result from households spending the income they earn, whether as a result of the direct effects associated with the initial changes in economic activity, or the indirect effects on different employers throughout the supply chain.
In this report, economic impacts are reported in terms of annual ongoing employment, earnings, and output effects on the nine-county Bay Area region. The estimates of economic output are derived from the previously-described model of employment and earnings for each land use alternative.
1 “Earnings” includes wages and benefits, unless otherwise noted.

South Fremont / Warm Springs Impact Analyses -16-
Employment Impacts
Alternative 1 has the potential to generate the largest regional economic impacts since it reserves the most land for employment. Alternative 3 has the second-highest potential economic impact. Table 6 shows the direct, indirect, and induced effects associated with the employment uses included in the land use alternatives.
Alternative 3 has the biggest “bang for the buck” in terms of economic impact, largely because
workers earn higher wages in the industries included in Alternative 3, which translates to greater induced effects (i.e. household spending). Because the analysis assumes that each alternative is fully built out, the relative scale of the impacts is primarily related to the amount of land that each alternative reserves for employment uses. Another factor that affects the size of the impacts is the varying economic effects between the mix of individual industries included under each land use alternative.
Table 6: Potential Regional Economic Impacts of Employment Uses
Type of Effect Aggregate Earnings Jobs Output
Alternative 1
Direct Effects $ 2,328,500,000 23,200 $ 6,829,000,000
Indirect Effects $ 983,700,000 15,800 $ 3,113,800,000
Induced Effects $ 1,075,300,000 20,300 $ 3,883,000,000
Total $ 4,387,500,000 59,300 $ 13,825,800,000
Alternative 2
Direct Effects $ 1,778,400,000 17,700 $ 5,218,500,000
Indirect Effects $ 790,600,000 12,900 $ 2,474,100,000
Induced Effects $ 833,700,000 16,300 $ 3,011,300,000
Total $ 3,402,800,000 46,900 $ 10,703,900,000
Alternative 3
Direct Effects $ 1,922,700,000 18,800 $ 5,593,800,000
Indirect Effects $ 883,700,000 14,600 $ 2,748,400,000
Induced Effects $ 910,600,000 18,200 $ 3,283,900,000
Total $ 3,716,900,000 51,500 $ 11,626,100,000
Sources: BEA, 2011; BLS, 2010 and 2011; Strategic Economics, 2011.
Note: Totals may not sum due to rounding. Comparison to NUMMI Factory
To provide additional context, Strategic Economics examined the economic impacts of the defunct NUMMI factory; however, the results should not be interpreted as a direct comparison since the NUMMI site is not one of the opportunity sites considered in the land use alternatives.
South Fremont / Warm Springs Impact Analyses
-17-
The East Bay Economic Development Alliance (EDA) estimated in 2009 that the NUMMI facility – which employed just under 4,700 workers with an annual payroll (including benefits) of about $512 million – supported a total of 24,598 jobs across the region through direct, indirect, and induced effects. Updated economic impact data from the US Bureau of Economic Analysis – the same source as the EDA – results in lower regional impact of about 16,300 jobs, $1.2 billion in earnings, and $7 to $9 billion in output.
Growth under any of the three land use alternatives exceeds the economic impact generated by the NUMMI plant under both Strategic Economics’ estimates and older estimates from the EDA. This is especially true because the figures shown in Table 6 do not include employment generated by Tesla at the former NUMMI site (the NUMMI facility itself is not an opportunity site, since the facility is now occupied by Tesla). Assuming that Tesla expands to 1,200 employees as projected, Tesla would support a total of about 4,200 jobs throughout the region.

South Fremont / Warm Springs Impact Analyses -18-
Impacts from New Households
As shown in Table 7, Alternative 3 provides the greatest potential economic impact in terms of aggregate earnings and output due to its high relatively high number of housing units. Alternative 1 does not create household impacts since it does not include any new housing.
Table 7: Potential Regional Economic Impact of Residential Uses
Land Use Alternative Aggregate Earnings Jobs Output
Alternative 1 $ ‐ ‐ $ ‐
Alternative 2 $ 85,438,106 2,100 $ 308,810,525
Alternative 3 $ 104,127,691 2,600 $ 376,362,828
Sources: U.S. Census, 2010; BLS, 2010 and 2011; Strategic Economics, 2011.
South Fremont / Warm Springs Impact Analyses -19-
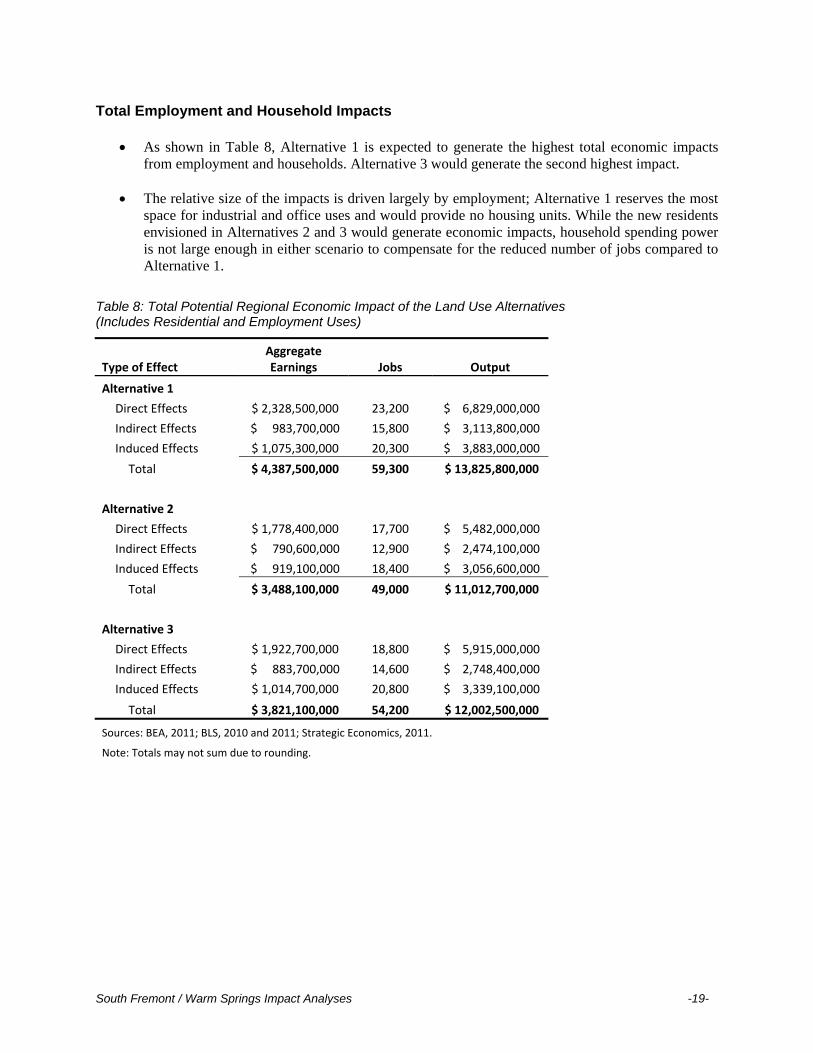
Total Employment and Household Impacts
As shown in Table 8, Alternative 1 is expected to generate the highest total economic impacts from employment and households. Alternative 3 would generate the second highest impact.
The relative size of the impacts is driven largely by employment; Alternative 1 reserves the most
space for industrial and office uses and would provide no housing units. While the new residents envisioned in Alternatives 2 and 3 would generate economic impacts, household spending power is not large enough in either scenario to compensate for the reduced number of jobs compared to Alternative 1.
Table 8: Total Potential Regional Economic Impact of the Land Use Alternatives (Includes Residential and Employment Uses)
Type of Effect Aggregate Earnings Jobs Output
Alternative 1
Direct Effects $ 2,328,500,000 23,200 $ 6,829,000,000
Indirect Effects $ 983,700,000 15,800 $ 3,113,800,000
Induced Effects $ 1,075,300,000 20,300 $ 3,883,000,000
Total $ 4,387,500,000 59,300 $ 13,825,800,000
Alternative 2
Direct Effects $ 1,778,400,000 17,700 $ 5,482,000,000
Indirect Effects $ 790,600,000 12,900 $ 2,474,100,000
Induced Effects $ 919,100,000 18,400 $ 3,056,600,000
Total $ 3,488,100,000 49,000 $ 11,012,700,000
Alternative 3
Direct Effects $ 1,922,700,000 18,800 $ 5,915,000,000
Indirect Effects $ 883,700,000 14,600 $ 2,748,400,000
Induced Effects $ 1,014,700,000 20,800 $ 3,339,100,000
Total $ 3,821,100,000 54,200 $ 12,002,500,000
Sources: BEA, 2011; BLS, 2010 and 2011; Strategic Economics, 2011.
Note: Totals may not sum due to rounding.
South Fremont / Warm Springs Impact Analyses -20-
Perkins + Will prepared the three land use alternatives to depict a range of employment-focused land use scenarios intended to capitalize on local workforce and transportation assets to create opportunities for job growth. Recognizing the existing industrial nature of the area, the land use scenarios include varying degrees of industrial use while also promoting transition toward high-tech uses and, in some cases, limited residential development. This section describes the three alternatives which, as stated earlier, only cover the opportunity sites shown on Figure 1. More detailed descriptions can be found in the “Land Use Alternatives” report written by Perkins + Will dated September 7, 2011; maps of the land use alternatives are included in the appendix of this report. Six land use categories are included in the alternatives:
Industrial – General Industrial/Manufacturing (General Industrial): Accommodates a broad range
of traditional industrial uses, such as heavy manufacturing, warehousing, recycling facilities, corporation yards, and uses requiring handling and storage of hazardous materials.
Industrial – Technology/Research and Development (R&D): Accommodates technology and research and development uses, including administrative, sales, and engineering facilities, plus light industrial uses such as warehousing, wholesaling, distribution, and non-hazardous manufacturing and materials handling/storage.
Commercial/Industrial – Office/Research & Development (R&D): Accommodates a broad range of uses related to research and development, more moderate industrial uses associated with manufacturing, warehousing, and distribution of materials, and commercial office space. Also allows special uses such as entertainment, community facilities, and hotels, and mixed-use development including commercial space over ground-floor retail and services.
Commercial High Tech Office: Accommodates office uses related to technological development, including administrative, sales, and other professional services.
Commercial – Retail Center: Accommodates neighborhood retail and office uses, including supermarkets, drug stores, banks, restaurants, medical and dental offices, etc.
Residential – High Density: Allows construction of multi-unit residential buildings ranging from two to five stories and 20 to 70 units per acre.
The three land use alternatives envision development of varying mixes of industrial, commercial, residential, and retail uses on the opportunity sites:
“Alternative 1: Innovation Center/Manufacturing” envisions development of industrial and
commercial uses on the opportunity sites to form a “Center for Innovation.” This scenario represents the greatest concentration of traditional industrial uses, complemented by a new emphasis on innovative practices and research and development.
“Alternative 2: Innovation Campus/Residential TOD” envisions establishment of a large
innovation campus with a mix of commercial and research and development uses, plus residential development near the BART station buffered by lower-intensity commercial uses.
III. PROPOSED LAND USE ALTERNATIVES

South Fremont / Warm Springs Impact Analyses
-21-
This scenario includes a mix of uses on the opportunity sites, but largely isolates housing from employment uses.
“Alternative 3: Innovation District/Residential Mixed-Use” envisions a mixed-use living and
working district, with a mix of office, research and development, industrial, housing, and retail uses included on the opportunity sites. This scenario creates two distinct residential neighborhoods, both well-integrated with the employment uses, but isolated from heavier industrial uses.
Although the land use alternatives present ranges of land use outcomes, Strategic Economics selected consistent measures for purposes of analysis.
Perkins + Will provided a range of potential land use outcomes to provide flexibility and acknowledge different outcomes based on future market conditions. For purposes of economic and fiscal analyses, however, these ranges needed to be held constant. Strategic Economics, and other project partners, used the following ranges for consistency:
Table 9: Residential and Commercial Land Use Assumptions for Fiscal Impact Analysis
Square Feet/Residential Units
Proposed Land Use Categories Alt. 1 Alt. 2 Alt. 3
Residential
Multi‐Family Residential 0 3,200 3,900
Commercial
Industrial ‐ General/Manufacturing 3,055,000 1,783,000 471,000
Industrial ‐ Technology/R&D 180,000 220,000 941,000
Commercial/Industrial ‐ High Tech Office/R&D Blend 1,126,000 3,077,000 3,370,000
Commercial ‐ High Tech Office 4,024,000 1,470,000 1,470,000
Commercial ‐ Retail Center 0 0 105,000
Total 8,385,000 6,551,000 6,356,000
Source: Perkins + Will, 2011; Strategic Economics, 2011.
Note: Totals may not sum due to rounding.

South Fremont / Warm Springs Impact Analyses
-22-
This chapter describes the assumptions and approach used to generate the findings of the fiscal impact analysis. It first describes the purpose and use of fiscal impact analysis, and then general assumptions, revenue assumptions and methodology, and the expense assumptions and methodology. The chapter closes with a description of outcomes under an alternative building value scenario.
Purpose of Fiscal Impact Analysis Fiscal impact analysis measures the impact of potential development on the City’s finances. All changes to land use patterns within a city will incur ongoing revenues and service costs. Additional residents and businesses create demand for city services (such as police and fire) and facilities (such as parks), but also provide sales tax, property tax, fee income, and other revenues. Fiscal impact analysis requires long-range projections of the future, and is therefore best used to understand which components of the plan generate revenues and costs, and to compare the differing impacts between the land use alternatives. Fiscal impact analysis uses the best available data to generate assumptions for projecting future revenues and expenses under the plan alternatives. These revenues and costs are derived from existing and historic conditions. However, completion of potential development may take thirty or more years; circumstances can dramatically change in that time. Therefore the most effective use of fiscal impact analysis is to focus on which elements of the plan create significant revenues or costs, and the magnitude of difference between the alternatives’ fiscal outcomes.
General Assumptions Type of Analysis
Static analysis of full development build-out. The analysis is “static,” as opposed to “dynamic.” It analyzes the annual fiscal impacts upon completion of development envisioned under the plan, rather than providing year-by-year estimates during construction.
General Fund. The impacts to the General Fund are analyzed. Notably, Fremont has successfully
funded large portions of its departmental activities through fees for service. Therefore the General Fund is now used primarily for basic services such as public safety, administration, community services, and ongoing basic street maintenance.
2010 dollars. The analysis is derived from the actual General Fund spending for fiscal year 2010-2011. All outputs are reported in 2010 dollars.
Continuing success of the fee-for-service model. The City of Fremont has committed to developing a fee-for-service model under which – to the extent possible – costs for providing services are offset by user fees. As a result, the General Fund is now used primarily to fund public safety services and administrative costs. This analysis assumes that Fremont continues to provide
IV. FISCAL IMPACT ANALYSIS ASSUMPTIONS AND
APPROACH
South Fremont / Warm Springs Impact Analyses
-23-
the same share of services on a fee-for-service basis rather than requiring additional General Fund funding to make up for any shortfalls.
Service Population and Land Use
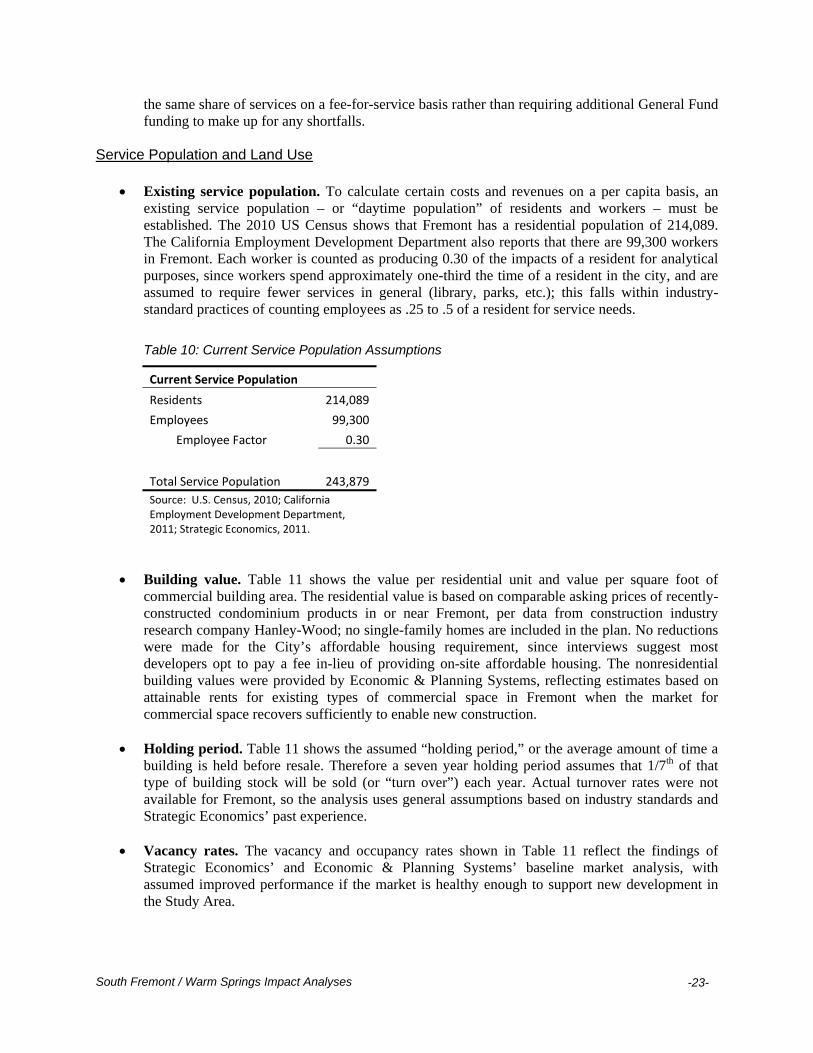
Existing service population. To calculate certain costs and revenues on a per capita basis, an existing service population – or “daytime population” of residents and workers – must be established. The 2010 US Census shows that Fremont has a residential population of 214,089. The California Employment Development Department also reports that there are 99,300 workers in Fremont. Each worker is counted as producing 0.30 of the impacts of a resident for analytical purposes, since workers spend approximately one-third the time of a resident in the city, and are assumed to require fewer services in general (library, parks, etc.); this falls within industry-standard practices of counting employees as .25 to .5 of a resident for service needs.
Table 10: Current Service Population Assumptions
Current Service Population
Residents 214,089
Employees 99,300
Employee Factor 0.30
Total Service Population 243,879
Source: U.S. Census, 2010; California Employment Development Department, 2011; Strategic Economics, 2011.
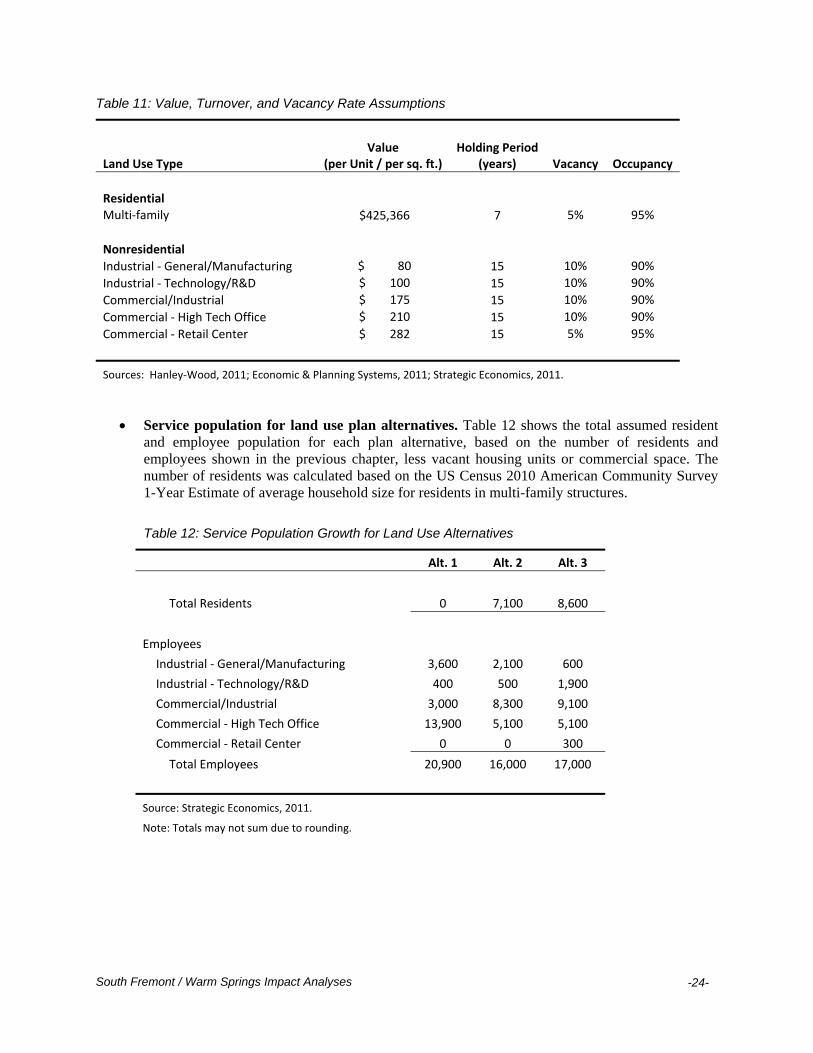
Building value. Table 11 shows the value per residential unit and value per square foot of commercial building area. The residential value is based on comparable asking prices of recently-constructed condominium products in or near Fremont, per data from construction industry research company Hanley-Wood; no single-family homes are included in the plan. No reductions were made for the City’s affordable housing requirement, since interviews suggest most developers opt to pay a fee in-lieu of providing on-site affordable housing. The nonresidential building values were provided by Economic & Planning Systems, reflecting estimates based on attainable rents for existing types of commercial space in Fremont when the market for commercial space recovers sufficiently to enable new construction.
Holding period. Table 11 shows the assumed “holding period,” or the average amount of time a
building is held before resale. Therefore a seven year holding period assumes that 1/7th of that type of building stock will be sold (or “turn over”) each year. Actual turnover rates were not available for Fremont, so the analysis uses general assumptions based on industry standards and Strategic Economics’ past experience.
Vacancy rates. The vacancy and occupancy rates shown in Table 11 reflect the findings of Strategic Economics’ and Economic & Planning Systems’ baseline market analysis, with assumed improved performance if the market is healthy enough to support new development in the Study Area.
South Fremont / Warm Springs Impact Analyses
-24-
Table 11: Value, Turnover, and Vacancy Rate Assumptions
Land Use Type Value
(per Unit / per sq. ft.) Holding Period
(years) Vacancy Occupancy
Residential Multi‐family $425,366 7 5% 95%
Nonresidential
Industrial ‐ General/Manufacturing $ 80 15 10% 90%
Industrial ‐ Technology/R&D $ 100 15 10% 90%
Commercial/Industrial $ 175 15 10% 90%
Commercial ‐ High Tech Office $ 210 15 10% 90%
Commercial ‐ Retail Center $ 282 15 5% 95%
Sources: Hanley‐Wood, 2011; Economic & Planning Systems, 2011; Strategic Economics, 2011.
Service population for land use plan alternatives. Table 12 shows the total assumed resident and employee population for each plan alternative, based on the number of residents and employees shown in the previous chapter, less vacant housing units or commercial space. The number of residents was calculated based on the US Census 2010 American Community Survey 1-Year Estimate of average household size for residents in multi-family structures.
Table 12: Service Population Growth for Land Use Alternatives
Alt. 1 Alt. 2 Alt. 3
Total Residents 0 7,100 8,600
Employees
Industrial ‐ General/Manufacturing 3,600 2,100 600
Industrial ‐ Technology/R&D 400 500 1,900
Commercial/Industrial 3,000 8,300 9,100
Commercial ‐ High Tech Office 13,900 5,100 5,100
Commercial ‐ Retail Center 0 0 300
Total Employees 20,900 16,000 17,000
Source: Strategic Economics, 2011.
Note: Totals may not sum due to rounding.
South Fremont / Warm Springs Impact Analyses
-25-
Estimating Revenues Property Tax
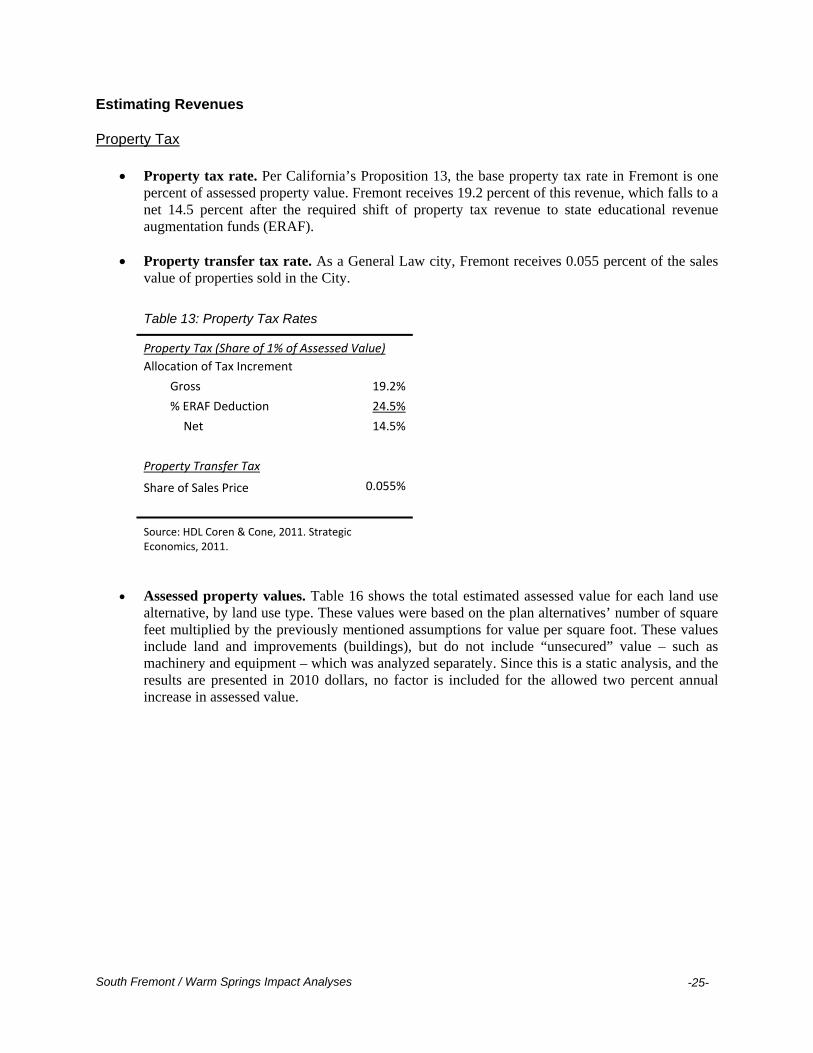
Property tax rate. Per California’s Proposition 13, the base property tax rate in Fremont is one percent of assessed property value. Fremont receives 19.2 percent of this revenue, which falls to a net 14.5 percent after the required shift of property tax revenue to state educational revenue augmentation funds (ERAF).
Property transfer tax rate. As a General Law city, Fremont receives 0.055 percent of the sales value of properties sold in the City.
Table 13: Property Tax Rates
Property Tax (Share of 1% of Assessed Value)
Allocation of Tax Increment
Gross 19.2%
% ERAF Deduction 24.5%
Net 14.5%
Property Transfer Tax
Share of Sales Price 0.055%
Source: HDL Coren & Cone, 2011. Strategic Economics, 2011.
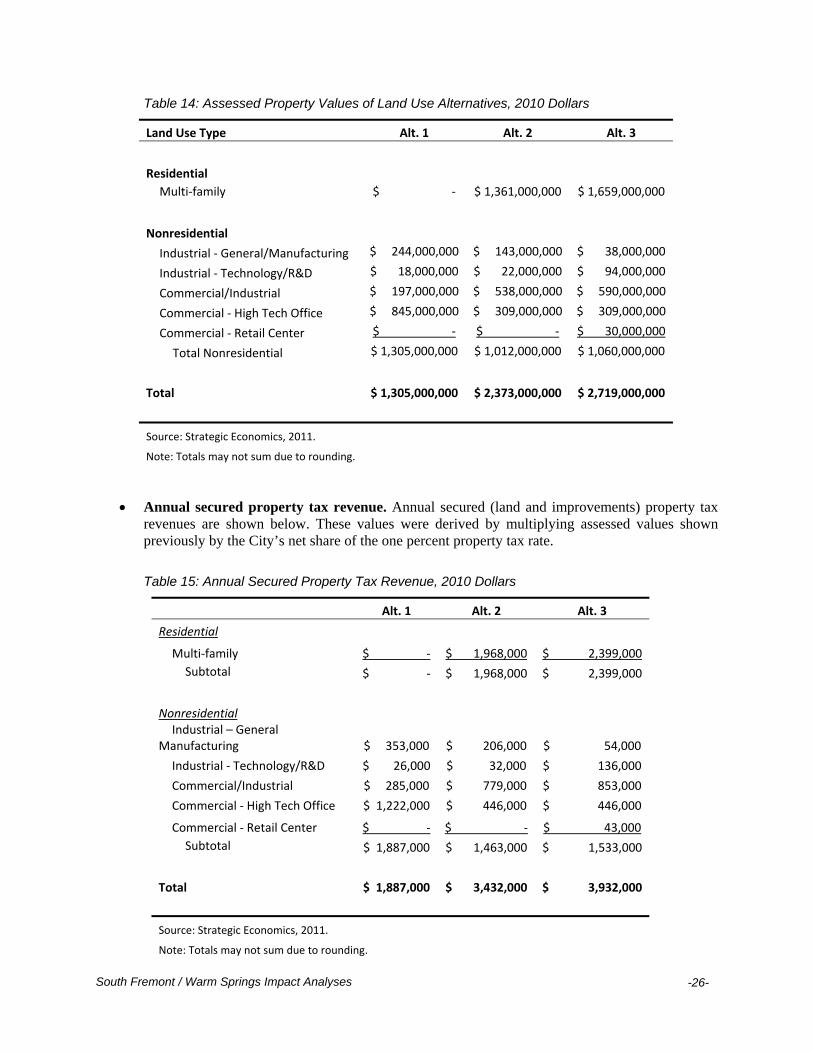
Assessed property values. Table 16 shows the total estimated assessed value for each land use alternative, by land use type. These values were based on the plan alternatives’ number of square feet multiplied by the previously mentioned assumptions for value per square foot. These values include land and improvements (buildings), but do not include “unsecured” value – such as machinery and equipment – which was analyzed separately. Since this is a static analysis, and the results are presented in 2010 dollars, no factor is included for the allowed two percent annual increase in assessed value.
South Fremont / Warm Springs Impact Analyses
-26-
Table 14: Assessed Property Values of Land Use Alternatives, 2010 Dollars
Land Use Type Alt. 1 Alt. 2 Alt. 3
Residential
Multi‐family $ ‐ $ 1,361,000,000 $ 1,659,000,000
Nonresidential
Industrial ‐ General/Manufacturing $ 244,000,000 $ 143,000,000 $ 38,000,000
Industrial ‐ Technology/R&D $ 18,000,000 $ 22,000,000 $ 94,000,000
Commercial/Industrial $ 197,000,000 $ 538,000,000 $ 590,000,000
Commercial ‐ High Tech Office $ 845,000,000 $ 309,000,000 $ 309,000,000
Commercial ‐ Retail Center $ ‐ $ ‐ $ 30,000,000
Total Nonresidential $ 1,305,000,000 $ 1,012,000,000 $ 1,060,000,000
Total $ 1,305,000,000 $ 2,373,000,000 $ 2,719,000,000
Source: Strategic Economics, 2011.
Note: Totals may not sum due to rounding.
Annual secured property tax revenue. Annual secured (land and improvements) property tax revenues are shown below. These values were derived by multiplying assessed values shown previously by the City’s net share of the one percent property tax rate.
Table 15: Annual Secured Property Tax Revenue, 2010 Dollars
Alt. 1 Alt. 2 Alt. 3
Residential
Multi‐family $ ‐ $ 1,968,000 $ 2,399,000
Subtotal $ ‐ $ 1,968,000 $ 2,399,000
Nonresidential Industrial – General
Manufacturing $ 353,000 $ 206,000 $ 54,000
Industrial ‐ Technology/R&D $ 26,000 $ 32,000 $ 136,000
Commercial/Industrial $ 285,000 $ 779,000 $ 853,000
Commercial ‐ High Tech Office $ 1,222,000 $ 446,000 $ 446,000
Commercial ‐ Retail Center $ ‐ $ ‐ $ 43,000
Subtotal $ 1,887,000 $ 1,463,000 $ 1,533,000
Total $ 1,887,000 $ 3,432,000 $ 3,932,000
Source: Strategic Economics, 2011.
Note: Totals may not sum due to rounding.
South Fremont / Warm Springs Impact Analyses
-27-
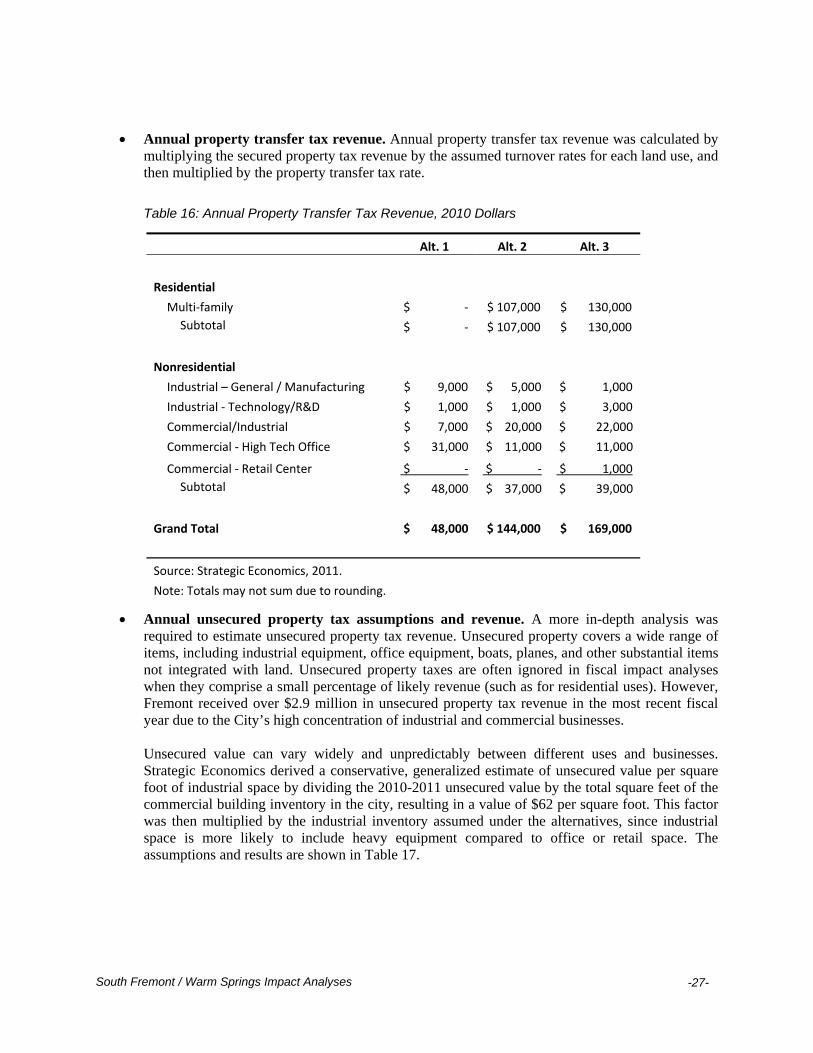
Annual property transfer tax revenue. Annual property transfer tax revenue was calculated by multiplying the secured property tax revenue by the assumed turnover rates for each land use, and then multiplied by the property transfer tax rate.
Table 16: Annual Property Transfer Tax Revenue, 2010 Dollars
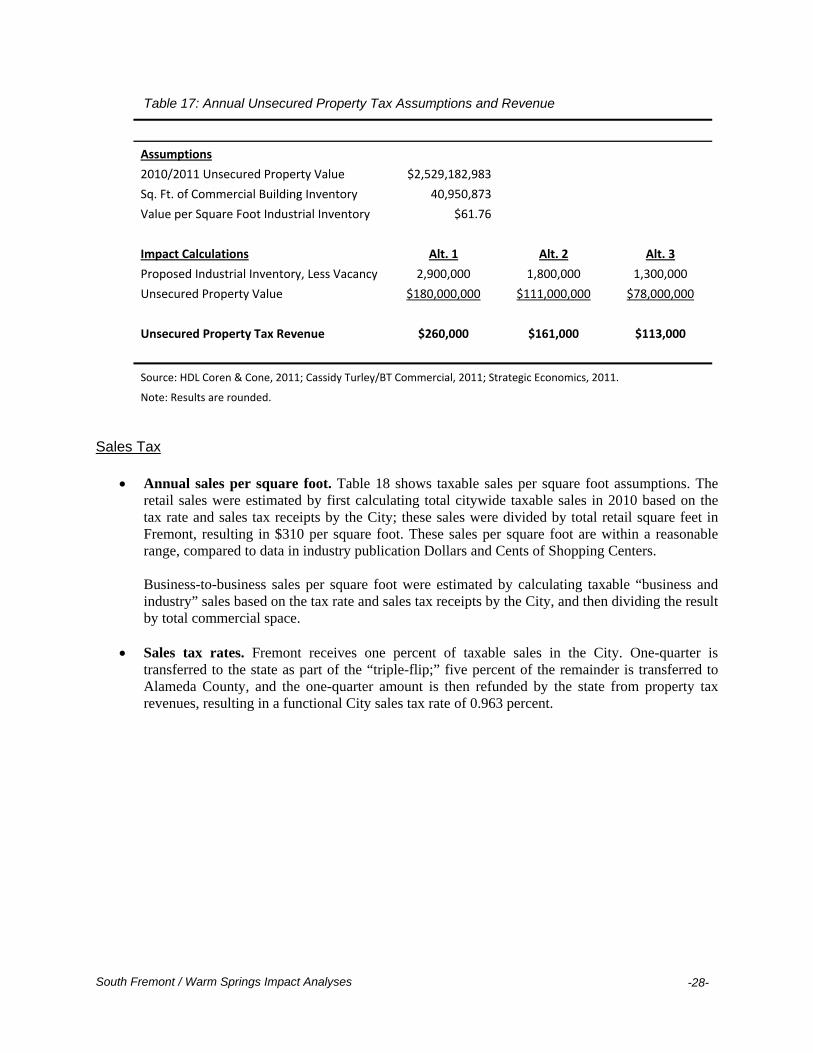
Annual unsecured property tax assumptions and revenue. A more in-depth analysis was required to estimate unsecured property tax revenue. Unsecured property covers a wide range of items, including industrial equipment, office equipment, boats, planes, and other substantial items not integrated with land. Unsecured property taxes are often ignored in fiscal impact analyses when they comprise a small percentage of likely revenue (such as for residential uses). However, Fremont received over $2.9 million in unsecured property tax revenue in the most recent fiscal year due to the City’s high concentration of industrial and commercial businesses. Unsecured value can vary widely and unpredictably between different uses and businesses. Strategic Economics derived a conservative, generalized estimate of unsecured value per square foot of industrial space by dividing the 2010-2011 unsecured value by the total square feet of the commercial building inventory in the city, resulting in a value of $62 per square foot. This factor was then multiplied by the industrial inventory assumed under the alternatives, since industrial space is more likely to include heavy equipment compared to office or retail space. The assumptions and results are shown in Table 17.
Alt. 1 Alt. 2 Alt. 3
Residential
Multi‐family $ ‐ $ 107,000 $ 130,000
Subtotal $ ‐ $ 107,000 $ 130,000
Nonresidential
Industrial – General / Manufacturing $ 9,000 $ 5,000 $ 1,000
Industrial ‐ Technology/R&D $ 1,000 $ 1,000 $ 3,000
Commercial/Industrial $ 7,000 $ 20,000 $ 22,000
Commercial ‐ High Tech Office $ 31,000 $ 11,000 $ 11,000
Commercial ‐ Retail Center $ ‐ $ ‐ $ 1,000
Subtotal $ 48,000 $ 37,000 $ 39,000
Grand Total $ 48,000 $ 144,000 $ 169,000
Source: Strategic Economics, 2011.
Note: Totals may not sum due to rounding.
South Fremont / Warm Springs Impact Analyses
-28-
Table 17: Annual Unsecured Property Tax Assumptions and Revenue
Assumptions
2010/2011 Unsecured Property Value $2,529,182,983
Sq. Ft. of Commercial Building Inventory 40,950,873
Value per Square Foot Industrial Inventory $61.76
Impact Calculations Alt. 1 Alt. 2 Alt. 3
Proposed Industrial Inventory, Less Vacancy 2,900,000 1,800,000 1,300,000
Unsecured Property Value $180,000,000 $111,000,000 $78,000,000
Unsecured Property Tax Revenue $260,000 $161,000 $113,000
Source: HDL Coren & Cone, 2011; Cassidy Turley/BT Commercial, 2011; Strategic Economics, 2011.
Note: Results are rounded.
Sales Tax
Annual sales per square foot. Table 18 shows taxable sales per square foot assumptions. The retail sales were estimated by first calculating total citywide taxable sales in 2010 based on the tax rate and sales tax receipts by the City; these sales were divided by total retail square feet in Fremont, resulting in $310 per square foot. These sales per square foot are within a reasonable range, compared to data in industry publication Dollars and Cents of Shopping Centers. Business-to-business sales per square foot were estimated by calculating taxable “business and industry” sales based on the tax rate and sales tax receipts by the City, and then dividing the result by total commercial space.
Sales tax rates. Fremont receives one percent of taxable sales in the City. One-quarter is transferred to the state as part of the “triple-flip;” five percent of the remainder is transferred to Alameda County, and the one-quarter amount is then refunded by the state from property tax revenues, resulting in a functional City sales tax rate of 0.963 percent.

South Fremont / Warm Springs Impact Analyses
-29-
Table 18: Taxable Sales per Square Foot and Tax Rates
Taxable Sales Sales per Square Foot
Retail $ 310.00
Business‐to‐Business $ 27.00
Tax Rates Percent of Taxable Sales
Base Tax Rate 1.000%
Triple‐Flip Transfer to State ‐0.250%
5% Transfer to Alameda County ‐0.038%
Triple‐Flip Property Tax Revenue 0.250%
Functional Sales Tax Rate 0.963%
Source: HDL Coren & Cone, 2011; Strategic Economics, 2011.
Annual sales tax revenue. Annual sales tax revenues for each alternative are shown below. They were calculated by multiplying the sales per square foot by the square feet of retail and industrial space in the alternatives, and subsequently multiplying that amount by the functional sales tax rate.
Table 19: Annual Sales Tax Revenue
Alt. 1 Alt. 2 Alt. 3
Retail $ ‐ $ ‐ $ 298,000
Business‐to‐Business $ 2,070,000 $ 1,617,000 $ 1,569,000
Total $ 2,070,000 $ 1,617,000 $ 1,867,000
Source: HDL Coren & Cone, 2011; Cassidy Turley / BT Commercial, 2011; Strategic Economics, 2011.
Vehicle License Fee
Per capita vehicle license fee assumptions. Each city in California has historically received an amount of vehicle license fee (VLF) revenue from the state based on the number of residents in the City. However, the future of the portion of VLF delivered on a per capita basis is in serious question after passage of California’s Senate Bill 89, which redirects funding to public safety programs. Given ongoing uncertainty, this analysis did not include any assumed revenue from the per capita component of VLF.
South Fremont / Warm Springs Impact Analyses
-30-
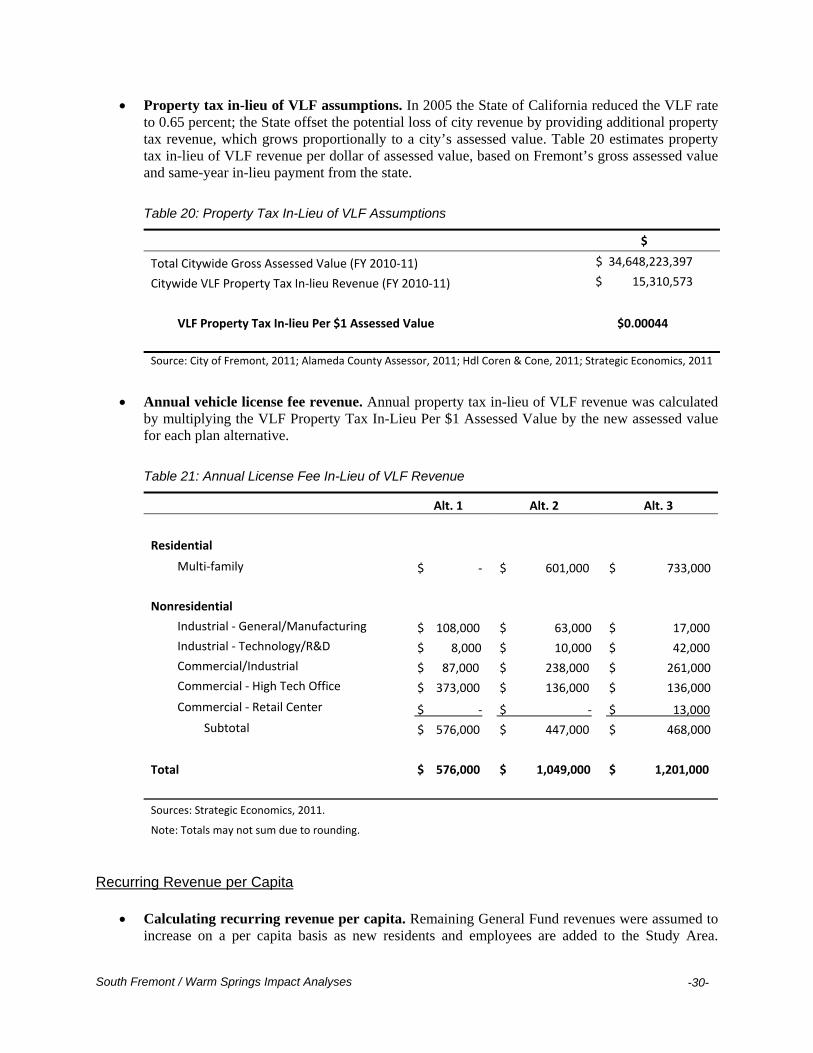
Property tax in-lieu of VLF assumptions. In 2005 the State of California reduced the VLF rate to 0.65 percent; the State offset the potential loss of city revenue by providing additional property tax revenue, which grows proportionally to a city’s assessed value. Table 20 estimates property tax in-lieu of VLF revenue per dollar of assessed value, based on Fremont’s gross assessed value and same-year in-lieu payment from the state.
Table 20: Property Tax In-Lieu of VLF Assumptions
$
Total Citywide Gross Assessed Value (FY 2010‐11) $ 34,648,223,397
Citywide VLF Property Tax In‐lieu Revenue (FY 2010‐11) $ 15,310,573
VLF Property Tax In‐lieu Per $1 Assessed Value $0.00044
Source: City of Fremont, 2011; Alameda County Assessor, 2011; Hdl Coren & Cone, 2011; Strategic Economics, 2011
Annual vehicle license fee revenue. Annual property tax in-lieu of VLF revenue was calculated by multiplying the VLF Property Tax In-Lieu Per $1 Assessed Value by the new assessed value for each plan alternative.
Table 21: Annual License Fee In-Lieu of VLF Revenue
Alt. 1 Alt. 2 Alt. 3
Residential
Multi‐family $ ‐ $ 601,000 $ 733,000
Nonresidential
Industrial ‐ General/Manufacturing $ 108,000 $ 63,000 $ 17,000
Industrial ‐ Technology/R&D $ 8,000 $ 10,000 $ 42,000
Commercial/Industrial $ 87,000 $ 238,000 $ 261,000
Commercial ‐ High Tech Office $ 373,000 $ 136,000 $ 136,000
Commercial ‐ Retail Center $ ‐ $ ‐ $ 13,000
Subtotal $ 576,000 $ 447,000 $ 468,000
Total $ 576,000 $ 1,049,000 $ 1,201,000
Sources: Strategic Economics, 2011.
Note: Totals may not sum due to rounding.
Recurring Revenue per Capita
Calculating recurring revenue per capita. Remaining General Fund revenues were assumed to increase on a per capita basis as new residents and employees are added to the Study Area.
South Fremont / Warm Springs Impact Analyses
-31-
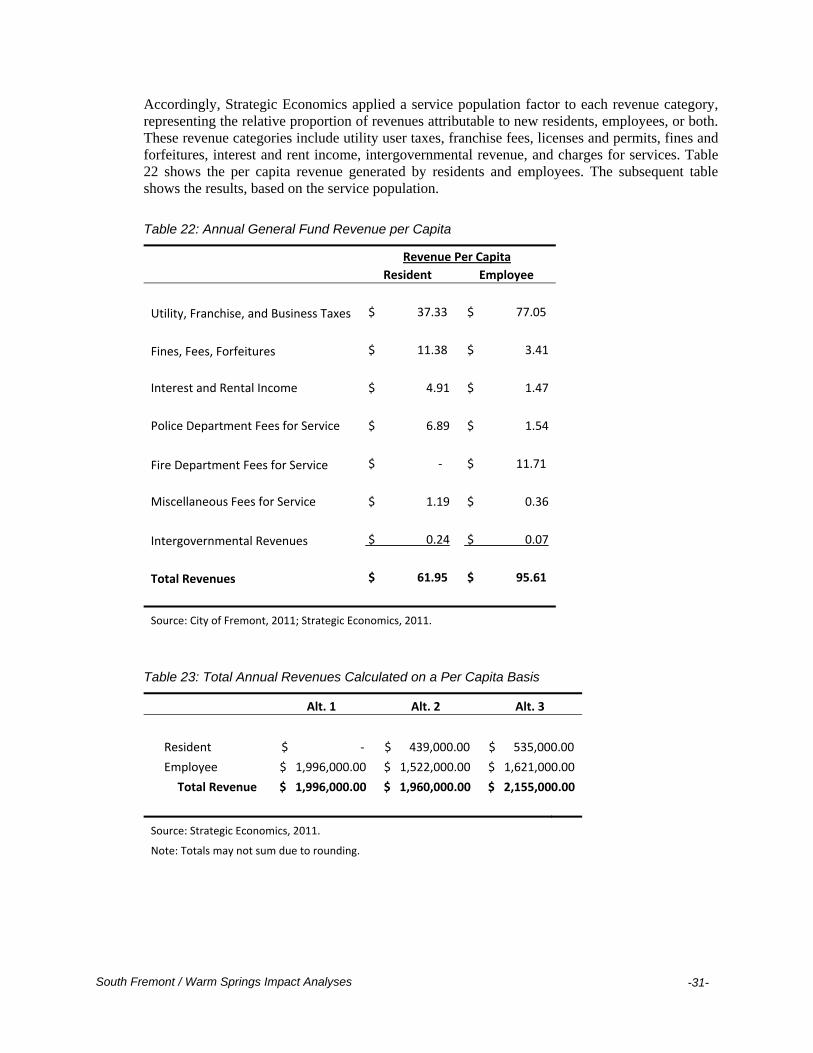
Accordingly, Strategic Economics applied a service population factor to each revenue category, representing the relative proportion of revenues attributable to new residents, employees, or both. These revenue categories include utility user taxes, franchise fees, licenses and permits, fines and forfeitures, interest and rent income, intergovernmental revenue, and charges for services. Table 22 shows the per capita revenue generated by residents and employees. The subsequent table shows the results, based on the service population.
Table 22: Annual General Fund Revenue per Capita
Revenue Per Capita
Resident Employee
Utility, Franchise, and Business Taxes $ 37.33 $ 77.05
Fines, Fees, Forfeitures $ 11.38 $ 3.41
Interest and Rental Income $ 4.91 $ 1.47
Police Department Fees for Service $ 6.89 $ 1.54
Fire Department Fees for Service $ ‐ $ 11.71
Miscellaneous Fees for Service $ 1.19 $ 0.36
Intergovernmental Revenues $ 0.24 $ 0.07
Total Revenues $ 61.95 $ 95.61
Source: City of Fremont, 2011; Strategic Economics, 2011.
Table 23: Total Annual Revenues Calculated on a Per Capita Basis
Alt. 1 Alt. 2 Alt. 3
Resident $ ‐ $ 439,000.00 $ 535,000.00
Employee $ 1,996,000.00 $ 1,522,000.00 $ 1,621,000.00
Total Revenue $ 1,996,000.00 $ 1,960,000.00 $ 2,155,000.00
Source: Strategic Economics, 2011.
Note: Totals may not sum due to rounding.

South Fremont / Warm Springs Impact Analyses
-32-
Estimating Expenses Overview Strategic Economics used a “case study” approach to estimate additional expenses incurred by growth under the plan alternatives for the Police Department, Fire Department, Public Works ongoing street maintenance, and Community Services maintenance of new parks and medians. Under the case study approach, Strategic Economics worked with City staff to estimate not just the incremental new expenses of development, but also any major one-time costs such as opening and staffing of a new police sub-station. Growth of other expenses, which individually comprise relatively small shares of the General Fund and are more likely to increase incrementally with population growth, were estimated on a per capita basis. Police Department Expenses Per the recommendation of Chief of Police Craig Steckler and other police staff, Strategic Economics estimated additional police expenses on the basis of maintaining funding per call for service. Calls for service are a common and useful means of estimating additional police department expenses.
Variable expense assumption. As shown in Table 24, Strategic Economics assumed that approximately 85 percent of the approximately $53,000,000 budget of the Police Department funded by the General Fund consists of variable costs likely to increase as calls increase. This percentage was based on the approximate amount of department expenses driven by salaries, benefits, and operating expenses.
Average cost per call assumption. The Police Department stated that approximately 75,000 calls for service are received annually. Based on the variable annual expenses, each call costs approximately $600.
Calls per capita assumption. Based on data received from the Police Department, Strategic Economics estimates approximately 0.14 calls per resident are received annually, and – using the assumption that each person employed in Fremont counts as approximately 0.30 of a resident for services – approximately 0.04 calls per employee are received.
Table 24: Police Department Cost Assumptions
Item Amount
Total General Fund Expenditures (FY 2009/10) $ 53,000,000
Estimated % Variable Costs 85%
Total Variable Costs $ 45,050,000
Annual Estimated Calls for Service 75,000
Average Cost per Call $ 600.67
Est. Annual Calls per Resident 0.14
Est. Annual Calls per Employee 0.04
Source: City of Fremont, 2011; Strategic Economics, 2011.
South Fremont / Warm Springs Impact Analyses
-33-
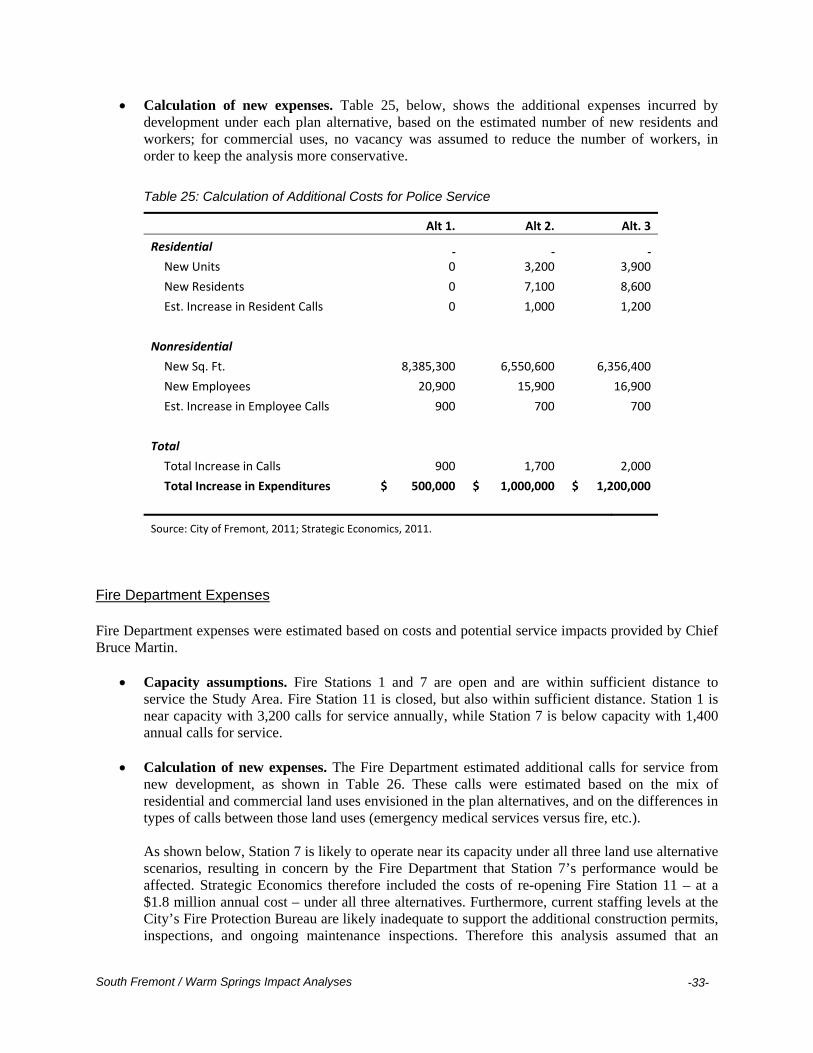
Calculation of new expenses. Table 25, below, shows the additional expenses incurred by development under each plan alternative, based on the estimated number of new residents and workers; for commercial uses, no vacancy was assumed to reduce the number of workers, in order to keep the analysis more conservative.
Table 25: Calculation of Additional Costs for Police Service
Alt 1. Alt 2. Alt. 3
Residential
New Units 0 3,200 3,900
New Residents 0 7,100 8,600
Est. Increase in Resident Calls 0 1,000 1,200
Nonresidential
New Sq. Ft. 8,385,300 6,550,600 6,356,400
New Employees 20,900 15,900 16,900
Est. Increase in Employee Calls 900 700 700
Total
Total Increase in Calls 900 1,700 2,000
Total Increase in Expenditures $ 500,000 $ 1,000,000 $ 1,200,000
Source: City of Fremont, 2011; Strategic Economics, 2011. Fire Department Expenses Fire Department expenses were estimated based on costs and potential service impacts provided by Chief Bruce Martin.
Capacity assumptions. Fire Stations 1 and 7 are open and are within sufficient distance to service the Study Area. Fire Station 11 is closed, but also within sufficient distance. Station 1 is near capacity with 3,200 calls for service annually, while Station 7 is below capacity with 1,400 annual calls for service.
Calculation of new expenses. The Fire Department estimated additional calls for service from new development, as shown in Table 26. These calls were estimated based on the mix of residential and commercial land uses envisioned in the plan alternatives, and on the differences in types of calls between those land uses (emergency medical services versus fire, etc.). As shown below, Station 7 is likely to operate near its capacity under all three land use alternative scenarios, resulting in concern by the Fire Department that Station 7’s performance would be affected. Strategic Economics therefore included the costs of re-opening Fire Station 11 – at a $1.8 million annual cost – under all three alternatives. Furthermore, current staffing levels at the City’s Fire Protection Bureau are likely inadequate to support the additional construction permits, inspections, and ongoing maintenance inspections. Therefore this analysis assumed that an

South Fremont / Warm Springs Impact Analyses
-34-
additional CEO II position will be required, at a maximum cost of $170,450 for benefits and salary. The re-opening of Station 11 and addition of a CEO II position assume a worst case scenario under which even a small amount of development beyond the Study Area, in addition to Study Area growth, will require these additional expenses. Therefore not all of these expenses will be directly driven by development within the Study Area, but the expenses are nevertheless included in this analysis since the vast majority are attributable to growth under the plan alternatives.
Table 26: Fire Department Annual General Fund Costs Assumptions and Results
Assumptions
Cost to Re‐Open Station 11 $1,800,000
Cost to Add CEO II Position (.5 to 1.0) $85,225 to $170,450
Max Station Capacity Calls for Service 3,200
Station 1 Annual Calls for Service 3,200
Station 7 Annual Calls for Service 1,400
Calculation of Results Alt. 1 Alt. 2 Alt. 3
Estimated Additional Calls for Service 1,391 1,508 1,674
Station 7 Total Calls for Service 2,791 2,908 3,074
Additional CEO II Position $ 170,450 $ 170,450 $ 170,450
Re‐Open Station 11, if Applicable $1,800,000 $1,800,000 $1,800,000
Total Fire Department Costs $2,000,000 $2,000,000 $2,000,000
Source: City of Fremont, 2011; Strategic Economics, 2011.
Note: Results are rounded.
Street Maintenance Expenses (Public Works Department) The three land use plan alternatives will require additional streets and related infrastructure improvements. The Public Works Department’s responsibilities include general street maintenance, with a portion of these maintenance costs funded by the General Fund. Additional street maintenance costs to the General Fund were calculated on the basis of costs for additional lane-miles required by the plan alternatives. Note that these costs do not include major capital improvement projects, which are funded outside the General Fund.
Cost per lane-mile. As shown in Table 27, there are currently approximately 1,100 lane-miles in Fremont, and General Fund street maintenance costs were nearly $4 million in fiscal year 2010-2011. Therefore, the General Fund allocation per lane-mile was approximately $3,600.
The majority of street maintenance funding is not provided by the City’s general fund, but comes from state gas tax and Measure B sales tax revenue. Therefore, in addition to the general fund allocation, the City on average spends approximately $4.2 million per year on pavement maintenance. Even with these sources, the revenue is far short of the $38 million per year estimated to be needed over the next 10 years to bring City streets to a state of good repair.

South Fremont / Warm Springs Impact Analyses
-35-
Although the increase in population and lane miles resulting from the build out of these alternatives would provide the City with some increase in gas tax revenue, as the new streets age, the new revenue will not fully offset the additional street maintenance costs. Therefore, over time, the City will have slightly more deferred street maintenance with each these alternatives.
Calculation of new expenses. Fehr & Peers and BKF Engineering estimated the additional lane-miles of streets required for each plan alternative; these lane-miles were multiplied by annual lane-mile maintenance expenses to determine additional annual expenses, shown below.
Table 27: Street Maintenance Cost Assumptions and Results
Assumptions
Current Lane‐Miles in City 1,100
Total Street Maintenance Cost, All Sources $3,992,019
Street Maintenance Cost per Lane Mile $3,629.11
Impact Calculations Alt. 1 Alt. 2 Alt. 3
Street Maintenance
Additional Lane Miles in Alternative 8.55 8.55 8.55
Additional Street Maintenance Cost $31,000 $31,000 $31,000
Source: City of Fremont, 2011; Fehr & Peers, 2011; BKF Engineering, 2011; Strategic Economics, 2011.
Parks and Medians Maintenance Expenses (Community Services Department) The Community Services Department is responsible for maintenance of Fremont’s parks and street medians. Annual maintenance costs by type/size of park were provided by the Community Services Department, while median maintenance costs were estimated based on the cost of annual maintenance per center-lane miles of streets since the exact acreage of medians is currently unknown.
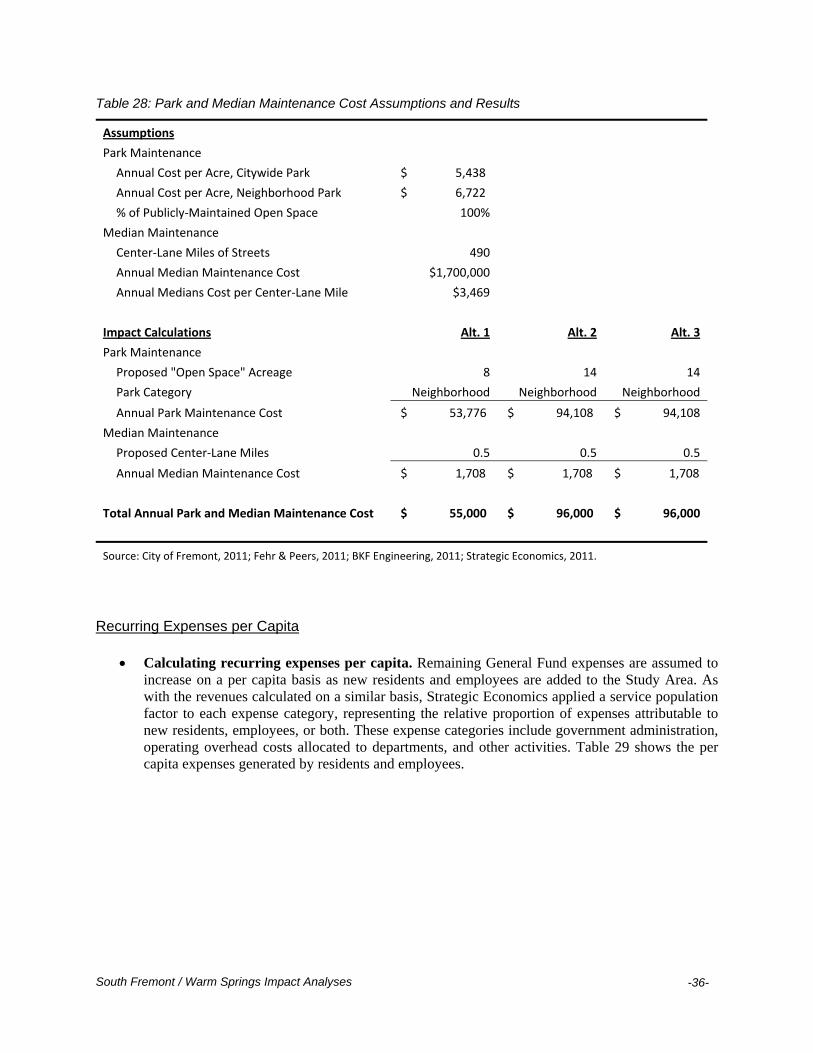
Park maintenance cost per acre. Table 28 shows park maintenance costs provided by the Community Services Department. A “Citywide Park” is twenty or more acres, while a “Neighborhood Park” is between five and twenty acres.
Median cost per center-lane mile. According to the Public Works Department, there are approximately 490 center-lane miles of streets in Fremont. The center-lane miles were used as an average proxy for the amount of medians in Fremont. Annual median maintenance funding per center-lane mile were estimated to be approximately $3,500 annually, given the $1,700,000 annual median maintenance funding provided by the Public Works Department. This data was provided by the Public Works Department because median maintenance responsibilities were only recently transferred to the Community Services Department.
Calculation of costs. Table 28 shows additional costs for park and median maintenance based on development under the plan alternatives. The “Neighborhood Park” maintenance costs per acre were applied since eight or fourteen acres of parkland are included in the alternatives.
South Fremont / Warm Springs Impact Analyses
-36-
Table 28: Park and Median Maintenance Cost Assumptions and Results
Assumptions
Park Maintenance
Annual Cost per Acre, Citywide Park $ 5,438
Annual Cost per Acre, Neighborhood Park $ 6,722
% of Publicly‐Maintained Open Space 100%
Median Maintenance
Center‐Lane Miles of Streets 490
Annual Median Maintenance Cost $1,700,000
Annual Medians Cost per Center‐Lane Mile $3,469
Impact Calculations Alt. 1 Alt. 2 Alt. 3
Park Maintenance
Proposed "Open Space" Acreage 8 14 14
Park Category Neighborhood Neighborhood Neighborhood
Annual Park Maintenance Cost $ 53,776 $ 94,108 $ 94,108
Median Maintenance
Proposed Center‐Lane Miles 0.5 0.5 0.5
Annual Median Maintenance Cost $ 1,708 $ 1,708 $ 1,708
Total Annual Park and Median Maintenance Cost $ 55,000 $ 96,000 $ 96,000
Source: City of Fremont, 2011; Fehr & Peers, 2011; BKF Engineering, 2011; Strategic Economics, 2011.
Recurring Expenses per Capita
Calculating recurring expenses per capita. Remaining General Fund expenses are assumed to increase on a per capita basis as new residents and employees are added to the Study Area. As with the revenues calculated on a similar basis, Strategic Economics applied a service population factor to each expense category, representing the relative proportion of expenses attributable to new residents, employees, or both. These expense categories include government administration, operating overhead costs allocated to departments, and other activities. Table 29 shows the per capita expenses generated by residents and employees.

South Fremont / Warm Springs Impact Analyses
-37-
Table 29: Annual General Fund Cost per Capita
Expenditures Per Capita
Resident Employee
General Government $ 41.41 $ 12.42
Community Preservation $ 2.87 $ 0.86
Public Works $ 37.76 $ 11.33
Non‐Departmental $ 12.71 $ 3.81
Transfers Out & Cost Center Allocations $ 60.14 $ 18.04
Total Expenditures $ 154.89 $ 46.47
Source: City of Fremont, 2011; Strategic Economics, 2011.
Note: Does not include costs analyzed in departmental case studies
Costs. Table 30 summarizes additional costs calculated on a per capita basis for growth under each alternative.
Table 30: Total Costs Calculated on a per Capita Basis
Alt. 1 Alt. 2 Alt. 3
Costs
Resident $ ‐ $ 1,097,000 $ 1,337,000
Employee $ 970,000 $ 740,000 $ 788,000
Total Cost $ 970,000 $ 1,837,000 $ 2,125,000
Source: Strategic Economics, 2011.
Note: Totals may not sum due to rounding.
Analysis Findings
Alternative 3 is estimated to provide the greatest potential net revenue to the General Fund. Table 31 summarizes the results of the analysis. As shown, Alternative 3 indicates the greatest potential for annual net revenue to the General Fund.
Alternative 1 is estimated to provide the highest ratio of revenue to costs. While Alternative 1 does not indicate the greatest amount of revenue to the General Fund, it is shown to provide the highest amount of revenue relative to expenses.

South Fremont / Warm Springs Impact Analyses
-38-
Property taxes comprise the largest revenue source for all alternatives. Property taxes are the largest General Fund revenue sources for all three alternatives. Furthermore, property taxes, vehicle license fee revenue, and property transfer tax are all driven by the increased assessed values under the plan alternatives; together they comprise the majority of revenues gained under Alternatives 2 and 3. In contrast, sales tax revenues under Alternative 1 are a relatively high share of revenue due to the likely business-to-business transactions occurring in that scenario.
Public safety drives the greatest costs for all plan alternatives. Police and fire services comprise the majority of new General Fund costs under all three alternatives; this finding appears reasonable given that public safety services comprise over sixty percent of existing General Fund expenditures and transfers out. To remain conservative in light of service capacity limitations, the analysis assumes that the Fire Department will require operation of an additional fire station due to growth under the plan alternatives. However, it may be possible to service growth without the additional station.
Table 31: Summary of General Fund Revenues and Costs
Alternative 1 Alternative 2 Alternative 3
Revenue
Property Tax $ 2,150,000 $ 3,590,000 $ 4,050,000
Property Transfer Tax $ 50,000 $ 140,000 $ 170,000
Sales Tax $ 2,070,000 $ 1,620,000 $ 1,870,000
Vehicle License Fee $ 580,000 $ 1,050,000 $ 1,200,000
Per Capita Revenue $ 2,000,000 $ 1,960,000 $ 2,160,000
Subtotal $ 6,840,000 $ 8,360,000 $ 9,440,000
Costs
Police Cost $ 540,000 $ 1,020,000 $ 1,180,000
Fire Cost $ 1,970,000 $ 1,970,000 $ 1,970,000
Street Maintenance Cost $ 30,000 $ 30,000 $ 30,000
Parks and Medians Cost $ 60,000 $ 100,000 $ 100,000
Per Capita Cost $ 970,000 $ 1,840,000 $ 2,120,000
Subtotal $ 3,570,000 $ 4,950,000 $ 5,400,000
Net Revenue $ 3,270,000 $ 3,410,000 $ 4,040,000
Net Revenue as % of 48% 41% 43%
Total Revenue
Source: Strategic Economics, 2011.
South Fremont / Warm Springs Impact Analyses -39-
ALTERNATIVE LAND VALUE SCENARIO Strategic Economics performed the fiscal impact analysis using commercial property values – provided by Economic & Planning Systems – which reflect likely future prices which will enable new construction of land uses similar to those currently located in the South Fremont / Warm Springs area. However, Economic & Planning Systems also provided alternative, higher values which reflect the value of new, innovation-based land uses sought after under the land use alternatives created by Perkins + Will (see separate memorandum by Economic & Planning Systems for more detail). Strategic Economics performed analysis based on the lower range of those values (the “Partial Implementation” scenario), and the findings are presented here. Property value. The baseline and updated (“alternative”) value assumptions are shown below, based on value per residential unit (unchanged) or value per square foot of commercial building area.
Table 32: Baseline and Alternative Values
Land Use Type Value
(per Unit / per sq. ft.)
Baseline Alternative
Residential Multi‐family $ 425,366 $ 425,366
Nonresidential
Industrial ‐ General/Manufacturing $ 80 $ 170
Industrial ‐ Technology/R&D $ 100 $ 260
Commercial/Industrial ‐ High Tech Office/R&D $ 175 $ 430
Commercial ‐ High Tech Office $ 210 $ 400
Commercial ‐ Retail Center $ 282 $ 282
Sources: Hanley‐Wood, 2011; Economic & Planning Systems, 2011; Strategic Economics, 2011.
Assessed property value. The updated assessed values are shown below. Aside from land value, all other assumptions from the primary analysis were held constant.

South Fremont / Warm Springs Impact Analyses
-40-
Table 33: Assessed Property Values of Land Use Alternatives, Under Higher Land Values
Land Use Type Alt. 1 Alt. 2 Alt. 3
Residential
Multi‐family $ ‐ $ 1,361,000,000 $ 1,659,000,000
Nonresidential
Industrial ‐ General/Manufacturing $ 519,000,000 $ 303,000,000 $ 80,000,000
Industrial ‐ Technology/R&D $ 47,000,000 $ 57,000,000 $ 245,000,000
Commercial/Industrial ‐ High Tech Office/R&D Blend
$ 484,000,000 $ 1,323,000,000 $ 1,449,000,000
Commercial ‐ High Tech Office $ 1,610,000,000 $ 588,000,000 $ 588,000,000
Commercial ‐ Retail Center $ ‐ $ ‐ $ 30,000,000
Total Nonresidential $ 2,660,000,000 $ 2,272,000,000 $ 2,391,000,000
Total $ 2,660,000,000 $ 3,633,000,000 $ 4,050,000,000
Source: Strategic Economics, 2011.
Note: Totals may not sum due to rounding.
Property tax revenue. The higher assessed values drive increased secured property tax revenue, as shown below.
Table 34: Annual Secured Property Tax Revenue Under Higher Land Values
Alt. 1 Alt. 2 Alt. 3
Residential
Multi‐family $ ‐ $ 1,968,000 $ 2,399,000
Subtotal $ ‐ $ 1,968,000 $ 2,399,000
Nonresidential Industrial ‐
General/Manufacturing $ 751,000 $ 438,000 $ 116,000
Industrial ‐ Technology/R&D $ 68,000 $ 83,000 $ 354,000
Commercial/Industrial $ 700,000 $ 1,913,000 $ 2,096,000
Commercial ‐ High Tech Office $ 2,328,000 $ 850,000 $ 850,000
Commercial ‐ Retail Center $ ‐ $ ‐ $ 43,000
Subtotal $ 3,847,000 $ 3,285,000 $ 3,458,000
Total $ 3,847,000 $ 5,253,000 $ 5,857,000
Source: Strategic Economics, 2011.
Note: Totals may not sum due to rounding.

South Fremont / Warm Springs Impact Analyses
-41-
Findings. Given that property taxes already comprised the greatest source of revenue under the land use alternatives, it is unsurprising that increased assessed values drive significantly more positive impacts to the General Fund, as summarized below.
Table 35: Summary of General Fund Revenues and Costs Under Higher Land Value Scenario
Alternative 1 Alternative 2 Alternative 3
Revenue
Property Tax $ 4,110,000 $ 5,410,000 $ 5,970,000
Property Transfer Tax $ 100,000 $ 190,000 $ 220,000
Sales Tax $ 2,070,000 $ 1,620,000 $ 1,870,000
Vehicle License Fee $ 1,180,000 $ 1,610,000 $ 1,790,000
Per Capita Revenue $ 2,000,000 $ 1,960,000 $ 2,160,000
Subtotal $ 9,450,000 $ 10,790,000 $ 12,000,000
Costs
Police Cost $ 540,000 $ 1,020,000 $ 1,180,000
Fire Cost $ 1,970,000 $ 1,970,000 $ 1,970,000
Street Maintenance Cost $ 30,000 $ 30,000 $ 30,000
Parks and Medians Cost $ 60,000 $ 100,000 $ 100,000
Per Capita Cost $ 970,000 $ 1,840,000 $ 2,120,000
Subtotal $ 3,570,000 $ 4,950,000 $ 5,400,000
Net Revenue $ 5,880,000 $ 5,830,000 $ 6,600,000
Net Revenue as % of 62% 54% 55%
Total Revenue
Source: Strategic Economics, 2011.

South Fremont / Warm Springs Impact Analyses
-42-
A new development project or expanding industry creates economic impacts beyond the jobs and income that are directly generated by any given project or employer. This chapter provides an estimate of the potential regional economic impacts associated with each of the three land use alternatives, including a profile of the types of employment that the Study Area could potentially attract under the different scenarios. Like the rest of this report, the economic impact analysis focuses on the opportunity sites identified in the land use alternatives (see Figure 1). For the sake of context this chapter also includes a brief discussion of the economic impact of the site of the former NUMMI plant. The first section of the chapter discusses the conceptual framework of an economic impact analysis, including the overall approach and assumptions underlying this analysis. The second section provides a profile of the types of jobs, by industry and occupation, which the Study Area could potentially attract under each of the three alternatives. Next, the chapter describes the potential economic impacts of the employment and residential uses, respectively, that are envisioned for the Study Area in the different land use alternatives. Finally, the chapter concludes with a comparison of the total estimated economic impacts of the three alternatives.
UNDERSTANDING ECONOMIC IMPACT ANALYSIS A dollar spent constructing a new building or purchasing a piece of equipment ripples through the economy as the construction company or manufacturer pays their suppliers and workers – who in turn (in the case of suppliers) pay their workers and purchase inputs, or (in the case of workers) purchase household goods and services. In general, these ripple effects fall into three categories:
Direct effects are the initial changes in employment, earnings,2 and output3 generated by the industry, firm, or project under study. In this analysis, direct effects are those generated by the businesses that might locate in the Study Area. For example, if a new manufacturer opens in the Study Area, the direct effects would include the jobs at the plant, the earnings paid to workers, and the net increase in economic output.
Indirect effects occur in industries that provide inputs or respond to the demand generated by the industry, firm, or project under study. In the example of a new manufacturer, the indirect effects would be generated as other manufacturers increase production to supply the new plant with inputs.
Induced effects result from households spending the income they earn, whether as a result of the direct effects associated with the initial changes in economic activity, or the indirect effects on different employers throughout the supply chain. In the example of the manufacturer, induced effects would be generated both by the spending of the employees who work at the new Study Area plant, and by additional household spending that occurs if the suppliers across the region hire new workers or increase wages in order to keep up with the increased demand.
2 RIMS II defines earnings to include wages and salaries, proprietors’ income, directors’ fees, and employer contributions for health insurance, less personal contributions for social insurance. Accordingly, throughout this report “earnings” includes wages and benefits, unless otherwise noted. 3 “Output” is the total value of sales within the economy generated by additional demand, including intermediate sales between suppliers, manufacturers, and wholesalers.
V. ECONOMIC IMPACT ANALYSIS ASSUMPTIONS
AND APPROACH

South Fremont / Warm Springs Impact Analyses
-43-
Total economic impact is calculated as the sum of direct, indirect, and induced effects. In this report, economic impacts are reported in terms of employment, earnings and output effects on the nine-county Bay Area region4 – that is, the overall change in jobs, aggregate earnings, and output (i.e. sales) throughout the Bay Area associated with the economic activity envisioned in each of the three land use alternatives.
Overall Approach The Land Use Alternatives section identifies six land use categories, and estimates the number of jobs or housing units associated with each land use category for the three different alternatives (Table 36). Based on these basic estimates, Strategic Economics conducted a series of analytical steps – each of which is described in greater detail in the following sections – to estimate the economic impacts of the employment and residential uses:
Creating a profile of the types of industries likely to locate in the Study Area, and the occupations and compensation levels of workers who would be employed in those industries. This analysis provides information on the types of jobs that each land use alternative could potentially attract to the Study Area, as well as estimates of total jobs and aggregate earnings that are considered the “direct effect” of the employment uses.
Applying multipliers to calculate the indirect and induced effects of the employment uses. Multipliers are ratios that capture how changes in one industry generate indirect and induced effects in other industries throughout a region. This analysis relies on industry-specific multipliers for the nine-county Bay Area, produced by the U.S. Bureau of Economic Analysis (BEA) using an economic model known as the Regional Input-Output Modeling System, or RIMS II.5
Estimating the aggregate spending by residents of the new housing units envisioned in Alternatives 2 and 3. (Alternative 1 does not include any housing units.) These aggregate expenditures are considered the direct effect of the residential development planned for the Study Area.
Applying RIMS II multipliers to calculate the total economic impact of the new housing units.
4 The counties are Alameda, Contra Costa, Marin, Napa, San Francisco, San Mateo, Santa Clara, Solano, and Sonoma. 5 RIMS II multipliers (benchmark series) produced by the Regional Product Division of the Bureau of Economic Analysis on 10/12/2011 for the San Jose-San Francisco-Oakland, CA Combined Statistical Area.

South Fremont / Warm Springs Impact Analyses
-44-
Table 36: Residential and Commercial Land Use Assumptions
Square Feet/Residential Units
Proposed Land Use Categories Alt. 1 Alt. 2 Alt. 3
Residential
Multi‐Family Residential 0 3,200 3,900
Commercial
Industrial ‐ General/Manufacturing 3,055,000 1,783,000 471,000
Industrial ‐ Technology/R&D 180,000 220,000 941,000
Commercial/Industrial ‐ High Tech Office/R&D Blend 1,126,000 3,077,000 3,370,000
Commercial ‐ High Tech Office 4,024,000 1,470,000 1,470,000
Commercial ‐ Retail Center 0 0 105,000
Total 8,385,000 6,551,000 6,356,000
Source: Perkins + Will, 2011; Strategic Economics, 2011.
Note: Totals may not sum due to rounding.
Overarching Assumptions Like any economic model, this analysis rests on a series of assumptions about the economic behavior of firms and households. In addition, the analysis makes assumptions about the type of uses that will eventually locate in the Study Area. The most important of these assumptions include:
Full Build-Out: The analysis assumes that the land use alternatives are fully built out as anticipated, and results are assumed to be generated by the ongoing operations at the facilities within the Study Area. In order for full build-out to occur, there would have to be sufficient demand for the types of land uses envisioned for the Study Area under each alternative. Development is assumed to be financially feasible.
Regional Impacts: This analysis assesses economic impacts to the nine-county Bay Area region and provides limited information on the share of activity that would be captured within the City of Fremont. Economic impacts are generally measured at higher geographic levels because capital flows and employee commutes create a regional economy with linkages crossing city boundaries.
No Competitive Effects/Off-Setting Activities: The analysis assumes that the industries and households that locate in the Study Area would not otherwise have located in the region, and that the new users generate economic activity that would not otherwise have occurred. For example, any new retail that locates in the Study Area is assumed to generate new sales, rather than to draw shoppers away from existing retail – which would offset the economic impact of the new store. In addition, by considering the impact of new households and industries separately, the analysis implicitly assumes that none of the residents who will occupy the new housing units located in the Study Area will also work in the Study Area.
Industries, Employment, and Households: For the purposes of this analysis, Strategic Economics used the basic jobs and household metrics developed for the land use alternatives (Table 36) to create a profile of the types of households and firms likely to locate in the Study Area, the number of workers that the firms would employ, and the compensation the workers would receive. Unlike the fiscal impact analysis, this analysis estimates maximum impact by not reducing the number of workers by vacancy rate assumptions. The estimates of economic output
South Fremont / Warm Springs Impact Analyses
-45-
– the total value of the project to the local economy – are derived from these assumptions around employment and earnings. This methodology is described in detail below.
Annual Impacts: Results are given in annual terms and in 2010 dollars.6
EMPLOYMENT AND OCCUPATION ANALYSIS This section describes the methodology used to compose the employment profile for each alternative, the underlying assumptions, and the results. The Land Use Alternatives identify five employment land use categories, and estimate the number of jobs associated with each land use category in each alternative (Table 36). However, the alternatives do not anticipate which specific industries would locate in the Study Area. For the purpose of comparing the jobs and earnings associated with the three different alternatives, Strategic Economics created a profile of the types of businesses and workers that could potentially – assuming the alternatives were fully built out as expected – locate in the Study Area under each land use alternative. The results of this analysis form the basis for the employment portion of the economic impact analysis.
Approach In order to create a profile of the industries and occupations potentially associated with each land use, Strategic Economics allocated the employment that each land use category could potentially generate among specific industries, and linked each industry with occupations and wages. The analysis consisted of three steps: matching land use categories with industry sectors; matching industry sectors with occupations; and matching occupations and industries with data on wages and benefits. Step 1. Matching Land Use Categories with Industry Sectors As a first step, Strategic Economics matched the five employment land use categories to specific industry sectors, and distributed employment among those sectors for each alternative. The industry sectors are based on a comprehensive report on industrial land uses prepared for the City of Fremont in 2008, which identified clusters of industries that generated most of the growth in Fremont’s economy.7 The allocation process was further informed by the market analysis performed during the development of the land use alternatives. Based on these inputs, the industry sectors for this analysis were defined as follows:
Heavy Industrial: Traditional manufacturing industries, such as machine shops, plastics manufacturing, cement and concrete manufacturing, etc.; waste disposal and recycling.
Technology-Related Industrial: Medical equipment, pharmaceutical, and computer/communications-related manufacturing.
Distribution & Logistics: Transportation, warehousing, and wholesaling.
Research & Development: Scientific R&D services, medical laboratories; management, scientific, and technical consulting services.
6 RIMS II is a “static equilibrium” model, meaning that the model assumes that supply and demand are balanced and that economic variables will change only as a result of the impacts associated with the project under study. The model does not account for any exogenous factors such as technological innovation or fluctuations in labor or supply costs. As such, the impacts have no specific time dimension. However, the model is based on annual data, so it is conventional to assume that the economic impacts occur in one year (or, in the case of ongoing economic activity, occur annually). 7 Economic & Planning Systems, Inc., Industrial Lane Use Analysis for the City of Fremont General Plan Update, prepared for the City of Fremont in association with ICF International, April 2008.

South Fremont / Warm Springs Impact Analyses
-46-
High-Tech Office: Computer systems design; architecture, engineering, and related services; data processing; communications.
Retail: Neighborhood and convenience retail, restaurants, and personal services. These industry sectors are intended to be representative of the type of businesses most likely to locate in the Study Area if the alternatives were built out as planned.
Table 37: Proposed Land Use Alternatives: Employment by Industry Sector
Jobs
Proposed Land Use Categories/Industry Sector % of Employment Alt. 1 Alt. 2 Alt. 3
Industrial ‐ General/Manufacturing
Heavy Industrial 75% 3,000 1,800 500
Distribution & Logistics 25% 1,000 600 200
Total 100% 4,000 2,300 600
Industrial ‐ Technology/R&D
Technology‐Related Industrial 45% 200 200 1,000
Research & Development 45% 200 200 1,000
Distribution & Logistics 10% 0 100 200
Total 100% 400 500 2,200
Commercial/Industrial ‐ High Tech Office/R&D Blend
High‐Tech Office 40% 1,300 3,700 4,000
Research & Development 40% 1,300 3,700 4,000
Technology‐Related Industrial 10% 300 900 1,000
Distribution & Logistics 10% 300 900 1,000
Total 100% 3,400 9,200 10,100
Commercial ‐ High Tech Office
High‐Tech Office 100% 15,400 5,600 5,600
Commercial ‐ Retail Center
Retail 50% 0 0 200
Restaurants 25% 0 0 100
Personal Services 25% 0 0 100
Total 100% 0 0 300
Total (All Land Use Categories) 23,200 17,700 18,800
Source: Strategic Economics, 2011. Note: Totals may not sum due to rounding.
Step 2. Matching Industry Sectors with Occupations Next, Strategic Economics linked the industries that compose each sector to occupations, based on national survey data from the U.S. Bureau of Labor Statistics (BLS) on the distribution of occupations employed in each industry.8 For example, the top occupations employed by metalworking machinery 8 Source: U.S. Bureau of Labor Statistics, Occupational Employment Statistics program, “National Industry-Specific Occupational Employment and Wage Estimates,” May 2010, http://bls.gov/oes/current/oessrci.htm.

South Fremont / Warm Springs Impact Analyses
-47-
manufacturers – one of the industries in the heavy industrial sector – include machinists (which accounted for about 13 percent of national employment in the metalworking industry in 2010) and tool and die makers (10 percent), as well as everything from engineers to janitors, office clerks, and managers. Step 3. Matching Occupations and Industries with Earnings Finally, Strategic Economics used data on wages and benefits to estimate the aggregate compensation associated with each alternative. These estimates were based on two sources:
Data on average annual wages in Alameda and Contra Costa Counties, available for each
occupation identified in Step 2.9 Data on the average national value of benefits, available for broad industry categories. 10
For example, machinists employed in the East Bay in 2010 earned $44,820 a year on average, while tool and die makers made $50,900. However, wages and salaries account for only about 65 percent of total compensation in the manufacturing industries. Therefore, total compensation (wages/salaries + benefits) was estimated at $68,953 for machinists and $78,307 for tool and die makers. To calculate the aggregate compensation associated with each alternative, the average compensation per worker for each industry/occupation was multiplied by the number of workers assigned to each category. For example, based on the process of matching alternatives and land use categories with industries and occupations (Steps 1 and 2), Alternative 1 was assumed to employ about 40 machinists, which would in aggregate receive $2,758,120 (40*$68,953) in compensation annually. This calculation was repeated for each industry and occupation to calculate the total compensation associated with each alternative.
Results of Employment and Occupation Analysis Table 38 shows the top occupations associated with the employment models for the three proposed land use alternatives, and the average wages associated with each of those occupations in the East Bay. Computer and mathematical occupations (e.g. software developers, computer systems analysts, and computer support specialists) account for the largest share of jobs in each alternative, because workers with these skills are employed by the types of technology-related manufacturing, R&D, and high-tech office uses likely to locate in the Study Area. Office and administrative support jobs also account for a significant share of employment in each alternative because these workers are employed by most industries. Alternative 1, which is more heavily weighted towards manufacturing, is modeled as providing more production and installation/repair/maintenance jobs. Alternatives 2 and 3 include relatively more jobs associated with R&D and office uses, such as management, architecture and engineering, and the sciences. Alternative 3 also includes more jobs associated with retail, restaurants, and personal services (e.g. sales people, cashiers, food preparation workers, hairstylists, etc.), although the amount of space allocated to retail uses in Alternative 3 does not generate enough employment to dramatically affect the overall distribution shown in Table 38.
9 U.S. Bureau of Labor Statistics, Occupational Employment Statistics program, “Metropolitan and Nonmetropolitan Area Occupational Employment and Wage Estimates: Oakland-Fremont-Hayward, CA Metropolitan Division,” May 2010, http://bls.gov/oes/current/oes_36084.htm. 10 U.S. Bureau of Labor Statistics, “Table 10. Employer costs per hour worked for employee compensation and costs as a percent of total compensation: Private industry workers, by industry group,” June 2011 http://www.bls.gov/news.release/ecec.t10.htm.
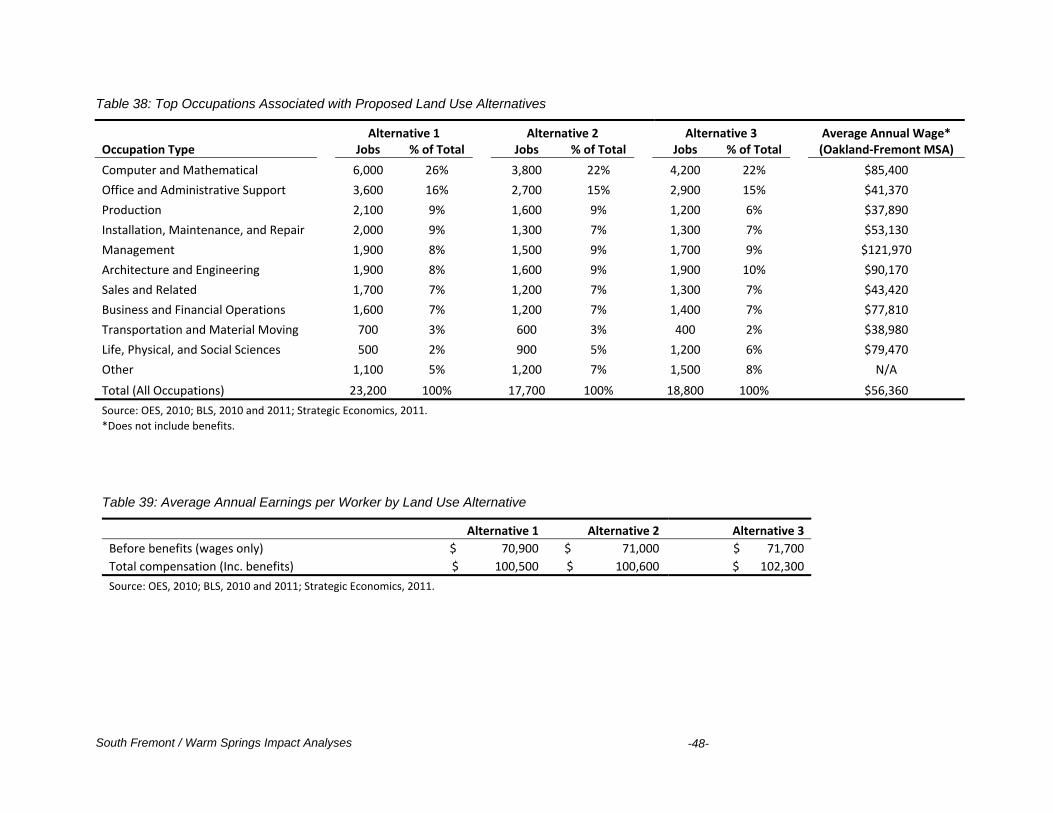
South Fremont / Warm Springs Impact Analyses
-48-
Table 38: Top Occupations Associated with Proposed Land Use Alternatives
Alternative 1 Alternative 2 Alternative 3 Average Annual Wage* Occupation Type Jobs % of Total Jobs % of Total Jobs % of Total (Oakland‐Fremont MSA)
Computer and Mathematical 6,000 26% 3,800 22% 4,200 22% $85,400
Office and Administrative Support 3,600 16% 2,700 15% 2,900 15% $41,370
Production 2,100 9% 1,600 9% 1,200 6% $37,890
Installation, Maintenance, and Repair 2,000 9% 1,300 7% 1,300 7% $53,130
Management 1,900 8% 1,500 9% 1,700 9% $121,970
Architecture and Engineering 1,900 8% 1,600 9% 1,900 10% $90,170
Sales and Related 1,700 7% 1,200 7% 1,300 7% $43,420
Business and Financial Operations 1,600 7% 1,200 7% 1,400 7% $77,810
Transportation and Material Moving 700 3% 600 3% 400 2% $38,980
Life, Physical, and Social Sciences 500 2% 900 5% 1,200 6% $79,470
Other 1,100 5% 1,200 7% 1,500 8% N/A
Total (All Occupations) 23,200 100% 17,700 100% 18,800 100% $56,360
Source: OES, 2010; BLS, 2010 and 2011; Strategic Economics, 2011. *Does not include benefits.
Table 39: Average Annual Earnings per Worker by Land Use Alternative
Alternative 1 Alternative 2 Alternative 3
Before benefits (wages only) $ 70,900 $ 71,000 $ 71,700
Total compensation (Inc. benefits) $ 100,500 $ 100,600 $ 102,300
Source: OES, 2010; BLS, 2010 and 2011; Strategic Economics, 2011.
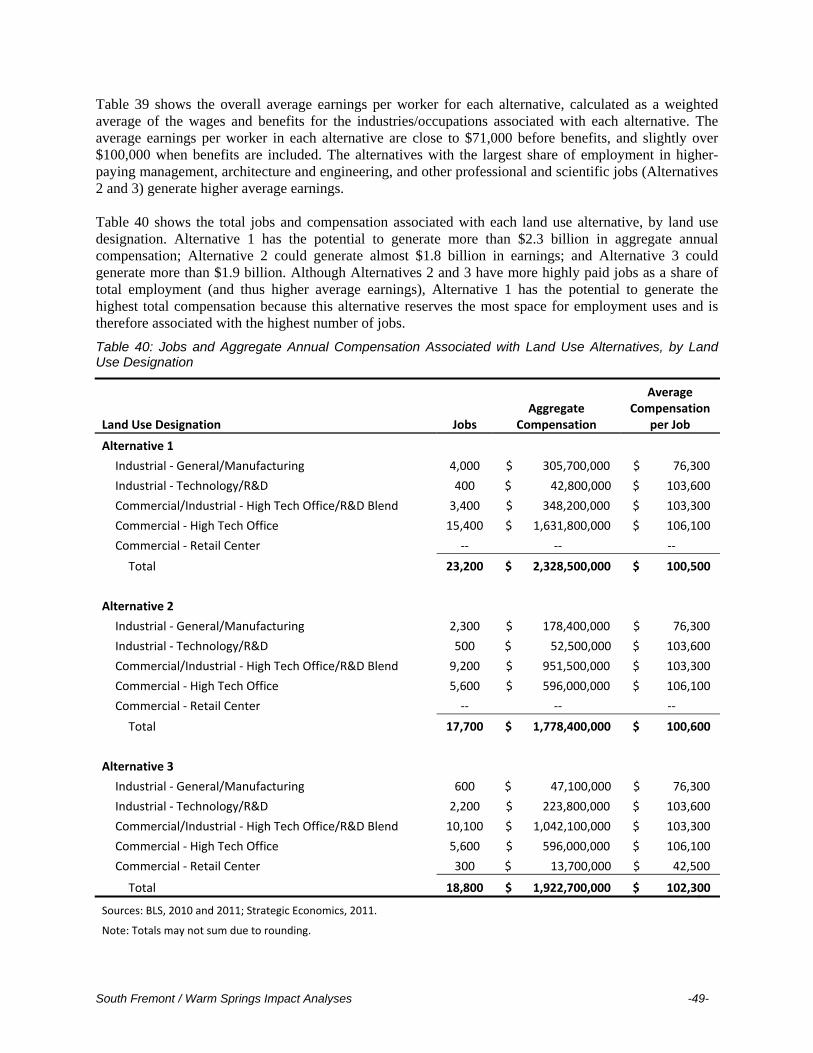
South Fremont / Warm Springs Impact Analyses -49-
Table 39 shows the overall average earnings per worker for each alternative, calculated as a weighted average of the wages and benefits for the industries/occupations associated with each alternative. The average earnings per worker in each alternative are close to $71,000 before benefits, and slightly over $100,000 when benefits are included. The alternatives with the largest share of employment in higher-paying management, architecture and engineering, and other professional and scientific jobs (Alternatives 2 and 3) generate higher average earnings. Table 40 shows the total jobs and compensation associated with each land use alternative, by land use designation. Alternative 1 has the potential to generate more than $2.3 billion in aggregate annual compensation; Alternative 2 could generate almost $1.8 billion in earnings; and Alternative 3 could generate more than $1.9 billion. Although Alternatives 2 and 3 have more highly paid jobs as a share of total employment (and thus higher average earnings), Alternative 1 has the potential to generate the highest total compensation because this alternative reserves the most space for employment uses and is therefore associated with the highest number of jobs.
Table 40: Jobs and Aggregate Annual Compensation Associated with Land Use Alternatives, by Land Use Designation
Land Use Designation Jobs Aggregate
Compensation
Average Compensation
per Job
Alternative 1
Industrial ‐ General/Manufacturing 4,000 $ 305,700,000 $ 76,300
Industrial ‐ Technology/R&D 400 $ 42,800,000 $ 103,600
Commercial/Industrial ‐ High Tech Office/R&D Blend 3,400 $ 348,200,000 $ 103,300
Commercial ‐ High Tech Office 15,400 $ 1,631,800,000 $ 106,100
Commercial ‐ Retail Center ‐‐ ‐‐ ‐‐
Total 23,200 $ 2,328,500,000 $ 100,500
Alternative 2
Industrial ‐ General/Manufacturing 2,300 $ 178,400,000 $ 76,300
Industrial ‐ Technology/R&D 500 $ 52,500,000 $ 103,600
Commercial/Industrial ‐ High Tech Office/R&D Blend 9,200 $ 951,500,000 $ 103,300
Commercial ‐ High Tech Office 5,600 $ 596,000,000 $ 106,100
Commercial ‐ Retail Center ‐‐ ‐‐ ‐‐
Total 17,700 $ 1,778,400,000 $ 100,600
Alternative 3
Industrial ‐ General/Manufacturing 600 $ 47,100,000 $ 76,300
Industrial ‐ Technology/R&D 2,200 $ 223,800,000 $ 103,600
Commercial/Industrial ‐ High Tech Office/R&D Blend 10,100 $ 1,042,100,000 $ 103,300
Commercial ‐ High Tech Office 5,600 $ 596,000,000 $ 106,100
Commercial ‐ Retail Center 300 $ 13,700,000 $ 42,500
Total 18,800 $ 1,922,700,000 $ 102,300
Sources: BLS, 2010 and 2011; Strategic Economics, 2011.
Note: Totals may not sum due to rounding.
South Fremont / Warm Springs Impact Analyses
-50-
EMPLOYMENT IMPACT ANALYSIS The jobs and aggregate earnings derived in the occupation analysis above were used to estimate the total regional economic impact of the employment uses envisioned in each of the three alternatives. This section reviews this methodology and describes the results of the employment impact analysis.
Approach The previous section described the methodology for calculating the jobs and aggregate compensation associated with the land uses in each of the three alternatives. For the purpose of the economic impact analysis, these figures are considered the “direct effect”– that is, the initial change in economic activity associated with each alternative. To calculate the indirect and induced effects of the employment uses, Strategic Economics applied RIMS II multipliers for each individual industry11 to the number of jobs and aggregate compensation calculated in the employment/occupation analysis. Strategic Economics also used RIMS II multipliers to estimate the effects of the alternatives on the region’s total economic output (i.e., total sales).
Results of Employment Impact Analysis Table 41 shows the direct, indirect, and induced effects associated with the employment uses modeled for the three alternatives. Because Alternative 1 reserves the most land for employment, it has the potential to generate the largest regional economic impacts, at 59,300 total jobs, nearly $4.4 billion in earnings, and $13.8 billion in output. Alternative 3 has the second highest potential economic impact, at 51,500 jobs, $3.7 billion in earnings, and $11.6 billion in output throughout the region. Alternative 2 has the potential to generate approximately 46,900 jobs, $3.4 billion in earnings, and $10.7 billion in output. Because the analysis assumes that each alternative is fully built out, the relative scale of the impacts is primarily related to the amount of land that each alternative reserves for employment uses. Another factor that affects the size of the impacts is the multipliers of the industries included in the model. Table 42 shows the effective multipliers for each of the three land use alternatives – that is, the average effect on the Bay Area economy in earnings, jobs, or output from a dollar invested in the Study Area under each scenario. Alternative 3 has the biggest “bang for the buck,” in part because workers earn higher wages in the industries included in Alternative 3, which translates to greater induced effects (i.e. household spending). The size of the multipliers is also related to the share of economic activity throughout the supply chain (i.e. the indirect effect) that is captured within the Bay Area; for example, inputs from professional service industries, such as law firms, may be more likely to be provided from within in the region then raw materials or industrial inputs.
11 Where industry categories for the RIMS II multipliers were more detailed (i.e. at the 5- or 6-digit NAICS level) than the industries used to assemble the employment profile, the multipliers were averaged.
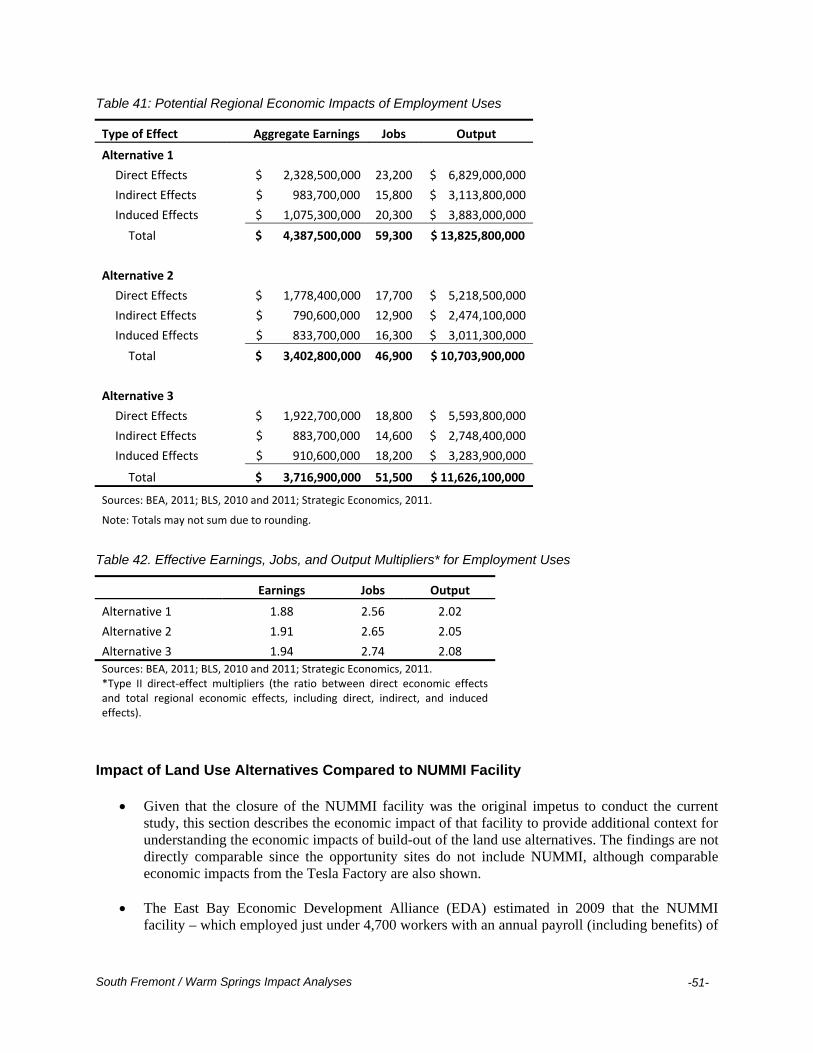
South Fremont / Warm Springs Impact Analyses
-51-
Table 41: Potential Regional Economic Impacts of Employment Uses
Type of Effect Aggregate Earnings Jobs Output
Alternative 1
Direct Effects $ 2,328,500,000 23,200 $ 6,829,000,000
Indirect Effects $ 983,700,000 15,800 $ 3,113,800,000
Induced Effects $ 1,075,300,000 20,300 $ 3,883,000,000
Total $ 4,387,500,000 59,300 $ 13,825,800,000
Alternative 2
Direct Effects $ 1,778,400,000 17,700 $ 5,218,500,000
Indirect Effects $ 790,600,000 12,900 $ 2,474,100,000
Induced Effects $ 833,700,000 16,300 $ 3,011,300,000
Total $ 3,402,800,000 46,900 $ 10,703,900,000
Alternative 3
Direct Effects $ 1,922,700,000 18,800 $ 5,593,800,000
Indirect Effects $ 883,700,000 14,600 $ 2,748,400,000
Induced Effects $ 910,600,000 18,200 $ 3,283,900,000
Total $ 3,716,900,000 51,500 $ 11,626,100,000
Sources: BEA, 2011; BLS, 2010 and 2011; Strategic Economics, 2011.
Note: Totals may not sum due to rounding.
Table 42. Effective Earnings, Jobs, and Output Multipliers* for Employment Uses
Earnings Jobs Output
Alternative 1 1.88 2.56 2.02
Alternative 2 1.91 2.65 2.05
Alternative 3 1.94 2.74 2.08
Sources: BEA, 2011; BLS, 2010 and 2011; Strategic Economics, 2011. *Type II direct‐effect multipliers (the ratio between direct economic effects and total regional economic effects, including direct, indirect, and induced effects).
Impact of Land Use Alternatives Compared to NUMMI Facility
Given that the closure of the NUMMI facility was the original impetus to conduct the current study, this section describes the economic impact of that facility to provide additional context for understanding the economic impacts of build-out of the land use alternatives. The findings are not directly comparable since the opportunity sites do not include NUMMI, although comparable economic impacts from the Tesla Factory are also shown.
The East Bay Economic Development Alliance (EDA) estimated in 2009 that the NUMMI facility – which employed just under 4,700 workers with an annual payroll (including benefits) of

South Fremont / Warm Springs Impact Analyses
-52-
about $512 million – supported a total of 24,598 jobs across the region through direct, indirect, and induced effects.12
The EDA relied on RIMS II multipliers based on 1997 national benchmark data and 2006 regional data, the most recent available at the time. Since then, the BEA has published updated RIMS II multipliers based on a 2002 national benchmark and 2008 regional data, which are used in this report. The new data shows that the employment multiplier used for automobile manufacturing in Alameda and Contra Costa Counties has since declined, from 5.2358 in the 1997/2006 data to 3.4879 in 2002/2008, possibly indicating that the concentration of automobile manufacturing suppliers in the East Bay had declined.
Using the new 2002/2008 multipliers for the East Bay,13 the regional impact of the NUMMI facility would have been significantly smaller, about 16,300 jobs, $1.2 billion in earnings, and $7 to $9 billion in output.
The figures shown in Table 41 do not include employment generated by Tesla at the former
NUMMI site (the land use alternatives do not identify the former NUMMI facility itself as an opportunity site, since the facility is now occupied by Tesla). Assuming that Tesla expands to 1,200 employees as projected – and using the 2002/2008 employment multiplier of 3.4879 for the automobile manufacturing industry in the East Bay – Tesla would support a total of about 4,200 jobs throughout the region.
12 East Bay EDA, “NUMMI Plant Closure Impacts & Plans,” U.S. Economic Development Administration grant application. 13 The rest of this report uses multipliers for the nine-county Bay Area region. Multipliers for the East Bay (Alameda and Contra Costa Counties) are used here because the automobile manufacturing industry and its suppliers are more highly concentrated in the East Bay then in the rest of the region. As a result, the RIMS II multipliers for the automobile manufacturing industry are higher for the two-county East Bay then for the nine-county region. In this (relatively rare) situation, the BEA recommends using the higher multiplier.

South Fremont / Warm Springs Impact Analyses
-53-
HOUSEHOLD IMPACT ANALYSIS This section discusses the residential component of the analysis, including the methodology for estimating the regional economic impact of the housing units planned in Alternatives 2 and 3, and the results.
Approach Aggregate household expenditures – the “direct effect” of new housing units in the Study Area – were estimated based on the mean annual household income for homeowners in the City of Fremont, which was $121,996 in 2010.14 The mean value for annual household income was used instead of the median value ($106,694) because it is assumed that households that purchase new units are likely to have relatively higher incomes than buyers of older product. Indeed, $121,996 is a conservative estimate of potential household income; if new units are priced at $425,000 or more, they would be affordable only to households earning at least $150,000.15 Strategic Economics calculated annual spending by new households based on data from the annual Consumer Expenditure Survey conducted by the United States Bureau of Labor Statistics. The annual Consumer Expenditure Survey reports that the average American household earning between $120,000 and $149,000 a year spends about 68 percent of their income on goods, services, etc., and saving the rest.16 On average, therefore, households living in the Study Area are expected to spend about $82,355 a year. In aggregate, household spending would total about $263.5 million in Alternative 2, which includes 3,200 housing units, and $321.2 million in Alternative 3, which includes 3,900 housing units (Table 43). Alternative 1 does not include any housing units.
In order to calculate the regional economic impact of this spending, Strategic Economics applied RIMS II multipliers for household spending. By definition, household expenditures are considered to generate induced effects but not indirect effects (which accrue to firms). The RIMS II household multipliers for earnings, jobs, and output are given in Table 43.
14 U.S. Census Bureau, 2010 American Community Survey. 15 Assumes households would spend 30 percent or less of household income on housing costs including mortgage payments, insurance, homeowners association (HOA) fees, and utilities. 16 U.S. Bureau of Labor Statistics, “Consumer Expenditure Survey,” 2010, http://www.bls.gov/cex/.
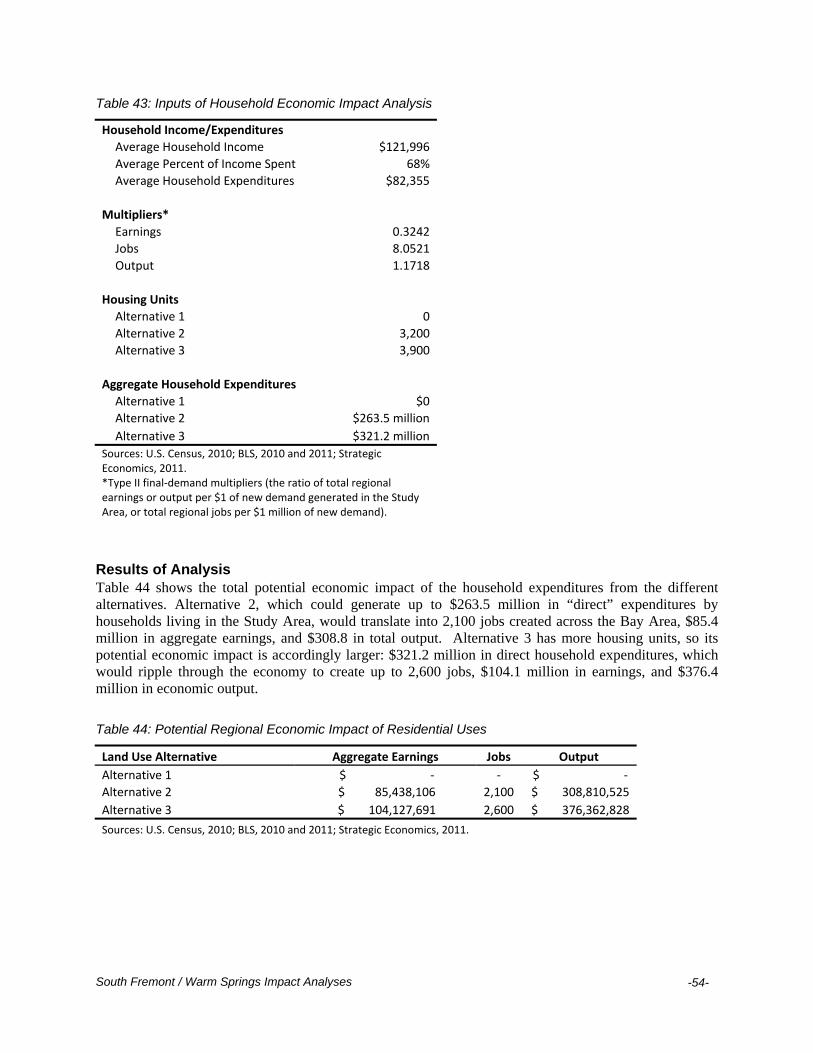
South Fremont / Warm Springs Impact Analyses
-54-
Table 43: Inputs of Household Economic Impact Analysis
Household Income/Expenditures
Average Household Income $121,996
Average Percent of Income Spent 68%
Average Household Expenditures $82,355
Multipliers*
Earnings 0.3242
Jobs 8.0521
Output 1.1718
Housing Units
Alternative 1 0
Alternative 2 3,200
Alternative 3 3,900
Aggregate Household Expenditures
Alternative 1 $0
Alternative 2 $263.5 million
Alternative 3 $321.2 million
Sources: U.S. Census, 2010; BLS, 2010 and 2011; Strategic Economics, 2011. *Type II final‐demand multipliers (the ratio of total regional earnings or output per $1 of new demand generated in the Study Area, or total regional jobs per $1 million of new demand).
Results of Analysis Table 44 shows the total potential economic impact of the household expenditures from the different alternatives. Alternative 2, which could generate up to $263.5 million in “direct” expenditures by households living in the Study Area, would translate into 2,100 jobs created across the Bay Area, $85.4 million in aggregate earnings, and $308.8 in total output. Alternative 3 has more housing units, so its potential economic impact is accordingly larger: $321.2 million in direct household expenditures, which would ripple through the economy to create up to 2,600 jobs, $104.1 million in earnings, and $376.4 million in economic output.
Table 44: Potential Regional Economic Impact of Residential Uses
Land Use Alternative Aggregate Earnings Jobs Output
Alternative 1 $ ‐ ‐ $ ‐
Alternative 2 $ 85,438,106 2,100 $ 308,810,525
Alternative 3 $ 104,127,691 2,600 $ 376,362,828
Sources: U.S. Census, 2010; BLS, 2010 and 2011; Strategic Economics, 2011.
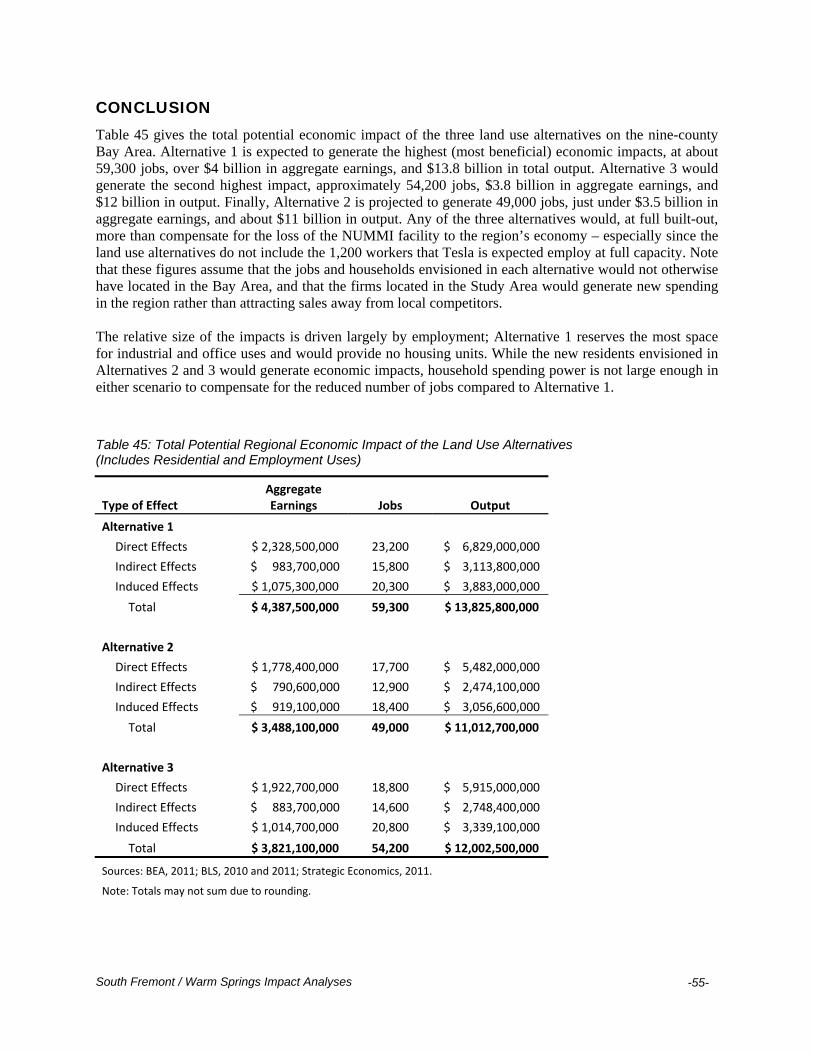
South Fremont / Warm Springs Impact Analyses
-55-
CONCLUSION Table 45 gives the total potential economic impact of the three land use alternatives on the nine-county Bay Area. Alternative 1 is expected to generate the highest (most beneficial) economic impacts, at about 59,300 jobs, over $4 billion in aggregate earnings, and $13.8 billion in total output. Alternative 3 would generate the second highest impact, approximately 54,200 jobs, $3.8 billion in aggregate earnings, and $12 billion in output. Finally, Alternative 2 is projected to generate 49,000 jobs, just under $3.5 billion in aggregate earnings, and about $11 billion in output. Any of the three alternatives would, at full built-out, more than compensate for the loss of the NUMMI facility to the region’s economy – especially since the land use alternatives do not include the 1,200 workers that Tesla is expected employ at full capacity. Note that these figures assume that the jobs and households envisioned in each alternative would not otherwise have located in the Bay Area, and that the firms located in the Study Area would generate new spending in the region rather than attracting sales away from local competitors. The relative size of the impacts is driven largely by employment; Alternative 1 reserves the most space for industrial and office uses and would provide no housing units. While the new residents envisioned in Alternatives 2 and 3 would generate economic impacts, household spending power is not large enough in either scenario to compensate for the reduced number of jobs compared to Alternative 1.
Table 45: Total Potential Regional Economic Impact of the Land Use Alternatives (Includes Residential and Employment Uses)
Type of Effect Aggregate Earnings Jobs Output
Alternative 1
Direct Effects $ 2,328,500,000 23,200 $ 6,829,000,000
Indirect Effects $ 983,700,000 15,800 $ 3,113,800,000
Induced Effects $ 1,075,300,000 20,300 $ 3,883,000,000
Total $ 4,387,500,000 59,300 $ 13,825,800,000
Alternative 2
Direct Effects $ 1,778,400,000 17,700 $ 5,482,000,000
Indirect Effects $ 790,600,000 12,900 $ 2,474,100,000
Induced Effects $ 919,100,000 18,400 $ 3,056,600,000
Total $ 3,488,100,000 49,000 $ 11,012,700,000
Alternative 3
Direct Effects $ 1,922,700,000 18,800 $ 5,915,000,000
Indirect Effects $ 883,700,000 14,600 $ 2,748,400,000
Induced Effects $ 1,014,700,000 20,800 $ 3,339,100,000
Total $ 3,821,100,000 54,200 $ 12,002,500,000
Sources: BEA, 2011; BLS, 2010 and 2011; Strategic Economics, 2011.
Note: Totals may not sum due to rounding.

South Fremont / Warm Springs Impact Analyses
-56-
Of course, overall economic impact is only one of many factors to be considered in comparing the three alternatives. Job quality and pay is another important consideration. Assuming that the Study Area could attract the type of R&D and high-tech office users envisioned, Alternatives 2 and 3 would provide higher paying jobs on average. On the other hand, Alternative 1 could potentially provide high-quality manufacturing jobs for lower skilled workers. Other factors to consider include market demand and financial feasibility, and the relative importance of different policy goals such as industrial land preservation and housing production.
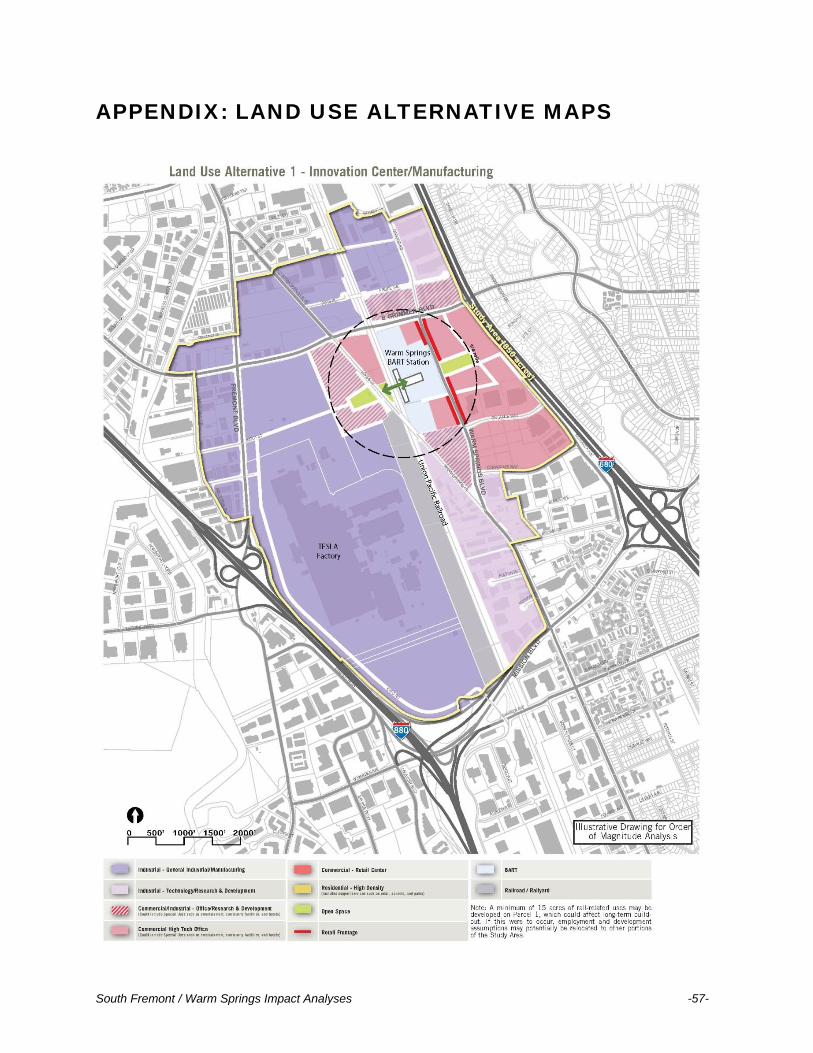
South Fremont / Warm Springs Impact Analyses -57-
APPENDIX: LAND USE ALTERNATIVE MAPS
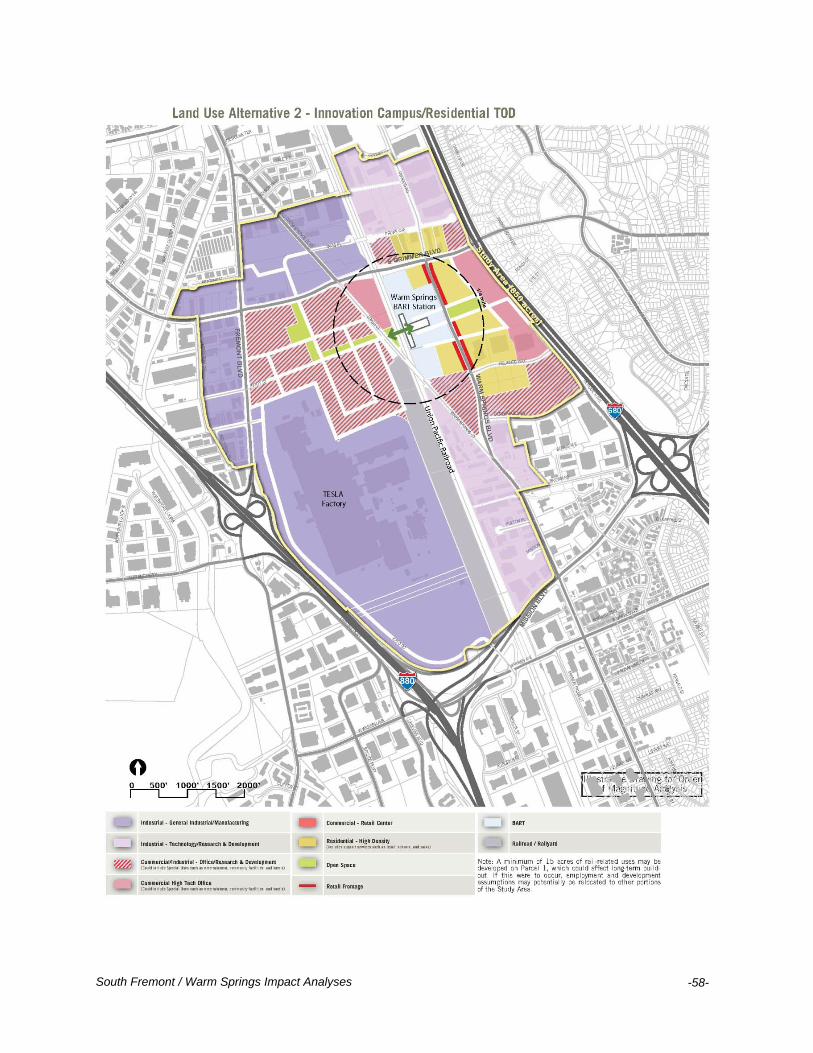
South Fremont / Warm Springs Impact Analyses
-58-

South Fremont / Warm Springs Impact Analyses
-59-