the economic and fiscal impacts on santa barbara county
TRANSCRIPT

The Economic and Fiscal Impacts on Santa Barbara County . . .
~~~~~~~ . . . when interim and full oil production from the ExxonMobil Santa Ynez Unit
is restored
Prepared by the California Economic Forecast
Prepared for Chambers of Commerce Coalition, Santa Barbara County
- Buellton Chamber of Commerce- Goleta Chamber of Commerce- Santa Maria Valley Chamber of Commerce- Lompoc Chamber of Commerce- Solvang Chamber of Commerce- Santa Barbara Chamber of Commerce
June 7, 2019
FINAL REPORT

ii
Key Findings The interim trucking proposal by ExxonMobil and the pipeline replacement by Plains will result in hundreds of new jobs created, millions of dollars in new income and spending, and a meaningful restoration of lost tax dollars to the Santa Barbara County General Fund, Santa Barbara County Fire Protection, and the public schools. The construction industry will employ 300 new workers as a new replacement pipeline is installed. Between 2020 and 2030, a total of 450 temporary jobs and 435 net permanent jobs are created in the County. Oil and gas processing, extraction, and transportation services add 218 workers in the peak years at annual salaries that are 27 percent above the average salary for all workers in Santa Barbara County. ExxonMobil will invest more than $40 million per year in the Santa Barbara County economy to maintain the Santa Ynez Unit operation which includes oil and gas extraction and processing. Plains will invest more than $370 million in the Santa Barbara County economy to replace lines 901 and 903, starting in the South Coast and ending at the northern ends of the County, both east and west. Personal income rises by $72 million in the peak year of the Project and the level of new income created remains in excess of $35 million per year between 2023 and 2030. Taxable spending on goods and services in Santa Barbara county increases by $69 million in the peak year of the Project and remains in excess of $10 million per year from 2021 to 2027. The value of industrial property rises nearly 6 times the current assessment level by the County of Santa Barbara and the State Board of Equalization. Consequently, the property tax levy will correspondingly increase, providing millions of additional annual revenues to the Santa Barbara County General Fund, many K-12 schools, Alan Hancock Community College, and the Santa Barbara County Fire Protection District.

iii
Executive Summary In 2015, prior to the Plains All American 901 pipeline incident near Refugio Beach, the ExxonMobil Santa Ynez Unit was operating at full capacity, producing 10.8 million barrels of oil annually. Crude oil and natural gas was delivered onshore to the Las Flores Canyon facility and the POPCO Gas Plant located north of Highway 101 between Refugio and El Capitan State Beaches.
Impacted Oil and Gas Operations Onshore and Offshore Santa Barbara County
The collective total of these industrial operations represented a meaningful economic engine for the Santa Barbara County economy and the County’s fiscal environment. Consequently, the abrupt cessation of this activity correspondingly resulted in economic and fiscal deficits which were measurable by the loss of jobs, income, and tax dollars. The proposed Project, whereby interim trucking of crude oil begins in 2020 and is ultimately superseded by a replacement oil pipeline through Santa Barbara County in 2023, restores much of the economic stimulus that was present prior to the pipeline rupture in May of 2015, expanding the diversity of the economy, and utilizing valuable resources that have been unproductive for years.

iv
The Project creates many higher paying employment opportunities for the private sector economy, and restores a higher level of general fund revenues to Santa Barbara County and significant property tax revenues to: • The Santa Barbara County Fire Protection District, • Lompoc Union School District • Santa Ynez High School • Vista Del Mar Elementary • Cuyama Unified School • Blochman Union and Santa Maria Joint Union High School District • Alan Hancock Community College, and • the County’s education revenue augmentation fund. The property tax fiscal stimulus represents a meaningful expansion of the property tax levy despite the permanent loss of the high valued industrial assets: Platform Holly, the Elwood Onshore Facility, the Point Arguello pipeline and the Gaviota Oil and Gas Processing Facility. Taxation of oil and gas facilities and the pipeline generate between $7 and $8 million annually in property tax revenues. The stimulus restores desperately needed property tax revenues to Vista Del Mar Elementary and Cuyama Unified School which have been severely impacted by the shutdown and which are located in areas of the County where household incomes are low and a larger than average percentage of families are currently below the federal poverty line. Delaying this project delays meaningful revenues to schools in Santa Barbara County that are necessary for student development and enrichment. Consequently, it is important that this project start as soon as possible to reestablish the revenue flow to schools. Certainly, the recommissioning of the offshore Santa Ynez Unit Platforms, the operation of the Las Flores and POPCO facilities, and the new intercounty pipeline re-employ laid off workers and create hundreds of new construction jobs. Jobs in oil and gas extraction, processing and transportation lead all sectors, followed by the potential for more public sector jobs in K-14 schools, fire protection, other special districts and county administrative government.
v
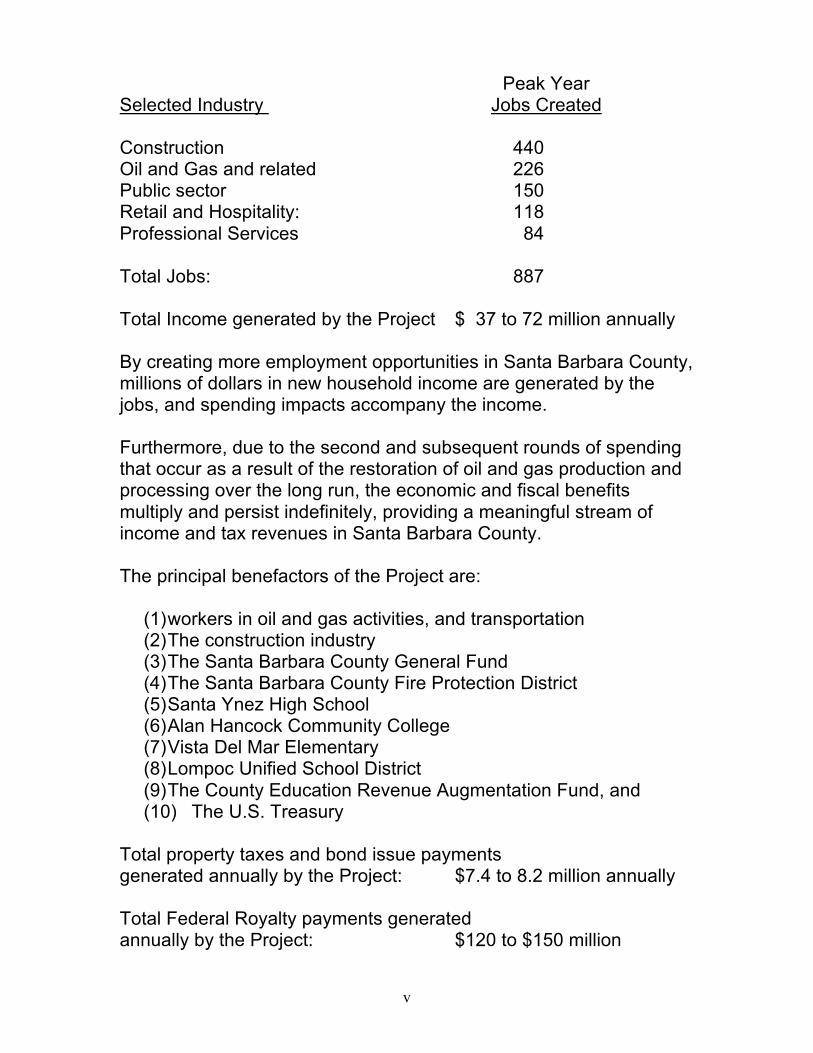
Peak Year Selected Industry Jobs Created
Construction 440 Oil and Gas and related 226 Public sector 150 Retail and Hospitality: 118 Professional Services 84 Total Jobs: 887 Total Income generated by the Project $ 37 to 72 million annually By creating more employment opportunities in Santa Barbara County, millions of dollars in new household income are generated by the jobs, and spending impacts accompany the income. Furthermore, due to the second and subsequent rounds of spending that occur as a result of the restoration of oil and gas production and processing over the long run, the economic and fiscal benefits multiply and persist indefinitely, providing a meaningful stream of income and tax revenues in Santa Barbara County. The principal benefactors of the Project are:
(1) workers in oil and gas activities, and transportation (2) The construction industry (3) The Santa Barbara County General Fund (4) The Santa Barbara County Fire Protection District (5) Santa Ynez High School (6) Alan Hancock Community College (7) Vista Del Mar Elementary (8) Lompoc Unified School District (9) The County Education Revenue Augmentation Fund, and (10) The U.S. Treasury
Total property taxes and bond issue payments generated annually by the Project: $7.4 to 8.2 million annually Total Federal Royalty payments generated annually by the Project: $120 to $150 million

vi
Table of Contents
page Key Findings ii Executive Summary iii Table of Contents vi 1. Introduction 1 2. Project Description 6 3. Direct Effects of the Project 19 4. Total Economic and Fiscal Impacts 23 5. Summary 39 References 41 Appendices A 42 B 44 C 47 D 49 E 51 F 52 Demographics 53 Preparers 56
1
1. Introduction and Background Chronology of Events
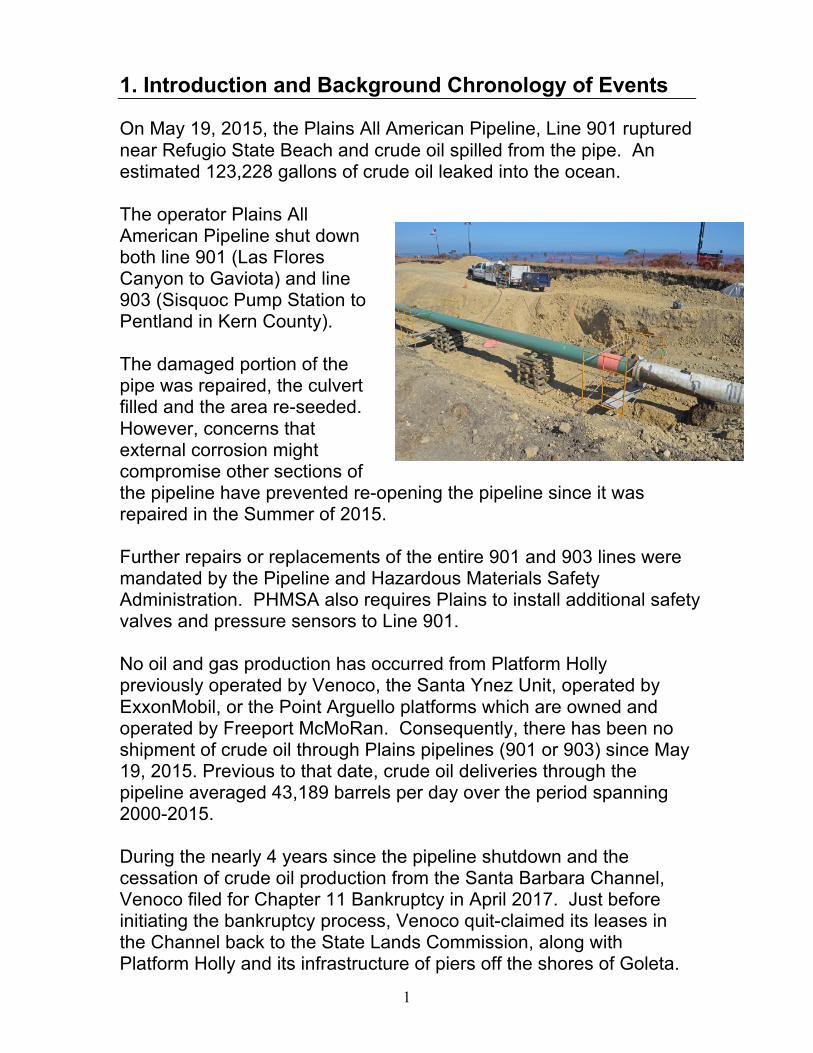
On May 19, 2015, the Plains All American Pipeline, Line 901 ruptured near Refugio State Beach and crude oil spilled from the pipe. An estimated 123,228 gallons of crude oil leaked into the ocean. The operator Plains All American Pipeline shut down both line 901 (Las Flores Canyon to Gaviota) and line 903 (Sisquoc Pump Station to Pentland in Kern County). The damaged portion of the pipe was repaired, the culvert filled and the area re-seeded. However, concerns that external corrosion might compromise other sections of the pipeline have prevented re-opening the pipeline since it was repaired in the Summer of 2015. Further repairs or replacements of the entire 901 and 903 lines were mandated by the Pipeline and Hazardous Materials Safety Administration. PHMSA also requires Plains to install additional safety valves and pressure sensors to Line 901. No oil and gas production has occurred from Platform Holly previously operated by Venoco, the Santa Ynez Unit, operated by ExxonMobil, or the Point Arguello platforms which are owned and operated by Freeport McMoRan. Consequently, there has been no shipment of crude oil through Plains pipelines (901 or 903) since May 19, 2015. Previous to that date, crude oil deliveries through the pipeline averaged 43,189 barrels per day over the period spanning 2000-2015. During the nearly 4 years since the pipeline shutdown and the cessation of crude oil production from the Santa Barbara Channel, Venoco filed for Chapter 11 Bankruptcy in April 2017. Just before initiating the bankruptcy process, Venoco quit-claimed its leases in the Channel back to the State Lands Commission, along with Platform Holly and its infrastructure of piers off the shores of Goleta.

2
As a result, Holly will be permanently shut down (decommissioned), and ultimately removed. Furthermore, Freeport McMoran announced in May 2018 their intention to decommission Platforms Hidalgo, Harvest, and Hermosa in the Point Arguello Unit. The federal leases associated with the platforms expired in November 2018. While decommissioning of Holly and the three Point Arguello platforms will take many years, these actions signal the end of oil and gas operations at these facilities.
Oil & Gas properties impacted by the Plains Pipeline shutdown in May of 2015. The Proposed Plan to Rebuild the Plains Pipeline In August 2017, Plains All American Pipeline filed an application with Santa Barbara County to replace the 123.4 mile oil and gas pipelines. The new Line 901R (R for replacement) would run from Las Flores Canyon to the Sisquoc Pump Station, where some oil is diverted toward the Phillips 66 Santa Maria Refinery in Nipomo. The new Line 903R would run east from Sisquoc to the existing Pentland Delivery Point in Kern County. The Plains proposal is for a smaller, uninsulated pipeline that has more safety valves, lower pressure, an anti-corrosion coating, and cathodic protection meant to keep corrosion away from the pipeline.

3
Also proposed is a new pump station between Sisquoc and Cuyama. The proposed pipeline route is designed to primarily follow the existing Line 901 and Line 903 corridor. The existing Line 901 and Line 903 pipelines will be abandoned and removed. Approximately 3 ½ years are expected for the permitting of the pipeline (2018 through 2021), and 12 months for construction. The replacement pipeline system will have a maximum daily throughput capacity of 40,000 barrels.1
In the Interim, Exxon Proposes Trucking Oil Since May of 2015, there has been no oil production from the seven platforms that rely on Plains Lines 901 and 903 for transporting oil to north and northeast bound processing facilities in California. There has been no processing of oil or natural gas at the Las Flores Canyon Oil and Gas facility or the adjacent POPCO Gas Processing Plant. Consequently, all seven offshore oil platforms, the onshore pipelines, and the onshore processing facilities have remained idle, unproductive, and effectively worthless other than for the alternative possibility of being sold for scrap value.
1 Line 901 & 903 Replacement Project Development Plan, Plains All American Pipeline, Santa Barbara County Planning Development Dept, August, 2017
4
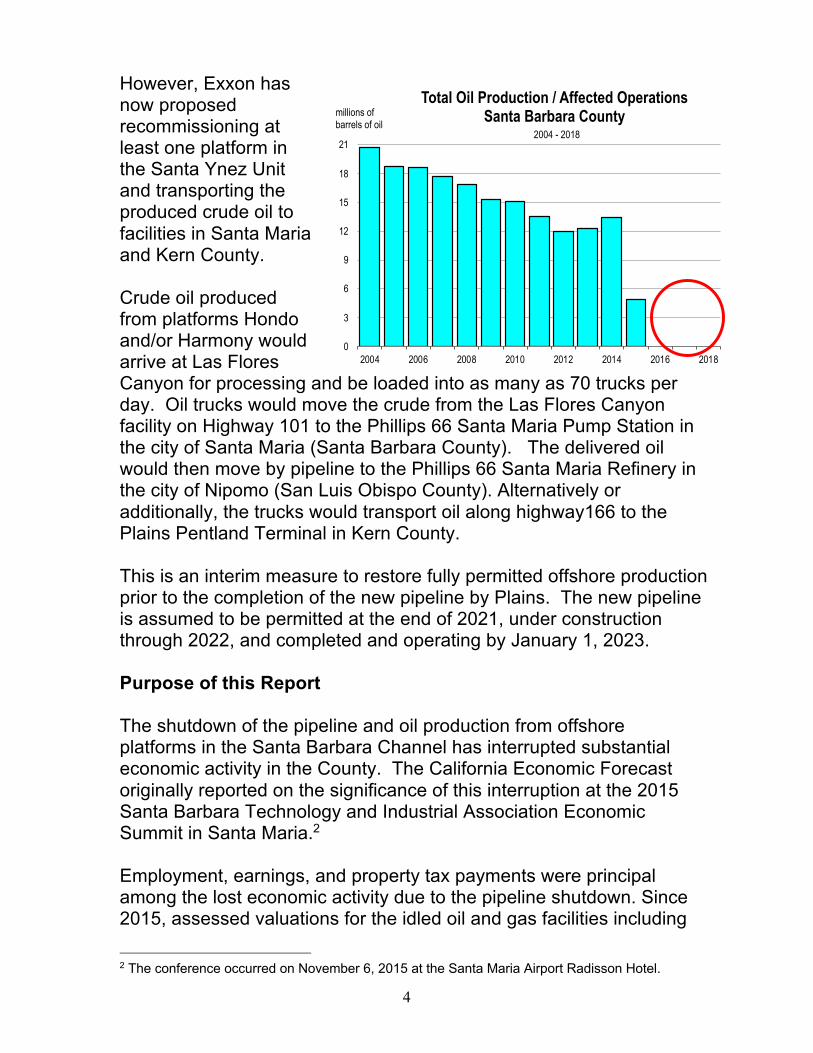
However, Exxon has now proposed recommissioning at least one platform in the Santa Ynez Unit and transporting the produced crude oil to facilities in Santa Maria and Kern County. Crude oil produced from platforms Hondo and/or Harmony would arrive at Las Flores Canyon for processing and be loaded into as many as 70 trucks per day. Oil trucks would move the crude from the Las Flores Canyon facility on Highway 101 to the Phillips 66 Santa Maria Pump Station in the city of Santa Maria (Santa Barbara County). The delivered oil would then move by pipeline to the Phillips 66 Santa Maria Refinery in the city of Nipomo (San Luis Obispo County). Alternatively or additionally, the trucks would transport oil along highway166 to the Plains Pentland Terminal in Kern County. This is an interim measure to restore fully permitted offshore production prior to the completion of the new pipeline by Plains. The new pipeline is assumed to be permitted at the end of 2021, under construction through 2022, and completed and operating by January 1, 2023. Purpose of this Report The shutdown of the pipeline and oil production from offshore platforms in the Santa Barbara Channel has interrupted substantial economic activity in the County. The California Economic Forecast originally reported on the significance of this interruption at the 2015 Santa Barbara Technology and Industrial Association Economic Summit in Santa Maria.2 Employment, earnings, and property tax payments were principal among the lost economic activity due to the pipeline shutdown. Since 2015, assessed valuations for the idled oil and gas facilities including
2 The conference occurred on November 6, 2015 at the Santa Maria Airport Radisson Hotel.
0
3
6
9
12
15
18
21
2004 2006 2008 2010 2012 2014 2016 2018
Total Oil Production / Affected OperationsSanta Barbara Countymillions of
barrels of oil
2004 - 2018

5
the Plains pipeline have been reduced by the Santa Barbara County Auditor-Controller’s office by a collective 87 percent.3
Source: Santa Barbara County Assessor’s Office,
and State Board of Equalization
The property tax levy on the oil and gas properties impacted by the pipeline shutdown declined by over $10 million between FY2015 and FY2018.4 Resumption of crude oil and gas production from the Santa Ynez Unit will have meaningful direct and total economic impacts. Consequently, they are estimated and formally presented as necessary information to the public and to those groups and individuals in decision making positions regarding the restoration of the status quo. This report formally documents the specific economic activity and the valuation that would be restored with the resumption of interim and permanent oil production and ultimate transport through the Plains replacement pipeline.
3 County of Santa Barbara Auditor-Controller’s Office, Tax Bill Search, 1996-2019, by parcel number (See references for website URL) 4 See Appendix A for details regarding the oil and pipeline property assessed value reductions by Santa Barbara County and the corresponding reduction in the associated property tax levy.
0
200
400
600
800
1,000
1,200
FY 2004 FY 2006 FY 2008 FY 2010 FY 2012 FY 2014 FY 2016 FY 2018
Assessed Valuation / Oil & Gas PropertiesImpacted by Pipeline Shutdown
FY 2004 - FY 2018
millions of
dollars

6
2. Project Description
The “Project” refers to the resumption of oil from the Santa Ynez Unit from trucking and ultimately through the rebuilt Plains pipeline Lines 901R and 903R through Santa Barbara County. The Project is a large industrial investment that represents a meaningful change to the status quo Santa Barbara County economy of 2019 or 2020. The investment dollars, the direct employment impacts, and the increase in the value of the existing industrial oil and gas resources currently in place are significant. To present how the regional economy is impacted by the Project, we first need to establish the current economic situation or status quo for Santa Barbara County in the absence of the Project. The status quo is the base case forecast of the Santa Barbara County economy, with no Project in place. We then forecast the economy of Santa Barbara County with the Project in place as described by the Project assumptions in the following section. This is the “With Project Scenario.” The impact of the Project on the County is the difference between the economy with the Project, and the economy under the base case, or no Project. Project Assumptions5 From 2020 to 2023, production of oil is resumed from the Exxon Santa Ynez Unit, limited by the minimal production necessary to operate the facility safely and reliably. The production of oil with interim trucking represents one-third of previous Santa Ynez Unit production at full capacity. Trucking occurs from Las Flores Canyon to the Santa Maria terminal in Nipomo and/or to Pentland in Kern County A single platform of the Santa Ynez Unit produces oil in 2020 at the rate of 1.83 million barrels annually. The oil is piped to Las Flores Canyon for processing and then loaded into trucks. In 2021, output is
5 Ibid., page 10-13, discussions with Exxon, November 2018 and Plains, December 2018.

7
increased to 3.65 million barrels annually. Oil production remains limited by trucking capacity until the pipeline project is completed. The 124 mile Plains replacement pipeline is assumed to be permitted by all local, state, and federal authorities in 2021. Construction plans commence when required permits are acquired at the end of 2021. Actual construction occurs throughout 2022 and is completed at the end of calendar 2022. Plains Pipeline Plan for New Pipeline And Resumption of Oil Transportation 2018 Application Submittal 2019 CEQA, EIR, permitting process 2020 CEQ Review, Revisions, Determinations 2021 CEQ Review, Revisions, Determinations, Permits 2022 Construction commences 2023 Pipeline completion and operation The Project includes 3 pump stations and 30 valves in Santa Barbara County. The pipeline restoration and its costs as estimated by Plains is to be completed as follows: Percent Completed each year cumulatively 2020 0 0 2021 16 16 2022 82 98 2023 2 100 There will be 24,086 square feet of new structural development associated with the replacement pipeline. The structures include
- a crude oil tank - a foam tank, and - a water tank at the Sisquoc Pump Station
The total construction cost of the replacement pipeline is estimated at $380 million.
8
Approximately 400 to 600 workers will be employed for the pipeline construction through Santa Barbara and San Luis Obispo Counties. An estimated 300 construction workers during the peak months of the Project will be on location in Santa Barbara County. The number of full time equivalent construction and contract workers per year is estimated to be: FTE Construction Workers each year 2020 6 2021 150 2022 300 2023 35 The total direct payrolls going to Santa Barbara County construction workers is $96 million. The average salary plus benefits is $127,556 per worker. By the end of 2022, the pipeline is completed
-- Full production of oil from all three platforms in the Santa Ynez Unit ensues -- Oil output rises to 30,000 barrels/day and travels to
Las Flores Canyon for processing; -- Then via line 901R and 903R to the Philips Refinery
in Nipomo and the Pentland Delivery Point in Kern County. Because some natural gas and natural gas liquids will be produced from the Project, the equivalent oil output is 12.47 million barrels annually, or 34,164 barrels per day. Base case and reestablishment scenarios An econometric model of Santa Barbara County is used to produce the base case forecast of economic activity in the County for the 2019 to 2030 time period.6 The base case represents the current status quo, with no resumption or expansion of oil production by Exxon and no replacement pipeline by Plains.
6 See Appendix B for a description of the forecast model

9
Under the “Project scenario” whereby there is resumption of oil production from the Santa Ynez Unit for the 2020 to 2030 period, the forecast model re-estimates the Santa Barbara County economy. This scenario includes the higher levels of oil production due to the reestablishment of the Santa Ynez Unit, interim trucking, and ultimately full production when the Plains replacement pipeline becomes operational in 2023. The economic impact of the Project is the difference between the forecast of the economy with the Project scenario and the base case forecast scenario that is absent the Project. The impacts are measured and presented in terms of: Employment in oil and gas industries Employment in construction Employment in professional services and other sectors Payrolls of workers Total personal Income7 Total retail sales Total assessed valuation Total property taxes Total sales taxes Total other taxes General revenues – Santa Barbara County Revenues less expenditures – Santa Barbara County Property Tax Considerations The shutdown of Plains line 901 also shut down other oil and gas facilities along the coast including the Ellwood Onshore Oil Facility, Las Flores Canyon, the POPCO Gas Plant and the Gaviota Oil and Gas facility. Most of these facilities were taxed based on depreciated cost, with depreciation determined as a factor of the amount of oil produced from the facilities. Consequently, when oil production ceased, the theoretical value of all oil and gas real property is zero, because there is no output value being created.
7 Total personal income is income from all sources including wages and salaries, dividend and other asset income, interest income, rental income, proprietor or 1099 income, and pension income.

10
The assessed valuation of oil and gas properties under a scenario in which no production was forthcoming was predicted to be zero from the impacted operations in 2016-2017, 2017-2018, and 2018-2019. However, since shutdown, the values of the Exxon and Freeport McMoRan facilities have been reassessed based on land, and projected future production.8 Effectively, Santa Barbara County reverted to an alternative method for assessing property taxes since the agreed valuation methodology resulted in a zero assessment. The alternative valuation methodology has resulted in assessments for 2016, 2017 and 2018 that are still being discussed. Nevertheless, assessed valuations for the affected properties declined by a collective 88 percent in the 2017-2018 tax year.9
Source: Santa Barbara County Auditor-Controller’s Office, Property Tax by APN10
8 The value of the Las Flores Canyon facility and the POPCO Gas Plant are currently in dispute for the years 2016, 2017, and 2018 because there has been no production in these years and future production is uncertain. 9 See Appendix A 10 http://taxes.co.santa-barbara.ca.us/propertytax/ptcriteria.asp?Report=Tax+Bill+Search&ReturnTo=taxbillsearch.asp&FiscalYear=2013\
Principal Property Tax Recipients
Impacted by Pipeline Shutdown
Santa Barbara County
Property Tax Levy
Recipient 2014-2015 2017-2018 Change
------------- dollars -----------
Santa Barbara County General Fund 2,395,569 319,770 -2,075,798
SB County Fire Protection 1,441,482 191,877 -1,249,605
Goleta Union School District 2,210,669 - -2,210,669
Santa Barbara Unified School District 1,027,392 - -1,027,392
Santa Barbara High School Bonds 135,285 - -135,285
Santa Barara City College 416,644 - -416,644
Vista Del Mar 703,887 229,971 -473,916
Santa Ynez High School 745,791 252,015 -493,776
Allan Hancock College 390,608 109,860 -280,749
Lompoc Unified School District 168,998 9,149 -159,849
County School Service Fund 440,660 58,651 -382,009
ERAF 1,274,865 168,676 -1,106,189
Totals $11,351,849 $1,339,969 -$10,011,880

11
The principal recipients of the property tax levy for the pipeline-shutdown impacted parcels of Santa Barbara County are shown in the above table. Over $10 million in property tax receipts were lost due to the shutdown of all facilities. The Goleta Union School District was impacted the most, followed by the County General Fund. Revenue from property taxes going to the Santa Barbara County General Fund declined by $2.1 million between FY 2015 and FY 2018. The Santa Barbara County Fire Protection District lost $1.25 million during this same time period. The General Fund includes support for the Satna Barbara County sheriff, the courts, public works and other county services. Consequently, when General Fund revenues are interrupted or reduced, the growth in revenue allocations to these beneficiaries is also reduced. Under the Project, nearly an equal amount of property taxes would be restored to all claimants in the table except the Goleta Union School District, the Santa Barbara Unified School District, Santa Barbara High School, and Santa Barbara City College.
Vista Del Mar Elementary lost 31 percent of its property tax revenues as a result of the pipeline shutdown.
0.8
0.9
1.0
1.1
1.2
1.3
1.4
2010 2011 2012 2013 2014 2015 2016 2017 2018 2019
Property Taxes ReceivedVista Del Mar Elementarymillions
of dollars
FY 2010 - FY 2019

12
Other Schools Impacted Clearly, significant property tax revenues going to Vista Del Mar and Santa Ynez High School were impacted by the pipeline and oil production facility shutdowns. Much of this lost revenue would ultimately be reinstated with the resumption of oil production and transportation through the Plains replacement pipeline. Other schools in the County that were impacted include Blochman Union School District in Cat Canyon, the Orcutt Union School District, the Lompoc Unified School District, and the Cuyama Joint Unified School District. Cuyama benefits from taxable properties on parcels in the Cuyama Valley, which include the Plains line 903.
0.60
0.65
0.70
0.75
0.80
0.85
0.90
0.95
1.00
2010 2011 2012 2013 2014 2015 2016 2017 2018 2019
Property Taxes ReceivedCuyama Unified School Districtmillions
of dollarsFY 2010 - FY 2019

13
The declines in property tax levies to particular schools have been alarming. It will take time for these schools to recover, if ever, since oil and gas infrastructure dominates real property values in some selected areas of the County, notably Gaviota, Cat Canyon just north of Los Alamos, and Cuyama. Despite recent restoration of growth in property tax revenue due to rising property value assessments in general, Blochman Elementary, Vista Del Mar Elementary, and the Cuyuma Unified School District are still significantly behind all other schools in the County regarding property tax distributions in 2018-2019. In fact, they are off nearly 20 percent from where they would have been in the absence of the shutdown of the plains pipeline. Total property tax distributions over time do not show any decline for Santa Ynez High School and the Lompoc Unified School District since the pipeline shutdown. However, here as well the growth in property tax revenues has been muted by the shutdown and the corresponding loss of property taxes generated for these schools by the impacted properties and facilities.
200
250
300
350
400
450
2010 2011 2012 2013 2014 2015 2016 2017 2018 2019
Property Taxes ReceivedBlochman Union Elementary
thousands
of dollarsFY 2010 - FY 2019

14
Relative to all property taxes received by schools in Santa Barbara County, Santa Ynez High and the Lompoc Unified School District have lagged in property tax growth over time.11
A list of schools where property tax revenue growth is significantly less than the average growth of property tax revenues going to Santa Barbara County schools between FY 2014-2015 and FY 2018-2019 is shown below. All of these schools were recipients of significant property tax distributions from pipeline shutdown impacted properties. Property tax revenue growth for all Santa Barbara County schools (net of the impacted schools) between FY2015 and FY2019 was 21.2 percent, representing the average growth of revenues per school. However, these particular schools have not benefited from the economic expansion and property tax growth over time as have all other schools in Santa Barbara County.
11 This is also true for the Goleta Valley Union School District which lost the tax proceeds from Platform Holly and the Ellwood Onshore Facility. Revenue growth to Goleta was significantly less than all other schools in Santa Barbara County in FY2015, FY2016 and FY2017. It has recently started recovering over the last two years as a result of home price appreciation and the development of new housing, hotels, and industrial buildings in the City of Goleta.
-4
-2
0
2
4
6
8
10
12
2011 2012 2013 2014 2015 2016 2017 2018 2019
Property Tax Revenue GrowthLompoc USD, Santa Ynez High and Total percent
changeFY 2011 - FY 2019
All Schools
Santa Ynez High
Lompoc Unified
Goleta Unified
Pipeline shutdown
15
Source: Santa Barbara County Auditor Controller Department, March 2019
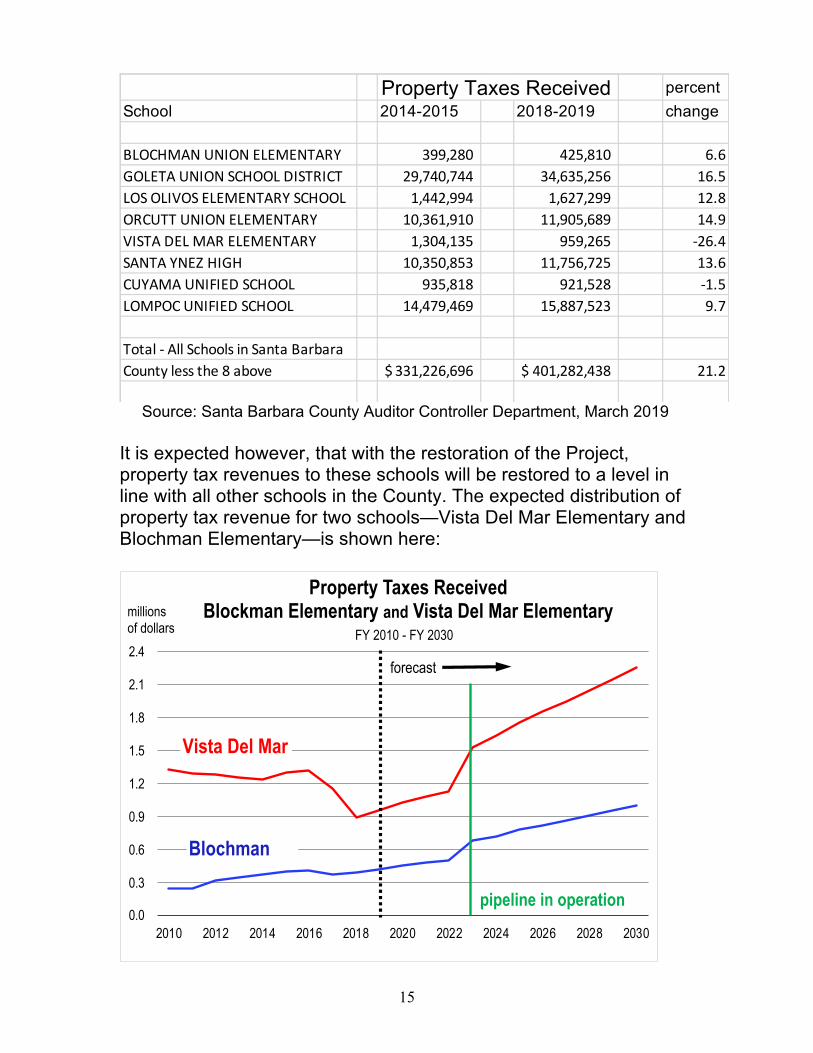
It is expected however, that with the restoration of the Project, property tax revenues to these schools will be restored to a level in line with all other schools in the County. The expected distribution of property tax revenue for two schools—Vista Del Mar Elementary and Blochman Elementary—is shown here:
Property Taxes Received percent
School 2014-2015 2018-2019 change
BLOCHMAN UNION ELEMENTARY 399,280 425,810 6.6
GOLETA UNION SCHOOL DISTRICT 29,740,744 34,635,256 16.5
LOS OLIVOS ELEMENTARY SCHOOL 1,442,994 1,627,299 12.8
ORCUTT UNION ELEMENTARY 10,361,910 11,905,689 14.9
VISTA DEL MAR ELEMENTARY 1,304,135 959,265 -26.4
SANTA YNEZ HIGH 10,350,853 11,756,725 13.6
CUYAMA UNIFIED SCHOOL 935,818 921,528 -1.5
LOMPOC UNIFIED SCHOOL 14,479,469 15,887,523 9.7
Total - All Schools in Santa Barbara
County less the 8 above 331,226,696$ 401,282,438$ 21.2
0.0
0.3
0.6
0.9
1.2
1.5
1.8
2.1
2.4
2010 2012 2014 2016 2018 2020 2022 2024 2026 2028 2030
Property Taxes ReceivedBlockman Elementary and Vista Del Mar Elementarymillions
of dollarsFY 2010 - FY 2030
Vista Del Mar
Blochman
forecast
pipeline in operation

16
In the Demographics Appendix to this report, we present characteristics of the schools and the Santa Barbara County populations associated with the most impacted schools: Vista Del Mar Elementary, Blochman Union Elementary and the Cuyama Unified School District. Federal Royalties Royalties are a payment to the Office of Natural Resources Revenue, a unit of the Department of the Interior, for extracted oil and gas, and is determined by a percentage of the total crude oil production value at the wellhead, less costs. Royalties are based on:
(1) the volume of the oil and gas produced (and verified by BOEM) (2) the royalty rate (3) deductions for the costs of transporting and/or processing the
oil and gas The extent of federal royalty payments that would be made to the U.S. Treasury with reinstatement of oil production from the Santa Ynez Unit are estimated in this report. The Federal royalty rate for oil production in federal waters has been as high as 18.75 percent.12 There was significant discussion to lower the rate to 12.5 percent in February and March of 2018 by the U.S. Department of Interior.13 The rate reduction was announced but in April, Interior Secretary Ryan Zinke decided against the reduction. Consequently, the current royalty rates on the leases in the Santa Ynez Unit are 16.667% with the exception of one lease that carries a 12.5% royalty.14
The Property Tax Impact Upon Resumption of Production In the event that trucking transportation is enabled, production will resume from the Santa Ynez Unit as early as 2020. In the event the
12 increased to that level (from 12.5 percent) under the Bush Administration 13 http://www.kallanishenergy.com/2018/03/02/interior-committee-approves-lower-royalty-rate-for-offshore-drilling/ 14 Royalty information provided by Natalie Welsh, Property/Title Analyst, ExxonMobil

17
pipeline replacement project commences, full production of crude oil from the Santa Ynez Unit is expected. The model can forecast the property tax increment for the County of Santa Barbara and the recipients of these future property taxes based on past distributions of total property tax collections. Between 2020 and 2023, a limited amount of oil production is restored and trucked from Las Flores Canyon to the Phillips 66 Santa Maria Pump Station or alternatively to the Plains Pentland Terminal in Kern County. From the beginning of 2023 and beyond, the pipeline is completed and becomes operational. Full production of the Santa Ynez Unit is assumed. The effects of the Project scenario in terms of new assessed valuation and the property tax levy are determined and presented in Chapter 4. The property tax dollar will be distributed as follows:15
Note: APN 381-220-051 and 391-220-050
15 Source for tax recipients and distributional shares: http://taxes.co.santa-barbara.ca.us/propertytax/ptcriteria.asp?Report=Tax+Bill+Search&ReturnTo=taxbillsearch.asp&FiscalYear=2013\
Las Flores Canyon and Popco percent
0001 - Santa Barbara County General 24.0
2280 - SB County Fire Protection Dist 14.4
2400 - SB County Flood Cntrl/Wtr Cnsrv 0.3
2610 - South Coast Flood Zn 2 1.4
3050 - Santa Barbara County Wtr Agency 0.4
4160 - SB Mosquito/Vector Dist 0.0
7801 - Vista Del Mar Dist General 17.5
8401 - Santa Ynez Valley HS Dist General 18.6
9401 - Allan Hancock CC Dist General 6.4
9801 - County School Srvc Fund 4.4
9802 - Education Revenue Augmentation 12.6
Total 100.0

18
Note: APN 397-360-052
In addition to the basic one percent property tax levy, there are also incremental payments added to the basic rate to finance public school and hospital bonds. In the Las Flores Canyon tax rate area, Allan Hancock now receives an additional 0.0135 percent and Santa Ynez High School receives 0.02256 percent. From the principal tax rate area of the Plains pipeline, the Lompoc Hospital receives 0.072 percent, Lompoc Unified School District receives 0.076 percent, and Allan Hancock receives 0.0238 percent. The gross property tax rates are 1.03606 percent and 1.171 percent respectively.16
16 There are many APNs that include the situs of the Plains Pipeline through Santa Barbara County. The table shown above is the principal APN but others will include the Santa Maria Union School District, Blochman Union Elementary, and the Cuyama Union School District as recipients of property taxes generated by the assessed value of the pipeline.
Plains All American Pipeline, LLC percent
0001 - Santa Barbara County General 23.5
2280 - SB County Fire Protection Dist 14.1
2400 - SB County Flood Cntrl/Wtr Cnsrv 0.3
2480 - Lompoc Valley Flood Zn 2 1.0
3050 - Santa Barbara County Wtr Agency 0.4
3290 - Lompoc Cemetery Dist 0.8
3750 - Lompoc Hospital Dist 2.0
4160 - SB Mosquito/Vector Dist 0.0
4500 - Cachuma Resource Cnsrv Dist 0.1
5800 - Santa Ynez River Wtr Cnsrv General 0.3
8901 - Lompoc Unified Dist General 34.5
9401 - Allan Hancock CC Dist General 6.2
9801 - County School Srvc Fund 4.3
9802 - Education Revenue Augmentation 12.5
Total 100.0

19
3. The Direct Effects
Project expenditures would nominally begin in 2019 by Exxon and Plains, but would increase in 2020, 2021, and 2022. Between 2019 and the end of 2022, the crude oil trucking scenario would be in place as only partial production from Platform Hondo and/or Harmony would occur, limiting full scale Santa Ynez Unit output and the attendant expenditure on materials and services in the local economy. After 2022 when the pipeline is completed, the massive construction expenditures would cease, but operating expenditures associated with the full production and processing of crude oil from the Santa Ynez unit would remain high.
The direct economic impacts associated with the resumption of oil production are the result of the incremental spending for offshore recommissioning work, onshore operations, maintenance, equipment rentals, transportation, contracting for services, and local government fees. They are also the result of the expenditure on labor, materials,
0
3,000
6,000
9,000
12,000
15,000
2008 2010 2012 2014 2016 2018 2020 2022 2024 2026 2028 2030
Santa Ynez Unit Oil ProductionSanta Barbara County thousands
of bbls of oil
2008 -- 2030
with The Project

20
and services needed to replace the existing Plains pipeline, principally in the years 2020 to 2022. Operating expenditures to maintain the pipeline will ensue every year thereafter. The estimated annual expenditures by Exxon and Plains are as follows:
Exxon Plains ----------- dollars --------------
2019 23,662,067 0 2020 29,328,573 900,000 2021 31,575,253 115,000,000 2022 31,222,000 230,000,000 2023 + 31,663,000 17,000,000 ------------------------------------------------------------------------------- Source: Exxon Mobil Corporation, Plains All American Pipeline, L.P.
These expenditures are the direct impact of the project, and represent the gross spending occurring inside Santa Barbara County for labor, goods, services, equipment, and materials.17 It is evident that the Project represents a significant capital dollar investment together with significant and continuous annual operating expenditures in the Santa Barbara County economy. Based on these expenditures, the direct employment effects that occur from the planned expenditures by Exxon are estimated as follows for the 2019 to 2030 period
17 See Appendix D for details associated with the expenditure estimates quoted by ExxonMobil and Plains to restart the Santa Ynez Unit, interim trucking, and rebuilt pipeline beginning in 2019.
Oil and Gas
Extraction,
Transportaton Food Professional Financial Retail
year and Processing Services Services Activities Trade
-------- numbers of workers -------------
2019 60.3 4.0 43.6 2.3 2.3
2020 95.5 7.6 68.1 2.3 4.2
2021 95.5 9.0 77.4 4.0 5.0
2022 95.9 10.5 82.6 4.8 5.5
2023-2030 104.2 11.8 83.6 5.3 5.5
21
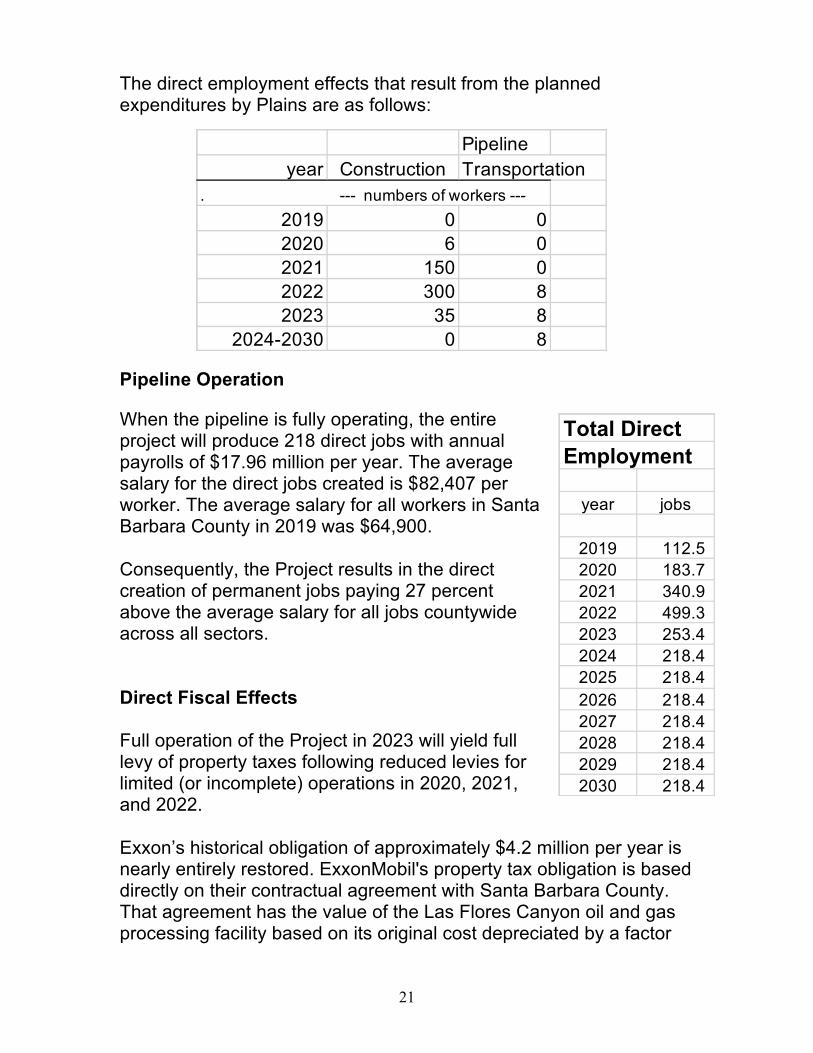
The direct employment effects that result from the planned expenditures by Plains are as follows:
Pipeline Operation
When the pipeline is fully operating, the entire project will produce 218 direct jobs with annual payrolls of $17.96 million per year. The average salary for the direct jobs created is $82,407 per worker. The average salary for all workers in Santa Barbara County in 2019 was $64,900. Consequently, the Project results in the direct creation of permanent jobs paying 27 percent above the average salary for all jobs countywide across all sectors. Direct Fiscal Effects Full operation of the Project in 2023 will yield full levy of property taxes following reduced levies for limited (or incomplete) operations in 2020, 2021, and 2022. Exxon’s historical obligation of approximately $4.2 million per year is nearly entirely restored. ExxonMobil's property tax obligation is based directly on their contractual agreement with Santa Barbara County. That agreement has the value of the Las Flores Canyon oil and gas processing facility based on its original cost depreciated by a factor
Pipeline
year Construction Transportation
. --- numbers of workers ---
2019 0 0
2020 6 0
2021 150 0
2022 300 8
2023 35 8
2024-2030 0 8
Total Direct
Employment
year jobs
2019 112.5
2020 183.7
2021 340.9
2022 499.3
2023 253.4
2024 218.4
2025 218.4
2026 218.4
2027 218.4
2028 218.4
2029 218.4
2030 218.4
22
determined by current production divided by plant capacity and taking into account a utility factor.18 With the construction of a brand new pipeline of which $371 million is located in Santa Barbara County, the basic one percent property tax based on the construction value method would be $3.7 million per year, and there are additional bond issue payments of approximately $625,000 annually. Consequently, the total direct property tax impact in the peak year would equal $8 million per year as a result of the Project. It will remain above $7 million annually over the forecast horizon presented in this analysis.19
18 See Settlement Agreement between Exxon Mobil Corporation and Santa Barbara County on November 1, 2002. 19 See pages 30-34 of this report for a discussion of the full fiscal impacts.

23
4. Total Economic and Fiscal Impacts
Direct, Indirect and Induced Total impacts represent the direct effects (or impacts) plus the indirect and induced impacts. These later two impact categories occur because of the economic multiplier. Indirect effects occur due to the spending by vendors who must hire workers and produce goods, materials, and services to meet the demands for materials, goods and services by Exxon and Plains in order for them to produce and process crude oil and construct, maintain and operate the pipeline. The induced effects are the spending effects by workers and households that earn labor income from Exxon and Plains as a result of the Project scenario. Under the no Project scenario, there are no workers on the Platforms, trucking oil, or processing oil at Las Flores Canyon. There are no workers building, maintaining, or operating Lines 901R and 903R for Plains. Under the Project scenario, all of these functions are operating with workers who are earning income. This income comprises most of their household income used for their expenditures on housing, food, transportation, and services. All of this expenditure is the induced effect and it continues for as long as the Project is operating. Indirect and induced effects are determined simultaneously by the Forecasting model. Therefore, we present the total impact of the project in terms of its direct effect and the total effect, which is the sum of the direct plus the indirect/induced effect. Fiscal Impacts The fiscal impacts represent how revenues and expenditures associated with the budget of Santa Barbara County are affected by the Project. With no Project, there is a bare bones assessment of real property values associated with storage tanks, the oil and gas processing plants, and pipelines because none of these facilities are

24
operating. They are therefore nearly valueless, only worth a minimal value if sold as scrap.20 With no Project, there is no expenditure on materials or services, and therefore there is no sales tax generated. There are no “other” taxes (like excise taxes or income taxes) generated nor revenues of any kind because there are no operations and therefore, no output and no income. Under the Project scenario, the oil and gas infrastructure in place retains its maximum value and it can be assessed accordingly. With the assessed valuation of property much greater, the property tax obligation increases. Sales taxes and other taxes are generated by expenditures (on materials, supplies, transportation, lodging, and other services and permit fees), and earned income by workers. With the generation of tax revenue, Santa Barbara County general fund revenues increase. Some expenditure categories also increase, but only marginally compared to the augmentation of revenue from property, sales, and other taxes. The impacts Quantified The first and most immediate impact of the Project is the return of workers to the Santa Ynez Unit Platforms and Las Flores Canyon, plus all of the contractors who provide services to the operations during the recommissioning phase, and the limited production phase that includes interim trucking. Meanwhile, construction begins on the replacement pipeline and up to 300 workers are employed in Santa Barbara County. Including maintenance and contractor jobs More construction jobs are indirectly created during Project startup and at the beginning of operations. They then diminish over time. Consequently, there is a surge of job creation in the oil and gas extraction, processing, and transportation sectors, and a surge of construction workers and contractors rebuilding the pipeline.
20 And according to the 2002 settlement formula between Exxon and Santa Barbara County regarding Las Flores Canyon, there would be no assessed value for the facility because there is no oil production.

25
700
750
800
850
900
950
1,000
1,050
1,100
1,150
1,200
2008 2010 2012 2014 2016 2018 2020 2022 2024 2026 2028 2030
Oil & Gas Extraction, Processeing, and Transportation Employment
Santa Barbara County jobs
2008 -- 2030
with The Project
6.5
7.0
7.5
8.0
8.5
9.0
9.5
10.0
2008 2010 2012 2014 2016 2018 2020 2022 2024 2026 2028 2030
Construction Employment / Santa Barbara County thousandsof jobs
2008 -- 2030
with The Project

26
The table shows the number of jobs created in the oil extraction, processing, and transportation sector, and the construction industry as a result of the Project.
180
185
190
195
200
205
210
215
220
225
2008 2010 2012 2014 2016 2018 2020 2022 2024 2026 2028 2030
Total Employment / Santa Barbara County thousandsof jobs
2008 -- 2030
with The Project
Total Job Impacts: Oil and Gas Activities
and Construction
Extraction & Construc-
year Processing tion
----- jobs created ------
2019 60 8
2020 113 21
2021 131 103
2022 132 440
2023 226 40
2024 221 110
2025 215 127
2026 210 74
2027 204 75
2028 199 57
2029 193 40
2030 188 32
Avg per year 174 94
27
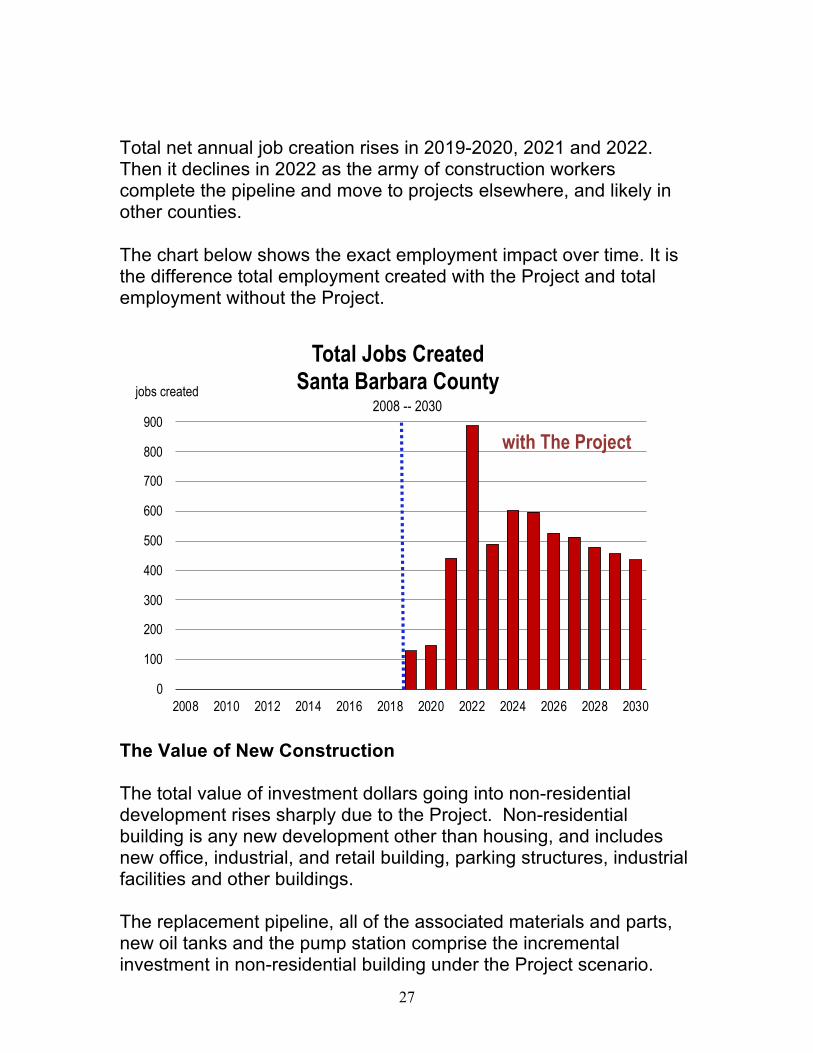
Total net annual job creation rises in 2019-2020, 2021 and 2022. Then it declines in 2022 as the army of construction workers complete the pipeline and move to projects elsewhere, and likely in other counties. The chart below shows the exact employment impact over time. It is the difference total employment created with the Project and total employment without the Project.
The Value of New Construction The total value of investment dollars going into non-residential development rises sharply due to the Project. Non-residential building is any new development other than housing, and includes new office, industrial, and retail building, parking structures, industrial facilities and other buildings. The replacement pipeline, all of the associated materials and parts, new oil tanks and the pump station comprise the incremental investment in non-residential building under the Project scenario.
0
100
200
300
400
500
600
700
800
900
2008 2010 2012 2014 2016 2018 2020 2022 2024 2026 2028 2030
Total Jobs CreatedSanta Barbara County
jobs created2008 -- 2030
with The Project

28
Also included in these estimates is the value of maintenance, repair, and rehabilitation to existing facilities associated with the Project operated by either Exxon or Plains. New development generates direct revenues to Santa Barbara County as permit fees. New non-residential investment dollars also create indirect effects: vendors who supply materials and contractors who provide services must purchase inputs and hire workers to meet the project demands of Exxon and Plains. These indirect effects create more jobs and household income.
Income and Spending The capital, material and supply expenditures associated with the Project along with the jobs created result in relatively large income impacts for Santa Barbara County. Total income going to workers, businesses and residents in the County of Santa Barbara rises to a peak year of $72 million in 2022, and remains in excess of $35 million per year for the life of the Project.
100
150
200
250
300
350
2008 2010 2012 2014 2016 2018 2020 2022 2024 2026 2028 2030
The Value of Non-Residential BuildingSanta Barbara County millions of
dollars2008 -- 2030
with The Project

29
Spending on taxable goods, services, and materials peaks in 2022 during the height of construction and recommissioning of the Santa Ynez Unit. More workers are employed earning peak incomes during this time.
New expenditures in Santa Barbara County as a result of The Project include (1) the direct spending on transportation services, gasoline, food, supplies, materials and equipment, (2) the indirect spending by vendors on similar items required as inputs to provide goods and services to Exxon and Plains, and (3) the induced spending by households of Project workers on the myriad of day to day goods and services including food, recreation, education and healthcare. Taxable sales rise to $69 million in 2022 and remain in excess of $10 million per year through 2027.
0
15
30
45
60
75
2008 2010 2012 2014 2016 2018 2020 2022 2024 2026 2028 2030
New Personal Income CreatedSanta Barbara County
millions of
constant
2019 dollars2008 -- 2030
with The Project

30
Fiscal Impacts The direct spending by the Project on equipment, materials, supplies and contractors, and the rehiring of workers to truck crude oil to refineries northward, to build the pipeline, to operate the Platforms, the Las Flores Canyon and the POPCO plant, and to service the entire operation for the life of the Project is a meaningful industrial expansion in Santa Barbara County. This direct spending creates millions of dollars in new household income for workers, vendors and contractors, spending by households in the local economy, and windfall tax dollars. And it is the windfall tax dollars that provide substantial benefits to the General Fund, County Fire Protection services, County flood control districts, recreation and parks, other County special districts and departments, but mostly to public schools. In the 2018-2019 fiscal year, schools received 47.5 percent of all property tax revenues in Santa Barbara County.21 However, schools received 61 percent of the property tax dollar in 2018-19 from real property in the County’s Assessor Parcels where
21 See County of Santa Barbara Property Tax Highlights, FY 2018-2019, for Secured and Unsecured Property Taxes
0
15
30
45
60
75
2008 2010 2012 2014 2016 2018 2020 2022 2024 2026 2028 2030
New Taxable Sales GeneratedSanta Barbara County
millions of
constant
2019 dollars2008 -- 2030
with The Project

31
the ExxonMobil facilities are located. Schools received 64 percent of property tax revenues from real property in the County’s Assessor Parcels in which the Plains Pipeline is located. Property Taxes With resumed operation of productive and high valued real property: the ExxonMobil Las Flores Canyon and POPCO plants, the property tax levy increases substantially. With a resumption of crude oil throughput that was in place prior to the pipeline shutdown (10.8 million barrels annually), the property tax levy estimated at $4.1 million is restored by 2024. With a new pipeline at a construction value of $370 million, the annual property tax levy rises sharply to $4.2 million (including school and hospital bonds). Together, the total incremental property tax levy under the Project including the repayment of school and hospital bonds is $8.3 million in 2024.
Total property taxes decline marginally due to diminishing throughput of crude oil over time from the Santa Ynez Unit, but remain in excess of $7 million per year over the forecast horizon presented in this analysis.
700
750
800
850
900
950
1,000
1,050
1,100
2008 2010 2012 2014 2016 2018 2020 2022 2024 2026 2028 2030
Property Tax LevySanta Barbara County
millions
of constant
2019 dollars2008 -- 2030
with The Project

32
The net property tax impact is the difference between the levy with the Project and without the Project
The principal assessor parcel numbers in which the relevant real properties are located are as follows:
The Plains pipeline travels through many other APNs throughout the county and the tax recipients change, principally the schools. So while Lompoc Unified is the principal beneficiary associated with the APNs shown above, as the pipeline winds north, Lompoc is replaced by Santa Maria High School, Blochman Union Elementary, and Cuyama Elementary and High Schools.
Principal Facilities Impacted by Pipeline Release
Assessor Parcel Number and Percent of
Property Tax Dollar allocated to Schools percent
prop taxes
Facility APN to schools
Las Flores Processing Facility 381-220-051 61
POPCO Gas Plant 381-220-050 61
Plains Pipeline 397-360-052 64
Plains Pipeline 397-350-071 64
Source: Santa Barbara County Auditor Controller Website
0
1
2
3
4
5
6
7
8
9
10
2008 2010 2012 2014 2016 2018 2020 2022 2024 2026 2028 2030
Net Annual Property Tax ImpactsSanta Barbara County
millions
of constant
2019 dollars
2008 -- 2030
with The Project

33
Source: See Appendix F. This summary table is the sum of the tax levies on ExxonMobil properties and the Plains lines 901R and 903R. The distributions are based on the 2018-2019 percentages of the property tax dollar by claimant.
Property Tax Recipients of the Project
Santa Barbara County
Annual
Amount
SB County General Fund 1,798,739
SB County Fire Protection 1,078,345
SB County Flood Control 24,460
South Coast Flood Zone 55,330
Lompoc Flood Zone 36,670
SB County Water Agency 31,453
SB Mosquito/Vector Dist 1,701
Cachuma Resource Cons Dist 3,310
Lompoc Cemetery District 28,504
Lompoc Hospital District 71,300
Vista Del Mar School District 693,600
Santa Ynez Valley High School 734,892
Santa Ynez River Water CD 11,732
5 Santa Barbara County schools* 1,248,476
Allan Hancock Comm College 476,600
County School Service Fund 329,556
Education Rev Aug Fund 954,333
Total $7,579,000
Bonds
Allan Hancock CC 139,406
Santa Ynez Valley High School 89,315
Lompoc Hospital 259,146
Lompoc Unified 275,001
Total Tax $8,341,868
* Santa Maria Jt HS Dist,
Lompoc Unified,
Blochman Union,
Cuyuma Elementary and
Cuyuma High School
34
It is important to note that the Santa Barbara County General Fund receives $1.8 million dollars. This is an annual revenue. It goes to finance the Santa Barbara County Sheriff, and public safety departments in general, Health and Human Services, Public Works, and general government services. The Santa Barbara County Fire Services District receives nearly $1.1 million, and a spate of other county services are supported by the Project. Other Revenue Other taxes including sales taxes from expenditures on final goods and services in Santa Barbara County, permit fees, and licenses also result from the Project. Estimated other taxes peak in 2022 at nearly $229,000, and remain in excess of $150,000 annually through 2030 and beyond. Tax revenues from the Project will be used to finance new programs within County government, and/or employ additional teachers and staff at public schools, or increase special district or departmental staff within the County of Santa Barbara. The bond issue payments also have the potential to create permanent positions within the schools It is estimated that the incremental revenues have the potential to increase public sector jobs by between 120 and 150 new positions. This new job creation is all indirect and is part of the total employment impact of the project.

35
0
25
50
75
100
125
150
175
200
225
250
2008 2010 2012 2014 2016 2018 2020 2022 2024 2026 2028 2030
Other Tax ImpactsSanta Barbara County
thousands
of constant
2019 dollars2008 -- 2030
with The Project
0
25
50
75
100
125
150
175
2008 2010 2012 2014 2016 2018 2020 2022 2024 2026 2028 2030
Potential Jobs Created in the Public SectorSanta Barbara County
jobs2008 -- 2030
with The Project

36
Federal Royalties The total value of oil production annually was estimated based on estimates of oil price and the annual production volume. California offshore oil price projections are based on forecasts by the Energy Information Administration Royalties are calculated on the basis of net revenues, or the total wellhead value of oil less costs of processing and transportation. Costs are estimated at 15 percent of total gross revenues and are subtracted from gross revenues. Royalty payments rise with the start of the project in 2020. Full production occurs in calendar 2023 and thereafter. The royalty is calculated at $144 million in FY 2023 and remains in excess of $130 million per year through 2030 period. The incremental decline in royalties is consistent with the annual decline in crude oil production over time.
0
20
40
60
80
100
120
140
160
2012 2014 2016 2018 2020 2022 2024 2026 2028 2030
Federal Royalties / Santa Ynez Unitmillions of
dollarsFY 2012 -- FY 2030

37
The Economic Multiplier The economic multiplier represents the rate at which total jobs, or final income, or final output is created from the initial direct stimulus of the economy brought by the Project. The size of the multiplier depends on how the initial expenditure stimulus by ExxonMobil and Plains is spent and re-spent in the economy by workers, vendors and other recipients of direct project spending including the tax beneficiaries. The calculation of the multiplier for reporting purposes is the ratio of total output to direct output, or total employment to direct employment, or total income to direct income. Essentially then, there are three general multipliers that are typically reported to ascertain the relative “impact” of the project on the regional economy. The model does not produce a calculation for output. That is more of a theoretical construct important to input-output models. However, the econometric model does determine both employment and income
20
35
50
65
80
95
110
125
2012 2014 2016 2018 2020 2022 2024 2026 2028 2030
Crude Oil Price / California Offshoredollarsper bbl
2012 -- 2030

38
(and a host of other economic indicators). Consequently, those two multipliers can be reported for each year of the project presented in this analysis. The multiplier effects are calculated as the ratio of the total impact to the direct impact, for employment and for income.
Economic Multiplier Effects
Due to the Project / Santa Barbara CountyTotal
Direct Total Employment Direct Direct Personal Income
year Employ Employ Multiplier Avg Salary Income Income Multiplier
----- jobs ------ dollars ($000) ($000)
2019 112.5 129.3 1.15 32,653 3,673 9,280 2.53
2020 183.7 148.1 0.81 35,964 6,606 18,290 2.77
2021 340.9 441.8 1.30 85,371 29,100 41,110 1.41
2022 499.3 887.3 1.78 105,733 52,797 71,560 1.36
2023 253.4 489.5 1.93 91,759 23,255 44,130 1.90
2024 218.4 601.9 2.76 91,759 20,043 49,530 2.47
2025 218.4 596.5 2.73 91,759 20,043 47,770 2.38
2026 218.4 524.8 2.40 91,759 20,043 42,200 2.11
2027 218.4 511.0 2.34 91,759 20,043 40,930 2.04
2028 218.4 477.4 2.19 91,759 20,043 39,200 1.96
2029 218.4 455.4 2.08 91,759 20,043 38,090 1.90
2030 218.4 436.4 2.00 91,759 20,043 37,100 1.85
Average 243.2 475.0 1.95 82,816 21,311 39,933 1.87
39
7. Summary
The interim trucking proposal by Exxon which ultimately leads to an efficient transition back to full time production of the Santa Ynez Unit and maximum delivery of crude oil through the replacement of the Plains All American pipeline, has broad impacts on the economy of Santa Barbara County. The Project scenario includes interim trucking of a limited production of crude oil from Platform Hondo beginning in 2019 and continuing through the end of 2022. The Plains All American Pipeline Company receives approval to replace lines 901and 903. Plains undertakes construction on replacement line 901R and 903R in 2022. The pipeline is projected to be completed by the end of calendar year 2022. By 2023, all 3 platforms of the Santa Ynez Unit have been recommissioned and are producing at the pre-pipeline shutdown levels that prevailed in 2014 and early 2015. The build-up to full production is accompanied by large capital investments in staffing, materials, supplies, contractors, and services provided by workers and vendors in Santa Barbara County. The pipeline construction employs hundreds of construction workers and is accompanied by large capital expenditures on equipment, materials, supplies, contractors, and services provided by vendors and workers in Santa Barbara County. The expenditures on labor, materials, equipment and services drive the economic impacts estimated and presented herein. The return of large and previously idled industrial equipment and plants to productive use enables assessed valuations of productive industrial facilities to return to pre-pipeline shutdown levels producing windfall property tax revenues for the Santa Barbara County General Fund, the K-12 schools, Fire protection, and special public works and services departments and districts. The Plains pipeline is reassessed at a much higher valuation (because the pipeline is new, based on a significantly higher

40
construction value, and is undepreciated) and this produces substantially higher property tax revenues to the same public sector recipients. K-12 schools that have incurred significant declines in property tax revenue as a result of the pipeline shutdown should be made whole or close to whole again. Property taxes in the tax rate areas benefitting from the new replacement pipeline will increase beyond the pre-shutdown levels. This will be especially significant for Cuyuma Unified School, Vista Del Mar Elementary, and Blochman Union Elementary. Federal royalties on the production value of oil from the Santa Ynez Unit are estimated at in excess of $125 million per year through 2030. These payments are made by ExxonMobil to the Department of Interior. Most of this revenue goes to the U.S. Treasury. A portion goes back to 38 States, and a portion goes to the Land and Water Conservation Fund, the National Historic Preservation Fund, and the Reclamation Fund. The employment multiplier associated with the project from 2019 to 2030 is 1.95. The income multiplier associated with the project from 2019 to 2030 is 1.87. For every direct job that the Project creates, nearly 1 full job is also created in the local economy as a result of the indirect and induced spending effects. For every dollar in income produced by the Project, an additional 87 cents is created in the local economy as a result of the indirect and induced spending effects. The economic impacts are not short term; they remain in place every year, diminishing marginally over the life of the project.
41
References
Plains Announces Plans to Replace Santa Barbara County Oil Pipelines, Noozhawk, August 16, 2017, online. https://www.noozhawk.com/article/plains_announces_plans_to_replace_santa_barbara_county_oil_pipelines Line 901 & 903 Replacement Project Development Plan, Plains All American Pipeline, Santa Barbara County Planning Development Dept, August, 2017 Plains Pipeline Company plan schedule County of Santa Barbara Auditor-Controller’s Office, Tax Bill Search, 1996-2019, by parcel number http://taxes.co.santa-barbara.ca.us/propertytax/ptcriteria.asp?Report=Tax+Bill+Search&ReturnTo=taxbillsearch.asp&FiscalYear=2013
California County Level Economic Forecast 2018-2050, prepared for the Transportation Economics Branch, Office of State Planning, California Dept of Transportation, by The California Economic Forecast, September 2018. http://www.dot.ca.gov/hq/tpp/offices/eab/socio_economic.html http://www.dot.ca.gov/hq/tpp/offices/eab/socio_economic_files/2018/Full_Report_2018.pdf
Peirce, John, “State and Local Taxation of the oil industry in California,” Proceedings of the Annual Conference on Taxation under the Auspices of the National Tax Association, Vol. 41 (1948), pp. 249-254 Published by: National Tax Association Freeport McMoRan to decommission the Point Arguello Unit https://www.boem.gov/Freeport-McMoRan-Oil-and-Gas-LLC-Lease-Expiration/
Settlement Agreement between Exxon Mobil Corporation and Santa Barbara County on November 1, 2002 Outer Continental Shelf: Debate Over Oil and Gas Leasing and Revenue Sharing” https://www.everycrsreport.com/reports/IB10149.html
42
Appendix A Assessed Valuation and Property Tax Reduction due to the Pipeline Shutdown
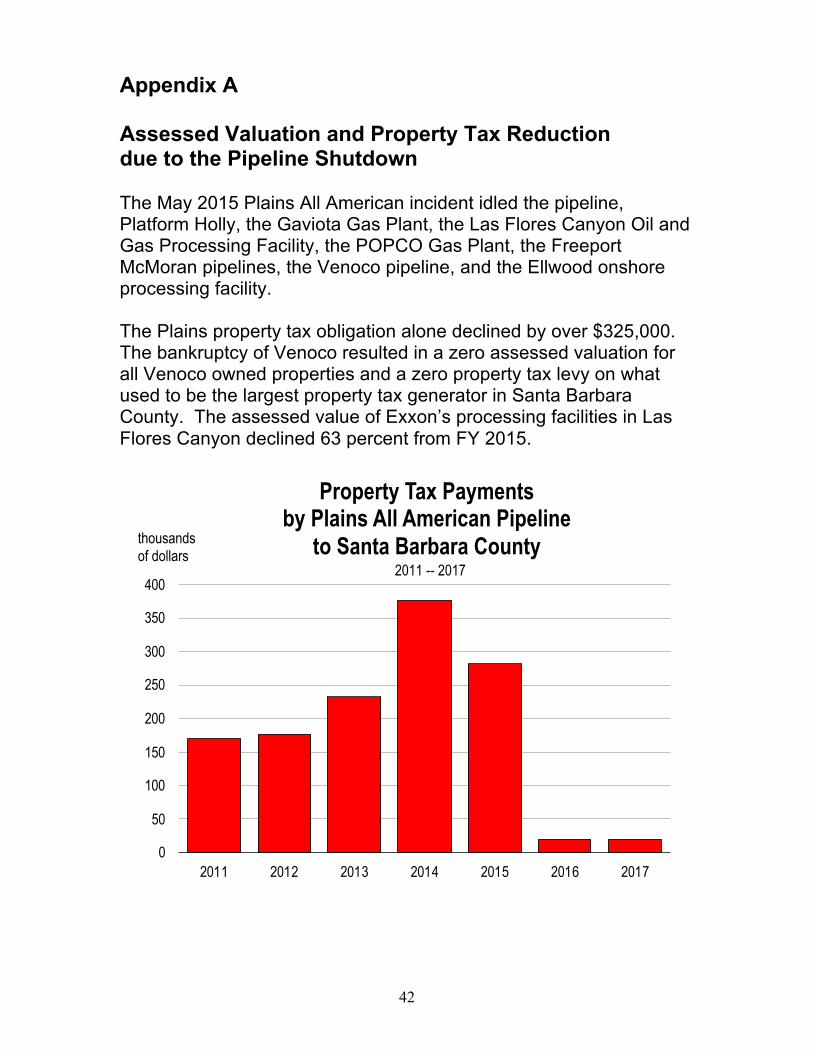
The May 2015 Plains All American incident idled the pipeline, Platform Holly, the Gaviota Gas Plant, the Las Flores Canyon Oil and Gas Processing Facility, the POPCO Gas Plant, the Freeport McMoran pipelines, the Venoco pipeline, and the Ellwood onshore processing facility. The Plains property tax obligation alone declined by over $325,000. The bankruptcy of Venoco resulted in a zero assessed valuation for all Venoco owned properties and a zero property tax levy on what used to be the largest property tax generator in Santa Barbara County. The assessed value of Exxon’s processing facilities in Las Flores Canyon declined 63 percent from FY 2015.
0
50
100
150
200
250
300
350
400
2011 2012 2013 2014 2015 2016 2017
Property Tax Payments by Plains All American Pipeline
to Santa Barbara County2011 -- 2017
thousands
of dollars

43
Pipeline Shutdown-Impacted Parcels / SB County
Assessed Valuation
Property FY2015 FY2018
Las Flores Canyon $300,937,132 $75,576,030
POPCO Gas Plant $106,270,866 $50,384,020
Gaviota Oil & Gas Plant $41,444,079 $1,366,652
Pt Arguello Pipeline $12,364,557 $5,305,202
Veneco Line 96 $22,540,000 $0
Platform Holly $537,580,000 $0
Ellwood Oil Field $117,998,000 $0
Plains AA Pipeline $30,700,000 $2,295,333
Totals $1,169,834,634 $134,927,237
Source: Santa Barbara County Auditor Controller Office
and Plains All American Pipeline Company
Facilities Impacted by Pipeline Shutdown
and Assessor Parcel Number
Facility APN
Las Flores Processing Facility 381-220-051
POPCO Gas Plant 381-220-050
Plains Pipeline 397-360-052
Point Arguello Pipeline 081-130-070
Gaviota Oil &Gas Plant and Plains Pipeline 397-350-071
Veneco Line 96 379-210-061
Platform Holly 379-000-052
Ellwood Oil Field 379-000-053

44
Platform Holly and the Ellwood Onshore Facility On May 14, 2018, the California State Lands Commission announced that Platform Holly would be fully decommissioned by mid-2019. The platform and the Ellwood Onshore Processing Facility, the first onshore stop for gas and oil collected at the platform, have been idle since the Plains All American Pipeline incident on May 19th, 2015. Venoco, the oil company that had been operating the platform and onshore facility, declared bankruptcy in April of 2017 and surrendered its lease on the Ellwood Oil Field to the State Lands Commission. This marked the end of oil and gas production at that location after more than 50 years of operation. It also represented an end to revenue generation for Santa Barbara County and recipient property tax claimants, the largest being the Goleta Union School District. These fiscal revenues will not be offset by the Project.
Point Arguello and the Gaviota Oil and Gas Processing Facility Three offshore platforms (Hermosa, Harvest and Hidalgo) produce and process oil and gas from the Point Arguello Offshore Oil Field. Pipelines are used to transport oil and gas produced and processed offshore to the Gaviota Oil and Gas Processing Facility located on the north side of Highway 101. The facility uses the sales quality gas to generate electricity and steam for use onsite. Excess electricity can be sold to the public utility grid. The processed crude oil is pumped into the Plains All American pipeline. in May 2018, Freeport-McMoRan announced their intention to decommission Platforms Hermosa, Harvest and Hidalgo of the Point Arguello unit. No oil has been produced since the pipeline shutdown and Freeport has sold its other California Central Coast operations to Sentinel Peak Resources California LLC.22
22 https://www.pacbiztimes.com/2016/10/17/freeport-mcmoran-selling-onshore-central-coast-oil-and-gas-
properties/

45
On November 27, 2018, the Point Arguello leases with the Bureau of Ocean Energy Management expired. The Bureau of Safety and Environmental Enforcement has requested a formal application from Freeport to decommission Platforms Harvest, Hermosa, and Hidalgo. The offshore Point Arguello pipeline will also be decommissioned.23 This latest event all but ends the productive contribution of the platforms and the processing plant, and therefore the productive valuation of the properties. Consequently, only the ExxonMobil Santa Ynez Unit remains as the sole surviving oil and gas operation from the Plains pipeline incident of May 19, 2015.
23 https://www.boem.gov/Freeport-McMoRan-Oil-and-Gas-LLC-Lease-Expiration/

46
Appendix B / the forecast model The Santa Barbara County forecast model is an econometric model that simulates a myriad of economic indicators that broadly describe the Santa Barbara County economy. The model has been in use since the late 1980s when the original theoretical concept was developed by Mark Schniepp as the Director of the UCSB Economic Forecast Project. The model was used to forecast the Santa Barbara County economy every year and the results were presented at large public presentations held at the Double Tree Resort or the Miramar Hotel in Santa Barbara, from 1985 to 2000. The model was further refined and developed when Dr. Schniepp became full time Director of the California Economic Forecast in 2000, specifically to address annual county forecast assignments for the California Department of Transportation. Those assignments—to forecast every County economy in California---have continued every year since. Forecasts of Santa Barbara County using the econometric forecasting model are updated annually and can be found at this website: http://www.dot.ca.gov/hq/tpp/offices/eab/socio_economic.html The model has also been used to forecast the Santa Barbara County economy for other assignments, including the annual Santa Barbara County Association of Realtors Economic Outlook Conferences: 2001 to 2008, and The Radius Group Economic Outlook Conferences: 2010 to 2015. Consequently, the forecasting model has been utilized over the last 33 years for many users updated annually to produce base case and impact forecasts for the County’s economy.
47
Appendix C / property taxes
County and City assessors in California use methods specified in the Revenue and Taxation Code to arrive at the assessed valuation of oil property.24 The practices fall into three categories: (1) comparative sales approach (2) cost approach (3) income approach Santa Barbara has historically used a cost approach for the assessment of both the Las Flores Canyon and the POPCO plants. Post pipeline rupture, the County has used an income approach with allocation to the taxable facilities as a proxy for the cost approach. This report assumes that the County will use the agreed cost approach on resumption of full production from the Santa Ynez Unit. California levies ad valorem taxes on real property, including mineral properties. Values are determined and assessed at the county governmental level. The statutory tax rate is 1%, but is subject to increases based on needs to retire voter approved debt. In fiscal year 2015-2016 the rate was 1.06%. Values are based on an adjusted acquisition value or the current market value, whichever is lower. Adjustments to acquisition value are made for depletion and increase in reserves and added or removed improvements. Pipelines however, are assessed by the State Board of Equalization using the unitary valuation method. The method uses cost, income and market approaches although the latter approach is given more weight in valuing regulated pipeline property. Unregulated pipelines that cross county lines are valued locally by using the replacement cost new, less depreciation method. Property in California is assessed at 100% of fair market value and taxed at 1% of value. Pipeline property that is annually assessed is not subject to Proposition 13 base year limitations.
24 California State Board of Equalization Assessors' Handbook, AH 566, Assessment of
Petroleum Properties, Chapter 5: General Appraisal Methods and Assessment Under Proposition
13.
48
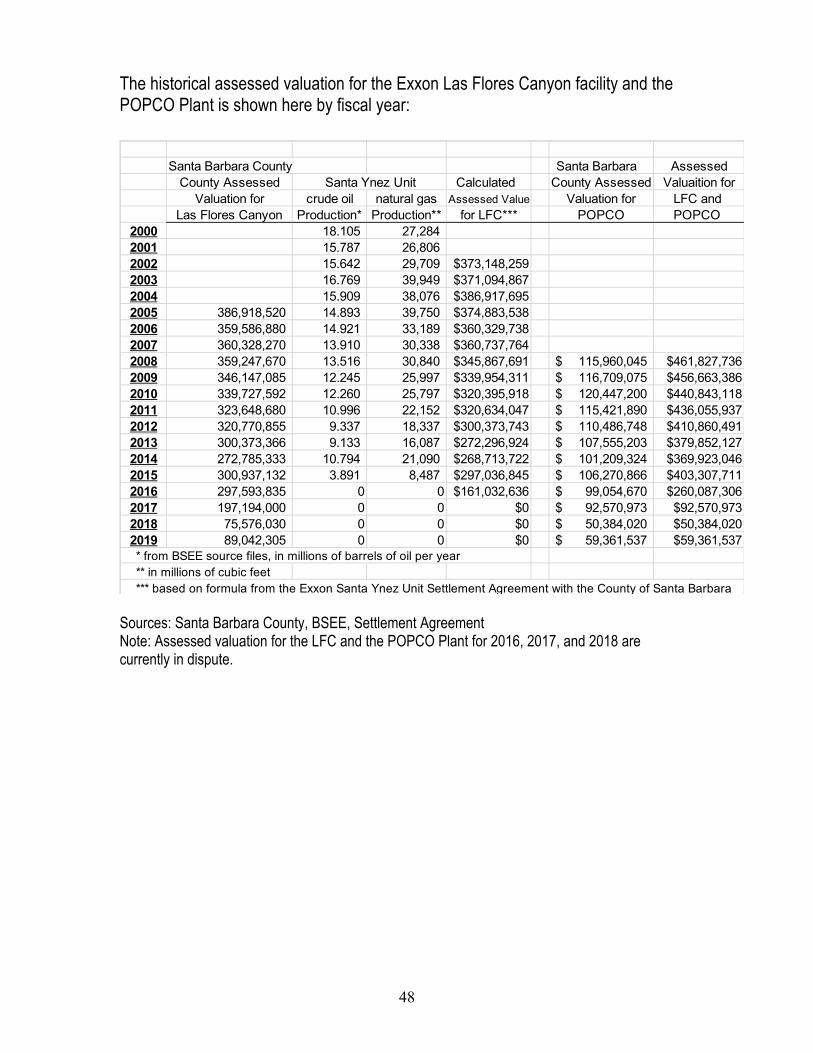
The historical assessed valuation for the Exxon Las Flores Canyon facility and the POPCO Plant is shown here by fiscal year:
Sources: Santa Barbara County, BSEE, Settlement Agreement Note: Assessed valuation for the LFC and the POPCO Plant for 2016, 2017, and 2018 are currently in dispute.
Santa Barbara County Santa Barbara Assessed
County Assessed Santa Ynez Unit Calculated County Assessed Valuaition for
Valuation for crude oil natural gas Assessed Value Valuation for LFC and
Las Flores Canyon Production* Production** for LFC*** POPCO POPCO
2000 18.105 27,284
2001 15.787 26,806
2002 15.642 29,709 $373,148,259
2003 16.769 39,949 $371,094,867
2004 15.909 38,076 $386,917,695
2005 386,918,520 14.893 39,750 $374,883,538
2006 359,586,880 14.921 33,189 $360,329,738
2007 360,328,270 13.910 30,338 $360,737,764
2008 359,247,670 13.516 30,840 $345,867,691 115,960,045$ $461,827,736
2009 346,147,085 12.245 25,997 $339,954,311 116,709,075$ $456,663,386
2010 339,727,592 12.260 25,797 $320,395,918 120,447,200$ $440,843,118
2011 323,648,680 10.996 22,152 $320,634,047 115,421,890$ $436,055,937
2012 320,770,855 9.337 18,337 $300,373,743 110,486,748$ $410,860,491
2013 300,373,366 9.133 16,087 $272,296,924 107,555,203$ $379,852,127
2014 272,785,333 10.794 21,090 $268,713,722 101,209,324$ $369,923,046
2015 300,937,132 3.891 8,487 $297,036,845 106,270,866$ $403,307,711
2016 297,593,835 0 0 $161,032,636 99,054,670$ $260,087,306
2017 197,194,000 0 0 $0 92,570,973$ $92,570,973
2018 75,576,030 0 0 $0 50,384,020$ $50,384,020
2019 89,042,305 0 0 $0 59,361,537$ $59,361,537 * from BSEE source files, in millions of barrels of oil per year
** in millions of cubic feet
*** based on formula from the Exxon Santa Ynez Unit Settlement Agreement with the County of Santa Barbara
49
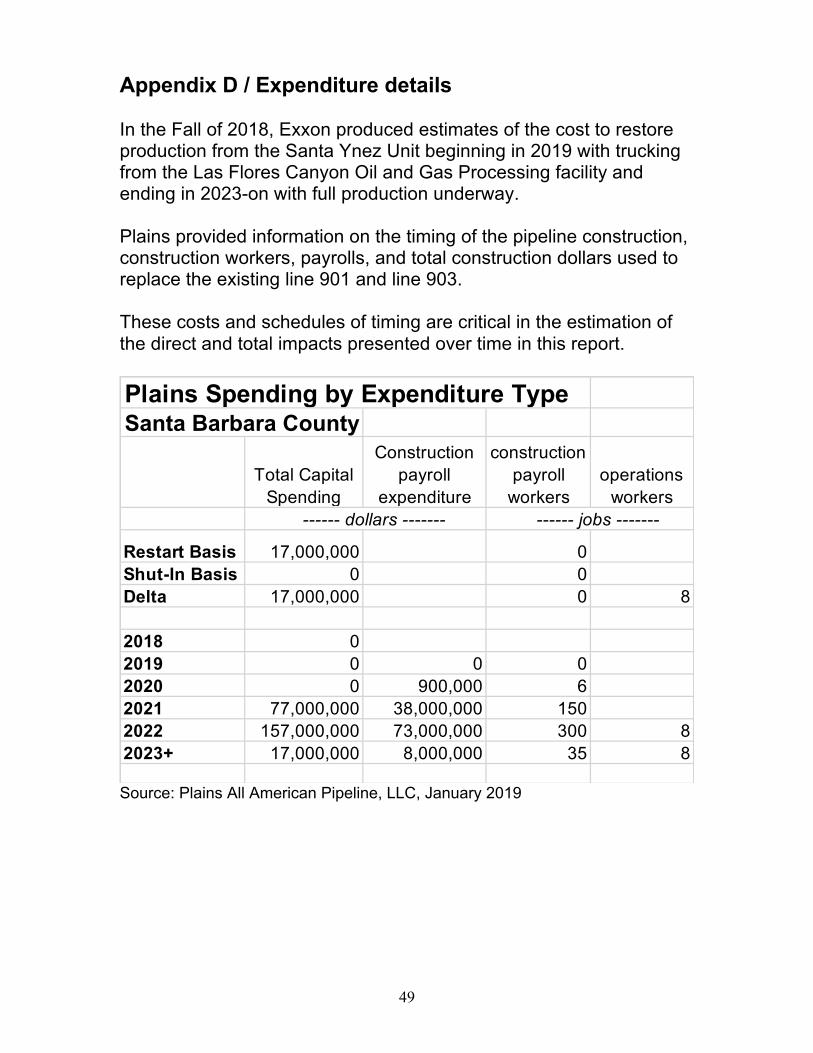
Appendix D / Expenditure details
In the Fall of 2018, Exxon produced estimates of the cost to restore production from the Santa Ynez Unit beginning in 2019 with trucking from the Las Flores Canyon Oil and Gas Processing facility and ending in 2023-on with full production underway. Plains provided information on the timing of the pipeline construction, construction workers, payrolls, and total construction dollars used to replace the existing line 901 and line 903. These costs and schedules of timing are critical in the estimation of the direct and total impacts presented over time in this report.
Source: Plains All American Pipeline, LLC, January 2019
Plains Spending by Expenditure TypeSanta Barbara County
Total Capital
Spending
Construction
payroll
expenditure
construction
payroll
workers
operations
workers
Restart Basis 17,000,000 0
Shut-In Basis 0 0
Delta 17,000,000 0 8
2018 0
2019 0 0 0
2020 0 900,000 6
2021 77,000,000 38,000,000 150
2022 157,000,000 73,000,000 300 8
2023+ 17,000,000 8,000,000 35 8
------ dollars ------- ------ jobs -------

50
Exxon Spending by Type of Expenditure / Santa Barbara County(all values in constant 2019 dollars)
Total - All
Local
Spending
Well
Services
Employee
Costs
Contract
Charges
Materials and
Consumables
Restart Basis 41,447,000 76,000 16,730,000 3,591,000 306,000
Shut-In Basis 15,127,000 0 2,714,000 749,000 84,000
Delta 26,320,000 76,000 14,016,000 2,842,000 222,000
2017 15,127,000 0 2,714,000 749,000 84,000
2018 21,301,560 0 6,401,680 1,118,460 112,860
2019 34,637,067 0 12,028,533 2,027,900 183,900
2020 40,303,573 25,333 16,698,720 2,937,340 254,940
2021 42,550,253 25,333 16,717,760 3,335,220 286,020
2022 42,197,000 76,000 16,730,000 3,591,000 306,000
2023+ 41,447,000 76,000 16,730,000 3,591,000 306,000
Maitenance
Contract
Charges -
Lab Testing Logs
Field
Accommo
dations -
Catering
Materials and
Consumables
Restart Basis 8,948,000 2,971,000 2,879,000 1,647,000 503,000
Shut-In Basis 3,444,000 1,834,000 2,170,000 1,319,000 194,000
Delta 5,504,000 1,137,000 709,000 328,000 309,000
2017 3,444,000 1,834,000 2,170,000 1,319,000 194,000
2018 4,681,760 1,981,810 2,262,170 1,361,640 234,170
2019 6,863,733 2,345,650 2,489,050 1,466,600 333,050
2020 8,683,040 2,345,650 2,489,050 1,571,560 431,930
2021 8,844,320 2,709,490 2,715,930 1,617,480 475,190
2022 8,948,000 2,868,670 2,815,190 1,647,000 503,000
2023+ 8,948,000 2,971,000 2,879,000 1,647,000 503,000
Transpor-
tation -
Company
Vehicles
Property -
Prod, Prop,
Other Taxes
Lic Fees -
Area &
License
Fees
Other SB
County
Spending
Misc
Materials &
Services
Restart Basis 105,000 4,184,000 545,000 4,188,000 4,188,000
Shut-In Basis 36,000 4,152,000 420,000 1,394,000 1,394,000
Delta 69,000 32,000 125,000 2,794,000 2,794,000
2017 36,000 4,152,000 420,000 1,394,000 1,394,000
2018 44,970 4,156,160 436,250 2,132,220 1,757,220
2019 67,050 4,166,400 476,250 6,401,300 2,651,300
2020 89,130 4,176,640 516,250 3,500,000 3,545,380
2021 98,790 4,181,120 516,250 4,295,380 3,936,540
2022 105,000 4,184,000 533,750 5,811,540 4,100,000
2023+ 105,000 4,184,000 545,000 4,938,000 4,188,000
Note: Miscelanious materials and services from non-SB County contractor invoices
where materials/services were sub-sourced directly from within SB County
Source: Exxon Mobil Corporation, December 2018, April 2019

51
Appendix E / Fiscal Data Used in This Report
Source: Santa Barbara County annual budgets, CAFR (http://countyofsb.org/auditor/default.aspx?id=1234) State Board of Equalization (http://www.boe.ca.gov/annual/annualrptsarchives.htm)
Santa Barbara County Fiscal Indicators
General Fund All Funds
Fiscal
year
ending
Expendi-
tures Revenues
Retail
Sales
Taxes
All other
Taxes
Property
Taxes
Property
Taxes
Net
Taxable
Assessed
Valuation
Property
Taxes
CAFR BOE
1981 142,348 145,019 6,066 31,855 1,931,798 85,097
1982 153,103 155,608 7,441 36,121 8,958,231 97,853
1983 167,913 170,037 7,925 40,117 9,955,141 107,600
1984 182,715 181,662 8,673 42,905 10,703,448 114,393
1985 194,859 215,123 9,920 48,829 12,083,972 127,897
1986 228,357 230,667 5,238 10,888 52,661 13,365,796 140,434
1987 254,482 238,348 5,462 11,957 57,939 14,509,663 148,315
1988 273,026 253,256 5,621 12,417 63,830 15,832,914 162,896
1989 291,267 277,771 6,047 13,342 66,669 17,210,549 175,544
1990 352,673 317,382 6,588 14,475 73,120 18,831,226 191,920
1991 411,643 354,861 6,630 15,754 79,768 20,846,973 212,365
1992 409,702 372,899 6,491 16,455 84,717 22,207,455 225,822
1993 374,814 367,709 6,453 15,960 81,726 23,194,090 236,488
1994 385,940 397,182 6,627 15,744 73,744 24,107,964 254,862
1995 411,189 385,835 6,799 14,285 62,567 226,629 24,379,620 248,185
1996 422,836 427,111 7,799 13,092 65,527 232,075 24,898,062 254,207
1997 429,650 429,192 6,899 13,923 67,479 239,689 25,613,476 262,212
1998 451,250 448,974 8,599 15,121 70,651 249,075 26,637,639 273,014
1999 489,655 494,556 8,899 16,312 75,066 263,442 28,267,350 292,709
2000 513,282 536,161 10,798 18,141 79,724 282,429 30,001,428 310,565
2001 553,912 580,832 12,198 20,152 90,271 306,674 32,566,457 334,739
2002 631,638 635,185 11,321 21,989 95,596 333,413 35,435,546 365,246
2003 637,282 614,534 8,896 17,610 97,550 355,911 38,162,136 392,838
2004 647,656 633,927 9,109 18,223 108,890 385,361 40,824,748 420,599
2005 678,295 686,931 6,959 47,578 117,258 419,120 44,376,975 455,690
2006 700,020 725,528 7,820 59,776 130,195 465,955 49,053,017 506,461
2007 744,824 764,603 8,887 63,497 143,920 515,578 54,085,048 565,798
2008 804,764 801,125 7,847 67,107 153,970 554,766 58,033,894 607,546
2009 823,779 824,030 7,304 63,149 160,569 577,749 60,696,539 635,507
2010 810,139 816,096 7,094 59,504 162,607 580,344 61,175,442 645,578
2011 909,484 829,347 7,100 57,102 163,830 579,631 61,464,193 648,716
2012 848,794 857,599 7,933 62,759 169,078 590,061 62,347,292 657,939
2013 834,239 851,587 6,930 62,536 176,145 599,011 62,997,084 664,811
2014 913,840 933,755 6,880 28,427 177,222 625,647 65,564,639 695,420
2015 905,935 924,876 7,797 70,178 187,341 655,252 69,059,890 732,945
2016 937,833 905,725 8,711 73,081 195,475 684,131 72,467,183 771,998
2017 985,036 1,010,887 10,442 75,088 205,598 714,505 75,421,929 802,161
2018 1,031,712 1,061,743 10,269 75,933 219,412 762,510 79,570,135 846,280

52
Appendix F / Property Tax Recipients under the Project
Las Flores Canyon and Popco 1% levy . . . . . 3,959,000$
Property Tax Recipient percent distribution
0001 - Santa Barbara County General 24.0 949,048
2280 - SB County Fire Protection Dist 14.4 569,490
2400 - SB County Flood Cntrl/Wtr Cnsrv 0.3 12,913
2610 - South Coast Flood Zn 2 1.4 55,330
3050 - Santa Barbara County Wtr Agency 0.4 16,613
4160 - SB Mosquito/Vector Dist 0.0 898
7801 - Vista Del Mar Dist General 17.5 693,600
8401 - Santa Ynez Valley HS Dist General 18.6 734,892
9401 - Allan Hancock CC Dist General 6.4 251,627
9801 - County School Srvc Fund 4.4 174,076
9802 - Education Revenue Augmentation 12.6 500,513
Total 100 3,959,000
Bonds Bond rate
9421 - Allan Hancock CC Bond 1.4 53,447
8451 - Santa Ynez Valley HS 2.3 89,315
Total 4,101,762
Plains All American Pipeline, LLC 1% levy . . . . . 3,620,000$
Property Tax Recipient percent distribution
0001 - Santa Barbara County General 23.5 849,691
2280 - SB County Fire Protection Dist 14.1 508,855
2400 - SB County Flood Cntrl/Wtr Cnsrv 0.3 11,548
2480 - Lompoc Valley Flood Zn 2 1.0 36,670
3050 - Santa Barbara County Wtr Agency 0.4 14,839
3290 - Lompoc Cemetery Dist 0.8 28,504
3750 - Lompoc Hospital Dist 2.0 71,300
4160 - SB Mosquito/Vector Dist 0.0 803
4500 - Cachuma Resource Cnsrv Dist 0.1 3,310
5800 - Santa Ynez River Wtr Cnsrv General 0.3 11,732
8901 - Lompoc Unified Dist General 34.5 1,248,476
9401 - Allan Hancock CC Dist General 6.2 224,973
9801 - County School Srvc Fund 4.3 155,480
9802 - Education Revenue Augmentation 12.5 453,820
Total 100.0 3,620,000
Bonds Bond rate
3756 - Lompoc Hospital 7.2 259,146
8951 - Lompoc Unified 7.6 275,001
9421 - Allan Hancock CC 2.4 85,959
Total 4,240,106

53
Demographics Appendix While the revenue growth of many schools has been significantly impacted by the pipeline shutdown and subsequent shutdown of industrial real property in Santa Barbara County, two schools in particular have suffered serious declines in property tax revenues impacting school resources. The areas of the county in which these schools are located are remote; consequently, the schools have had to rely on existing oil and gas infrastructure for tax distributions because very little other real property resources have been built or are going to be built in the future. Generally, these regions of the County are less affluent, less ethnically diverse, have fewer workers per household, and a greater percentage of the population is below the federal poverty line, relative to all of Santa Barbara County. Federal Poverty Guidelines: 2019 Family or Household Minimum Income Size Needed
1 $12,490 2 $16,910 3 $21,330 4 $25,759 5 $30,170 6 $34,590 ---------------------------
Source: ASPE, U.S. Department of Health and Human Services https://aspe.hhs.gov/2019-poverty-guidelines
The performance of the schools generally lags the average performance of schools in the county. The only exception is English language / literacy testing at Vista Del Mar Elementary. There, a higher percentage of the student enrollment met or exceeded standards relative to the countywide student body for elementary schools.

54
With fewer people per household working, with lower household incomes, and with students generally requiring enhanced learning programs for English speaking and mathematics, school resources may be strained as a result of the decline in property tax distributions to these schools.
Ethnic Diversity Index: a higher number indicates more ethnically diverse
School Demographics and PerformanceCuyuma Unified, Vista Del Mar and Benjamin Foxen Elementary
School Year 2017-2018Benjamin
Cuyama Cuyama Vista Del Mar Foxen
Elementary High Elementary Elementary
Student Enrollment 152 50 75 212
Percent of students with
free or reduced meals 78% 80% 42.7% 57.5%
English Language proficient 57.2% 70% 80% 88.2%
English Language/Literacy
meets/exceeds standards 35.9% 35.3% 56.7% 42.0%
Mathematics proficiency
meets/exceeds standards 18.0% 23.6% 37.8% 32.0%
Ethnic Diversity Index 22 9 4 39
Source: Edhat: https://www.ed-data.org/county/Santa-Barbara
Niche.com" https://www.niche.com/k12/d/blochman-union-elementary-school-district-ca/
Note: Benjamin Foxen is the elementary school name within the Blochman Union School Dist
Demographics of Surrounding School District Area
2019 Santa
Los Barbara
Cuyama Lompoc Alamos County
Population 664 44,569 1,447 453,288
Employment 247 17,203 611 208,267
Employment to Pop Ratio 37.2 38.6 42.2 45.9
Employment to Household Ratio 1.01 1.23 1.1 1.39
Median Household Income $54,471 $51,815 $64,484 $73,545
Percent below Poverty line 19.6 15.2 26.9 9.2Percent of employment
in farming 21.9 7.6 22.4 8.4
Source: Claritas, March 2019

55
School Demographics and PerformanceMontecito Union, Cold Springs, Monte Vista, Mountain View
School Year 2017-2018
Montecito Cold Monte Mountain
Union Springs Vista View
Student Enrollment 410 170 308 321
Percent of students with
free or reduced meals 10.7% 9% 28.6% 11.2%
English Language proficient 92% 97% 84.4% 95.0%
English Language/Literacy
meets/exceeds standards 91.4% 92.3% 73.5% 83.2%
Mathematics proficiency
meets/exceeds standards 84.9% 90.2% 60.3% 78.8%
Ethnic Diversity Index 19 20 43 35
School Demographics and Performance
Roosevelt Elementary, Solvang Elementary, All Santa Barbara County Schools
School Year 2017-2018
Roosevelt Solvang All SB County
Elementary Elementary Schools
Student Enrollment 584 600 69,752
Percent of students with
free or reduced meals 40.4 54.0% 63.4%
English Language proficient 78% 74.0% 70.1%
English Language/Literacy
meets/exceeds standards 52.1% 69.1% 45.9%
Mathematics proficiency
meets/exceeds standards 44.8% 62.5% 45.5%
Ethnic Diversity Index 38 38 31
Source: Edhat: https://www.ed-data.org/county/Santa-Barbara

56
Preparers of this Report California Economic Forecast 5385 Hollister Avenue Box 207 Santa Barbara, California 93111 (805) 692-2498 Website: www.californiaforecast.com Mark Schniepp, Principal [email protected] Ben Wright, Senior Economist [email protected]
Lauren Wong [email protected] The report was prepared between December 2018 and May 23, 2019. A draft report, a final draft report, and a final report were prepared. The drafts have endured many reviews, comments, and revisions to insure accuracy of the timeline and the data. Information on costs and production pertaining to the Project scenario was obtained from both ExxonMobil and Plains All American Pipeline Company. A thorough description of that information is presented in this report. Information on property taxes and other fiscal indicators was obtained from Santa Barbara County, both the Auditor-Controller and Assessor’s Departments. ------------------------------------------------------------------------------------