shongweni lap regional economic assessment june 2010 draft
TRANSCRIPT
SHONGWENI LOCAL AREA PLAN
REGIONAL ECONOMIC ASSESSMENT
JUNE 2010
ETHEKWINI MUNICIPALITY
SHONGWENI LOCAL AREA PLAN
REGIONAL ECONOMIC ASSESSMENT
JUNE 2010
PREPARED FOR:
PHILANI CELE / HENRY MASINGA
Linda Masinga & Associates
PO Box 70036
Overport
4067
Tel: 031 202 0573/4
e-mail: [email protected]
PREPARED BY:
TINDALL KRUGER
Strategic Planning Resources
Postnet Suite 75
Private Bag X03
Westville
3630
Tel: 031 – 262 7014
e-mail: [email protected]
SHONGWENI LOCAL AREA PLAN REGIONAL ECONOMIC ASSESSMENT: DRAFT
PREPARED BY STRATPLAN
JUNE 2010
i
TABLE OF CONTENTS
1. INTRODUCTION ..........................................................................................................................1
1.1. PURPOSE OF THE ASSESSMENT............................................................................................1
1.2. BACKGROUND TO THE SHONGWENI LOCAL AREA ................................................................1
1.3. CURRENT PLANNING PROPOSALS ........................................................................................3
2. THE ETHEKWINI ECONOMIC DEVELOPMENT CONTEXT...............................................................4
2.1. INTRODUCTION ...................................................................................................................4
2.2. OVERVIEW OF THE ETHEKWINI ECONOMY...........................................................................4
2.3. SPATIAL DISTRIBUTION OF ETHEKWINI ECONOMIC ACTIVITY ...............................................5
2.4. RECENT TRENDS IN SPATIAL ECONOMIC DEVELOPMENT .....................................................8
3. RETAIL SECTOR ...........................................................................................................................9
3.1. INTRODUCTION ...................................................................................................................9
3.2. TRENDS IN RETAIL SECTOR ...................................................................................................9
3.3. REGIONAL RETAIL OFFERING ............................................................................................. 12
3.4. POTENTIAL RETAIL CATCHMENTS ...................................................................................... 21
3.5. SHOPPING CENTRE STANDARDS ........................................................................................ 26
3.6. GAP ANALYSIS ................................................................................................................... 28
3.7. SUMMARY RECOMMENDATIONS: RETAIL DEVELOPMENT IN SHONGWENI ........................ 34
4. COMMERCIAL / OFFICE SECTOR ............................................................................................... 35
4.1. GLOBAL TRENDS IN THE COMMERCIAL PROPERTY SECTOR ................................................ 35
4.2. CURRENT OFFICE PROPERTY ECONOMIC TRENDS .............................................................. 35
4.3. OFFICE TRENDS IN ETHEKWINI ........................................................................................... 36
4.4. CONSIDERING SUPPLY IN WESTERN AREAS ........................................................................ 37
4.5. OPPORTUNITIES FOR ESTABLISHMENT OF COMMERCIAL SECTOR...................................... 37
4.6. BASIC RECOMMENDATIONS: OFFICE / COMMERCIAL DEVELOPMENT ............................... 37
5. MANUFACTURING SECTOR ....................................................................................................... 38
5.1. INTRODUCTION ................................................................................................................. 38
5.2. TRENDS IN THE MANUFACTURING SECTOR ........................................................................ 38
5.3. TRENDS IN THE INDUSTRIAL PROPERTY SECTOR ................................................................ 39
5.4. SPATIAL INDUSTRIAL TRENDS IN ETHEKWINI ..................................................................... 39
5.5. CURRENT PLANNING PROPOSALS ...................................................................................... 40
5.6. RECOMMENDATIONS ........................................................................................................ 42
SHONGWENI LOCAL AREA PLAN REGIONAL ECONOMIC ASSESSMENT: DRAFT
PREPARED BY STRATPLAN
JUNE 2010
ii
6. ALTERNATIVE OPPORTUNITIES ................................................................................................. 43
6.1. THE AGRIBUSINESS SECTOR ............................................................................................... 43
7. SUMMARY RECOMMENDATION ............................................................................................... 44
7.1. GENERAL RECOMMENDATIONS ......................................................................................... 44
7.2. MIDDLE TO HIGH INCOME RETAIL RECOMMENDATIONS ................................................... 44
7.3. LOW INCOME RETAIL RECOMMENDATIONS ...................................................................... 45
7.4. OFFICE / COMMERCIAL DEVELOPMENT RECOMMENDATIONS ........................................... 45
7.5. MANUFACTURING SECTOR DEVELOPMENT RECOMMENDATIONS ..................................... 45
LIST OF FIGURES:
FIGURE 2.1: GROSS DOMESTIC PRODUCT CONTRIBUTION BY SECTOR FOR 2005 ............................................... 5
FIGURE 3.1: THE STATUS OF TRADITIONAL VS ORGANISED RETAILING ............................................................ 10
FIGURE 3.2: PERCENTAGE HOUSEHOLD EXPENDITURE PER POPULATION GROUP 1993 TO 2008 ..................... 11
LIST OF MAPS:
MAP 3.1: DIAGRAM: PROPOSED NODAL DEVELOPMENT IN THE OUTER WEST ............................................... 32
MAP 5.1: EXISTING AND (PHASING) PLANNED INDUSTRIAL AREAS .................................................................. 40
MAP 5.2: PROPOSED FOCUS AREAS ................................................................................................................ 41
LIST OF TABLES:
TABLE 1.1: PRELIMINARY (NOT FINAL) LAND USE TABLE FOR THE SHONGWENI LOCAL AREA PLAN ................... 3
TABLE 2.1: THE SPREAD OF EMPLOYMENT ACROSS ETHEKWINI BY TYPE AND NUMBER OF JOBS, 2001 ............. 6
TABLE 3.1: OVERVIEW OF FORMAL RETAIL IN THE OUTER WEST ..................................................................... 14
TABLE 3.2: SUMMARY OF CURRENT REGIONAL RETAIL OFFERING ................................................................... 16
TABLE 3.3: OUTER WEST GROSS LETTABLE RETAIL PER RETAIL CENTRE TYPE ................................................... 16
TABLE 3.4: DISTRIBUTION OF RETAIL IN HILLCREST BY TYPE OF CENTRE .......................................................... 17
TABLE 3.5: BUSINESS CATEGORIES IN THE BOTHA'S HILL COMMERCIAL NODE ................................................ 20
TABLE 3.6: CATCHMENT AREAS IN TERMS OF PLANNING UNIT ....................................................................... 22
TABLE 3.7: SUMMARY OVERVIEW OF CURRENT AND FUTURE POPULATION IN SHONGWENI CATCHMENTS .... 25
TABLE 3.8: MONTHLY AVERAGE HOUSEHOLD INCOME PER LSM CATEGORY ................................................... 27
TABLE 3.9: WARRANTED SPACE (IN SQUARE METER) PER PERSON ACCORDING TO LSM GROUPS ................... 27
TABLE 3.10: SUGGESTED HIERARCHY OF SHOPPING FACILITIES ....................................................................... 28
TABLE 3.11: RETAIL SPACE REQUIREMENTS BASED ON CURRENT POPULATION AND NATURAL GROWTH ........ 29
TABLE 3.12: POTENTIAL DWELLING UNITS IN OUTER WEST ............................................................................. 31
TABLE 3.13: ADDITIONAL RETAIL SPACE REQUIREMENTS IN THE OUTER WEST ............................................... 31
TABLE 4.1: SAPOA OFFICE VACANCY FACTORS FOR GRADES A+, A & B ............................................................ 36
TABLE 5.1: TABLE: FIRMS YESTERDAY, TODAY AND TOMORROW ................................................................... 38
TABLE 5.2: OVERVIEW OF INDUSTRIAL LAND IN ETHEKWINI ........................................................................... 39
SHONGWENI LOCAL AREA PLAN REGIONAL ECONOMIC ASSESSMENT: DRAFT
PREPARED BY STRATPLAN
JUNE 2010
1
1. INTRODUCTION
1.1. PURPOSE OF THE ASSESSMENT
This assessment is an extension to the economic development brief for the Shongweni Local Area
Plan. It is intended to develop a better regional perspective of specifically the retail sector with a
view to guiding future land use planning in the Shongweni area. The commercial/office and
manufacturing sectors are, however, also commented on. The specific focus is on identifying
appropriate uses for future developments in identified development nodes. The report therefore
presents a basic assessment of the retail, commercial/office and manufacturing sector trends in the
eThekwini Municipality and more specifically the western sections of the Municipality.
1.2. BACKGROUND TO THE SHONGWENI LOCAL AREA
1.2.1. DEFINING THE AREA
The Shongweni Area is located to the west of Pinetown and is bordered to the north by the Valley of
the 1000 Hills, to the west by Inchanga and Hammarsdale / Mpumalanga and to the south by various
traditional council areas including Zwelibomvu.
The Study Area includes the following Planning Units as defined by the eThekwini Municipality:
Alverstone
Assagay
Botha’s Hill
Bux Farm
Cliffdale
Clifton Canyon
Drummond
Monteseel
Peacevale
Pinetown Rural
Salem Community
Shongweni Resource Reserve
Summerveld
1.2.2. THE SHONGWENI AREA – STATUS QUO FINDINGS
The Study Area is characterized by substantial differences in socio-economic conditions and the local
communities have different expectations and requirements for development. The residents of the
more affluent areas such as Assagay, Alverstone and Summerveld have vastly different expectations
and priorities than those residing in areas such as Cliffdale, Bux Farm, Salem and Pinetown Rural.
SHONGWENI LOCAL AREA PLAN REGIONAL ECONOMIC ASSESSMENT: DRAFT
PREPARED BY STRATPLAN
JUNE 2010
2
Further impacting on this is the economic needs and expectations of those residing in predominantly
traditional and informal settlement areas bordering on the Study Area.
There is a general lack of bulk infrastructure and basic services such as schools and health facilities in
parts of the Shongweni Area, especially in the Planning Units to the south west of the N3. In these
Units there are also insufficient employment opportunities, limited economic activities and a weak
economic base. Settlement patterns are fragmented and dispersed and this forms a major constraint
as the development and services provision of these settlements will be not only difficult but also
costly.
The Shongweni Area contains portions of steep fragmented topography and unusual landform and
these unique landscapes contribute to the tourism potential of the Study Area. However, this also
poses a challenge for the provision of infrastructure in large portions of the Study Area.
There are numerous registered conservancies within the Study Area, such as the entire Assagay
valley that is registered as the Assagay Conservancy. Again these conservancies contribute to the
tourism potential of the Study Area, but will also limit future development.
The Shongweni Resource Reserve once was the premier destination for nature lovers and extreme
sport enthusiasts in the City. The future of this Reserve is however now unclear due to the successful
land claim by the Zwelibomvu community. The vision that the land claimants have for the area needs
to be established and they will need support if they want to ensure that the Reserve continues to be
a premier destination for nature lovers and extreme sport enthusiasts in eThekwini and for people
from further afield.
Employment opportunities and the provision of income-generating activities are the two most
important development needs within the Salem, Shongweni and Cliffdale areas. On the other hand
Summerveld, the upper portions of Shongweni Resource Reserve, Assagay and Alverstone view
nature conservation, wildlife and equestrian related activities as important needs.
Although economic activities are varied within the Study Area they do not provide sufficient
employment opportunities for the large concentration of people that are living in especially the
settlements to the west of the N3. The development of a strong economic sector in these Planning
Units could potentially help to alleviate the current weak economic base of these settlements.
Whilst there are a substantial number of small businesses operating in the Planning Units to the west
of the N3, many of these are associated with agriculture and quarrying and are not large employers.
They have limited capacity to grow and are not able to provide meaningful levels of employment
within these Planning Units and in the Outer West in general.
It can be concluded economic development challenges faced by the different Planning Units differ
substantially, but that the challenges that will be faced in Planning Units with similar characteristics
can be clearly identified. The key challenges for economic development would then be:
SHONGWENI LOCAL AREA PLAN REGIONAL ECONOMIC ASSESSMENT: DRAFT
PREPARED BY STRATPLAN
JUNE 2010
3
Lack of land available for development should densification of existing areas not be considered;
Uncontrolled and unplanned development impacting on the building of specifically the tourism
industry in the area (i.e. conflict between different land uses);
Proximity to eThekwini may be perceived as both a challenge and an opportunity (i.e.
competition for businesses in metropolitan areas is much more significant); and
Low levels of infrastructure and services available in the Study Area.
This current study attempts to address and make recommendations regarding all of the above, by
providing guidance as to development opportunities in the various nodes.
1.3. CURRENT PLANNING PROPOSALS
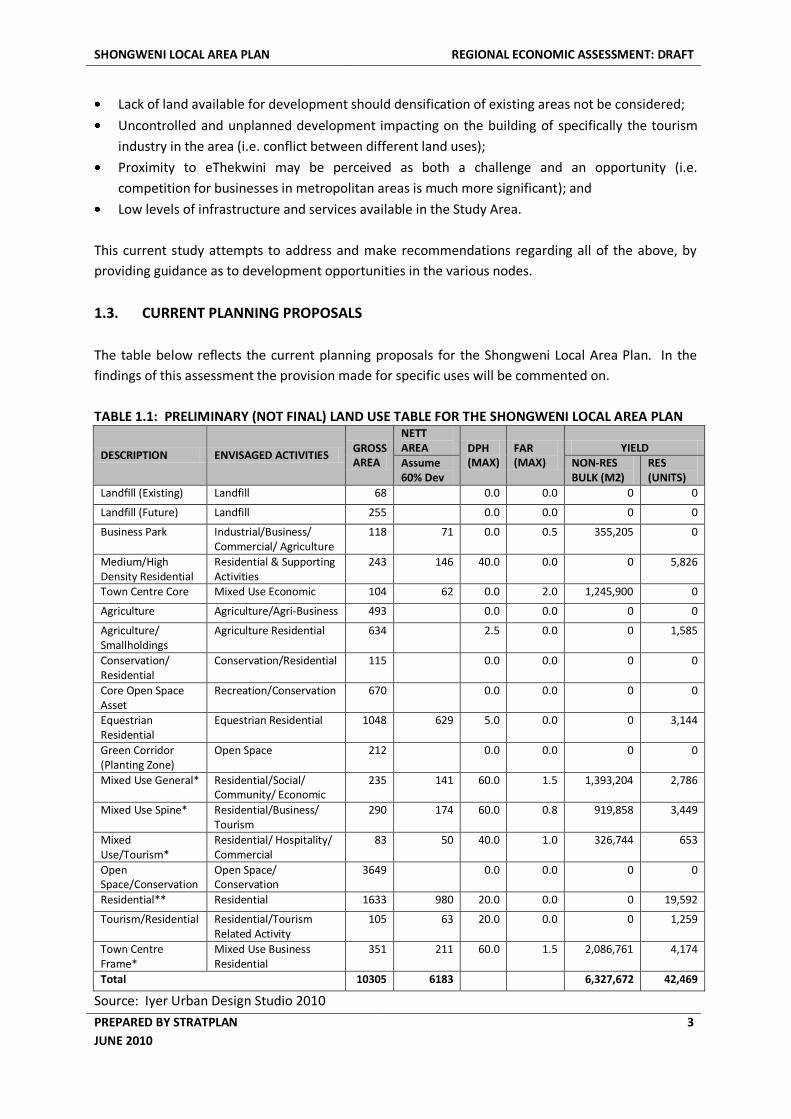
The table below reflects the current planning proposals for the Shongweni Local Area Plan. In the
findings of this assessment the provision made for specific uses will be commented on.
TABLE 1.1: PRELIMINARY (NOT FINAL) LAND USE TABLE FOR THE SHONGWENI LOCAL AREA PLAN
DESCRIPTION ENVISAGED ACTIVITIES GROSS AREA
NETT AREA DPH
(MAX) FAR (MAX)
YIELD Assume 60% Dev
NON-RES BULK (M2)
RES (UNITS)
Landfill (Existing) Landfill 68 0.0 0.0 0 0
Landfill (Future) Landfill 255 0.0 0.0 0 0
Business Park Industrial/Business/ Commercial/ Agriculture
118 71 0.0 0.5 355,205 0
Medium/High Density Residential
Residential & Supporting Activities
243 146 40.0 0.0 0 5,826
Town Centre Core Mixed Use Economic 104 62 0.0 2.0 1,245,900 0
Agriculture Agriculture/Agri-Business 493 0.0 0.0 0 0
Agriculture/ Smallholdings
Agriculture Residential 634 2.5 0.0 0 1,585
Conservation/ Residential
Conservation/Residential 115 0.0 0.0 0 0
Core Open Space Asset
Recreation/Conservation 670 0.0 0.0 0 0
Equestrian Residential
Equestrian Residential 1048 629 5.0 0.0 0 3,144
Green Corridor (Planting Zone)
Open Space 212 0.0 0.0 0 0
Mixed Use General* Residential/Social/ Community/ Economic
235 141 60.0 1.5 1,393,204 2,786
Mixed Use Spine* Residential/Business/ Tourism
290 174 60.0 0.8 919,858 3,449
Mixed Use/Tourism*
Residential/ Hospitality/ Commercial
83 50 40.0 1.0 326,744 653
Open Space/Conservation
Open Space/ Conservation
3649 0.0 0.0 0 0
Residential** Residential 1633 980 20.0 0.0 0 19,592
Tourism/Residential Residential/Tourism Related Activity
105 63 20.0 0.0 0 1,259
Town Centre Frame*
Mixed Use Business Residential
351 211 60.0 1.5 2,086,761 4,174
Total 10305 6183 6,327,672 42,469
Source: Iyer Urban Design Studio 2010
SHONGWENI LOCAL AREA PLAN REGIONAL ECONOMIC ASSESSMENT: DRAFT
PREPARED BY STRATPLAN
JUNE 2010
4
2. THE ETHEKWINI ECONOMIC DEVELOPMENT CONTEXT
2.1. INTRODUCTION
The eThekwini Municipal area has experienced significant changes in its spatial economic
development over the past decade and these changes will also direct / guide future economic
development to the west of eThekwini. With a view to this, this section of the report provides a
brief overview of economic and spatial economic development in eThekwini based on available
information.
An overview of the eThekwini economy, extracted from a 2006/7 review prepared for eThekwini, is
presented with a view to understanding the contribution of and trends in the key economic sectors.
2.2. OVERVIEW OF THE ETHEKWINI ECONOMY
(Extracted from eThekwini Municipality Economic Review 2006/7 prepared by Graham Muller
Associates)
The economy of the eThekwini Municipality is the driving force behind economic growth in the region
and gross domestic product (GDP) in the metropolitan economy has grown at an average annual rate
of 3.65 % over the period from 1995-2005. This compares favourably with the rest of KwaZulu-Natal
province, which grew at a rate of 2.3% for the period from 1995 to 2004. The combined rate of GDP
growth for the province from 1995-2004 was 2.9%. The metropolitan area has consistently shown
strong positive GDP growth over the last ten years at a level which has been fairly similar to the
growth experienced in Cape Town (3.52 %) and the City of Tswane (3.23 %) but somewhat lagging
behind GDP growth for Johannesburg which has averaged 4.29% since 1996. More recent growth
trends suggest that eThekwini metropolitan area has been lagging in GDP growth with the other
three cities mentioned experiencing growth at 4% or higher for the 2001- 2004 period and the
eThekwini metropolitan area averaging a more modest 3.15% over the same period.
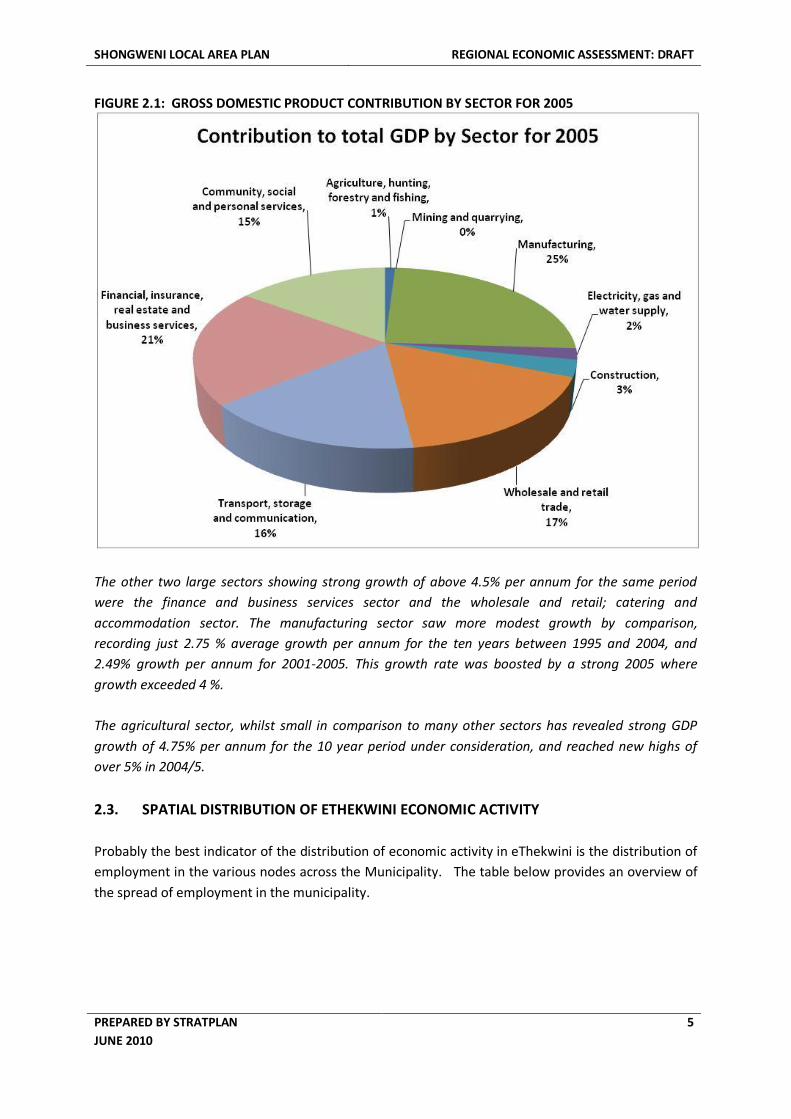
The single largest contributor to GDP in the eThekwini metropolitan area is the manufacturing sector
which contributes to a quarter of total GDP. The importance of this sector in the metropolitan area
and the province as a whole cannot be understated as its total contribution to provincial GDP in 2004
was nearly 15%. After manufacturing the next largest sector is finance and business services, and 72%
of the contribution to the provincial finance and business services sector’s GDP is generated in the
metropolitan area.
Transport and communication is also a significant contributor to the economy in the eThekwini
metropolitan area. This is unsurprising given that the metropolitan area is home to the Port of
Durban, Africa’s busiest port and a major transportation hub. The transport and communication
sector is the fastest growing sector in the municipality, recording average annual growth of 6.45 %
for the 2001-2005 period.
SHONGWENI LOCAL AREA PLAN REGIONAL ECONOMIC ASSESSMENT: DRAFT
PREPARED BY STRATPLAN
JUNE 2010
5
FIGURE 2.1: GROSS DOMESTIC PRODUCT CONTRIBUTION BY SECTOR FOR 2005
The other two large sectors showing strong growth of above 4.5% per annum for the same period
were the finance and business services sector and the wholesale and retail; catering and
accommodation sector. The manufacturing sector saw more modest growth by comparison,
recording just 2.75 % average growth per annum for the ten years between 1995 and 2004, and
2.49% growth per annum for 2001-2005. This growth rate was boosted by a strong 2005 where
growth exceeded 4 %.
The agricultural sector, whilst small in comparison to many other sectors has revealed strong GDP
growth of 4.75% per annum for the 10 year period under consideration, and reached new highs of
over 5% in 2004/5.
2.3. SPATIAL DISTRIBUTION OF ETHEKWINI ECONOMIC ACTIVITY
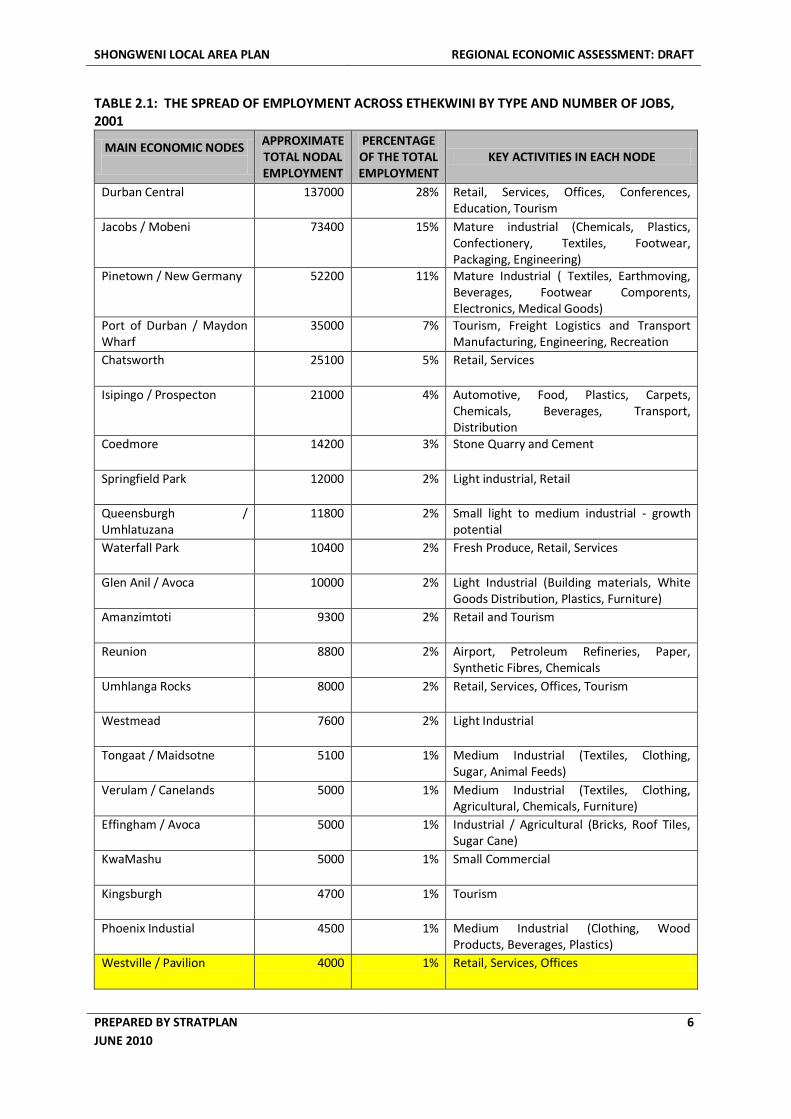
Probably the best indicator of the distribution of economic activity in eThekwini is the distribution of
employment in the various nodes across the Municipality. The table below provides an overview of
the spread of employment in the municipality.
SHONGWENI LOCAL AREA PLAN REGIONAL ECONOMIC ASSESSMENT: DRAFT
PREPARED BY STRATPLAN
JUNE 2010
6
TABLE 2.1: THE SPREAD OF EMPLOYMENT ACROSS ETHEKWINI BY TYPE AND NUMBER OF JOBS, 2001
MAIN ECONOMIC NODES
APPROXIMATE TOTAL NODAL EMPLOYMENT
PERCENTAGE OF THE TOTAL EMPLOYMENT
KEY ACTIVITIES IN EACH NODE
Durban Central 137000 28% Retail, Services, Offices, Conferences, Education, Tourism
Jacobs / Mobeni 73400 15% Mature industrial (Chemicals, Plastics, Confectionery, Textiles, Footwear, Packaging, Engineering)
Pinetown / New Germany 52200 11% Mature Industrial ( Textiles, Earthmoving, Beverages, Footwear Comporents, Electronics, Medical Goods)
Port of Durban / Maydon Wharf
35000 7% Tourism, Freight Logistics and Transport Manufacturing, Engineering, Recreation
Chatsworth 25100 5% Retail, Services
Isipingo / Prospecton 21000 4% Automotive, Food, Plastics, Carpets, Chemicals, Beverages, Transport, Distribution
Coedmore 14200 3% Stone Quarry and Cement
Springfield Park 12000 2% Light industrial, Retail
Queensburgh / Umhlatuzana
11800 2% Small light to medium industrial - growth potential
Waterfall Park 10400 2% Fresh Produce, Retail, Services
Glen Anil / Avoca 10000 2% Light Industrial (Building materials, White Goods Distribution, Plastics, Furniture)
Amanzimtoti 9300 2% Retail and Tourism
Reunion 8800 2% Airport, Petroleum Refineries, Paper, Synthetic Fibres, Chemicals
Umhlanga Rocks 8000 2% Retail, Services, Offices, Tourism
Westmead 7600 2% Light Industrial
Tongaat / Maidsotne 5100 1% Medium Industrial (Textiles, Clothing, Sugar, Animal Feeds)
Verulam / Canelands 5000 1% Medium Industrial (Textiles, Clothing, Agricultural, Chemicals, Furniture)
Effingham / Avoca 5000 1% Industrial / Agricultural (Bricks, Roof Tiles, Sugar Cane)
KwaMashu 5000 1% Small Commercial
Kingsburgh 4700 1% Tourism
Phoenix Industial 4500 1% Medium Industrial (Clothing, Wood Products, Beverages, Plastics)
Westville / Pavilion 4000 1% Retail, Services, Offices
SHONGWENI LOCAL AREA PLAN REGIONAL ECONOMIC ASSESSMENT: DRAFT
PREPARED BY STRATPLAN
JUNE 2010
7
MAIN ECONOMIC NODES
APPROXIMATE TOTAL NODAL EMPLOYMENT
PERCENTAGE OF THE TOTAL EMPLOYMENT
KEY ACTIVITIES IN EACH NODE
La Lucia 3500 1% Retail, Services, Offices
Hillcrest 3500 1% Retail, Services, Offices
Mt Edgecombe 3000 1% Light Industry (Engineering, Furniture, Manufacturing, Distribution and Warehousing), Offices, Golf Course
Cato Manor 2000 0% Commercial, SMME, Light Industrial
Umbongintwini 1900 0% Chemical Industrial Park, Light Industrial Park
Glenwood 490 0% Education, Research, Innovation & Experimentation
Harrison Flats 480 0% Heavy Industry
Hammarsdale 230 0% Textiles, Clothing, Chicken
Berea Ridge Not available Health, Retail Offices
Beachfront Not available Retail, Tourism
Point Not available Retail, Tourism
Bluff Not available Retail, Tourism
Victoria Embankment Not available Sport (Sailing, Boating), Tourism
Greyville Not available Sport (Horse Racing, Golf), Tourism, Offices Publishing
Kings Park Not available Sport (Rugby, Golf Swimming, Soccer), Tourism
Umdloti Not available Tourism
TOTAL 484 200 100%
Source: Not indicated in Graham Muller (2006)
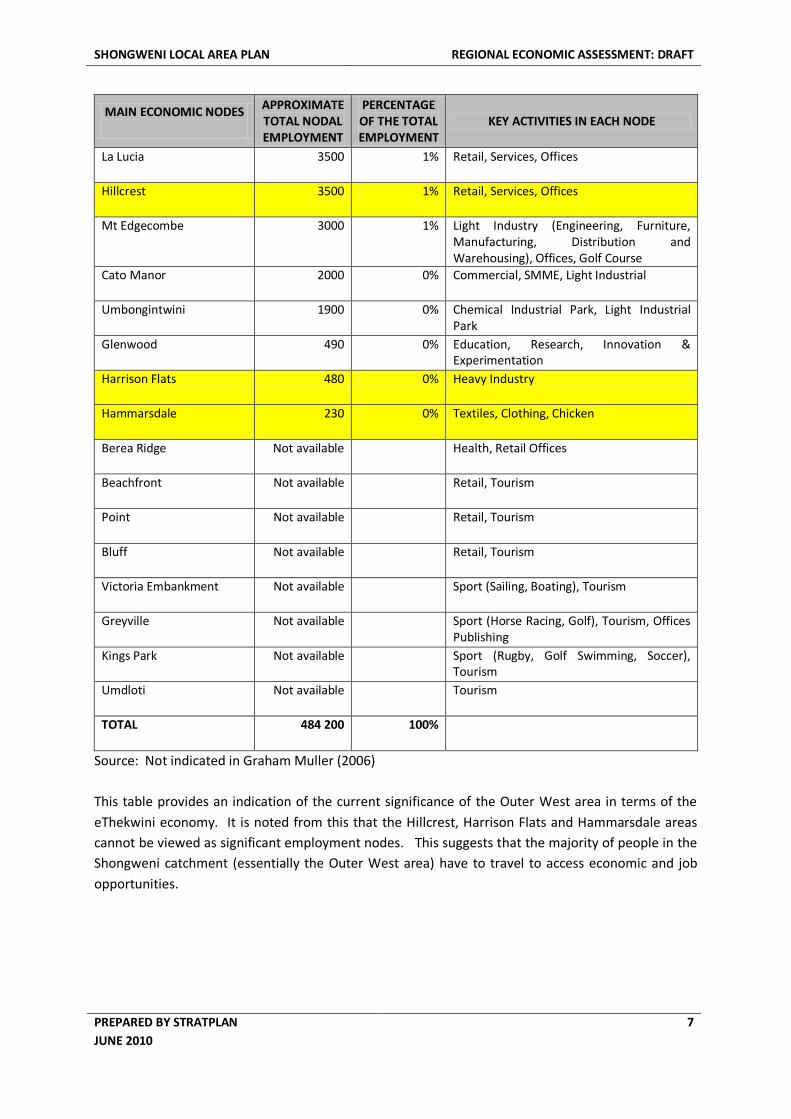
This table provides an indication of the current significance of the Outer West area in terms of the
eThekwini economy. It is noted from this that the Hillcrest, Harrison Flats and Hammarsdale areas
cannot be viewed as significant employment nodes. This suggests that the majority of people in the
Shongweni catchment (essentially the Outer West area) have to travel to access economic and job
opportunities.
SHONGWENI LOCAL AREA PLAN REGIONAL ECONOMIC ASSESSMENT: DRAFT
PREPARED BY STRATPLAN
JUNE 2010
8
2.4. RECENT TRENDS IN SPATIAL ECONOMIC DEVELOPMENT
Over the past decade the most visible spatial economic development trend was expansion and
consolidation of development to the north of Durban. This development is attributed primarily to
the pro-active approach taken by one major landowner in the area and a fully integrated
development approach taken. This integrated development approach supported residential, retail,
industrial, entertainment and public infrastructure developments. The most notable examples of
these types of development are:
Residential (Edgeview, Somerset Park, Mount Edgecombe, Itala Ridge, La Lucia Ridge,
Broadlands, Izinga Ridge);
Retail (Gateway and surroundings);
Industrial (River Horse Valley and developments around Ballito and King Shaka Airport);
Entertainment (Sibaya Casino and other); and
Public infrastructure (most notably the King Shaka Airport, the Umhlanga Rocks Promenade and
Pier etc).
Planning for future development in the Conurbia and Sibaya areas will further add substantially to
the number of residents in the area. Previous studies (StratPlan 2007) illustrated that at least a 10
fold increase in the population of the Umhlanga Ridge catchment is anticipated, not considering the
continued densification and population growth in existing settlement areas.
Other significant development areas in eThekwini over the past decade include the Point Waterfront
development, the Durban sports precinct including the Moses Mabhida Stadium, expansion of the
vehicle manufacturing industry in Prospecton, the Galleria and related retail developments to the
south of Durban.
Considered within the above context the Outer West area has received limited attention in terms of
development in the same period, with new comparatively small retail developments in Hillcrest, and
some upmarket housing estates in the Botha’s Hill and Water Fall areas, being the only
developments of any significance. These developments, however, do not compete in any way with
the developments in northern, central and southern areas of eThekwini.
SHONGWENI LOCAL AREA PLAN REGIONAL ECONOMIC ASSESSMENT: DRAFT
PREPARED BY STRATPLAN
JUNE 2010
9
3. RETAIL SECTOR
3.1. INTRODUCTION
Historic and current planning for the Shongweni Local Area proposes the establishment of a Town
Centre and several supporting nodes. It is anticipated that in both the proposed Town Centre and
other smaller nodes a strong emphasis will be placed on retail development. This section therefore
explores retail development opportunities in Shongweni, considering specifically the future demand
for such development in the context of current supply.
3.2. TRENDS IN RETAIL SECTOR
3.2.1. TRADITIONAL VS ORGANISED RETAILING
The retail sector is a significant sector in the economy of any urban area and do not only provide
services to local residents, but is often also a magnet for visitors and investors, as well as a creator of
employment. Prinsloo (2010) notes that over the past four years phenomenal growth has been
experienced specifically in shopping centre space and that growth of 8% per annum in retail space
over the past 15 years have been recorded. Shopping centre space in South Africa now totals 18
million square metres or +/- 50% of all retail sector space.
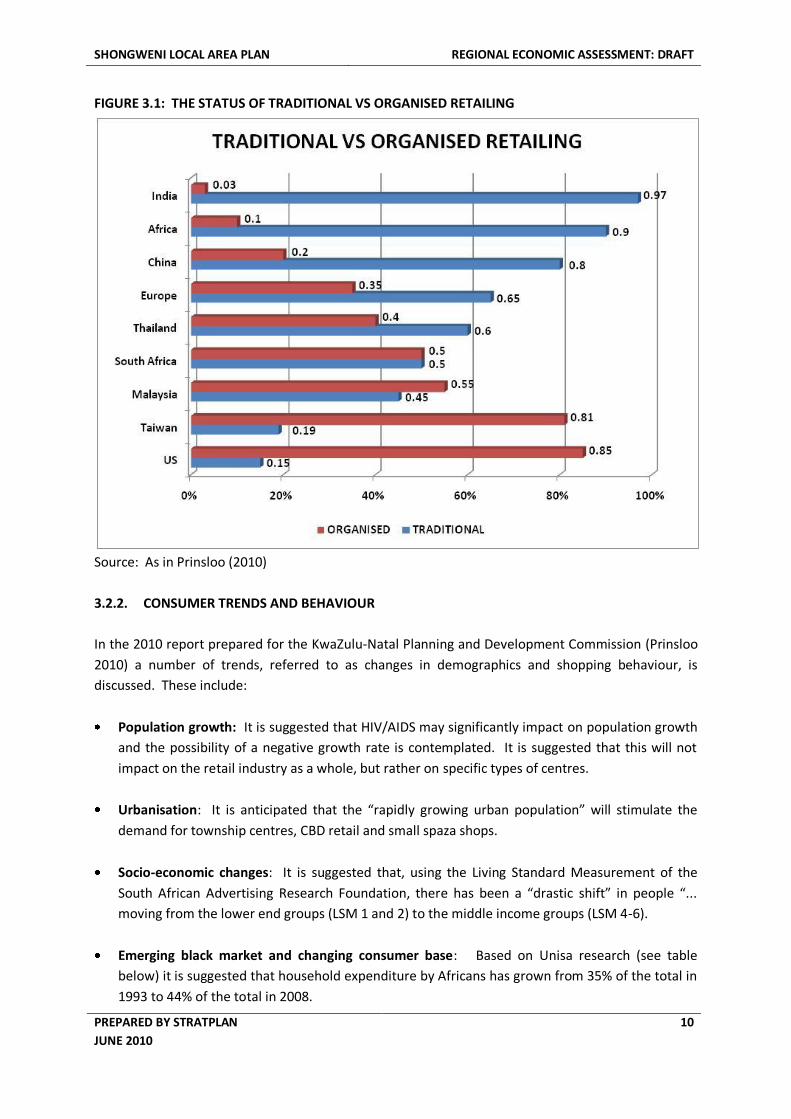
Prinsloo (2010) distinguishes between traditional retailing, focusing mainly on market areas, street
retailing and retail along specific major roads and strips, also referred to as unplanned retail
development and organised / planned retailing. As indicated above in South Africa the ratio between
traditional and planned retailing is 50/50. This ratio, however, differs substantially across the world
as illustrated in the table below.
From the table it appears as if South Africa is attempting to emulate the United States and that the
ratio of traditional versus organised retailing is more in line with highly developed economies than
that of other developing countries in Africa and countries such as India. Prinsloo (2010) in his
assessment of trends suggests that in South Africa the focus will be on “... planned/organised mall
development, as well as the redevelopment of town centres as is currently happening in the UK”. It
is suggested that the jury is still out on the success of lifestyle centres in South Africa.
SHONGWENI LOCAL AREA PLAN REGIONAL ECONOMIC ASSESSMENT: DRAFT
PREPARED BY STRATPLAN
JUNE 2010
10
FIGURE 3.1: THE STATUS OF TRADITIONAL VS ORGANISED RETAILING
Source: As in Prinsloo (2010)
3.2.2. CONSUMER TRENDS AND BEHAVIOUR
In the 2010 report prepared for the KwaZulu-Natal Planning and Development Commission (Prinsloo
2010) a number of trends, referred to as changes in demographics and shopping behaviour, is
discussed. These include:
Population growth: It is suggested that HIV/AIDS may significantly impact on population growth
and the possibility of a negative growth rate is contemplated. It is suggested that this will not
impact on the retail industry as a whole, but rather on specific types of centres.
Urbanisation: It is anticipated that the “rapidly growing urban population” will stimulate the
demand for township centres, CBD retail and small spaza shops.
Socio-economic changes: It is suggested that, using the Living Standard Measurement of the
South African Advertising Research Foundation, there has been a “drastic shift” in people “...
moving from the lower end groups (LSM 1 and 2) to the middle income groups (LSM 4-6).
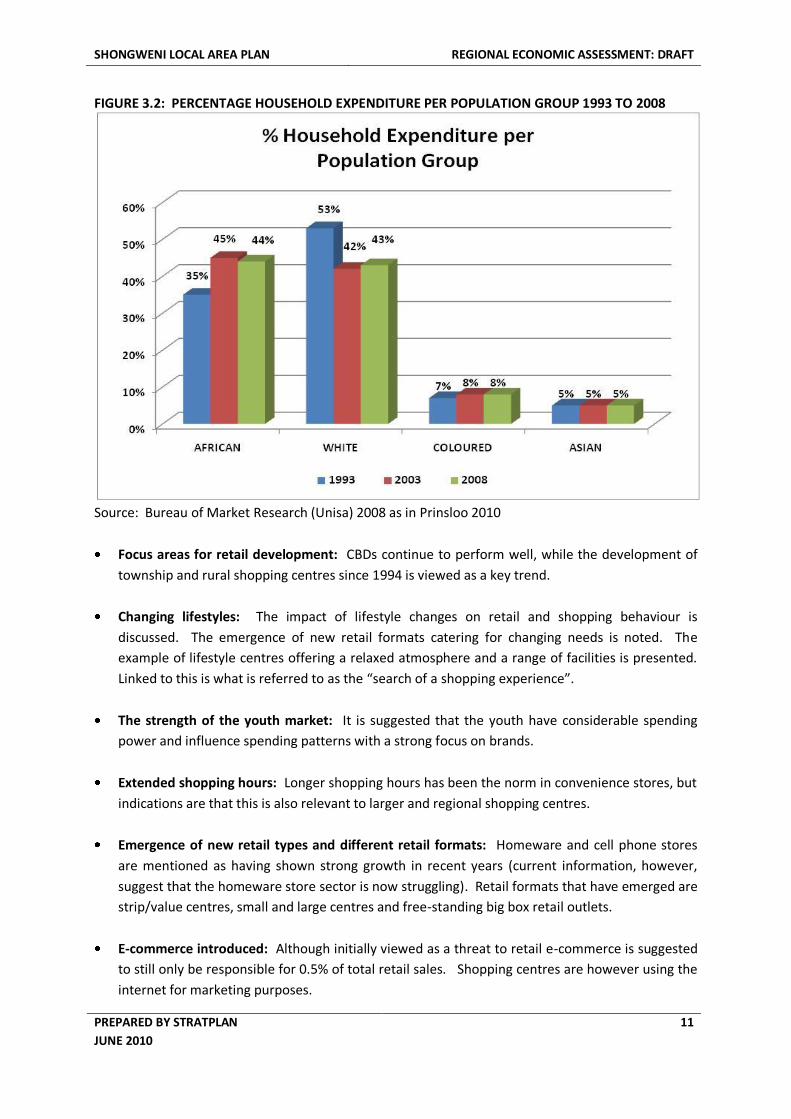
Emerging black market and changing consumer base: Based on Unisa research (see table
below) it is suggested that household expenditure by Africans has grown from 35% of the total in
1993 to 44% of the total in 2008.
SHONGWENI LOCAL AREA PLAN REGIONAL ECONOMIC ASSESSMENT: DRAFT
PREPARED BY STRATPLAN
JUNE 2010
11
FIGURE 3.2: PERCENTAGE HOUSEHOLD EXPENDITURE PER POPULATION GROUP 1993 TO 2008
Source: Bureau of Market Research (Unisa) 2008 as in Prinsloo 2010
Focus areas for retail development: CBDs continue to perform well, while the development of
township and rural shopping centres since 1994 is viewed as a key trend.
Changing lifestyles: The impact of lifestyle changes on retail and shopping behaviour is
discussed. The emergence of new retail formats catering for changing needs is noted. The
example of lifestyle centres offering a relaxed atmosphere and a range of facilities is presented.
Linked to this is what is referred to as the “search of a shopping experience”.
The strength of the youth market: It is suggested that the youth have considerable spending
power and influence spending patterns with a strong focus on brands.
Extended shopping hours: Longer shopping hours has been the norm in convenience stores, but
indications are that this is also relevant to larger and regional shopping centres.
Emergence of new retail types and different retail formats: Homeware and cell phone stores
are mentioned as having shown strong growth in recent years (current information, however,
suggest that the homeware store sector is now struggling). Retail formats that have emerged are
strip/value centres, small and large centres and free-standing big box retail outlets.
E-commerce introduced: Although initially viewed as a threat to retail e-commerce is suggested
to still only be responsible for 0.5% of total retail sales. Shopping centres are however using the
internet for marketing purposes.
SHONGWENI LOCAL AREA PLAN REGIONAL ECONOMIC ASSESSMENT: DRAFT
PREPARED BY STRATPLAN
JUNE 2010
12
3.2.3. SHOPPING CENTRE RELATED TRENDS
Trends more related to the shopping centres themselves highlighted by Prinsloo (2010) include:
Renewal of centres: Reference is made specifically to first generation centres in need of “total
revamps and re-tenanting”.
Increasing shopping centre size: Once established and successful shopping centres attract
additional investment for expansion, e.g. Boardwalk in Richards Bay and the Midlands Mall in
Pietermaritzburg.
Cannibalisation: Prinsloo (2010) describes the process of cannibalisation as occurring when “...
there is an oversupply of retail facilities in a certain area ... the market share of each facility will
then automatically be reduced and outdated facilities will further deteriorate”. This is viewed as
one of the most serious threats for retailers in South Africa.
3.3. REGIONAL RETAIL OFFERING
3.3.1. INTRODUCTION
In order to understand the future demand for retail that may be experienced within the Shongweni
Local Plan area it is necessary to understand current supply. Although no regional or sub-regional
centres exists within close proximity to the area a number of retail areas / centres located outside of
the local area plan area may in future impact on retail development.
This discussion will provide a brief overview of the following concentrations of retail development
and the potential impact thereof on retail development in the study area:
Hillcrest
Kloof
Pinetown
Pavilion (Westville)
Mpumalanga
Camperdown / Cato Ridge
Botha’s Hill
This is followed with a summary of the impact of these developments on future development in the
Shongweni node.
SHONGWENI LOCAL AREA PLAN REGIONAL ECONOMIC ASSESSMENT: DRAFT
PREPARED BY STRATPLAN
JUNE 2010
13
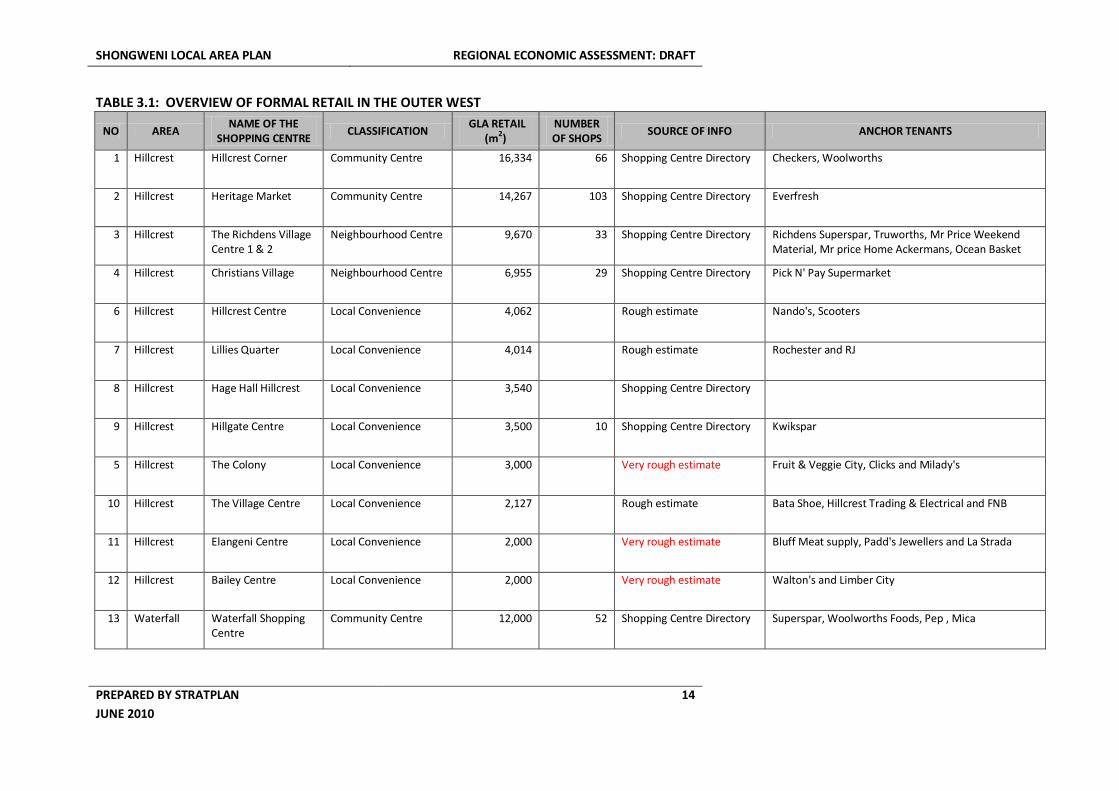
3.3.2. THE CURRENT RETAIL OFFERING
For the purpose of this assessment the StratPlan Team developed a database of retail offerings in the
Outer West area of the eThekwini Municipality. The database was developed using information for
the South African Shopping Centre Directory (2009/10) as a basis and augmenting this with
information from Google surveys, site visits and personal knowledge of the area.
The table below lists the various shopping centres and concentrations of shopping activity currently
in the Outer West area and provides basic information relating to these. The Pinetown area (only
representing the organised retail space) and the Pavilion Shopping Centre are included as these areas
currently have a major impact on retailing trends in the Outer West.
With the inclusion of major Pinetown Shopping Centres and the Pavilion the current retail offering is
around 300 000 m2, with the Pavilion contributing 120 000 m2 of this.
TABLE 3.1 FOLLOW OVERLEAF
SHONGWENI LOCAL AREA PLAN REGIONAL ECONOMIC ASSESSMENT: DRAFT
PREPARED BY STRATPLAN
JUNE 2010
14
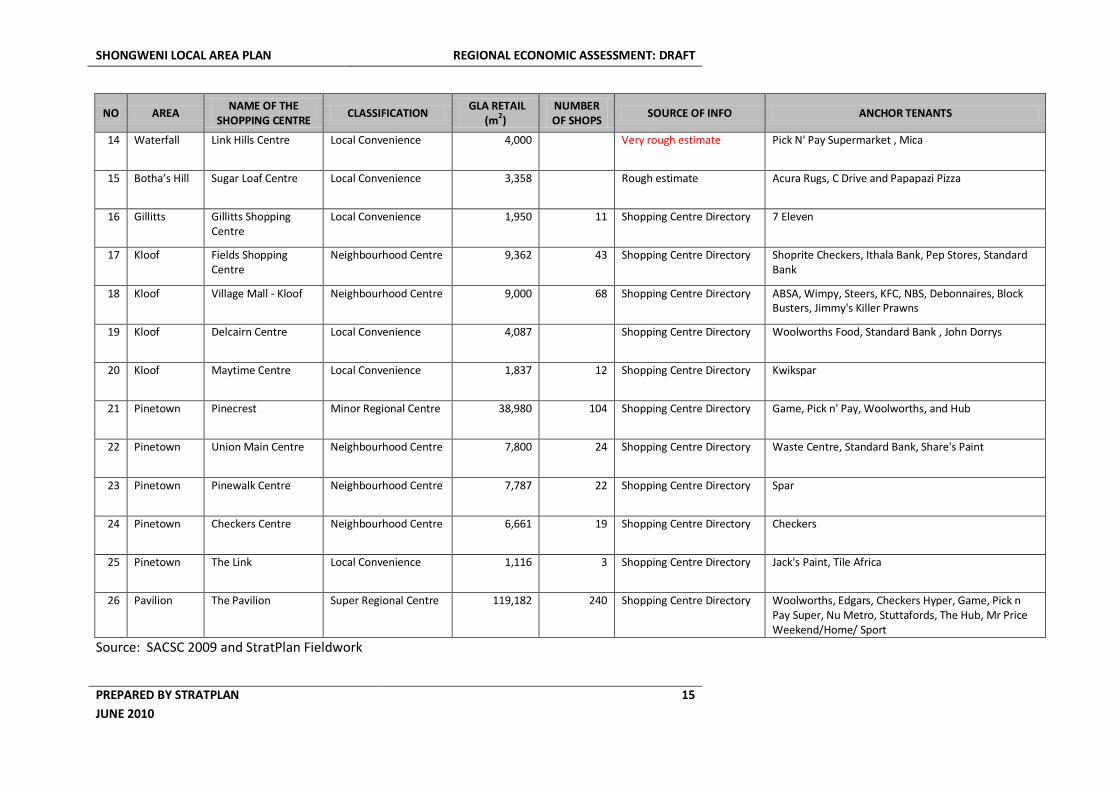
TABLE 3.1: OVERVIEW OF FORMAL RETAIL IN THE OUTER WEST
NO AREA NAME OF THE
SHOPPING CENTRE CLASSIFICATION
GLA RETAIL (m2)
NUMBER OF SHOPS
SOURCE OF INFO ANCHOR TENANTS
1 Hillcrest Hillcrest Corner Community Centre 16,334 66 Shopping Centre Directory Checkers, Woolworths
2 Hillcrest Heritage Market Community Centre 14,267 103 Shopping Centre Directory Everfresh
3 Hillcrest The Richdens Village Centre 1 & 2
Neighbourhood Centre 9,670 33 Shopping Centre Directory Richdens Superspar, Truworths, Mr Price Weekend Material, Mr price Home Ackermans, Ocean Basket
4 Hillcrest Christians Village Neighbourhood Centre 6,955 29 Shopping Centre Directory Pick N' Pay Supermarket
6 Hillcrest Hillcrest Centre Local Convenience 4,062 Rough estimate Nando's, Scooters
7 Hillcrest Lillies Quarter Local Convenience 4,014 Rough estimate Rochester and RJ
8 Hillcrest Hage Hall Hillcrest Local Convenience 3,540 Shopping Centre Directory
9 Hillcrest Hillgate Centre Local Convenience 3,500 10 Shopping Centre Directory Kwikspar
5 Hillcrest The Colony Local Convenience 3,000 Very rough estimate Fruit & Veggie City, Clicks and Milady's
10 Hillcrest The Village Centre Local Convenience 2,127 Rough estimate Bata Shoe, Hillcrest Trading & Electrical and FNB
11 Hillcrest Elangeni Centre Local Convenience 2,000 Very rough estimate Bluff Meat supply, Padd's Jewellers and La Strada
12 Hillcrest Bailey Centre Local Convenience 2,000 Very rough estimate Walton's and Limber City
13 Waterfall Waterfall Shopping Centre
Community Centre 12,000 52 Shopping Centre Directory Superspar, Woolworths Foods, Pep , Mica
SHONGWENI LOCAL AREA PLAN REGIONAL ECONOMIC ASSESSMENT: DRAFT
PREPARED BY STRATPLAN
JUNE 2010
15
NO AREA NAME OF THE
SHOPPING CENTRE CLASSIFICATION
GLA RETAIL (m
2)
NUMBER OF SHOPS
SOURCE OF INFO ANCHOR TENANTS
14 Waterfall Link Hills Centre Local Convenience 4,000 Very rough estimate Pick N' Pay Supermarket , Mica
15 Botha’s Hill Sugar Loaf Centre Local Convenience 3,358 Rough estimate Acura Rugs, C Drive and Papapazi Pizza
16 Gillitts Gillitts Shopping Centre
Local Convenience 1,950 11 Shopping Centre Directory 7 Eleven
17 Kloof Fields Shopping Centre
Neighbourhood Centre 9,362 43 Shopping Centre Directory Shoprite Checkers, Ithala Bank, Pep Stores, Standard Bank
18 Kloof Village Mall - Kloof Neighbourhood Centre 9,000 68 Shopping Centre Directory ABSA, Wimpy, Steers, KFC, NBS, Debonnaires, Block Busters, Jimmy's Killer Prawns
19 Kloof Delcairn Centre Local Convenience 4,087 Shopping Centre Directory Woolworths Food, Standard Bank , John Dorrys
20 Kloof Maytime Centre Local Convenience 1,837 12 Shopping Centre Directory Kwikspar
21 Pinetown Pinecrest Minor Regional Centre 38,980 104 Shopping Centre Directory Game, Pick n' Pay, Woolworths, and Hub
22 Pinetown Union Main Centre Neighbourhood Centre 7,800 24 Shopping Centre Directory Waste Centre, Standard Bank, Share's Paint
23 Pinetown Pinewalk Centre Neighbourhood Centre 7,787 22 Shopping Centre Directory Spar
24 Pinetown Checkers Centre Neighbourhood Centre 6,661 19 Shopping Centre Directory Checkers
25 Pinetown The Link Local Convenience 1,116 3 Shopping Centre Directory Jack's Paint, Tile Africa
26 Pavilion The Pavilion Super Regional Centre 119,182 240 Shopping Centre Directory Woolworths, Edgars, Checkers Hyper, Game, Pick n Pay Super, Nu Metro, Stuttafords, The Hub, Mr Price Weekend/Home/ Sport
Source: SACSC 2009 and StratPlan Fieldwork
SHONGWENI LOCAL AREA PLAN REGIONAL ECONOMIC ASSESSMENT: DRAFT
PREPARED BY STRATPLAN
JUNE 2010
16
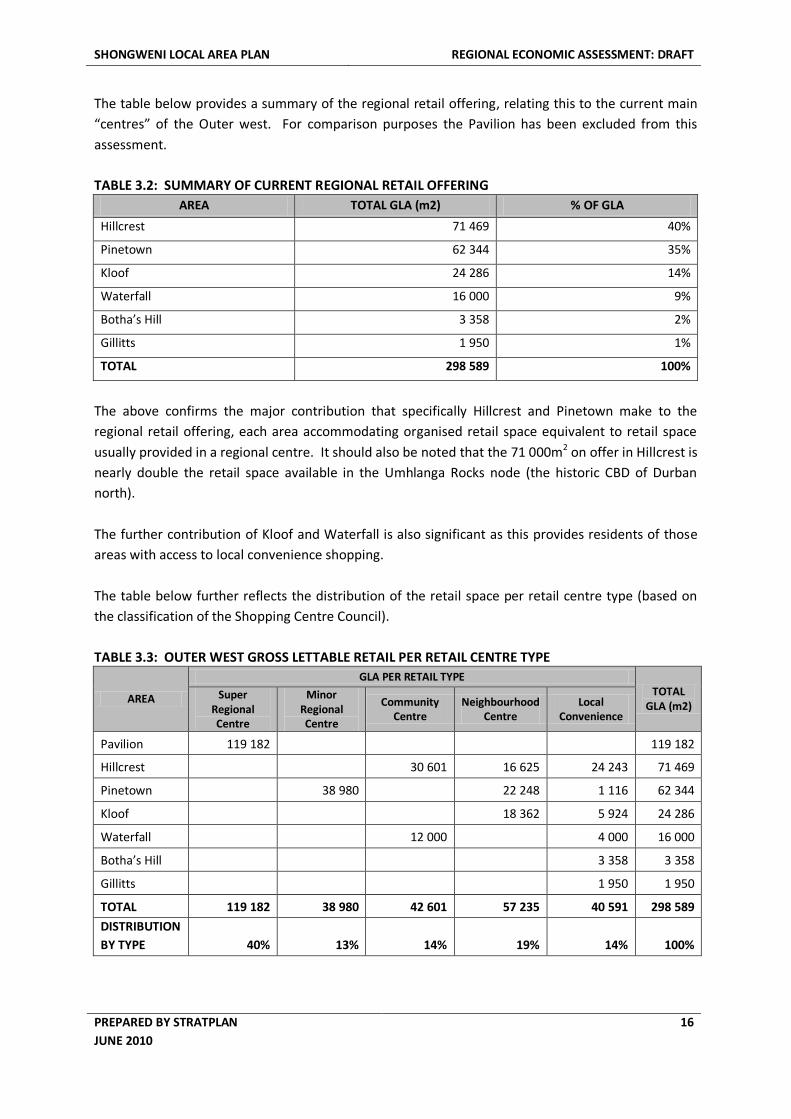
The table below provides a summary of the regional retail offering, relating this to the current main
“centres” of the Outer west. For comparison purposes the Pavilion has been excluded from this
assessment.
TABLE 3.2: SUMMARY OF CURRENT REGIONAL RETAIL OFFERING
AREA TOTAL GLA (m2) % OF GLA
Hillcrest 71 469 40%
Pinetown 62 344 35%
Kloof 24 286 14%
Waterfall 16 000 9%
Botha’s Hill 3 358 2%
Gillitts 1 950 1%
TOTAL 298 589 100%
The above confirms the major contribution that specifically Hillcrest and Pinetown make to the
regional retail offering, each area accommodating organised retail space equivalent to retail space
usually provided in a regional centre. It should also be noted that the 71 000m2 on offer in Hillcrest is
nearly double the retail space available in the Umhlanga Rocks node (the historic CBD of Durban
north).
The further contribution of Kloof and Waterfall is also significant as this provides residents of those
areas with access to local convenience shopping.
The table below further reflects the distribution of the retail space per retail centre type (based on
the classification of the Shopping Centre Council).
TABLE 3.3: OUTER WEST GROSS LETTABLE RETAIL PER RETAIL CENTRE TYPE
AREA
GLA PER RETAIL TYPE TOTAL
GLA (m2) Super
Regional Centre
Minor Regional Centre
Community Centre
Neighbourhood Centre
Local Convenience
Pavilion 119 182
119 182
Hillcrest
30 601 16 625 24 243 71 469
Pinetown
38 980
22 248 1 116 62 344
Kloof
18 362 5 924 24 286
Waterfall
12 000 4 000 16 000
Botha’s Hill
3 358 3 358
Gillitts
1 950 1 950
TOTAL 119 182 38 980 42 601 57 235 40 591 298 589
DISTRIBUTION
BY TYPE 40% 13% 14% 19% 14% 100%
SHONGWENI LOCAL AREA PLAN REGIONAL ECONOMIC ASSESSMENT: DRAFT
PREPARED BY STRATPLAN
JUNE 2010
17
Following from the above, the sections that follow provide a brief discussion of the retail situation in
each of the key retail nodes. The areas where retail is currently limited, such as Mpumalanga and
Cato Ridge, is also considered.
3.3.3. HILLCREST
Until a decade ago Hillcrest was still viewed by many as a rural village providing only access to basic
retail services. Development of the retail sector in Hillcrest was, however, sparked by the Heritage
Market developed in 1993 and intensified over the past 10 years through the development of the
Christians Village, Hillcrest Corner and the expansion of Richdens Village. Various other
developments by amongst other Mr Price extends the local offering and plans are afoot for Hirsch
and McDonalds to also be added to the retail activities.
Hillcrest now includes the following retail developments / centres that continue to serve the growing
population of the Outer West (centres in order of approximate size – largest first):
Hillcrest Corner
Heritage Market
The Richdens Village Centre 1 & 2
Christians Village
Hillcrest Centre
Lillies Quarter
Hage Hall Hillcrest
Hillgate Centre
The Colony
The Village Centre
Elangeni Centre
Bailey Centre
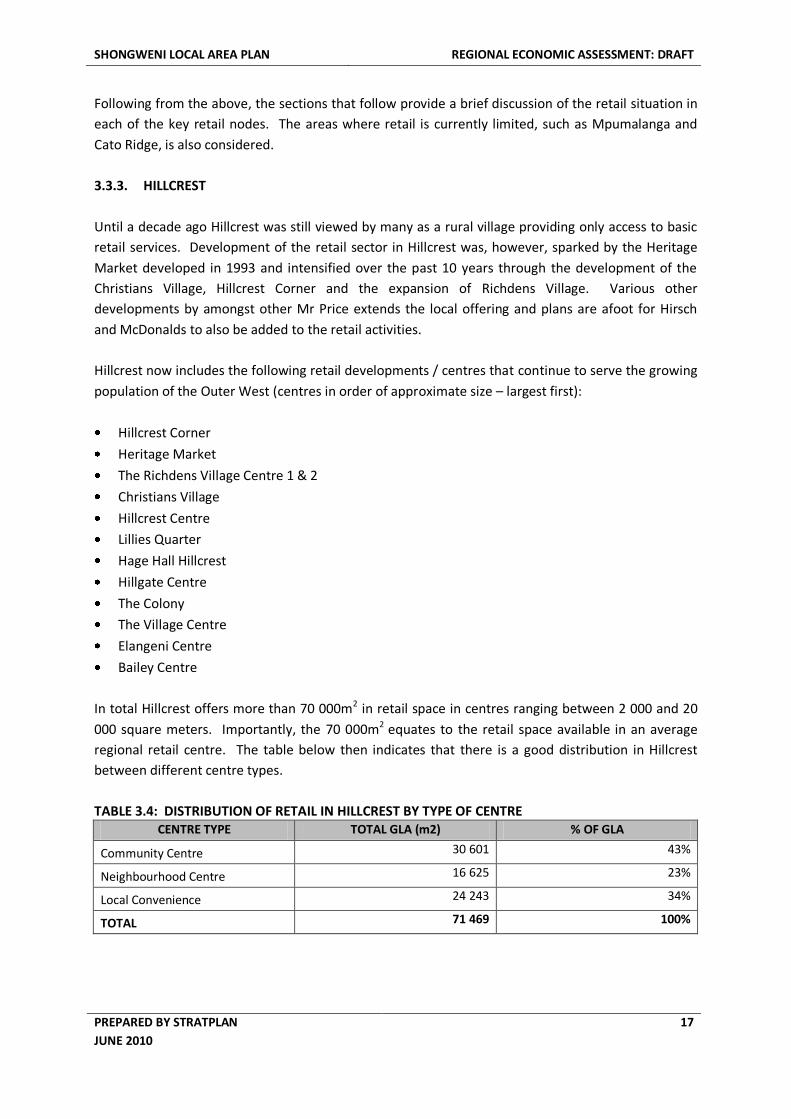
In total Hillcrest offers more than 70 000m2 in retail space in centres ranging between 2 000 and 20
000 square meters. Importantly, the 70 000m2 equates to the retail space available in an average
regional retail centre. The table below then indicates that there is a good distribution in Hillcrest
between different centre types.
TABLE 3.4: DISTRIBUTION OF RETAIL IN HILLCREST BY TYPE OF CENTRE CENTRE TYPE TOTAL GLA (m2) % OF GLA
Community Centre 30 601 43%
Neighbourhood Centre 16 625 23%
Local Convenience 24 243 34%
TOTAL 71 469 100%
SHONGWENI LOCAL AREA PLAN REGIONAL ECONOMIC ASSESSMENT: DRAFT
PREPARED BY STRATPLAN
JUNE 2010
18
A couple of observations regarding the Hillcrest retail offering for consideration in this assessment
are:
Hillcrest retail caters almost exclusively for the middle to higher income brackets despite the fact
that it is also surrounded by lower income communities residing in the Inanda and Valley of a
1000 Hills areas.
A small taxi rank developed in Hillcrest (behind the Christians Village) appears to be more aimed
to satisfy the transport requirements of workers than to cater for a large influx of shoppers;
Large numbers of low income earners travel through Hillcrest to Pinetown to access retail
services;
There is currently no regional centre in Hillcrest, e.g. a Westwood or Pinecrest level centre.
3.3.4. KLOOF
Kloof offers two neighbourhood centres and the remainder of the retail offering is for convenience
shopping. The main centres identified include:
Fields Shopping Centre (Neighbourhood)
Village Mall – Kloof (Neighbourhood)
Delcairn Centre
Maytime Centre
Kloof retail also caters for the middle to high income markets and at present it does not appear as if
there are plans to expand retail space in this area.
3.3.5. PINETOWN
In terms of shopping centres Pinetown offers nearly as much retail space as Hillcrest, however, it is
anticipated that 50% or more of the total retail space in Pinetown is located outside of shopping
centres (currently contributing 62 000m2). Pinetown then also has a substantial informal retail sector
that makes a major contribution to the economy of the area.
The western portion of the Pinetown CBD now almost exclusively caters for the commuters moving
through the Pinetown transport hub to and from residential settlement areas across the Outer West.
3.3.6. PAVILION
Although located a substantial distance from the Shongweni area, and Outer West in general, this
remains one of Durban’s two super regional malls and attract people from the middle and high
income areas located to the west of eThekwini.
Importantly for this assessment, the Pavilion is located on the same N3 Corridor exactly 20
kilometres from the proposed Shongweni “town centre”.
SHONGWENI LOCAL AREA PLAN REGIONAL ECONOMIC ASSESSMENT: DRAFT
PREPARED BY STRATPLAN
JUNE 2010
19
3.3.7. MPUMALANGA
Mpumalanga is a major residential area located to the immediate west of the Shongweni Local Area.
Historically Mpumalanga residents have been dependent on accessing commercial and social services
in a number of areas, most notably Pinetown, but also Pietermaritzburg and Cato Ridge.
Recently, the eThekwini Municipality facilitated the establishment of a multi-use development in
Mpumalanga described as follows in a press release:
“Phase One consisting of R30m bulk infrastructure to unlock land in the town centre commenced in
earnest in January 2010. This will allow for various mixed use developments to follow. The 36 week
project, the funding for which comes from the Neighbourhood Development Partnership Grant
(NDPG), will lay the foundation for the R200m investment by Eris Property Group towards the
provision of a 18000 sqm retail shopping centre, which will be the first facility to be established in the
towncentre.”
“The retail shopping centre is to be provisionally known as the Mpumalanga Mall and will comprise a
mix of both national and local retailers. It will substantially increase the much needed retail offering
in the Mpumalanga and Hammarsdale communities, who in the past have had to travel to
Pietermaritzburg, Pinetown or Durban for their household and retail shopping needs.”
It is anticipated that the following public investment will occur subject to completion of negotiations
and business plans with respective government departments:
1. New Metro Police Station
2. Municipal Customer Care Centre (Sizakala) which will accommodate various government
service departments, including a library
3. Social welfare centre
4. Public park with sport and recreational facilities
5. New railway station integrated with nodal transport interchange
6. Health facilities
7. Small trader facilities
It is suggested that the new shopping centre will serve people from the Mpumalanga Township,
Shongweni, Georgedale, Sankhontshe, Mophela, Malangeni, mini Town and Hammarsdale industrial.
It is then anticipated that, considering the proposed 18 000m2 the centre will also fulfil a more
regional function drawing also people residing to the north of the N3.
3.3.8. CATO RIDGE
Dunbar’s Centre in Cato Ridge is essentially a Spar Centre, accommodating a Super Spar, a Tops
Liquor Store and a Build It Hardware Store. Other facilities also available at the centre include:
SHONGWENI LOCAL AREA PLAN REGIONAL ECONOMIC ASSESSMENT: DRAFT
PREPARED BY STRATPLAN
JUNE 2010
20
First National Bank;
Standard Bank and Nedbank ATMs;
Cato Ridge Post Office;
A Pharmacy;
A Surgery; and
A number of smaller stores (e.g. furniture etc).
A total of approximately 3 600m2 of floor space is available in this development. A surfaced parking
area and small “taxi shed” is also on the site.
Although a relatively small centre this caters for a much larger community.
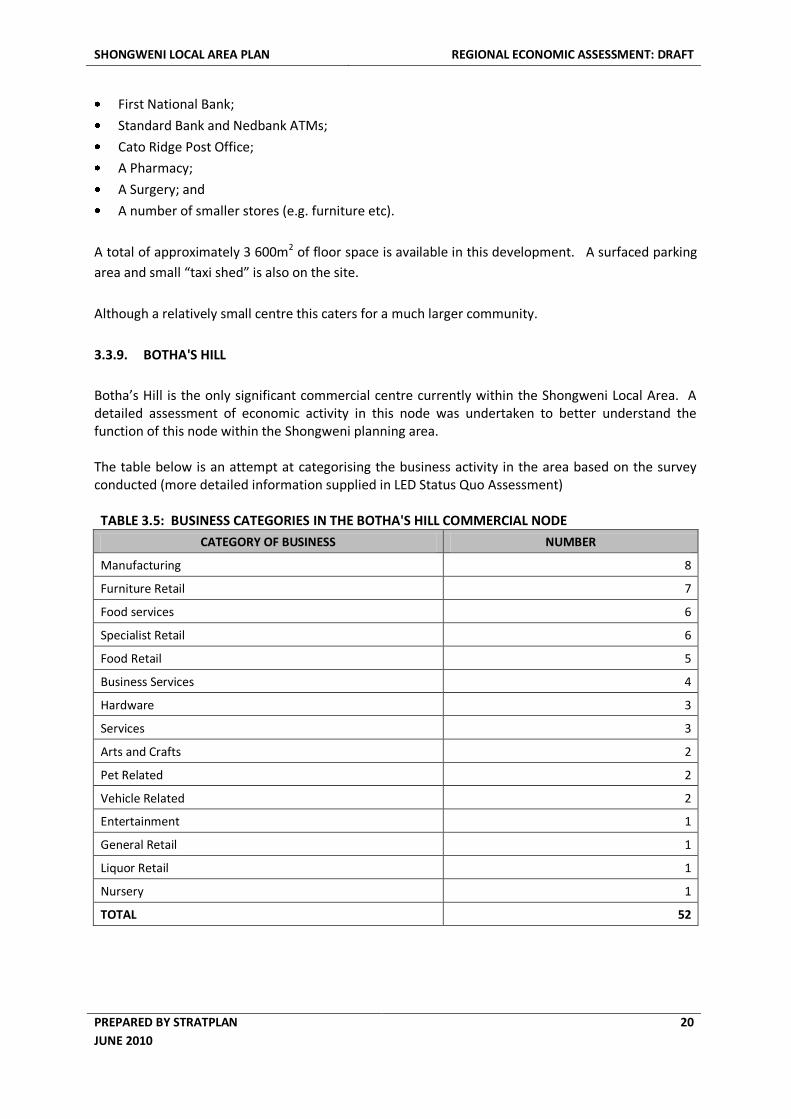
3.3.9. BOTHA'S HILL
Botha’s Hill is the only significant commercial centre currently within the Shongweni Local Area. A detailed assessment of economic activity in this node was undertaken to better understand the function of this node within the Shongweni planning area. The table below is an attempt at categorising the business activity in the area based on the survey conducted (more detailed information supplied in LED Status Quo Assessment) TABLE 3.5: BUSINESS CATEGORIES IN THE BOTHA'S HILL COMMERCIAL NODE
CATEGORY OF BUSINESS NUMBER
Manufacturing 8
Furniture Retail 7
Food services 6
Specialist Retail 6
Food Retail 5
Business Services 4
Hardware 3
Services 3
Arts and Crafts 2
Pet Related 2
Vehicle Related 2
Entertainment 1
General Retail 1
Liquor Retail 1
Nursery 1
TOTAL 52
SHONGWENI LOCAL AREA PLAN REGIONAL ECONOMIC ASSESSMENT: DRAFT
PREPARED BY STRATPLAN
JUNE 2010
21
The above table confirms that there is not a specific focus of business activity in the node, but that the area is home to a range of economic activities ranging from manufacturing to specialist retail. It is interesting to note the number of furniture retailers identified, specifically considering that these establishments service a vastly different market (higher income) from that served by for instance the larger food and hardware retailers (lower income). The area also includes four smaller groupings of businesses (centres) where more specialised business and retail services are offered. From the above and visits to the area it is concluded that the Botha’s Hill node serves vastly different markets that can potentially be divided into three categories:
The lower income population residing in the Valley of a 1000 Hills;
The local residents in settlements mainly along the R103; and
Visitors or tourists visiting the area. Importantly, the Botha’s Hill area serves as a commercial node for only a limited portion of the Shongweni Local Area.
3.4. POTENTIAL RETAIL CATCHMENTS
3.4.1. INTRODUCTION
At the outset of this section it must be indicated that a comprehensive model identifying the most
appropriate locations for retail development in the eThekwini Municipality should be developed and
should guide future decision-making regarding retail development. As this is not within the scope of
this assessment this section takes a preliminary look at potential retail catchments specifically for the
Shongweni LAP area. The potential catchment for the Shongweni LAP area covers a major part of the
Outer West area of the eThekwini Municipality.
3.4.2. OVERVIEW OF THE CATCHMENTS
For the purpose of this assessment three catchment zones were identified. The three zones are
defined as follows:
Local Area Plan (LAP) Core: The LAP core area includes all the planning units forming part of the
Shongweni Local Area Plan.
Expanded Core: The expanded area identifies those planning units where, should a suitably
attractive / relevant retail facility be established in the Shongweni Area, the majority of people
will potentially make use of such a facility.
Edge: The edge represents those areas where people may potentially make use of facilities in
Shongweni, but for whom other options may also be available.
SHONGWENI LOCAL AREA PLAN REGIONAL ECONOMIC ASSESSMENT: DRAFT
PREPARED BY STRATPLAN
JUNE 2010
22
Based on Census 2001 information a population / household database of these planning units were
developed and planning units were categorised in terms of types of settlement and household
income levels (it should be noted that this does not reflect absolutes).
In terms of housing types distinction was made between:
Formal;
Informal; and
Traditional.
In terms of income distinction was made between:
Low Income; and
Middle to High Income.
The population figures from the 2001 Census were adjusted for 2010 and estimated for 2020. The
following basic growth rates were used for this purpose:
Formal: 2001 to 2020 a growth rate of 0.5%; and
Informal and traditional: 2001 to 2020 a growth rate of 2%.
The higher growth rate for informal and traditional areas assumes the continued densification of
these areas as a result of urbanisation processes and therefore a rate higher than the natural
population growth rate is assumed.
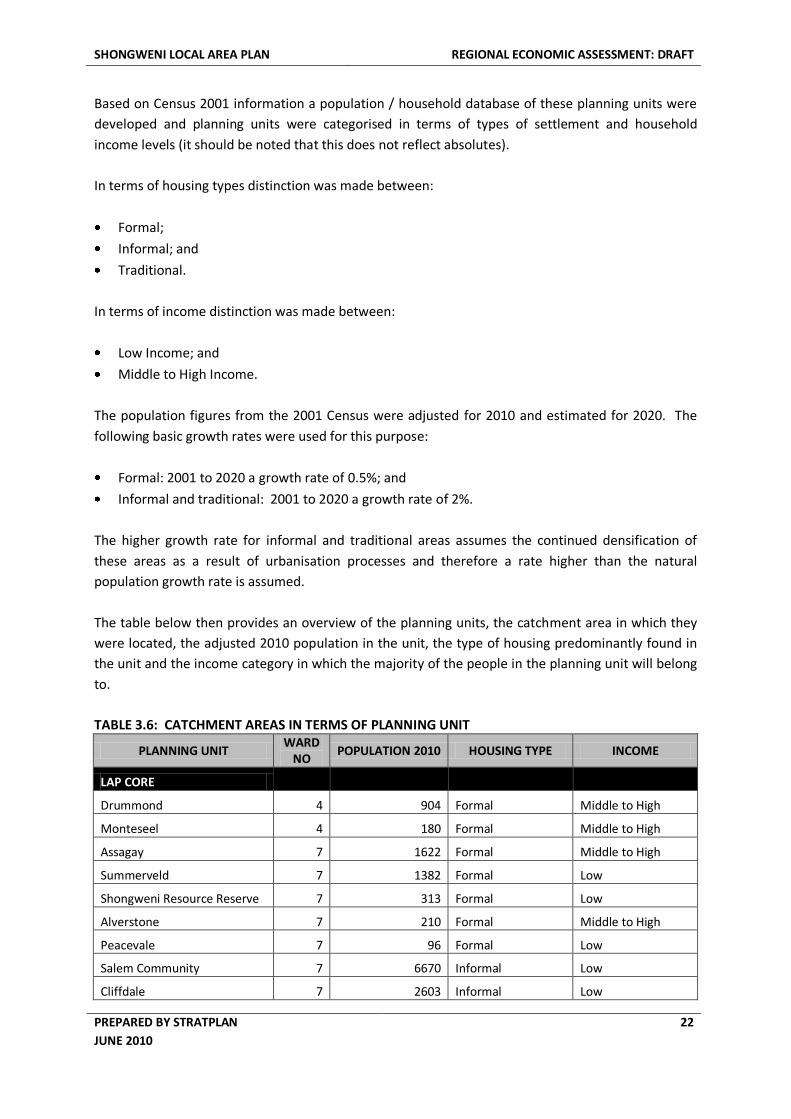
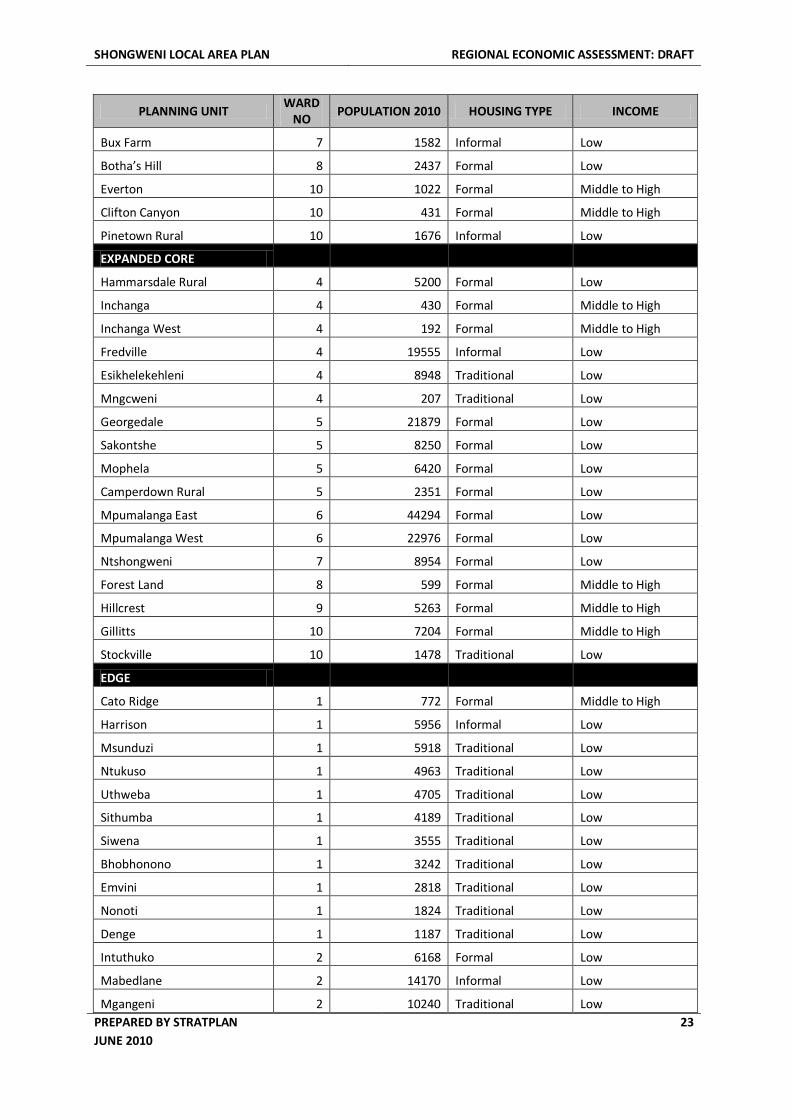
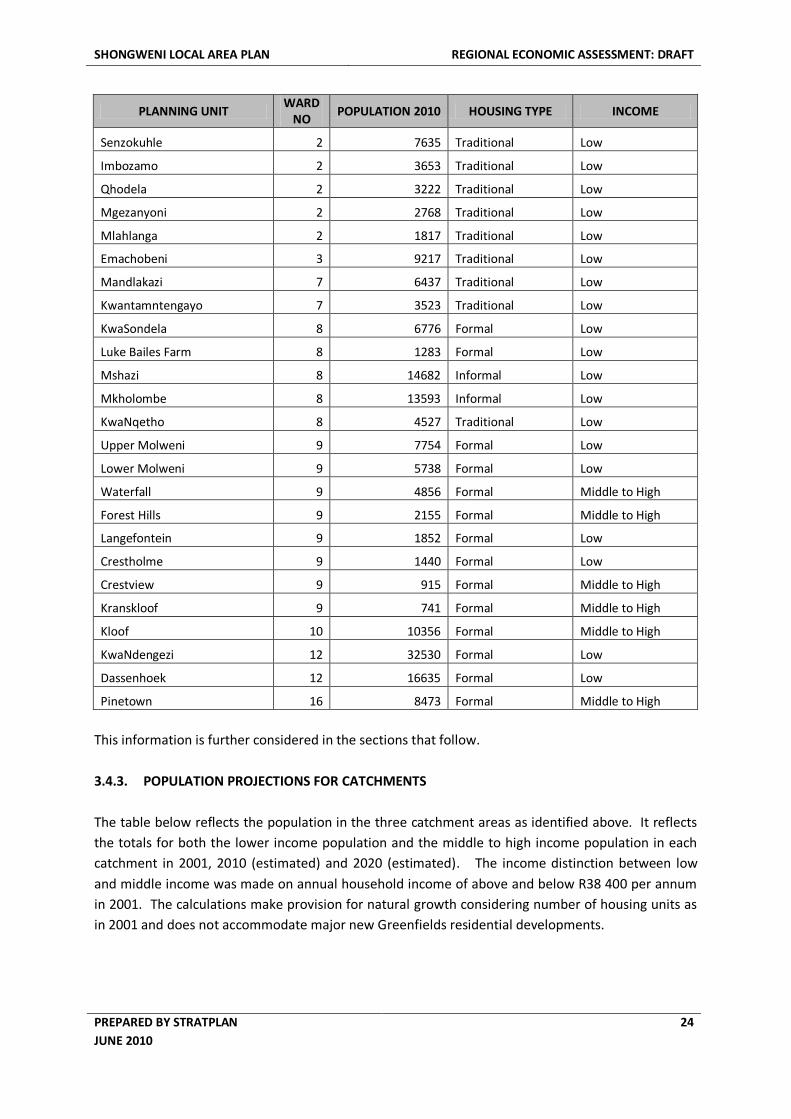
The table below then provides an overview of the planning units, the catchment area in which they
were located, the adjusted 2010 population in the unit, the type of housing predominantly found in
the unit and the income category in which the majority of the people in the planning unit will belong
to.
TABLE 3.6: CATCHMENT AREAS IN TERMS OF PLANNING UNIT
PLANNING UNIT WARD
NO POPULATION 2010 HOUSING TYPE INCOME
LAP CORE
Drummond 4 904 Formal Middle to High
Monteseel 4 180 Formal Middle to High
Assagay 7 1622 Formal Middle to High
Summerveld 7 1382 Formal Low
Shongweni Resource Reserve 7 313 Formal Low
Alverstone 7 210 Formal Middle to High
Peacevale 7 96 Formal Low
Salem Community 7 6670 Informal Low
Cliffdale 7 2603 Informal Low
SHONGWENI LOCAL AREA PLAN REGIONAL ECONOMIC ASSESSMENT: DRAFT
PREPARED BY STRATPLAN
JUNE 2010
23
PLANNING UNIT WARD
NO POPULATION 2010 HOUSING TYPE INCOME
Bux Farm 7 1582 Informal Low
Botha’s Hill 8 2437 Formal Low
Everton 10 1022 Formal Middle to High
Clifton Canyon 10 431 Formal Middle to High
Pinetown Rural 10 1676 Informal Low
EXPANDED CORE
Hammarsdale Rural 4 5200 Formal Low
Inchanga 4 430 Formal Middle to High
Inchanga West 4 192 Formal Middle to High
Fredville 4 19555 Informal Low
Esikhelekehleni 4 8948 Traditional Low
Mngcweni 4 207 Traditional Low
Georgedale 5 21879 Formal Low
Sakontshe 5 8250 Formal Low
Mophela 5 6420 Formal Low
Camperdown Rural 5 2351 Formal Low
Mpumalanga East 6 44294 Formal Low
Mpumalanga West 6 22976 Formal Low
Ntshongweni 7 8954 Formal Low
Forest Land 8 599 Formal Middle to High
Hillcrest 9 5263 Formal Middle to High
Gillitts 10 7204 Formal Middle to High
Stockville 10 1478 Traditional Low
EDGE
Cato Ridge 1 772 Formal Middle to High
Harrison 1 5956 Informal Low
Msunduzi 1 5918 Traditional Low
Ntukuso 1 4963 Traditional Low
Uthweba 1 4705 Traditional Low
Sithumba 1 4189 Traditional Low
Siwena 1 3555 Traditional Low
Bhobhonono 1 3242 Traditional Low
Emvini 1 2818 Traditional Low
Nonoti 1 1824 Traditional Low
Denge 1 1187 Traditional Low
Intuthuko 2 6168 Formal Low
Mabedlane 2 14170 Informal Low
Mgangeni 2 10240 Traditional Low
SHONGWENI LOCAL AREA PLAN REGIONAL ECONOMIC ASSESSMENT: DRAFT
PREPARED BY STRATPLAN
JUNE 2010
24
PLANNING UNIT WARD
NO POPULATION 2010 HOUSING TYPE INCOME
Senzokuhle 2 7635 Traditional Low
Imbozamo 2 3653 Traditional Low
Qhodela 2 3222 Traditional Low
Mgezanyoni 2 2768 Traditional Low
Mlahlanga 2 1817 Traditional Low
Emachobeni 3 9217 Traditional Low
Mandlakazi 7 6437 Traditional Low
Kwantamntengayo 7 3523 Traditional Low
KwaSondela 8 6776 Formal Low
Luke Bailes Farm 8 1283 Formal Low
Mshazi 8 14682 Informal Low
Mkholombe 8 13593 Informal Low
KwaNqetho 8 4527 Traditional Low
Upper Molweni 9 7754 Formal Low
Lower Molweni 9 5738 Formal Low
Waterfall 9 4856 Formal Middle to High
Forest Hills 9 2155 Formal Middle to High
Langefontein 9 1852 Formal Low
Crestholme 9 1440 Formal Low
Crestview 9 915 Formal Middle to High
Kranskloof 9 741 Formal Middle to High
Kloof 10 10356 Formal Middle to High
KwaNdengezi 12 32530 Formal Low
Dassenhoek 12 16635 Formal Low
Pinetown 16 8473 Formal Middle to High
This information is further considered in the sections that follow.
3.4.3. POPULATION PROJECTIONS FOR CATCHMENTS
The table below reflects the population in the three catchment areas as identified above. It reflects
the totals for both the lower income population and the middle to high income population in each
catchment in 2001, 2010 (estimated) and 2020 (estimated). The income distinction between low
and middle income was made on annual household income of above and below R38 400 per annum
in 2001. The calculations make provision for natural growth considering number of housing units as
in 2001 and does not accommodate major new Greenfields residential developments.
SHONGWENI LOCAL AREA PLAN REGIONAL ECONOMIC ASSESSMENT: DRAFT
PREPARED BY STRATPLAN
JUNE 2010
25
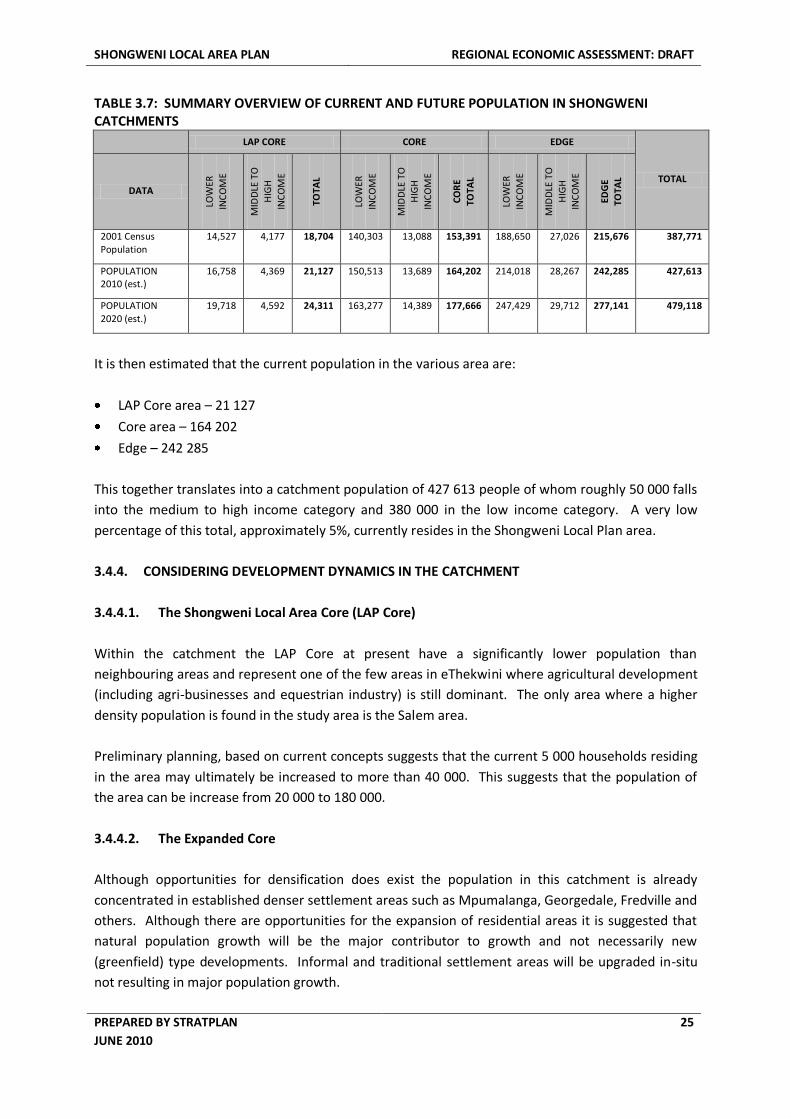
TABLE 3.7: SUMMARY OVERVIEW OF CURRENT AND FUTURE POPULATION IN SHONGWENI CATCHMENTS
LAP CORE CORE EDGE
TOTAL DATA
LOW
ER
INC
OM
E
MID
DLE
TO
HIG
H
INC
OM
E
TOTA
L
LOW
ER
INC
OM
E
MID
DLE
TO
H
IGH
INC
OM
E
CO
RE
TOTA
L
LOW
ER
INC
OM
E
MID
DLE
TO
HIG
H
INC
OM
E
EDG
E
TOTA
L
2001 Census Population
14,527 4,177 18,704 140,303 13,088 153,391 188,650 27,026 215,676 387,771
POPULATION 2010 (est.)
16,758 4,369 21,127 150,513 13,689 164,202 214,018 28,267 242,285 427,613
POPULATION 2020 (est.)
19,718 4,592 24,311 163,277 14,389 177,666 247,429 29,712 277,141 479,118
It is then estimated that the current population in the various area are:
LAP Core area – 21 127
Core area – 164 202
Edge – 242 285
This together translates into a catchment population of 427 613 people of whom roughly 50 000 falls
into the medium to high income category and 380 000 in the low income category. A very low
percentage of this total, approximately 5%, currently resides in the Shongweni Local Plan area.
3.4.4. CONSIDERING DEVELOPMENT DYNAMICS IN THE CATCHMENT
3.4.4.1. The Shongweni Local Area Core (LAP Core)
Within the catchment the LAP Core at present have a significantly lower population than
neighbouring areas and represent one of the few areas in eThekwini where agricultural development
(including agri-businesses and equestrian industry) is still dominant. The only area where a higher
density population is found in the study area is the Salem area.
Preliminary planning, based on current concepts suggests that the current 5 000 households residing
in the area may ultimately be increased to more than 40 000. This suggests that the population of
the area can be increase from 20 000 to 180 000.
3.4.4.2. The Expanded Core
Although opportunities for densification does exist the population in this catchment is already
concentrated in established denser settlement areas such as Mpumalanga, Georgedale, Fredville and
others. Although there are opportunities for the expansion of residential areas it is suggested that
natural population growth will be the major contributor to growth and not necessarily new
(greenfield) type developments. Informal and traditional settlement areas will be upgraded in-situ
not resulting in major population growth.
SHONGWENI LOCAL AREA PLAN REGIONAL ECONOMIC ASSESSMENT: DRAFT
PREPARED BY STRATPLAN
JUNE 2010
26
3.4.4.3. The Edge
The majority of the informal and traditional areas included in the “edge” are located outside of the
urban edge of the Municipality and will in all likelihood not attract new Greenfields development.
Provision will, however, be made for the in-situ upgrading of housing and the provision of services.
3.4.5. THE PASSING TRAFFIC
The Shongweni area is the gateway through which all traffic between not only Durban and
Pietermaritzburg, but also the rest of the country, generally moves. The fact that the Shongweni
area can be accessed from both the N3 and the M13 further enhances accessibility. Despite this the
impact of passing traffic on retail potential in an area such as Shongweni is difficult to establish. No
meaningful standards in this regard exist and examples of similarly located retail centres are limited.
Future studies regarding the impact of passing traffic on the Liberty Mall in Pietermaritzburg, the
Pavilion Shopping Centre, the Canal Walk Centre in Cape Town and others in Gauteng should be
considered.
Potentially substantial passing traffic can be attracted to retail at in the Shongweni node, however,
the extent to which this is successful will depend on the nature of the development. Passing traffic
would generally be attracted to retail areas that offer easily accessible retail space. This may not be
in line with the requirements of the regional residential market.
3.5. SHOPPING CENTRE STANDARDS
3.5.1. INTRODUCTION
Shopping centre potential assessments, specifically in the South African rural context, is not a science
(at least not yet), and is often directly influenced by the “gut feel” of the developer for whom the
assessment is being made. Prinsloo (2010) suggests that one technique that is useful is “per capita
retail space warranted per annum”. It is, however, acknowledged that it is “... difficult if there is a
lot of cross shopping between different areas, and if the retail supply is not fully known”. He further
indicates that these techniques have in recent years been supplemented by “major advances in data
availability and processing, and in computerised functionality”.
The standards, i.e. number of persons to be served by a specific type/size of centre, can merely be
used as indicative of where an opportunity may potentially exist. Whether the actual development
will be successful will ultimately depend on the facility or conglomeration of facilities having the
correct market focus, including consideration of price, product range, quality etc.
This section takes a brief look at the general approach taken in determining retail potential and
indicates how this will be applied to the Shongweni Local Area.
SHONGWENI LOCAL AREA PLAN REGIONAL ECONOMIC ASSESSMENT: DRAFT
PREPARED BY STRATPLAN
JUNE 2010
27
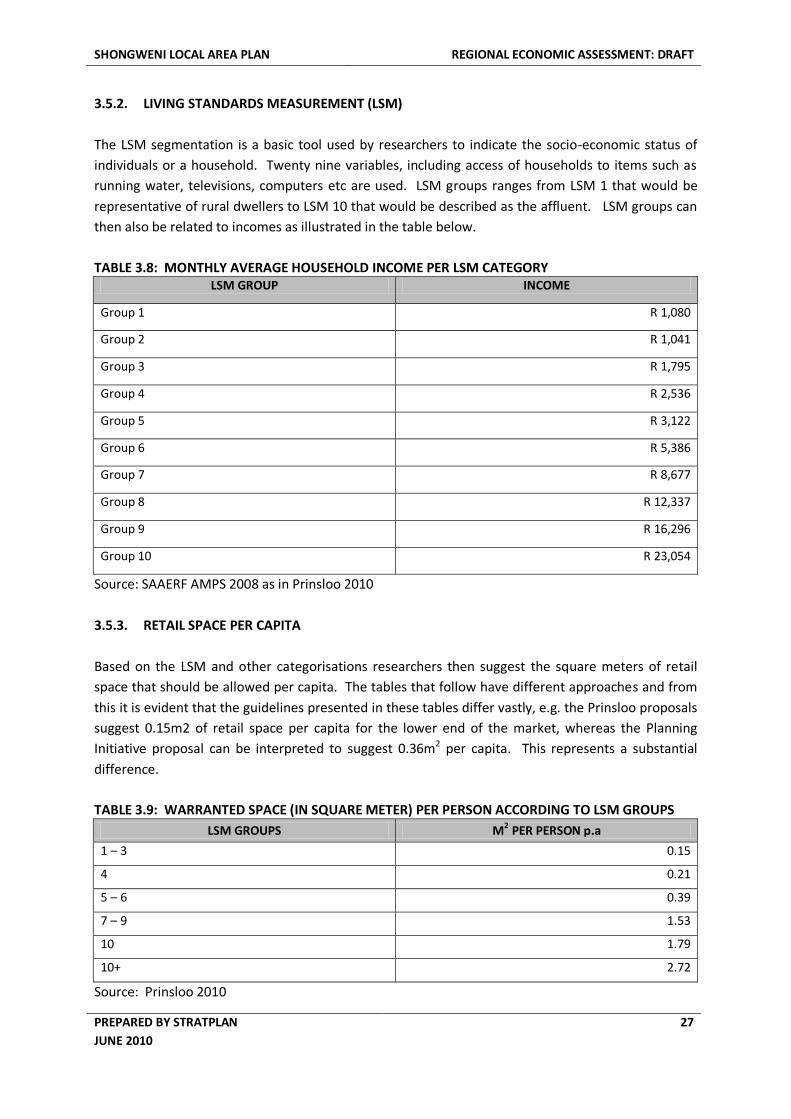
3.5.2. LIVING STANDARDS MEASUREMENT (LSM)
The LSM segmentation is a basic tool used by researchers to indicate the socio-economic status of
individuals or a household. Twenty nine variables, including access of households to items such as
running water, televisions, computers etc are used. LSM groups ranges from LSM 1 that would be
representative of rural dwellers to LSM 10 that would be described as the affluent. LSM groups can
then also be related to incomes as illustrated in the table below.
TABLE 3.8: MONTHLY AVERAGE HOUSEHOLD INCOME PER LSM CATEGORY LSM GROUP INCOME
Group 1 R 1,080
Group 2 R 1,041
Group 3 R 1,795
Group 4 R 2,536
Group 5 R 3,122
Group 6 R 5,386
Group 7 R 8,677
Group 8 R 12,337
Group 9 R 16,296
Group 10 R 23,054
Source: SAAERF AMPS 2008 as in Prinsloo 2010
3.5.3. RETAIL SPACE PER CAPITA
Based on the LSM and other categorisations researchers then suggest the square meters of retail
space that should be allowed per capita. The tables that follow have different approaches and from
this it is evident that the guidelines presented in these tables differ vastly, e.g. the Prinsloo proposals
suggest 0.15m2 of retail space per capita for the lower end of the market, whereas the Planning
Initiative proposal can be interpreted to suggest 0.36m2 per capita. This represents a substantial
difference.
TABLE 3.9: WARRANTED SPACE (IN SQUARE METER) PER PERSON ACCORDING TO LSM GROUPS
LSM GROUPS M2 PER PERSON p.a
1 – 3 0.15
4 0.21
5 – 6 0.39
7 – 9 1.53
10 1.79
10+ 2.72
Source: Prinsloo 2010
SHONGWENI LOCAL AREA PLAN REGIONAL ECONOMIC ASSESSMENT: DRAFT
PREPARED BY STRATPLAN
JUNE 2010
28
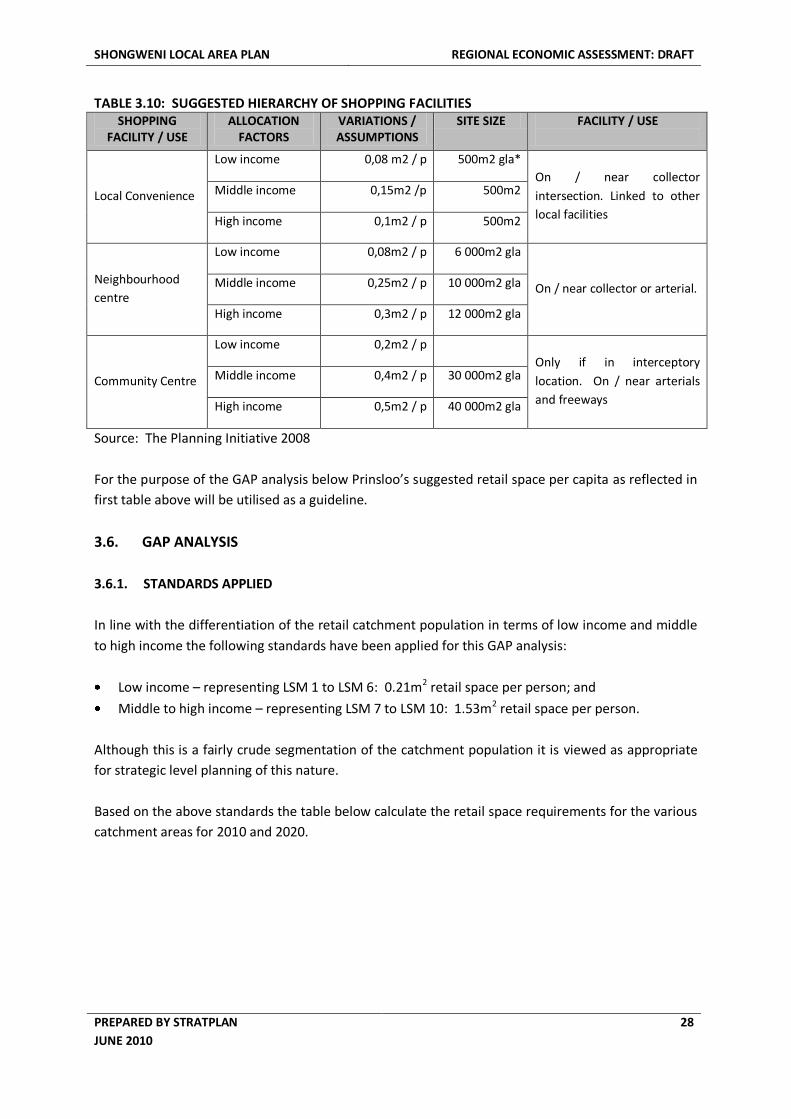
TABLE 3.10: SUGGESTED HIERARCHY OF SHOPPING FACILITIES SHOPPING
FACILITY / USE ALLOCATION
FACTORS VARIATIONS / ASSUMPTIONS
SITE SIZE FACILITY / USE
Local Convenience
Low income 0,08 m2 / p 500m2 gla*
On / near collector
intersection. Linked to other
local facilities
Middle income 0,15m2 /p 500m2
High income 0,1m2 / p 500m2
Neighbourhood
centre
Low income 0,08m2 / p 6 000m2 gla
On / near collector or arterial. Middle income 0,25m2 / p 10 000m2 gla
High income 0,3m2 / p 12 000m2 gla
Community Centre
Low income 0,2m2 / p
Only if in interceptory
location. On / near arterials
and freeways
Middle income 0,4m2 / p 30 000m2 gla
High income 0,5m2 / p 40 000m2 gla
Source: The Planning Initiative 2008
For the purpose of the GAP analysis below Prinsloo’s suggested retail space per capita as reflected in
first table above will be utilised as a guideline.
3.6. GAP ANALYSIS
3.6.1. STANDARDS APPLIED
In line with the differentiation of the retail catchment population in terms of low income and middle
to high income the following standards have been applied for this GAP analysis:
Low income – representing LSM 1 to LSM 6: 0.21m2 retail space per person; and
Middle to high income – representing LSM 7 to LSM 10: 1.53m2 retail space per person.
Although this is a fairly crude segmentation of the catchment population it is viewed as appropriate
for strategic level planning of this nature.
Based on the above standards the table below calculate the retail space requirements for the various
catchment areas for 2010 and 2020.
SHONGWENI LOCAL AREA PLAN REGIONAL ECONOMIC ASSESSMENT: DRAFT
PREPARED BY STRATPLAN
JUNE 2010
29
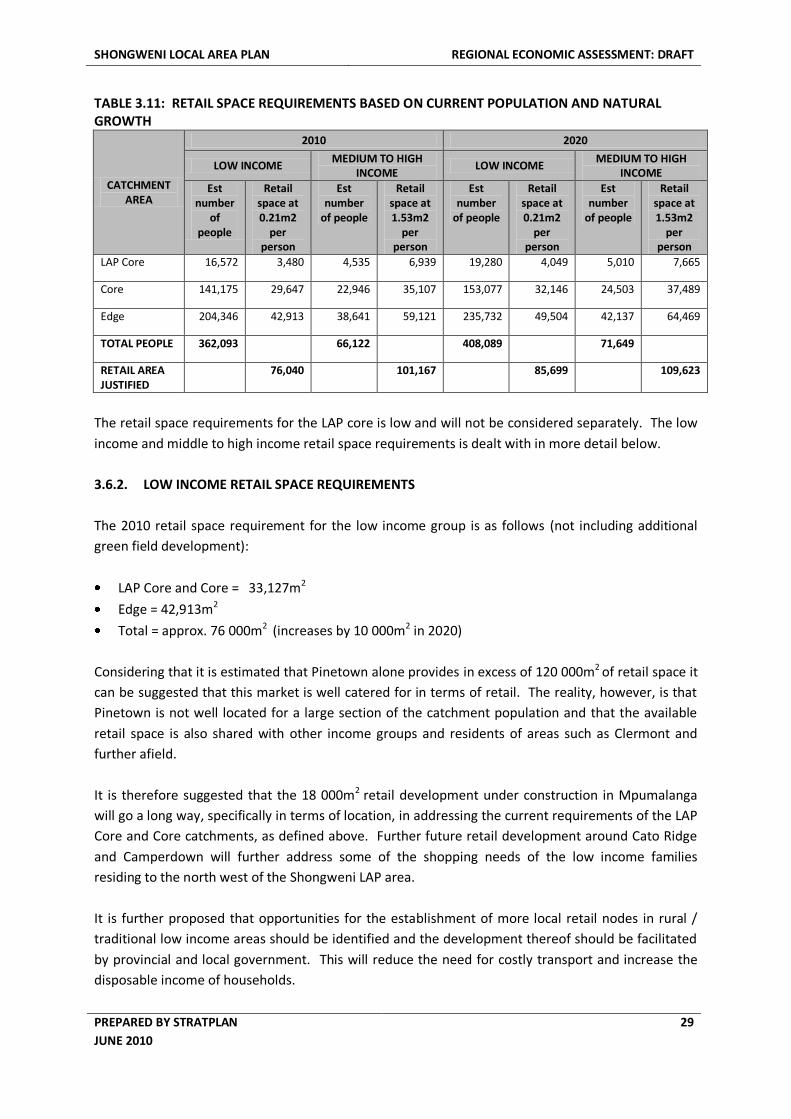
TABLE 3.11: RETAIL SPACE REQUIREMENTS BASED ON CURRENT POPULATION AND NATURAL GROWTH
CATCHMENT AREA
2010 2020
LOW INCOME MEDIUM TO HIGH
INCOME LOW INCOME
MEDIUM TO HIGH INCOME
Est number
of people
Retail space at 0.21m2
per person
Est number
of people
Retail space at 1.53m2
per person
Est number
of people
Retail space at 0.21m2
per person
Est number
of people
Retail space at 1.53m2
per person
LAP Core 16,572 3,480 4,535 6,939 19,280 4,049 5,010 7,665
Core 141,175 29,647 22,946 35,107 153,077 32,146 24,503 37,489
Edge 204,346 42,913 38,641 59,121 235,732 49,504 42,137 64,469
TOTAL PEOPLE 362,093 66,122 408,089 71,649
RETAIL AREA JUSTIFIED
76,040 101,167 85,699 109,623
The retail space requirements for the LAP core is low and will not be considered separately. The low
income and middle to high income retail space requirements is dealt with in more detail below.
3.6.2. LOW INCOME RETAIL SPACE REQUIREMENTS
The 2010 retail space requirement for the low income group is as follows (not including additional
green field development):
LAP Core and Core = 33,127m2
Edge = 42,913m2
Total = approx. 76 000m2 (increases by 10 000m2 in 2020)
Considering that it is estimated that Pinetown alone provides in excess of 120 000m2 of retail space it
can be suggested that this market is well catered for in terms of retail. The reality, however, is that
Pinetown is not well located for a large section of the catchment population and that the available
retail space is also shared with other income groups and residents of areas such as Clermont and
further afield.
It is therefore suggested that the 18 000m2 retail development under construction in Mpumalanga
will go a long way, specifically in terms of location, in addressing the current requirements of the LAP
Core and Core catchments, as defined above. Further future retail development around Cato Ridge
and Camperdown will further address some of the shopping needs of the low income families
residing to the north west of the Shongweni LAP area.
It is further proposed that opportunities for the establishment of more local retail nodes in rural /
traditional low income areas should be identified and the development thereof should be facilitated
by provincial and local government. This will reduce the need for costly transport and increase the
disposable income of households.
SHONGWENI LOCAL AREA PLAN REGIONAL ECONOMIC ASSESSMENT: DRAFT
PREPARED BY STRATPLAN
JUNE 2010
30
With regard to low income retail space it is therefore concluded that the current offering in regional
nodes is sufficient and that the focus should rather be on the development of existing regional nodes
such as Mpumalanga and more local retail nodes within walking distance or residents of low income
areas.
The additional 10 000m2 required by 2020 could in all likelihood be accommodated in existing
regional and local nodes.
3.6.3. MIDDLE TO HIGH INCOME RETAIL SPACE REQUIREMENTS
The 2010 retail space requirement for the middle to high income group is as follows (not including
additional Greenfield development and densification):
LAP Core and Core = 42,046m2
Edge = 59,121 m2
Total = approx. 101 000m2 (increases by 9 000m2 in 2020)
Considering that the current offering in terms of retail space in Hillcrest, Kloof and Waterfall
(shopping centres only) totals 111 755 m2, it is suggested that, based on the standards used, the area
is currently oversupplied in terms of retail. It should further be noted that this does not consider
utilisation of the space available in Pinetown and the Pavilion by the middle to high income groups in
the Shongweni catchments.
The extent of new upmarket residential development that came on line in the larger Hillcrest region
is difficult to establish and it is accepted that this would have contributed to a substantial increase in
the retail space requirements for the area. Further investigation and quantification of this growth
relevant to the Census 2001 figures should be undertaken.
The following statement in the 2009 Outer West Spatial Development Plan should perhaps be
considered in this regard:
The Retail Sector is influenced by the performance of shopping centres and the buying power of the
nodal catchment. The biggest growth in the form of new developments over the last 5 years has
occurred in Hillcrest and Waterfall. Some of the existing shopping areas on Old Main Road display
minimal shopping activities during the day which may imply that the buying power has either moved
out of Hillcrest or that there is an oversupply of shopping centres. Trends are not very clear as
developers still pursue development in this area despite resistance from the public. Traffic congestion
and lack of waste water disposal options act as deterrents to new development.
SHONGWENI LOCAL AREA PLAN REGIONAL ECONOMIC ASSESSMENT: DRAFT
PREPARED BY STRATPLAN
JUNE 2010
31
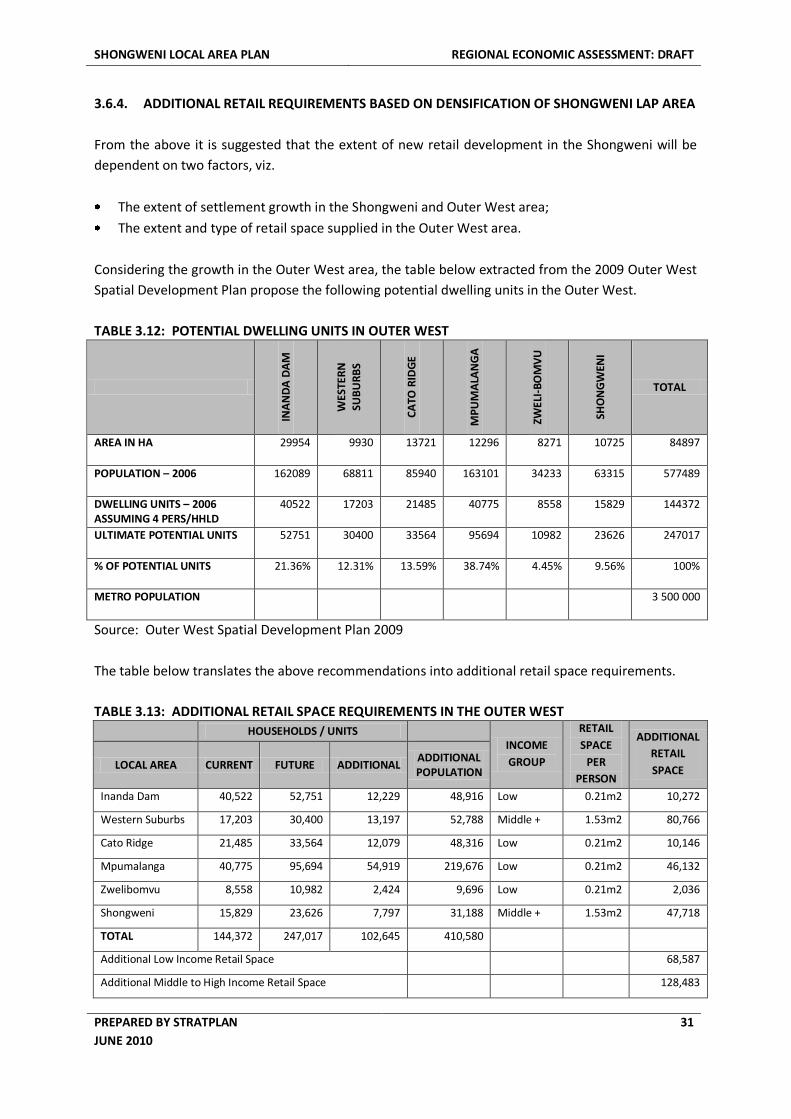
3.6.4. ADDITIONAL RETAIL REQUIREMENTS BASED ON DENSIFICATION OF SHONGWENI LAP AREA
From the above it is suggested that the extent of new retail development in the Shongweni will be
dependent on two factors, viz.
The extent of settlement growth in the Shongweni and Outer West area;
The extent and type of retail space supplied in the Outer West area.
Considering the growth in the Outer West area, the table below extracted from the 2009 Outer West
Spatial Development Plan propose the following potential dwelling units in the Outer West.
TABLE 3.12: POTENTIAL DWELLING UNITS IN OUTER WEST
INA
ND
A D
AM
WES
TER
N
SUB
UR
BS
CA
TO R
IDG
E
MP
UM
ALA
NG
A
ZWEL
I-B
OM
VU
SHO
NG
WEN
I
TOTAL
AREA IN HA 29954 9930 13721 12296 8271 10725 84897
POPULATION – 2006 162089 68811 85940 163101 34233 63315 577489
DWELLING UNITS – 2006 ASSUMING 4 PERS/HHLD
40522 17203 21485 40775 8558 15829 144372
ULTIMATE POTENTIAL UNITS 52751 30400 33564 95694 10982 23626 247017
% OF POTENTIAL UNITS 21.36% 12.31% 13.59% 38.74% 4.45% 9.56% 100%
METRO POPULATION 3 500 000
Source: Outer West Spatial Development Plan 2009
The table below translates the above recommendations into additional retail space requirements.
TABLE 3.13: ADDITIONAL RETAIL SPACE REQUIREMENTS IN THE OUTER WEST
HOUSEHOLDS / UNITS
INCOME
GROUP
RETAIL
SPACE
PER
PERSON
ADDITIONAL
RETAIL
SPACE LOCAL AREA CURRENT FUTURE ADDITIONAL ADDITIONAL POPULATION
Inanda Dam 40,522 52,751 12,229 48,916 Low 0.21m2 10,272
Western Suburbs 17,203 30,400 13,197 52,788 Middle + 1.53m2 80,766
Cato Ridge 21,485 33,564 12,079 48,316 Low 0.21m2 10,146
Mpumalanga 40,775 95,694 54,919 219,676 Low 0.21m2 46,132
Zwelibomvu 8,558 10,982 2,424 9,696 Low 0.21m2 2,036
Shongweni 15,829 23,626 7,797 31,188 Middle + 1.53m2 47,718
TOTAL 144,372 247,017 102,645 410,580
Additional Low Income Retail Space 68,587
Additional Middle to High Income Retail Space 128,483
SHONGWENI LOCAL AREA PLAN REGIONAL ECONOMIC ASSESSMENT: DRAFT
PREPARED BY STRATPLAN
JUNE 2010
32
The rate of future urban growth in the Outer West will depend on a number of factors, but
importantly access to job opportunities and the availability of alternative housing closer to the CBD /
SDB / Pinetown areas of employment will have a major impact on this growth rate. It is highly
possible that the above numbers of units will only be achieved in a 50 year timescale.
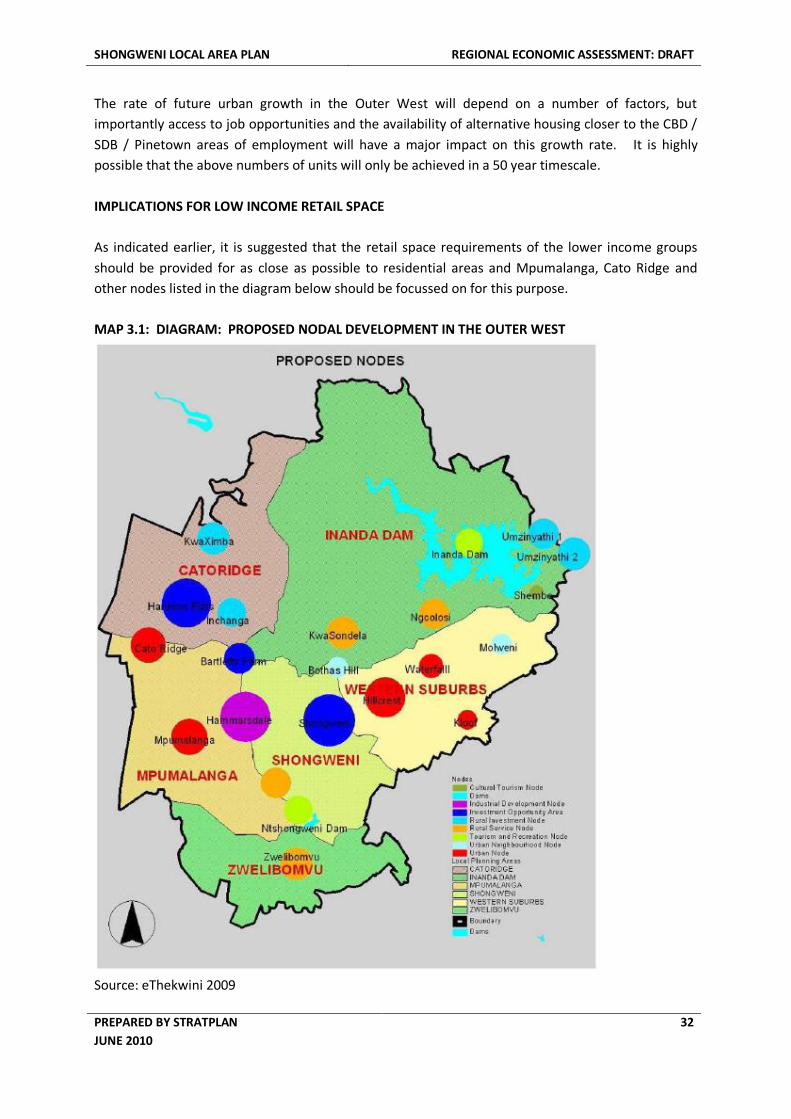
IMPLICATIONS FOR LOW INCOME RETAIL SPACE
As indicated earlier, it is suggested that the retail space requirements of the lower income groups
should be provided for as close as possible to residential areas and Mpumalanga, Cato Ridge and
other nodes listed in the diagram below should be focussed on for this purpose.
MAP 3.1: DIAGRAM: PROPOSED NODAL DEVELOPMENT IN THE OUTER WEST
Source: eThekwini 2009
SHONGWENI LOCAL AREA PLAN REGIONAL ECONOMIC ASSESSMENT: DRAFT
PREPARED BY STRATPLAN
JUNE 2010
33
Further to this, it is suggested that the above projected retail space requirements for the low income
groups may be found to be to low in future due to changing retail needs and patterns of this group.
Also, it is hoped that employment and income patterns in the low income areas improve over time
allowing for a greater proportion of the low income group to be accommodated in the middle to high
income groups.
IMPLICATIONS FOR MIDDLE TO HIGH INCOME RETAIL SPACE
Accommodating future retail space growth for the middle to high income groups is much more
complex. The above calculations suggest additional provision for 128 000 m2 to be made (different
scenarios regarding this could be explored in future) should household / unit densities reflected in
the OWSDP be considered. Current local area planning for Shongweni suggest that at least 60 000
m2 more retail space may be required (assuming 10 000 [current proposals suggest 20 000] more
middle to high income households accommodated in Shongweni than anticipated in Outer West
Spatial Planning). This suggest a requirement for at least an additional 190 000 m2 of retail space for
the middle to high income population of the Outer West once proposed densities have been
achieved. Considering that the area may well be overtraded at present by 30 000 m2, this
requirement can be reduced to 160 000m2.
The challenge will then be to determine where this space will be developed in the longer term, and
again it is assumed that this will be achieved over a 50 year timescale. It is suggested that the
following nodes will attract some of this space:
Giba Gorge area (currently proposals for commercial / retail development in this area);
Kloof;
Hillcrest;
Waterfall;
Botha’s Hill;
Shongweni Town Centre.
In nodes such as Kloof and Hillcrest additional space will relate to the redevelopment of existing
retail areas and the future densification of development. New development can still be provided for
in other areas.
Based on the above it is suggested that at least 50% or 80 000m2 of the above retail space should be
accommodated in the Shongweni “Town Centre” and should this be released over 50 years it will
translate to 16 000 m2 of additional retail space to be provided for every ten years in the Shongweni
area. As noted in comments on a first draft of this report, developers are most likely to initially opt
for the establishment of 30 000m2 of retail space to achieve a particular critical mass.
SHONGWENI LOCAL AREA PLAN REGIONAL ECONOMIC ASSESSMENT: DRAFT
PREPARED BY STRATPLAN
JUNE 2010
34
3.7. SUMMARY RECOMMENDATIONS: RETAIL DEVELOPMENT IN SHONGWENI
Based on the above analysis, in summary, then the following:
The population of the Outer West area may in future nearly double and additional retail space
will have to be provided for the various income categories.
At present the low income group in the Outer West is undersupplied in terms of well located
retail space and is generally dependent on Pinetown for retail and commercial needs. It is
suggested that this need is addressed locally in proximity to the various settlement areas. Major
nodes in Shongweni are not necessarily well located for this purpose.
The middle and high income retail sector may currently be overtraded in the Outer West area,
however, should the envisaged densification occur in Shongweni and other local areas a
substantial demand for retail space is anticipated. Adequate provision should be made for this
space in line with the planned land release by developers and the ability of the eThekwini to
provide bulk infrastructure for development.
SHONGWENI LOCAL AREA PLAN REGIONAL ECONOMIC ASSESSMENT: DRAFT
PREPARED BY STRATPLAN
JUNE 2010
35
4. COMMERCIAL / OFFICE SECTOR
4.1. GLOBAL TRENDS IN THE COMMERCIAL PROPERTY SECTOR
In planning for future office space in the Shongweni LAP area it is important that current global
trends in office design be considered as some of these will also impact on the spatial distribution of
office space. Some of the global trends in office design is summarised in a 2007 article by Heisler (as
summarised by Cynamon-Murphy):
Technology Transformation: Technology is changing the way we use space. Telecommuting,
VPNs and wireless networks all change the way we use space, and when. To assume that all
employees use their office space 100% of the work day would do them a disservice and could be
costing you.
Collaboration Exploration: Teamwork is the new “individual contributor”. Group projects are
the norm and space needs to foster, rather than stifle, collaborative efforts.
Rise of Branded Environments: Firms today have a philosophy or image to maintain and are
capitalizing on their workspace to further reinforce who they are.
Mainstream Green: LEED (Leadership in Energy and Environmental Design) and sustainable
design are buzzwords right now. Although firms don’t necessarily want to go through the
expense of formal LEED certification, they are eager to incorporate sustainable elements into
their workspaces.
Change Management in the Work Environment: Younger employees do not have the same
work mentality as older employees. As the workforce shifts from Baby Boomer to Gen X/Gen Y,
real estate and facility teams need to understand the differences in how the two generations use
space.
The above highlights some of the key trends in a rapidly changing environment and it is suggested
that the workplace design in an area such as Umhlanga Ridge, developed over the past decade, may
already be outdated. The central location of Shongweni in terms of the two major cities in the
province, the seat of government and the economic hub, makes it the ideal place to initiate the
process of developing an alternative to the office blocks of the past and present. This together with
the potential of providing new middle to high income accommodation in a rural setting close to the
workplace should be viewed as the competitive advantage of the local area.
4.2. CURRENT OFFICE PROPERTY ECONOMIC TRENDS
At present property commentators are uncertain about the future of this particular market and
forecasts are generally of a short term nature. Erwin Rode, in an article Property Trends, 2010 and
Beyond suggests that, assuming consensus growth for the economy over the next three years, the
“industrial and office markets will start picking up in two years”. The same article propose that there
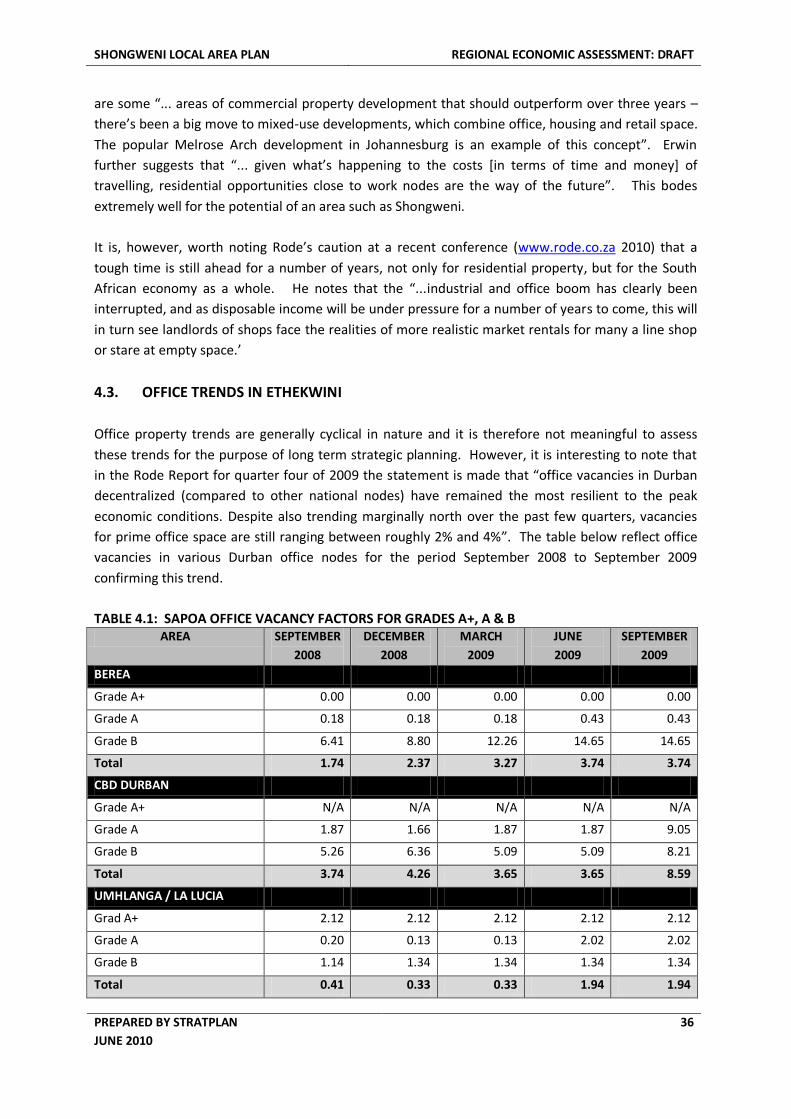
SHONGWENI LOCAL AREA PLAN REGIONAL ECONOMIC ASSESSMENT: DRAFT
PREPARED BY STRATPLAN
JUNE 2010
36
are some “... areas of commercial property development that should outperform over three years –
there’s been a big move to mixed-use developments, which combine office, housing and retail space.
The popular Melrose Arch development in Johannesburg is an example of this concept”. Erwin
further suggests that “... given what’s happening to the costs *in terms of time and money+ of
travelling, residential opportunities close to work nodes are the way of the future”. This bodes
extremely well for the potential of an area such as Shongweni.
It is, however, worth noting Rode’s caution at a recent conference (www.rode.co.za 2010) that a
tough time is still ahead for a number of years, not only for residential property, but for the South
African economy as a whole. He notes that the “...industrial and office boom has clearly been
interrupted, and as disposable income will be under pressure for a number of years to come, this will
in turn see landlords of shops face the realities of more realistic market rentals for many a line shop
or stare at empty space.’
4.3. OFFICE TRENDS IN ETHEKWINI
Office property trends are generally cyclical in nature and it is therefore not meaningful to assess
these trends for the purpose of long term strategic planning. However, it is interesting to note that
in the Rode Report for quarter four of 2009 the statement is made that “office vacancies in Durban
decentralized (compared to other national nodes) have remained the most resilient to the peak
economic conditions. Despite also trending marginally north over the past few quarters, vacancies
for prime office space are still ranging between roughly 2% and 4%”. The table below reflect office
vacancies in various Durban office nodes for the period September 2008 to September 2009
confirming this trend.
TABLE 4.1: SAPOA OFFICE VACANCY FACTORS FOR GRADES A+, A & B AREA SEPTEMBER
2008
DECEMBER
2008
MARCH
2009
JUNE
2009
SEPTEMBER
2009
BEREA
Grade A+ 0.00 0.00 0.00 0.00 0.00
Grade A 0.18 0.18 0.18 0.43 0.43
Grade B 6.41 8.80 12.26 14.65 14.65
Total 1.74 2.37 3.27 3.74 3.74
CBD DURBAN
Grade A+ N/A N/A N/A N/A N/A
Grade A 1.87 1.66 1.87 1.87 9.05
Grade B 5.26 6.36 5.09 5.09 8.21
Total 3.74 4.26 3.65 3.65 8.59
UMHLANGA / LA LUCIA
Grad A+ 2.12 2.12 2.12 2.12 2.12
Grade A 0.20 0.13 0.13 2.02 2.02
Grade B 1.14 1.34 1.34 1.34 1.34
Total 0.41 0.33 0.33 1.94 1.94
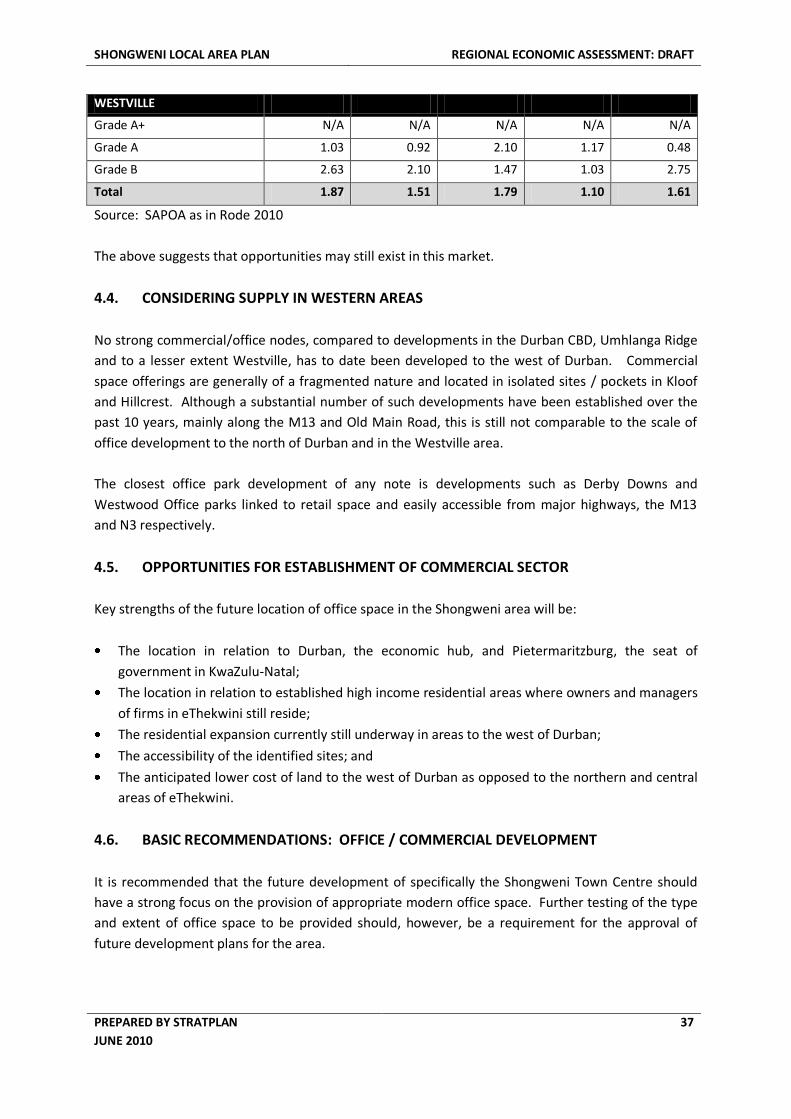
SHONGWENI LOCAL AREA PLAN REGIONAL ECONOMIC ASSESSMENT: DRAFT
PREPARED BY STRATPLAN
JUNE 2010
37
WESTVILLE
Grade A+ N/A N/A N/A N/A N/A
Grade A 1.03 0.92 2.10 1.17 0.48
Grade B 2.63 2.10 1.47 1.03 2.75
Total 1.87 1.51 1.79 1.10 1.61
Source: SAPOA as in Rode 2010
The above suggests that opportunities may still exist in this market.
4.4. CONSIDERING SUPPLY IN WESTERN AREAS
No strong commercial/office nodes, compared to developments in the Durban CBD, Umhlanga Ridge
and to a lesser extent Westville, has to date been developed to the west of Durban. Commercial
space offerings are generally of a fragmented nature and located in isolated sites / pockets in Kloof
and Hillcrest. Although a substantial number of such developments have been established over the
past 10 years, mainly along the M13 and Old Main Road, this is still not comparable to the scale of
office development to the north of Durban and in the Westville area.
The closest office park development of any note is developments such as Derby Downs and
Westwood Office parks linked to retail space and easily accessible from major highways, the M13
and N3 respectively.
4.5. OPPORTUNITIES FOR ESTABLISHMENT OF COMMERCIAL SECTOR
Key strengths of the future location of office space in the Shongweni area will be:
The location in relation to Durban, the economic hub, and Pietermaritzburg, the seat of
government in KwaZulu-Natal;
The location in relation to established high income residential areas where owners and managers
of firms in eThekwini still reside;
The residential expansion currently still underway in areas to the west of Durban;
The accessibility of the identified sites; and
The anticipated lower cost of land to the west of Durban as opposed to the northern and central
areas of eThekwini.
4.6. BASIC RECOMMENDATIONS: OFFICE / COMMERCIAL DEVELOPMENT
It is recommended that the future development of specifically the Shongweni Town Centre should
have a strong focus on the provision of appropriate modern office space. Further testing of the type
and extent of office space to be provided should, however, be a requirement for the approval of
future development plans for the area.
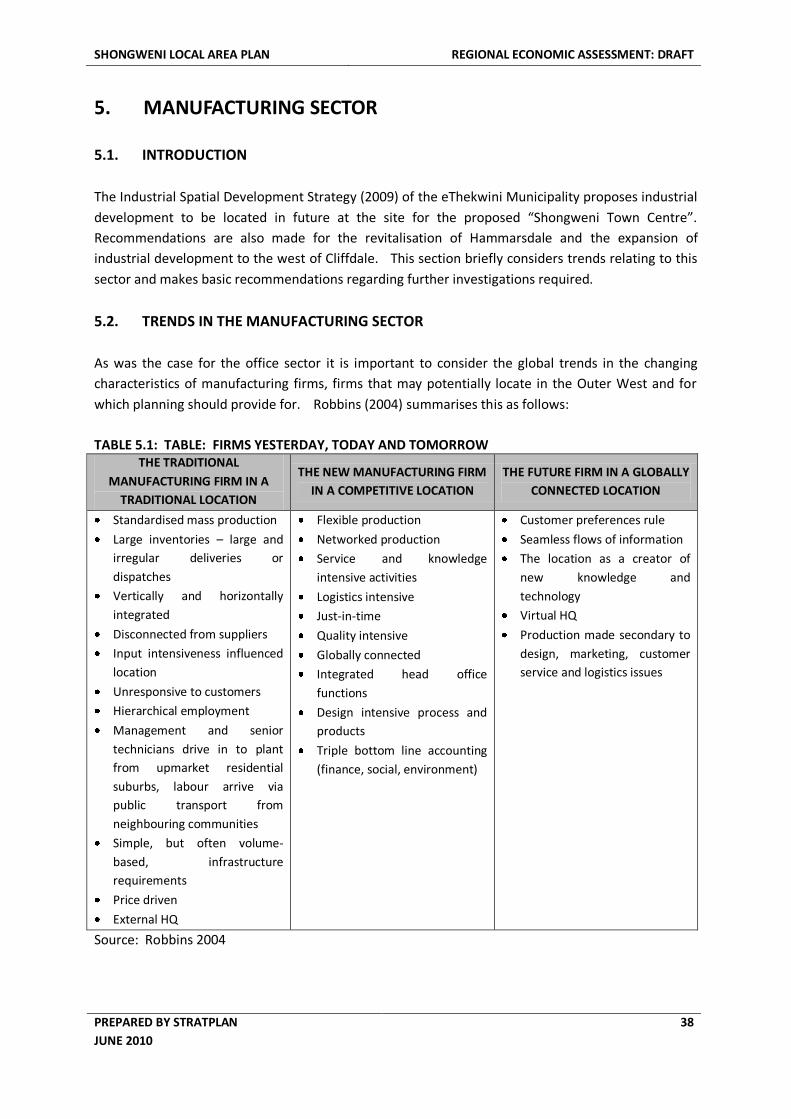
SHONGWENI LOCAL AREA PLAN REGIONAL ECONOMIC ASSESSMENT: DRAFT
PREPARED BY STRATPLAN
JUNE 2010
38
5. MANUFACTURING SECTOR
5.1. INTRODUCTION
The Industrial Spatial Development Strategy (2009) of the eThekwini Municipality proposes industrial
development to be located in future at the site for the proposed “Shongweni Town Centre”.
Recommendations are also made for the revitalisation of Hammarsdale and the expansion of
industrial development to the west of Cliffdale. This section briefly considers trends relating to this
sector and makes basic recommendations regarding further investigations required.
5.2. TRENDS IN THE MANUFACTURING SECTOR
As was the case for the office sector it is important to consider the global trends in the changing
characteristics of manufacturing firms, firms that may potentially locate in the Outer West and for
which planning should provide for. Robbins (2004) summarises this as follows:
TABLE 5.1: TABLE: FIRMS YESTERDAY, TODAY AND TOMORROW THE TRADITIONAL
MANUFACTURING FIRM IN A
TRADITIONAL LOCATION
THE NEW MANUFACTURING FIRM
IN A COMPETITIVE LOCATION
THE FUTURE FIRM IN A GLOBALLY
CONNECTED LOCATION
Standardised mass production
Large inventories – large and
irregular deliveries or
dispatches
Vertically and horizontally
integrated
Disconnected from suppliers
Input intensiveness influenced
location
Unresponsive to customers
Hierarchical employment
Management and senior
technicians drive in to plant
from upmarket residential
suburbs, labour arrive via
public transport from
neighbouring communities
Simple, but often volume-
based, infrastructure
requirements
Price driven
External HQ
Flexible production
Networked production
Service and knowledge
intensive activities
Logistics intensive
Just-in-time
Quality intensive
Globally connected
Integrated head office
functions
Design intensive process and
products
Triple bottom line accounting
(finance, social, environment)
Customer preferences rule
Seamless flows of information
The location as a creator of
new knowledge and
technology
Virtual HQ
Production made secondary to
design, marketing, customer
service and logistics issues
Source: Robbins 2004
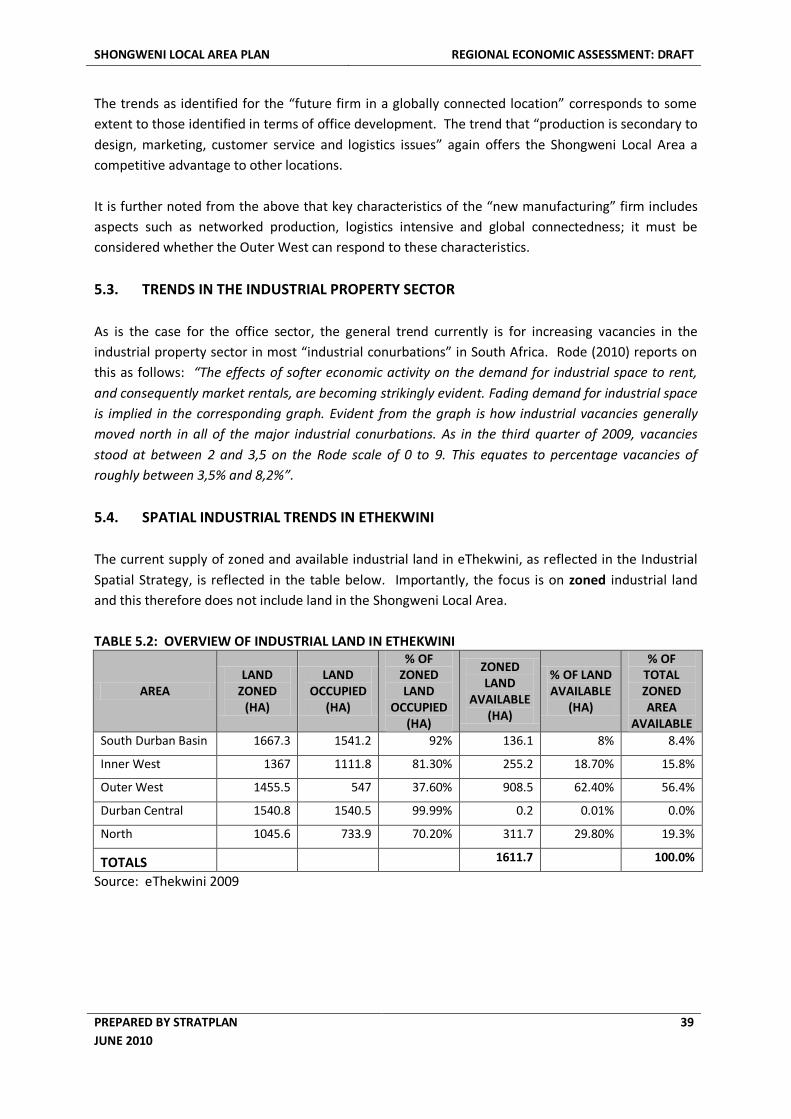
SHONGWENI LOCAL AREA PLAN REGIONAL ECONOMIC ASSESSMENT: DRAFT
PREPARED BY STRATPLAN
JUNE 2010
39
The trends as identified for the “future firm in a globally connected location” corresponds to some
extent to those identified in terms of office development. The trend that “production is secondary to
design, marketing, customer service and logistics issues” again offers the Shongweni Local Area a
competitive advantage to other locations.
It is further noted from the above that key characteristics of the “new manufacturing” firm includes
aspects such as networked production, logistics intensive and global connectedness; it must be
considered whether the Outer West can respond to these characteristics.
5.3. TRENDS IN THE INDUSTRIAL PROPERTY SECTOR
As is the case for the office sector, the general trend currently is for increasing vacancies in the
industrial property sector in most “industrial conurbations” in South Africa. Rode (2010) reports on
this as follows: “The effects of softer economic activity on the demand for industrial space to rent,
and consequently market rentals, are becoming strikingly evident. Fading demand for industrial space
is implied in the corresponding graph. Evident from the graph is how industrial vacancies generally
moved north in all of the major industrial conurbations. As in the third quarter of 2009, vacancies
stood at between 2 and 3,5 on the Rode scale of 0 to 9. This equates to percentage vacancies of
roughly between 3,5% and 8,2%”.
5.4. SPATIAL INDUSTRIAL TRENDS IN ETHEKWINI
The current supply of zoned and available industrial land in eThekwini, as reflected in the Industrial
Spatial Strategy, is reflected in the table below. Importantly, the focus is on zoned industrial land
and this therefore does not include land in the Shongweni Local Area.
TABLE 5.2: OVERVIEW OF INDUSTRIAL LAND IN ETHEKWINI
AREA LAND
ZONED (HA)
LAND OCCUPIED
(HA)
% OF ZONED LAND
OCCUPIED (HA)
ZONED LAND
AVAILABLE (HA)
% OF LAND AVAILABLE
(HA)
% OF TOTAL ZONED AREA
AVAILABLE
South Durban Basin 1667.3 1541.2 92% 136.1 8% 8.4%
Inner West 1367 1111.8 81.30% 255.2 18.70% 15.8%
Outer West 1455.5 547 37.60% 908.5 62.40% 56.4%
Durban Central 1540.8 1540.5 99.99% 0.2 0.01% 0.0%
North 1045.6 733.9 70.20% 311.7 29.80% 19.3%
TOTALS 1611.7 100.0%
Source: eThekwini 2009
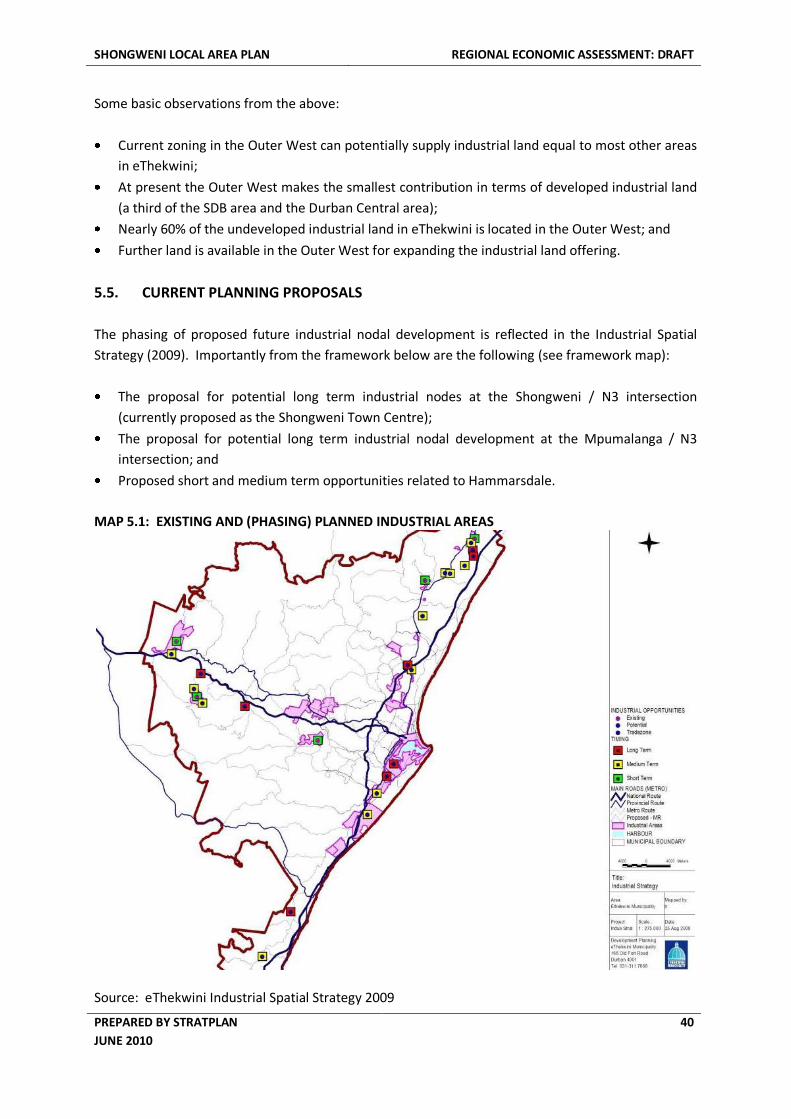
SHONGWENI LOCAL AREA PLAN REGIONAL ECONOMIC ASSESSMENT: DRAFT
PREPARED BY STRATPLAN
JUNE 2010
40
Some basic observations from the above:
Current zoning in the Outer West can potentially supply industrial land equal to most other areas
in eThekwini;
At present the Outer West makes the smallest contribution in terms of developed industrial land
(a third of the SDB area and the Durban Central area);
Nearly 60% of the undeveloped industrial land in eThekwini is located in the Outer West; and
Further land is available in the Outer West for expanding the industrial land offering.
5.5. CURRENT PLANNING PROPOSALS
The phasing of proposed future industrial nodal development is reflected in the Industrial Spatial
Strategy (2009). Importantly from the framework below are the following (see framework map):
The proposal for potential long term industrial nodes at the Shongweni / N3 intersection
(currently proposed as the Shongweni Town Centre);
The proposal for potential long term industrial nodal development at the Mpumalanga / N3
intersection; and
Proposed short and medium term opportunities related to Hammarsdale.
MAP 5.1: EXISTING AND (PHASING) PLANNED INDUSTRIAL AREAS
Source: eThekwini Industrial Spatial Strategy 2009
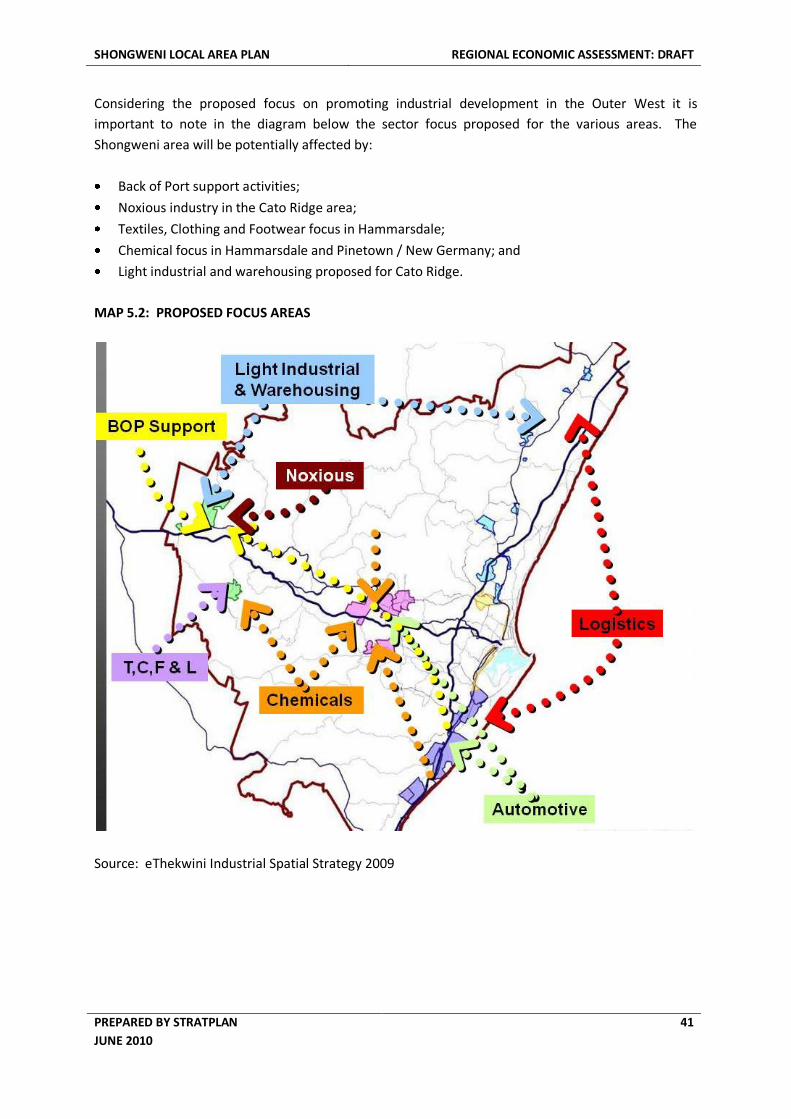
SHONGWENI LOCAL AREA PLAN REGIONAL ECONOMIC ASSESSMENT: DRAFT
PREPARED BY STRATPLAN
JUNE 2010
41
Considering the proposed focus on promoting industrial development in the Outer West it is
important to note in the diagram below the sector focus proposed for the various areas. The
Shongweni area will be potentially affected by:
Back of Port support activities;
Noxious industry in the Cato Ridge area;
Textiles, Clothing and Footwear focus in Hammarsdale;
Chemical focus in Hammarsdale and Pinetown / New Germany; and
Light industrial and warehousing proposed for Cato Ridge.
MAP 5.2: PROPOSED FOCUS AREAS
Source: eThekwini Industrial Spatial Strategy 2009
SHONGWENI LOCAL AREA PLAN REGIONAL ECONOMIC ASSESSMENT: DRAFT
PREPARED BY STRATPLAN
JUNE 2010
42
5.6. RECOMMENDATIONS
Based on the brief assessment of the industrial sector, and preceding sections addressing retail and
office development, the following recommendations are made regarding future industrial sector
development in the Shongweni Local Area:
Industrial development in the Shongweni Local Area and surrounding areas are viewed as
essential in order to create job opportunities for the vast unemployed workforce in the
catchment (the present situation of people having to access job opportunities in the CBD, SDB
and northern areas is not sustainable);
The main area of focus for industrial development should be the Cliffdale area linked to the
Hammarsdale ‘complex’, an area where service sector activities are already establishing (private
landownership of land parcels may complicate these development intentions);
Conventional industrial development should not be provided for at the proposed Shongweni
Town Centre node as it will detract from the business and residential amenity, however,
feasibility for the establishment of a high tech industrial / research orientated cluster in the
“frame” should be investigated.
SHONGWENI LOCAL AREA PLAN REGIONAL ECONOMIC ASSESSMENT: DRAFT
PREPARED BY STRATPLAN
JUNE 2010
43
6. ALTERNATIVE OPPORTUNITIES
6.1. THE AGRIBUSINESS SECTOR
The proposed spatial planning makes provision for the establishment of an agribusiness cluster in the
area where the current mushroom farm is located, bordering on Summerveld and Salem. The
establishment of this cluster is motivated for from a number of perspectives:
There is still substantial agricultural production activity in the general area and providing access
to inputs and equipment in close vicinity will strengthen the development of a cluster;
It is generally recommended that agricultural development in the Shongweni Local Area be
intensified and diversified (both formal and informal) as it represents an important area of
agricultural production in the eThekwini context;
Requests for the provision of more space for a farmer’s market have been received from
community members;
Alternative crops and production techniques is already a core characteristic of the area and can
be built on; and
This type of use will be more compatible with the proposed landfill site than most other uses.
Although there is a strong move to also locate agribusiness related activities / cluster in proximity to
the Dube Tradeport to the north of Durban, it is suggested that considering the provincial
distribution of production spatially, the Outer West may be better positioned to attract non-export
related production and related activities. Should the local intensification of production be achieved,
partly also as a result of sugar production becoming more marginal, this will add weight to the
establishment of the agricultural cluster.
It is further recommended that the potential of locating (or re-locating) the municipal fresh produce
market to this area be considered. It will not only improve the distribution of fresh produce in
eThekwini, but also free up strategically located land for other more pressing needs (e.g. back of port
logistics). Further detailed assessments will be required in order to determine the feasibility of this.
SHONGWENI LOCAL AREA PLAN REGIONAL ECONOMIC ASSESSMENT: DRAFT
PREPARED BY STRATPLAN
JUNE 2010
44
7. SUMMARY RECOMMENDATION
7.1. GENERAL RECOMMENDATIONS
The various sections above proposed approaches to the development of the retail, office and
industrial sectors to be considered in development planning for the Shongweni Local Area. This is a
preliminary input for strategic planning purposes and it is suggested that before precinct planning is
engaged in, a more detailed economic planning assessment should be undertaken. The findings of
this report should be used to guide such future investigations.
From the assessments in this report it is apparent that the Outer West as yet does not make a
significant contribution to employment in the eThekwini region. The formal and traditional
settlement areas that have developed in the Outer West as a result of apartheid spatial planning
policies is far removed from the job opportunities offered in other parts of eThekwini and local job
creation must be a primary development objective. Based on this and related investigations, it is
suggested that this objective can be achieved through:
the expansion of general industrial development in the Cliffdale area (related to Hammarsdale),
establishing high tech industries in the frame of the proposed Shongweni Town Centre,
promoting office development in the Town Centre core,
intensifying and diversifying agricultural development,
development of an agribusiness cluster;
supporting the consolidation of the equestrian cluster;
supporting the strengthening of the tourism/recreation sector, specifically in the northern parts
of the planning area and relating to the Shongweni Resources Reserve, Giba Gorge and the
equestrian industry; and
establishing new residential developments in the area.
7.2. MIDDLE TO HIGH INCOME RETAIL RECOMMENDATIONS
An additional 160 000 m2 plus of retail space, considering current retail formats, will be required in
the Outer West should current planned densities be achieved. It is suggested that this could be
accommodated in the Outer West as follows:
A portion of this should be developed in planned and existing retail nodes including Giba Gorge
area (currently proposals for commercial / retail development in this area); Kloof; Hillcrest;
Waterfall; and Botha’s Hill;
At least 50% of this could be accommodated in the proposed Shongweni Town Centre in the
longer term, detailed planning to make provision for at least two larger sites that can each
accommodate at least 30 000m2 of retail space;
Detailed precinct planning to further consider the potential for small convenience shopping
clusters (not necessarily centres) in each of the precincts.
SHONGWENI LOCAL AREA PLAN REGIONAL ECONOMIC ASSESSMENT: DRAFT
PREPARED BY STRATPLAN
JUNE 2010
45
7.3. LOW INCOME RETAIL RECOMMENDATIONS
The findings of this report confirms that every effort should be made to bring retail services closer to
low income communities in the Outer West. In order to achieve this the following is recommended:
Continued support for the establishment and future growth of the Mpumalanga Town Centre to
act as a regional centre for the Outer West (it must however be considered that as peri-urban
and rural areas around eThekwini densify the most appropriate location for such a town centre
may also change and the identification of potential future alternative locations for regional
service centres should be further investigated);
The potential expansion of commercial delivery in an existing node such as Cato Ridge;
Facilitating the establishment of smaller local clusters of retail (not necessarily shopping centres)
of approximately 2 000 to 5 000 m2 in the rural service nodes identified and confirmed in the
Outer West Spatial Development Plan;
Pro-actively identifying other nodes where large concentrations (even at low densities) of people
will benefit from access to local level commercial and social services and facilitating the
development of commercial retail and market opportunities in such nodes.
It is important that every effort is made to coordinate the delivery of retail and government services
in the various nodes considered above.
7.4. OFFICE / COMMERCIAL DEVELOPMENT RECOMMENDATIONS
It is recommended that the emphasis of development in the proposed Shongweni Town Centre be on
office and commercial development. The extent and format of the space to be provided for the
sector should be considered in further more detailed planning.
7.5. MANUFACTURING SECTOR DEVELOPMENT RECOMMENDATIONS
The following recommendations are made regarding the future development of the industrial sector:
Industrial development in the Shongweni Local Area should be focussed in the Cliffdale area
linked to the Hammarsdale ‘complex’;
The feasibility for the establishment of a high tech industrial / research orientated cluster in the
Shongweni Town Centre “frame” should be investigated.
As is the case for office development, the extent and format of the space to be provided for the
sector should be considered in further more detailed planning.
SHONGWENI LOCAL AREA PLAN REGIONAL ECONOMIC ASSESSMENT: DRAFT
PREPARED BY STRATPLAN
JUNE 2010
46
SOURCES:
eThekwini Municipality Development Planning Department, June 2009. Outer West Spatial
Development Plan 2nd Draft.
eThekwini Municipality, 2009. Industrial Spatial Strategy. Prepared by Framework Planning Branch.
eThekwini Municipality, 2010. Planning Unit data based on Census 2001.
http://capmon.durban.gov.za/ reports/ geographical/planunt2
Graham Muller and Associates, 2006. eThekwini Municipality Economic Review 2006/7.
Prinsloo, D. 2010. The Nature of the International, National and KwaZulu-Natal Retail and
Shopping Centre Industry. A research report prepared for the KwaZulu-Natal Planning &
Development Commission.
Robbins, G. 2004. The South Durban Basin – A framework for integrating economic development
issues into broader planning processes. A position paper prepared as part of the Spatial
Development Planning process in the SDB.
Rode, Erwin (ed.), 2010. Rode’s Report 2009:4.
South African Council of Shopping Centres, 2009. South African Shopping Centre Directory 2009/10.
The Planning Initiative Team, 2008. Guidelines for Planning of Facilities in KwaZulu-Natal.
www.thepropertymag.co.za Article: Property Trends, 2010 and Beyond
www.rode.co.za Article: Rode Conference warns of rocky road ahead but opportunities do exist