monthly report - michigan
TRANSCRIPT
Monthly Report January 1, 2021 – January 31, 2021
Governor Executive Director Director
Gretchen Whitmer Andrew Brisbo Orlene Hawks
2 | P a g e
Table of Contents
Medical Marijuana Facility Licensing ..................................................................................... 4
1. Product Sales ............................................................................................................... 4
2. Plants ........................................................................................................................... 4
3. Packages and Inventory ............................................................................................... 5
4. Transfers ...................................................................................................................... 5
5. Initial Applications ........................................................................................................ 6
6. Renewal Applications ................................................................................................... 6
7. Application Processing Time ........................................................................................ 7
8. Actions Taken by the MRA ........................................................................................... 7
9. Complaints and Investigations...................................................................................... 7
10. Number of Administrative Hearing Adjudications .......................................................... 8
11. Revenue and Expenses ............................................................................................... 8
12. Municipalities Opting In to the MMFLA ......................................................................... 9
13. Demographic Information ............................................................................................. 9
Adult-Use Establishment Licensing ......................................................................................13
1. Product Sales ..............................................................................................................13
2. Plants ..........................................................................................................................13
3. Packages and Inventory ..............................................................................................14
4. Transfers .....................................................................................................................14
5. Initial Applications .......................................................................................................15
6. Renewal Applications ..................................................................................................16
7. Application Processing Time .......................................................................................17
8. Actions Taken by the MRA ..........................................................................................18
9. Applications not Processed within Established Time Requirements ............................18
10. Complaints and Investigations.....................................................................................18
11. Number of Administrative Hearing Adjudications .........................................................19
12. Revenue and Expenses ..............................................................................................19
13. Social Equity Applications ...........................................................................................20
14. Social Equity Education & Outreach ............................................................................21
15. Social Equity Application Assistance Provided ............................................................21
16. MTIS Criminal Enforcement Data ................................................................................21
17. Municipalities Opting In or Out of MRTMA ..................................................................21
18. Demographic Information ............................................................................................22
Medical Marijuana Registry Program ....................................................................................26
1. Initial Applications .......................................................................................................26

3 | P a g e
2. Renewal Applications ..................................................................................................26
3. Application Processing Time .......................................................................................26
4. Number of Applications Filed for Registry Identification Cards ....................................26
5. Number of Qualifying Patients and Primary Caregivers Approved in Each County ......27
6. Registry Identification Cards Revoked .........................................................................28
7. Nature of the Debilitating Medical Conditions of the Qualifying Patients. .....................28
8. Number of Physicians Providing Written Certifications for Qualifying Patients .............29
9. Applications not Processed within Established Time Requirements ............................29
10. Revenue and Expenses ..............................................................................................29

4 | P a g e
Medical Marijuana Facility Licensing 1. Product Sales
Sales by Product Type
January 1 - January 31
Product Type Pounds Sold Fluid Ounces Sold Total Sales
Flower 4,510.56 $18,189,817.16
Shake/Trim 490.26 $1,173,795.30
Concentrate 284.3 $3,963,622.84
Vape Cartridge 925.32 $12,277,598.62
Kief 4 $32,819.63
Infused-Edible 34,713.59 $4,871,642.63
Infused Non-Edible Solid 695.09 $248,719.93
Infused Liquid 8,436.60 $293,818.94
Infused Non-Edible Liquid 881 $18,668.86
January Total 41,623.12 9,317.60 $41,070,503.91
Additional Sales Information
January 1 - January 31
Category Amount
Sales To Date (Jan. 31) $812,149,650.00
Sales Deliveries $1,576,826.50
Average Retail Flower Price (oz.) $252.04
2. Plants
Plants
Active Plants
As of January 31, 2021
Plant State Number
Immature 65,604
Vegetative 69,383
Flowering 92,424
Destroyed & Harvested Plants
January 1 – January 31
Plant State Number
Immature - Destroyed 23,814
Vegetative - Destroyed 10,247
Flowering - Destroyed 1,667
Plants Harvested 30,310

5 | P a g e
3. Packages and Inventory
Packages
As of January 31, 2021
Package State Number
Active 299,271
On Hold 1,352
In Transit 4,172
January 1 – January 31
Package State Number
Finished 30,129
Inventory
As of January 31, 2021
Category Amount (lbs.)
Flower at Growers (Test Passed) 13,158
Flower at Provisioning Centers 27,714
Flower at Processors 16,338
Fresh Frozen Flower at Processors 8,569
Concentrates at Processors 13,201
Infused Solids at Processors 170,532
Infused Liquids at Processors (Fl. Oz.) 551,053
4. Transfers
Products Shipped
January 1 - January 31
License Type Pounds Shipped Fluid Ounces Shipped
Grower Class A 1,094.94 0
Grower Class B 275.64 0
Grower Class C 34,902.95 223.17
Processor 1,094.17 173.47
Provisioning Center 53,156.94 10,530.55
Safety Compliance Facility 0.72 0
Secure Transporter 70,793.46 5,862.80
Transfers
January 1 – January 31
Transfer Type Number
Completed 5,992
Voided 93
6 | P a g e
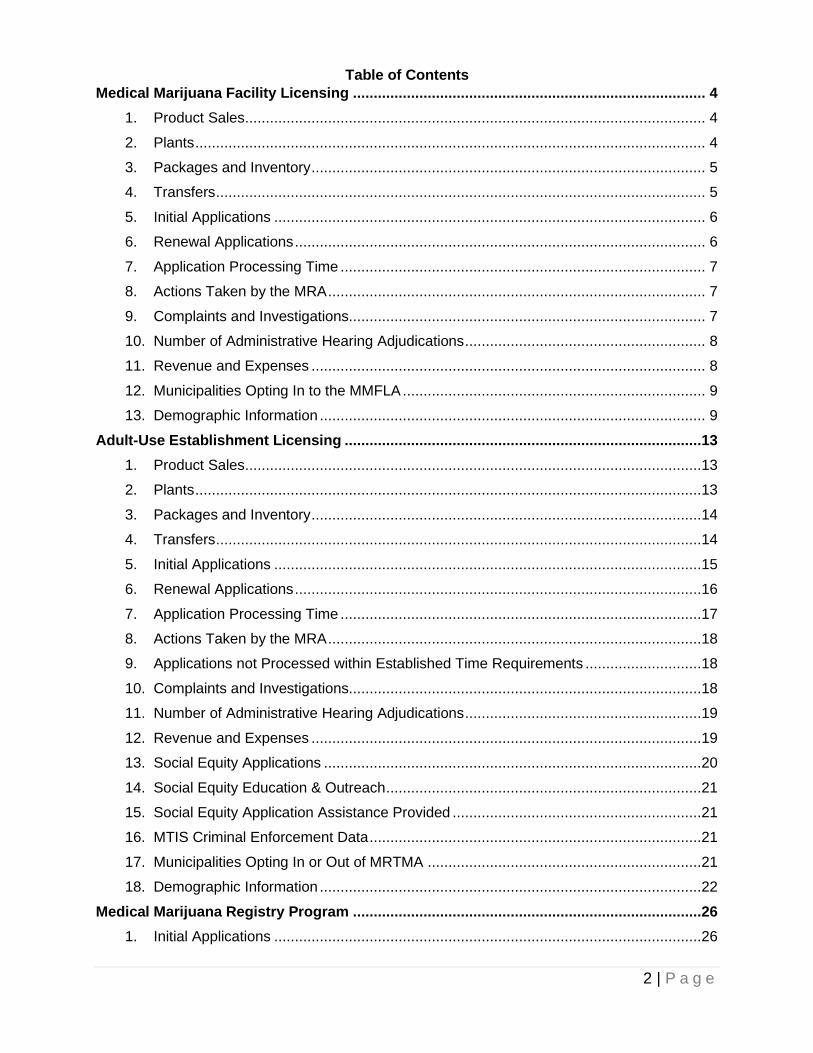
5. Initial Applications
Initial Applications
January 1 - January 31
License Type Received Approved Denied
Prequalification 55 63 1
Grower Class A 2 5 0
Grower Class B 1 0 0
Grower Class C 5 13 0
Processor 4 4 0
Provisioning Center 11 12 0
Safety Compliance Facility 0 1 0
Secure Transporter 0 1 0
Total 78 99 1
6. Renewal Applications
Renewal Applications
January 1 - January 31
License Type Received Approved Denied
Grower Class A 2 5 0
Grower Class B 0 0 0
Grower Class C 7 14 0
Processor 3 3 0
Provisioning Center 22 15 0
Safety Compliance Facility 0 1 0
Secure Transporter 3 0 0
Total 37 38 0

7 | P a g e
7. Application Processing Time
Application Processing Time (Calendar Days)
January 1 - January 31
License Type Initial Applications Renewal Applications
Prequalification 76.2 --
Grower Class A 85.8 60.2
Grower Class B -- --
Grower Class C 80.3 83.5
Processor 99.3 68.7
Provisioning Center 74.9 52.7
Safety Compliance Facility 100 --
Secure Transporter 235 31
January Step 2 Average 86.22 --
January Total Average 79.77 65.7
8. Actions Taken by the MRA
Disciplinary Actions Taken by the MRA
January 1 - January 31
License Type Warning Formal Complaint Final Order
Grower Class A 0 0 0
Grower Class B 0 0 0
Grower Class C 0 0 0
Processor 0 0 0
Provisioning Center 2 1 0
Safety Compliance Facility 0 0 0
Secure Transporter 0 0 0
9. Complaints and Investigations
Complaints and Investigations
January 1 - January 31
Enforcement & Legal Data Amount
Number of Complains Received* 170
Number of Investigations Opened* 145
Number of Investigations Closed* 165
Average Time to Complete an Investigation* (Calendar Days) 89
Number of Enforcement Actions Taken* 16
* Includes both MMFL and AU data

8 | P a g e
10. Number of Administrative Hearing Adjudications
Number of administrative hearing adjudications pertaining to each regulated activity.
Provided are all final orders for denials. Approximate Amounts: 1
Number of administrative hearings pertaining to each regulated activity.
Provided are all the hearings that have been involved with the MRA, e.g.,
denials, lawsuits, etc.
Approximate Amounts:
Denials: 3
Litigation: 0
Circuit Court Appeals: 0
11. Revenue and Expenses
Application Fees
January 1 - January 31
Amount
January $306,000
Regulatory Assessment Fees
January 1 - January 31
Grower Class A
Grower Class B
Grower Class C
Processor Provisioning Center Safety
Compliance Facility
Secure Transporter
Total
January $35,000 $0 $216,963 $75,888 $195,545 $0 $13,125 $536,521
Renewal
January 1 - January 31
Grower Class A
Grower Class B
Grower Class C
Processor Provisioning Center Safety
Compliance Facility
Secure Transporter
Total
January $14,000 $0 $126,000 $42,000 $218,500 $0 $35,000 $435,500
Total Licensing Revenue Collected
January 1 - January 31
Amount
January $1,278,021

9 | P a g e
Expenses January 1 - January 31 Amount
State Employee Wages $363,012.84
State Employee Benefits $234,426.09
Materials and Equipment $2,813.75
All Other Costs $227,548.88
January Total $827,801.56
12. Municipalities Opted In to the MMFLA
Municipalities
As of January 31, 2021
Opted In
154
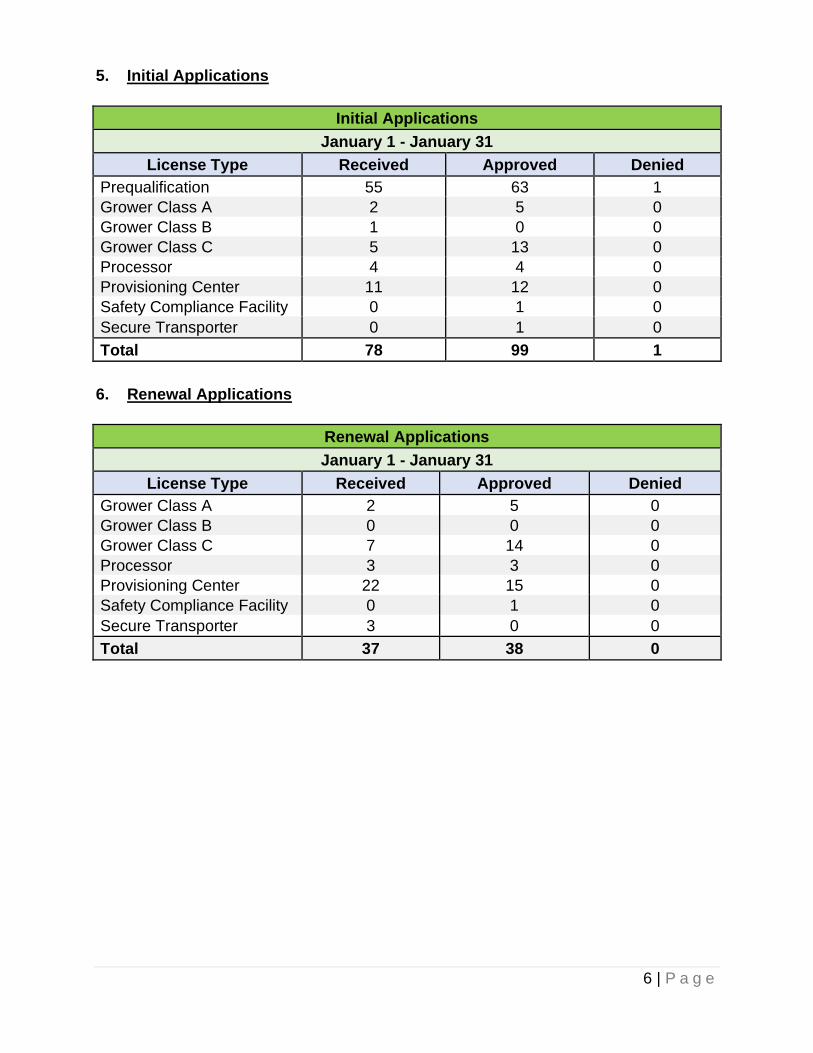
13. Demographic Information
270
6
0
50
100
150
200
250
300
Yes No
Are you willing to complete a demographic survey for medical facility licensees?

10 | P a g e
73
176
8
0
20
40
60
80
100
120
140
160
180
200
Female Male Prefer Not To Answer
What gender do you most identify with?
0
14
64
47
57
69
3
0
10
20
30
40
50
60
70
80
18-20 21-29 30-39 40-49 50-59 60 or older Prefer Not ToAnswer
What is your current age group?

11 | P a g e
42
10 9
181
11
0
20
40
60
80
100
120
140
160
180
200
Not a Resident 1-2 years 3-5 years More than 5 years Prefer Not ToAnswer
How long have you been a resident of Michigan?
1
9
46
22
93
55
23
4
0
10
20
30
40
50
60
70
80
90
100
Less thanhigh school
degree
High schooldegree orequivalent(e.g., GED)
Somecollege, butno degree
Associatedegree
Bachelordegree
Graduatedegree
Higher thanGraduate
degree
Prefer NotTo Answer
What is the highest level of education you have completed?
12 | P a g e
1 1
9
17
29 28 26
15
7
78
41
0
10
20
30
40
50
60
70
80
90
What is your total household income?
198
101 8 5
15 13
0
50
100
150
200
250
How would you best identify yourself?

13 | P a g e
Adult-Use Establishment Licensing 1. Product Sales
Sales by Product Type
January 1 - January 31
Product Type Pounds Sold Fluid Ounces Sold Total Sales
Flower 6,696.27 $34,678,753.18
Shake/Trim 872.1 $2,891,977.84
Concentrate 221.58 $4,904,515.90
Vape Cartridge 445.84 $12,375,260.82
Kief 12.04 $127,500.62
Infused-Edible 52,843.88 $11,741,000.56
Infused Non-Edible Solid 237.62 $218,528.31
Infused Liquid 12,127.37 $420,414.94
Infused Non-Edible Liquid 1664.54 $48,656.71
January Total 61,329.33 13,791.91 $67,406,608.88
Additional Sales Information
January 1 - January 31
Category Amount
Sales To Date (Jan. 31) $583,913,948.00
Sales Deliveries $2,165,064.18
Average Retail Flower Price (oz.) $323.68
2. Plants
Plants
Active Plants
As of January 31, 2021
Plant State Number
Immature 66,764
Vegetative 80,152
Flowering 114,670
Destroyed & Harvested Plants
January 1 - January 31
Plant State Number
Immature - Destroyed 21,273
Vegetative - Destroyed 8,085
Flowering - Destroyed 1,031
Plants Harvested 48,662

14 | P a g e
3. Packages and Inventory
Packages
As of January 31, 2021
Package State Number
Active 226,043
On Hold 46
In Transit 5,341
January 1 - January 31
Package State Number
Finished 38,959
Inventory
As of January 31, 2021
Category Amount (lbs.)
Flower at Growers (Test Passed) 17,334
Flower at Retailers 14,659
Flower at Processors 13,879
Fresh Frozen Flower at Processors 7,537
Concentrates at Processors 5,633
Infused Solids at Processors 143,750
Infused Liquids at Processors (Fl. Oz.) 70,661
4. Transfers
Shipped Products
January 1 - January 31
License Type Shipped Pounds Fluid Ounces Shipped
Class B Marijuana Grower 534.49 0
Class C Marijuana Grower 29,231.47 1,115.85
Excess Grower 2,649.11 0
Processor 56,700.46 13,439.22
Retailer 4,453.11 683.68
Safety Compliance Facility 0.05 0
Secure Transporter 80,008.47 13,725.75
Transfers
January 1 - January 31
Transfer Type Number
Completed 6,107
Voided 71

5. Initial Applications
Initial Applications
January 1 - January 31
Applications Received
Licenses Issued
Licenses Denied
Prequalification 78 40 0
Class A Marijuana Grower 2 0 0
Class B Marijuana Grower 1 2 0
Class C Marijuana Grower 8 11 0
Designated Consumption Establishment 0 0 0
Marijuana Event Organizer 1 1 0
Excess Grower 3 2 0
Microbusiness 0 0 0
Processor 4 5 0
Retailer 15 8 0
Safety Compliance Facility 0 1 0
Secure Transporter 1 0 0
Temporary Marijuana Event 0 0 0
Social Equity Class A Marijuana Grower 0 0 0
Social Equity Class B Marijuana Grower 1 2 0
Social Equity Class C Marijuana Grower 0 1 0
Social Equity Designated Consumption Establishment
0 0 0
Social Equity Marijuana Event Organizer 0 0 0
Social Equity Excess Grower 0 0 0
Social Equity Microbusiness 0 0 0
Social Equity Processor 0 1 0
Social Equity Retailer 1 2 0
Social Equity Safety Compliance Facility 0 0 0
Social Equity Secure Transporter 0 0 0
Social Equity Marijuana Temporary Event 0 0 0
January Total 115 76 0

16 | P a g e
6. Renewal Applications
Renewal Applications
January 1 - January 31
Applications Received Licenses Issued Licenses Denied
Class A Marijuana Grower 0 0 0
Class B Marijuana Grower 2 2 0
Class C Marijuana Grower 9 13 0
Designated Consumption Establishment 0 0 0
Marijuana Event Organizer 0 0 0
Excess Grower 0 0 0
Microbusiness 0 0 0
Processor 2 5 0
Retailer 26 14 0
Safety Compliance Facility 0 0 0
Secure Transporter 3 2 0
Temporary Marijuana Event 0 0 0
January Total 42 36 0

17 | P a g e
7. Application Processing Time
Application Processing Days (Calendar Days)
January 1 - January 31
License Type Initial
Applications Renewal
Applications
Prequalification 45.45 --
Class A Marijuana Grower -- --
Class B Marijuana Grower 26 15
Class C Marijuana Grower 45.64 18.82
Designated Consumption Establishment -- --
Marijuana Event Organizer 6 --
Excess Grower 26 --
Microbusiness -- --
Processor 34.8 19
Retailer 29.63 15.13
Safety Compliance Facility 17 --
Secure Transporter -- 6
Temporary Marijuana Event -- --
Social Equity Class A Marijuana Grower -- --
Social Equity Class B Marijuana Grower 35.5 --
Social Equity Class C Marijuana Grower 35 --
Social Equity Designated Consumption Establishment
-- --
Social Equity Marijuana Event Organizer -- --
Social Equity Excess Grower -- --
Social Equity Microbusiness -- --
Social Equity Processor 51 --
Social Equity Retailer 31 --
Social Equity Safety Compliance Facility -- --
Social Equity Secure Transporter -- --
Social Equity Temporary Marijuana Event -- --
January Step 2 Average 34.97 --
January Total Average 40.55 16.28

18 | P a g e
8. Actions Taken by the MRA
Disciplinary Actions Taken by the MRA
January 1 - January 31
License Type Warning Formal Complaint Final Order
Class A Marijuana Grower 0 0 0
Class B Marijuana Grower 0 0 0
Class C Marijuana Grower 0 0 0
Designated Consumption Establishment 0 0 0
Marijuana Event Organizer 0 0 0
Excess Grower 0 0 0
Microbusiness 0 0 0
Processor 0 0 0
Retailer 1 0 0
Safety Compliance Facility 0 0 0
Secure Transporter 0 0 0
Temporary Marijuana Event 0 0 0
9. Applications not Processed within Established Time Requirements
Applications Not Timely Processed
January 1 - January 31
Initial Renewal
0% 0%
10. Complaints and Investigations
Complaints and Investigations
January 1 - January 31
Enforcement & Legal Data Amount
Number of Complains Received* 170
Number of Investigations Opened* 145
Number of Investigations Closed* 165
Average Time to Complete an Investigation* (Calendar Days) 89
Number of Enforcement Actions Taken* 16
* Includes both MMFL and AU data

19 | P a g e
11. Number of Administrative Hearing Adjudications
Number of administrative hearing adjudications pertaining to each regulated activity.
Provided are all final orders for denials.
Approximate Amounts: 1
Number of administrative hearings pertaining to each regulated activity.
"Regulated activity" means the particular activities, entities, facilities, and
industries regulated by the agencies. Provided are all the hearings that have
been involved with the MRA, e.g., denials, lawsuits, etc.
Approximate Amounts:
Denials: 3
Litigation: 0
Circuit Court Appeals: 0
12. Revenue and Expenses
Application Fees
January 1 - January 31
Prequalification Social Equity
Prequalification Total
January $318,000 $94,200 $400,200
Regulatory Assessment Fees
January 1 - January 31
Class A
Marijuana Grower
Class B Marijuana
Grower
Class C Marijuana
Grower
Designated Consumption Establishment
Marijuana Event
Organizer
Excess Grower
Microbusiness Processor
January $0 $24,000 $457,028 $0 $1,000 $94,246 $0 $234,850
Retailer Safety
Compliance Facility
Secure Transporter
Temporary Marijuana
Event
Social Equity Class A
Marijuana Grower
Social Equity Class B
Marijuana Grower
Social Equity Class C
Marijuana Grower
Social Equity Designated
Consumption Establishment
January $267,124 $25,000 $0 $0 $0 $6,000 $0 $0
Social Equity Marijuana
Event Organizer
Social Equity Excess Grower
Social Equity Microbusiness
Social Equity Processor
Social Equity Retailer
Social Equity Safety
Compliance Facility
Social Equity Secure
Transporter
Social Equity Temporary
Marijuana Event
January $0 $0 $0 $0 $40,942 $0 $0 $0
Total Regulatory Assessment Fees
January $1,150,190
20 | P a g e
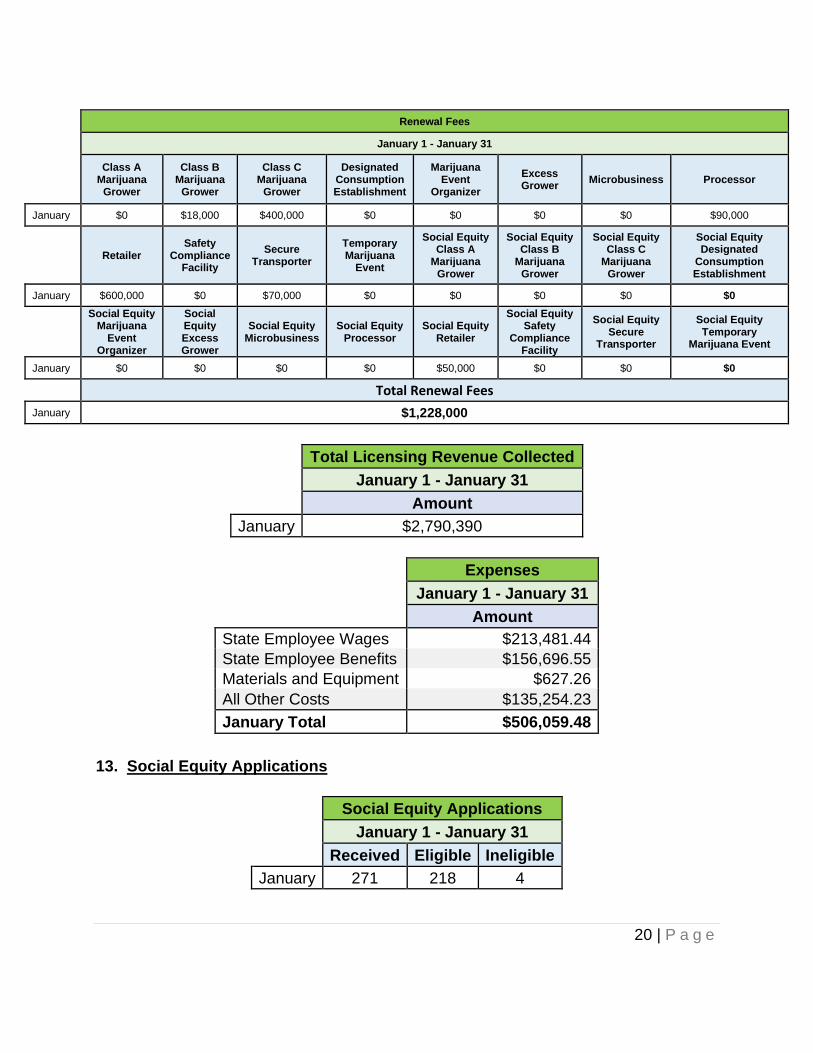
Renewal Fees
January 1 - January 31
Class A
Marijuana Grower
Class B Marijuana
Grower
Class C Marijuana
Grower
Designated Consumption Establishment
Marijuana Event
Organizer
Excess Grower
Microbusiness Processor
January $0 $18,000 $400,000 $0 $0 $0 $0 $90,000
Retailer Safety
Compliance Facility
Secure Transporter
Temporary Marijuana
Event
Social Equity Class A
Marijuana Grower
Social Equity Class B
Marijuana Grower
Social Equity Class C
Marijuana Grower
Social Equity Designated
Consumption Establishment
January $600,000 $0 $70,000 $0 $0 $0 $0 $0
Social Equity Marijuana
Event Organizer
Social Equity Excess Grower
Social Equity Microbusiness
Social Equity Processor
Social Equity Retailer
Social Equity Safety
Compliance Facility
Social Equity Secure
Transporter
Social Equity Temporary
Marijuana Event
January $0 $0 $0 $0 $50,000 $0 $0 $0
Total Renewal Fees
January $1,228,000
Total Licensing Revenue Collected
January 1 - January 31
Amount
January $2,790,390
Expenses
January 1 - January 31 Amount
State Employee Wages $213,481.44
State Employee Benefits $156,696.55
Materials and Equipment $627.26
All Other Costs $135,254.23
January Total $506,059.48
13. Social Equity Applications
Social Equity Applications
January 1 - January 31
Received Eligible Ineligible
January 271 218 4
21 | P a g e
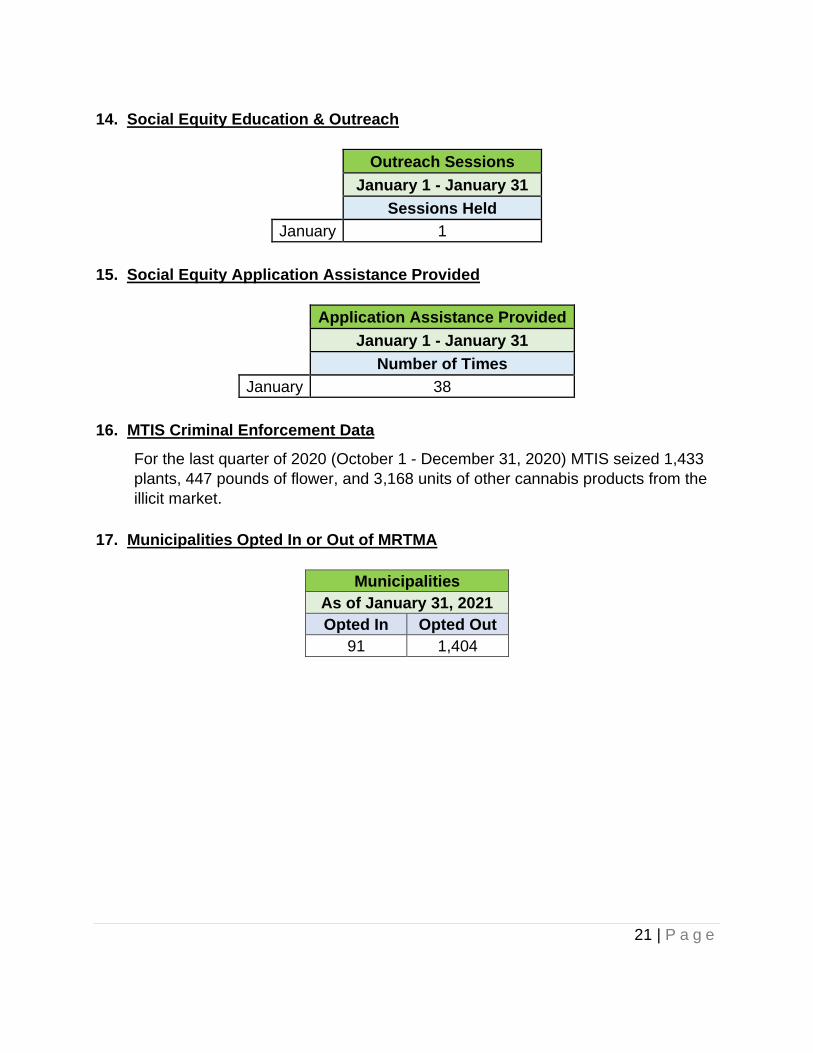
14. Social Equity Education & Outreach
Outreach Sessions
January 1 - January 31
Sessions Held
January 1
15. Social Equity Application Assistance Provided
Application Assistance Provided
January 1 - January 31
Number of Times
January 38
16. MTIS Criminal Enforcement Data
For the last quarter of 2020 (October 1 - December 31, 2020) MTIS seized 1,433
plants, 447 pounds of flower, and 3,168 units of other cannabis products from the
illicit market.
17. Municipalities Opted In or Out of MRTMA
Municipalities
As of January 31, 2021
Opted In Opted Out
91 1,404
22 | P a g e
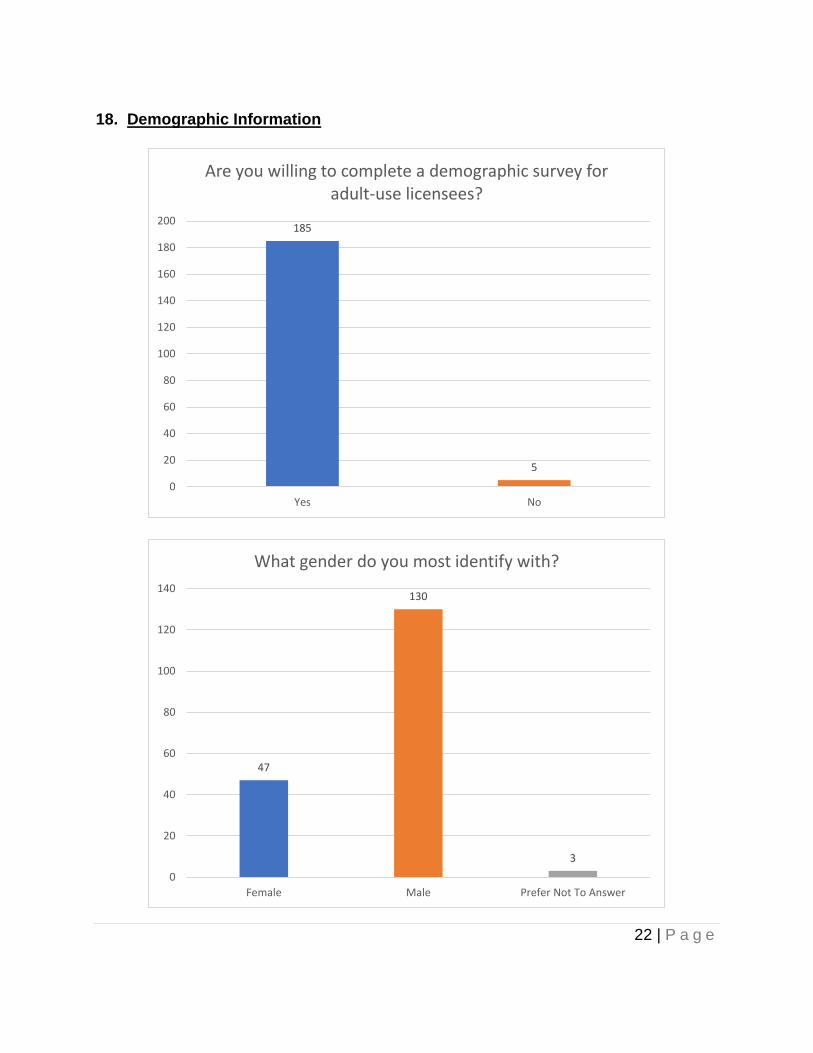
18. Demographic Information
185
5
0
20
40
60
80
100
120
140
160
180
200
Yes No
Are you willing to complete a demographic survey for adult-use licensees?
47
130
3
0
20
40
60
80
100
120
140
Female Male Prefer Not To Answer
What gender do you most identify with?

23 | P a g e
0
11
44
49
34
38
2
0
10
20
30
40
50
60
18-20 21-29 30-39 40-49 50-59 60 or older Prefer Not ToAnswer
What is your current age group?
29
4 5
131
8
0
20
40
60
80
100
120
140
Not a Resident 1-2 years 3-5 years More than 5 years Prefer Not ToAnswer
How long have you been a resident of Michigan?

24 | P a g e
0
10
31
10
72
31
20
2
0
10
20
30
40
50
60
70
80
Less thanhigh school
degree
High schooldegree orequivalent(e.g., GED)
Somecollege, butno degree
Associatedegree
Bachelordegree
Graduatedegree
Higher thanGraduate
degree
Prefer NotTo Answer
What is the highest level of education you have completed?
20
2
10
15 16
8
21
4
64
33
0
10
20
30
40
50
60
70
What is your total household income?
25 | P a g e
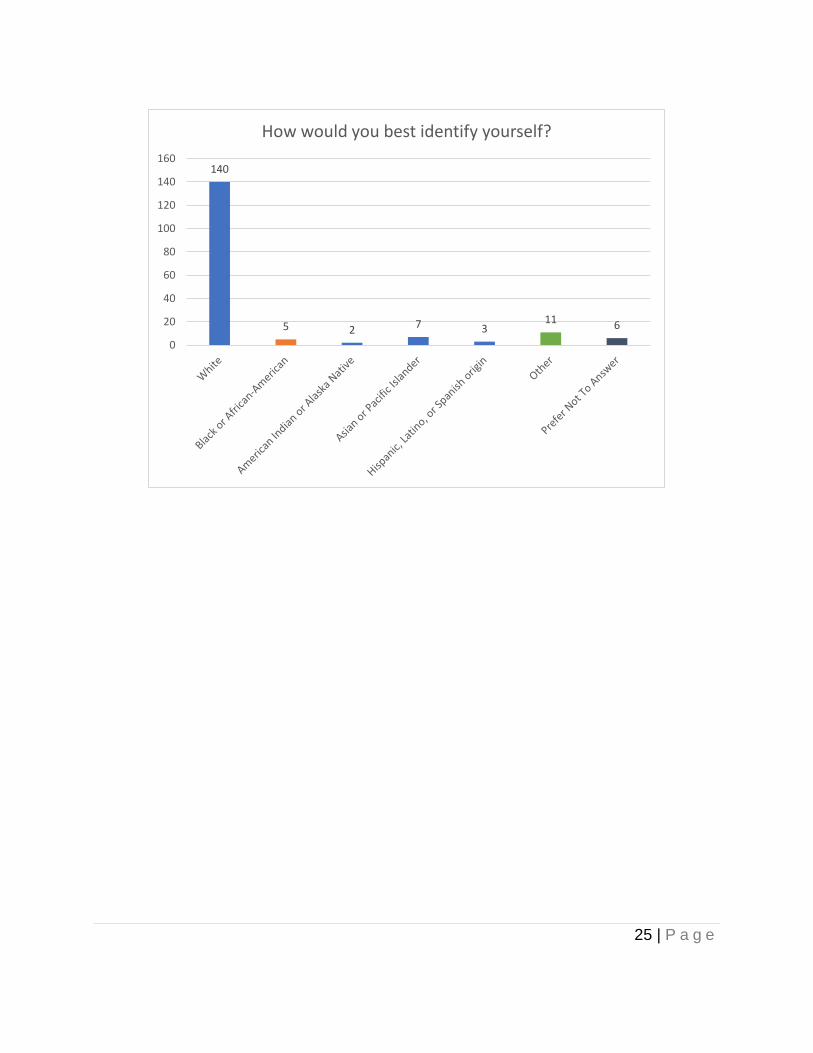
140
5 2 7 311 6
0
20
40
60
80
100
120
140
160
How would you best identify yourself?

26 | P a g e
Medical Marijuana Registry Program 1. Initial Applications
Initial Applications
January 1 - January 31
Received Issued Denied
8,508 10,466 1,218
2. Renewal Applications
Renewal Applications
January 1 - January 31
Received Issued Denied
1,534 1,049 84
3. Application Processing Time
Initial Applications (Calendar Days)
January 1 - January 31
Approvals Denials
Paper Online Combined Paper Online Combined
5.18 0.02 2.38 6.11 0.33 5.48
Renewal Applications (Calendar Days)
January 1 - January 31
Approvals Denials
Paper Online Combined Paper Online Combined
4.29 0.02 1.81 6 0.14 4.54
4. Number of Applications Filed for Registry Identification Cards
Applications Filed for Registry Identification Cards
January 1 - January 31
Original Applications Renewals Grand Total
Paper Online Total Paper Online Total
January 6,717 5,106 11,823 929 910 1,839 13,662

27 | P a g e
5. Number of Qualifying Patients and Primary Caregivers Approved in Each County
As of January 31, 2021
County Patients Caregivers County Patients Caregivers
Alcona 616 76 Lake 253 52 Alger 599 107 Lapeer 3,498 485 Allegan 5,061 714 Leelanau 661 67 Alpena 682 81 Lenawee 3,192 464 Antrim 1,196 189 Livingston 3,775 439 Arenac 1,120 136 Luce 74 17 Baraga 124 16 Mackinac 185 31 Barry 2,143 288 Macomb 28,864 4,258 Bay 5,191 375 Manistee 395 65 Benzie 1,017 134 Marquette 262 99 Berrien 3,833 637 Mason 427 60 Branch 1,757 301 Mecosta 207 44 Calhoun 2,583 403 Menominee 373 94 Cass 1,573 297 Midland 2,090 227 Charlevoix 331 47 Missaukee 181 33 Cheboygan 651 83 Monroe 4,288 503 Chippewa 469 82 Montcalm 1,675 309 Clare 1,476 250 Montmorency 105 39 Clinton 3,184 375 Muskegon 2,781 366 Crawford 989 123 Newaygo 1,588 242 Delta 673 129 Oakland 36,461 3,985 Dickinson 541 117 Oceana 1,247 206 Eaton 3,265 453 Ogemaw 440 48 Emmet 157 42 Ontonagon 115 21 Genesee 9,594 1,383 Osceola 371 84 Gladwin 47 25 Oscoda 175 19 Gogebic 328 76 Otsego 99 33 Grand Traverse 1,071 142 Ottawa 3,018 343 Gratiot 231 52 Out of State 0 9 Hillsdale 1,118 226 Presque Isle 120 28 Houghton 247 44 Roscommon 474 72 Huron 493 39 Saginaw 3,673 420 Ingham 2,403 462 Saint Clair 5,039 547 Ionia 246 57 Saint Joseph 689 136 Iosco 230 31 Sanilac 788 119 Iron 172 38 Schoolcraft 34 19 Isabella 428 69 Shiawassee 2,593 334 Jackson 3,989 559 Tuscola 3,432 534 Kalamazoo 3,302 443 Van Buren 1,732 303 Kalkaska 304 52 Washtenaw 12,259 1,124 Kent 8,024 828 Wayne 45,883 4,054 Keweenaw 148 26 Wexford 1,146 214
Total 245,268 30,553

28 | P a g e
6. Registry Identification Cards Revoked
Registry Identification Cards Revoked
Month Revoked
January 0
7. Nature of the Debilitating Medical Conditions of the Qualifying Patients.
As of January 31, 2021
Condition Percent of Total
Agitation of Alzheimer's Disease 0.03
AIDS 0.01
Amyotrophic Lateral Sclerosis 0.04
Arthritis 19.86
Autism 0.21
Cachexia or Wasting Syndrome 0.37
Cancer 3.69
Cerebral Palsy 0.09
Chronic Pain 59.93
Colitis 0.34
Crohn's Disease 0.77
Glaucoma 1.01
Hepatitis C 0.40
HIV Positive 0.23
Inflammatory Bowel Disease 1.17
Muscle Spasms 8.39
Nail Patella 0.01
Obsessive Compulsive Disorder 1.38
Parkinson’s Disease 0.16
Post-Traumatic Stress Disorder 6.18
Rheumatoid Arthritis 1.50
Seizures 1.57
Severe and Chronic Pain 44.81
Severe Nausea 6.79
Spinal Cord Injury 0.45
Tourette’s Syndrome 0.08
Ulcerative Colitis 0.40
29 | P a g e
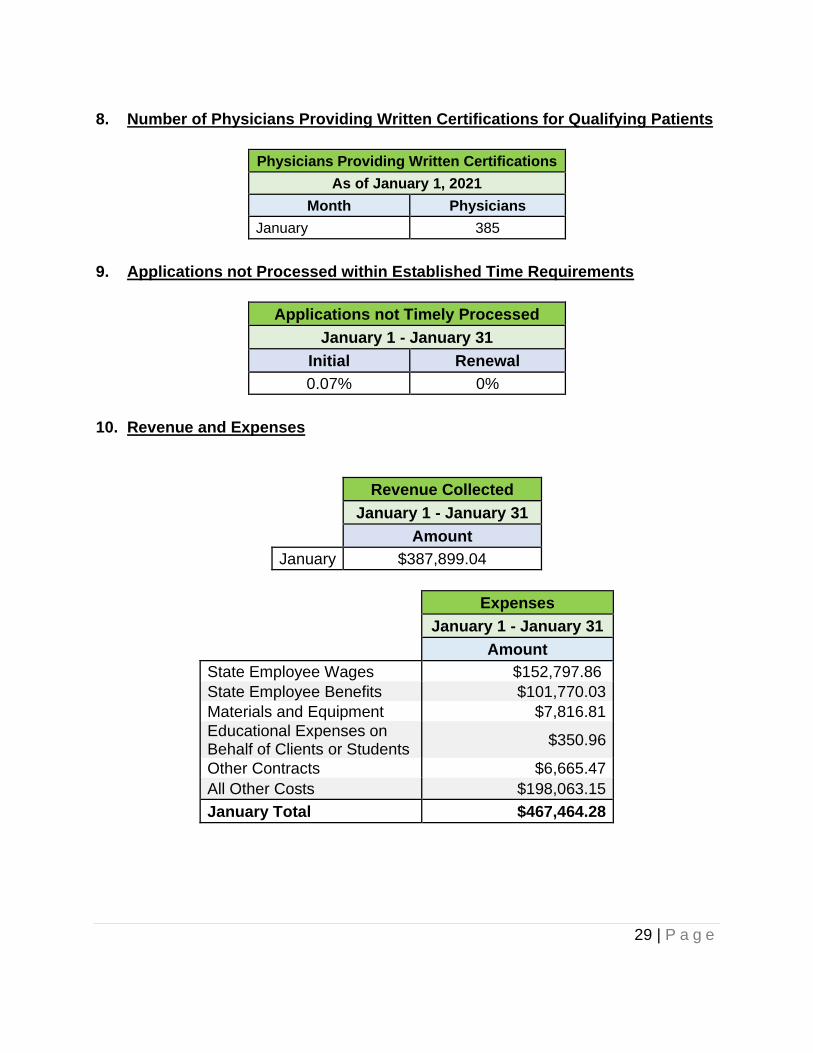
8. Number of Physicians Providing Written Certifications for Qualifying Patients
Physicians Providing Written Certifications
As of January 1, 2021
Month Physicians
January 385
9. Applications not Processed within Established Time Requirements
Applications not Timely Processed
January 1 - January 31
Initial Renewal
0.07% 0%
10. Revenue and Expenses
Revenue Collected
January 1 - January 31
Amount
January $387,899.04
Expenses
January 1 - January 31
Amount
State Employee Wages $152,797.86
State Employee Benefits $101,770.03
Materials and Equipment $7,816.81
Educational Expenses on Behalf of Clients or Students
$350.96
Other Contracts $6,665.47
All Other Costs $198,063.15
January Total $467,464.28