monthly financial - report
TRANSCRIPT

Report to the City Council Prepared by the City Treasurer
September 21, 2021
Monthly Financial ReportFiscal Year to Date as
of July, 31 2021

General Fund
$ in millions / rounding differences may occur
Sources
Twelve Months: Fiscal Year
FY 2019/20 Actuals
FY 2020/21 Actuals
FY 2021/22 Revised
Budget Taxes - Local $152.8 n/a $157.6Property Tax 32.2 n/a 34.8State Shared Revenues 70.2 n/a 75.9Charges for Service/Other 14.7 n/a 14.4License Permits & Fees 6.9 n/a 8.2Fines Fees & Forfeitures 7.3 n/a 6.9Interest Earnings 4.7 n/a 1.9Building Permit Fees & Charges 18.5 n/a 17.2Other Revenue - n/a -Indirect/Direct Cost Allocations 7.2 n/a 7.2Transfers In 11.3 n/a 11.4Total Sources $326.0 n/a $335.5
Note: FY 2020/21 twelve month actuals are not available at this time. Once completed, they will be included within the report.
July 2021 Page 2 of 19
General Fund
$ in millions / rounding differences may occur
FY 2019/20 Actuals
FY 2020/21 Actuals
FY 2021/22 Actuals
FY 2021/22 Revised
Budget
Actual vs. BudgetFavorable / (Unfavorable)
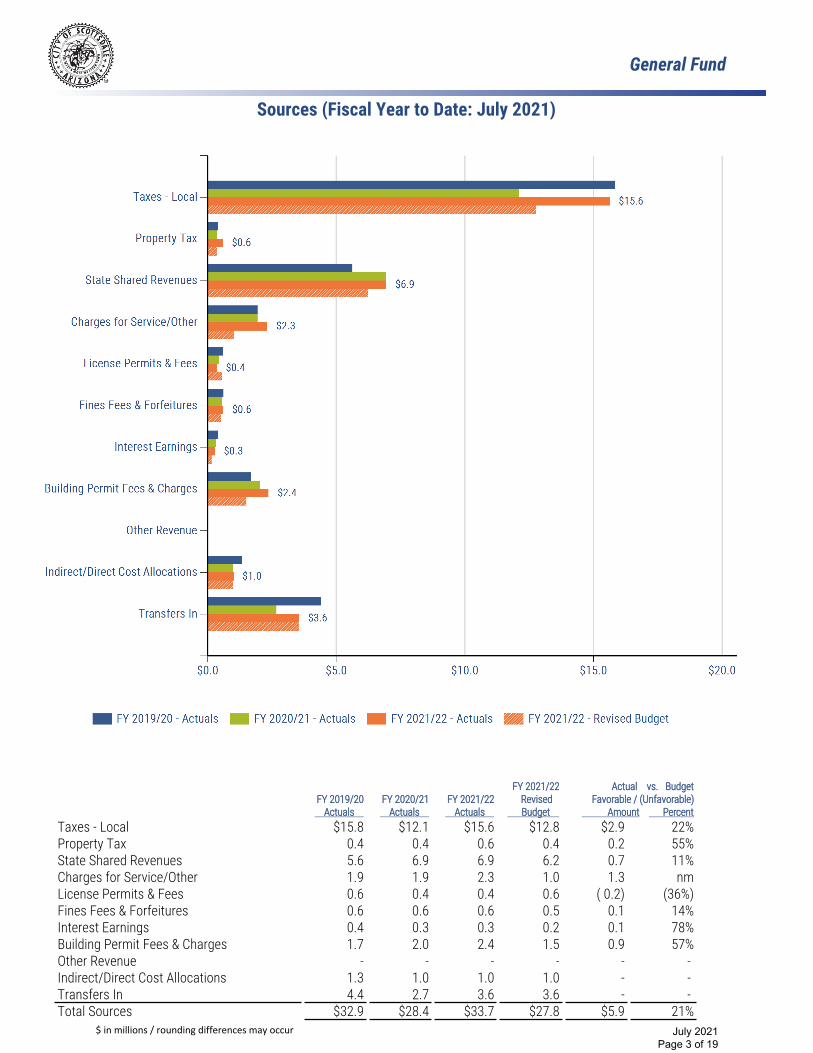
Amount PercentTaxes - Local $15.8 $12.1 $15.6 $12.8 $2.9 22%Property Tax 0.4 0.4 0.6 0.4 0.2 55%State Shared Revenues 5.6 6.9 6.9 6.2 0.7 11%Charges for Service/Other 1.9 1.9 2.3 1.0 1.3 nmLicense Permits & Fees 0.6 0.4 0.4 0.6 ( 0.2) (36%)Fines Fees & Forfeitures 0.6 0.6 0.6 0.5 0.1 14%Interest Earnings 0.4 0.3 0.3 0.2 0.1 78%Building Permit Fees & Charges 1.7 2.0 2.4 1.5 0.9 57%Other Revenue - - - - - - Indirect/Direct Cost Allocations 1.3 1.0 1.0 1.0 - - Transfers In 4.4 2.7 3.6 3.6 - - Total Sources $32.9 $28.4 $33.7 $27.8 $5.9 21%
Sources (Fiscal Year to Date: July 2021)
July 2021 Page 3 of 19

General Fund
$ in millions / rounding differences may occur
Taxes - Local (Fiscal Year to Date: July 2021)
Actual to Revised Budget variance of $2.9 million or 22%: The favorable variance is primarily due to Sales Tax. See detailed Sales Tax information on page 5. Electric & Gas Franchise is favorable due to the APS quarterly franchise payment reflecting a decrease in adjustments from the federal Tax Cuts and Jobs Act of 2017. Salt River Project In Lieu is favorable due to the timing of the final payment from FY 2020/21 which was received in FY 2021/22. The revenue will be adjusted for August to properly record in FY 2020/21.
FY 2019/20 Actuals
FY 2020/21 Actuals
FY 2021/22 Actuals
FY 2021/22 Revised
Budget
Actual vs. BudgetFavorable / (Unfavorable)
Amount PercentSales Tax $12.6 $9.2 $12.4 $10.1 $2.3 23%Sales Tax - Public Safety (0.10%) 1.2 0.9 1.2 1.0 0.2 22%Electric & Gas Franchise 1.6 1.6 1.8 1.6 0.2 11%Cable TV License Fee - - - - - - Salt River Project In Lieu - - 0.1 - 0.1 -Stormwater Fee 0.1 0.1 0.1 0.1 - - Stormwater Fee - CIP 0.3 0.3 - - - - Taxes - Local Total $15.8 $12.1 $15.6 $12.8 $2.9 22%
July 2021 Page 4 of 19

General Fund
$ in millions / rounding differences may occur
Sales Tax (Fiscal Year to Date: July 2021)
Actual to Revised Budget variance of $2.3 million or 23%: The favorable variance is the result of the following: 1) Dining/Entertainment – restaurants doing better than anticipated; 2) Hotel/Motel – hotels doing better than anticipated, an increase in bookings with short term vacation rental properties and a new hotel opening; 3) Major Dept Stores – stores performing better than anticipated; 4) Misc Retail Stores – some stores performing better than expected; 5) Other Activity – increase in taxable sales from computer software and hardware wholesalers and manufacturers sellers; and 6) Rental – a one-time taxable speculative sale of apartment complex. The favorable variance would have been greater but is being partially offset by: Automotive due to timing issues of when some taxpayers filed last year versus this year.
FY 2019/20 Actuals
FY 2020/21 Actuals
FY 2021/22 Actuals
FY 2021/22 Revised
Budget
Actual vs. BudgetFavorable / (Unfavorable)
Amount PercentAutomotive $2.0 $1.7 $1.6 $2.0 ($0.5) (24%)Construction 1.0 0.9 1.0 0.9 0.1 8%Dining/Entertnmnt 1.1 0.6 1.1 0.5 0.6 nmFood Stores 0.8 0.7 0.7 0.8 ( 0.1) (8%)Hotel/Motel 0.5 0.2 0.4 0.3 0.1 18%Major Dept Stores 1.1 0.6 1.0 0.8 0.2 19%Misc Retail Stores 2.6 2.0 2.5 2.1 0.4 21%Other Activity 1.3 0.9 1.5 0.9 0.6 65%Rental 1.7 1.2 2.2 1.3 1.0 75%Utilities 0.5 0.4 0.4 0.4 - - Sales Tax Total $12.6 $9.2 $12.4 $10.1 $2.3 23%
July 2021 Page 5 of 19

General Fund
$ in millions / rounding differences may occur
Property Tax (Fiscal Year to Date: July 2021)
Actual to Revised Budget variance of $0.2 million or 55%: Favorable due to the budget spread, which is based on the way people paid on average over the last two years and may vary year over year.
FY 2019/20 Actuals
FY 2020/21 Actuals
FY 2021/22 Actuals
FY 2021/22 Revised
Budget
Actual vs. BudgetFavorable / (Unfavorable)
Amount PercentProperty Tax $0.4 $0.4 $0.6 $0.4 $0.2 55%Property Tax Total $0.4 $0.4 $0.6 $0.4 $0.2 55%
State Shared Revenues (Fiscal Year to Date: July 2021)
Actual to Revised Budget variance of $0.7 million or 11%: State Shared Sales Tax is favorable due to better-than-expected state shared sales tax revenue brought in and shared with cities than originally projected. This is due primarily to greater than expected consumer spending as a result of more people venturing out of their houses due to the lifting of mask mandates and to satisfy a pent-up demand for goods and services. Is it also due to the continued effects of the 2019 Wayfair Bill on online sales and there being no real reduction in the rate of online shopping which increased substantially during the pandemic.
FY 2019/20 Actuals
FY 2020/21 Actuals
FY 2021/22 Actuals
FY 2021/22 Revised
Budget
Actual vs. BudgetFavorable / (Unfavorable)
Amount Percent$1.8 $2.8 $3.1 $2.4 $0.7 29% 2.8 3.1 2.8 2.8 - -
State Shared Sales TaxState Shared Income TaxAuto Lieu Tax 1.1 1.1 1.0 1.0 - - State Shared Revenues Total $5.6 $6.9 $6.9 $6.2 $0.7 11%
July 2021 Page 6 of 19

General Fund
$ in millions / rounding differences may occur
Charges for Service/Other (Fiscal Year to Date: July 2021)
Actual to Revised Budget variance of $1.3 million or nm: Westworld Equestrian Facility Fees is favorable due to the timing of receipts of payments for rentals of WestWorld facilities in FY 2021/22 and payments for events held in FY 2020/21 being received in FY 2021/22. Intergovernmental is favorable due to invoice timing of the School Resource Officer quarterly payments. The favorable variance would have been greater but is being partially offset by the quarterly payment for Regional Wireless Cooperative being received in FY 2020/21 for the FY 2021/22 July-September payment of the maintenance of the Scottsdale Radio Sites. Miscellaneous is favorable due to receiving the final reimbursement in FY 2021/22 for emergency rent and utility assistance for Vista del Camino from Maricopa County which occurred in FY 2020/21, and reimbursements for Public Safety – Fire for training provided to Maricopa County and a Scottsdale firefighter deployed on a state fire. Property Rental is favorable due to advance payments of Cell Phone Tower Leases, Outdoor Dining Leases,a nd Land and Building Rents including the Tournament Players Club (TPC) Sportsbook lease payment.
FY 2019/20 Actuals
FY 2020/21 Actuals
FY 2021/22 Actuals
FY 2021/22 Revised
Budget
Actual vs. BudgetFavorable / (Unfavorable)
Amount PercentWestworld Equestrian Facility Fees $0.5 $0.6 $0.8 $0.2 $0.5 nmIntergovernmental 0.7 0.5 0.5 0.3 0.2 88%Miscellaneous 0.1 0.1 0.3 0.1 0.2 nmProperty Rental 0.7 0.7 0.8 0.5 0.3 69%Contributions & Donations - - - - - - Charges for Service/Other Total $1.9 $1.9 $2.3 $1.0 $1.3 nm
July 2021 Page 7 of 19

General Fund
$ in millions / rounding differences may occur
License Permits & Fees (Fiscal Year to Date: July 2021)
Actual to Revised Budget variance of ($0.2) million or (36%): Business & Liquor Licenses is unfavorable due to the annual process of writing off uncollectable license debt which occurred in July and, per Governmental Accounting Standards, is recorded as a negative revenue. Recreation Fees is unfavorable due to lower than anticipated revenue for summer session recreation fees. This is due to reduced program offerings as a result of school renovations and restricted uses, the challenge in hiring staff and overall lower registration levels.
FY 2019/20 Actuals
FY 2020/21 Actuals
FY 2021/22 Actuals
FY 2021/22 Revised
Budget
Actual vs. BudgetFavorable / (Unfavorable)
Amount PercentBusiness & Liquor Licenses $0.1 $0.1 ($0.1) $0.1 ($0.2) nmFire Charges For Services 0.1 0.1 0.2 0.1 - - Recreation Fees 0.4 0.2 0.3 0.4 ( 0.1) (24%)License Permits & Fees Total $0.6 $0.4 $0.4 $0.6 ($0.2) (36%)
Fines Fees & Forfeitures (Fiscal Year to Date: July 2021)
Actual to Revised Budget variance of $0.1 million or 14%: Court Fines is favorable due to to a higher number of criminal court filings than expected, though civil filings are still down.
FY 2019/20 Actuals
FY 2020/21 Actuals
FY 2021/22 Actuals
FY 2021/22 Revised
Budget
Actual vs. BudgetFavorable / (Unfavorable)
Amount PercentCourt Fines $0.4 $0.3 $0.4 $0.3 $0.1 18%Library - - - - - - Parking Fines - - - - - - Photo Radar 0.2 0.2 0.2 0.2 - - Jail Dormitory - - - - - - Fines Fees & Forfeitures Total $0.6 $0.6 $0.6 $0.5 $0.1 14%
July 2021 Page 8 of 19
General Fund
$ in millions / rounding differences may occur
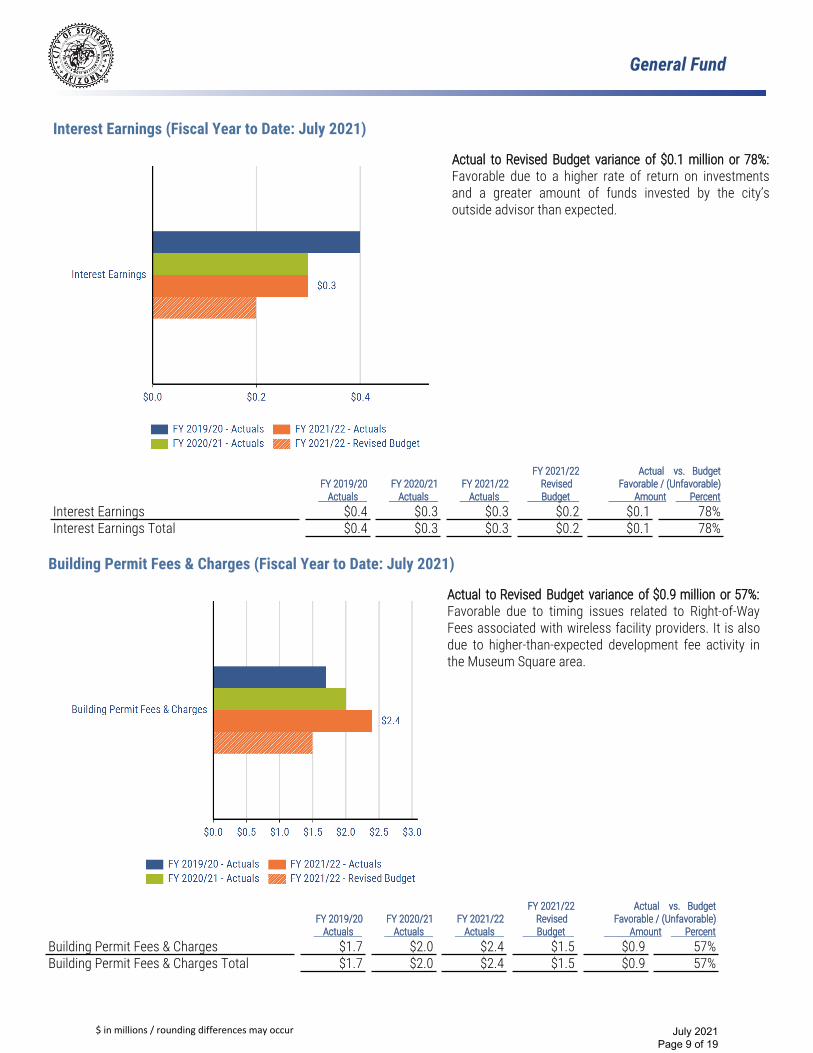
Interest Earnings (Fiscal Year to Date: July 2021)
Actual to Revised Budget variance of $0.1 million or 78%: Favorable due to a higher rate of return on investments and a greater amount of funds invested by the city’s outside advisor than expected.
FY 2019/20 Actuals
FY 2020/21 Actuals
FY 2021/22 Actuals
FY 2021/22 Revised
Budget
Actual vs. BudgetFavorable / (Unfavorable)
Amount PercentInterest Earnings $0.4 $0.3 $0.3 $0.2 $0.1 78%Interest Earnings Total $0.4 $0.3 $0.3 $0.2 $0.1 78%
Building Permit Fees & Charges (Fiscal Year to Date: July 2021)
Actual to Revised Budget variance of $0.9 million or 57%: Favorable due to timing issues related to Right-of-Way Fees associated with wireless facility providers. It is also due to higher-than-expected development fee activity in the Museum Square area.
FY 2019/20 Actuals
FY 2020/21 Actuals
FY 2021/22 Actuals
FY 2021/22 Revised
Budget
Actual vs. BudgetFavorable / (Unfavorable)
Amount PercentBuilding Permit Fees & Charges $1.7 $2.0 $2.4 $1.5 $0.9 57%Building Permit Fees & Charges Total $1.7 $2.0 $2.4 $1.5 $0.9 57%
July 2021 Page 9 of 19

General Fund
$ in millions / rounding differences may occur
Other Revenue (Fiscal Year to Date: July 2021)
Actual to Revised Budget variance of $0.0 million or 0%: No explanation necessary.
FY 2019/20 Actuals
FY 2020/21 Actuals
FY 2021/22 Actuals
FY 2021/22 Revised
Budget
Actual vs. BudgetFavorable / (Unfavorable)
Amount PercentMiscellaneous $ - $ - $ - $ - $ - - Other Revenue Total $0.0 $0.0 $0.0 $0.0 $ - -
Indirect/Direct Cost Allocations (Fiscal Year to Date: July 2021)
Actual to Revised Budget variance of $0.0 million or 0%:No explanation necessary.
FY 2019/20 Actuals
FY 2020/21 Actuals
FY 2021/22 Actuals
FY 2021/22 Revised
Budget
Actual vs. BudgetFavorable / (Unfavorable)
Amount Percent$0.6 $0.5 $0.6 $0.6 $ - - Indirect Costs
Direct Cost Allocation (Fire) 0.8 0.4 0.4 0.4 - - Indirect/Direct Cost Allocations Total $1.3 $1.0 $1.0 $1.0 $ - -
July 2021 Page 10 of 19

General Fund
$ in millions / rounding differences may occur
Transfers In (Fiscal Year to Date: July 2021)
Actual to Revised Budget variance of $0.0 million or 0%: No explanation necessary.
FY 2019/20 Actuals
FY 2020/21 Actuals
FY 2021/22 Actuals
FY 2021/22 Revised
Budget
Actual vs. BudgetFavorable / (Unfavorable)
Amount PercentSpecial Revenue Funds $5.1 $1.9 $2.7 $2.7 $ - - Debt Service - - - - - - CIP - - - - - - Enterprise Franchise Fees ( 0.7) 0.8 0.9 0.8 - - Transfers In Total $4.4 $2.7 $3.6 $3.6 $ - -
July 2021 Page 11 of 19

General Fund
$ in millions / rounding differences may occur
Uses
*Includes budgeted vacancy savings net of Leave Accrual Payouts, Utilities, Fleet Replacement, Fleet Maintenance and Fuelcosts.
Twelve Months: Fiscal Year
Note: FY 2020/21 twelve month actuals are not available at this time. Once completed, they will be included within the report.
FY 2019/20 Actuals
FY 2020/21 Actuals
FY 2021/22 Revised
Budget Personnel Services $191.8 n/a $268.6Contractual Services 59.6 n/a 67.4Commodities 8.1 n/a 8.9Capital Outlays 1.5 n/a 1.4Contracts Payable & COPs 2.9 n/a 0.4Transfers Out 29.4 n/a 31.0Total Uses $293.2 n/a $377.6
July 2021 Page 12 of 19

General Fund
$ in millions / rounding differences may occur
FY 2019/20 Actuals
FY 2020/21 Actuals
FY 2021/22 Actuals
FY 2021/22 Revised
Budget
Actual vs. BudgetFavorable / (Unfavorable)
Amount PercentPersonnel Services $17.6 $11.6 $17.2 $17.9 $0.7 4%Contractual Services 7.0 7.8 7.8 8.6 0.8 9%Commodities 0.2 0.3 0.2 0.3 0.1 38%Capital Outlays - 0.3 - - - - Contracts Payable & COPs - - - - - - Transfers Out 0.3 - - - - - Total Uses $25.1 $20.0 $25.3 $26.9 $1.6 6%
Uses (Fiscal Year to Date: July 2021)
July 2021 Page 13 of 19

General Fund
$ in millions / rounding differences may occur
Personnel Services (Fiscal Year to Date: July 2021)
Actual to Revised Budget variance of $0.7 million or 4%: Salaries is favorable due to rank promotions with replacement employees coming in at a lower rate than the person who was promoted and fewer part-time hours due to challenges in recruiting based on the competitive job market. Overtime is unfavorable due to 21 firefighters out of work due to workers comp, off duty injury, FMLA and a resignation. There are also 15 recruits in the academy who are unable to fill normal shifts and thus for which other staff must cover.
FY 2019/20 Actuals
FY 2020/21 Actuals
FY 2021/22 Actuals
FY 2021/22 Revised
Budget
Actual vs. BudgetFavorable / (Unfavorable)
Amount PercentSalaries $11.4 $7.0 $11.0 $11.6 $0.6 5%Overtime 0.7 0.9 0.9 0.8 ( 0.1) (9%)Health/Dental 1.6 0.5 1.7 1.7 0.1 3%Fringe Benefits 0.8 0.7 0.8 0.8 - - Retirement 3.0 2.5 2.8 2.9 0.1 4%Contract Workers - - - - - - Personnel Services Total $17.6 $11.6 $17.2 $17.9 $0.7 4%
Personnel Services Macro Adjustments FY 2021/22Adopted
Budget
FY 2021/22Year-To-Date
Saved/(Used) RemainingCitywide Pay Program $3.7 ($3.0) $0.7Vacancy Savings ( 6.4) 0.6 ( 5.7)Medical Leave Payouts 1.3 - 1.3Vacation Leave Payouts 0.9 - 0.8Compensation Other 7.0 ( 4.4) 2.6Personnel Services Macro Adjustments Total $6.5 ($6.9) ($0.4)
Total Saved/(Used) YTD of ($6.9)million: Expenses in Citywide Pay Program and Compensation Other were used to support employees whose salaries may have fallen below market comparisons and to provide merit based pay increases to employees meeting or exceeding performance expectations. In addition, the city has achieved $0.6 million in vacancy savings year-to-date.
July 2021 Page 14 of 19

General Fund
$ in millions / rounding differences may occur
Contractual Services (Fiscal Year to Date: July 2021)
Actual to Revised Budget variance of $0.8 million or 9%: Professional Services is unfavorable due to the timing of the Cultural Council Contract August invoice payment which was paid in July. Communications is favorable primarily due to the timing of the Regional Wireless Cooperative (RWC) invoice, which manages the radio communication network. Maintenance and Repair is favorable due to the timing of software invoices. Rents is favorable due to the timing of machinery and equipment rental costs associated with the Bell Road Sports Complex project. Miscellaneous Services and Charges is favorable due to the timing of the payments of the Phoenix Dispatch Fire Service Contract and the Arizona State Land lease.
FY 2019/20 Actuals
FY 2020/21 Actuals
FY 2021/22 Actuals
FY 2021/22 Revised
Budget
Actual vs. BudgetFavorable / (Unfavorable)
Amount PercentProfessional Services $1.1 $1.9 $2.0 $1.4 ($0.6) (43%)Communications 1.7 1.5 1.3 1.6 0.3 17%Travel Training and Conferences - - - - - - Printing Duplication and Filming 0.4 0.4 0.5 0.5 - - Maintenance and Repair 1.5 1.8 1.8 2.2 0.3 16%Insurance 0.7 0.7 0.7 0.7 - - Rents 0.2 0.2 0.1 0.3 0.2 62%Transportation Services 0.8 0.5 0.7 0.7 - - Utilities 0.4 0.4 0.3 0.3 - - Miscellaneous Services and Charges 0.3 0.5 0.3 0.8 0.5 62%Fleet Replacement - - - - - -
$7.0 $7.8 $7.8 $8.6 $0.8 9%
FY 2021/22Adopted
Budget
FY 2021/22Year-To-Date
Used Remaining 4.9 ( 0.4) 4.6
$13.5 ($0.7)
Total Saved/(Used) YTD of ($0.7) million: Through July, Fuel and Maint and Repair and Utilities are tracking as expected.
July 2021 Page 15 of 19
Contractual Services Macro Adjustments Total
Fuel and Maint and Repair Utilities 8.6 ( 0.3) 8.2
Contractual Services Total
Contractual Services Macro Adjustments
$12.8

General Fund
$ in millions / rounding differences may occur
Commodities (Fiscal Year to Date: July 2021)
Actual to Revised Budget variance of $0.1 million or 38%: Operating Supplies is favorable primarily due to delays in purchases in the Community Services Dvision based on current inventory levels.
FY 2019/20 Actuals
FY 2020/21 Actuals
FY 2021/22 Actuals
FY 2021/22 Revised
Budget
Actual vs. BudgetFavorable / (Unfavorable)
Amount PercentOperating Supplies $0.1 $0.2 $0.1 $0.2 $0.1 37%Purchased for Resale - - - - - - Library Materials 0.1 - - - - - Maintenance and Repair Supplies - 0.1 0.1 0.1 - - Other - - - - - - Commodities Total $0.2 $0.3 $0.2 $0.3 $0.1 38%
Capital Outlays (Fiscal Year to Date: July 2021)
Actual to Revised Budget variance of $0.0 million or 0%:No explanation necessary.
FY 2019/20 Actuals
FY 2020/21 Actuals
FY 2021/22 Actuals
FY 2021/22 Revised
Budget
Actual vs. BudgetFavorable / (Unfavorable)
Amount Percent$ - $ - $ - $ - $ - -
- - - - Buildings and ImprovementsMachinery and EquipmentOther
- 0.3- - - - - -
Capital Outlays Total $0.0 $0.3 $0.0 $0.0 $ - -
July 2021 Page 16 of 19
General Fund
$ in millions / rounding differences may occur
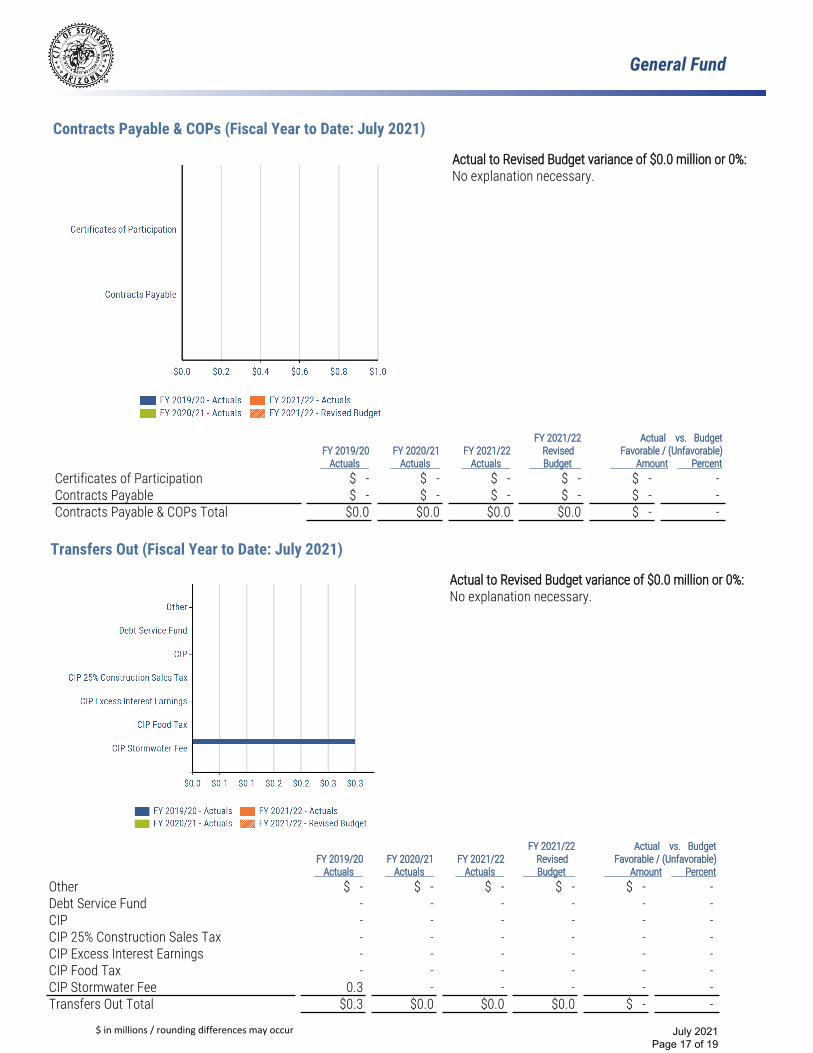
Contracts Payable & COPs (Fiscal Year to Date: July 2021)
Actual to Revised Budget variance of $0.0 million or 0%: No explanation necessary.
FY 2019/20 Actuals
FY 2020/21 Actuals
FY 2021/22 Actuals
FY 2021/22 Revised
Budget
Actual vs. BudgetFavorable / (Unfavorable)
Amount PercentCertificates of Participation $ - $ - $ - $ - $ - - Contracts Payable $ - $ - $ - $ - $ - - Contracts Payable & COPs Total $0.0 $0.0 $0.0 $0.0 $ - -
Transfers Out (Fiscal Year to Date: July 2021)
Actual to Revised Budget variance of $0.0 million or 0%: No explanation necessary.
FY 2019/20 Actuals
FY 2020/21 Actuals
FY 2021/22 Actuals
FY 2021/22 Revised
Budget
Actual vs. BudgetFavorable / (Unfavorable)
Amount Percent$ - $ - $ - $ - $ - -
- - - - - - - - - - - - - - - - - - - - - - - - - - - - - -
OtherDebt Service FundCIPCIP 25% Construction Sales TaxCIP Excess Interest EarningsCIP Food TaxCIP Stormwater Fee 0.3 - - - - - Transfers Out Total $0.3 $0.0 $0.0 $0.0 $ - -
July 2021 Page 17 of 19

General Fund
$ in millions / rounding differences may occur
FY 2019/20 Actuals
FY 2020/21 Actuals
FY 2021/22 Actuals
FY 2021/22 Revised
Budget
Actual vs. BudgetFavorable / (Unfavorable)
Amount PercentMayor & Council and Charter Officers $2.4 $2.3 $2.5 $2.7 $0.3 9%Administrative Services 1.8 1.6 1.8 2.1 0.3 14%Community and Economic Development 2.3 2.9 3.1 2.4 ( 0.7) (27%)Community Services 3.7 3.2 3.4 4.1 0.7 18%Public Safety - Fire 3.9 2.5 4.2 4.6 0.3 8%Public Safety - Police 9.4 6.4 9.0 9.6 0.7 7%Public Works 1.2 1.1 1.2 1.2 - - Total $24.8 $20.0 $25.2 $26.9 $1.6 6%
Division Expenditures (Fiscal Year to Date: July 2021)
July 2021 Page 18 of 19

General Fund
$ in millions / rounding differences may occur
Actual to Revised Budget variance of $1.6 million or 6%:Mayor & Council and Charter Officers is favorable due primarily to the timing of invoices.
Administrative Services is also favorable due to the timing of invoices.
Community and Economic Development is unfavorable due to the timing of the Cultural Council Contract August invoice payment which was paid in July.
Community Services is favorable due to: 1) Promotions and retirements with replacement employees coming in at a lower rate than the person who was promoted; 2) fewer part-time hours due to challenges in recruiting based on the competitive job market; 3) the timing of machinery and equipment rental costs associated Bell Road Sports Complex project; 4) the timing of the invoice payment for Arizona State Land lease; and 4) the delay in purchases based on current inventory levels.
Public Safety – Fire is favorable due primarily to the timing of the payment of the Phoenix Dispatch Fire Service Contract. The favorable variance would have been greater but is being partially offset by higher-than-expected overtime needed due to 21 firefighters out of work as a result of workers comp, off duty injury, FMLA and a resignation. There are also 15 recruits in the academy who are unable to fill normal shifts and thus for which other staff must cover.
Public Safety - Police is favorable due to: 1) rank promotions with replacement employees coming in at a lower rate than the person who was promoted; and 2) the timing of the Regional Wireless Cooperative (RWC) invoice, which manages the radio communication network.
July 2021 Page 19 of 19