media habits study_dec, 16
TRANSCRIPT

…Measurable Results
MMS Research
The Ghanaian media landscape is witnessing media proliferation and fragmentation coupled with expanding
technologies and evolving demographics; consumers are becoming more sophisticated in their media consumption -
shifting media audience patterns and varied preferences have put a serious challenge to traditional media planning and
campaign execution in the mobile telephony industry.
To ensure that the brand continues to remain relevant and endear itself to subscribers as the brand that continues to
give everyday value, it seeks to monitor the media landscape to have a first-hand insight on media, audience patterns and
preferences as well as MTN and competitors’ media/communication activities.
KEY OBJECTIVE
To establish consumers’ media consumption patterns and preferences that will enhance effective and efficient media
planning and campaigns execution.
Background

Sampling universe
Males and Females aged : 16 - 65+
Survey period: Quarter 4 2016
Sample size: 2250
Geographic coverage
29
54
14
AB C1C2 DE
Social Class
Gender Split Survey was quantitative and has covered 8 key regions
54% 46%Region %
Greater Accra 23
Western 11
Central 9
Eastern 13
Ashanti 19
Brong Ahafo 8
Volta 7
Northern 10
Scope and Methodology

29
54
14
AB
CI/C2
DE
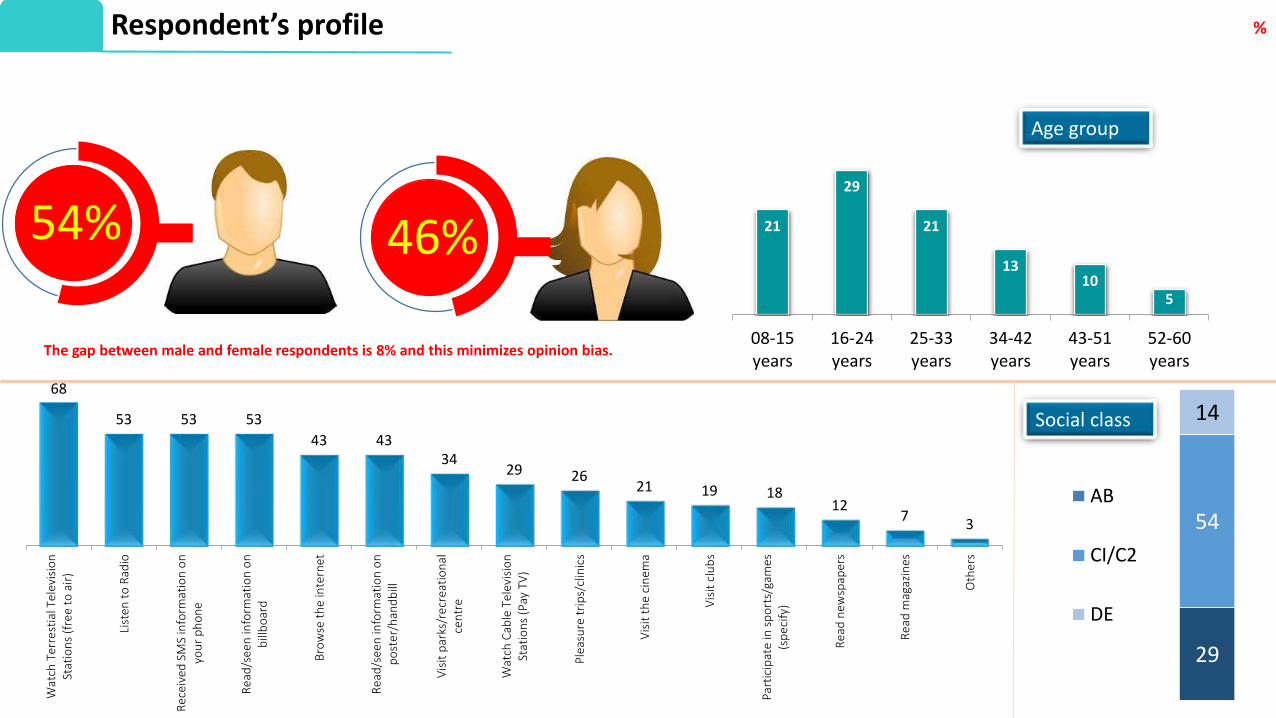
The gap between male and female respondents is 8% and this minimizes opinion bias.
%
21
29
21
1310
5
08-15years
16-24years
25-33years
34-42years
43-51years
52-60years
Social class
68
53 53 53
43 4334
29 2621 19 18
127
3
Wat
ch T
erre
stia
l Tel
evis
ion
Stat
ion
s (f
ree
to a
ir)
List
en t
o R
adio
Re
ceiv
ed S
MS
info
rmat
ion
on
you
r p
ho
ne
Re
ad/s
een
info
rmat
ion
on
bill
bo
ard
Bro
wse
th
e in
tern
et
Re
ad/s
een
info
rmat
ion
on
po
ste
r/h
and
bill
Vis
it p
arks
/re
crea
tio
nal
cen
tre
Wat
ch C
able
Te
levi
sio
nSt
atio
ns
(Pay
TV
)
Ple
asu
re t
rip
s/cl
inic
s
Vis
it t
he
cin
ema
Vis
it c
lub
s
Par
tici
pat
e in
sp
ort
s/ga
mes
(sp
eci
fy)
Re
ad n
ewsp
aper
s
Re
ad m
agaz
ines
Oth
ers
Age group
54% 46%
Respondent’s profile

60
45
33
28
13
71
55
78
75
72
69
47
55
58
11
85
6
57
13
8
40
9
16
6
6
36
12
6
21
89
10
63
2
4
40
9
3
1
1
9
10
4
4
58
36
25
4
2
23
4
83
85
73
39
43
24
7
28
43
56
6
2
47
4
80
88
76
31
25
4
4
98
2
79
8
14
19
16
6
6
8
6
6
6
6
82
36
79
5
3
16
6
7
5
3
2
6
9
7
1
100
16
74
11
11
38
12
64
63
12
15
16
6
6
Watch Terrestial Television Stations (free to air)
Watch Cable Television Stations (Pay TV)
Listen to Radio
Read newspapers
Read magazines
Browse the internet
Visit the cinema
Received SMS information on your phone
Read/seen information on billboard
Read/seen information on poster/handbill
Visit parks/recreational centre
Pleasure trips/clinics
Visit clubs
Participate in sports/games (specify)
Others
Greater Accra
Western
Central
Koforidua
Ashanti
Brong Ahafo
Volta
Northern
Base: 2250Terrestrial TV stations are mostly watched in northern region followed by Brong Ahafo while cable TV stations are mostly watched in Greater Accra. Radio is largely listen
to in Volta region while newspaper and magazine are read mostly in Greater Accra.
%Media patronage by region

Watch Terrestial Television Stations (free to air)
Watch Cable Television Stations (Pay TV)
Listen to Radio
Read newspapers
Read magazines
Browse the internet
Visit the cinema
Received SMS information on your phone
Read/seen information on billboard
Read/seen information on poster/handbill
Visit parks/recreational centre
Pleasure trips/clinics
Visit clubs
Participate in sports/games (specify)
Others
71
30
54
8
8
54
23
55
49
37
29
27
19
25
0
60
28
49
12
8
61
15
55
59
48
28
33
22
18
0
70
28
54
12
5
30
17
51
50
40
36
19
21
19
4
65
41
54
14
8
30
18
58
53
46
49
23
10
20
7
79
21
54
19
8
27
24
46
50
44
43
19
18
13
6
74
21
57
6
7
17
18
50
50
42
28
33
22
20
8
08-15 years 16-24 years 25-33 years 34-42 years 43-51 years 52-60 years
Base: 2250Terrestrial TV is watched majorly by respondents within age 43 – 51 years while cable TV is watched majorly by respondents within age 34 – 42 years. Radio is being
patronized more by respondent within age 52 – 60 years.
%Media patronage by Age group
55
50
35
21
7
71 35
62 5958 50 35
3743
870
23
57
7
8
35 12
5150
41 2923
12
10
1
82
11
68
87
15 1048 57
27 21 2112
7
Wat
ch T
erre
stia
l Tel
evis
ion
Stat
ion
s (f
ree
to a
ir)
Wat
ch C
able
Tel
evis
ion
Sta
tio
ns
(Pay
TV
)
List
en t
o R
adio
Rea
d n
ewsp
aper
s
Rea
d m
agaz
ines
Bro
wse
th
e in
tern
et
Vis
it t
he
cin
ema
Rec
eive
d S
MS
info
rmat
ion
on
yo
ur
ph
on
e
Rea
d/s
een
info
rmat
ion
on
bill
bo
ard
Rea
d/s
een
info
rmat
ion
on
po
ster
/han
db
ill
Vis
it p
arks
/rec
reat
ion
al c
entr
e
Ple
asu
re t
rip
s/cl
inic
s
Vis
it c
lub
s
Par
tici
pat
e in
sp
ort
s/ga
mes
(sp
ecif
y)
Oth
ers
DE
C1C2
AB
Base: 2250
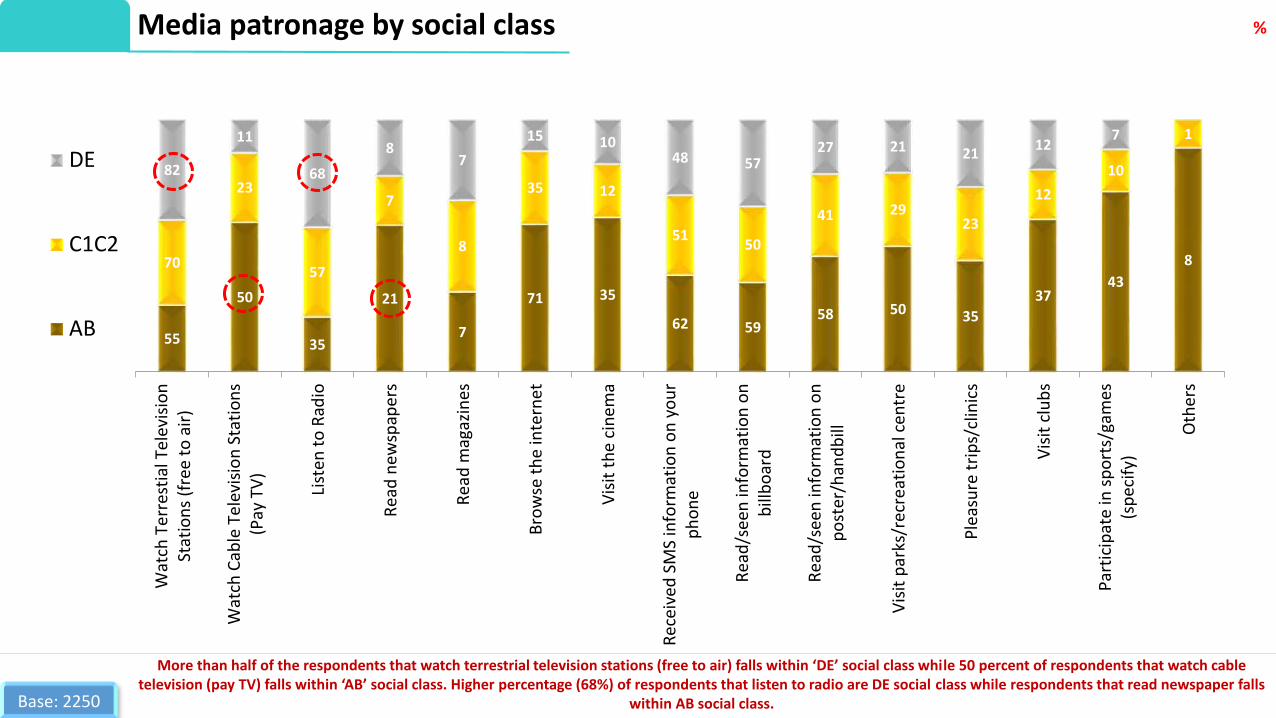
More than half of the respondents that watch terrestrial television stations (free to air) falls within ‘DE’ social class while 50 percent of respondents that watch cable television (pay TV) falls within ‘AB’ social class. Higher percentage (68%) of respondents that listen to radio are DE social class while respondents that read newspaper falls
within AB social class.
%Media patronage by social class

8605241
6761548
6703446
6703429
5484908
5460032
4317361
3696022
3281935
2474280
2446878
2376304
1510900
945769
Watch Terrestial Television Stations (free to air)
Received SMS information on your phone
Read/seen information on billboard
Listen to Radio
Read/seen information on poster/handbill
Browse the internet
Visit parks/recreational centre
Watch Cable Television Stations (Pay TV)
Pleasure trips/clinics
Participate in sports/games (specify)
Visit clubs
Visit the cinema
Read newspapers
Read magazines
67.69%
53.19%
52.73%
52.73%
43.15%
42.95%
33.96%
29.07%
25.82%
19.46%
19.25%
18.69%
11.89%
7.44%
Watch Terrestial Television Stations (free to air)
Received SMS information on your phone
Read/seen information on billboard
Listen to Radio
Read/seen information on poster/handbill
Browse the internet
Visit parks/recreational centre
Watch Cable Television Stations (Pay TV)
Pleasure trips/clinics
Participate in sports/games (specify)
Visit clubs
Visit the cinema
Read newspapers
Read magazines
Share of PenetrationPenetration
Base: 2250Terrestrial TV has the highest penetration (67.69%) followed by SMS on phone, billboard (52.73%), and radio (52.73%)
respectively.
Media penetration
2321617
2237694
2149982
2124531
2051220
1776700
1714456
1638998
1633905
1398510
1342274
994083
837230
377622
Received SMS information on your phone
Read/seen information on billboard
Read/seen information on poster/handbill
Watch Terrestial Television Stations (free to air)
Visit parks/recreational centre
Browse the internet
Participate in sports/games (specify)
Visit the cinema
Visit clubs
Pleasure trips/clinics
Watch Cable Television Stations (Pay TV)
Listen to Radio
Read newspapers
Read magazines
78.06%
75.24%
72.29%
71.43%
68.97%
59.74%
57.65%
55.11%
54.94%
47.02%
45.13%
33.42%
28.15%
12.70%
Received SMS information on your phone
Read/seen information on billboard
Read/seen information on poster/handbill
Watch Terrestial Television Stations (free to air)
Visit parks/recreational centre
Browse the internet
Participate in sports/games (specify)
Visit the cinema
Visit clubs
Pleasure trips/clinics
Watch Cable Television Stations (Pay TV)
Listen to Radio
Read newspapers
Read magazines
Share of PenetrationPenetration
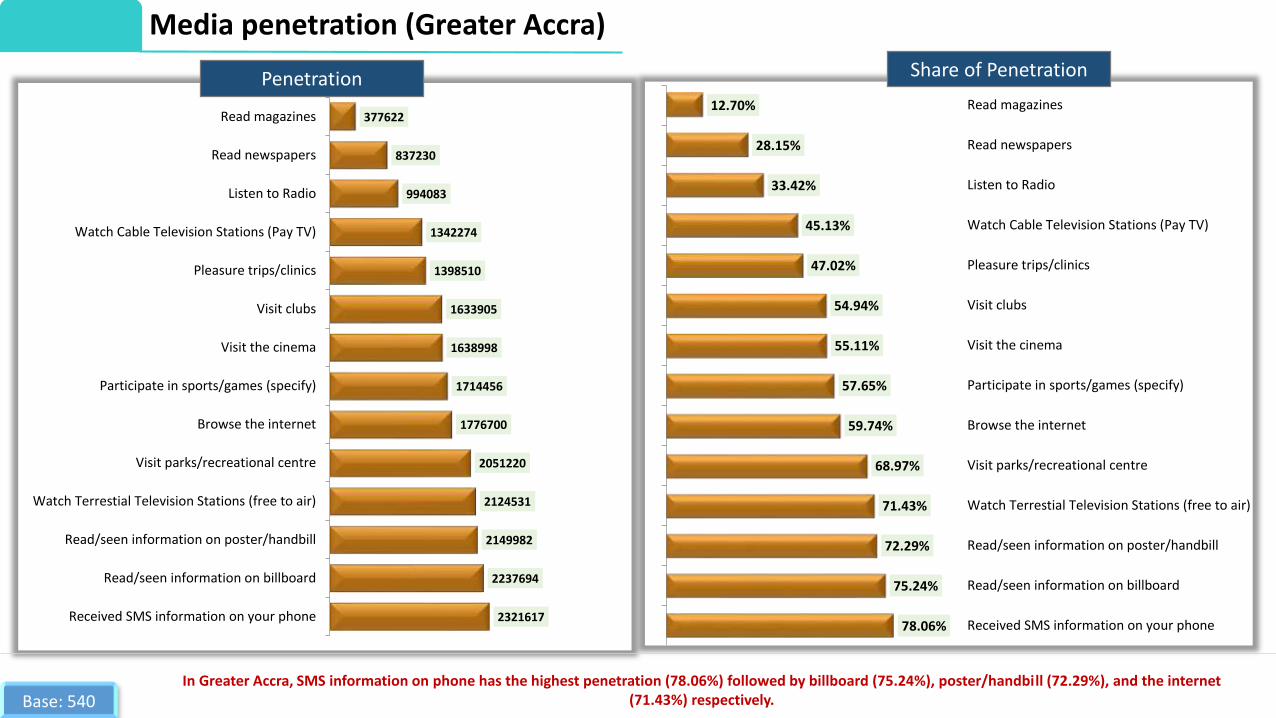
Base: 540In Greater Accra, SMS information on phone has the highest penetration (78.06%) followed by billboard (75.24%), poster/handbill (72.29%), and the internet
(71.43%) respectively.
Media penetration (Greater Accra)

1235586
833367
576576
520647
307581
227981
193022
168522
125836
123040
90226
89208
81797
80266
Watch Terrestial Television Stations (free to air)
Listen to Radio
Browse the internet
Visit parks/recreational centre
Participate in sports/games (specify)
Received SMS information on your phone
Read newspapers
Pleasure trips/clinics
Visit the cinema
Read magazines
Read/seen information on billboard
Watch Cable Television Stations (Pay TV)
Read/seen information on poster/handbill
Visit clubs
85.15%
57.43%
39.73%
35.88%
21.20%
15.71%
13.30%
11.61%
8.67%
8.48%
6.22%
6.15%
5.64%
5.53%
Watch Terrestial Television Stations (free to air)
Listen to Radio
Browse the internet
Visit parks/recreational centre
Participate in sports/games (specify)
Received SMS information on your phone
Read newspapers
Pleasure trips/clinics
Visit the cinema
Read magazines
Read/seen information on billboard
Watch Cable Television Stations (Pay TV)
Read/seen information on poster/handbill
Visit clubs
Share of PenetrationPenetration
Base: 225Terrestrial TV stations has the highest penetration share (85.15%) in Western region followed by radio (57.43%), and the internet (39.73%) respectively.
Media penetration (Western region)

1034566
731464
464154
119593
114493
107230
103317
50909
50909
47195
31362
28523
11183
6298
Watch Terrestial Television Stations (free to air)
Listen to Radio
Browse the internet
Pleasure trips/clinics
Watch Cable Television Stations (Pay TV)
Visit parks/recreational centre
Visit the cinema
Visit clubs
Participate in sports/games (specify)
Read magazines
Received SMS information on your phone
Read newspapers
Read/seen information on billboard
Read/seen information on poster/handbill
89.05%
62.96%
39.95%
10.29%
9.86%
9.23%
8.89%
4.38%
4.38%
4.06%
2.70%
2.46%
0.96%
0.54%
Watch Terrestial Television Stations (free to air)
Listen to Radio
Browse the internet
Pleasure trips/clinics
Watch Cable Television Stations (Pay TV)
Visit parks/recreational centre
Visit the cinema
Visit clubs
Participate in sports/games (specify)
Read magazines
Received SMS information on your phone
Read newspapers
Read/seen information on billboard
Read/seen information on poster/handbill
Share of PenetrationPenetration
Base: 200In central region, terrestrial TV stations has the highest penetration share (89.05%) which is followed by radio (62.96%) and the internet (39.95%) respectively.
Media penetration (central region)

1371112
1338554
1173299
938821
687556
631330
578986
405525
382717
366344
108153
62675
62559
39412
Read/seen information on billboard
Received SMS information on your phone
Read/seen information on poster/handbill
Watch Terrestial Television Stations (free toair)
Pleasure trips/clinics
Visit parks/recreational centre
Watch Cable Television Stations (Pay TV)
Listen to Radio
Visit clubs
Browse the internet
Participate in sports/games (specify)
Read newspapers
Visit the cinema
Read magazines
85.40%
83.37%
73.08%
58.47%
42.82%
39.32%
36.06%
25.26%
23.84%
22.82%
6.74%
3.90%
3.90%
2.45%
Read/seen information on billboard
Received SMS information on your phone
Read/seen information on poster/handbill
Watch Terrestial Television Stations (free to air)
Pleasure trips/clinics
Visit parks/recreational centre
Watch Cable Television Stations (Pay TV)
Listen to Radio
Visit clubs
Browse the internet
Participate in sports/games (specify)
Read newspapers
Visit the cinema
Read magazines
Share of PenetrationPenetration
Base: 225Billboard has the highest penetration share in Eastern region followed by phone SMS (83.37%), poster/handbill respectively.
Media penetration (Eastern region)

2104223
1926065
1822679
1332507
1120150
1026419
736678
675549
588612
134257
97823
89289
85198
54033
Read/seen information on billboard
Received SMS information on your phone
Read/seen information on poster/handbill
Listen to Radio
Browse the internet
Watch Terrestial Television Stations (free to air)
Visit parks/recreational centre
Watch Cable Television Stations (Pay TV)
Pleasure trips/clinics
Read newspapers
Participate in sports/games (specify)
Visit clubs
Visit the cinema
Read magazines
87.94%
80.49%
76.17%
55.69%
46.81%
42.90%
30.79%
28.23%
24.60%
5.61%
4.09%
3.73%
3.56%
2.26%
Read/seen information on billboard
Received SMS information on your phone
Read/seen information on poster/handbill
Listen to Radio
Browse the internet
Watch Terrestial Television Stations (free toair)
Visit parks/recreational centre
Watch Cable Television Stations (Pay TV)
Pleasure trips/clinics
Read newspapers
Participate in sports/games (specify)
Visit clubs
Visit the cinema
Read magazines
Share of PenetrationPenetration
Base: 520In Ashanti region, billboard has the highest penetration when compared to other media.
Media penetration (Ashanti region)
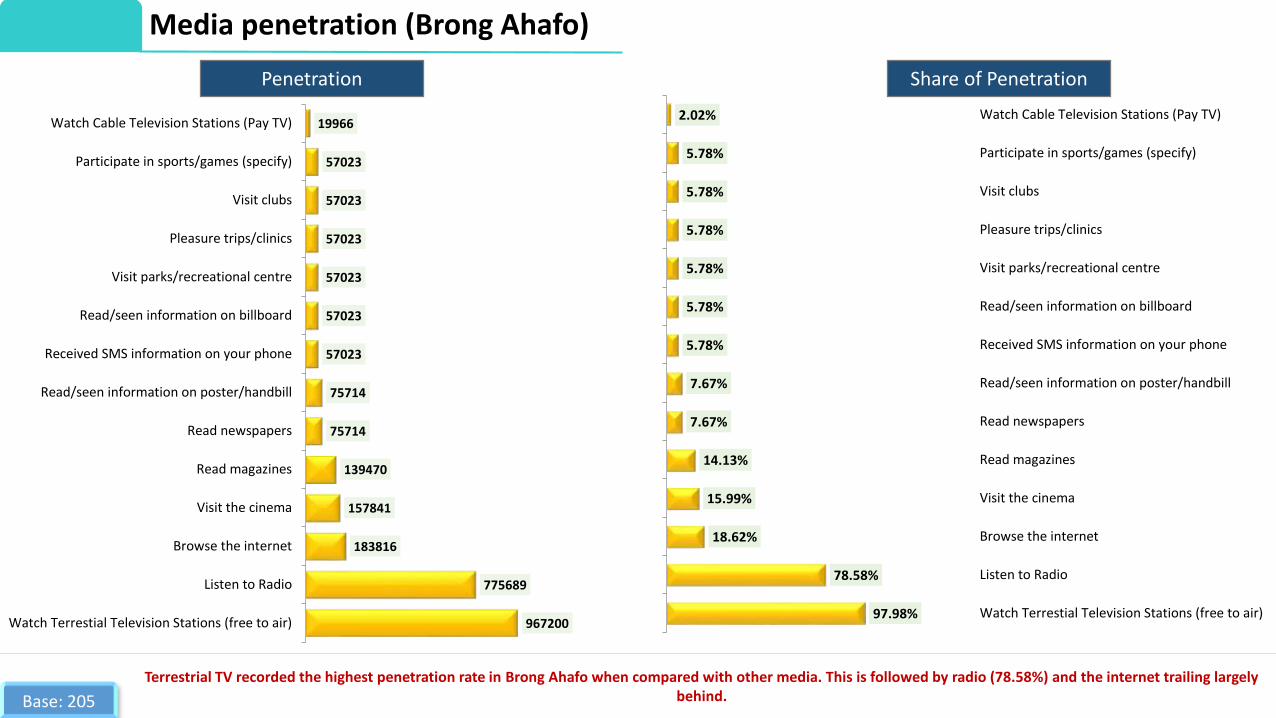
967200
775689
183816
157841
139470
75714
75714
57023
57023
57023
57023
57023
57023
19966
Watch Terrestial Television Stations (free to air)
Listen to Radio
Browse the internet
Visit the cinema
Read magazines
Read newspapers
Read/seen information on poster/handbill
Received SMS information on your phone
Read/seen information on billboard
Visit parks/recreational centre
Pleasure trips/clinics
Visit clubs
Participate in sports/games (specify)
Watch Cable Television Stations (Pay TV)
97.98%
78.58%
18.62%
15.99%
14.13%
7.67%
7.67%
5.78%
5.78%
5.78%
5.78%
5.78%
5.78%
2.02%
Watch Terrestial Television Stations (free to air)
Listen to Radio
Browse the internet
Visit the cinema
Read magazines
Read newspapers
Read/seen information on poster/handbill
Received SMS information on your phone
Read/seen information on billboard
Visit parks/recreational centre
Pleasure trips/clinics
Visit clubs
Participate in sports/games (specify)
Watch Cable Television Stations (Pay TV)
Share of PenetrationPenetration
Base: 205
Terrestrial TV recorded the highest penetration rate in Brong Ahafo when compared with other media. This is followed by radio (78.58%) and the internet trailing largely behind.
Media penetration (Brong Ahafo)
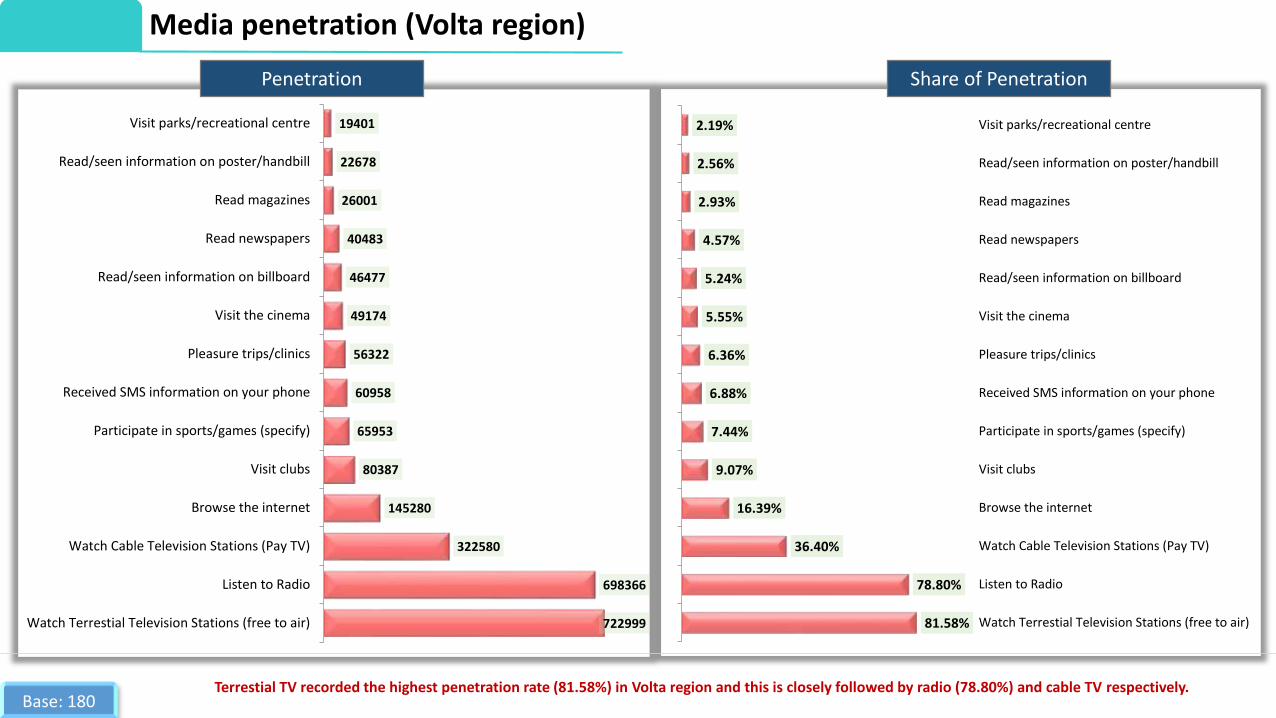
722999
698366
322580
145280
80387
65953
60958
56322
49174
46477
40483
26001
22678
19401
Watch Terrestial Television Stations (free to air)
Listen to Radio
Watch Cable Television Stations (Pay TV)
Browse the internet
Visit clubs
Participate in sports/games (specify)
Received SMS information on your phone
Pleasure trips/clinics
Visit the cinema
Read/seen information on billboard
Read newspapers
Read magazines
Read/seen information on poster/handbill
Visit parks/recreational centre
81.58%
78.80%
36.40%
16.39%
9.07%
7.44%
6.88%
6.36%
5.55%
5.24%
4.57%
2.93%
2.56%
2.19%
Watch Terrestial Television Stations (free to air)
Listen to Radio
Watch Cable Television Stations (Pay TV)
Browse the internet
Visit clubs
Participate in sports/games (specify)
Received SMS information on your phone
Pleasure trips/clinics
Visit the cinema
Read/seen information on billboard
Read newspapers
Read magazines
Read/seen information on poster/handbill
Visit parks/recreational centre
Share of PenetrationPenetration
Base: 180Terrestial TV recorded the highest penetration rate (81.58%) in Volta region and this is closely followed by radio (78.80%) and cable TV respectively.
Media penetration (Volta region)

1253820
932428
797988
785508
479181
205798
202097
193831
153381
152461
138996
138996
72382
72382
Watch Terrestial Television Stations (free to air)
Listen to Radio
Received SMS information on your phone
Read/seen information on billboard
Browse the internet
Pleasure trips/clinics
Watch Cable Television Stations (Pay TV)
Visit parks/recreational centre
Visit the cinema
Read/seen information on poster/handbill
Read newspapers
Read magazines
Visit clubs
Participate in sports/games (specify)
100.00%
74.37%
63.64%
62.65%
38.22%
16.41%
16.12%
15.46%
12.23%
12.16%
11.09%
11.09%
5.77%
5.77%
Watch Terrestial Television Stations (free to air)
Listen to Radio
Received SMS information on your phone
Read/seen information on billboard
Browse the internet
Pleasure trips/clinics
Watch Cable Television Stations (Pay TV)
Visit parks/recreational centre
Visit the cinema
Read/seen information on poster/handbill
Read newspapers
Read magazines
Visit clubs
Participate in sports/games (specify)
Share of PenetrationPenetration
Base: 155
In Northern region, terrestrial TV recorded the highest penetration rate (100%) followed by radio (74.37%), SMS information on phone, and billboard (62.65%) correspondingly.
Media penetration (Northern region)


32
21
45
79
5
25
19
24
28
0
6
0
8
14
14
2
0
1
0
13
7
9
14
0
0
0
6
5
21
39
0
0
0
3
32
41
31
9
0
35
41
58
18
10
74
1
59
7
26
2
0
46
34
59
8
7
Sunday
Monday
Tuesday
Wednesday
Thursday
Friday
Saturday
Early morning (4am-9.59am)
Late morning (10am-11.59am)
Early afternoon (12noon-1.59pm)
Late afternoon (2pm-3.59pm)
Early evening (4pm-6.59pm)
Late evening (7pm-9.59pm)
Night/midnight (10pm-12am)
Night/midnight (12.01-3.59am)
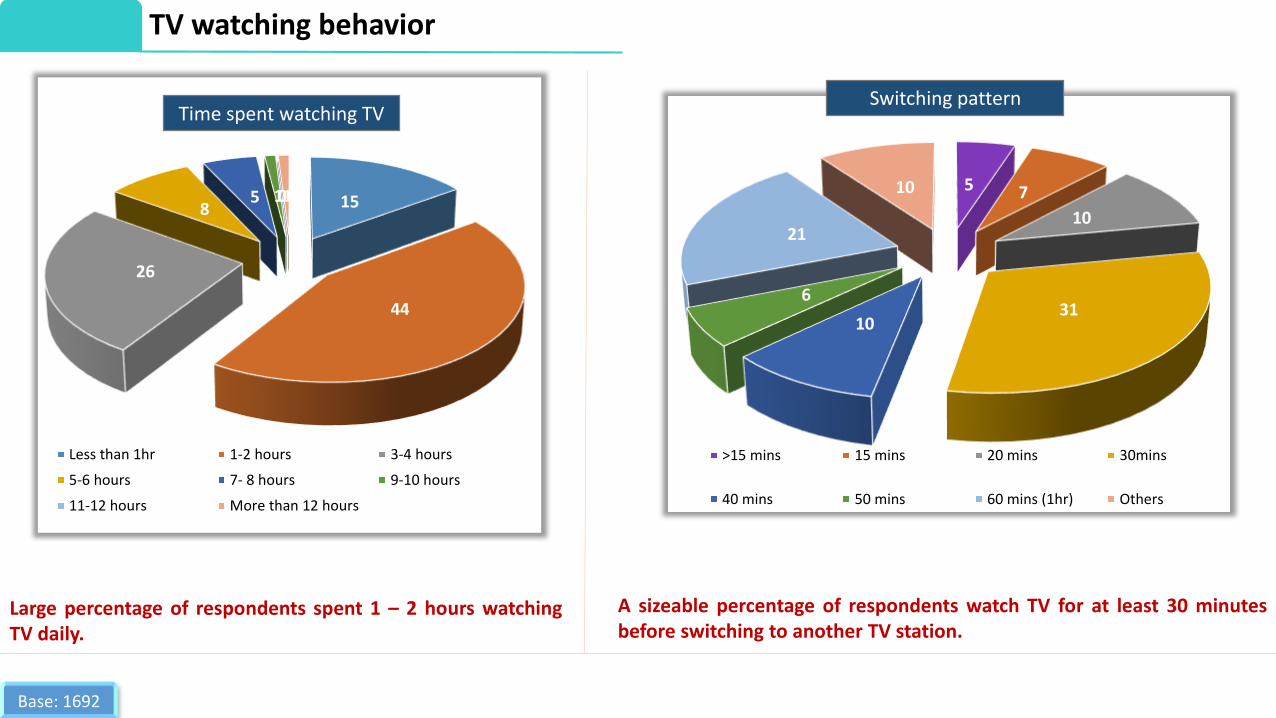
Base: 1692
On Fridays, Saturdays, and Sundays, higher percentage of respondents watched TV late in the evening. On Tuesdays and Thursdays, a sizeable percentage of the respondents watched TV at night/midnight.
%Time when TV is Regularly watched (%)
Base: 1692
15
44
26
85 101
Less than 1hr 1-2 hours 3-4 hours
5-6 hours 7- 8 hours 9-10 hours
11-12 hours More than 12 hours
Time spent watching TV
5 7
10
3110
6
21
10
>15 mins 15 mins 20 mins 30mins
40 mins 50 mins 60 mins (1hr) Others
Switching pattern
A sizeable percentage of respondents watch TV for at least 30 minutesbefore switching to another TV station.
Large percentage of respondents spent 1 – 2 hours watchingTV daily.
TV watching behavior

99 99 98 96 96 93 90 88 8781 80 77
3627
GTV TV3 GHOne MetroTV
Viasat1
UTV ETVGhana
TVAfrica
Net2TV
CrystalXtra
CrystalPrime
CrystalPlus
CoastalTV
AdomTV
100 99 9792
8779
65
4 3 1 1
TV3 UTV GTV Viasat 1 CoastalTV
Metro TVTV Africa GHOne Adom TV CrystalPrime
CrystalXtra
100 10095
8983
48
28
4 2
TV3 UTV GTV Metro TV GHOne Viasat 1 TV Africa Adom TV CrystalPrime
100 100 100
89
GTV TV3 Metro TV TV Africa
Accra Western
Central Eastern
% Share of Reception of Stations by Regions…1/3
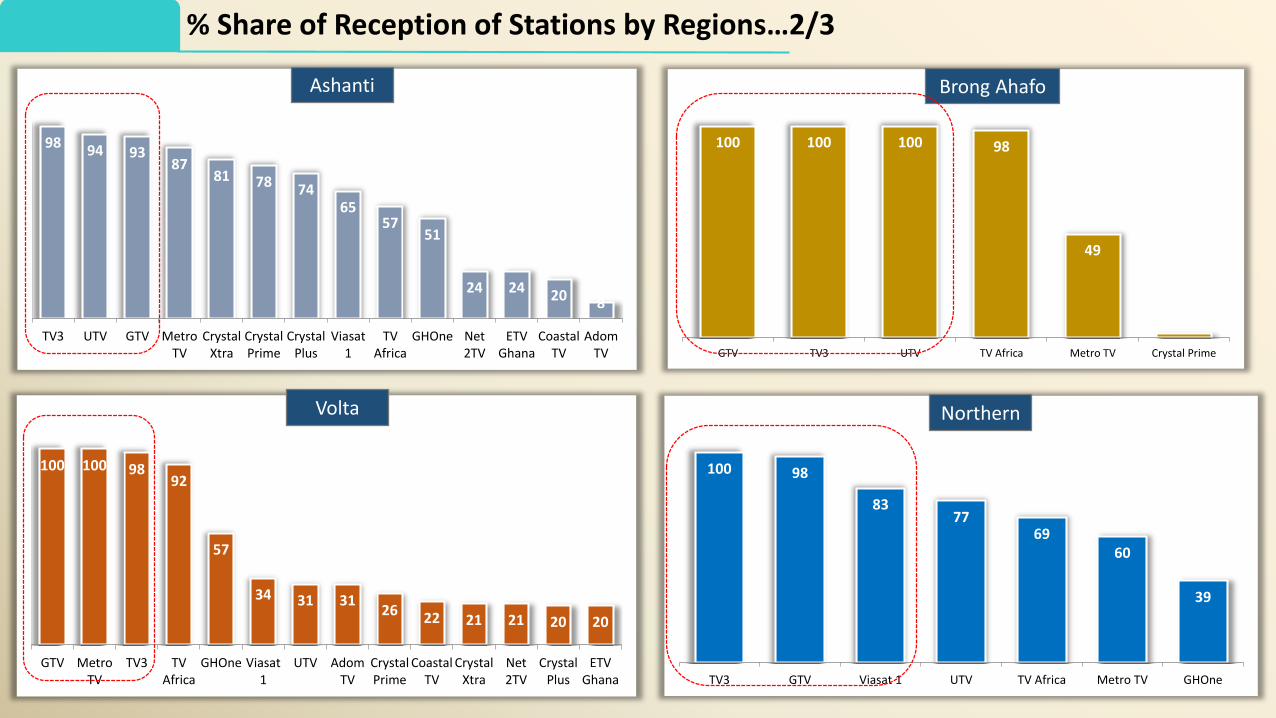
100 100 9892
57
34 31 3126 22 21 21 20 20
GTV MetroTV
TV3 TVAfrica
GHOne Viasat1
UTV AdomTV
CrystalPrime
CoastalTV
CrystalXtra
Net2TV
CrystalPlus
ETVGhana
98 94 9387
81 78 7465
5751
24 24 20 8
TV3 UTV GTV MetroTV
CrystalXtra
CrystalPrime
CrystalPlus
Viasat1
TVAfrica
GHOne Net2TV
ETVGhana
CoastalTV
AdomTV
100 100 100 98
49
2
GTV TV3 UTV TV Africa Metro TV Crystal Prime
100 98
8377
6960
39
TV3 GTV Viasat 1 UTV TV Africa Metro TV GHOne
Ashanti Brong Ahafo
Volta Northern
% Share of Reception of Stations by Regions…2/3

21
30
45
47
47
48
50
77
78
78
85
87
99
99
Adom TV
Coastal TV
Crystal Prime
Crystal Xtra
Crystal Plus
ETV Ghana
Net 2TV
Viasat 1
TV Africa
GHOne
Metro TV
UTV
GTV
TV3
6
12
14
18
18
20
21
38
47
73
78
82
97
99
Adom TV
Net 2TV
ETV Ghana
Crystal Plus
Coastal TV
Crystal Xtra
Crystal Prime
GHOne
Viasat 1
TV Africa
UTV
Metro TV
GTV
TV3
2
3
4
5
6
6
15
27
63
63
64
76
97
99
Adom TV
ETV Ghana
Net 2TV
Crystal Plus
Crystal Prime
Crystal Xtra
Coastal TV
GHOne
TV Africa
UTV
Viasat 1
Metro TV
GTV
TV3
High Value Band (AB) Middle Value Band (C1C2) Low Value Band (DE)
Base: 1692
There is no significant difference between the TV stations watched by different social class as revealed above. TV3 and GTV tops the station watched by high, middle, and low value band.
% Share of Reception of Stations by Regions…3/3

Base: 1692UTV has the highest reach in Accra and Central regions while GTV has the highest reach in Western region and TV3 has the highest reach in Eastern region.
78
65
4032
27 27
UTV TV3 GTV Viasat 1 GHOne Metro TV
Accra76
7066
3225
17
GTV TV3 UTV GHOne Metro TV Viasat 1
Western
97
7670 67
61
46 43
UTV TV3 Viasat 1 GTV Coastal TV Metro TV TV Africa
Central
85
5348
42
TV3 GTV Metro TV TV Africa
Eastern
Reach of Stations (Using the watched most often response)
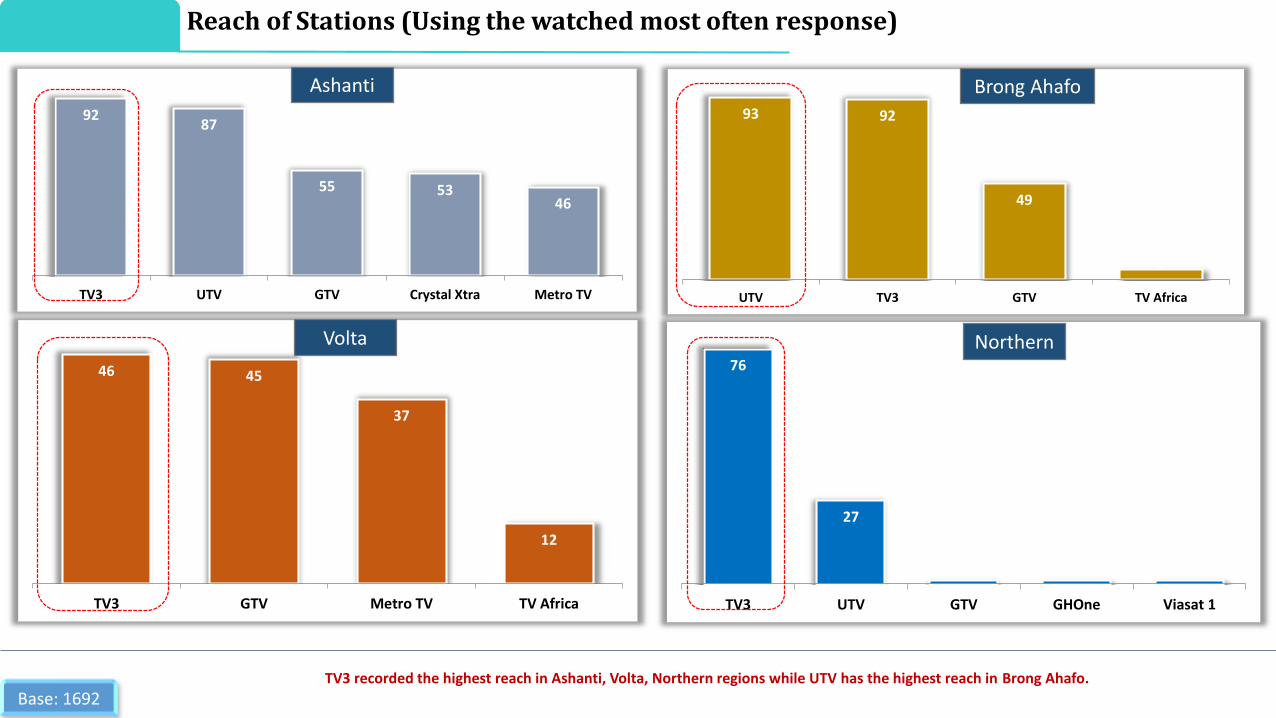
46 45
37
12
TV3 GTV Metro TV TV Africa
9287
55 5346
TV3 UTV GTV Crystal Xtra Metro TV
93 92
49
5
UTV TV3 GTV TV Africa
76
27
1 1 1
TV3 UTV GTV GHOne Viasat 1
Ashanti Brong Ahafo
Volta Northern
Base: 1692TV3 recorded the highest reach in Ashanti, Volta, Northern regions while UTV has the highest reach in Brong Ahafo.
Reach of Stations (Using the watched most often response)
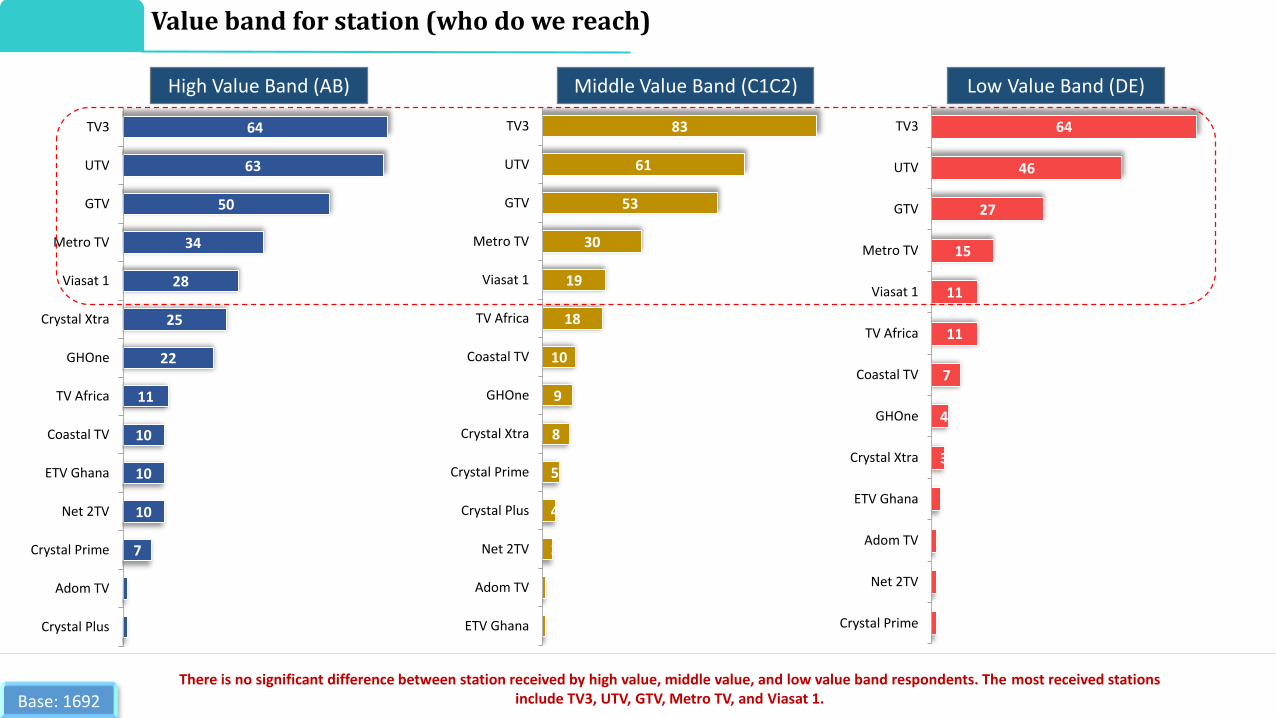
1
1
7
10
10
10
11
22
25
28
34
50
63
64
Crystal Plus
Adom TV
Crystal Prime
Net 2TV
ETV Ghana
Coastal TV
TV Africa
GHOne
Crystal Xtra
Viasat 1
Metro TV
GTV
UTV
TV3
1
1
3
4
5
8
9
10
18
19
30
53
61
83
ETV Ghana
Adom TV
Net 2TV
Crystal Plus
Crystal Prime
Crystal Xtra
GHOne
Coastal TV
TV Africa
Viasat 1
Metro TV
GTV
UTV
TV3
1
1
1
2
3
4
7
11
11
15
27
46
64
Crystal Prime
Net 2TV
Adom TV
ETV Ghana
Crystal Xtra
GHOne
Coastal TV
TV Africa
Viasat 1
Metro TV
GTV
UTV
TV3
High Value Band (AB) Middle Value Band (C1C2) Low Value Band (DE)
Base: 1692There is no significant difference between station received by high value, middle value, and low value band respondents. The most received stations
include TV3, UTV, GTV, Metro TV, and Viasat 1.
Value band for station (who do we reach)
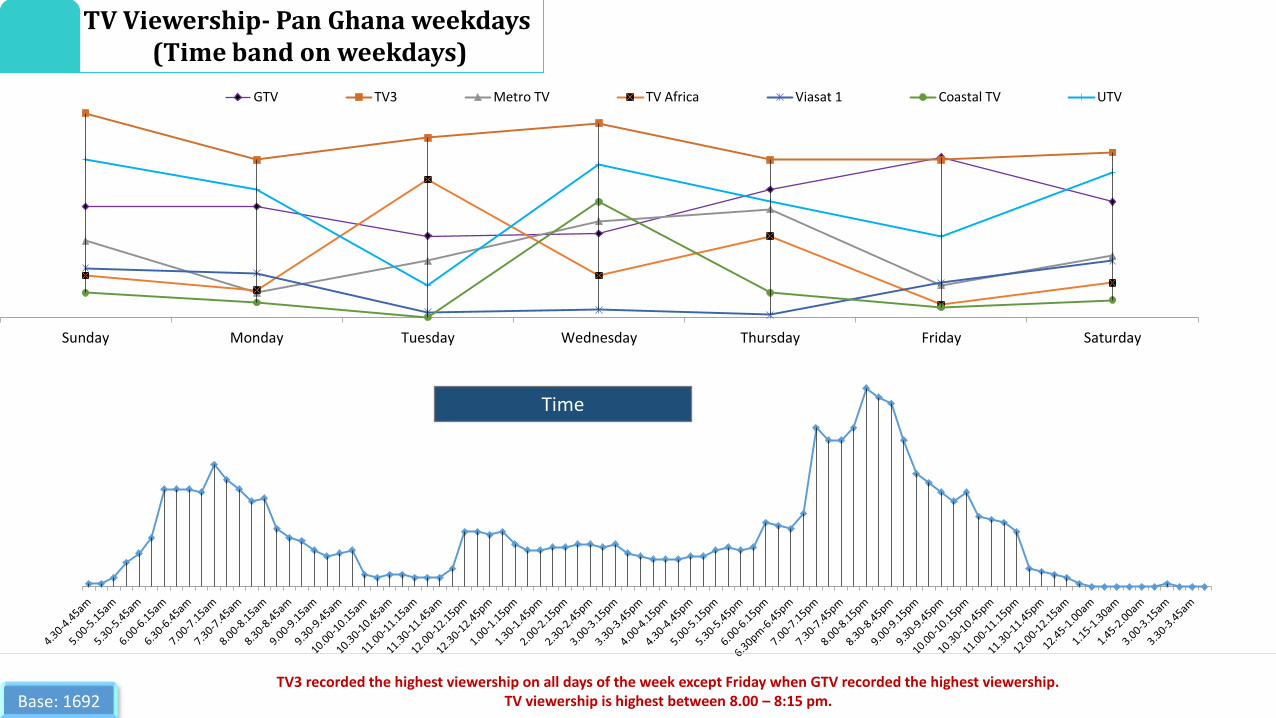
Sunday Monday Tuesday Wednesday Thursday Friday Saturday
GTV TV3 Metro TV TV Africa Viasat 1 Coastal TV UTV
TV Viewership- Pan Ghana weekdays(Time band on weekdays)
Base: 1692TV3 recorded the highest viewership on all days of the week except Friday when GTV recorded the highest viewership.
TV viewership is highest between 8.00 – 8:15 pm.
Time
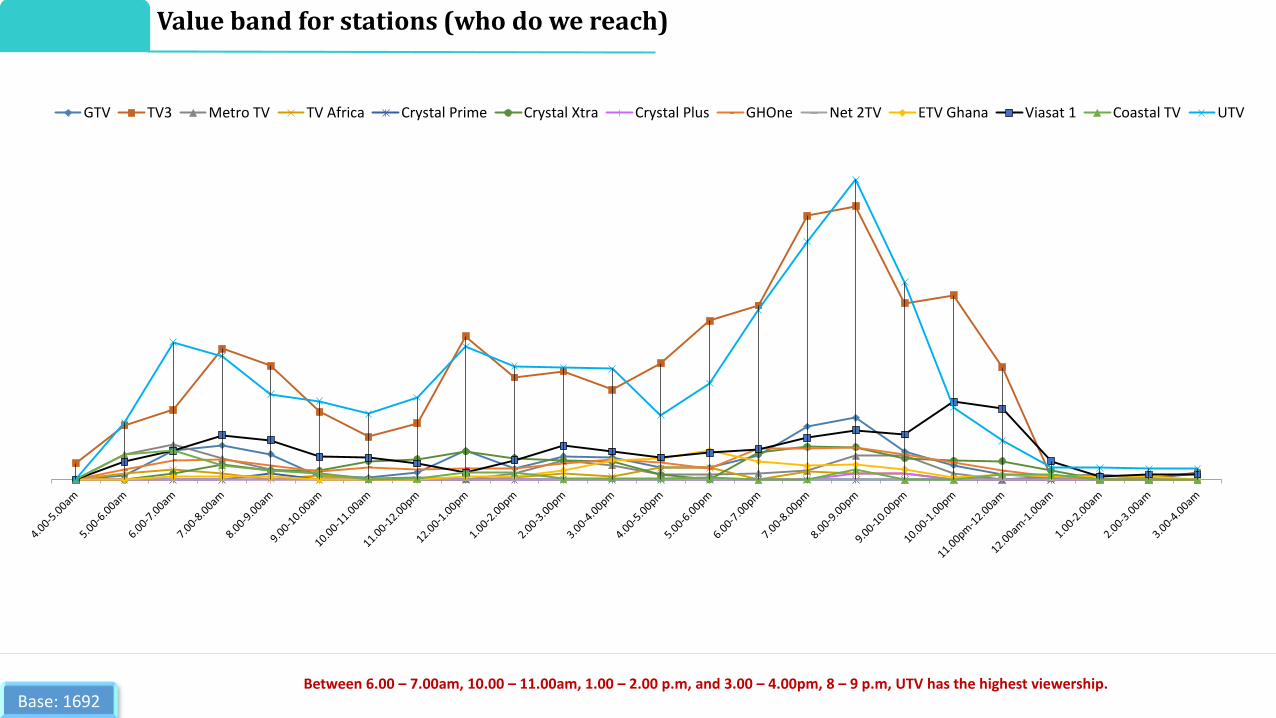
GTV TV3 Metro TV TV Africa Crystal Prime Crystal Xtra Crystal Plus GHOne Net 2TV ETV Ghana Viasat 1 Coastal TV UTV
Base: 1692Between 6.00 – 7.00am, 10.00 – 11.00am, 1.00 – 2.00 p.m, and 3.00 – 4.00pm, 8 – 9 p.m, UTV has the highest viewership.
Value band for stations (who do we reach)
Sunday Monday Tuesday Wednesday Thursday Friday Saturday
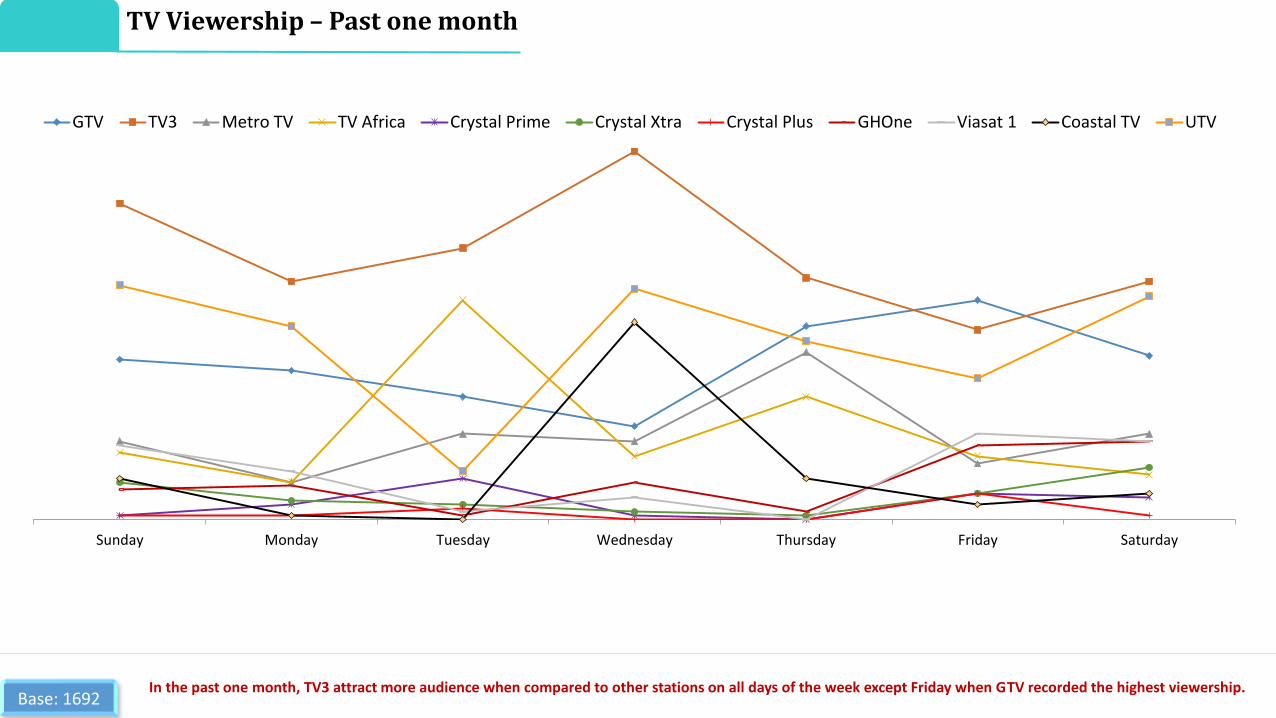
GTV TV3 Metro TV TV Africa Crystal Prime Crystal Xtra Crystal Plus GHOne Viasat 1 Coastal TV UTV
Base: 1692In the past one month, TV3 attract more audience when compared to other stations on all days of the week except Friday when GTV recorded the highest viewership.
TV Viewership – Past one month
38
66
69
53
53
42
41
1
61
59
80
87
92
92
51
84
22
15
45
45
26
2
19
19
44
48
12
4
1
8
17
33
50
2
14
26
35
2
18
9
1
32
6
64
37
5
6
5
60
8
83
61
95
87
93
2
28
2
1
1
7
Greater Accra
Western
Central
Eastern
Ashanti
Brong Ahafo
Volta
Northern
GTV
TV3
Metro TV
TV Africa
Crystal Prime
Crystal Xtra
Crystal Plus
GHOne
Viasat 1
Coastal TV
UTV
Adom TV
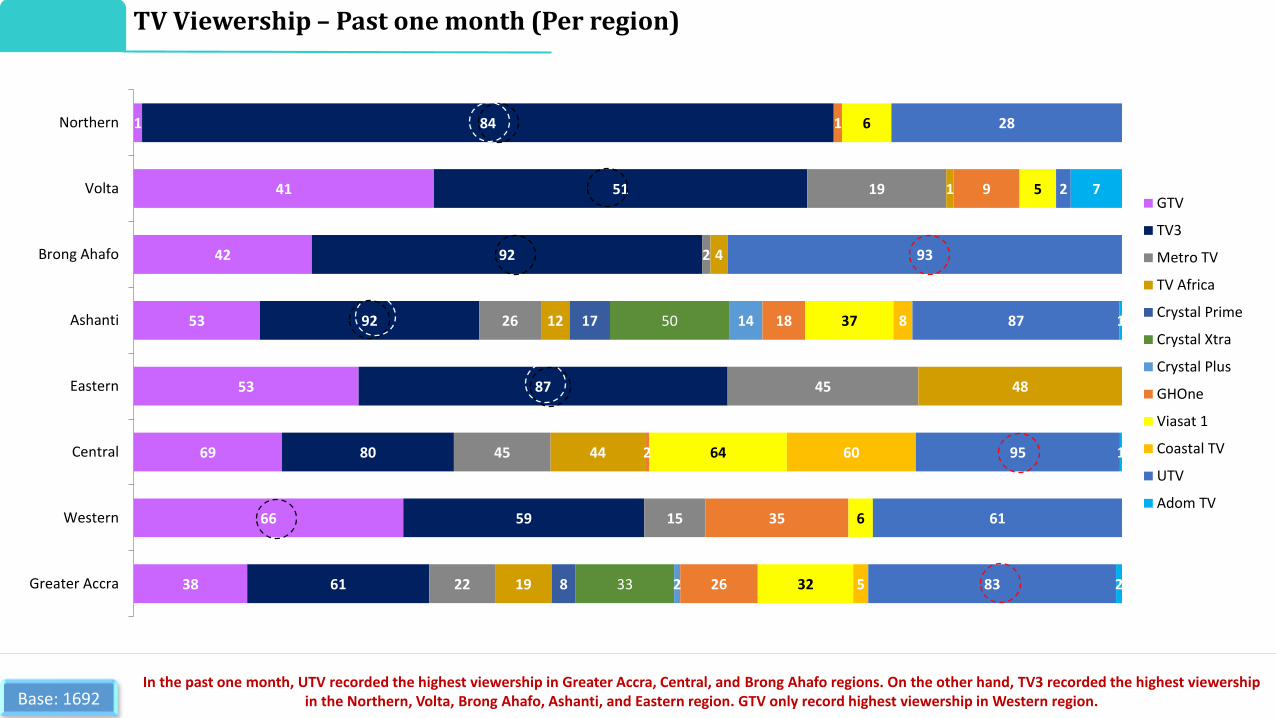
Base: 1692In the past one month, UTV recorded the highest viewership in Greater Accra, Central, and Brong Ahafo regions. On the other hand, TV3 recorded the highest viewership
in the Northern, Volta, Brong Ahafo, Ashanti, and Eastern region. GTV only record highest viewership in Western region.
TV Viewership – Past one month (Per region)

GTV TV3 Metro TV TV Africa CrystalPrime
Crystal Xtra Crystal Plus GHOne Net 2TV ETV Ghana Viasat 1 Coastal TV UTV Adom TV
AB
C1C2
DE
Base: 1692
Note: AB: High Value Band, C1C2:Middle Vale Band, DE: Low Value Band
TV Viewership – Past one month (Value Band)
Sunday Monday Tuesday Wednesday Thursday Friday Saturday
7 9 10
2
20 19
81
51
11
37
GHOne
Coastal TV
Crystal Xtra
TV Africa
Metro TV
Viasat 1
GTV
UTV
TV3
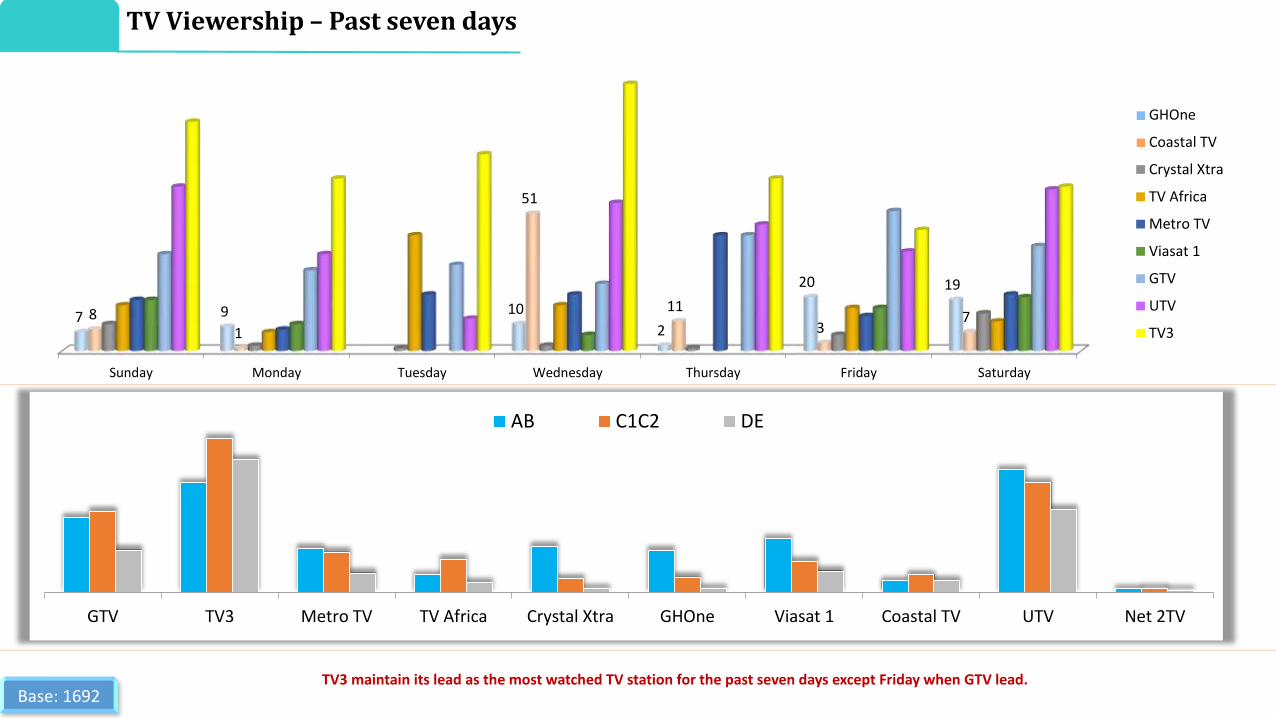
Base: 1692TV3 maintain its lead as the most watched TV station for the past seven days except Friday when GTV lead.
GTV TV3 Metro TV TV Africa Crystal Xtra GHOne Viasat 1 Coastal TV UTV Net 2TV
AB C1C2 DE
TV Viewership – Past seven days
30
52
6845
43 31
41
1
61
54
78
87
91
92
50
8221
9
44
44
21
0
18
2630
1
13
9
129
6
64
29
5
80 6095
84
83
2
27
Greater Accra Western Central Eastern Ashanti Brong Ahafo Volta Northern
UTV
Coastal TV
Viasat 1
GHOne
Crystal Xtra
TV Africa
Metro TV
TV3
GTV
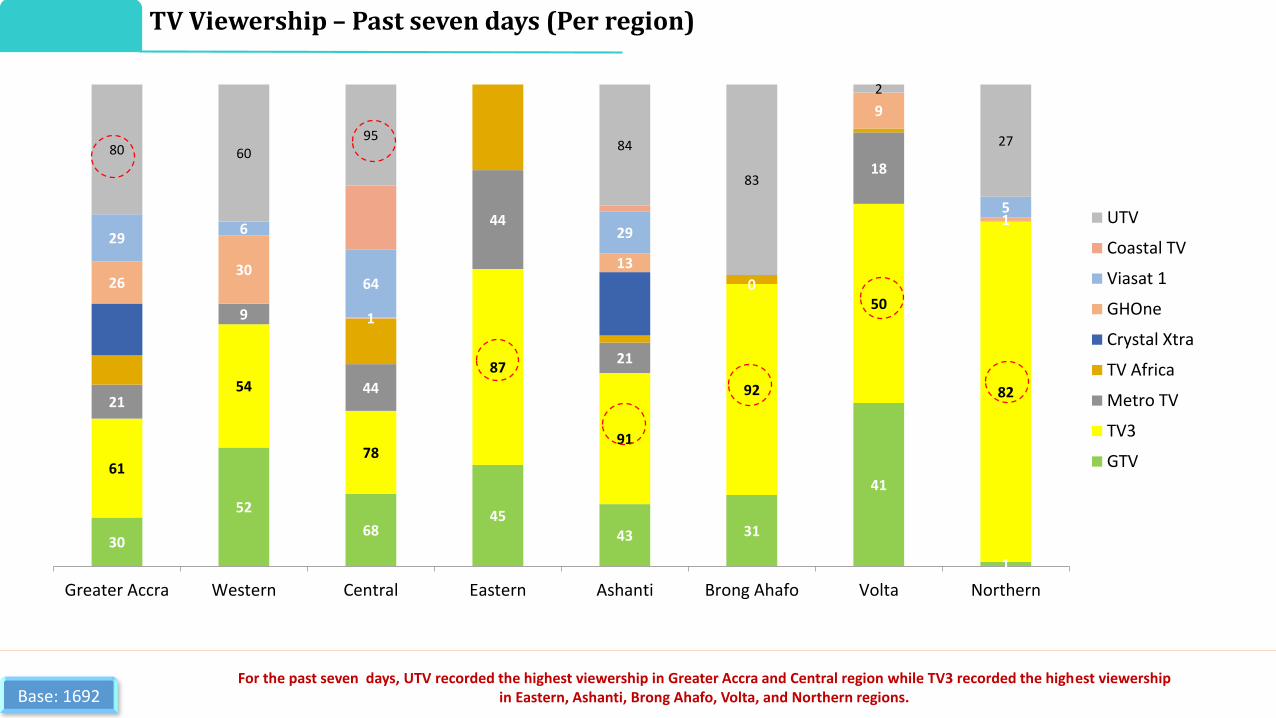
Base: 1692For the past seven days, UTV recorded the highest viewership in Greater Accra and Central region while TV3 recorded the highest viewership
in Eastern, Ashanti, Brong Ahafo, Volta, and Northern regions.
TV Viewership – Past seven days (Per region)

28
29
18
20
10
50
30
74
61
73
45
64
31
57
15
6
21
21
34
5
17
12
6
36
16
10
11
1
1
5
10
2
1
2
1
5
13
16
10
6
5
19
56
35
12
55
47
37
58
Sunday
Monday
Tuesday
Wednesday
Thursday
Friday
SaturdayGTV
TV3
Metro TV
TV Africa
Crystal Prime
Crystal Xtra
GHOne
Viasat 1
Coastal TV
UTV
GTV TV3 Metro TV TV Africa Crystal Xtra GHOne Net 2TV Viasat 1 Coastal TV UTV
AB C1C2 DE
Base: 1692
TV Viewership – Watched yesterday

Greater Accra
Western
Central
Eastern
Ashanti
Brong Ahafo
Volta
Northern
27
49
63
18
36
10
41
1
51
48
66
87
82
80
30
78
16
9
44
25
13
17
17
43
18
2
1
25
23
1
12
9
1
7
6
6
4
28
6
63
13
1
79
57
93
84
71
1
21
GTV
TV3
Metro TV
TV Africa
GHOne
Net 2TV
ETV Ghana
Viasat 1
Coastal TV
UTV
Base: 1692
TV Viewership – Watched yesterday (per region)
2
23
512
1 0
41
1
10
22
20
51
39
37
24
70
2
24
2
21
17
17
9
342
38
60
26
63
1
24
Greater Accra Western Central Eastern Ashanti Brong Ahafo Volta Northern
UTV
Viasat 1
GHOne
Metro TV
TV3
GTV
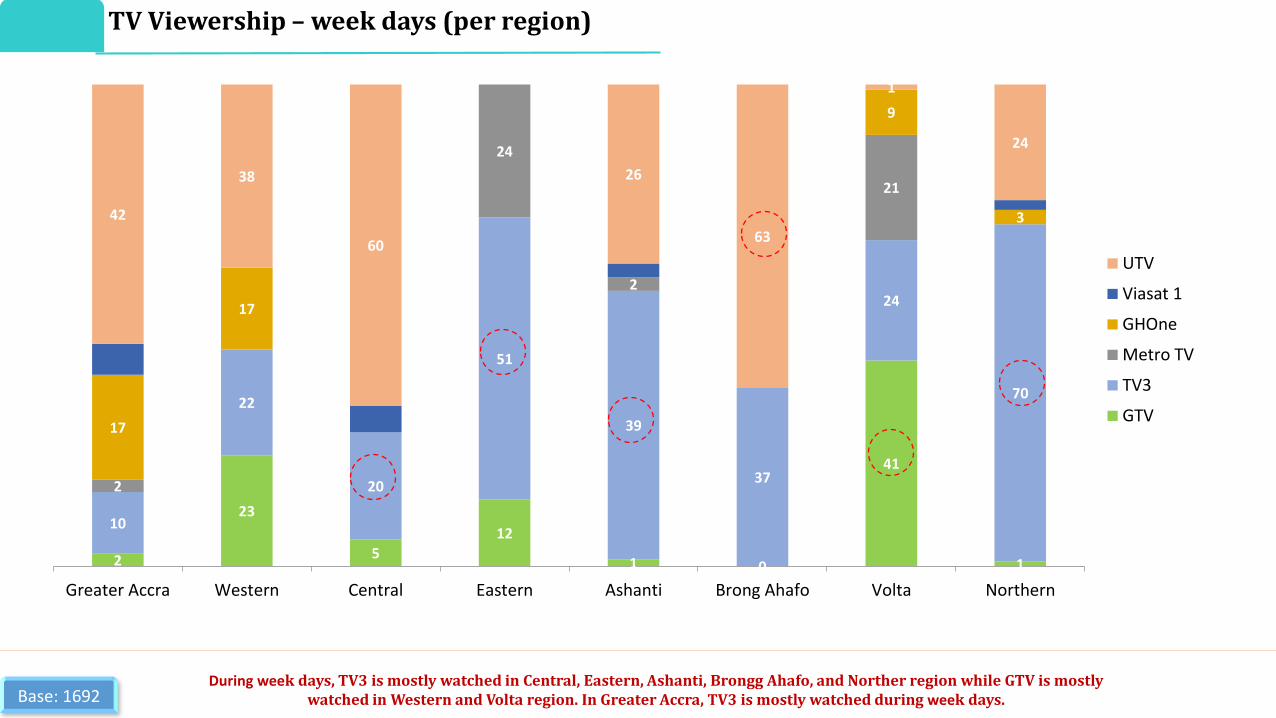
Base: 1692During week days, TV3 is mostly watched in Central, Eastern, Ashanti, Brongg Ahafo, and Norther region while GTV is mostly
watched in Western and Volta region. In Greater Accra, TV3 is mostly watched during week days.
TV Viewership – week days (per region)
1
23
6
3
1
45
1
26
25
32
54
38
41
23
69
2
4
16
1
18
8
17
2
9
3
8
2
5
2
1
2
37
29
38
36
55
1
25
Greater Accra
Western
Central
Eastern
Ashanti
Brong Ahafo
Volta
Northern
GTV
TV3
Metro TV
GHOne
Viasat 1
UTV
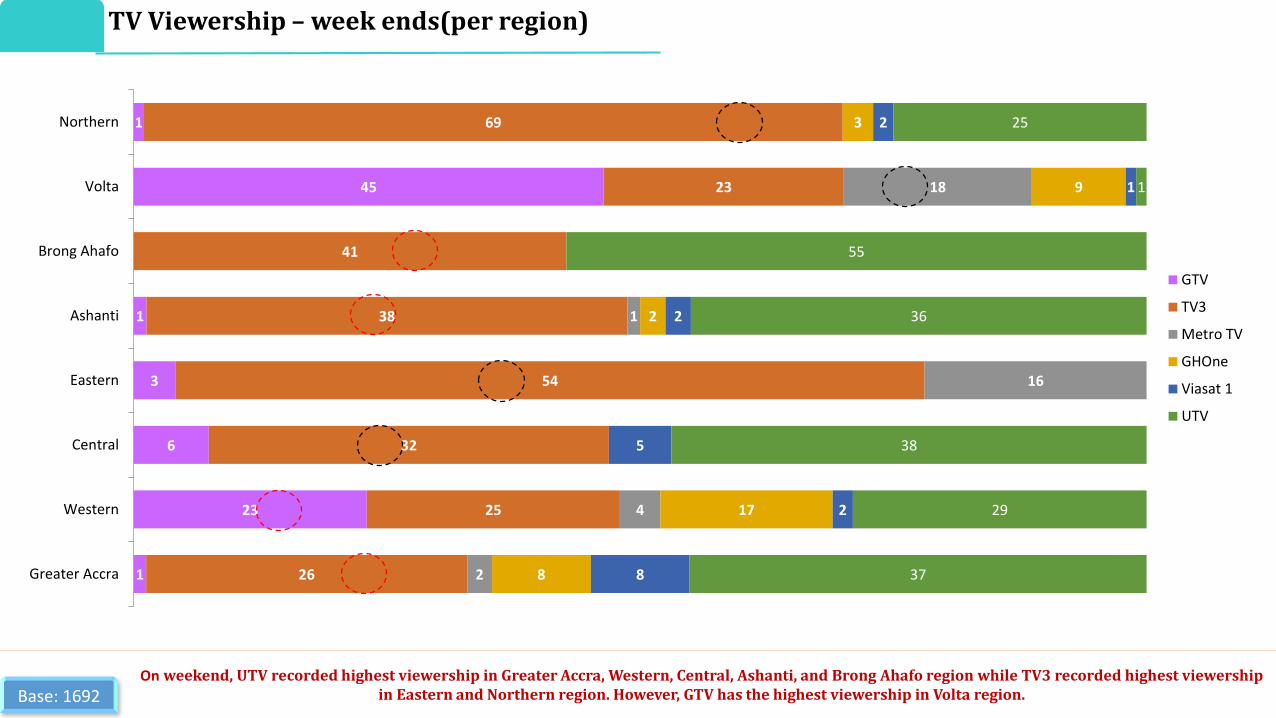
Base: 1692On weekend, UTV recorded highest viewership in Greater Accra, Western, Central, Ashanti, and Brong Ahafo region while TV3 recorded highest viewership
in Eastern and Northern region. However, GTV has the highest viewership in Volta region.
TV Viewership – week ends(per region)

Good line up / organisation ofprograms
crystal clear vision/ good qualityreception
show nice entertainingprograms
Show nice interesting programs Their news broacst is detailed,both local and foreign
Good sports program/show
AB C1C2 DE
Base: 1461
Reasons for TV Viewership – Value Band

1
2
3
3
8
10
98
Others
Recreation centre
School
Viewing centre
Friends/relation house
At work
At home
62
38
Yes No
Influenced by advert
Base: 1692Nearly all respondents watched TV at home while more than half of the respondents asserted that they have been influenced by a TV advert to make
informed purchase.
1
4
5
5
16
69
Others specify
I dont watch/walkout/leave to do other
things
I don't pay attention tothe adverts
Though I watch, I feelunhappy/furious
I tune to other TV stationchannels
I sit back to watch theadvert with keen interest
Reaction to advert
Usual Places of watching TV and Reaction to advert
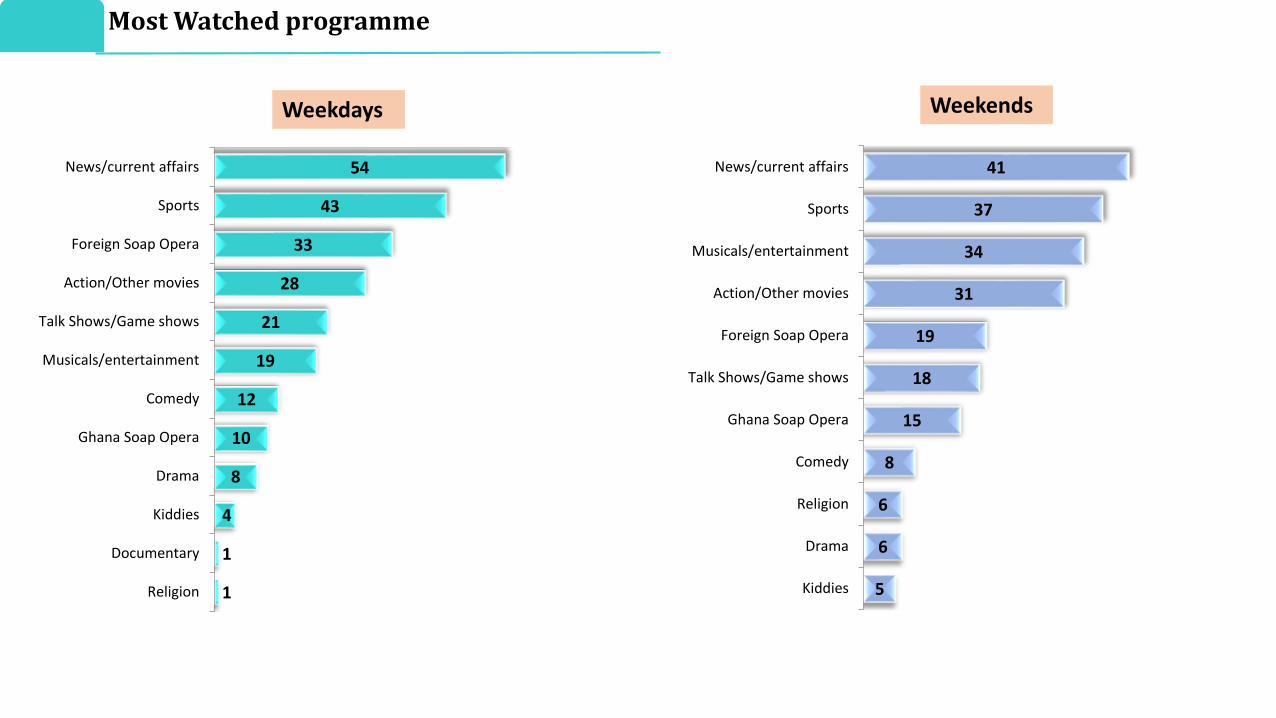
1
1
4
8
10
12
19
21
28
33
43
54
Religion
Documentary
Kiddies
Drama
Ghana Soap Opera
Comedy
Musicals/entertainment
Talk Shows/Game shows
Action/Other movies
Foreign Soap Opera
Sports
News/current affairs
Weekdays
5
6
6
8
15
18
19
31
34
37
41
Kiddies
Drama
Religion
Comedy
Ghana Soap Opera
Talk Shows/Game shows
Foreign Soap Opera
Action/Other movies
Musicals/entertainment
Sports
News/current affairs
Weekends
Most Watched programme
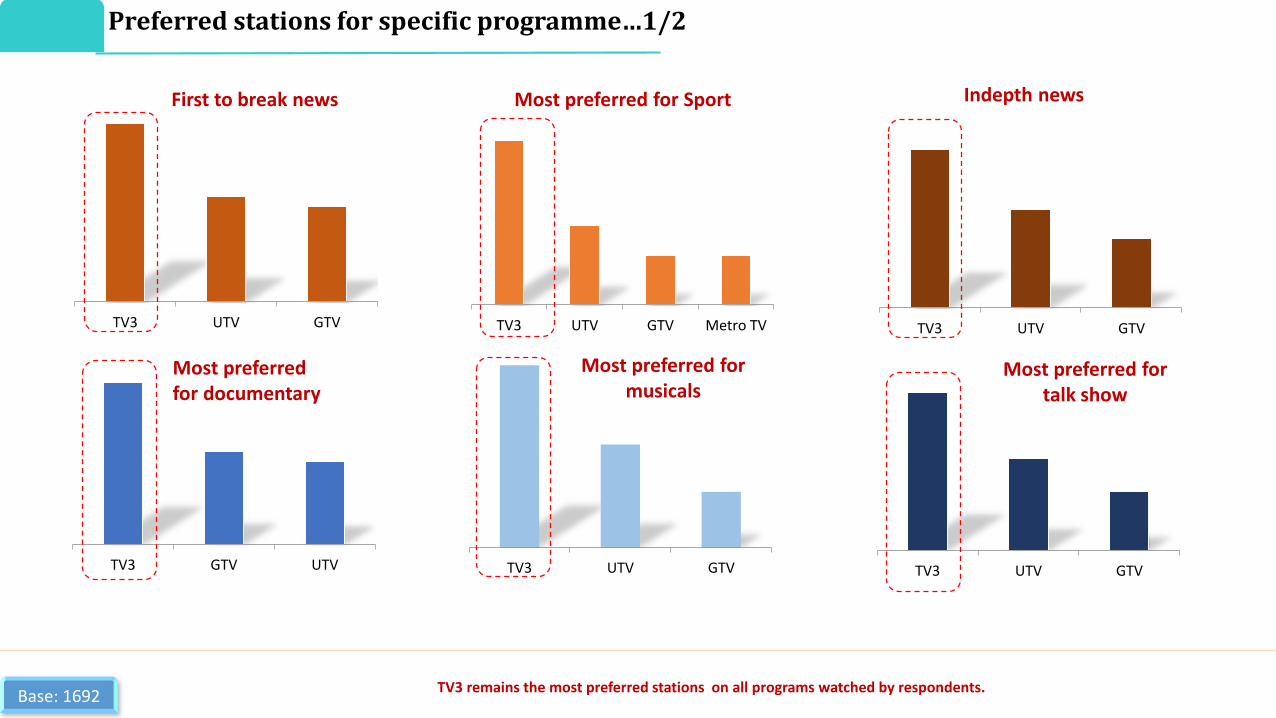
TV3 UTV GTV TV3 UTV GTV Metro TV TV3 UTV GTV
TV3 GTV UTV TV3 UTV GTV TV3 UTV GTV
First to break news Most preferred for Sport Indepth news
Most preferred for documentary
Most preferred for musicals
Most preferred for talk show
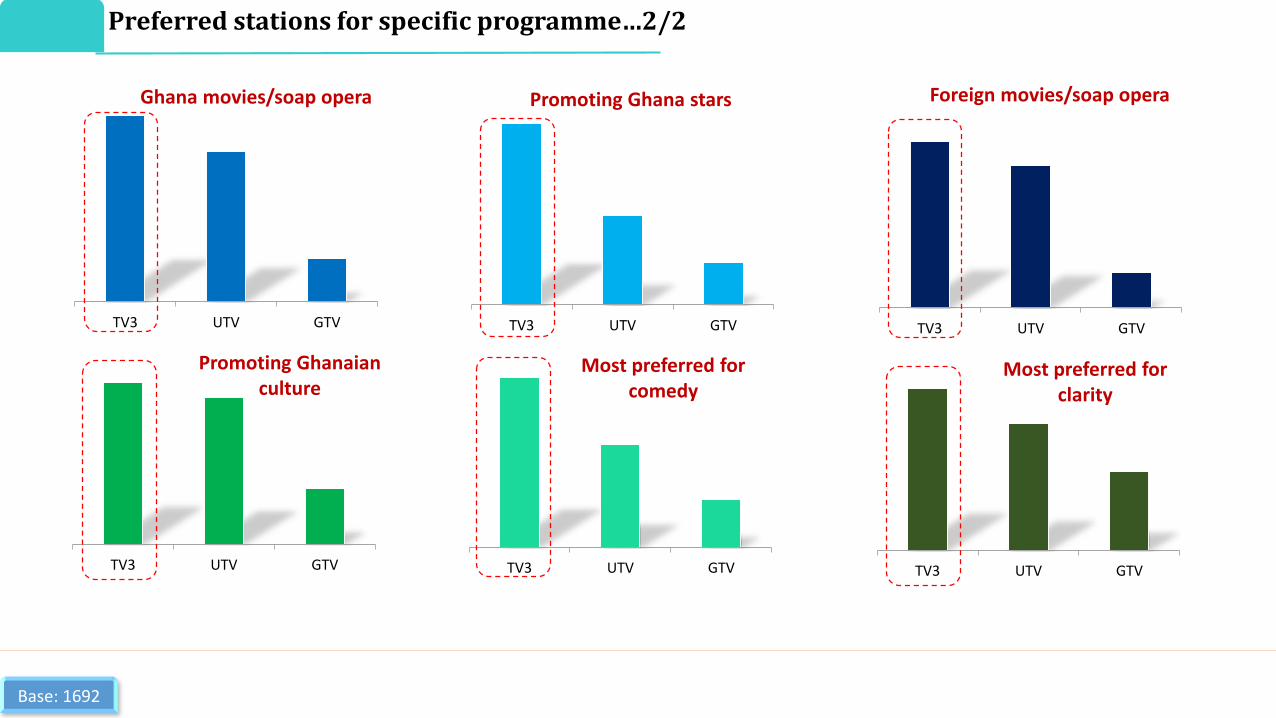
Base: 1692TV3 remains the most preferred stations on all programs watched by respondents.
Preferred stations for specific programme…1/2
TV3 UTV GTV TV3 UTV GTV TV3 UTV GTV
TV3 UTV GTV TV3 UTV GTV TV3 UTV GTV
Ghana movies/soap opera Promoting Ghana stars Foreign movies/soap opera
Promoting Ghanaian culture
Most preferred for comedy
Most preferred for clarity
Base: 1692
Preferred stations for specific programme…2/2

4.0
0-
5.0
0am
5.0
0-
6.0
0am
6.0
0-
7.0
0am
7.0
0-
8.0
0am
8.0
0-
9.0
0am
9.0
0-
10
.00
am
10
.00
-1
1.0
0am
11
.00
-1
2.0
0p
m
12
.00
-1
.00
pm
1.0
0-
2.0
0p
m
2.0
0-
3.0
0p
m
3.0
0-
4.0
0p
m
4.0
0-
5.0
0p
m
5.0
0-
6.0
0p
m
6.0
0-
7.0
0p
m
7.0
0-
8.0
0p
m
8.0
0-
9.0
0p
m
9.0
0-
10
.00
pm
10
.00
-1
1.0
0p
m
11
.00
pm
-1
2.0
0am
12
.00
am-
1.0
0am
1.0
0-
2.0
0am
2.0
0-
3.0
0am
3.0
0-
4.0
0am
Ad
om
fm
Atl
anti
s ra
dio
87.
9
Cit
i fm
97.
3
Hit
z fm
10
3.9
Joy
fm 9
9.7
Mo
nti
e fm
10
0.1
Oka
y fm
101
.7
Pea
ce f
m 1
04
.3
Rad
io g
old
90.
5
Swee
t m
elo
die
s 9
4.3
X f
m 9
5.1
X
Y fm
107
.9
Kas
apa
FM 1
02
.3 A
ccra
Cla
ss/A
din
kra
FM 9
1.3
Ote
c fm
102
.9 A
shan
ti…
Y fm
102
.5
New
mer
cury
91
.5
K f
m 1
03.7
Hel
lo f
m 1
01.
5
An
gel f
m 9
6.1
Bo
ss f
m 9
3.7
Gar
den
city
92.
1
Spir
it f
m 8
8.3
Twin
city
94
.7 (
Wes
tern
…
Bea
ch f
m 1
05.
5
Go
od
new
s fm
96.
3
Skyy
po
wer
93
.5
Ad
om
fm
Y f
m 9
7.9
Ark
fm
107
.1
Rad
io b
ar 9
3.5
Met
ro f
m
Ad
epa
fm
Rad
io s
avan
nah
91.
2
Zaa
fm
Eagl
e fm
87.
7
Ah
om
ka f
m 9
9.5
Atl
fm
100
.5
Live
fm
10
7.5
Vo
lta
pre
mie
r fm
98
.1
Kek
eli
rad
io 1
02.9
Tosh
fm
10
3.9
Lorl
orn
yo f
m 9
3.3
Po
ly f
m 8
7.7
Ago
o
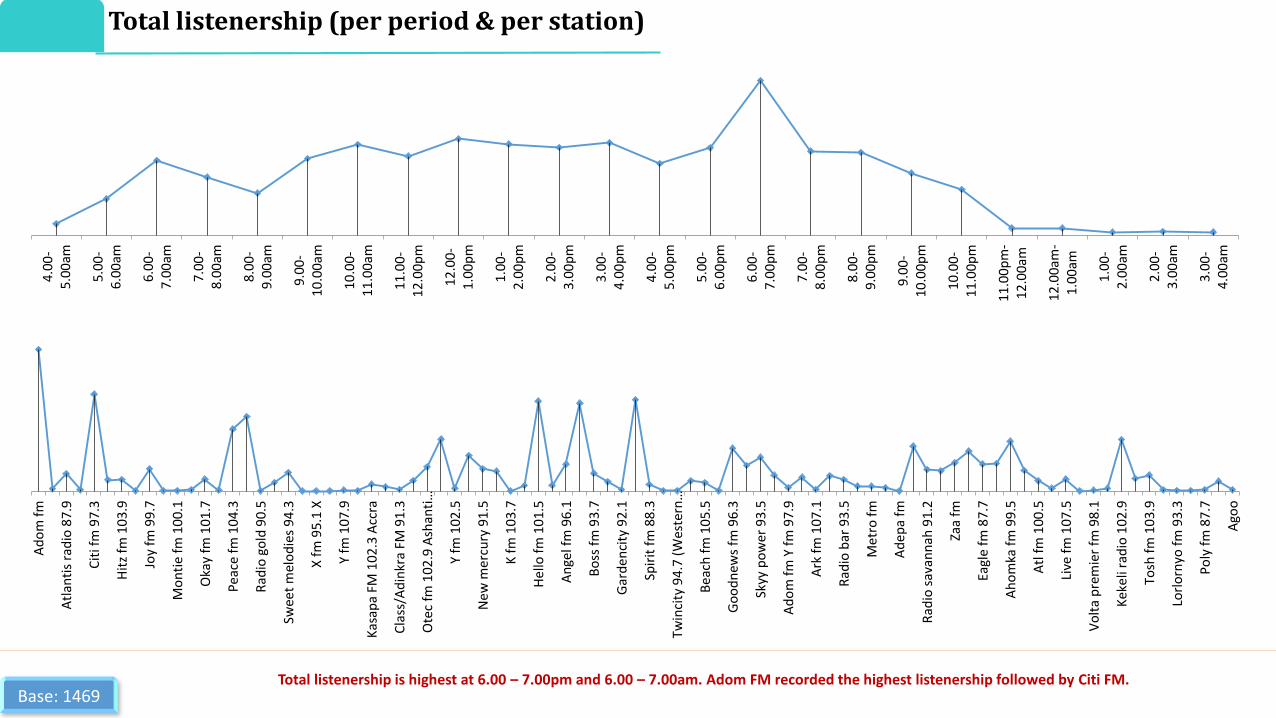
Base: 1469Total listenership is highest at 6.00 – 7.00pm and 6.00 – 7.00am. Adom FM recorded the highest listenership followed by Citi FM.
Total listenership (per period & per station)

4.0
0-
5.0
0am
5.0
0-
6.0
0am
6.0
0-
7.0
0am
7.0
0-
8.0
0am
8.0
0-
9.0
0am
9.0
0-
10
.00
am
10
.00
-1
1.0
0am
11
.00
-1
2.0
0p
m
12
.00
-1
.00
pm
1.0
0-
2.0
0p
m
2.0
0-
3.0
0p
m
3.0
0-
4.0
0p
m
4.0
0-
5.0
0p
m
5.0
0-
6.0
0p
m
6.0
0-
7.0
0p
m
7.0
0-
8.0
0p
m
8.0
0-
9.0
0p
m
9.0
0-
10
.00
pm
10
.00
-1
1.0
0p
m
11
.00
pm
-1
2.0
0am
12
.00
am-
1.0
0am
1.0
0-
2.0
0am
2.0
0-
3.0
0am
3.0
0-
4.0
0am
Ad
om
fm
Atl
anti
s ra
dio
87
.9
Cit
i fm
97.
3
Hit
z fm
10
3.9
Joy
fm 9
9.7
Mo
nti
e fm
10
0.1
Oka
y fm
101
.7
Pea
ce f
m 1
04.
3
Rad
io g
old
90
.5
Swee
t m
elo
die
s 9
4.3
Nea
t fm
10
0.9
Vis
ion
On
e FM
93
.5…
Nh
yira
fm
10
4.5
Fox
fm 9
7.9
Do
ve f
m 8
9.5
Ligh
t fm
94
.9
Luv
fm 9
9.5
Kes
sben
fm
93.
3
Met
ro f
m 9
4.1
Ash
h f
m 1
01.
1
Ase
da
fm 1
05.9
Go
od
new
s fm
96.
3
Skyy
po
wer
93
.5
Ad
om
fm
Y f
m 9
7.9
Sky
fm 9
6.7
Met
ro f
m
Rad
io s
avan
nah
91
.2
Zaa
fm
Eagl
e fm
87.
7
Ah
om
ka f
m 9
9.5
Atl
fm
100
.5
Vo
lta
pre
mie
r fm
98
.1
Kek
eli
rad
io 1
02.9
Tosh
fm
10
3.9
Go
od
life
fm
Base: 1469Total listenership is highest at 6.00 – 7.00pm and 6.00 – 7.00am. Adom FM recorded the highest listenership followed by Citi FM.
Total listenership (per period & per station) absolute

Base: 1263
In Accra, Peace FM lead the market followed by Adom FM. In Western region, Sky power is the market leader while Ahomka FM leads in Central region. In Eastern region, Goodlife FM led the market.
Ad
om
fm
Pea
ce f
m 1
04
.3
Oka
y fm
10
1.7
Cit
i fm
97
.3
Ase
mp
a fm
94
.7
Sun
ny
fm 8
8.7
Hap
py
fm 9
8.9
Joy
fm 9
9.7
Om
an f
m 1
07
.1
Hit
z fm
10
3.9
Ho
t fm
93
.9
90 8983 81
73 73 71 71 71 70 70
Skyy
po
wer
93
.5
Go
od
new
s fm
96
.3
Ase
da
fm 1
05
.9
Ro
k fm
98
.7
Hel
p f
m 1
03
.9
Spic
e fm
91
.9
Bea
ch f
m 1
05
.5
Par
ago
n f
m 9
9.9
Mel
od
y fm
91
.1
71 68 6661
5444
33 30 27
Ah
om
ka f
m 9
9.5
Rad
io C
entr
al9
2.5
Yes
fm 1
02.
9
Eagl
e fm
87.
7
Som
pa
fm 9
0.9
(Cen
tral
reg
ion
)
Atl
fm
10
0.5
Cap
e fm
93
.3
Live
fm
107
.5
Pin
k fm
96
.9
100 96 95 94 9387 86 82
16
Go
od
life
fm
Emak
fm
97
.7
Oth
ers
1
Sun
ris
e fm
Po
ly f
m 8
7.7
Ago
o
Ob
ou
ba
fm 9
1.7
1
East
ern
fm
10
5.1
(Eas
tern
reg
ion
)
8677
7159
3729
24 22
Accra Western
Central Eastern
Radio stations coverage/reception by region…1/2
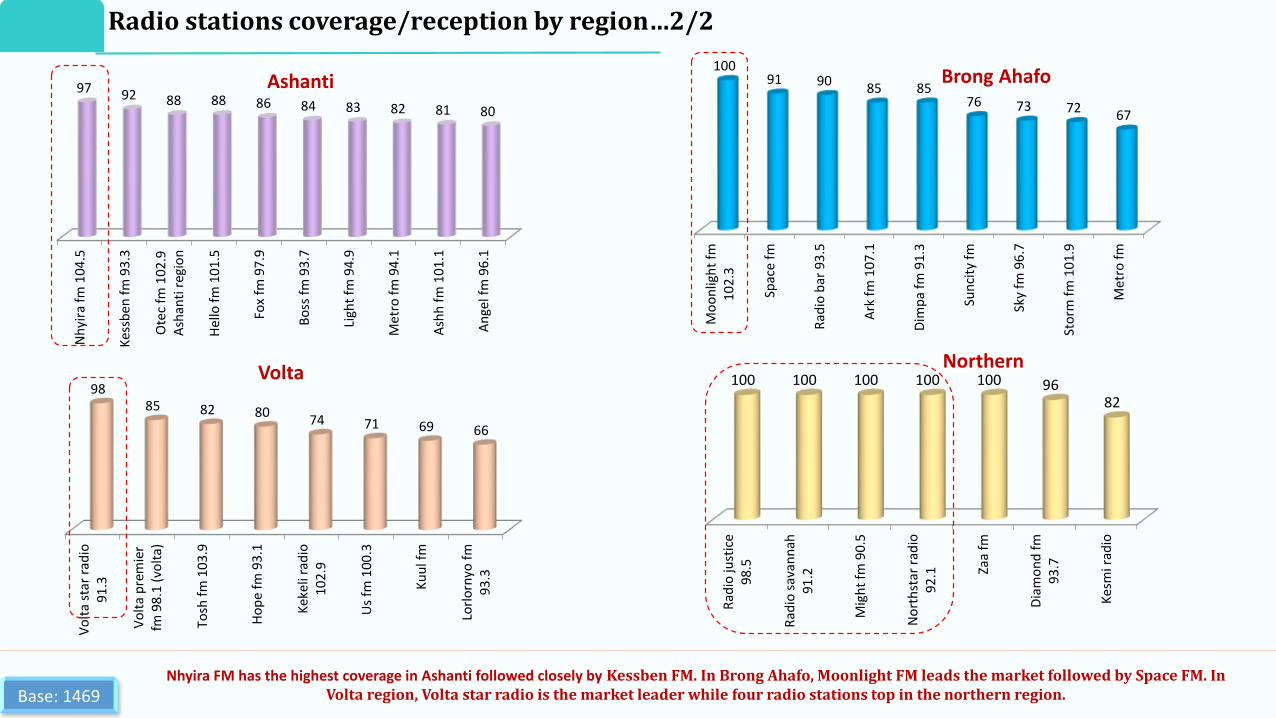
Base: 1469Nhyira FM has the highest coverage in Ashanti followed closely by Kessben FM. In Brong Ahafo, Moonlight FM leads the market followed by Space FM. In
Volta region, Volta star radio is the market leader while four radio stations top in the northern region.
Nh
yira
fm
10
4.5
Kes
sben
fm
93
.3
Ote
c fm
10
2.9
Ash
anti
reg
ion
Hel
lo f
m 1
01
.5
Fox
fm 9
7.9
Bo
ss f
m 9
3.7
Ligh
t fm
94
.9
Met
ro f
m 9
4.1
Ash
h f
m 1
01
.1
An
gel f
m 9
6.1
97 92 88 88 86 84 83 82 81 80
Mo
on
ligh
t fm
10
2.3
Spac
e fm
Rad
io b
ar 9
3.5
Ark
fm
10
7.1
Dim
pa
fm 9
1.3
Sun
city
fm
Sky
fm 9
6.7
Sto
rm f
m 1
01
.9
Met
ro f
m
10091 90
85 8576 73 72
67
Vo
lta
star
rad
io91
.3
Vo
lta
pre
mie
rfm
98
.1 (
volt
a)
Tosh
fm
10
3.9
Ho
pe
fm 9
3.1
Kek
eli
rad
io1
02
.9
Us
fm 1
00
.3
Ku
ul f
m
Lorl
orn
yo f
m93
.3
9885 82 80
74 71 69 66
Rad
io ju
stic
e9
8.5
Rad
io s
avan
nah
91.2
Mig
ht
fm 9
0.5
No
rth
star
rad
io9
2.1 Za
a fm
Dia
mo
nd
fm
93.7
Kes
mi r
adio
100 100 100 100 100 9682
Ashanti Brong Ahafo
VoltaNorthern
Radio stations coverage/reception by region…2/2

Base: 1469
There is a significant difference between radio stations received by high, middle, and low value respondents. For high value, they are endeared to Peace FM, Citi FM, Adom FM and Okay FM; medium value respondents are endeared to Nhyria FM; while low value respondents are endeared to six stations as shown above.
X fm 95.1
Uniiq fm 95.7
Joy fm 99.7
Prime fm 89.1
Radio gold 90.5
Sena radio 104.7 now atinka fm
Sweet melodies 94.3
Atlantis radio 87.9
Choice fm 102.3
Hitz fm 103.9
Hot fm 93.9
Asempa fm 94.7
Happy fm 98.9
Oman fm 107.1
Sunny fm 88.7
Okay fm 101.7
Adom fm
Citi fm 97.3
Peace fm 104.3
33
35
38
38
38
38
39
41
41
41
41
42
42
42
45
46
49
49
49
High Value Band
Y fm 102.5
K fm 103.7
Kapital fm 97.1
Dove fm 89.5
Luv fm 99.5
Radio bar 93.5
Space fm
New mercury 91.5
Angel fm 96.1
Ashh fm 101.1
Moonlight fm 102.3
Fox fm 97.9
Light fm 94.9
Boss fm 93.7
Metro fm 94.1
Otec fm 102.9 Ashanti region
Hello fm 101.5
Kessben fm 93.3
Nhyira fm 104.5
17
17
17
18
18
18
18
19
19
19
19
20
20
20
20
21
21
22
23
Medium Value Band
Light fm 94.9
Boss fm 93.7
New mercury 91.5
Luv fm 99.5
Angel fm 96.1
Ashh fm 101.1
Otec fm 102.9 Ashanti region
Dove fm 89.5
Fox fm 97.9
Hello fm 101.5
Kessben fm 93.3
Nhyira fm 104.5
Kesmi radio
Diamond fm 93.7
Radio justice 98.5
Radio savannah 91.2
Might fm 90.5
Northstar radio 92.1
Zaa fm
16
16
17
17
17
17
18
18
19
19
20
22
39
43
44
44
44
44
44
Low Value Band
Radio stations coverage/reception by social clas

86
41 38 3727
22 22 2
Goodlifefm
Emak fm97.7
Sun rise fm Poly fm87.7
Others 1 Eastern fm105.1
(Easternregion)
Agoo Obouba fm91.71
81 77 7769 64 62 59 56
Sompafm 90.9(Centralregion)
RadioCentral
92.5
Ahomkafm 99.5
Yes fm102.9
Cape fm93.3
Eagle fm87.7
Atl fm100.5
Live fm107.5
45
33 32
22 2116 15 15
Skyypower93.5
Goodnewsfm 96.3
Spice fm91.9
Rok fm98.7
Twincity94.7
(Westernregion)
Melodyfm 91.1
Help fm103.9
Radiosilver 92.3
Base: 1469
72
4942
3831
21 19 19 18
Adomfm
Peacefm 104.3
Happyfm 98.9
Citi fm97.3
Starr fm103.5
Joy fm99.7
Atlantisradio87.9
Okay fm101.7
AccraFM
100.5Accra
Accra Western
CentralEastern
Reach of Radio Stations: (Using the listened to most often responses…1/2)

Base: 1469
7769 65
56 55 55 52 5145
Nhyirafm 104.5
Kessbenfm 93.3
Hello fm101.5
Fox fm97.9
Otec fm102.9
Ashantiregion
Boss fm93.7
Ashh fm101.1
Light fm94.9
Dove fm89.5
AshantiBrong Ahafo
Volta Northern
90 89 8883
75 74 71 70
Moonlightfm 102.3
Space fm Radio bar93.5
Ark fm107.1
Dimpa fm91.3
Suncity fm Sky fm96.7
Storm fm101.9
42
28 28
19
Kekeli radio 102.9 Volta star radio 91.3 Tosh fm 103.9 Hope fm 93.1
3230 29
9
Zaa fm Radio justice 98.5 Radio savannah91.2
Northstar radio92.1
Reach of Radio Stations: (Using the listened to most often responses…2/2)
10
14
14
14
14
19
22
25
27
36
Uniiq fm 95.7
Kasapa FM 102.3 Accra
Accra FM 100.5 Accra
Class/Adinkra FM 91.3 Accra
Vision One FM 93.5
Starr fm 103.5
Citi fm 97.3
Happy fm 98.9
Peace fm 104.3
Adom fm
Base: 1469
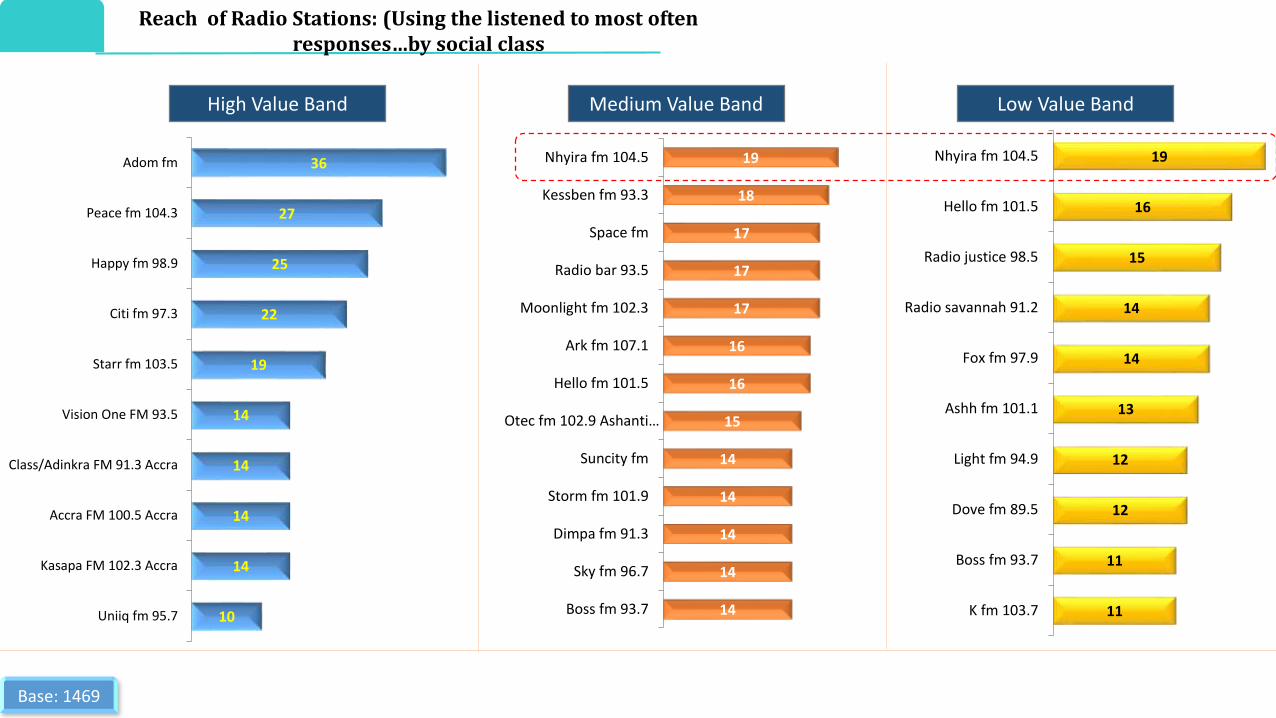
High Value Band Medium Value Band Low Value Band
14
14
14
14
14
15
16
16
17
17
17
18
19
Boss fm 93.7
Sky fm 96.7
Dimpa fm 91.3
Storm fm 101.9
Suncity fm
Otec fm 102.9 Ashanti…
Hello fm 101.5
Ark fm 107.1
Moonlight fm 102.3
Radio bar 93.5
Space fm
Kessben fm 93.3
Nhyira fm 104.5
11
11
12
12
13
14
14
15
16
19
K fm 103.7
Boss fm 93.7
Dove fm 89.5
Light fm 94.9
Ashh fm 101.1
Fox fm 97.9
Radio savannah 91.2
Radio justice 98.5
Hello fm 101.5
Nhyira fm 104.5
Reach of Radio Stations: (Using the listened to most often responses…by social class

1
3
4
9
29
44
82
Others
In own motor vehicle
Friends/relation house
School
In public motor vehicles (taxi, busetc)
At work
At home
2
4
4
7
8
11
22
42
11-12 hours
5-6 hours
7- 8 hours
More than 12 hours
9-10 hours
3-4 hours
Less than 1hr
1-2 hours
3
3
3
5
9
26
31
>15 mins
20 mins
50 mins
15 mins
40 mins
30mins
60 mins (1hr)
Switching spanHours spent listening to radioLocation
Base: 1469 A sizeable proportion of respondents listen to radio at home for at least 1 – 2 hours daily. The earlier they switched from one radio station to another is 30 minutes.
Respondent’s listening behavior

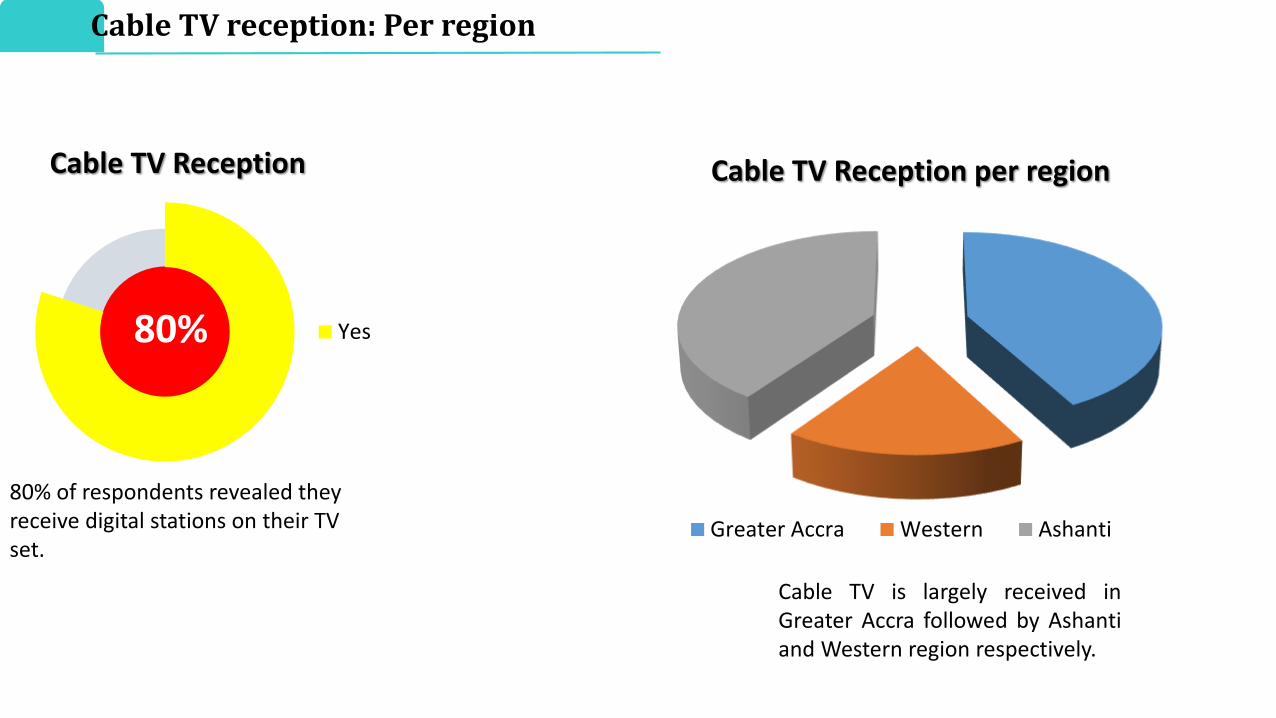
Yes80%
Cable TV Reception
80% of respondents revealed they receive digital stations on their TV set.
Greater Accra Western Ashanti
Cable TV Reception per region
Cable TV is largely received inGreater Accra followed by Ashantiand Western region respectively.
Cable TV reception: Per region
4.0
0-
5.0
0am
5.0
0-
6.0
0am
6.0
0-
7.0
0am
7.0
0-
8.0
0am
8.0
0-
9.0
0am
9.0
0-
10
.00
am
10
.00
-1
1.0
0am
11
.00
-1
2.0
0p
m
12
.00
-1
.00
pm
1.0
0-
2.0
0p
m
2.0
0-
3.0
0p
m
3.0
0-
4.0
0p
m
4.0
0-
5.0
0p
m
5.0
0-
6.0
0p
m
6.0
0-
7.0
0p
m
7.0
0-
8.0
0p
m
8.0
0-
9.0
0p
m
9.0
0-
10
.00
pm
10
.00
-1
1.0
0p
m
11
.00
pm
-1
2.0
0am
12
.00
am-
1.0
0am
1.0
0-
2.0
0am
2.0
0-
3.0
0am
3.0
0-
4.0
0am
4sy
te T
V
Ad
om
TV
AG
OO
TV
AL-
Jaz
eera
An
gel T
V
BB
C (
TAG
GED
)
CA
PIT
AL
TV
Car
too
n N
etw
ork
Fam
ily T
V
Fire
TV
GB
C24
GTV
All
GTV
Go
vern
GTV
Lif
e
GTV
Sp
ort
s +
Ho
meb
ase
TV
Joy
Pri
me
Kan
tan
ka T
V
Ligh
t TV
Max
TV
Ob
on
u T
V
Oce
ans
TV
Pra
ise
TV
Smile
TV
TV7
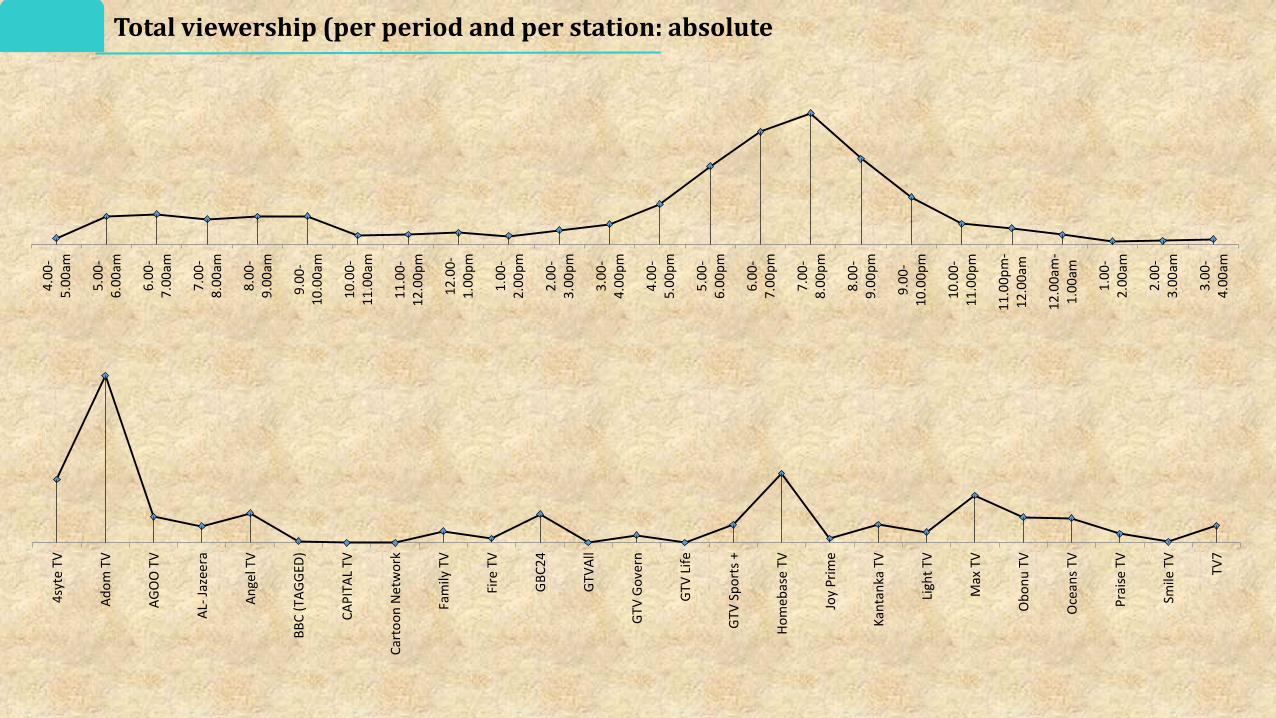
Total viewership (per period and per station: absolute

4syte TV Adom TV AGOO TV AL- Jazeera Angel TV BBC (TAGGED) CAPITAL TV
Cartoon Network Family TV Fire TV GBC24 GTVAll GTV Govern GTV Life
GTV Sports + Homebase TV Joy Prime Kantanka TV Light TV Max TV Obonu TV
Oceans TV Praise TV Smile TV TV7
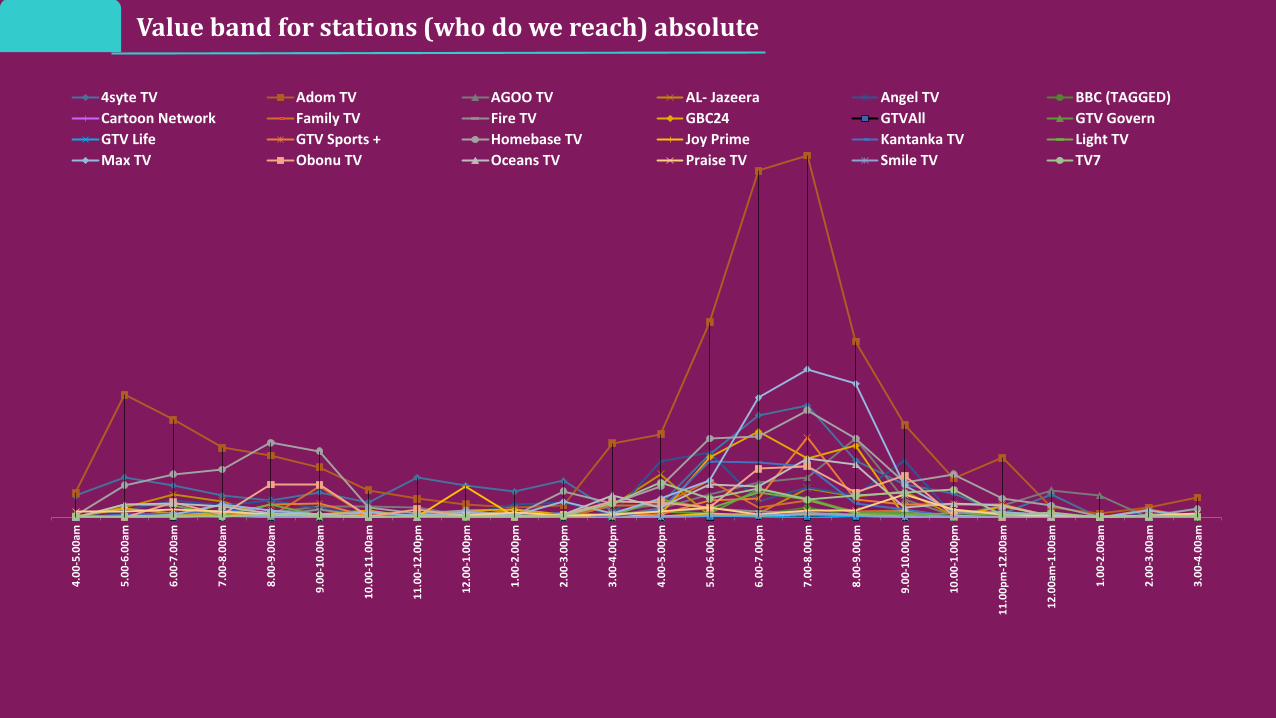
Value band for stations (who do we reach)
4.0
0-5
.00
am
5.0
0-6
.00
am
6.0
0-7
.00
am
7.0
0-8
.00
am
8.0
0-9
.00
am
9.0
0-1
0.0
0am
10
.00
-11
.00
am
11
.00
-12
.00
pm
12
.00
-1.0
0p
m
1.0
0-2
.00
pm
2.0
0-3
.00
pm
3.0
0-4
.00
pm
4.0
0-5
.00
pm
5.0
0-6
.00
pm
6.0
0-7
.00
pm
7.0
0-8
.00
pm
8.0
0-9
.00
pm
9.0
0-1
0.0
0p
m
10
.00
-1.0
0p
m
11
.00
pm
-12
.00
am
12
.00
am-1
.00
am
1.0
0-2
.00
am
2.0
0-3
.00
am
3.0
0-4
.00
am
4syte TV Adom TV AGOO TV AL- Jazeera Angel TV BBC (TAGGED)
Cartoon Network Family TV Fire TV GBC24 GTVAll GTV Govern
GTV Life GTV Sports + Homebase TV Joy Prime Kantanka TV Light TV
Max TV Obonu TV Oceans TV Praise TV Smile TV TV7
Value band for stations (who do we reach) absolute
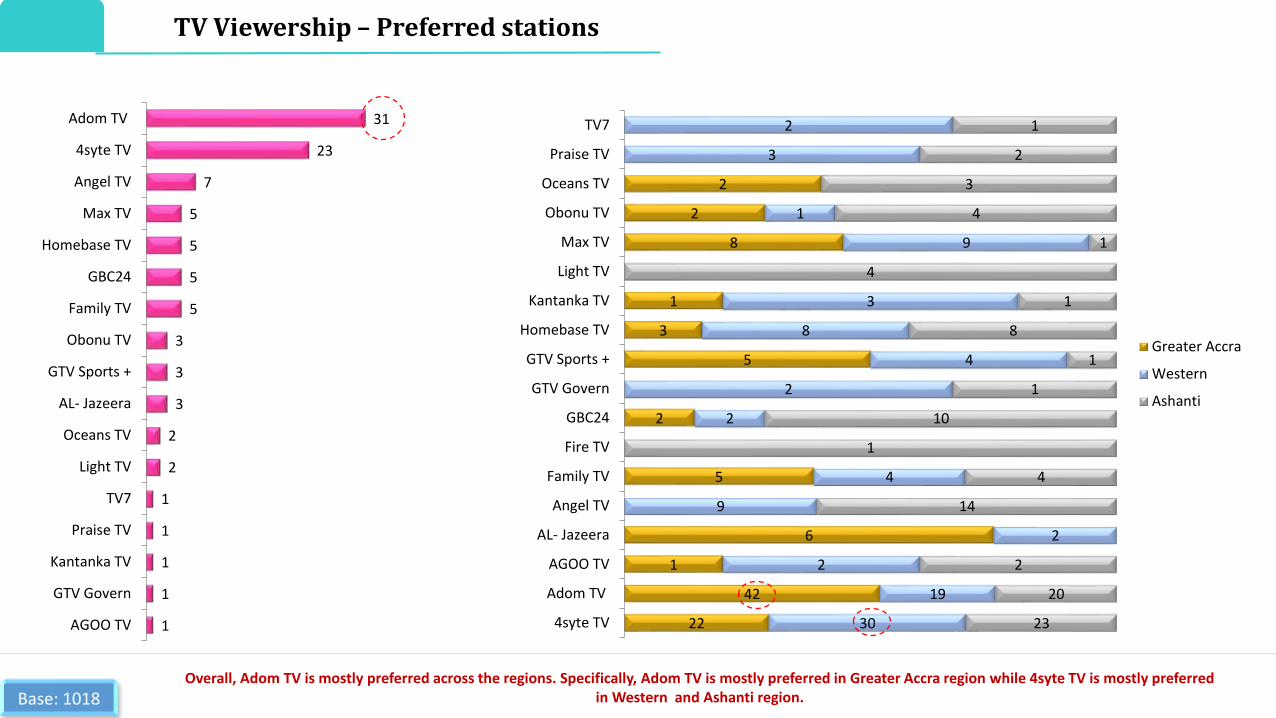
Base: 1018Overall, Adom TV is mostly preferred across the regions. Specifically, Adom TV is mostly preferred in Greater Accra region while 4syte TV is mostly preferred
in Western and Ashanti region.
1
1
1
1
1
2
2
3
3
3
5
5
5
5
7
23
31
AGOO TV
GTV Govern
Kantanka TV
Praise TV
TV7
Light TV
Oceans TV
AL- Jazeera
GTV Sports +
Obonu TV
Family TV
GBC24
Homebase TV
Max TV
Angel TV
4syte TV
Adom TV
22
42
1
6
5
2
5
3
1
8
2
2
30
19
2
2
9
4
2
2
4
8
3
9
1
3
2
23
20
2
14
4
1
10
1
1
8
1
4
1
4
3
2
1
4syte TV
Adom TV
AGOO TV
AL- Jazeera
Angel TV
Family TV
Fire TV
GBC24
GTV Govern
GTV Sports +
Homebase TV
Kantanka TV
Light TV
Max TV
Obonu TV
Oceans TV
Praise TV
TV7
Greater Accra
Western
Ashanti
TV Viewership – Preferred stations

73
82
63
40
31
21
27
15
37
15
18
11
29
32
37
33
18
14
11
46
34
46
20
4
15
52
64
34
12
30
8
2
7
24
9
23
5
14
6
10
43
5
23
28
34
36
26
18
6
15
40
75
40
37
41
11
13
9
32
15
22
4
8
4
11
28
6
17
17
25
30
30
20
12
16
4syte TV
Adom TV
AGOO TV
AL- Jazeera
Angel TV
BBC (TAGGED)
CAPITAL
Cartoon Network
Family TV
Fire TV
GBC24
GTVAll
GTV Govern
GTV Life
GTV Sports +
Homebase TV
Joy Prime
Kantanka TV
Light TV
Max TV
Obonu TV
Oceans TV
Praise TV
Smile TV
TV7
Greater Accra
Western
Ashanti
Base: 1018 In the past one month, Adom TV recorded the highest viewership in all the three regions
TV Viewership- Past one month (Per region)
5668
43 25
12
11
10
10
25
5
17
4
11
13
30
34
11
6 5
44
2736
13
1118
49
59
26
9
26
0
0
7
22
9
15
12
2
9
41
5
23 23
32
31 2318 4
15
26
6226
23 28
1
33
26 8 16 2
62 7
27
2
1411
22 2127
11
10
13
4sy
te T
V
Ad
om
TV
AG
OO
TV
AL-
Jaz
eera
An
gel T
V
BB
C (
TAG
GED
)
CA
PIT
AL
Car
too
n N
etw
ork
Fam
ily T
V
Fire
TV
GB
C2
4
GTV
All
GTV
Go
vern
GTV
Lif
e
GTV
Sp
ort
s +
Ho
me
bas
e TV
Joy
Pri
me
Kan
tan
ka T
V
Ligh
t TV
Max
TV
Ob
on
u T
V
Oce
ans
TV
Pra
ise
TV
Smile
TV
TV7
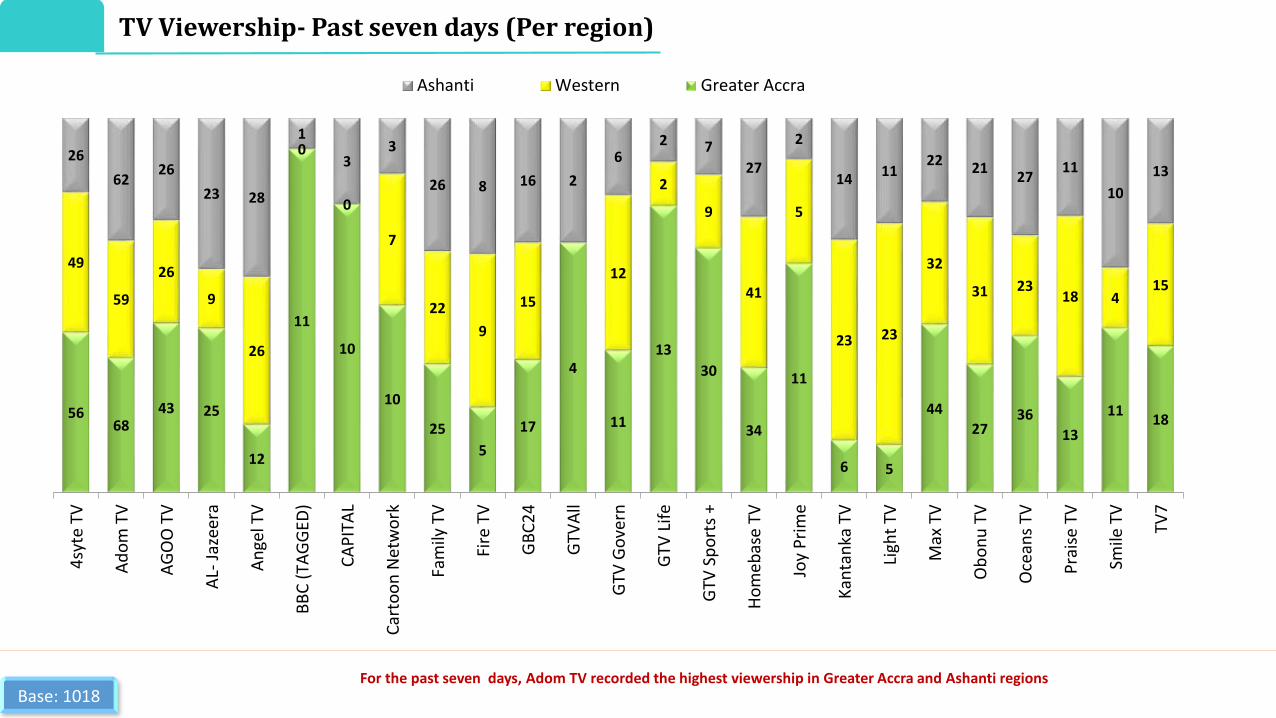
Ashanti Western Greater Accra
Base: 1018For the past seven days, Adom TV recorded the highest viewership in Greater Accra and Ashanti regions
TV Viewership- Past seven days (Per region)

4syte TV
AGOO TV
Angel TV
Family TV
GBC24
GTV Life
Homebase TV
Kantanka TV
Max TV
Oceans TV
Smile TV
56
69
22
13
21
3
8
2
10
4
1
39
19
2
4
1
44
8
30
12
16
24
33
42
15
2
20
2
7
6
5
3
8
31
3
15
11
14
17
11
13
2
9
22
49
7
10
31
2
16
7
14
3
1
12
20
3
12
9
19
18
24
11
12
15
Greater Accra
Western
Ashanti
Base: 1018
TV Viewership- Watched yesterday

39
13
1
4
1
6
0
4
1
1
10
1
13
3
14
24
8
1
6
5
2
2
3
1
8
3
2
9
4
1
1
5
14
28
3
8
5
8
2
2
1
1
9
1
2
2
5
5
2
1
2
4syte TV
Adom TV
AGOO TV
AL- Jazeera
Angel TV
Family TV
Fire TV
GBC24
GTV Govern
GTV Sports +
Homebase TV
Kantanka TV
Light TV
Max TV
Obonu TV
Oceans TV
Praise TV
Smile TV
TV7
Greater Accra
Western
Ashanti
Base: 1018
TV Viewership- Week days (Per region)

21
10
3
3
2
2
3
4
8
9
4
23
2
3
2
11
22
6
4
1
4
5
1
4
14
9
3
8
2
3
1
1
2
10
32
3
3
8
1
10
1
1
8
2
4
3
4
3
2
3
4syte TV
Adom TV
AGOO TV
AL- Jazeera
Angel TV
Family TV
Fire TV
GBC24
GTV Govern
GTV Sports +
Homebase TV
Kantanka TV
Light TV
Max TV
Obonu TV
Oceans TV
Praise TV
Smile TV
TV7
Greater Accra
Western
Ashanti
Base: 1018
TV Viewership- Weekends (Per region)