in situ structure and dynamics of dna origami determined ... · in situ structure and dynamics of...
TRANSCRIPT
In situ structure and dynamics of DNA origamidetermined through molecular dynamics simulationsJejoong Yooa and Aleksei Aksimentieva,b,1
aDepartment of Physics and Center for the Physics of Living Cells and bBeckman Institute for Advanced Science and Technology, University of Illinois atUrbana-Champaign, Urbana, IL 61801
Edited by Michael L. Klein, Temple University, Philadelphia, PA, and approved November 4, 2013 (received for review September 3, 2013)
The DNA origami method permits folding of long single-strandedDNA into complex 3D structures with subnanometer precision.Transmission electron microscopy, atomic force microscopy, andrecently cryo-EM tomography have been used to characterize theproperties of such DNA origami objects, however their microscopicstructures and dynamics have remained unknown. Here, we reportthe results of all-atom molecular dynamics simulations that charac-terized the structural and mechanical properties of DNA origamiobjects in unprecedented microscopic detail. When simulated in anaqueous environment, the structures of DNA origami objects departfrom their idealized targets as a result of steric, electrostatic, andsolvent-mediated forces. Whereas the global structural features ofsuch relaxed conformations conform to the target designs, local defor-mations are abundant and vary in magnitude along the structures. Incontrast to their free-solution conformation, the Holliday junctions inthe DNA origami structures adopt a left-handed antiparallel confor-mation. We find the DNA origami structures undergo considerabletemporal fluctuations on both local and global scales. Analysis ofsuch structural fluctuations reveals the local mechanical properties ofthe DNA origami objects. The lattice type of the structures consid-erably affects global mechanical properties such as bending rigidity.Our study demonstrates the potential of all-atom molecular dynam-ics simulations to play a considerable role in future development ofthe DNA origami field by providing accurate, quantitative assess-ment of local and global structural and mechanical properties of DNAorigami objects.
nucleic acids | self-assembly | nanotechnology | nanopore
Self-assembly of DNA into complex 3D objects has emergedas a new paradigm for practical nanotechnology (1, 2). Among
many methods that have been put forward to use self-assembly ofDNA (2), DNA origami (3) stands out through its conceptualsimplicity and infinite range of possible applications (1, 2). Thebasic principle of the method is folding of a long (tens of thou-sands of nucleotides) DNA strand into custom 2D or 3D shapesusing short oligonucleotides (“staples”) (3). Since its first dem-onstration in 2006, the DNA origami method has been used toself-assemble complex 3D objects with subnanometer precision (4)that can serve as static structures (1, 2, 5, 6), and also performactive functions (7–10). Recent methodological advances (11)have made practical applications (11–14) of DNA origami feasible.Due to the intrinsic complexity of DNA origami, computa-
tional tools have been essential for the development of the field.In the seminal work, Rothemund used a custom computer codeto design sets of staple strands to fold the M13 viral genome intounique 2D patterns (3). Design of 3D origami has been facili-tated by the caDNAno program (15), which can semiautomaticallygenerate a set of staple strands to realize folding of the M13 ge-nome into a user-defined 3D object. The structural stability ofcaDNAno designs can be assessed using the CanDo (16) program,which provides instant review of the caDNAno outputs based on acontinuum mechanics approximation. However, the computationalmodels of DNA origami objects have not yet taken explicitly intoaccount the atomic-scale interactions that govern self-assembly ofDNA. As pairing of complementary DNA strands into a DNA
duplex is a balancing act involving electrostatic, hydrophobic, andsolvation forces (17), one can expect all-atom modeling to providethe most comprehensive description of DNA origami, especiallyunder environmental stress.Until recently, experimental characterization of DNA origami
was limited to atomic force spectroscopy (8), small-angle X-rayscattering (8), and transmission electron microscopy (4, 5). Re-cently, superresolution optical imaging (10), FRET (13), andmagnetic tweezer (18) have been applied to DNA origami objectsto infer information about their in situ structure and dynamics. Theonly atomic-level model of DNA origami in situ has been derivedfrom cryo–electron microscopy (cryo-EM) (19), which revealedconsiderable deviations of the in situ structure from the idealizeddesign. Despite the tremendous insights brought about by the cryo-EM structure, the structural dynamics and local mechanical prop-erties of DNA origami have remained unknown. Furthermore, thecomplexity of the cryo-EM reconstruction makes this method un-likely to be routinely used to characterize DNA origami objects.Here, we report all-atom molecular dynamics (MD) simu-
lations of DNA origami structures. By following trajectories ofall of the atoms comprising a DNA origami object and the sur-rounding solution, we could characterize their structure anddynamics in microscopic detail. Below, we describe the in situstructures of several DNA origami objects, their temporal fluc-tuations, the conformations of key structural elements, and localmechanical properties. While we find the global properties of thesimulated DNA origami objects to be in good agreement withexperimental measurements, our simulations reveal the in-trinsically dynamic nature of DNA origami objects.
Significance
Folding of DNA strands into complex three-dimensional nano-scale objects—DNA origami—has emerged as a new paradigmfor practical nanotechnology. Although computer-aided designtools are often used to illustrate the idealized shape of suchobjects, their structural behavior in solution has been poorlycharacterized. Using a large supercomputer system, we createdtrajectories of millions of atoms to obtain the first atomicallyprecise portrait of DNA origami in solution. The DNA origamiobjects were found to undergo considerable structural fluctua-tions, significantly departing from their idealized conformationsat the nanometer scale. Analysis of the fluctuations provideda detailed map of local mechanical properties of DNA origami.Our work demonstrates the potential for atomistic simulationsto facilitate rational engineering of DNA origami objects.
Author contributions: J.Y. and A.A. designed research; J.Y. performed research; J.Y. ana-lyzed data; and J.Y. and A.A. wrote the paper.
The authors declare no conflict of interest.
This article is a PNAS Direct Submission.1To whom correspondence should be addressed. E-mail: [email protected].
This article contains supporting information online at www.pnas.org/lookup/suppl/doi:10.1073/pnas.1316521110/-/DCSupplemental.
www.pnas.org/cgi/doi/10.1073/pnas.1316521110 PNAS | December 10, 2013 | vol. 110 | no. 50 | 20099–20104
BIOPH
YSICSAND
COMPU
TATIONALBIOLO
GY
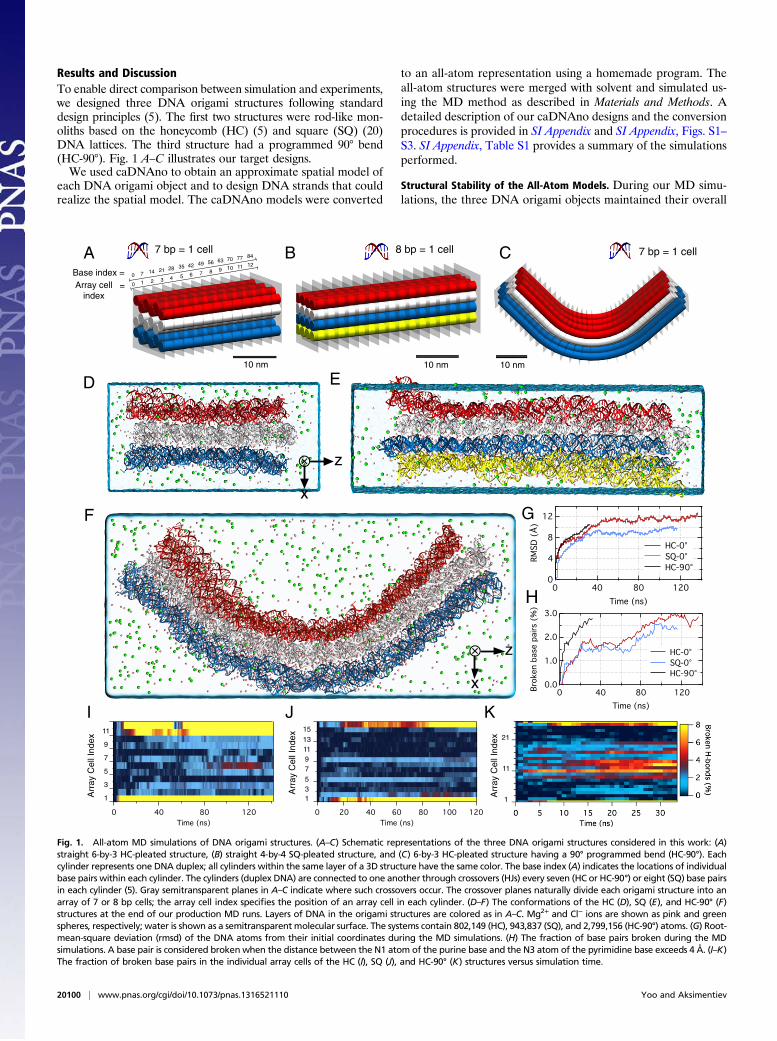
Results and DiscussionTo enable direct comparison between simulation and experiments,we designed three DNA origami structures following standarddesign principles (5). The first two structures were rod-like mon-oliths based on the honeycomb (HC) (5) and square (SQ) (20)DNA lattices. The third structure had a programmed 90° bend(HC-90°). Fig. 1 A–C illustrates our target designs.We used caDNAno to obtain an approximate spatial model of
each DNA origami object and to design DNA strands that couldrealize the spatial model. The caDNAno models were converted
to an all-atom representation using a homemade program. Theall-atom structures were merged with solvent and simulated us-ing the MD method as described in Materials and Methods. Adetailed description of our caDNAno designs and the conversionprocedures is provided in SI Appendix and SI Appendix, Figs. S1–S3. SI Appendix, Table S1 provides a summary of the simulationsperformed.
Structural Stability of the All-Atom Models. During our MD simu-lations, the three DNA origami objects maintained their overall
D E
F
z
x
I J K
Arr
ay C
ell I
ndex
Arr
ay C
ell I
ndex
Arr
ay C
ell I
ndex
7 bp = 1 cell
10 nm10 nm10 nm
1Array cell index
Base index =2 3 4 5 6 7 8 9 10
8 bp = 1 cell
11 12
0
7 14 21 28 35 42 49 56 63 70 77 84
0
A B C
z
x
7 bp = 1 cell
3.0
2.0
1.0
0.0Bro
ken
bas
e pai
rs (
%)
12080400
Time (ns)
12
8
4
012080400
Time (ns)
G
H
=
120100806040200Time (ns)
12080400Time (ns)
1
3
5
7
9
11
1
5
9
1315
11
3
7
1
11
21
Fig. 1. All-atom MD simulations of DNA origami structures. (A–C) Schematic representations of the three DNA origami structures considered in this work: (A)straight 6-by-3 HC-pleated structure, (B) straight 4-by-4 SQ-pleated structure, and (C) 6-by-3 HC-pleated structure having a 90° programmed bend (HC-90°). Eachcylinder represents one DNA duplex; all cylinders within the same layer of a 3D structure have the same color. The base index (A) indicates the locations of individualbase pairs within each cylinder. The cylinders (duplex DNA) are connected to one another through crossovers (HJs) every seven (HC or HC-90°) or eight (SQ) base pairsin each cylinder (5). Gray semitransparent planes in A–C indicate where such crossovers occur. The crossover planes naturally divide each origami structure into anarray of 7 or 8 bp cells; the array cell index specifies the position of an array cell in each cylinder. (D–F) The conformations of the HC (D), SQ (E), and HC-90° (F)structures at the end of our production MD runs. Layers of DNA in the origami structures are colored as in A–C. Mg2+ and Cl− ions are shown as pink and greenspheres, respectively; water is shown as a semitransparent molecular surface. The systems contain 802,149 (HC), 943,837 (SQ), and 2,799,156 (HC-90°) atoms. (G) Root-mean-square deviation (rmsd) of the DNA atoms from their initial coordinates during the MD simulations. (H) The fraction of base pairs broken during the MDsimulations. A base pair is considered brokenwhen the distance between the N1 atom of the purine base and the N3 atom of the pyrimidine base exceeds 4 Å. (I–K)The fraction of broken base pairs in the individual array cells of the HC (I), SQ (J), and HC-90° (K) structures versus simulation time.
20100 | www.pnas.org/cgi/doi/10.1073/pnas.1316521110 Yoo and Aksimentiev
shape. Fig. 1 A–F provides one-to-one comparisons of the targetdesigns and the instantaneous microscopic conformations of thethree objects observed at the end of our production runs. Fig. 1Gshows the root-mean-square deviation (rmsd) of the DNA atomsfrom their initial coordinates. The rmsd values increase initiallybut reach a plateau after ∼40 ns for the HC and SQ systems.Because of its excessively large size (∼3 million atoms), the HC-90° system was simulated for a considerably shorter time interval(∼35 ns). However, we expect the HC-90° system to have reachedan equilibrium conformation at the end of the production run asthe rmsd of the HC and SQ systems reached a plateau after 40 ns.Fig. 1H shows the fraction of broken base pairs during the MDruns. In all three systems, the fraction was observed to slowlyincrease with time, but remained less than 3%.During our production runs, the DNA origami objects main-
tained their straight (HC and SQ) and bent (HC-90°) con-formations (SI Appendix, Fig. S4 A and B). In the centralportions of the HC and SQ structures, the DNA helices werefound to closely follow their prescribed arrangement of an HC orSQ lattice (SI Appendix, Fig. S4 C and D). Consistent with ex-perimental estimations (5), the average interhelical distance inthe lattices was about 23–24 Å.Fig. 1 I–K characterizes the local structural integrity of the
DNA origami objects by showing how the fraction of broken basepairs in the individual array cells of the objects (defined in Fig. 1A–C) changes during our MD runs. Peripheral regions of theDNA origami objects were found to exhibit a considerablygreater fraction of broken base pairs (>5%) than the internalregions, where the fraction remained <2%.Overall, the local structure of the internal regions of the straight
DNA origami objects (HC and SQ) remained stable; the fractionof broken base pairs fluctuated around 1% (Fig. 1 I and J).However, our simulations of the HC and SQ systems indicate thatlarge reversible deformations of the local structure can occur onthe time scale of hundreds of nanoseconds. For example, thefraction of broken base pairs in array cell 6 of the HC structurereached 4–5% at ∼100 ns (Fig. 1I). Unlike peripheral regions ofthe DNA origami structures, the base pairs forming array cell 6were constrained by the surrounding duplex DNA, and therefore,the local structural defect could be repaired within the time scaleof our simulation (140 ns). Movies S1–S3 illustrate the dynamicsof base pairing at the single-nucleotide level for individual lay-ers of the HC structure. Among the six base pairs from the internalregions that remained broken for 10 ns or longer, five located at thenicks in duplex DNA.In the case of the HC-90° structure, the fraction of broken
base pairs within the programmed bend region (array cell index7–20) reached ∼1–8% after ∼15 ns (Fig. 1K). Although thenumber of insertions and deletions was designed to minimize thestructural stress introduced by the 90° bend, some stressesremained in the structure. Because helical turn per array cellshould be 240° regardless of insertions or deletions, one turn perbase pair can range from ∼27° (two insertions per cell) to 48°(two deletions per cell) in the bent region. Thus, the bend regioncould be expected to have a less ordered structure than frag-ments of straight DNA origami. Indeed, Sobczak et al. (11)reported difficulties with folding a seven-layer HC design havinga sharp programmed bend.SI Appendix, Fig. S5 characterizes the distributions of Mg2+ in
the HC system during the production simulation. The charges ofMg2+ ions completely neutralize the charge of DNA inside theorigami (SI Appendix, Fig. S5A). The ions are located, on aver-age, 5.4 Å away from the phosphorous atoms of the DNAbackbone (SI Appendix, Fig. S5B). The diffusion coefficients ofMg2+ inside HC and SQ structures are 0.15 and 0.12 10−5 cm2/s,respectively, which is considerably lower than 0.52 × 10⁻⁵ cm2/sthat we measured in 50 mM MgCl2 bulk solution.
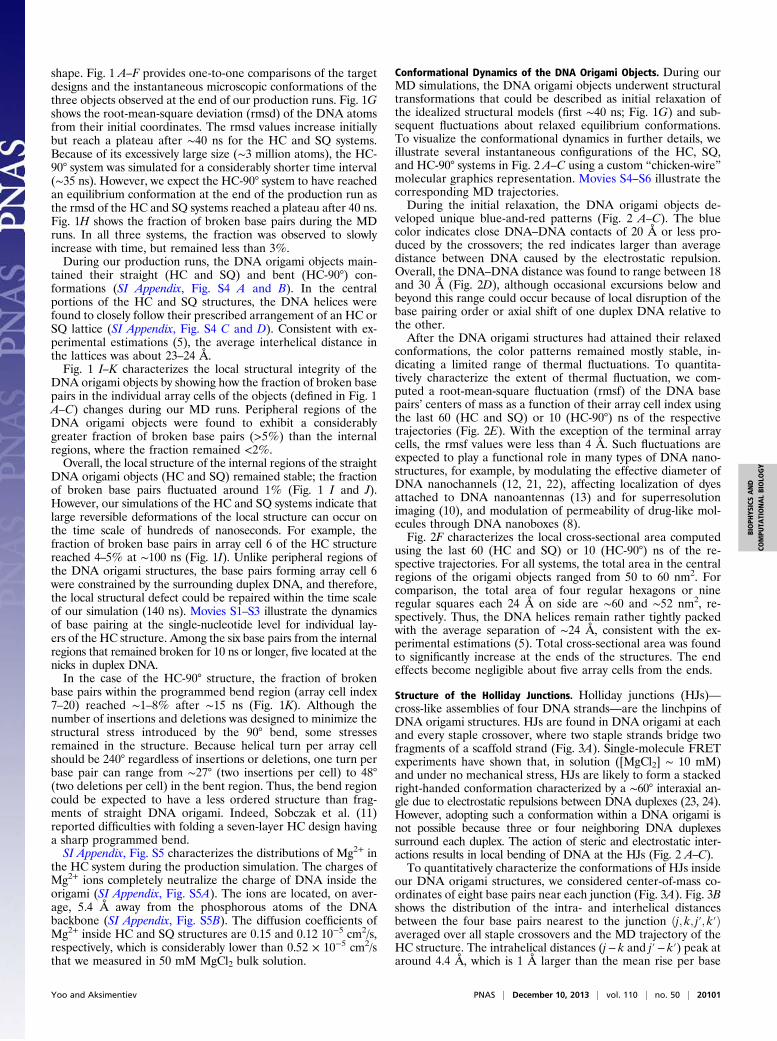
Conformational Dynamics of the DNA Origami Objects. During ourMD simulations, the DNA origami objects underwent structuraltransformations that could be described as initial relaxation ofthe idealized structural models (first ∼40 ns; Fig. 1G) and sub-sequent fluctuations about relaxed equilibrium conformations.To visualize the conformational dynamics in further details, weillustrate several instantaneous configurations of the HC, SQ,and HC-90° systems in Fig. 2 A–C using a custom “chicken-wire”molecular graphics representation. Movies S4–S6 illustrate thecorresponding MD trajectories.During the initial relaxation, the DNA origami objects de-
veloped unique blue-and-red patterns (Fig. 2 A–C). The bluecolor indicates close DNA–DNA contacts of 20 Å or less pro-duced by the crossovers; the red indicates larger than averagedistance between DNA caused by the electrostatic repulsion.Overall, the DNA–DNA distance was found to range between 18and 30 Å (Fig. 2D), although occasional excursions below andbeyond this range could occur because of local disruption of thebase pairing order or axial shift of one duplex DNA relative tothe other.After the DNA origami structures had attained their relaxed
conformations, the color patterns remained mostly stable, in-dicating a limited range of thermal fluctuations. To quantita-tively characterize the extent of thermal fluctuation, we com-puted a root-mean-square fluctuation (rmsf) of the DNA basepairs’ centers of mass as a function of their array cell index usingthe last 60 (HC and SQ) or 10 (HC-90°) ns of the respectivetrajectories (Fig. 2E). With the exception of the terminal arraycells, the rmsf values were less than 4 Å. Such fluctuations areexpected to play a functional role in many types of DNA nano-structures, for example, by modulating the effective diameter ofDNA nanochannels (12, 21, 22), affecting localization of dyesattached to DNA nanoantennas (13) and for superresolutionimaging (10), and modulation of permeability of drug-like mol-ecules through DNA nanoboxes (8).Fig. 2F characterizes the local cross-sectional area computed
using the last 60 (HC and SQ) or 10 (HC-90°) ns of the re-spective trajectories. For all systems, the total area in the centralregions of the origami objects ranged from 50 to 60 nm2. Forcomparison, the total area of four regular hexagons or nineregular squares each 24 Å on side are ∼60 and ∼52 nm2, re-spectively. Thus, the DNA helices remain rather tightly packedwith the average separation of ∼24 Å, consistent with the ex-perimental estimations (5). Total cross-sectional area was foundto significantly increase at the ends of the structures. The endeffects become negligible about five array cells from the ends.
Structure of the Holliday Junctions. Holliday junctions (HJs)—cross-like assemblies of four DNA strands—are the linchpins ofDNA origami structures. HJs are found in DNA origami at eachand every staple crossover, where two staple strands bridge twofragments of a scaffold strand (Fig. 3A). Single-molecule FRETexperiments have shown that, in solution ([MgCl2] ∼ 10 mM)and under no mechanical stress, HJs are likely to form a stackedright-handed conformation characterized by a ∼60° interaxial an-gle due to electrostatic repulsions between DNA duplexes (23, 24).However, adopting such a conformation within a DNA origami isnot possible because three or four neighboring DNA duplexessurround each duplex. The action of steric and electrostatic inter-actions results in local bending of DNA at the HJs (Fig. 2 A–C).To quantitatively characterize the conformations of HJs inside
our DNA origami structures, we considered center-of-mass co-ordinates of eight base pairs near each junction (Fig. 3A). Fig. 3Bshows the distribution of the intra- and interhelical distancesbetween the four base pairs nearest to the junction ðj; k; j′; k′Þaveraged over all staple crossovers and the MD trajectory of theHC structure. The intrahelical distances (j− k and j′− k′) peak ataround 4.4 Å, which is 1 Å larger than the mean rise per base
Yoo and Aksimentiev PNAS | December 10, 2013 | vol. 110 | no. 50 | 20101
BIOPH
YSICSAND
COMPU
TATIONALBIOLO
GY
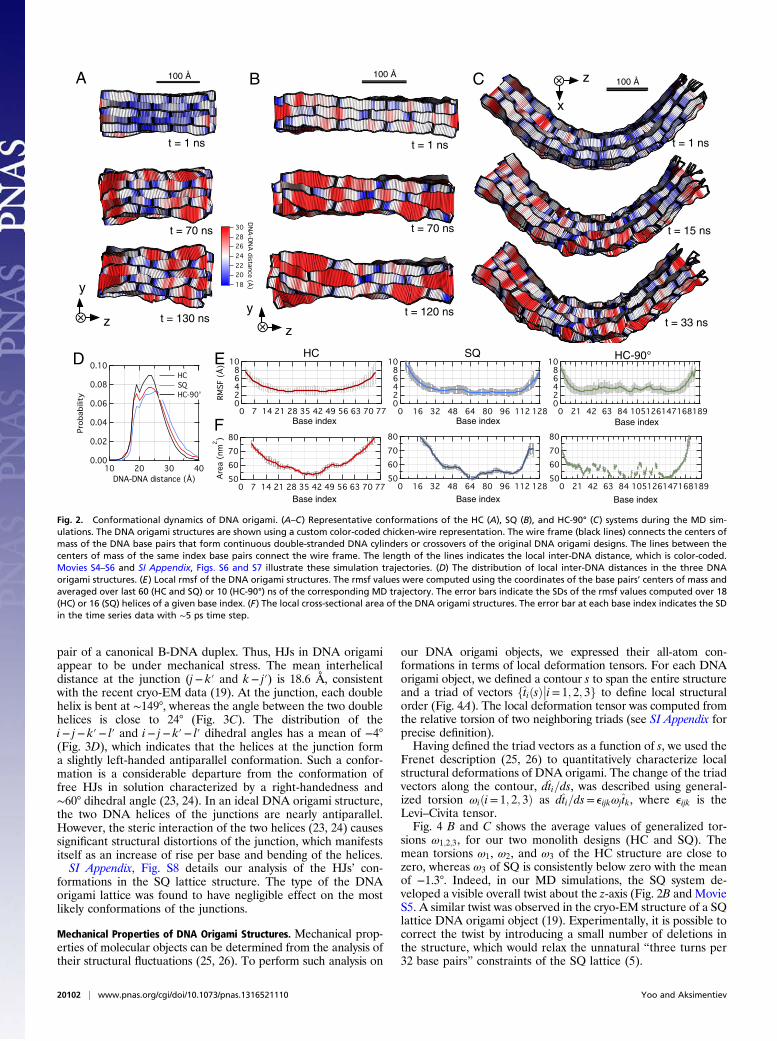
pair of a canonical B-DNA duplex. Thus, HJs in DNA origamiappear to be under mechanical stress. The mean interhelicaldistance at the junction (j− k′ and k− j′) is 18.6 Å, consistentwith the recent cryo-EM data (19). At the junction, each doublehelix is bent at ∼149°, whereas the angle between the two doublehelices is close to 24° (Fig. 3C). The distribution of thei− j− k′− l′ and i− j− k′− l′ dihedral angles has a mean of −4°(Fig. 3D), which indicates that the helices at the junction forma slightly left-handed antiparallel conformation. Such a confor-mation is a considerable departure from the conformation offree HJs in solution characterized by a right-handedness and∼60° dihedral angle (23, 24). In an ideal DNA origami structure,the two DNA helices of the junctions are nearly antiparallel.However, the steric interaction of the two helices (23, 24) causessignificant structural distortions of the junction, which manifestsitself as an increase of rise per base and bending of the helices.SI Appendix, Fig. S8 details our analysis of the HJs’ con-
formations in the SQ lattice structure. The type of the DNAorigami lattice was found to have negligible effect on the mostlikely conformations of the junctions.
Mechanical Properties of DNA Origami Structures. Mechanical prop-erties of molecular objects can be determined from the analysis oftheir structural fluctuations (25, 26). To perform such analysis on
our DNA origami objects, we expressed their all-atom con-formations in terms of local deformation tensors. For each DNAorigami object, we defined a contour s to span the entire structureand a triad of vectors ftiðsÞ
��i= 1; 2; 3g to define local structural
order (Fig. 4A). The local deformation tensor was computed fromthe relative torsion of two neighboring triads (see SI Appendix forprecise definition).Having defined the triad vectors as a function of s, we used the
Frenet description (25, 26) to quantitatively characterize localstructural deformations of DNA origami. The change of the triadvectors along the contour, dti=ds, was described using general-ized torsion ωiði= 1; 2; 3Þ as dti=ds= eijkωjtk, where eijk is theLevi–Civita tensor.Fig. 4 B and C shows the average values of generalized tor-
sions ω1;2;3, for our two monolith designs (HC and SQ). Themean torsions ω1, ω2, and ω3 of the HC structure are close tozero, whereas ω3 of SQ is consistently below zero with the meanof −1.3°. Indeed, in our MD simulations, the SQ system de-veloped a visible overall twist about the z-axis (Fig. 2B and MovieS5. A similar twist was observed in the cryo-EM structure of a SQlattice DNA origami object (19). Experimentally, it is possible tocorrect the twist by introducing a small number of deletions inthe structure, which would relax the unnatural “three turns per32 base pairs” constraints of the SQ lattice (5).
t = 33 ns
t = 1 ns
t = 15 ns
z
x
1086420
189168147126105846342210
t = 1 ns
t = 130 ns
t = 1 ns
t = 120 ns
A
1086420
1281129680644832160
D
z
y
B C
z
y
0.10
0.08
0.06
0.04
0.02
0.00
Pro
bab
ility
40302010
HC SQ
80
70
60
50Are
a (n
m2)
7770635649423528211470
1086420
7770635649423528211470
Base index Base index
Base index Base index Base index
HC SQE
F
t = 70 ns t = 70 ns30
28
26
24
22
20
18
DN
A-D
NA
distance (Å
)
100 Å 100 Å100 Å
80
70
60
501281129680644832160
80
70
60
50189168147126105846342210
Base index
Fig. 2. Conformational dynamics of DNA origami. (A–C) Representative conformations of the HC (A), SQ (B), and HC-90° (C) systems during the MD sim-ulations. The DNA origami structures are shown using a custom color-coded chicken-wire representation. The wire frame (black lines) connects the centers ofmass of the DNA base pairs that form continuous double-stranded DNA cylinders or crossovers of the original DNA origami designs. The lines between thecenters of mass of the same index base pairs connect the wire frame. The length of the lines indicates the local inter-DNA distance, which is color-coded.Movies S4–S6 and SI Appendix, Figs. S6 and S7 illustrate these simulation trajectories. (D) The distribution of local inter-DNA distances in the three DNAorigami structures. (E) Local rmsf of the DNA origami structures. The rmsf values were computed using the coordinates of the base pairs’ centers of mass andaveraged over last 60 (HC and SQ) or 10 (HC-90°) ns of the corresponding MD trajectory. The error bars indicate the SDs of the rmsf values computed over 18(HC) or 16 (SQ) helices of a given base index. (F) The local cross-sectional area of the DNA origami structures. The error bar at each base index indicates the SDin the time series data with ∼5 ps time step.
20102 | www.pnas.org/cgi/doi/10.1073/pnas.1316521110 Yoo and Aksimentiev
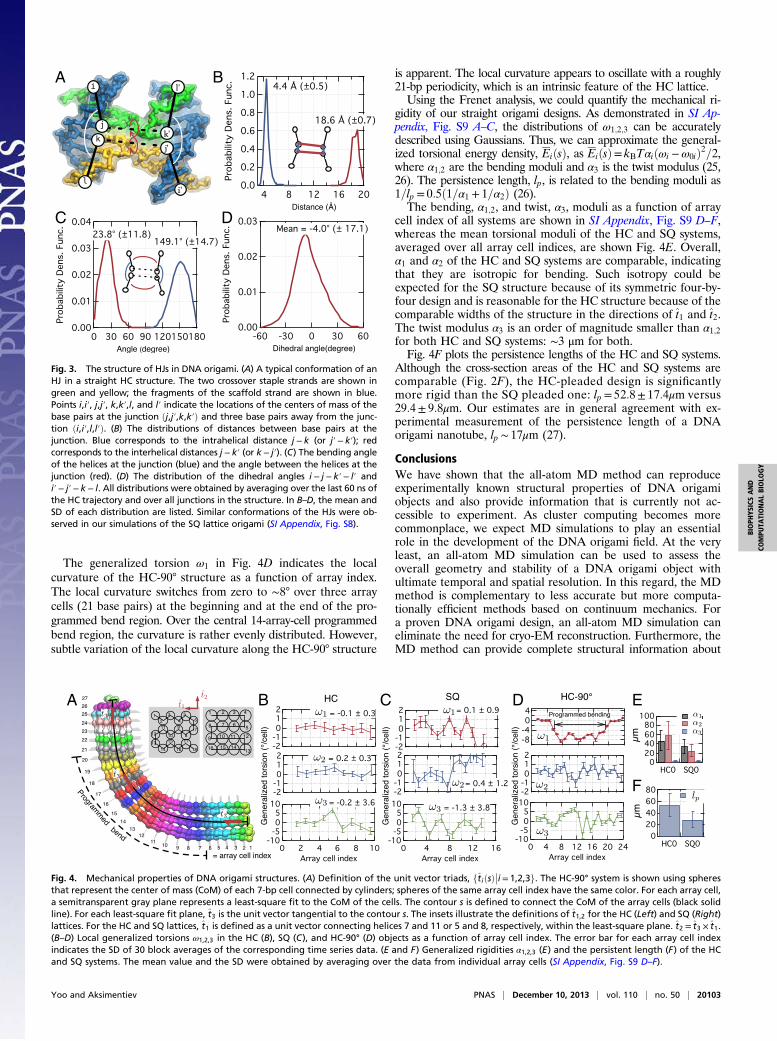
The generalized torsion ω1 in Fig. 4D indicates the localcurvature of the HC-90° structure as a function of array index.The local curvature switches from zero to ∼8° over three arraycells (21 base pairs) at the beginning and at the end of the pro-grammed bend region. Over the central 14-array-cell programmedbend region, the curvature is rather evenly distributed. However,subtle variation of the local curvature along the HC-90° structure
is apparent. The local curvature appears to oscillate with a roughly21-bp periodicity, which is an intrinsic feature of the HC lattice.Using the Frenet analysis, we could quantify the mechanical ri-
gidity of our straight origami designs. As demonstrated in SI Ap-pendix, Fig. S9 A–C, the distributions of ω1;2;3 can be accuratelydescribed using Gaussians. Thus, we can approximate the general-ized torsional energy density, EiðsÞ, as EiðsÞ= kBTαiðωi −ω0iÞ2=2,where α1;2 are the bending moduli and α3 is the twist modulus (25,26). The persistence length, lp, is related to the bending moduli as1=lp = 0:5ð1=α1 + 1=α2Þ (26).The bending, α1;2, and twist, α3, moduli as a function of array
cell index of all systems are shown in SI Appendix, Fig. S9 D–F,whereas the mean torsional moduli of the HC and SQ systems,averaged over all array cell indices, are shown Fig. 4E. Overall,α1 and α2 of the HC and SQ systems are comparable, indicatingthat they are isotropic for bending. Such isotropy could beexpected for the SQ structure because of its symmetric four-by-four design and is reasonable for the HC structure because of thecomparable widths of the structure in the directions of t1 and t2.The twist modulus α3 is an order of magnitude smaller than α1;2for both HC and SQ systems: ∼3 μm for both.Fig. 4F plots the persistence lengths of the HC and SQ systems.
Although the cross-section areas of the HC and SQ systems arecomparable (Fig. 2F), the HC-pleaded design is significantlymore rigid than the SQ pleaded one: lp = 52:8± 17:4μm versus29:4± 9:8μm. Our estimates are in general agreement with ex-perimental measurement of the persistence length of a DNAorigami nanotube, lp ∼ 17μm (27).
ConclusionsWe have shown that the all-atom MD method can reproduceexperimentally known structural properties of DNA origamiobjects and also provide information that is currently not ac-cessible to experiment. As cluster computing becomes morecommonplace, we expect MD simulations to play an essentialrole in the development of the DNA origami field. At the veryleast, an all-atom MD simulation can be used to assess theoverall geometry and stability of a DNA origami object withultimate temporal and spatial resolution. In this regard, the MDmethod is complementary to less accurate but more computa-tionally efficient methods based on continuum mechanics. Fora proven DNA origami design, an all-atom MD simulation caneliminate the need for cryo-EM reconstruction. Furthermore, theMD method can provide complete structural information about
A B
C D
Fig. 3. The structure of HJs in DNA origami. (A) A typical conformation of anHJ in a straight HC structure. The two crossover staple strands are shown ingreen and yellow; the fragments of the scaffold strand are shown in blue.Points i,i′, j,j′, k,k′,l, and l′ indicate the locations of the centers of mass of thebase pairs at the junction ðj,j′,k,k′Þ and three base pairs away from the junc-tion ði,i′,l,l′Þ. (B) The distributions of distances between base pairs at thejunction. Blue corresponds to the intrahelical distance j− k (or j′− k′); redcorresponds to the interhelical distances j− k′ (or k− j′). (C) The bending angleof the helices at the junction (blue) and the angle between the helices at thejunction (red). (D) The distribution of the dihedral angles i− j−k′− l′ andi′− j′− k− l. All distributions were obtained by averaging over the last 60 ns ofthe HC trajectory and over all junctions in the structure. In B–D, the mean andSD of each distribution are listed. Similar conformations of the HJs were ob-served in our simulations of the SQ lattice origami (SI Appendix, Fig. S8).
A B C D E
F
Fig. 4. Mechanical properties of DNA origami structures. (A) Definition of the unit vector triads, ftiðsÞ��i= 1,2,3g. The HC-90° system is shown using spheres
that represent the center of mass (CoM) of each 7-bp cell connected by cylinders; spheres of the same array cell index have the same color. For each array cell,a semitransparent gray plane represents a least-square fit to the CoM of the cells. The contour s is defined to connect the CoM of the array cells (black solidline). For each least-square fit plane, t3 is the unit vector tangential to the contour s. The insets illustrate the definitions of t1,2 for the HC (Left) and SQ (Right)lattices. For the HC and SQ lattices, t1 is defined as a unit vector connecting helices 7 and 11 or 5 and 8, respectively, within the least-square plane. t2 = t3 × t1.(B–D) Local generalized torsions ω1,2,3 in the HC (B), SQ (C), and HC-90° (D) objects as a function of array cell index. The error bar for each array cell indexindicates the SD of 30 block averages of the corresponding time series data. (E and F) Generalized rigidities α1,2,3 (E) and the persistent length (F) of the HCand SQ systems. The mean value and the SD were obtained by averaging over the data from individual array cells (SI Appendix, Fig. S9 D–F).
Yoo and Aksimentiev PNAS | December 10, 2013 | vol. 110 | no. 50 | 20103
BIOPH
YSICSAND
COMPU
TATIONALBIOLO
GY
each and every nucleotide of a DNA origami object, surroundingwater and ions, local mechanical stresses and their microscopicorigins. Such capability can be of particular value for designs thatincorporate active elements at specific locations of a DNA origamiobject (2, 12, 28). The utility of the MD method can be fully re-alized in the development of systems where DNA origami iscombined with other structural components, such as lipid bilayermembranes (12, 21), nanoparticles (13, 14), or solid-state nano-pores (22, 28, 29) and where physical forces are used to activelycontrol the behavior of the assemblies.
Materials and MethodsUsing caDNAno, we designed three DNA origami objects and converted thecaDNAno designs to all-atom models in vacuum as described in SI Appendix.Following the conversion, each model was submerged in aqueous solutioncontaining ∼10 mM MgCl2. We used the genbox program of the gromacspackage (30) to randomly place Mg2+and Cl− ions and to add water to ourmodels. The size of the water box was chosen such that a water buffer of4 nm or more separated the periodic images of DNA origami objects. Thefinal size of the HC and SQ systems was approximately 16:5× 16:5× 32:5 and14:0×14:0× 47:0 nm3, respectively. Before equilibration, the potential en-ergy of each system was minimized using the conjugate gradient method.
Two different protocols were used to equilibrate our straight (HC and SQ)and bent (HC-90°) DNA origami objects. For the straight objects, 10 nsequilibration was performed applying harmonic restraints to all heavy atomsof DNA bases using the spring constant k of 1 kcal/mol/Å2. This equilibrationprocess allowed the DNA backbone to relax and Mg2+ to diffuse into theDNA origami objects, while preserving the overall integrity of the designs.
For the bent object, we used a multistep equilibration strategy described inSI Appendix and illustrated by Movie S7.
All MD simulations reported in the main text were performed using theNAMD program (31), periodic boundary conditions, CHARMM36 force fieldfor DNA (32), the modified TIP3P model of water (33), and custom param-eters for ions (34). All Mg2+ ions were simulated as Mg2+-hexahydrates (34).During the equilibration, the structure of hexahydrate was preserved byharmonically restraining ðk= 1 kcal=mol=A2Þ the distance between Mg2+
and water oxygen atoms to ∼1.9 Å. These restraints prevented irreversiblebinding of Mg2+ to phosphate oxygens of DNA during initial equilibration(34). In our production runs, the restraints were not applied; nevertheless,the hexahydrate structure remained intact. The van der Waals and short-range electrostatic energies were calculated using an 8–10 Å switchingscheme. The long-range electrostatic interactions were computed using theparticle-mesh Ewald scheme and the grid size of ∼1.2 Å (35). The integrationtime step was 2 fs; 2–2–6 fs multiple timestepping was used (31). Tempera-ture was held constant at 298 K using a Langevin thermostat (31). Pressurewas maintained at one bar using the Nosé–Hoover Langevin piston pressurecontrol (36).
We have also performed production simulations using the AMBERbsc0DNA force field (37). However, we found the resulting structures of DNAorigami objects to be in considerable departure from experimental data (5).These simulations are described in SI Appendix and SI Appendix, Fig. S10.
ACKNOWLEDGMENTS. This work was supported in part by the grants fromthe National Science Foundation (DMR-0955959, PHY-0822613, and ECC-1227034) and the National Institutes of Health (R01-HG005115). The authorsgladly acknowledge supercomputer time provided through Extreme Scienceand Engineering Discovery Environment Allocation Grant MCA05S028 andthe Taub Cluster (University of Illinois at Urbana-Champaign).
1. Seeman NC (2010) Nanomaterials based on DNA. Annu Rev Biochem 79:65–87.2. Pinheiro AV, Han D, Shih WM, Yan H (2011) Challenges and opportunities for struc-
tural DNA nanotechnology. Nat Nanotechnol 6(12):763–772.3. Rothemund PW (2006) Folding DNA to create nanoscale shapes and patterns. Nature
440(7082):297–302.4. Douglas SM, et al. (2009) Self-assembly of DNA into nanoscale three-dimensional
shapes. Nature 459(7245):414–418.5. Dietz H, Douglas SM, Shih WM (2009) Folding DNA into twisted and curved nanoscale
shapes. Science 325(5941):725–730.6. Han D, et al. (2011) DNA origami with complex curvatures in three-dimensional space.
Science 332(6027):342–346.7. Douglas SM, Chou JJ, Shih WM (2007) DNA-nanotube-induced alignment of mem-
brane proteins for NMR structure determination. Proc Natl Acad Sci USA 104(16):6644–6648.
8. Andersen ES, et al. (2009) Self-assembly of a nanoscale DNA box with a controllablelid. Nature 459(7243):73–76.
9. Liedl T, Högberg B, Tytell J, Ingber DE, Shih WM (2010) Self-assembly of three-dimensionalprestressed tensegrity structures from DNA. Nat Nanotechnol 5(7):520–524.
10. Lin C, et al. (2012) Submicrometre geometrically encoded fluorescent barcodes self-assembled from DNA. Nat Chem 4(10):832–839.
11. Sobczak JPJP, Martin TG, Gerling T, Dietz H (2012) Rapid folding of DNA into nano-scale shapes at constant temperature. Science 338(6113):1458–1461.
12. Langecker M, et al. (2012) Synthetic lipid membrane channels formed by designedDNA nanostructures. Science 338(6109):932–936.
13. Acuna GP, et al. (2012) Fluorescence enhancement at docking sites of DNA-directedself-assembled nanoantennas. Science 338(6106):506–510.
14. Kuzyk A, et al. (2012) DNA-based self-assembly of chiral plasmonic nanostructureswith tailored optical response. Nature 483(7389):311–314.
15. Douglas SM, et al. (2009) Rapid prototyping of 3D DNA-origami shapes with caDNAno.Nucleic Acids Res 37(15):5001–5006.
16. Kim DN, Kilchherr F, Dietz H, Bathe M (2012) Quantitative prediction of 3D solutionshape and flexibility of nucleic acid nanostructures. Nucleic Acids Res 40(7):2862–2868.
17. Strey HH, Podgornik R, Rau DC, Parsegian VA (1998) DNA–DNA interactions. CurrOpin Struct Biol 8(3):309–313.
18. Kauert DJ, Kurth T, Liedl T, Seidel R (2011) Direct mechanical measurements revealthe material properties of three-dimensional DNA origami. Nano Lett 11(12):5558–5563.
19. Bai XCC, Martin TG, Scheres SHW, Dietz H (2012) Cryo-EM structure of a 3D DNA-origami object. Proc Natl Acad Sci USA 109(49):20012–20017.
20. Ke Y, et al. (2009) Multilayer DNA origami packed on a square lattice. J Am Chem Soc
131(43):15903–15908.21. Burns JR, Stulz E, Howorka S (2013) Self-assembled DNA nanopores that span lipid
bilayers. Nano Lett 13(6):2351–2356.22. Hernández-Ainsa S, et al. (2013) DNA origami nanopores for controlling DNA trans-
location. ACS Nano 7(7):6024–6030.23. McKinney SA, Déclais ACC, Lilley DMJ, Ha T (2003) Structural dynamics of individual
Holliday junctions. Nat Struct Biol 10(2):93–97.24. Hohng S, et al. (2007) Fluorescence-force spectroscopy maps two-dimensional re-
action landscape of the holliday junction. Science 318(5848):279–283.25. Panyukov S, Rabin Y (2000) Fluctuating filaments: Statistical mechanics of helices.
Phys Rev E Stat Phys Plasmas Fluids Relat Interdiscip Topics 62(5 Pt B):7135–7146.26. Choe S, Sun SX (2005) The elasticity of alpha-helices. J Chem Phys 122(24):244912.27. Schiffels D, Liedl T, Fygenson DK (2013) Nanoscale structure and microscale stiffness
of DNA nanotubes. ACS Nano 7(8):6700–6710.28. Wei R, Martin TG, Rant U, Dietz H (2012) DNA origami gatekeepers for solid-state
nanopores. Angew Chem Int Ed Engl 51(20):4864–4867.29. Bell NAW, et al. (2012) DNA origami nanopores. Nano Lett 12(1):512–517.30. Hess B, Kutzner C, Van Der Spoel D, Lindahl E (2008) Gromacs 4: Algorithms for highly
efficient, load-balanced, and scalable molecular simulation. J Chem Theory Comput
4(3):435–447.31. Phillips JC, et al. (2005) Scalable molecular dynamics with NAMD. J Comput Chem
26(16):1781–1802.32. Hart K, et al. (2012) Optimization of the CHARMM additive force field for DNA: Im-
proved treatment of the BI/BII conformational equilibrium. J Chem Theory Comput
8(1):348–362.33. Jorgensen WL, Chandrasekhar J, Madura JD, Impey RW, Klein ML (1983) Comparison
of simple potential functions for simulating liquid water. J Chem Phys 79(2):926–935.34. Yoo J, Aksimentiev A (2012) Improved parametrization of Li+, Na+, K+, and Mg2+ ions
for all-atom molecular dynamics simulations of nucleic acid systems. J Phys Chem Lett
3(1):45–50.35. Darden T, York D, Pedersen L (1993) Particle mesh ewald: An n log(n) method for
ewald sums in large systems. J Chem Phys 98(12):10089–10092.36. Martyna GJ, Tobias DJ, Klein ML (1994) Constant pressure molecular dynamics algo-
rithms. J Chem Phys 101(5):4177–4189.37. Pérez A, et al. (2007) Refinement of the AMBER force field for nucleic acids: Im-
proving the description of α/γ conformers. Biophys J 92(11):3817–3829.
20104 | www.pnas.org/cgi/doi/10.1073/pnas.1316521110 Yoo and Aksimentiev