membrane sculpting by curved dna origami scaffolds
TRANSCRIPT
ARTICLE
Membrane sculpting by curved DNA origamiscaffoldsHenri G. Franquelim 1, Alena Khmelinskaia 1,2, Jean-Philippe Sobczak 3, Hendrik Dietz 3 &
Petra Schwille 1
Membrane sculpting and transformation is essential for many cellular functions, thus being
largely regulated by self-assembling and self-organizing protein coats. Their functionality is
often encoded by particular spatial structures. Prominent examples are BAR domain proteins,
the ‘banana-like’ shapes of which are thought to aid scaffolding and membrane tubulation. To
elucidate whether 3D structure can be uncoupled from other functional features of complex
scaffolding proteins, we hereby develop curved DNA origami in various shapes and stacking
features, following the presumable design features of BAR proteins, and characterize their
ability for membrane binding and transformation. We show that dependent on curvature,
membrane affinity and surface density, DNA origami coats can indeed reproduce the activity
of membrane-sculpting proteins such as BAR, suggesting exciting perspectives for using
them in bottom-up approaches towards minimal biomimetic cellular machineries.
DOI: 10.1038/s41467-018-03198-9 OPEN
1Max Planck Institute of Biochemistry, D-82152 Martinsried near Munich, Planegg, Germany. 2 Graduate School of Quantitative Biosciences, Ludwig-Maximilans-University, D-81337 Munich, Germany. 3 Physics Department and Institute of Advanced Study, Technische Universität München, D-85748Garching near Munich, Germany. Correspondence and requests for materials should be addressed to P.S. (email: [email protected])
NATURE COMMUNICATIONS | (2018) 9:811 | DOI: 10.1038/s41467-018-03198-9 |www.nature.com/naturecommunications 1
1234
5678
90():,;
The curvatures of biological membranes vary strongly, frompredominantly flat in the plasma membrane to highlycurved in the endoplasmatic reticulum or in the Golgi
apparatus. The transformation of membranes from one shape toanother, for example during cell division, belongs to the mostfundamental processes in living cells. Numerous factors thatregulate membrane curvature have been identified, with scaf-folding proteins being the most obvious ones1–3. An importantclass of scaffolding proteins which presumably imprint theirshape on lipid membranes is the BAR (Bin/Amphiphysin/Rvs)domain superfamily4, 5. When dimerized, BAR proteins formcharacteristic banana-shaped scaffolds that induce and stabilizemembrane curvature through electrostatic and hydrophobicinteractions4–6. Several BAR proteins were shown to tubulatemembranes in vitro7–10. BAR proteins presumably rely on theircurved shape for their activity: different types of BAR modulesadopt folds with different degrees of curvature4, 5. By using BARdomains as model proteins11, 12, recent studies emphasized therelevance of physical-chemical foundations for membrane bend-ing. From the minimalistic perspective of bottom-up syntheticbiology13, 14, it is tempting to speculate about the simplest way toinduce specific membrane curvatures, and thus engineer aminimal membrane sculpting machinery de novo. The goal ofthis work is to mimic structural and functional features of BARdomain proteins by rationally designed DNA origami objects(Supplementary Fig. 1), in order to decipher the essential prop-erties of artificial scaffolds for curving lipid membranes.
Programmable self-assembly with DNA origami may beemployed to produce a variety of two-dimensional and three-dimensional structures on the nanometer-scale, including objectswith custom curvature15–19. This molecular toolkit now serves asthe starting point for our goal of constructing membrane-sculpting machinery from the bottom-up. DNA origami has beenpreviously employed to create nanoscale channels in lipidmembranes20, 21 and to guide the assembly of nanoscale lipidcompartments22–25. In contrast to DNA origami nanocages24, 25
that template small liposomes via detergent removal, ourdesigned origami structures act on preexisting cell-sized vesicles,imitating the mechanism of action of protein coats. Subsequently,in this work, we achieve the transformation of membrane shapeon much larger scales, reminiscent of deformations observed incells2, 3.
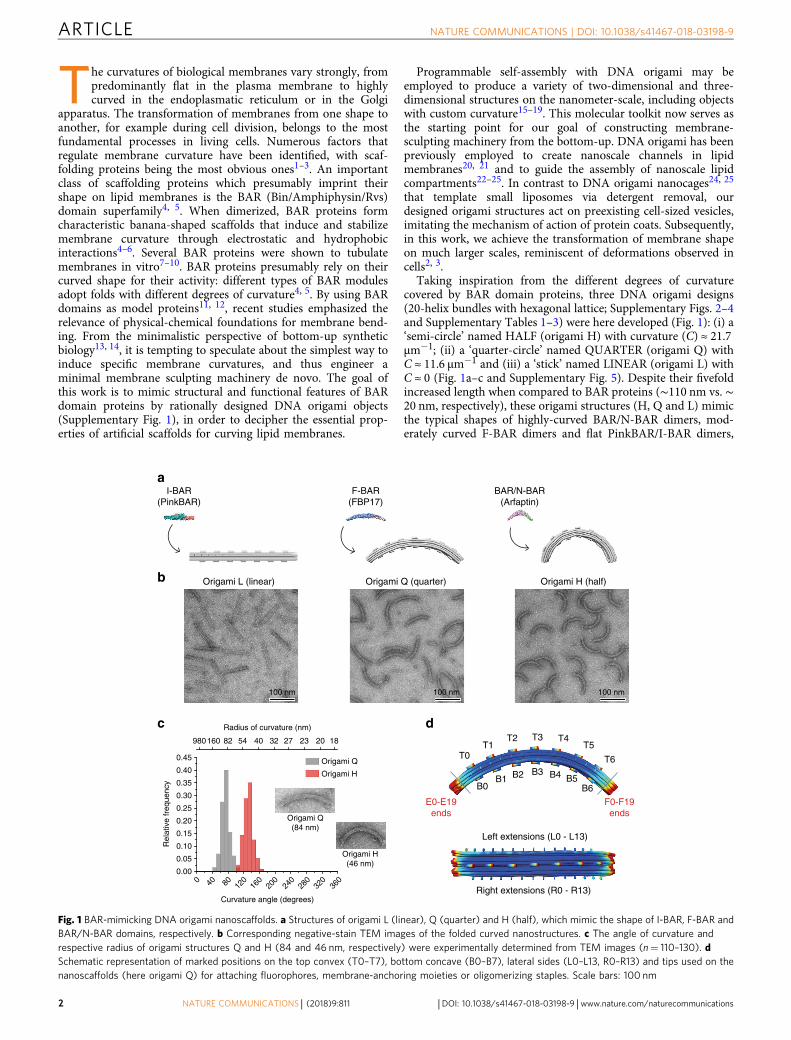
Taking inspiration from the different degrees of curvaturecovered by BAR domain proteins, three DNA origami designs(20-helix bundles with hexagonal lattice; Supplementary Figs. 2–4and Supplementary Tables 1–3) were here developed (Fig. 1): (i) a‘semi-circle’ named HALF (origami H) with curvature (C) ≈ 21.7μm−1; (ii) a ‘quarter-circle’ named QUARTER (origami Q) withC ≈ 11.6 μm−1 and (iii) a ‘stick’ named LINEAR (origami L) withC ≈ 0 (Fig. 1a–c and Supplementary Fig. 5). Despite their fivefoldincreased length when compared to BAR proteins (∼110 nm vs. ∼20 nm, respectively), these origami structures (H, Q and L) mimicthe typical shapes of highly-curved BAR/N-BAR dimers, mod-erately curved F-BAR dimers and flat PinkBAR/I-BAR dimers,
Radius of curvature (nm)
0 40 80 120
160
200
240
280
320
360
0.00
0.05
0.10
0.15
0.20
0.25
0.30
0.35
0.40
0.45
Rel
ativ
e fr
eque
ncy
Curvature angle (degrees)
Origami Q
Origami H
980160 82 54 40 32 27 23 20 18
Origami Q(84 nm)
Origami H(46 nm)
Origami L (linear)
I-BAR(PinkBAR)
Origami Q (quarter)
F-BAR(FBP17)
BAR/N-BAR(Arfaptin)
Origami H (half)
100 nm 100 nm 100 nm
E0-E19ends
Left extensions (L0 - L13)
Right extensions (R0 - R13)
b
a
c d
T0T1
T2 T3 T4T5
T6
B0B1 B2 B3 B4 B5
B6
F0-F19ends
Fig. 1 BAR-mimicking DNA origami nanoscaffolds. a Structures of origami L (linear), Q (quarter) and H (half), which mimic the shape of I-BAR, F-BAR andBAR/N-BAR domains, respectively. b Corresponding negative-stain TEM images of the folded curved nanostructures. c The angle of curvature andrespective radius of origami structures Q and H (84 and 46 nm, respectively) were experimentally determined from TEM images (n= 110–130). dSchematic representation of marked positions on the top convex (T0–T7), bottom concave (B0–B7), lateral sides (L0–L13, R0–R13) and tips used on thenanoscaffolds (here origami Q) for attaching fluorophores, membrane-anchoring moieties or oligomerizing staples. Scale bars: 100 nm
ARTICLE NATURE COMMUNICATIONS | DOI: 10.1038/s41467-018-03198-9
2 NATURE COMMUNICATIONS | (2018) 9:811 | DOI: 10.1038/s41467-018-03198-9 |www.nature.com/naturecommunications
respectively (Fig. 1a and Supplementary Fig. 1). Each designfurther includes positions at the different curved facets forattaching fluorophores, membrane-anchoring moieties or foroligomerizing the objects laterally (Fig. 1d and SupplementaryNotes). Thereupon, we studied the interaction of the DNAorigami-based scaffolds with lipid model systems and demon-strate the ability for membrane bending in vitro. We determinedquantitatively the requirements in terms of shape, membrane-attachment and oligomerization needed for a synthetic scaffold toinduce specific membrane curvature. As we explore reconstitu-tion assays with model membranes similar to the ones employedfor studying scaffolding proteins in vitro8–10, direct comparisonwith the mechanism of action of BAR domain proteins can bedrawn.
Our results demonstrate that DNA nanotechnology hasreached the degree of sophistication to reproduce complex bio-logical functionality, which has so far been thought to be reservedfor proteins. We show that structure- and function-specific DNAorigami devices, biomimetic of proteins targeting and remodelingbiological membranes, can be rationally designed and recon-stituted into cell-sized model membrane environments. Thisopens up exciting perspectives for bottom-up synthetic biologyapproaches, as even more complex fundamental biomimeticnanosystems, such as protein-less membrane trafficking andprotocell division machineries, may be within reach.
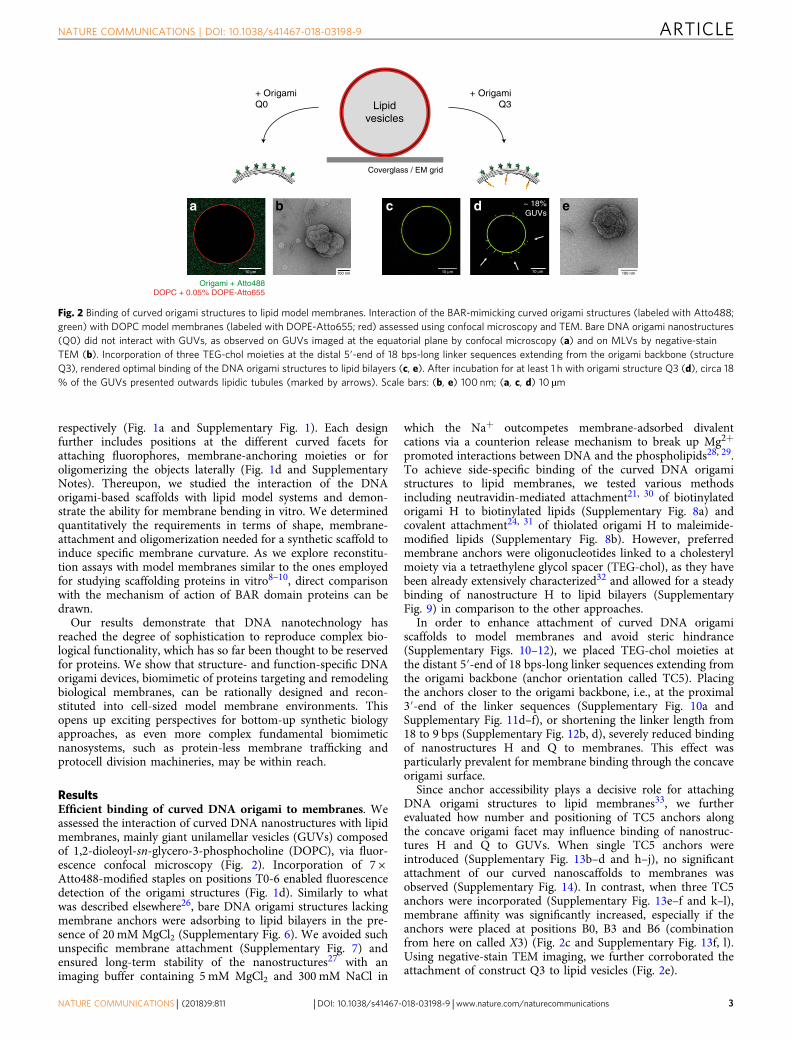
ResultsEfficient binding of curved DNA origami to membranes. Weassessed the interaction of curved DNA nanostructures with lipidmembranes, mainly giant unilamellar vesicles (GUVs) composedof 1,2-dioleoyl-sn-glycero-3-phosphocholine (DOPC), via fluor-escence confocal microscopy (Fig. 2). Incorporation of 7 ×Atto488-modified staples on positions T0-6 enabled fluorescencedetection of the origami structures (Fig. 1d). Similarly to whatwas described elsewhere26, bare DNA origami structures lackingmembrane anchors were adsorbing to lipid bilayers in the pre-sence of 20 mM MgCl2 (Supplementary Fig. 6). We avoided suchunspecific membrane attachment (Supplementary Fig. 7) andensured long-term stability of the nanostructures27 with animaging buffer containing 5 mM MgCl2 and 300 mM NaCl in
which the Na+ outcompetes membrane-adsorbed divalentcations via a counterion release mechanism to break up Mg2+
promoted interactions between DNA and the phospholipids28, 29.To achieve side-specific binding of the curved DNA origamistructures to lipid membranes, we tested various methodsincluding neutravidin-mediated attachment21, 30 of biotinylatedorigami H to biotinylated lipids (Supplementary Fig. 8a) andcovalent attachment24, 31 of thiolated origami H to maleimide-modified lipids (Supplementary Fig. 8b). However, preferredmembrane anchors were oligonucleotides linked to a cholesterylmoiety via a tetraethylene glycol spacer (TEG-chol), as they havebeen already extensively characterized32 and allowed for a steadybinding of nanostructure H to lipid bilayers (SupplementaryFig. 9) in comparison to the other approaches.
In order to enhance attachment of curved DNA origamiscaffolds to model membranes and avoid steric hindrance(Supplementary Figs. 10–12), we placed TEG-chol moieties atthe distant 5′-end of 18 bps-long linker sequences extending fromthe origami backbone (anchor orientation called TC5). Placingthe anchors closer to the origami backbone, i.e., at the proximal3′-end of the linker sequences (Supplementary Fig. 10a andSupplementary Fig. 11d–f), or shortening the linker length from18 to 9 bps (Supplementary Fig. 12b, d), severely reduced bindingof nanostructures H and Q to membranes. This effect wasparticularly prevalent for membrane binding through the concaveorigami surface.
Since anchor accessibility plays a decisive role for attachingDNA origami structures to lipid membranes33, we furtherevaluated how number and positioning of TC5 anchors alongthe concave origami facet may influence binding of nanostruc-tures H and Q to GUVs. When single TC5 anchors wereintroduced (Supplementary Fig. 13b–d and h–j), no significantattachment of our curved nanoscaffolds to membranes wasobserved (Supplementary Fig. 14). In contrast, when three TC5anchors were incorporated (Supplementary Fig. 13e–f and k–l),membrane affinity was significantly increased, especially if theanchors were placed at positions B0, B3 and B6 (combinationfrom here on called X3) (Fig. 2c and Supplementary Fig. 13f, l).Using negative-stain TEM imaging, we further corroborated theattachment of construct Q3 to lipid vesicles (Fig. 2e).
a c d ~ 18%GUVs
DOPC + 0.05% DOPE-Atto655Origami + Atto488
Lipidvesicles
+ Origami Q0
+ OrigamiQ3
e
Coverglass / EM grid
b
10 μm 100 nm 10 μm 10 μm 100 nm
Fig. 2 Binding of curved origami structures to lipid model membranes. Interaction of the BAR-mimicking curved origami structures (labeled with Atto488;green) with DOPC model membranes (labeled with DOPE-Atto655; red) assessed using confocal microscopy and TEM. Bare DNA origami nanostructures(Q0) did not interact with GUVs, as observed on GUVs imaged at the equatorial plane by confocal microscopy (a) and on MLVs by negative-stainTEM (b). Incorporation of three TEG-chol moieties at the distal 5′-end of 18 bps-long linker sequences extending from the origami backbone (structureQ3), rendered optimal binding of the DNA origami structures to lipid bilayers (c, e). After incubation for at least 1 h with origami structure Q3 (d), circa 18% of the GUVs presented outwards lipidic tubules (marked by arrows). Scale bars: (b, e) 100 nm; (a, c, d) 10 µm
NATURE COMMUNICATIONS | DOI: 10.1038/s41467-018-03198-9 ARTICLE
NATURE COMMUNICATIONS | (2018) 9:811 | DOI: 10.1038/s41467-018-03198-9 |www.nature.com/naturecommunications 3
Taken together, we identified some of the major requirementsfor efficiently attaching curved origami structures to lipid bilayersand we observed indications of curvature-mediated deformationsof membranes induced by the F-BAR mimicking structure Q3(Fig. 2d and Supplementary Fig. 13m). Notably, incubation ofGUVs with Q3 for at least 1 h led to the appearance of outwardstubular deformations within a significant fraction of vesicles(~18%; 22 out of 121 GUVs); deformations similar to thepositively curved tubules reported for several F-BARproteins7, 8, 10, 34.
Membrane deformations as a function of DNA origami cur-vature. As different classes of BAR domains curve membranes indistinct manners4, we further investigated whether the appear-ance of membrane deformations, as reported in Fig. 2d, can becorrelated with the direction and degree of curvature of our BAR-mimicking DNA origami structures. Membrane tension has beenpreviously implicated in influencing the assembly of BAR domainproteins35, 36. To provide a controllable trigger for assessingvesicle deformations, we lowered the membrane tension by
increasing osmolarity of the outer buffer in 10%. Subsequently,shape variations of the deflated GUVs were monitored.
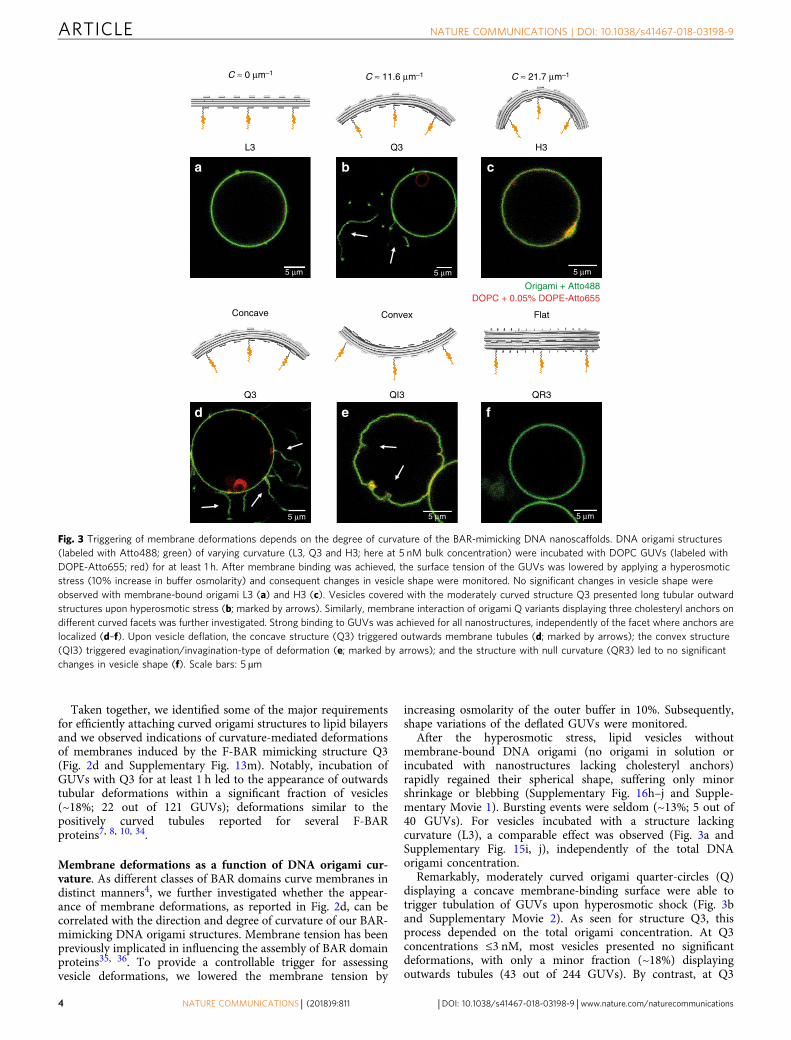
After the hyperosmotic stress, lipid vesicles withoutmembrane-bound DNA origami (no origami in solution orincubated with nanostructures lacking cholesteryl anchors)rapidly regained their spherical shape, suffering only minorshrinkage or blebbing (Supplementary Fig. 16h–j and Supple-mentary Movie 1). Bursting events were seldom (~13%; 5 out of40 GUVs). For vesicles incubated with a structure lackingcurvature (L3), a comparable effect was observed (Fig. 3a andSupplementary Fig. 15i, j), independently of the total DNAorigami concentration.
Remarkably, moderately curved origami quarter-circles (Q)displaying a concave membrane-binding surface were able totrigger tubulation of GUVs upon hyperosmotic shock (Fig. 3band Supplementary Movie 2). As seen for structure Q3, thisprocess depended on the total origami concentration. At Q3concentrations ≤3 nM, most vesicles presented no significantdeformations, with only a minor fraction (~18%) displayingoutwards tubules (43 out of 244 GUVs). By contrast, at Q3
H3
c
L3
a
Q3
b
C ≈ 11.6 μm–1C ≈ 0 μm–1 C ≈ 21.7 μm–1
QR3Q3 QI3
fd e
ConvexConcave Flat
5 μm 5 μm 5 μm
5 μm 5 μm 5 μm
DOPC + 0.05% DOPE-Atto655Origami + Atto488
Fig. 3 Triggering of membrane deformations depends on the degree of curvature of the BAR-mimicking DNA nanoscaffolds. DNA origami structures(labeled with Atto488; green) of varying curvature (L3, Q3 and H3; here at 5 nM bulk concentration) were incubated with DOPC GUVs (labeled withDOPE-Atto655; red) for at least 1 h. After membrane binding was achieved, the surface tension of the GUVs was lowered by applying a hyperosmoticstress (10% increase in buffer osmolarity) and consequent changes in vesicle shape were monitored. No significant changes in vesicle shape wereobserved with membrane-bound origami L3 (a) and H3 (c). Vesicles covered with the moderately curved structure Q3 presented long tubular outwardstructures upon hyperosmotic stress (b; marked by arrows). Similarly, membrane interaction of origami Q variants displaying three cholesteryl anchors ondifferent curved facets was further investigated. Strong binding to GUVs was achieved for all nanostructures, independently of the facet where anchors arelocalized (d–f). Upon vesicle deflation, the concave structure (Q3) triggered outwards membrane tubules (d; marked by arrows); the convex structure(QI3) triggered evagination/invagination-type of deformation (e; marked by arrows); and the structure with null curvature (QR3) led to no significantchanges in vesicle shape (f). Scale bars: 5 µm
ARTICLE NATURE COMMUNICATIONS | DOI: 10.1038/s41467-018-03198-9
4 NATURE COMMUNICATIONS | (2018) 9:811 | DOI: 10.1038/s41467-018-03198-9 |www.nature.com/naturecommunications
concentrations ≥5 nM, ~70% of all GUVs (128 out of 189)displayed outwards tubules (Supplementary Fig. 19a–d andSupplementary Fig. 15k–m). If additional cholesteryl moietieswere used on the concave surface (as observed for Q7 with 7 ×TC5), due to the increase in hydrophobicity and consequentlyenhanced membrane binding, lower total concentrations of DNAorigami were able to induce membrane tubulation (Supplemen-tary Fig. 19i–l and Supplementary Fig. 17g–i). Indeed, mostvesicles incubated with Q7 (97 out of 191 GUVs) displayedtubular deformations at concentrations ≥2 nM.
In the same way, we investigated origami Q constructsdisplaying either a convex membrane-binding interface (QI3;anchors at top positions T0, T3, and T6), or a flat membrane-binding interface perpendicular to the curvature (QR3; anchors atlateral positions R0, R6, and R12). For the latter (QR3), nosignificant membrane deformations were observed upon osmotictrigger (Fig. 3f; Supplementary Fig. 16m, n and SupplementaryMovie 3), consistent with the results reported for the non-curvedstructure L3 (Fig. 3a and Supplementary Fig. 15i, j). For structureQI3 with convex membrane-binding interface, on the other hand,~60% of the vesicles (55 out of 92 GUVs; at 5 nM QI3) presentedevagination/invagination-type shallow deformations upon hyper-osmotic stress (Fig. 3e; Supplementary Fig. 16k–l and Supple-mentary Movie 4). Such deformations effectively contrasted withthe outward tubules observed for structure Q3 (Fig. 3b, d) andwere somewhat reminiscent of the negatively curved membranedeformations reported for inverted I-BAR domains37, 38.
Contrary to the origami Q structures, the more curved origamihalf-circle (H) structures with concave membrane-binding inter-face were not capable of inducing the formation of tubulardeformation on GUVs (Fig. 3c): neither at high H3 totalconcentrations (Supplementary Fig. 15n–p), nor for H7 display-ing enhanced membrane binding (Supplementary Fig. 17j–l). Forinstance, with the exception of seldom vesicle bursting (~15%; 20out of 134 GUVs) and minor flaccid deformations (~10%; 14 outof 134 GUVs), vesicles incubated with H3 (~75%; 100 out of 134GUVs) remained spherical upon osmotic change and did notdisplay any tubular deformations. Adsorption of these highlycurved origami structures to DOPC vesicles seemed thereforeinsufficient to overcome the energetic barrier required forbending a flat membrane into a positively curved tube. Indeed,assuming a typical bending modulus for lipid bilayers of ~10−19 J,the estimated energy cost for bending a flat membrane segment ofsurface area (A) ~1800 nm2 (corresponding to the surface area ofour DNA origami scaffolds) into a membrane tube with R ≈ 46nm (radius of curvature fitting origami H) is ~38 kBT, based onthe area-difference elasticity (ADE) model of membranebending39, 40 (equation 3). For origami Q (R ≈ 84 nm), however,the estimated membrane bending cost is ∼11 kBT, ~3.5-fold lowerthan structure H and comparable with the membrane bendingcosts expected for a BAR domain protein (amphiphysin: 9 kBT,for R ≈ 11 nm and A ≈ 23 nm2)41.
Taken together, our data show a clear connection between thecurvature of the membrane-binding interface of our BAR-mimicking DNA-based scaffolds and the resulting membranedeformations (e.g. tubulation, invagination, etc.).
Hierarchical oligomerization of curved DNA origami scaffolds.Self-assembly of membrane scaffolding proteins into higher-orderstructures was suggested to play an important role in themechanism of action of BAR domains7, 10. Both lateral and tip-to-tip linear intermolecular interactions were described to stabi-lize their assembly into protein lattices7, 10. To test the influenceof such higher-order linkages, we designed variants of curvedDNA origami Q that could oligomerize, similar to BAR proteins,
tip-to-tip (Supplementary Fig. 18b–d) and laterally (Supplemen-tary Fig. 18e). Overall, four constructs capable of multimerizing insolution were created: origami Q-E5 (Supplementary Fig. 18b),Q-E7 (Supplementary Fig. 18c) and Q-E13 (SupplementaryFig. 18d) able to linearly multimerize from the tips forming arc-like oligomers of tunable size; plus origami Q-S14 (Supplemen-tary Fig. 18e) able to multimerize laterally forming sheet-likeoligomers. Constructs Q-E5/7/13 possess 2 × 5, 7 and 13 bluntends at defined helices, enabling intermolecular stacking at theorigami tips. Construct Q-S14, on the other hand, displays 2 × 14TATATA overhangs, enabling complementary lateral interactionsalong the origami sides.
Subsequently, we tested whether the inclusion of thosepolymerizing staples would enhance the ability of origami Q3with concave membrane-binding interface to produce tubularmembrane deformations on GUVs upon deflation. Altogether, nosignificant differences in terms of total bulk concentrationrequired to induce tubulation of vesicles were observed forconstructs with or without tip-to-tip oligomerizing staples (i.e.,structures Q3-E5/7/13 vs. Q3, respectively; SupplementaryFig. 18g–i and Supplementary Fig. 20). In contrast, for theconstruct with lateral oligomerizing staples (Q3-S14), lower bulkconcentrations were required for inducing membrane tubulationupon osmotic stress (Supplementary Fig. 19e–h and Supplemen-tary Fig 18j). Indeed, ~70% of the vesicles incubated with Q3-S14presented tubular deformations at concentrations ≥3 nM (135 outof 193 GUVs). Likewise, inclusion of lateral polymerizingoverhangs on origami QI3 with convex membrane-bindinginterface (i.e., QI3-S14) also affected the generation of membranedeformations (Supplementary Fig. 21). Here while most vesiclesdisplayed evagination-type membrane deformations upon hyper-osmotic stress (Supplementary Fig. 21e, f), ~15% of vesicles (36out of 244 GUVs; at 5 nM QI3-S14) additionally presentedinward tubules (Supplementary Fig. 21d, g) resembling protrud-ing nanotubes described for convex I-BAR proteins42, 43; whichcould not be observed for the structure QI3 lacking lateraloverhangs. Incubation with lower bulk concentrations of QI3-S14(i.e., 2 nM), on the other hand, did not promote significantmembrane deformations, similar to what was observed for convexstructure Q-I3 lacking polymerizing overhangs (SupplementaryFig. 16k).
In summary, our data indicate that in particular the presence oflateral interactions influences the ability of curved membrane-bound DNA origami to deform membranes. However, this effectseems to be of minor significance, as structures having additionalmembrane anchors but lacking polymerization strands (i.e., Q7;Supplementary Fig. 19i–l), were able to deform lipid vesicles asefficiently (in terms of total origami concentrations required) asthe structures with polymerization strands (i.e., Q3-S14).
Membrane density and binding affinity of curved DNA ori-gami. Our results so far strongly suggest that a critical membranedensity of curved nanostructures is required for triggeringmembrane bending. To test this hypothesis, variable surfacedensities of our BAR-mimicking DNA-based scaffolds to DOPCGUVs were quantitatively investigated at equilibrium (afterovernight incubation), by fluorescence imaging and singlemolecule detection.
Apparent membrane dissociation constants at equilibrium (Kd
± s.d.) were obtained for L3, Q3, and H3 structures by fitting thefluorescence intensity values on the surface of GUVs44 as afunction of bulk concentration to a Langmuir isotherm(equation 1): Kd (L3)= 0.39 ± 0.07 nM (ntotal= 288 GUVs; n=131–157 GUVs per fit, 2 repeats), Kd (Q3)= 0.68 ± 0.18 nM(ntotal= 277 GUVs; n= 83–100 GUVs per fit, 3 repeats) and Kd
NATURE COMMUNICATIONS | DOI: 10.1038/s41467-018-03198-9 ARTICLE
NATURE COMMUNICATIONS | (2018) 9:811 | DOI: 10.1038/s41467-018-03198-9 |www.nature.com/naturecommunications 5
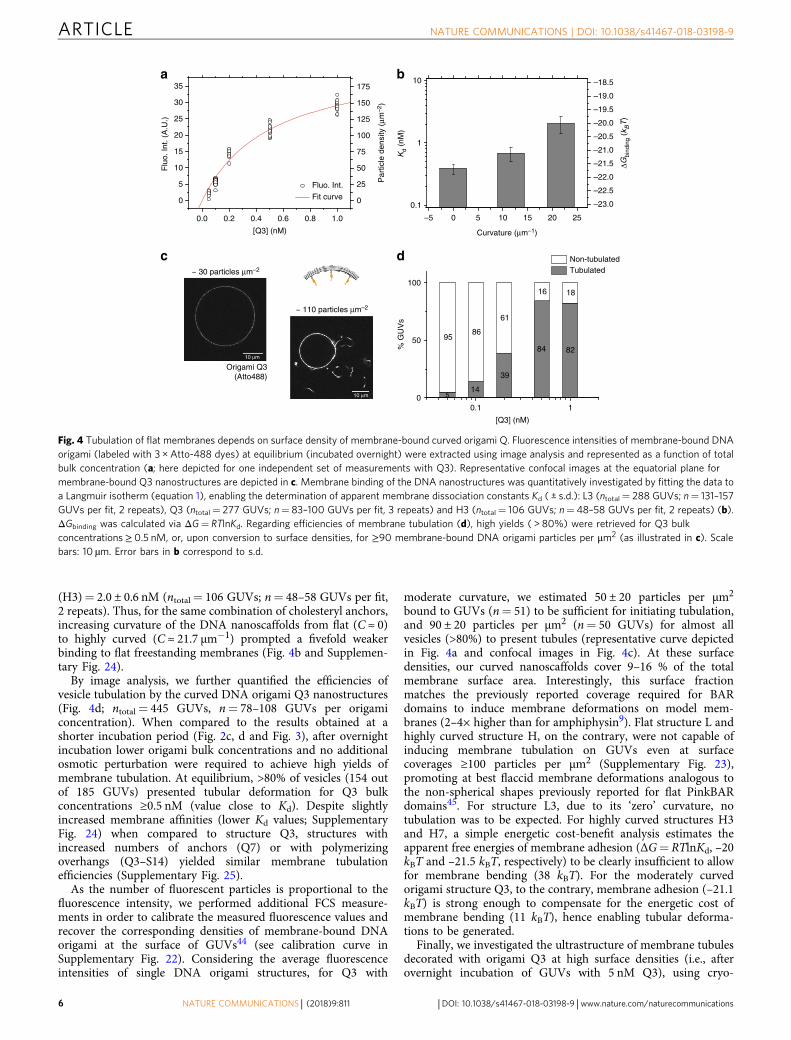
(H3)= 2.0 ± 0.6 nM (ntotal= 106 GUVs; n= 48–58 GUVs per fit,2 repeats). Thus, for the same combination of cholesteryl anchors,increasing curvature of the DNA nanoscaffolds from flat (C ≈ 0)to highly curved (C ≈ 21.7 μm−1) prompted a fivefold weakerbinding to flat freestanding membranes (Fig. 4b and Supplemen-tary Fig. 24).
By image analysis, we further quantified the efficiencies ofvesicle tubulation by the curved DNA origami Q3 nanostructures(Fig. 4d; ntotal= 445 GUVs, n= 78–108 GUVs per origamiconcentration). When compared to the results obtained at ashorter incubation period (Fig. 2c, d and Fig. 3), after overnightincubation lower origami bulk concentrations and no additionalosmotic perturbation were required to achieve high yields ofmembrane tubulation. At equilibrium, >80% of vesicles (154 outof 185 GUVs) presented tubular deformation for Q3 bulkconcentrations ≥0.5 nM (value close to Kd). Despite slightlyincreased membrane affinities (lower Kd values; SupplementaryFig. 24) when compared to structure Q3, structures withincreased numbers of anchors (Q7) or with polymerizingoverhangs (Q3–S14) yielded similar membrane tubulationefficiencies (Supplementary Fig. 25).
As the number of fluorescent particles is proportional to thefluorescence intensity, we performed additional FCS measure-ments in order to calibrate the measured fluorescence values andrecover the corresponding densities of membrane-bound DNAorigami at the surface of GUVs44 (see calibration curve inSupplementary Fig. 22). Considering the average fluorescenceintensities of single DNA origami structures, for Q3 with
moderate curvature, we estimated 50 ± 20 particles per μm2
bound to GUVs (n= 51) to be sufficient for initiating tubulation,and 90 ± 20 particles per μm2 (n= 50 GUVs) for almost allvesicles (>80%) to present tubules (representative curve depictedin Fig. 4a and confocal images in Fig. 4c). At these surfacedensities, our curved nanoscaffolds cover 9–16 % of the totalmembrane surface area. Interestingly, this surface fractionmatches the previously reported coverage required for BARdomains to induce membrane deformations on model mem-branes (2–4× higher than for amphiphysin9). Flat structure L andhighly curved structure H, on the contrary, were not capable ofinducing membrane tubulation on GUVs even at surfacecoverages ≥100 particles per µm2 (Supplementary Fig. 23),promoting at best flaccid membrane deformations analogous tothe non-spherical shapes previously reported for flat PinkBARdomains45. For structure L3, due to its ‘zero’ curvature, notubulation was to be expected. For highly curved structures H3and H7, a simple energetic cost-benefit analysis estimates theapparent free energies of membrane adhesion (ΔG= RTlnKd, –20kBT and –21.5 kBT, respectively) to be clearly insufficient to allowfor membrane bending (38 kBT). For the moderately curvedorigami structure Q3, to the contrary, membrane adhesion (–21.1kBT) is strong enough to compensate for the energetic cost ofmembrane bending (11 kBT), hence enabling tubular deforma-tions to be generated.
Finally, we investigated the ultrastructure of membrane tubulesdecorated with origami Q3 at high surface densities (i.e., afterovernight incubation of GUVs with 5 nM Q3), using cryo-
0.0 0.2 0.4 0.6 0.8 1.0
0
5
10
15
20
25
30
35
Fluo. Int.
Fit curve
Flu
o. In
t. (A
.U.)
[Q3] (nM)
0
25
50
75
100
125
150
175
~ 110 particles μm–2
~ 30 particles μm–2
Origami Q3(Atto488)
10 μm
10 μm
–5 0 5 10 15 20 25
0.1
1
10
–23.0
–22.5
–22.0
–21.5
–21.0
–20.5
–20.0
–19.5
–19.0
–18.5
514
39
84 82
9586
61
16 18
0.1 10
50
100
% G
UV
s
[Q3] (nM)
Non-tubulated Tubulated
Par
ticle
den
sity
(μm
–2)
Kd
(nM
)
ΔGbi
ndin
g (k
BT
)
Curvature (μm–1)
a b
c d
Fig. 4 Tubulation of flat membranes depends on surface density of membrane-bound curved origami Q. Fluorescence intensities of membrane-bound DNAorigami (labeled with 3 × Atto-488 dyes) at equilibrium (incubated overnight) were extracted using image analysis and represented as a function of totalbulk concentration (a; here depicted for one independent set of measurements with Q3). Representative confocal images at the equatorial plane formembrane-bound Q3 nanostructures are depicted in c. Membrane binding of the DNA nanostructures was quantitatively investigated by fitting the data toa Langmuir isotherm (equation 1), enabling the determination of apparent membrane dissociation constants Kd ( ± s.d.): L3 (ntotal= 288 GUVs; n= 131–157GUVs per fit, 2 repeats), Q3 (ntotal= 277 GUVs; n= 83–100 GUVs per fit, 3 repeats) and H3 (ntotal= 106 GUVs; n= 48–58 GUVs per fit, 2 repeats) (b).ΔGbinding was calculated via ΔG= RTlnKd. Regarding efficiencies of membrane tubulation (d), high yields ( > 80%) were retrieved for Q3 bulkconcentrations≥ 0.5 nM, or, upon conversion to surface densities, for ≥90 membrane-bound DNA origami particles per μm2 (as illustrated in c). Scalebars: 10 µm. Error bars in b correspond to s.d.
ARTICLE NATURE COMMUNICATIONS | DOI: 10.1038/s41467-018-03198-9
6 NATURE COMMUNICATIONS | (2018) 9:811 | DOI: 10.1038/s41467-018-03198-9 |www.nature.com/naturecommunications
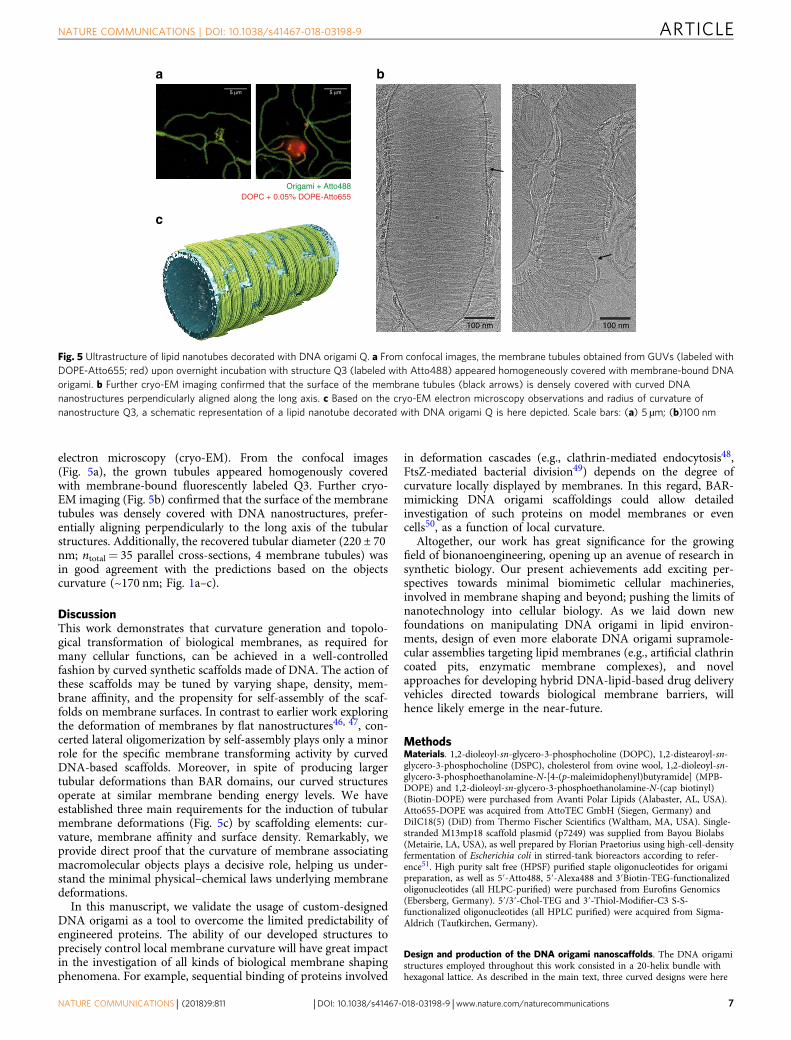
electron microscopy (cryo-EM). From the confocal images(Fig. 5a), the grown tubules appeared homogenously coveredwith membrane-bound fluorescently labeled Q3. Further cryo-EM imaging (Fig. 5b) confirmed that the surface of the membranetubules was densely covered with DNA nanostructures, prefer-entially aligning perpendicularly to the long axis of the tubularstructures. Additionally, the recovered tubular diameter (220 ± 70nm; ntotal= 35 parallel cross-sections, 4 membrane tubules) wasin good agreement with the predictions based on the objectscurvature (~170 nm; Fig. 1a–c).
DiscussionThis work demonstrates that curvature generation and topolo-gical transformation of biological membranes, as required formany cellular functions, can be achieved in a well-controlledfashion by curved synthetic scaffolds made of DNA. The action ofthese scaffolds may be tuned by varying shape, density, mem-brane affinity, and the propensity for self-assembly of the scaf-folds on membrane surfaces. In contrast to earlier work exploringthe deformation of membranes by flat nanostructures46, 47, con-certed lateral oligomerization by self-assembly plays only a minorrole for the specific membrane transforming activity by curvedDNA-based scaffolds. Moreover, in spite of producing largertubular deformations than BAR domains, our curved structuresoperate at similar membrane bending energy levels. We haveestablished three main requirements for the induction of tubularmembrane deformations (Fig. 5c) by scaffolding elements: cur-vature, membrane affinity and surface density. Remarkably, weprovide direct proof that the curvature of membrane associatingmacromolecular objects plays a decisive role, helping us under-stand the minimal physical–chemical laws underlying membranedeformations.
In this manuscript, we validate the usage of custom-designedDNA origami as a tool to overcome the limited predictability ofengineered proteins. The ability of our developed structures toprecisely control local membrane curvature will have great impactin the investigation of all kinds of biological membrane shapingphenomena. For example, sequential binding of proteins involved
in deformation cascades (e.g., clathrin-mediated endocytosis48,FtsZ-mediated bacterial division49) depends on the degree ofcurvature locally displayed by membranes. In this regard, BAR-mimicking DNA origami scaffoldings could allow detailedinvestigation of such proteins on model membranes or evencells50, as a function of local curvature.
Altogether, our work has great significance for the growingfield of bionanoengineering, opening up an avenue of research insynthetic biology. Our present achievements add exciting per-spectives towards minimal biomimetic cellular machineries,involved in membrane shaping and beyond; pushing the limits ofnanotechnology into cellular biology. As we laid down newfoundations on manipulating DNA origami in lipid environ-ments, design of even more elaborate DNA origami supramole-cular assemblies targeting lipid membranes (e.g., artificial clathrincoated pits, enzymatic membrane complexes), and novelapproaches for developing hybrid DNA-lipid-based drug deliveryvehicles directed towards biological membrane barriers, willhence likely emerge in the near-future.
MethodsMaterials. 1,2-dioleoyl-sn-glycero-3-phosphocholine (DOPC), 1,2-distearoyl-sn-glycero-3-phosphocholine (DSPC), cholesterol from ovine wool, 1,2-dioleoyl-sn-glycero-3-phosphoethanolamine-N-[4-(p-maleimidophenyl)butyramide] (MPB-DOPE) and 1,2-dioleoyl-sn-glycero-3-phosphoethanolamine-N-(cap biotinyl)(Biotin-DOPE) were purchased from Avanti Polar Lipids (Alabaster, AL, USA).Atto655-DOPE was acquired from AttoTEC GmbH (Siegen, Germany) andDiIC18(5) (DiD) from Thermo Fischer Scientifics (Waltham, MA, USA). Single-stranded M13mp18 scaffold plasmid (p7249) was supplied from Bayou Biolabs(Metairie, LA, USA), as well prepared by Florian Praetorius using high-cell-densityfermentation of Escherichia coli in stirred-tank bioreactors according to refer-ence51. High purity salt free (HPSF) purified staple oligonucleotides for origamipreparation, as well as 5′-Atto488, 5′-Alexa488 and 3′Biotin-TEG-functionalizedoligonucleotides (all HLPC-purified) were purchased from Eurofins Genomics(Ebersberg, Germany). 5′/3′-Chol-TEG and 3′-Thiol-Modifier-C3 S-S-functionalized oligonucleotides (all HPLC purified) were acquired from Sigma-Aldrich (Taufkirchen, Germany).
Design and production of the DNA origami nanoscaffolds. The DNA origamistructures employed throughout this work consisted in a 20-helix bundle withhexagonal lattice. As described in the main text, three curved designs were here
100 nm100 nm
DOPC + 0.05% DOPE-Atto655Origami + Atto488
5 μm 5 μm
a b
c
Fig. 5 Ultrastructure of lipid nanotubes decorated with DNA origami Q. a From confocal images, the membrane tubules obtained from GUVs (labeled withDOPE-Atto655; red) upon overnight incubation with structure Q3 (labeled with Atto488) appeared homogeneously covered with membrane-bound DNAorigami. b Further cryo-EM imaging confirmed that the surface of the membrane tubules (black arrows) is densely covered with curved DNAnanostructures perpendicularly aligned along the long axis. c Based on the cryo-EM electron microscopy observations and radius of curvature ofnanostructure Q3, a schematic representation of a lipid nanotube decorated with DNA origami Q is here depicted. Scale bars: (a) 5 µm; (b)100 nm
NATURE COMMUNICATIONS | DOI: 10.1038/s41467-018-03198-9 ARTICLE
NATURE COMMUNICATIONS | (2018) 9:811 | DOI: 10.1038/s41467-018-03198-9 |www.nature.com/naturecommunications 7
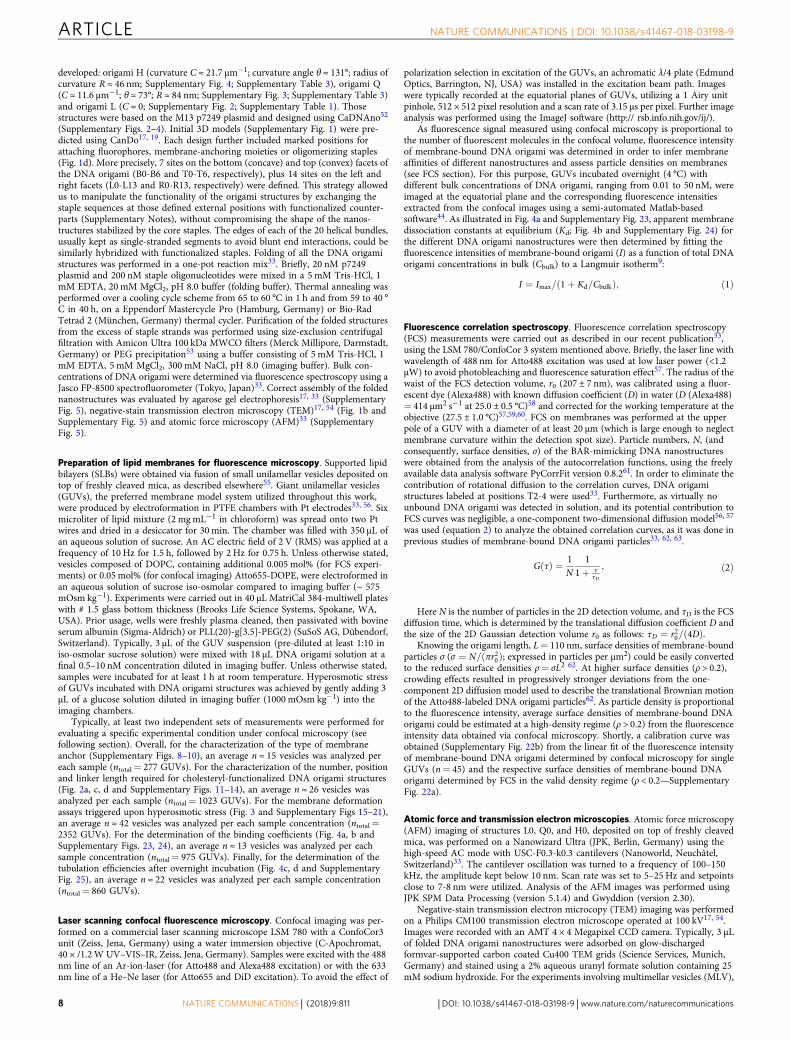
developed: origami H (curvature C ≈ 21.7 μm−1; curvature angle θ ≈ 131°; radius ofcurvature R ≈ 46 nm; Supplementary Fig. 4; Supplementary Table 3), origami Q(C ≈ 11.6 μm−1; θ ≈ 73°; R ≈ 84 nm; Supplementary Fig. 3; Supplementary Table 3)and origami L (C ≈ 0; Supplementary Fig. 2; Supplementary Table 1). Thosestructures were based on the M13 p7249 plasmid and designed using CaDNAno52
(Supplementary Figs. 2–4). Initial 3D models (Supplementary Fig. 1) were pre-dicted using CanDo17, 19. Each design further included marked positions forattaching fluorophores, membrane-anchoring moieties or oligomerizing staples(Fig. 1d). More precisely, 7 sites on the bottom (concave) and top (convex) facets ofthe DNA origami (B0-B6 and T0-T6, respectively), plus 14 sites on the left andright facets (L0-L13 and R0-R13, respectively) were defined. This strategy allowedus to manipulate the functionality of the origami structures by exchanging thestaple sequences at those defined external positions with functionalized counter-parts (Supplementary Notes), without compromising the shape of the nanos-tructures stabilized by the core staples. The edges of each of the 20 helical bundles,usually kept as single-stranded segments to avoid blunt end interactions, could besimilarly hybridized with functionalized staples. Folding of all the DNA origamistructures was performed in a one-pot reaction mix33. Briefly, 20 nM p7249plasmid and 200 nM staple oligonucleotides were mixed in a 5 mM Tris-HCl, 1mM EDTA, 20 mM MgCl2, pH 8.0 buffer (folding buffer). Thermal annealing wasperformed over a cooling cycle scheme from 65 to 60 °C in 1 h and from 59 to 40 °C in 40 h, on a Eppendorf Mastercycle Pro (Hamburg, Germany) or Bio-RadTetrad 2 (München, Germany) thermal cycler. Purification of the folded structuresfrom the excess of staple strands was performed using size-exclusion centrifugalfiltration with Amicon Ultra 100 kDa MWCO filters (Merck Millipore, Darmstadt,Germany) or PEG precipitation53 using a buffer consisting of 5 mM Tris-HCl, 1mM EDTA, 5 mM MgCl2, 300 mM NaCl, pH 8.0 (imaging buffer). Bulk con-centrations of DNA origami were determined via fluorescence spectroscopy using aJasco FP-8500 spectrofluorometer (Tokyo, Japan)33. Correct assembly of the foldednanostructures was evaluated by agarose gel electrophoresis17, 33 (SupplementaryFig. 5), negative-stain transmission electron microscopy (TEM)17, 54 (Fig. 1b andSupplementary Fig. 5) and atomic force microscopy (AFM)33 (SupplementaryFig. 5).
Preparation of lipid membranes for fluorescence microscopy. Supported lipidbilayers (SLBs) were obtained via fusion of small unilamellar vesicles deposited ontop of freshly cleaved mica, as described elsewhere55. Giant unilamellar vesicles(GUVs), the preferred membrane model system utilized throughout this work,were produced by electroformation in PTFE chambers with Pt electrodes33, 56. Sixmicroliter of lipid mixture (2 mgmL−1 in chloroform) was spread onto two Ptwires and dried in a desiccator for 30 min. The chamber was filled with 350 μL ofan aqueous solution of sucrose. An AC electric field of 2 V (RMS) was applied at afrequency of 10 Hz for 1.5 h, followed by 2 Hz for 0.75 h. Unless otherwise stated,vesicles composed of DOPC, containing additional 0.005 mol% (for FCS experi-ments) or 0.05 mol% (for confocal imaging) Atto655-DOPE, were electroformed inan aqueous solution of sucrose iso-osmolar compared to imaging buffer (~ 575mOsm kg−1). Experiments were carried out in 40 µL MatriCal 384-multiwell plateswith # 1.5 glass bottom thickness (Brooks Life Science Systems, Spokane, WA,USA). Prior usage, wells were freshly plasma cleaned, then passivated with bovineserum albumin (Sigma-Aldrich) or PLL(20)-g[3.5]-PEG(2) (SuSoS AG, Dübendorf,Switzerland). Typically, 3 µL of the GUV suspension (pre-diluted at least 1:10 iniso-osmolar sucrose solution) were mixed with 18 µL DNA origami solution at afinal 0.5–10 nM concentration diluted in imaging buffer. Unless otherwise stated,samples were incubated for at least 1 h at room temperature. Hyperosmotic stressof GUVs incubated with DNA origami structures was achieved by gently adding 3µL of a glucose solution diluted in imaging buffer (1000 mOsm kg−1) into theimaging chambers.
Typically, at least two independent sets of measurements were performed forevaluating a specific experimental condition under confocal microscopy (seefollowing section). Overall, for the characterization of the type of membraneanchor (Supplementary Figs. 8–10), an average n ≈ 15 vesicles was analyzed pereach sample (ntotal= 277 GUVs). For the characterization of the number, positionand linker length required for cholesteryl-functionalized DNA origami structures(Fig. 2a, c, d and Supplementary Figs. 11–14), an average n ≈ 26 vesicles wasanalyzed per each sample (ntotal= 1023 GUVs). For the membrane deformationassays triggered upon hyperosmotic stress (Fig. 3 and Supplementary Figs 15–21),an average n ≈ 42 vesicles was analyzed per each sample concentration (ntotal=2352 GUVs). For the determination of the binding coefficients (Fig. 4a, b andSupplementary Figs. 23, 24), an average n ≈ 13 vesicles was analyzed per eachsample concentration (ntotal= 975 GUVs). Finally, for the determination of thetubulation efficiencies after overnight incubation (Fig. 4c, d and SupplementaryFig. 25), an average n ≈ 22 vesicles was analyzed per each sample concentration(ntotal= 860 GUVs).
Laser scanning confocal fluorescence microscopy. Confocal imaging was per-formed on a commercial laser scanning microscope LSM 780 with a ConfoCor3unit (Zeiss, Jena, Germany) using a water immersion objective (C-Apochromat,40 × /1.2W UV–VIS–IR, Zeiss, Jena, Germany). Samples were excited with the 488nm line of an Ar-ion-laser (for Atto488 and Alexa488 excitation) or with the 633nm line of a He–Ne laser (for Atto655 and DiD excitation). To avoid the effect of
polarization selection in excitation of the GUVs, an achromatic λ/4 plate (EdmundOptics, Barrington, NJ, USA) was installed in the excitation beam path. Imageswere typically recorded at the equatorial planes of GUVs, utilizing a 1 Airy unitpinhole, 512 × 512 pixel resolution and a scan rate of 3.15 μs per pixel. Further imageanalysis was performed using the ImageJ software (http:// rsb.info.nih.gov/ij/).
As fluorescence signal measured using confocal microscopy is proportional tothe number of fluorescent molecules in the confocal volume, fluorescence intensityof membrane-bound DNA origami was determined in order to infer membraneaffinities of different nanostructures and assess particle densities on membranes(see FCS section). For this purpose, GUVs incubated overnight (4 °C) withdifferent bulk concentrations of DNA origami, ranging from 0.01 to 50 nM, wereimaged at the equatorial plane and the corresponding fluorescence intensitiesextracted from the confocal images using a semi-automated Matlab-basedsoftware44. As illustrated in Fig. 4a and Supplementary Fig. 23, apparent membranedissociation constants at equilibrium (Kd; Fig. 4b and Supplementary Fig. 24) forthe different DNA origami nanostructures were then determined by fitting thefluorescence intensities of membrane-bound origami (I) as a function of total DNAorigami concentrations in bulk (Cbulk) to a Langmuir isotherm9:
I ¼ Imax= 1þ Kd=Cbulkð Þ; ð1Þ
Fluorescence correlation spectroscopy. Fluorescence correlation spectroscopy(FCS) measurements were carried out as described in our recent publication33,using the LSM 780/ConfoCor 3 system mentioned above. Briefly, the laser line withwavelength of 488 nm for Atto488 excitation was used at low laser power (<1.2μW) to avoid photobleaching and fluorescence saturation effect57. The radius of thewaist of the FCS detection volume, r0 (207 ± 7 nm), was calibrated using a fluor-escent dye (Alexa488) with known diffusion coefficient (D) in water (D (Alexa488)= 414 μm2 s−1 at 25.0 ± 0.5 °C)58 and corrected for the working temperature at theobjective (27.5 ± 1.0 °C)57,59,60. FCS on membranes was performed at the upperpole of a GUV with a diameter of at least 20 μm (which is large enough to neglectmembrane curvature within the detection spot size). Particle numbers, N, (andconsequently, surface densities, σ) of the BAR-mimicking DNA nanostructureswere obtained from the analysis of the autocorrelation functions, using the freelyavailable data analysis software PyCorrFit version 0.8.261. In order to eliminate thecontribution of rotational diffusion to the correlation curves, DNA origamistructures labeled at positions T2-4 were used33. Furthermore, as virtually nounbound DNA origami was detected in solution, and its potential contribution toFCS curves was negligible, a one-component two-dimensional diffusion model56, 57
was used (equation 2) to analyze the obtained correlation curves, as it was done inprevious studies of membrane-bound DNA origami particles33, 62, 63.
GðτÞ ¼ 1N
11þ τ
τD
; ð2Þ
Here N is the number of particles in the 2D detection volume, and τD is the FCSdiffusion time, which is determined by the translational diffusion coefficient D andthe size of the 2D Gaussian detection volume r0 as follows: τD ¼ r20=ð4DÞ.
Knowing the origami length, L= 110 nm, surface densities of membrane-boundparticles σ (σ ¼ N=ðπr20Þ; expressed in particles per µm2) could be easily convertedto the reduced surface densities ρ= σL2 62. At higher surface densities (ρ > 0.2),crowding effects resulted in progressively stronger deviations from the one-component 2D diffusion model used to describe the translational Brownian motionof the Atto488-labeled DNA origami particles62. As particle density is proportionalto the fluorescence intensity, average surface densities of membrane-bound DNAorigami could be estimated at a high-density regime (ρ > 0.2) from the fluorescenceintensity data obtained via confocal microscopy. Shortly, a calibration curve wasobtained (Supplementary Fig. 22b) from the linear fit of the fluorescence intensityof membrane-bound DNA origami determined by confocal microscopy for singleGUVs (n= 45) and the respective surface densities of membrane-bound DNAorigami determined by FCS in the valid density regime (ρ < 0.2—SupplementaryFig. 22a).
Atomic force and transmission electron microscopies. Atomic force microscopy(AFM) imaging of structures L0, Q0, and H0, deposited on top of freshly cleavedmica, was performed on a Nanowizard Ultra (JPK, Berlin, Germany) using thehigh-speed AC mode with USC-F0.3-k0.3 cantilevers (Nanoworld, Neuchâtel,Switzerland)33. The cantilever oscillation was turned to a frequency of 100–150kHz, the amplitude kept below 10 nm. Scan rate was set to 5–25 Hz and setpointsclose to 7-8 nm were utilized. Analysis of the AFM images was performed usingJPK SPM Data Processing (version 5.1.4) and Gwyddion (version 2.30).
Negative-stain transmission electron microcopy (TEM) imaging was performedon a Philips CM100 transmission electron microscope operated at 100 kV17, 54.Images were recorded with an AMT 4 × 4 Megapixel CCD camera. Typically, 3 µLof folded DNA origami nanostructures were adsorbed on glow-dischargedformvar-supported carbon coated Cu400 TEM grids (Science Services, Munich,Germany) and stained using a 2% aqueous uranyl formate solution containing 25mM sodium hydroxide. For the experiments involving multimellar vesicles (MLV),
ARTICLE NATURE COMMUNICATIONS | DOI: 10.1038/s41467-018-03198-9
8 NATURE COMMUNICATIONS | (2018) 9:811 | DOI: 10.1038/s41467-018-03198-9 |www.nature.com/naturecommunications
4 nM of origami Q0 or Q3 were pre-incubated for 30 min with DOPC MLV (at 0.5mM lipid concentration) before deposition on the EM grids and negative staining.
For cryo-electron microscopy (cryo-EM), 5 nM Q3 was pre-incubated overnightin a tube with DOPC GUVs. Samples were then adsorbed for 4 min on glow-discharged lacey carbon grids (Plano, Wetzlar, Germany) and vitrified by plungefreezing the grid in liquid ethane. Imaging was performed on a Titan Halo electronmicroscope (FEI, Eindhoven, Netherlands), equipped with a Falcon II camera anda Gatan 626 cryo holder (Pleasanton, CA, USA). The microscope was operated at300 kV, with a magnification of ×45,000, giving a pixel size of 0.237 nm at thespecimen level. Data were collected using SerialEM, at nominal −3 µm targetdefocus with an electron dose of 20 e−Å−2. Tubular diameter (average ± s.d.) wasobtained analyzing ntotal= 35 parallel cross-sections along four Q3-decoratedmembrane tubules.
Estimation of the energetic costs for membrane bending. The energy requiredfor membrane bending by curved DNA origami scaffolds Q and H and a BARdomain protein were calculated using the Area-difference Elasticity (ADE)model39, 40. This model, based on the classical Helfrich-Canham-Evans elasticmembrane model (spontaneous curvature model)64, takes into consideration thefinite thickness of the lipid bilayer and consequent additional penalty arising fromthe area difference between its two leaflets upon bending (i.e., negatively curvedleaflet being compressed, while positively curved leaflet being expanded). The ADEmodel describes bending energy (εbe) as:
εbe ¼ κ12
ZdA C1 þ C2 � C0ð Þ2 þ α
2π
AD2ΔA� ΔA0ð Þ2
� �; ð3Þ
where κ is the bending modulus of DOPC bilayers (23.1 kBT)65, A is the area ofthe membrane segment, C1 and C2 are the principal curvatures (for a membranetube, C1 ¼ 1=R and C2 ¼ 0). C0 is spontaneous curvature of the membrane, whichrelates to the intrinsic curvature of the lipid molecules. For a homogenous non-asymmetric bilayer, C0= 0. In the second term, ΔA is the differential monolayerarea (determined by the difference in number of molecules of the outer and theinner monolayers) and ΔA0 its value at equilibrium. D corresponds to themembrane thickness. α ¼ κ=κ, with κ being the non-local bending rigiditymodulus. α is estimated to be in the order of unity and the approximationα ¼ 3=π66 was used.
Data availability. Data supporting the findings of this manuscript are availablefrom the corresponding author upon reasonable request.
Received: 21 December 2017 Accepted: 24 January 2018
References1. Baumgart, T., Capraro, B. R., Zhu, C. & Das, S. L. Thermodynamics and
mechanics of membrane curvature generation and sensing by proteins andlipids. Annu. Rev. Phys. Chem. 62, 483–506 (2011).
2. McMahon, H. T. & Gallop, J. L. Membrane curvature and mechanisms ofdynamic cell membrane remodelling. Nature 438, 590–596 (2005).
3. Zimmerberg, J. & Kozlov, M. M. How proteins produce cellular membranecurvature. Nat. Rev. Mol. Cell. Biol. 7, 9–19 (2006).
4. Qualmann, B., Koch, D. & Kessels, M. M. Let’s go bananas: revisiting theendocytic BAR code. Embo. J. 30, 3501–3515 (2011).
5. Frost, A., Unger, V. M. & De Camilli, P. The BAR domain superfamily:membrane-molding macromolecules. Cell 137, 191–196 (2009).
6. Zimmerberg, J. & McLaughlin, S. Membrane curvature: how BAR domainsbend bilayers. Curr. Biol. 14, R250–R252 (2004).
7. Frost, A. et al. Structural basis of membrane invagination by F-BAR domains.Cell 132, 807–817 (2008).
8. Wang, Q. et al. Molecular mechanism of membrane constriction andtubulation mediated by the F-BAR protein Pacsin/Syndapin. Proc. Natl. Acad.Sci. USA 106, 12700–12705 (2009).
9. Sorre, B. et al. Nature of curvature coupling of amphiphysin with membranesdepends on its bound density. Proc. Natl. Acad. Sci. USA 109, 173–178 (2012).
10. McDonald, N. A., Vander Kooi, C. W., Ohi, M. D. & Gould, K. L.Oligomerization but not membrane bending underlies the function of certainF-BAR proteins in cell motility and cytokinesis. Dev. Cell. 35, 725–736 (2015).
11. Simunovic, M., Voth, G. A., Callan-Jones, A. & Bassereau, P. When physicstakes over: BAR proteins and membrane curvature. Trends Cell. Biol. 25,780–792 (2015).
12. Traub, L. M. F-BAR/EFC domain proteins: some assembly required. Dev. Cell.35, 664–666 (2015).
13. Schwille, P. Bottom-up synthetic biology: engineering in a tinkerer’s world.Science 333, 1252–1254 (2011).
14. Schwille, P. & Diez, S. Synthetic biology of minimal systems. Crit. Rev.Biochem. Mol. Biol. 44, 223–242 (2009).
15. Rothemund, P. W. Folding DNA to create nanoscale shapes and patterns.Nature 440, 297–302 (2006).
16. Douglas, S. M. et al. Self-assembly of DNA into nanoscale three-dimensionalshapes. Nature 459, 414–418 (2009).
17. Castro, C. E. et al. A primer to scaffolded DNA origami. Nat. Methods 8,221–229 (2011).
18. Dietz, H., Douglas, S. M. & Shih, W. M. Folding DNA into twisted and curvednanoscale shapes. Science 325, 725–730 (2009).
19. Kim, D. N., Kilchherr, F., Dietz, H. & Bathe, M. Quantitative prediction of 3Dsolution shape and flexibility of nucleic acid nanostructures. Nucleic Acids Res.40, 2862–2868 (2012).
20. Langecker, M. et al. Synthetic lipid membrane channels formed by designedDNA nanostructures. Science 338, 932–936 (2012).
21. Krishnan, S. et al. Molecular transport through large-diameter DNAnanopores. Nat. Commun. 7, 12787 (2016).
22. Dong, Y. et al. Cuboid vesicles formed by frame-guided assembly on DNAorigami scaffolds. Angew. Chem. Int. Ed. 56, 1586–1589 (2016).
23. Perrault, S. D. & Shih, W. M. Virus-inspired membrane encapsulation ofDNA nanostructures to achieve in vivo stability. ACS Nano 8, 5132–5140(2014).
24. Yang, Y. et al. Self-assembly of size-controlled liposomes on DNAnanotemplates. Nat. Chem. 8, 476–483 (2016).
25. Zhang, Z., Yang, Y., Pincet, F., M, C. L. & Lin, C. Placing and shapingliposomes with reconfigurable DNA nanocages. Nat. Chem. 9, 653–659(2017).
26. Suzuki, Y., Endo, M. & Sugiyama, H. Lipid-bilayer-assisted two-dimensionalself-assembly of DNA origami nanostructures. Nat. Commun. 6, 8052 (2015).
27. Martin, T. G. & Dietz, H. Magnesium-free self-assembly of multi-layer DNAobjects. Nat. Commun. 3, 1103 (2012).
28. Mengistu, D. H., Bohinc, K. & May, S. Binding of DNA to zwitterionic lipidlayers mediated by divalent cations. J. Phys. Chem. B. 113, 12277–12282(2009).
29. Harries, D., May, S. & Ben-Shaul, A. Counterion release in membrane-biopolymer interactions. Soft Matter 9, 9268–9284 (2013).
30. Hirtz, M., Brglez, J., Fuchs, H. & Niemeyer, C. M. Selective binding of DNAorigami on biomimetic lipid patches. Small 11, 5752–5758 (2015).
31. Dave, N. & Liu, J. Biomimetic sensing based on chemically induced assemblyof a signaling DNA aptamer on a fluid bilayer membrane. Chem. Commun.48, 3718–3720 (2012).
32. Czogalla, A., Franquelim, H. G. & Schwille, P. DNA Nanostructures onMembranes as Tools for Synthetic Biology. Biophys. J. 110, 1698–1707 (2016).
33. Khmelinskaia, A., Franquelim, H. G., Petrov, E. P. & Schwille, P. Effect ofanchor positioning on binding and diffusion of elongated 3D DNAnanostructures on lipid membranes. J. Phys. D. Appl. Phys. 49, 194001 (2016).
34. Zhao, H. et al. Membrane-sculpting BAR domains generate stable lipidmicrodomains. Cell Rep. 4, 1213–1223 (2013).
35. Shi, Z. & Baumgart, T. Membrane tension and peripheral protein densitymediate membrane shape transitions. Nat. Commun. 6, 5974 (2015).
36. Simunovic, M. & Voth, G. A. Membrane tension controls the assembly ofcurvature-generating proteins. Nat. Commun. 6, 7219 (2015).
37. Mattila, P. K. et al. Missing-in-metastasis and IRSp53 deform PI(4,5)P2-richmembranes by an inverse BAR domain-like mechanism. J. Cell. Biol. 176,953–964 (2007).
38. Saarikangas, J. et al. Molecular mechanisms of membrane deformation by I-BAR domain proteins. Curr. Biol. 19, 95–107 (2009).
39. Miao, L., Seifert, U., Wortis, M. & Dobereiner, H. G. Budding Transitions ofFluid-Bilayer Vesicles - the Effect of Area-Difference Elasticity. Phys. Rev. E49, 5389–5407 (1994).
40. Döbereiner, H. G., Lehmann, A., Goedel, W., Selchow, O. & Lipowsky, R.Membrane curvature induced by sugar and polymer solutions.Mater. Res. Soc.Symp. P. 489, 101–106 (1998).
41. Lipowsky, R. Spontaneous tubulation of membranes and vesicles revealsmembrane tension generated by spontaneous curvature. Faraday Discuss. 161,305–331 (2013).
42. Barooji, Y. F., Rørvig-Lund, A., Semsey, S., Reihani, S. N. & Bendix, P. M.Dynamics of membrane nanotubes coated with I-BAR. Sci. Rep. 6, 30054(2016).
43. Prévost, C. et al. IRSp53 senses negative membrane curvature and phaseseparates along membrane tubules. Nat. Commun. 6, 8529 (2015).
44. Thomas, F. A., Visco, I., Petrášek, Z., Heinemann, F. & Schwille, P.Introducing a fluorescence-based standard to quantify protein partitioninginto membranes. Biochim. Biophys. Acta 1848, 2932–2941 (2015).
NATURE COMMUNICATIONS | DOI: 10.1038/s41467-018-03198-9 ARTICLE
NATURE COMMUNICATIONS | (2018) 9:811 | DOI: 10.1038/s41467-018-03198-9 |www.nature.com/naturecommunications 9
45. Pykäläinen, A. et al. Pinkbar is an epithelial-specific BAR domain protein thatgenerates planar membrane structures. Nat. Struct. Mol. Biol. 18, 902–907(2011).
46. Czogalla, A. et al. Amphipathic DNA origami nanoparticles to scaffold anddeform lipid membrane vesicles. Angew. Chem. Int. Ed. 54, 6501–6505 (2015).
47. Kocabey, S. et al. Membrane-assisted growth of DNA origami nanostructurearrays. ACS Nano 9, 3530–3539 (2015).
48. Saleem, M. et al. A balance between membrane elasticity and polymerizationenergy sets the shape of spherical clathrin coats. Nat. Commun. 6, 6249(2015).
49. Arumugam, S. et al. Surface topology engineering of membranes for themechanical investigation of the tubulin homologue FtsZ. Angew. Chem. Int.Ed. 51, 11858–11862 (2012).
50. Akbari, E. et al. Engineering Cell Surface Function with DNA Origami. Adv.Mater. 29, 1703632 (2017).
51. Kick, B., Praetorius, F., Dietz, H. & Weuster-Botz, D. Efficient production ofsingle-stranded phage DNA as scaffolds for DNA origami. Nano. Lett. 15,4672–4676 (2015).
52. Douglas, S. M. et al. Rapid prototyping of 3D DNA-origami shapes withcaDNAno. Nucleic Acids Res. 37, 5001–5006 (2009).
53. Stahl, E., Martin, T. G., Praetorius, F. & Dietz, H. Facile and scalablepreparation of pure and dense DNA origami solutions. Angew. Chem. Int. Ed.53, 12735–12740 (2014).
54. Sobczak, J. P., Martin, T. G., Gerling, T. & Dietz, H. Rapid folding of DNAinto nanoscale shapes at constant temperature. Science 338, 1458–1461 (2012).
55. Franquelim, H. G., Gaspar, D., Veiga, A. S., Santos, N. C. & Castanho, M. A.Decoding distinct membrane interactions of HIV-1 fusion inhibitors using acombined atomic force and fluorescence microscopy approach. Biochim.Biophys. Acta 1828, 1777–1785 (2013).
56. García-Sáez, A. J., Carrer, D. C. & Schwille, P. Fluorescence correlationspectroscopy for the study of membrane dynamics and organization in giantunilamellar vesicles. Methods Mol. Biol. 606, 493–508 (2010).
57. Petrov, E. P. & Schwille, P. In Standardization and quality assurance influorescence measurements II-bioanalytical and biomedical applications. (ed.U. Resch-Genger) 145-197 (Springer, Berlin Heidelberg; 2008).
58. Petrov, E. P., Ohrt, T., Winkler, R. G. & Schwille, P. Diffusion and segmentaldynamics of double-stranded DNA. Phys. Rev. Lett. 97, 258101 (2006).
59. Heinemann, F., Betaneli, V., Thomas, F. A. & Schwille, P. Quantifying lipiddiffusion by fluorescence correlation spectroscopy: a critical treatise. Langmuir28, 13395–13404 (2012).
60. Korson, L., Drosthan, W. & Millero, F. J. Viscosity of water at varioustemperatures. J. Phys. Chem. 73, 34–39 (1969).
61. Müller, P., Schwille, P. & Weidemann, T. PyCorrFit-generic data evaluationfor fluorescence correlation spectroscopy. Bioinformatics 30, 2532–2533(2014).
62. Czogalla, A., Kauert, D. J., Seidel, R., Schwille, P. & Petrov, E. P. DNA origaminanoneedles on freestanding lipid membranes as a tool to observe isotropic-nematic transition in two dimensions. Nano. Lett. 15, 649–655 (2015).
63. Czogalla, A. et al. Switchable domain partitioning and diffusion of DNAorigami rods on membranes. Faraday Discuss. 161, 31–43 (2013).
64. Helfrich, W. Elastic properties of lipid bilayers: theory and possibleexperiments. Z. Naturforsch. C. 28, 693–703 (1973).
65. Fa, N. et al. Decrease of elastic moduli of DOPC bilayers induced by amacrolide antibiotic, azithromycin. Biochim. Biophys. Acta 1768, 1830–1838(2007).
66. Seifert, U. & Lipowsky, R. in Structure and dynamics of membranes. (eds. R.Lipowsky & E. Sackmann) 403-462 (Elsevier Science, Amsterdam; New York;1995).
AcknowledgementsThis project was mainly funded by the collaborative research center SFB863 of theGerman Research Foundation (DFG). Additional support was given by the NanosystemsInitiative Munich (NIM), Center for NanoScience (CeNS) and Center for IntegratedProtein Science Munich (CIPSM). H.G.F. was awarded a Humboldt Research Fellowship(PTG/1152511/STP) from the Alexander von Humboldt Foundation. A.K. was supportedby the Graduate School of Quantitative Biosciences Munich (QBM). H.D. acknowledgesthe European Research Council (ERC Starting Grant #256270). P.S. acknowledges theMax Planck Society for further support. We thank Mike Strauss and the CEM facility atthe Max Planck Institute of Biochemistry for the assistance during cryo-EM experiments,Aleksander Czogalla and Veikko Linko for initial assistance and support, and EugeneP. Petrov for expert advice and fruitful discussions.
Author contributionsP.S. and H.G.F. initially conceived the project. P.S. supervised and coordinated theproject. H.D. supervised the development of curved DNA origami-based scaffolds.Experimental design was carried out largely by H.G.F., with contribution of A.K. H.G.F.designed the DNA origami structures, performed and analyzed the fluorescencemicroscopy experiments for studying requirements for membrane binding and curvaturegeneration, executed the membrane deformation assays upon osmotic trigger and carriedout the cryo-EM experiment. A.K. performed and analyzed the fluorescence imaging andFCS-based experiments for determining surface densities, binding and tubulation effi-ciencies. J.-P.S. developed the strategies for lateral self-assembly in solution and carriedout negative-stain TEM experiments. All authors contributed to the writing and revisionof the manuscript.
Additional informationSupplementary Information accompanies this paper at https://doi.org/10.1038/s41467-018-03198-9.
Competing interests: The authors declare no competing financial interests.
Reprints and permission information is available online at http://npg.nature.com/reprintsandpermissions/
Publisher's note: Springer Nature remains neutral with regard to jurisdictional claims inpublished maps and institutional affiliations.
Open Access This article is licensed under a Creative CommonsAttribution 4.0 International License, which permits use, sharing,
adaptation, distribution and reproduction in any medium or format, as long as you giveappropriate credit to the original author(s) and the source, provide a link to the CreativeCommons license, and indicate if changes were made. The images or other third partymaterial in this article are included in the article’s Creative Commons license, unlessindicated otherwise in a credit line to the material. If material is not included in thearticle’s Creative Commons license and your intended use is not permitted by statutoryregulation or exceeds the permitted use, you will need to obtain permission directly fromthe copyright holder. To view a copy of this license, visit http://creativecommons.org/licenses/by/4.0/.
© The Author(s) 2018
ARTICLE NATURE COMMUNICATIONS | DOI: 10.1038/s41467-018-03198-9
10 NATURE COMMUNICATIONS | (2018) 9:811 | DOI: 10.1038/s41467-018-03198-9 |www.nature.com/naturecommunications