ground penetrating radar in reflection vs transmission ... · ground penetrating radar in...
TRANSCRIPT
Ground penetrating radar in reflection vs transmission mode
for void detection in concrete structure
Christiane TRELA, Thomas KIND 1, Martin GÜNTHER 1
1 BAM, Federal Institute for Materials Research and Testing, Unter den Eichen 87, 12205 Berlin, Germany, Phone +493081043225, Fax: +493081041447; e-mail: [email protected]
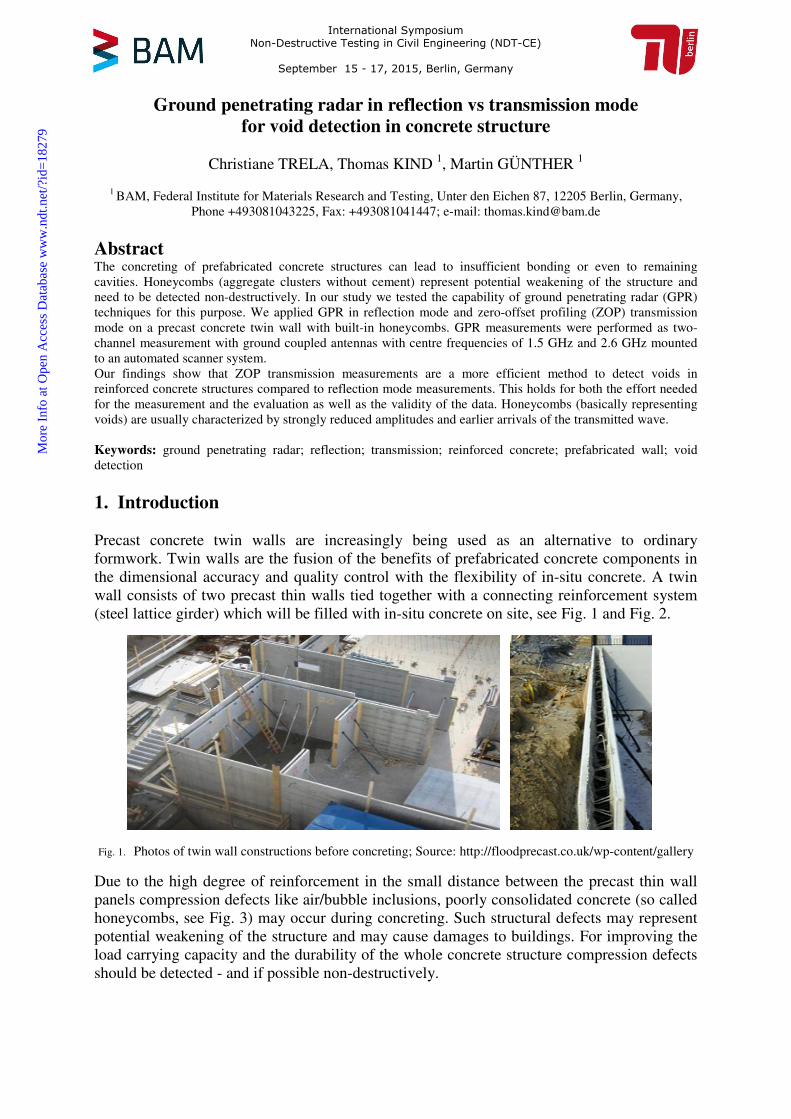
Abstract The concreting of prefabricated concrete structures can lead to insufficient bonding or even to remaining cavities. Honeycombs (aggregate clusters without cement) represent potential weakening of the structure and need to be detected non-destructively. In our study we tested the capability of ground penetrating radar (GPR) techniques for this purpose. We applied GPR in reflection mode and zero-offset profiling (ZOP) transmission mode on a precast concrete twin wall with built-in honeycombs. GPR measurements were performed as two-channel measurement with ground coupled antennas with centre frequencies of 1.5 GHz and 2.6 GHz mounted to an automated scanner system. Our findings show that ZOP transmission measurements are a more efficient method to detect voids in reinforced concrete structures compared to reflection mode measurements. This holds for both the effort needed for the measurement and the evaluation as well as the validity of the data. Honeycombs (basically representing voids) are usually characterized by strongly reduced amplitudes and earlier arrivals of the transmitted wave. Keywords: ground penetrating radar; reflection; transmission; reinforced concrete; prefabricated wall; void detection 1. Introduction Precast concrete twin walls are increasingly being used as an alternative to ordinary formwork. Twin walls are the fusion of the benefits of prefabricated concrete components in the dimensional accuracy and quality control with the flexibility of in-situ concrete. A twin wall consists of two precast thin walls tied together with a connecting reinforcement system (steel lattice girder) which will be filled with in-situ concrete on site, see Fig. 1 and Fig. 2.
Fig. 1. Photos of twin wall constructions before concreting; Source: http://floodprecast.co.uk/wp-content/gallery
Due to the high degree of reinforcement in the small distance between the precast thin wall panels compression defects like air/bubble inclusions, poorly consolidated concrete (so called honeycombs, see Fig. 3) may occur during concreting. Such structural defects may represent potential weakening of the structure and may cause damages to buildings. For improving the load carrying capacity and the durability of the whole concrete structure compression defects should be detected - and if possible non-destructively.
International Symposium Non-Destructive Testing in Civil Engineering (NDT-CE)
September 15 - 17, 2015, Berlin, Germany
Mor
e In
fo a
t Ope
n A
cces
s D
atab
ase
ww
w.n
dt.n
et/?
id=
1827
9
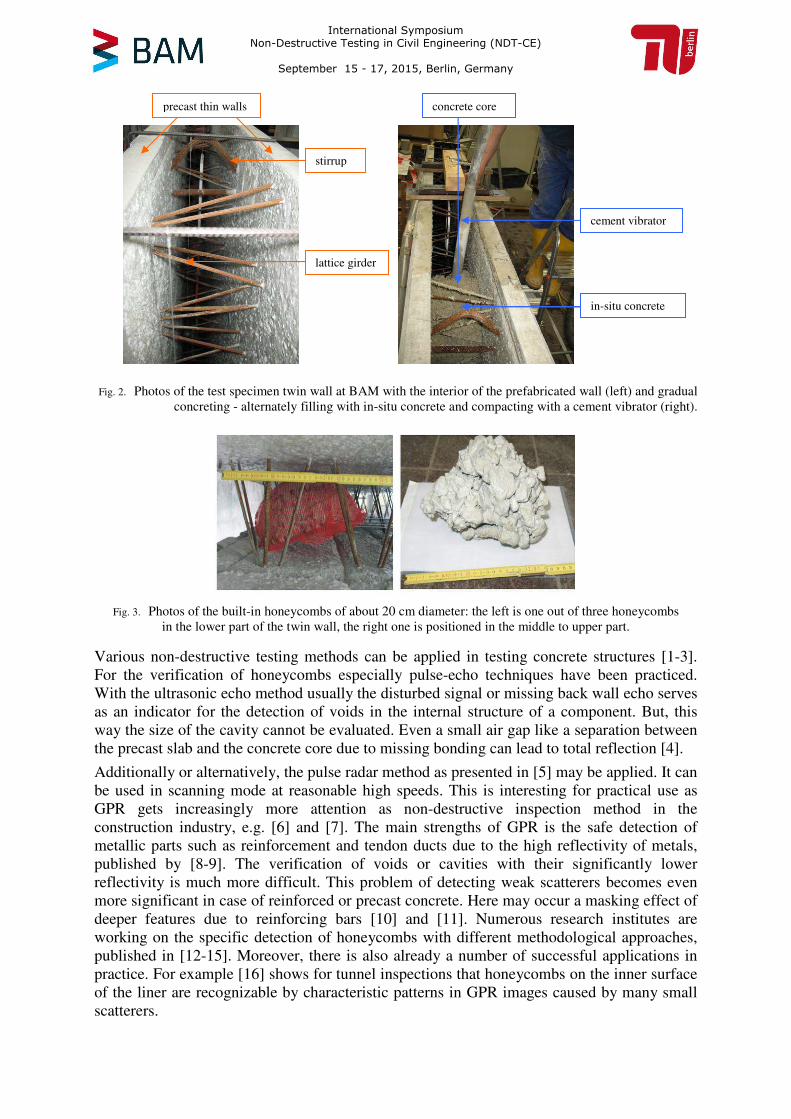
Fig. 2. Photos of the test specimen twin wall at BAM with the interior of the prefabricated wall (left) and gradual concreting - alternately filling with in-situ concrete and compacting with a cement vibrator (right).
Fig. 3. Photos of the built-in honeycombs of about 20 cm diameter: the left is one out of three honeycombs
in the lower part of the twin wall, the right one is positioned in the middle to upper part.
Various non-destructive testing methods can be applied in testing concrete structures [1-3]. For the verification of honeycombs especially pulse-echo techniques have been practiced. With the ultrasonic echo method usually the disturbed signal or missing back wall echo serves as an indicator for the detection of voids in the internal structure of a component. But, this way the size of the cavity cannot be evaluated. Even a small air gap like a separation between the precast slab and the concrete core due to missing bonding can lead to total reflection [4].
Additionally or alternatively, the pulse radar method as presented in [5] may be applied. It can be used in scanning mode at reasonable high speeds. This is interesting for practical use as GPR gets increasingly more attention as non-destructive inspection method in the construction industry, e.g. [6] and [7]. The main strengths of GPR is the safe detection of metallic parts such as reinforcement and tendon ducts due to the high reflectivity of metals, published by [8-9]. The verification of voids or cavities with their significantly lower reflectivity is much more difficult. This problem of detecting weak scatterers becomes even more significant in case of reinforced or precast concrete. Here may occur a masking effect of deeper features due to reinforcing bars [10] and [11]. Numerous research institutes are working on the specific detection of honeycombs with different methodological approaches, published in [12-15]. Moreover, there is also already a number of successful applications in practice. For example [16] shows for tunnel inspections that honeycombs on the inner surface of the liner are recognizable by characteristic patterns in GPR images caused by many small scatterers.
lattice girder
stirrup
precast thin walls
cement vibrator
in-situ concrete
concrete core
International Symposium Non-Destructive Testing in Civil Engineering (NDT-CE)
September 15 - 17, 2015, Berlin, Germany
Our studies at BAM represent additional potential of GPR as a reliable detection technique when it is used in transmission mode and the concrete structure is accessible from both sides. In this paper presents results obtained on a precast concrete twin wall with built-in honeycombs. 2. Design of the experiment The presented work on the twin walls is basically the continuation of an extensive study that was carried out to investigate the advantages and limitations of both GPR in reflection and transmission mode for detecting voids in concrete structures. Experiences in the measurement procedure and evaluation are based on comparative tests on different test specimen with predefined inhomogenities [17-18]. Polystyrene balls in different sizes (5 and 8 cm) and depths (cover thicknesses between 5 and 25 cm) represent the voids inside the reinforced concrete test specimens. 2.1 Twin wall test specimen
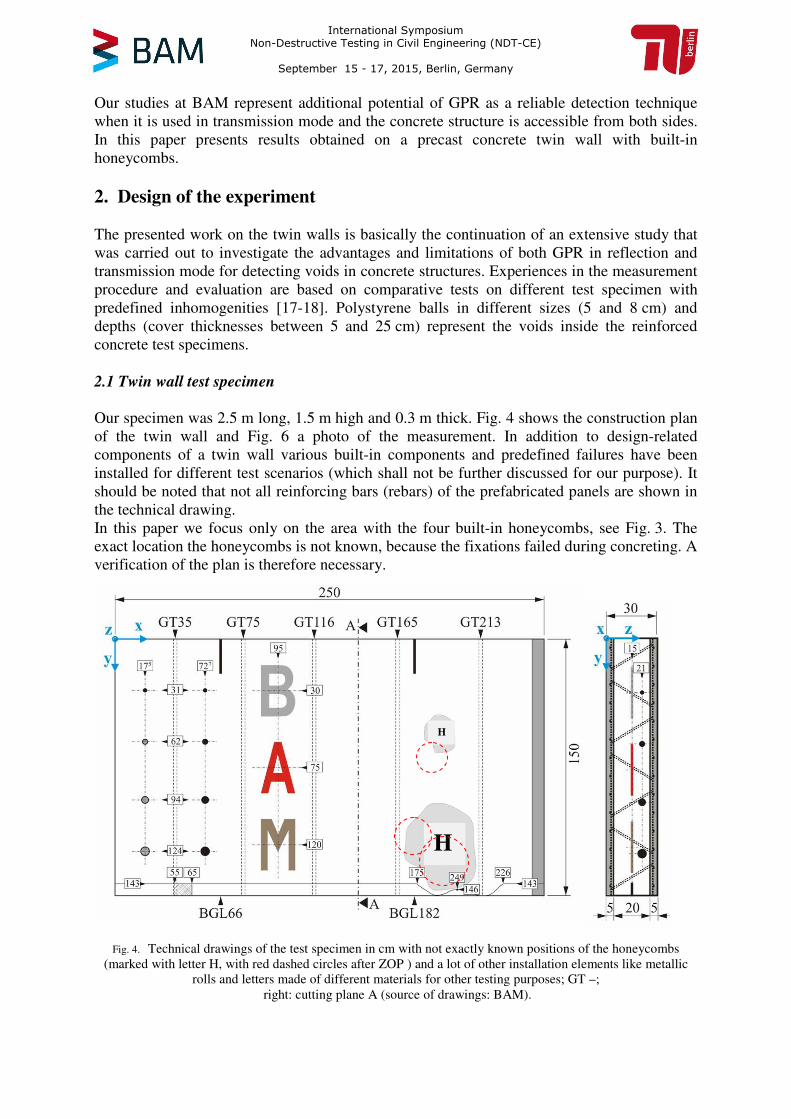
Our specimen was 2.5 m long, 1.5 m high and 0.3 m thick. Fig. 4 shows the construction plan of the twin wall and Fig. 6 a photo of the measurement. In addition to design-related components of a twin wall various built-in components and predefined failures have been installed for different test scenarios (which shall not be further discussed for our purpose). It should be noted that not all reinforcing bars (rebars) of the prefabricated panels are shown in the technical drawing. In this paper we focus only on the area with the four built-in honeycombs, see Fig. 3. The exact location the honeycombs is not known, because the fixations failed during concreting. A verification of the plan is therefore necessary.
Fig. 4. Technical drawings of the test specimen in cm with not exactly known positions of the honeycombs
(marked with letter H, with red dashed circles after ZOP ) and a lot of other installation elements like metallic rolls and letters made of different materials for other testing purposes; GT –;
right: cutting plane A (source of drawings: BAM).
H
H
International Symposium Non-Destructive Testing in Civil Engineering (NDT-CE)
September 15 - 17, 2015, Berlin, Germany
2.2 Method
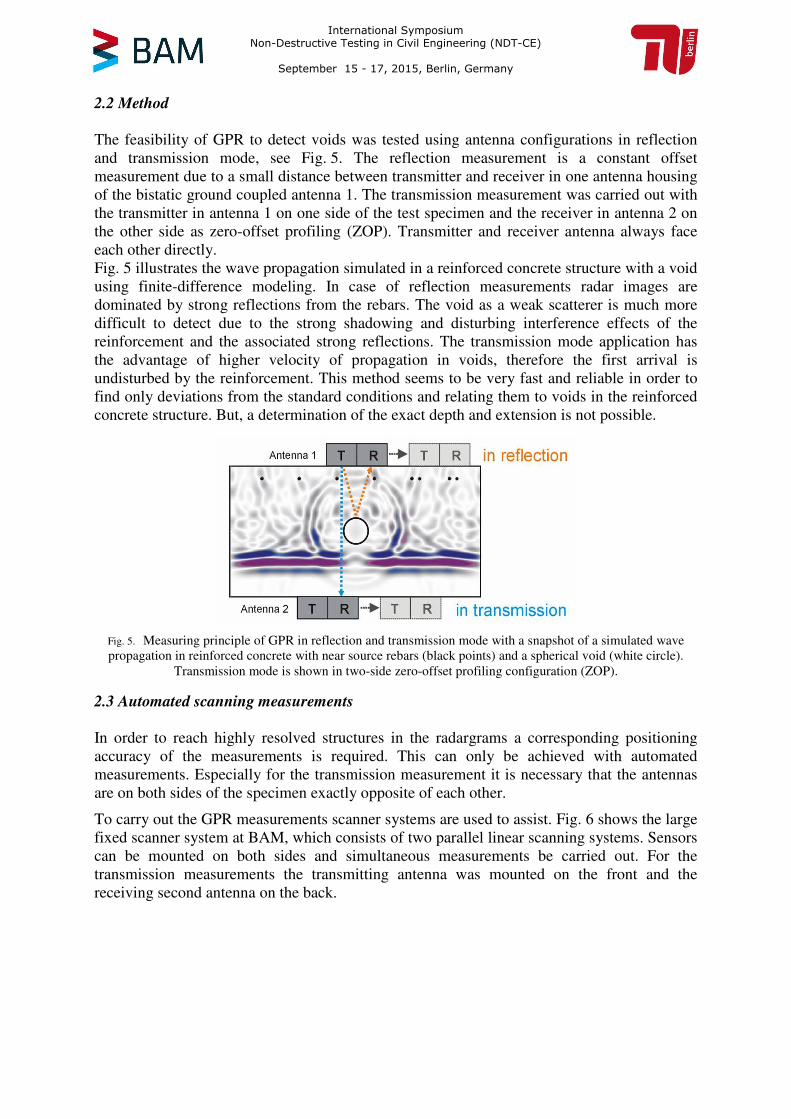
The feasibility of GPR to detect voids was tested using antenna configurations in reflection and transmission mode, see Fig. 5. The reflection measurement is a constant offset measurement due to a small distance between transmitter and receiver in one antenna housing of the bistatic ground coupled antenna 1. The transmission measurement was carried out with the transmitter in antenna 1 on one side of the test specimen and the receiver in antenna 2 on the other side as zero-offset profiling (ZOP). Transmitter and receiver antenna always face each other directly. Fig. 5 illustrates the wave propagation simulated in a reinforced concrete structure with a void using finite-difference modeling. In case of reflection measurements radar images are dominated by strong reflections from the rebars. The void as a weak scatterer is much more difficult to detect due to the strong shadowing and disturbing interference effects of the reinforcement and the associated strong reflections. The transmission mode application has the advantage of higher velocity of propagation in voids, therefore the first arrival is undisturbed by the reinforcement. This method seems to be very fast and reliable in order to find only deviations from the standard conditions and relating them to voids in the reinforced concrete structure. But, a determination of the exact depth and extension is not possible.
Fig. 5. Measuring principle of GPR in reflection and transmission mode with a snapshot of a simulated wave propagation in reinforced concrete with near source rebars (black points) and a spherical void (white circle).
Transmission mode is shown in two-side zero-offset profiling configuration (ZOP).
2.3 Automated scanning measurements
In order to reach highly resolved structures in the radargrams a corresponding positioning accuracy of the measurements is required. This can only be achieved with automated measurements. Especially for the transmission measurement it is necessary that the antennas are on both sides of the specimen exactly opposite of each other.
To carry out the GPR measurements scanner systems are used to assist. Fig. 6 shows the large fixed scanner system at BAM, which consists of two parallel linear scanning systems. Sensors can be mounted on both sides and simultaneous measurements be carried out. For the transmission measurements the transmitting antenna was mounted on the front and the receiving second antenna on the back.
International Symposium Non-Destructive Testing in Civil Engineering (NDT-CE)
September 15 - 17, 2015, Berlin, Germany

Fig. 6. View of the frontside of the twin wall specimen together with the large scanning system at BAM
For the presented GPR measurements the GSSI device SIR 20 was used. This device allowed a two-channel measurement, so that reflection and transmission measurements were carried out along parallel horizontal, meandering lines during a single measurement run.
Following measurement configuration was used: - 1.5 GHz and 2.6 GHz antennas - only one antenna configuration with antenna 1 at the front and antenna 2 at the back - 45° antenna orientation - measuring grid size of 2 mm in both direction, x and y
Due to our experiences from earlier works no further measurement configuration was tested except changing the antenna frequency. Especially for the reflection measurements, the antenna orientation is very important. To also look behind the reinforcement, the antenna should not be in line with the rebars. The dense grid of 2 mm and the simultanously measured reflection and transmission mode opens up possibilities for future evaluation with appropriate analysis software. 3. Results and discussion Also for the analysis of the data we greatly benefited from the results of previous investigations of voids in other test specimens [17-18]. For data evaluation and vizualisation the software from the University of Kassel was used [19]. In the first part, the results of the ZOP measurements are shown. For analyzing the first arrival of the transmitted waves raw data are sufficient. Time sections (x,y-slices) of the first arrivals were analysed to find the position of the anomalies . 3.1 Transmission mode The transmitted waves propagating through the honeycombs are faster and feature earlier first arrivals than the waves propagating through the surrounding material, see Fig. 7. The effect depends on the size and permittivity of the honeycomb but also depends on the antenna frequency. Fig. 7 shows the x,t-slice for the position of the upper honeycomb in the twin wall at y = 0.7 m along with the amplitude scan in x and y direction. This figure clearly shows the two effects: the shorter travel time and the reduced amplitude of the wave travelling through the void. The interference of the reinforcement on leads here only to a corresponding ripple time and amplitude response. Rebars represent an obstacle to the wave propagation, but in this case only of secondary importance due to their small diameter compared to the wavelength.
International Symposium Non-Destructive Testing in Civil Engineering (NDT-CE)
September 15 - 17, 2015, Berlin, Germany
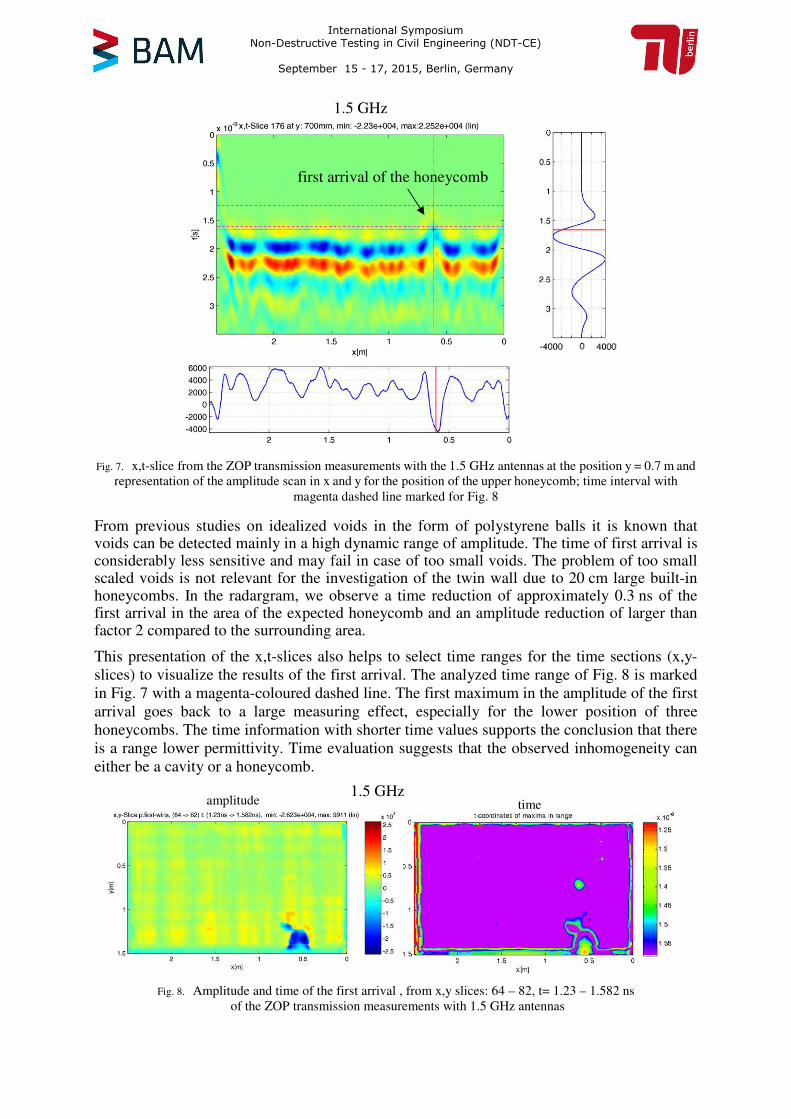
Fig. 7. x,t-slice from the ZOP transmission measurements with the 1.5 GHz antennas at the position y = 0.7 m and
representation of the amplitude scan in x and y for the position of the upper honeycomb; time interval with magenta dashed line marked for Fig. 8
From previous studies on idealized voids in the form of polystyrene balls it is known that voids can be detected mainly in a high dynamic range of amplitude. The time of first arrival is considerably less sensitive and may fail in case of too small voids. The problem of too small scaled voids is not relevant for the investigation of the twin wall due to 20 cm large built-in honeycombs. In the radargram, we observe a time reduction of approximately 0.3 ns of the first arrival in the area of the expected honeycomb and an amplitude reduction of larger than factor 2 compared to the surrounding area.
This presentation of the x,t-slices also helps to select time ranges for the time sections (x,y-slices) to visualize the results of the first arrival. The analyzed time range of Fig. 8 is marked in Fig. 7 with a magenta-coloured dashed line. The first maximum in the amplitude of the first arrival goes back to a large measuring effect, especially for the lower position of three honeycombs. The time information with shorter time values supports the conclusion that there is a range lower permittivity. Time evaluation suggests that the observed inhomogeneity can either be a cavity or a honeycomb.
Fig. 8. Amplitude and time of the first arrival , from x,y slices: 64 – 82, t= 1.23 – 1.582 ns
of the ZOP transmission measurements with 1.5 GHz antennas
amplitude time 1.5 GHz
1.5 GHz
first arrival of the honeycomb
International Symposium Non-Destructive Testing in Civil Engineering (NDT-CE)
September 15 - 17, 2015, Berlin, Germany
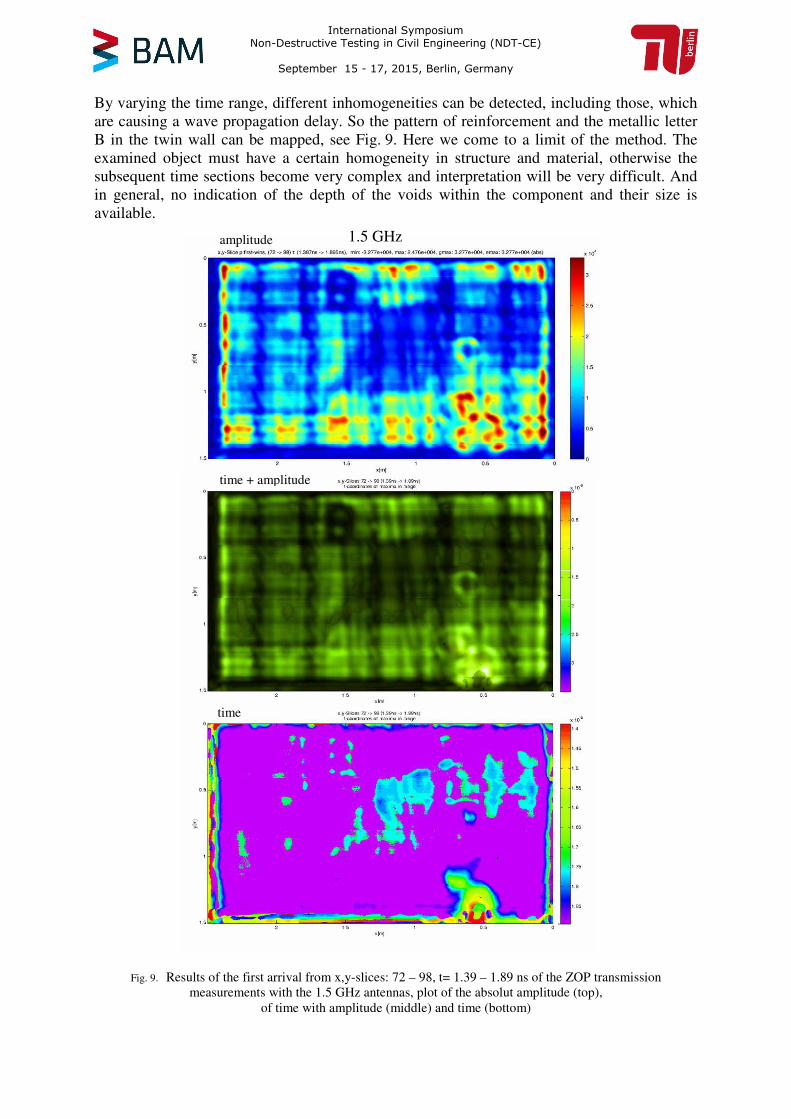
By varying the time range, different inhomogeneities can be detected, including those, which are causing a wave propagation delay. So the pattern of reinforcement and the metallic letter B in the twin wall can be mapped, see Fig. 9. Here we come to a limit of the method. The examined object must have a certain homogeneity in structure and material, otherwise the subsequent time sections become very complex and interpretation will be very difficult. And in general, no indication of the depth of the voids within the component and their size is available.
Fig. 9. Results of the first arrival from x,y-slices: 72 – 98, t= 1.39 – 1.89 ns of the ZOP transmission measurements with the 1.5 GHz antennas, plot of the absolut amplitude (top),
of time with amplitude (middle) and time (bottom)
1.5 GHz amplitude
time + amplitude
time
International Symposium Non-Destructive Testing in Civil Engineering (NDT-CE)
September 15 - 17, 2015, Berlin, Germany
The vizualisation software [19] enables the analysis of different characteristics of the first signal arrival in a time range, such as the first maximum or an average and cumulative sum, but no significant differences were observed. The disturbing edge effects, especially in the time plot, can be suppressed by the exclusion of sub-regions. Typically the amplitude representation in the figures has been selected so that the contrast between signal and noise will be maximized. Therefore comparative vizualisation of results in uniform amplitude axis (color scale) is usually not effective.
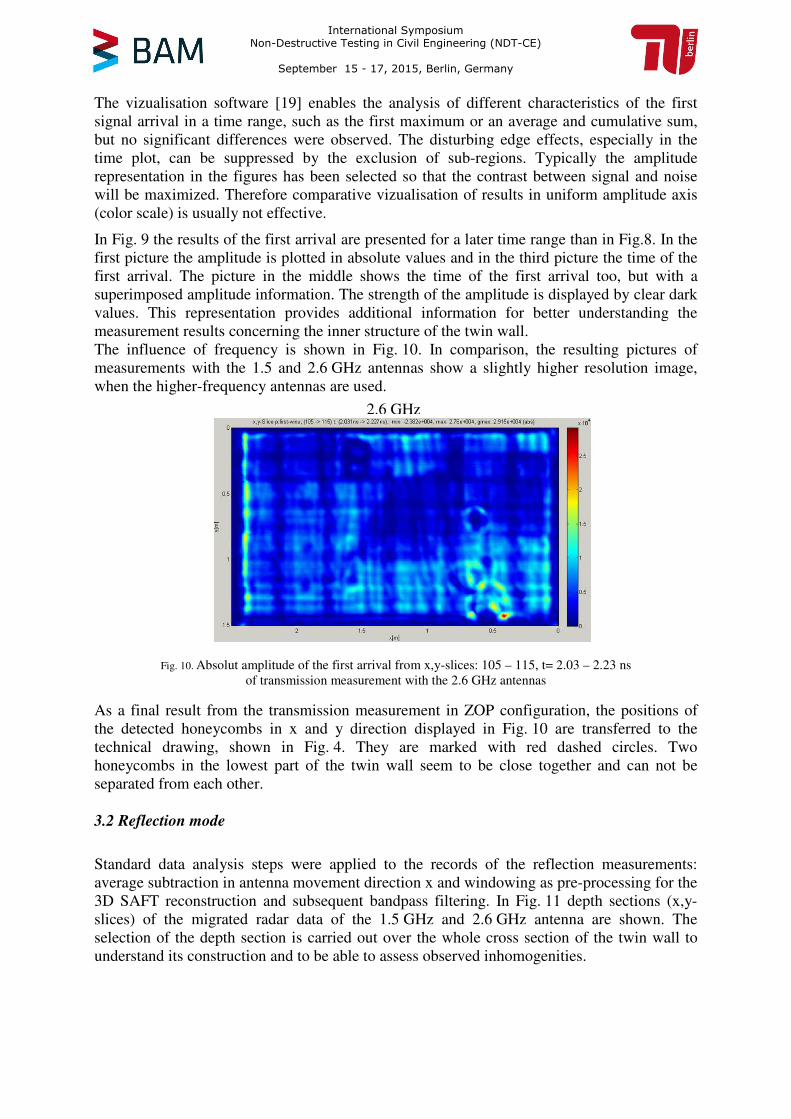
In Fig. 9 the results of the first arrival are presented for a later time range than in Fig.8. In the first picture the amplitude is plotted in absolute values and in the third picture the time of the first arrival. The picture in the middle shows the time of the first arrival too, but with a superimposed amplitude information. The strength of the amplitude is displayed by clear dark values. This representation provides additional information for better understanding the measurement results concerning the inner structure of the twin wall. The influence of frequency is shown in Fig. 10. In comparison, the resulting pictures of measurements with the 1.5 and 2.6 GHz antennas show a slightly higher resolution image, when the higher-frequency antennas are used.
Fig. 10. Absolut amplitude of the first arrival from x,y-slices: 105 – 115, t= 2.03 – 2.23 ns of transmission measurement with the 2.6 GHz antennas
As a final result from the transmission measurement in ZOP configuration, the positions of the detected honeycombs in x and y direction displayed in Fig. 10 are transferred to the technical drawing, shown in Fig. 4. They are marked with red dashed circles. Two honeycombs in the lowest part of the twin wall seem to be close together and can not be separated from each other. 3.2 Reflection mode
Standard data analysis steps were applied to the records of the reflection measurements: average subtraction in antenna movement direction x and windowing as pre-processing for the 3D SAFT reconstruction and subsequent bandpass filtering. In Fig. 11 depth sections (x,y-slices) of the migrated radar data of the 1.5 GHz and 2.6 GHz antenna are shown. The selection of the depth section is carried out over the whole cross section of the twin wall to understand its construction and to be able to assess observed inhomogenities.
2.6 GHz
International Symposium Non-Destructive Testing in Civil Engineering (NDT-CE)
September 15 - 17, 2015, Berlin, Germany
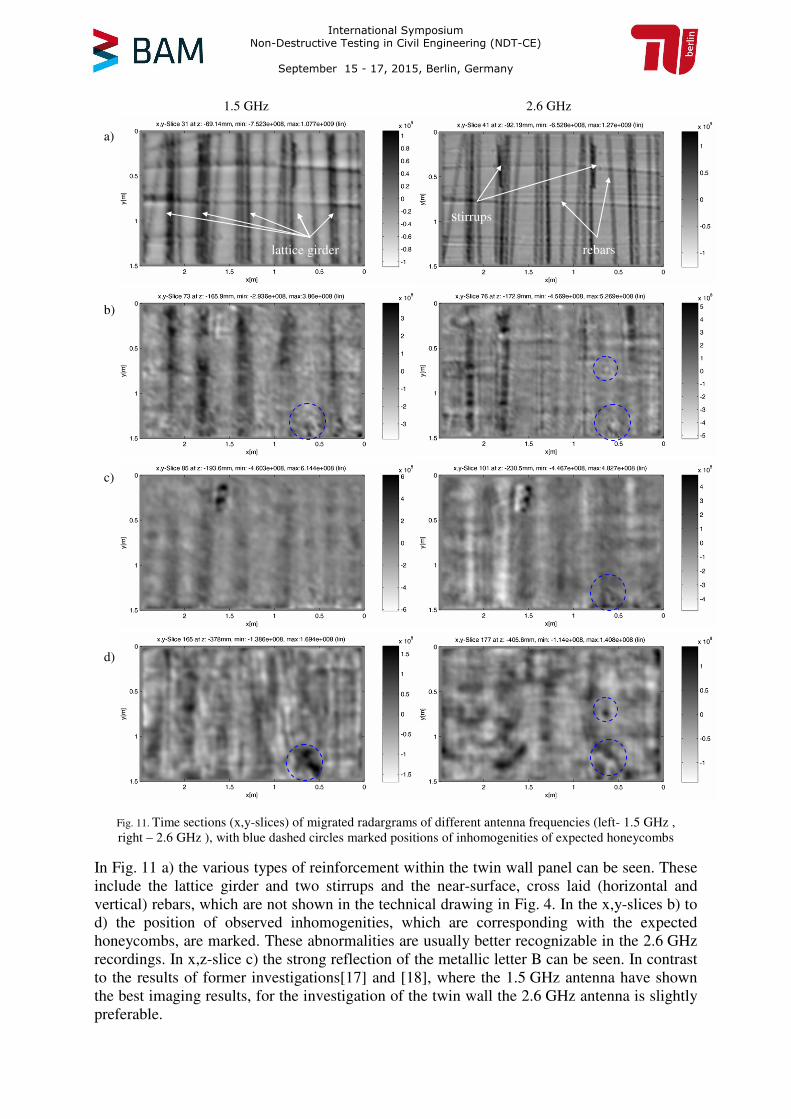
Fig. 11. Time sections (x,y-slices) of migrated radargrams of different antenna frequencies (left- 1.5 GHz , right – 2.6 GHz ), with blue dashed circles marked positions of inhomogenities of expected honeycombs
In Fig. 11 a) the various types of reinforcement within the twin wall panel can be seen. These include the lattice girder and two stirrups and the near-surface, cross laid (horizontal and vertical) rebars, which are not shown in the technical drawing in Fig. 4. In the x,y-slices b) to d) the position of observed inhomogenities, which are corresponding with the expected honeycombs, are marked. These abnormalities are usually better recognizable in the 2.6 GHz recordings. In x,z-slice c) the strong reflection of the metallic letter B can be seen. In contrast to the results of former investigations[17] and [18], where the 1.5 GHz antenna have shown the best imaging results, for the investigation of the twin wall the 2.6 GHz antenna is slightly preferable.
1.5 GHz 2.6 GHz
a)
b)
c)
d)
stirrups
lattice girder rebars
International Symposium Non-Destructive Testing in Civil Engineering (NDT-CE)
September 15 - 17, 2015, Berlin, Germany
4. Summary and conclusion GPR measurements were performed in reflection and transmission mode with 1.5 GHz and 2.6 GHz antennas on a precast concrete twin wall specimen to test the reliability of these methods. Two-channel measurements were carried out along a dense grid using commercial compact radar systems adapted to an automated scanner system. ZOP zero-offset profiling (ZOP) mode in transmission measurements is the more efficient GPR technique for detecting voids in reinforced concrete structures in comparison to reflection measurements, both in terms of the measurement effort as well as regarding evaluation and reliability. However, two-sided access must be given and it has to be taken into account that information about the depth of the detected inhomogeneities is not possible. This method is also less affected by antenna configurations, such as frequency and antenna polarization and it is relatively robust with respect to positioning. A positioning accuracy in centimeter range is sufficient. Due to the large size of the built-in honeycombs they can be mapped by the reduced amplitude as well as by the early first arrivals. For the latter though the honeycombs must not undercut a critical size. According to our evaluation the transmission method has the potential for routine use on construction sites. However, some technological development would be necessary, providing the possibility of wireless measurements. Communication between the two antennas for triggering the measurement is another important point. Generally the use of a scanning system that has been modified and optimized for the construction site under investigation is recommended.
Acknowledgements
The project was funded by the Deutsche Forschungsgemeinschaft. This work is of interest for COST Action TU1208 "Civil Engineering Applications of Ground Penetrating Radar. We are grateful for the support of our colleagues from BAM Division 8.2 during casting specimen and Dr.-Ing. Stefan Maack for making available the twin wall. References
1. D M McCann and M C Forde, 'Review of NDT methods in the assessment of concrete
and masonry structures', NDT & E International 34 (2), pp 71-84, 2001 2. Ch Maierhofer, H-W Reinhard and G Dobmann, 'Non-Destructive Evaluation of
Reinforced Concrete Structures, Volume 2 - Non-Destructive Testing Methods', Woodhead Publishing, 624 pages, July 2010
3. J H Bungey and S G Millard, 'Testing of Concrete in Structures', Third Edition, 3, revised, CRC Press, 296 pages, 2010
4. J Krautkrämer and H Krautkrämer, 'Ultrasonic testing of materials', 4th fully rev. ed. Berlin; New York: Springer-Verlag, 677 pages, ISBN 3-540-51231-4, 1990
5. D J Daniels, 'Ground Penetrating Radar', 2nd Edition, Volume 1, Technology and Engineerin, 726 pages, 2004
6. Ch Maierhofer, 'Nondestructive Evaluation of Concrete Infrastructure with Ground Penetrating Radar' in Journal of materials in civil engineering, Vol 15, No 3, pp 287-297, May/June 2003
7. J Hugenschmidt and R Mastrangelo, 'GPR inspection of concrete bridges', Cement & Concrete Composites, 28, pp 384- 392, 2006
International Symposium Non-Destructive Testing in Civil Engineering (NDT-CE)
September 15 - 17, 2015, Berlin, Germany
8. T R Cantor, 'Review of penetrating radar as applied to the non-destructive testing of concrete', Spec. Publ., SP 82-89, American Concrete Institute, Detroit, pp 581-602, 1984
9. J H Bungey, 'Sub-surface radar testing of concrete: a review', Construction and Building Materials, 18. pp 1-8, 2004
10. J H Bungey, S G Millard and M R Shaw, 'The influence of reinforcing steel on radar surveys of reinforced concrete', Construction and Building Materials, 8 (2), pp 119-126, 1994
11. N J Cassidy, R Eddies and S Dods, 'Void detection beneath reinforced concrete sections: The practical application of ground-penetrating radar and ultrasonic techniques', Journal of Applied Geophysics, Vol 74(4), pp 263-276, 2011
12. A Goodier and S L Matthews, 'Radar investigation of honeycombed concrete', Proceedings of Structural Faults and Repair, London, Edinburgh: Engineering Technics Press, 1999
13. A Garbacz, J Steinbruch, Z Hlaváč, L Hobst and O Anton, 'Defect Detection in Concrete Structure by NDT methods: Impact-Echo Versus Radar', Proc. of NDE for Safety, Brno, Brno University of Technology, Faculty of Mechanical Engineering, pp 21-28, ISBN 978-80-214-3973-3, 2009
14. D Mähner, S Thünemann and M Becker, 'Nachweis von Strukturdefekten in Elementwänden mittels zerstörungsfreier Prüfverfahren', Ernst & Sohn Verlag, Beton- und Stahlbetonbau 105, Heft 12, pp 787-796, 2010
15. Lee Ka Kin, 'Evaluation of the effectiveness of using high frequency surface penetrating radar and ultrasonic pulse wave signal with time-frequency analysis on honeycomb in early stage concrete', Master of Science dissertation, City University of Hong Kong, Department of Physics and Materials Science, (AP6309 Advanced Research), 52 pages, July 2013
16. G Parkinson and C Ékes, 'Ground penetrating radar evaluation of concrete tunnel linings', In: 12th International Conference on Ground Penetrating Radar, Birmingham, UK, 11 pages, 2008
17. Ch Trela, Th Kind, M Schubert and M Günther, 'Detection of weak scatterers in reinforced concrete structures', Université catholique de Louvain, Proceedings of GPR 2014 - 15th International conference on ground penetrating rada, pp 904-910, 2014
18. Ch Trela, Th Kind and M, Schubert, 'Detection of air voids in concrete by radar in transmission mode', Proceedings of 8th International Workshop on Advanced Ground Penetrating Radar - IWAGPR 2015, Florence, Italy, July 2015
19. K Mayer, 'Softwarepaket InterSAFT zur bildgebenden Auswertung von Radar- und Ultraschallmessdaten' Universität Kassel, FG Theorie der Elektrotechnik und Photonik. Kassel, 2014
International Symposium Non-Destructive Testing in Civil Engineering (NDT-CE)
September 15 - 17, 2015, Berlin, Germany