ground-penetrating radar - semantic scholar · ground-penetrating radar ~ 133 history of gpr in...
TRANSCRIPT

7
Ground-Penetrating Radar
Lawrence B. Conyers
Ground-penetrating radar (GPR) has recently gained a wide acceptance in the archaeological community as a method that can quickly and accurately locate bur-ied archaeological features, artifacts, and important cultural strata in the near-sur-face. The GPR method has been especially effective in certain sediments and soils between about 20 cm and 5 m below the ground surface, where the targets to be imaged are fairly large, hollow, or linear or have significant physical and chemical properties that contrast with the surrounding medium. Features as diverse as Mayan house platforms and plazas (Conyers 1995), burial tombs (Goodman and Nishimura 1993), historic cellars, privies, and graves (Bevan and Kenyon 1975), camp sites (Vaughan 1986), and pit dwellings and kivas (Conyers and Cameron 1998) have been discovered and mapped using the method. The archaeological community has also recently seen the need for near-surface mapping using GPR in order to identify buried cultural remains for protection and future preservation and as a planning tool for selective excavation.
Ground-penetrating radar has a reputation as one of the more complex of archaeo-logical geophysical methods because it collects large amounts of reflection data from numerous transects within grids, oftentimes producing massive three-dimensional da-tabases. The ability to detect multiple interfaces at different depths below the surface, the interpretation of these numerous reflections, and the difficulty in correlating the abundance of reflections between many profiles within a grid can make GPR data col-lection and processing a somewhat intimidating venture for the uninitiated. However,
132 ~ Lawrence B. Conyers
with modern data acquisition and processing and a knowledge of how radar energy travels and reflects from interfaces in the ground, GPR mapping in archaeology need not be as daunting as its reputation suggests.
Some of the earliest model GPR systems recorded raw subsurface reflection data on paper printouts that allowed little postacquisition processing. Although these radar systems, a few of which are still in use, can many times yield valuable subsurface information, modern digital systems record reflection data on a com-puter hard drive for later filtering, processing, and sophisticated data analysis. Most important, when the data are digital, a computer can process, filter, and enhance raw field data almost immediately after they are collected. Computer manipula-tion of the digital data, which removes unwanted noise and enhances the portions of the signal that are important, allows for rapid data processing and dramatically increases subsurface resolution and interpretation of complex data sets. Accompa-nied by a trend in equipment miniaturization, computer processing of the acquired GPR data can now occur immediately after they are acquired and interpretation can often begin while the operators are still in the field. The recently acquired speed at which data can be filtered, processed, and interpreted can often allow archaeolo-gists to produce three-dimensional images of buried features just hours after data are acquired. When this is done, further data acquisition or the planning of exca-vations to confirm features of interest that have been discovered can begin almost immediately, making geophysical data collection, interpretation, and excavation an iterative process.
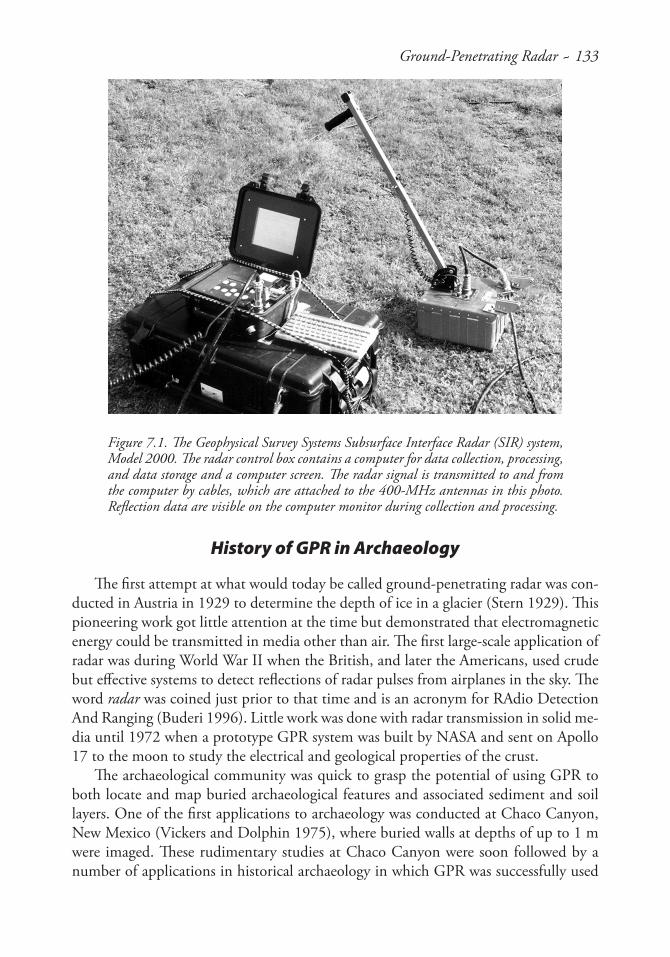
Modern GPR systems are quite compact and easy to use. The typical system con-sists of surface antennas, a radar system to produce pulses, a computer to process and save the data, a video monitor, a keyboard, and a power source (Figure 7.1). This system can be easily transported to the field by plane, car, and backpack. Processing of data can be done in the laboratory or while in the field using a portable laptop computer. A complete system can be purchased for about $20,000 and used systems for substantially less. GPR systems with multiple antennas can also be rented from a number of vendors for about $200 per day.
With careful planning and the ability to work in areas that are not cluttered or topographically complex, GPR data for grids of 50 × 50 m or more, with a 50-cm profile separation, can be collected in a day. If transects within grids must be shortened or lengthened to avoid obstacles or many small grids must be constructed to cover the targeted areas, the amount of ground that can be covered can be substantially less. It is also often desirable to collect and process data from an area one day, process them that night, and then re-collect them again the next day using different antenna con-figurations, grid orientations, or other collection parameters depending on the results. Processing programs that produce images very quickly from complex databases now allow these kinds of immediate results in the form of processed profiles and plan maps of reflections at various depths in the ground. These types of data-analysis products will be discussed more below.
Ground-Penetrating Radar ~ 133
History of GPR in Archaeology
The first attempt at what would today be called ground-penetrating radar was con-ducted in Austria in 1929 to determine the depth of ice in a glacier (Stern 1929). This pioneering work got little attention at the time but demonstrated that electromagnetic energy could be transmitted in media other than air. The first large-scale application of radar was during World War II when the British, and later the Americans, used crude but effective systems to detect reflections of radar pulses from airplanes in the sky. The word radar was coined just prior to that time and is an acronym for RAdio Detection And Ranging (Buderi 1996). Little work was done with radar transmission in solid me-dia until 1972 when a prototype GPR system was built by NASA and sent on Apollo 17 to the moon to study the electrical and geological properties of the crust.
The archaeological community was quick to grasp the potential of using GPR to both locate and map buried archaeological features and associated sediment and soil layers. One of the first applications to archaeology was conducted at Chaco Canyon, New Mexico (Vickers and Dolphin 1975), where buried walls at depths of up to 1 m were imaged. These rudimentary studies at Chaco Canyon were soon followed by a number of applications in historical archaeology in which GPR was successfully used
Figure 7.1. The Geophysical Survey Systems Subsurface Interface Radar (SIR) system, Model 2000. The radar control box contains a computer for data collection, processing, and data storage and a computer screen. The radar signal is transmitted to and from the computer by cables, which are attached to the 400-MHz antennas in this photo. Reflection data are visible on the computer monitor during collection and processing.
134 ~ Lawrence B. Conyers
to search for buried barn walls, stone walls, and underground storage cellars (Bevan and Kenyon 1975; Kenyon 1977). In these early studies, what were described as “radar echoes” were recognized in paper printouts as being generated from the tops of buried walls, and depth estimates were made, using approximate velocity measurements from local soil characteristics.
Initial successes in historical archaeology applications were followed in 1979 by work at the Hala Sultan Tekke site in Cyprus (Fischer et al. 1980) and the Ceren site in El Salvador (Sheets et al. 1985). Both of these GPR surveys produced unprocessed reflection profiles that were successful in delineating buried walls, house platforms, and other archaeological features as radar anomalies. Most of the initial GPR successes can be attributed to the very dry material that covered the archaeological remains, which was almost “transparent” to radar energy propagation, allowing for deep energy pen-etration and the production of relatively uncomplicated reflection records that were easy to interpret in the field.
A comprehensive series of GPR surveys were conducted in Japan in the mid-1980s to locate buried sixth-century houses, burial mounds, and what were called “cultural layers” (Imai et al. 1987). These studies were successful in identifying ancient pit dwell-ings with clay floors, which were buried in some cases by as much as 2 m of volcanic pumice and loamy soil. The interface of the house floors with the overlying pumice produced very distinctive reflections that were easily recognizable on GPR profiles. Most important, much of the site discovered by GPR was excavated to confirm the re-sults. Other ancient features were discovered and found to be burial mounds and asso-ciated trenches. Three distinct “cultural layers,” visible in reflection profiles, were found to be buried soil horizons containing many stone artifacts, with each layer delineating a different occupational period. This important conclusion allowed GPR profiles to be used to map the ancient landscape of each distinct living surface throughout portions of the site that had not been excavated.
Throughout the late 1980s and early 1990s, GPR continued to be used suc-cessfully in a number of archaeological contexts, with a growing usage in cul-tural resource management (CRM) projects. In most cases these studies were little more than “anomaly hunting” exercises. Usually unprocessed or partially processed GPR profiles were viewed as paper records or on a computer screen as they were acquired, and interesting reflections, which could possibly have ar-chaeological meaning, were targeted for excavation. These types of “on the fly” acquisition and interpretation methods led to mixed results, with a few successes but sometimes leaving field archaeologists with the impression that GPR was a “hit or miss” method at best.
Prior to 1993 the most encompassing and successful archaeological applications of GPR were those employed in the mapping of the houses and burial mounds in Japan, discussed above (Imai et al. 1987). These successes were soon followed by numerous other Japanese GPR surveys, conducted by Dean Goodman and his col-leagues (Goodman 1994; Goodman and Nishimura 1993; Goodman et al. 1994;
Ground-Penetrating Radar ~ 135
Goodman et al. 1995). These advancements were possible because about the same time GPR manufacturers began to produce systems that could store reflection data as digital files, allowing large amounts of data to be collected for later processing. Also, inexpensive and increasingly powerful personal computers had become available that could process digital data in ways that were not previously possible, at least on the typically small archaeological budgets. The pioneering studies of Goodman and his collaborators led to many important GPR acquisition and data-processing tech-niques, including amplitude slice maps, computer-simulated two-dimensional mod-els, and three-dimensional reconstructions of buried features (Conyers 2004; Conyers and Goodman 1997; Goodman et al. 1994; Goodman et al. 1995; Goodman et al. 1998). The development of the amplitude slice-map method was one of the single most important developments that made GPR technology more understandable to the archaeological community. This data-processing and mapping technique allows huge amounts of data from many tens of reflection profiles in a grid to be processed simultaneously, producing maps of the areal distribution of reflections analogous to ar-bitrary levels in standard archaeological excavations. Another important development was computer programs that have the ability to produce synthetic computer models of buried archaeological features and associated stratigraphy, which were also used as an aid in interpretation during data analysis (Conyers 1995; Goodman 1994). These ad-vancements and the application of many more advanced data-processing techniques in the 1990s (Goodman et al. 1995) demonstrated that even radar data that do not yield immediately visible reflections can still contain valuable reflection data when computer processed (Conyers and Cameron 1998).
Recent research has demonstrated (and quantitatively assessed) the differences in data quality among numerous antenna frequencies and the differences in data quality that can occur because of line spacing and the density of reflections along transects (Neubauer et al. 2002). This type of research has demonstrated how variable field acquisition parameters can greatly influence the final product (Conyers et al. 2002a, 2002b). The ability of GPR to collect data in a three-dimensional block has recently led some researchers to begin analyzing reflected wave amplitudes in complex ways (Goodman et al. 1998; Moran et al. 1998). If higher amplitudes can be shown to denote the location of important buried archaeological features, then their locations in three dimensions can be analyzed and visualized using a number of software pro-grams. In this way, the lower amplitude reflections are effectively removed from the data set and only those of importance remain. The locations in space of certain radar amplitudes, which are proxies for the actual location of features in the ground, are then rendered in a number of fashions to produce “virtual reality” images of what lies below the surface, much like CT scans are used in the medical profession (Conyers et al. 2002b). This has been done by cutting through the block of data (Neubauer et al. 2002) or rendering out only the higher amplitudes and presenting images of buried archaeological remains in a three-dimensional, rotating image (Conyers et al. 2002b; Leckebusch and Peikert 2001).
136 ~ Lawrence B. Conyers
The GPR Method
GPR is a geophysical method that can accurately map the spatial extent of near-surface objects and archaeological features or changes in soil media and ultimately produce images of those materials. Radar waves are propagated in distinct pulses from a surface antenna, reflected off buried objects, features, bedding contacts, or soil units, and detected back at the source by a receiving antenna. As radar pulses are transmit-ted through various materials on their way to the buried targets, their velocity changes depending on the physical and chemical properties of the material through which they travel (Conyers 2004; Conyers and Goodman 1997). The greater the contrast in elec-trical and to some extent magnetic properties between two materials at a subsurface interface, the greater the strength of the reflected signal and therefore the greater the amplitude of the reflected waves. When the travel times of energy pulses are measured and their velocity through the ground is known, distance (or depth in the ground) can be accurately measured to produce a three-dimensional data set (Conyers and Lucius 1996). Each time a radar pulse traverses a material with a different composition or wa-ter saturation, the velocity changes and a portion of the radar energy is reflected back to the surface to be recorded at the receiving antenna. The remaining energy continues to pass into the ground to be further reflected, until it finally spreads and dissipates with depth.
Recording Radar Reflections
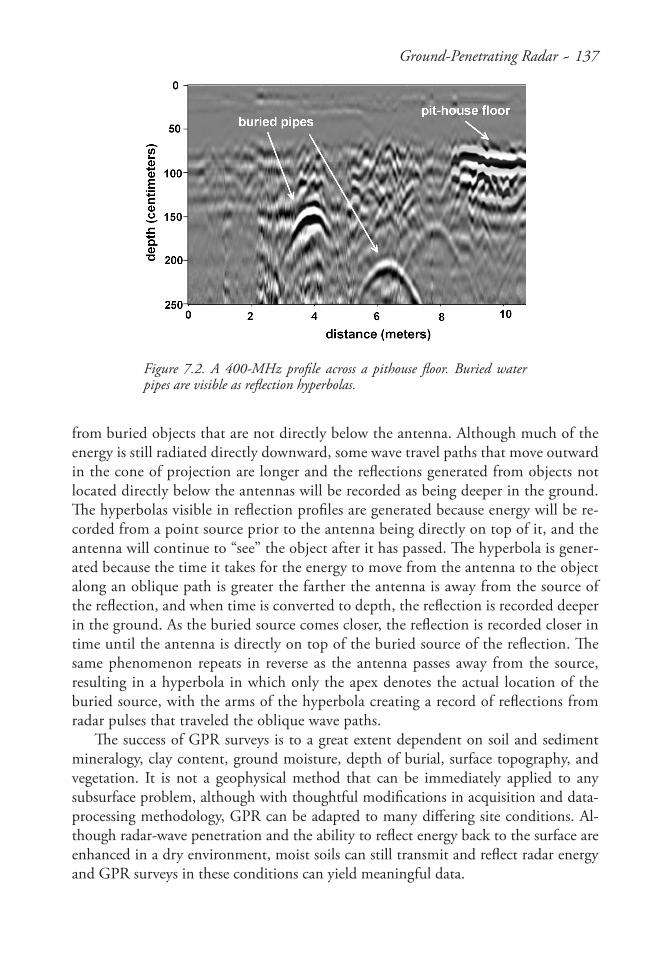
In the GPR method, radar antennas are moved along the ground in linear transects and two-dimensional profiles of a large number of periodic reflections are created, pro-ducing a profile of subsurface stratigraphy and buried features along each line (Figure 7.2). When data are acquired in a series of transects within a grid, and the reflections are correlated and processed, an accurate three-dimensional picture of buried features and associated stratigraphy can be constructed.
Reflections occur at buried discontinuities where there are changes in the electri-cal properties of the sediment or soil, variations in water content, lithologic changes, or changes in bulk density. Reflections can also be produced at interfaces between anomalous archaeological features and the surrounding soil or sediment. Void spaces in the ground such as caskets in cemeteries, tunnels, and buried pipes or conduits made of either metal or plastic will also generate strong radar reflections as a result of a significant change in radar-wave velocity. These features tend to produce reflection hyperbolas generated from a distinct “point feature” in the subsurface (Figure 7.2), which could be archaeological in origin but also produced from buried stones, tree roots, or tunnels created by burrowing animals. These point source hyperbolas are produced because GPR antennas generate a transmitted radar beam that propagates from the surface down into the ground in a conical pattern, radiating outward as it travels deeper in the ground (Conyers 2004; Conyers and Goodman 1997:35). Radar energy leaving the surface antenna will therefore spread out with depth and be reflected
Ground-Penetrating Radar ~ 137
from buried objects that are not directly below the antenna. Although much of the energy is still radiated directly downward, some wave travel paths that move outward in the cone of projection are longer and the reflections generated from objects not located directly below the antennas will be recorded as being deeper in the ground. The hyperbolas visible in reflection profiles are generated because energy will be re-corded from a point source prior to the antenna being directly on top of it, and the antenna will continue to “see” the object after it has passed. The hyperbola is gener-ated because the time it takes for the energy to move from the antenna to the object along an oblique path is greater the farther the antenna is away from the source of the reflection, and when time is converted to depth, the reflection is recorded deeper in the ground. As the buried source comes closer, the reflection is recorded closer in time until the antenna is directly on top of the buried source of the reflection. The same phenomenon repeats in reverse as the antenna passes away from the source, resulting in a hyperbola in which only the apex denotes the actual location of the buried source, with the arms of the hyperbola creating a record of reflections from radar pulses that traveled the oblique wave paths.
The success of GPR surveys is to a great extent dependent on soil and sediment mineralogy, clay content, ground moisture, depth of burial, surface topography, and vegetation. It is not a geophysical method that can be immediately applied to any subsurface problem, although with thoughtful modifications in acquisition and data-processing methodology, GPR can be adapted to many differing site conditions. Al-though radar-wave penetration and the ability to reflect energy back to the surface are enhanced in a dry environment, moist soils can still transmit and reflect radar energy and GPR surveys in these conditions can yield meaningful data.
Figure 7.2. A 400-MHz profile across a pithouse floor. Buried water pipes are visible as reflection hyperbolas.
138 ~ Lawrence B. Conyers
Depth of Penetration and Resolution
The depth to which radar energy can penetrate and the amount of definition that can be expected in the subsurface is partially controlled by the frequency of the radar energy transmitted. The frequency controls both the wavelength of the propagating wave and the amount of spreading and attenuation of the energy in the ground.
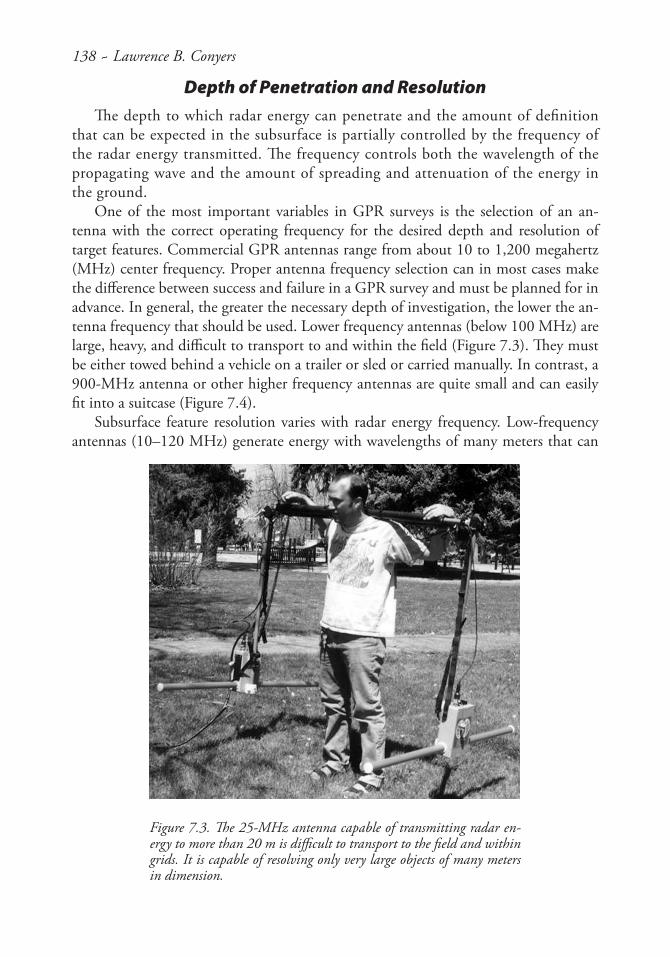
One of the most important variables in GPR surveys is the selection of an an-tenna with the correct operating frequency for the desired depth and resolution of target features. Commercial GPR antennas range from about 10 to 1,200 megahertz (MHz) center frequency. Proper antenna frequency selection can in most cases make the difference between success and failure in a GPR survey and must be planned for in advance. In general, the greater the necessary depth of investigation, the lower the an-tenna frequency that should be used. Lower frequency antennas (below 100 MHz) are large, heavy, and difficult to transport to and within the field (Figure 7.3). They must be either towed behind a vehicle on a trailer or sled or carried manually. In contrast, a 900-MHz antenna or other higher frequency antennas are quite small and can easily fit into a suitcase (Figure 7.4).
Subsurface feature resolution varies with radar energy frequency. Low-frequency antennas (10–120 MHz) generate energy with wavelengths of many meters that can
Figure 7.3. The 25-MHz antenna capable of transmitting radar en-ergy to more than 20 m is difficult to transport to the field and within grids. It is capable of resolving only very large objects of many meters in dimension.

Ground-Penetrating Radar ~ 139
penetrate up to 50 m in certain conditions but are capable of resolving only very large subsurface fea-tures. In contrast, the maximum depth of penetra-tion of a 900-MHz antenna is about 1 m or less in typical soils, but its generated reflections can re-solve features down to a few centimeters. A trade-off therefore exists between depth of penetration and subsurface resolution. These factors are highly variable, depending on many site-specific factors such as overburden composition and porosity and the amount of moisture retained in the soil.
How Materials in the Ground Affect the GPR Signal
The primary goal of most archaeological GPR investigations is to differentiate subsurface in-terfaces, whether they are archaeological or geo-logical. All sediment and soil layers, as well as ar-chaeological features, have particular electrical and magnetic properties that affect radar-wave velocity, reflection, and dissipation in the ground (Conyers 2004; Conyers and Goodman 1997). The propa-gation velocity of radar waves depends on a num-ber of factors, the most important ones being the electrical and chemical properties of the material through which they pass (Olhoeft 1981). Radar waves in air travel at the speed of light, which is about 30 cm per nanosecond (one nanosecond is one billionth of a second). When radar energy travels through dry sand, its velocity slows to about 15 cm per nanosecond (Conyers 2004). If the radar energy were then to pass through water-saturated sand or a clay layer, its velocity would slow further to about 5 cm per nanosecond or less.
Radar energy both disperses and attenuates as it radiates into the ground. When portions of the original transmitted signal reflect back toward the surface, they suffer additional attenuation before finally being recorded at the surface. Therefore, to be detected as reflections, important subsurface interfaces not only must have a sufficient electrical (or magnetic) contrast at their boundary but also must be located at a shallow enough depth where sufficient radar energy is still available for reflection and reception back at the surface. As radar energy propagates to increasing depths, the signal becomes weaker and is spread out over more surface area. Less energy is then available for re-flection and it is likely only very low-amplitude waves will be recorded. It is therefore usually necessary to enhance reflections that come from deeper in the ground, using an amplitude adjustment method called range gaining. The gain factors to be applied
Figure 7.4. The 900-MHz antenna can transmit energy to about 1 m at most but can resolve features to about 10 cm in diameter.
140 ~ Lawrence B. Conyers
to the reflections are usually adjusted specifically for each site and are unique for those ground materials present at the time the survey is performed. Sometimes these gain functions are applied prior to recording the data in the field, or they may be applied afterward when the data set is processed.
The velocity of radar travel in the ground can also be defined by a particular con-stant for each material called its relative dielectric permittivity (RDP). The higher the RDP, the slower radar waves travel in that material. The ability of the ground to transmit radar energy to depth is not affected by the RDP, which is only a measure-ment of the velocity of energy movement. Whether energy will be able to penetrate into the ground is purely a function of the electrical conductivity (and to a lesser extent the magnetic permeability) of that material. Ground that has a higher elec-trical conductivity, such as some wet clays, will remove the electrical portion of the propagating electromagnetic radar waves, effectively attenuating all radar propaga-tion. Low-conductivity ground, such as dry quartz sand, will readily allow radar en-ergy propagation to depth, usually at a fairly high velocity. But some materials could have a high RDP (radar will travel through them at a relatively slow rate) but also a low electrical conductivity, and even though the energy is moving relatively slowly, it will still propagate fairly deeply into the ground. In ground with a high electrical conductivity, no radar energy will travel to any great depth no matter what its RDP might be.
Reflection of radar energy in the ground occurs at interfaces between materials with differing RDP. Any change in velocity of propagating radar energy will generate a reflected wave that travels back to the surface and will be detected at the surface an-tenna. Only a portion of the radar energy is reflected, while some continues to depth to be reflected further until it is finally absorbed by the ground. Changes in RDP at buried interfaces are primarily a function of the magnitude of the difference in electri-cal properties between two materials on either side of that interface, which also affects velocity (and RDP). The greater the change in RDP at those interfaces, the stronger the reflected wave (Sellman et al. 1983). Higher amplitude reflected waves recorded at the surface antenna are a product of reflection from the contact between highly different materials such as sand and clay or, for example, the boundary between a house floor and the surrounding matrix.
The ability to discern radar reflections in GPR data is related to the amplitude of those reflected waves. Higher amplitude waves produce more visible reflections, which can be denoting the presence of buried archaeological materials or natural stratigraph-ic interfaces. Lower amplitude reflections, such as those generated from subtle soil changes, usually occur when there are only small differences in the electrical properties between layers. Subtle changes in the nature of buried soil or sediment layers are usu-ally all but invisible to the human eye but are still recorded in GPR profiles as small digital changes in their amplitudes. In order to enhance these changes, so they may be mapped and viewed, sophisticated amplitude analyses discussed below must be applied to the data set.
Ground-Penetrating Radar ~ 141
Computer Processing to Produce Images of Features in the Ground
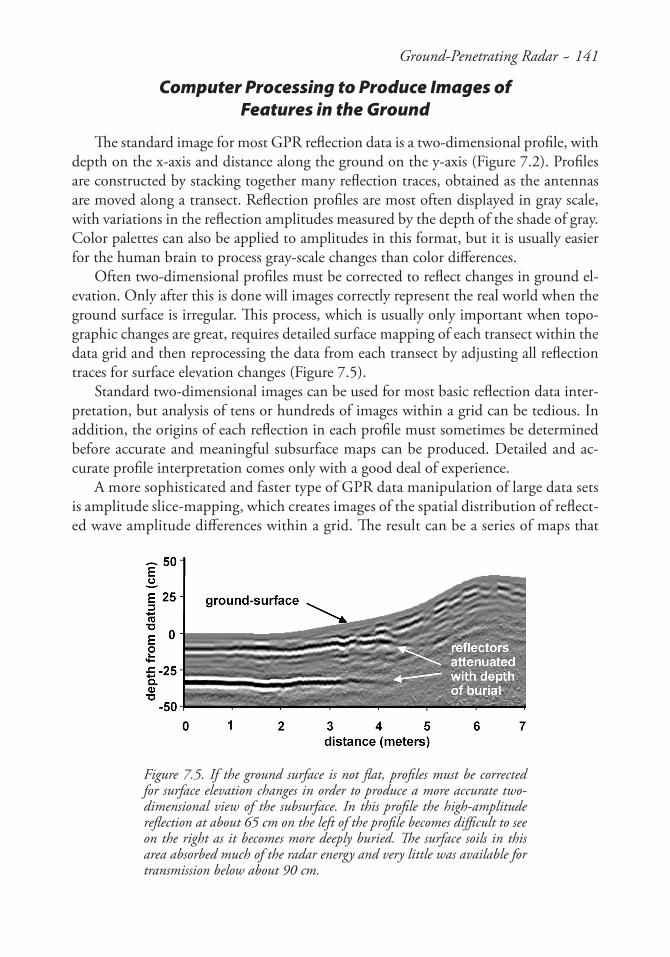
The standard image for most GPR reflection data is a two-dimensional profile, with depth on the x-axis and distance along the ground on the y-axis (Figure 7.2). Profiles are constructed by stacking together many reflection traces, obtained as the antennas are moved along a transect. Reflection profiles are most often displayed in gray scale, with variations in the reflection amplitudes measured by the depth of the shade of gray. Color palettes can also be applied to amplitudes in this format, but it is usually easier for the human brain to process gray-scale changes than color differences.
Often two-dimensional profiles must be corrected to reflect changes in ground el-evation. Only after this is done will images correctly represent the real world when the ground surface is irregular. This process, which is usually only important when topo-graphic changes are great, requires detailed surface mapping of each transect within the data grid and then reprocessing the data from each transect by adjusting all reflection traces for surface elevation changes (Figure 7.5).
Standard two-dimensional images can be used for most basic reflection data inter-pretation, but analysis of tens or hundreds of images within a grid can be tedious. In addition, the origins of each reflection in each profile must sometimes be determined before accurate and meaningful subsurface maps can be produced. Detailed and ac-curate profile interpretation comes only with a good deal of experience.
A more sophisticated and faster type of GPR data manipulation of large data sets is amplitude slice-mapping, which creates images of the spatial distribution of reflect-ed wave amplitude differences within a grid. The result can be a series of maps that
Figure 7.5. If the ground surface is not flat, profiles must be corrected for surface elevation changes in order to produce a more accurate two-dimensional view of the subsurface. In this profile the high-amplitude reflection at about 65 cm on the left of the profile becomes difficult to see on the right as it becomes more deeply buried. The surface soils in this area absorbed much of the radar energy and very little was available for transmission below about 90 cm.
142 ~ Lawrence B. Conyers
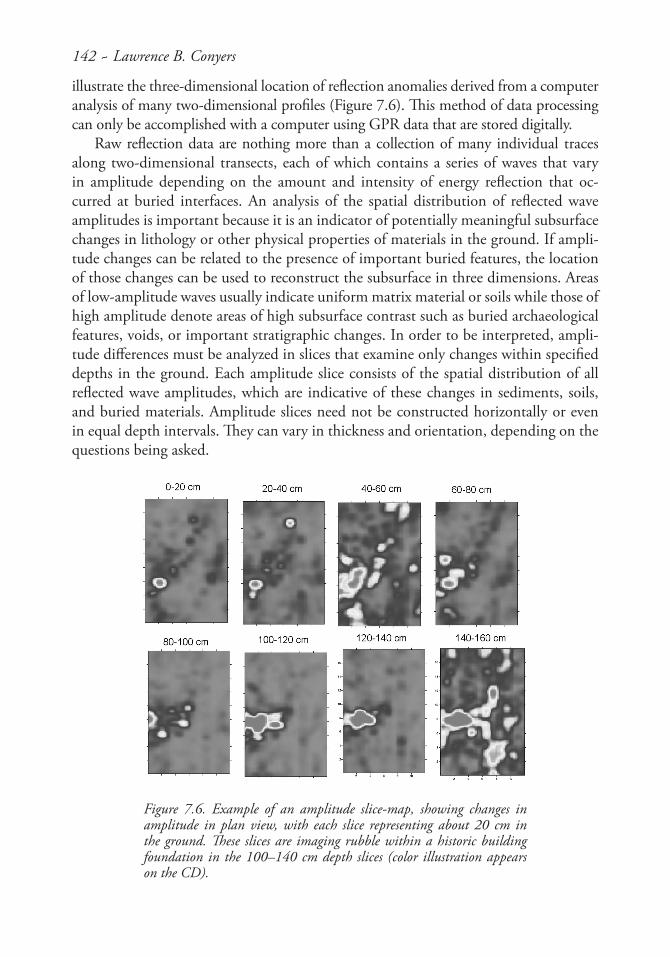
illustrate the three-dimensional location of reflection anomalies derived from a computer analysis of many two-dimensional profiles (Figure 7.6). This method of data processing can only be accomplished with a computer using GPR data that are stored digitally.
Raw reflection data are nothing more than a collection of many individual traces along two-dimensional transects, each of which contains a series of waves that vary in amplitude depending on the amount and intensity of energy reflection that oc-curred at buried interfaces. An analysis of the spatial distribution of reflected wave amplitudes is important because it is an indicator of potentially meaningful subsurface changes in lithology or other physical properties of materials in the ground. If ampli-tude changes can be related to the presence of important buried features, the location of those changes can be used to reconstruct the subsurface in three dimensions. Areas of low-amplitude waves usually indicate uniform matrix material or soils while those of high amplitude denote areas of high subsurface contrast such as buried archaeological features, voids, or important stratigraphic changes. In order to be interpreted, ampli-tude differences must be analyzed in slices that examine only changes within specified depths in the ground. Each amplitude slice consists of the spatial distribution of all reflected wave amplitudes, which are indicative of these changes in sediments, soils, and buried materials. Amplitude slices need not be constructed horizontally or even in equal depth intervals. They can vary in thickness and orientation, depending on the questions being asked.
Figure 7.6. Example of an amplitude slice-map, showing changes in amplitude in plan view, with each slice representing about 20 cm in the ground. These slices are imaging rubble within a historic building foundation in the 100–140 cm depth slices (color illustration appears on the CD).
Ground-Penetrating Radar ~ 143
To produce horizontal amplitude slice-maps the computer compares amplitude variations within traces that were recorded within a defined time window. For instance, if data were recorded to a maximum of 30 nanoseconds in the ground, six slices of 5 nanoseconds in thickness would be analyzed and the spatial distribution of amplitudes in each slice would be produced. When this is done both positive and negative ampli-tudes of reflections are compared to the norm of all amplitudes within that window. No differentiation is usually made between positive or negative amplitudes in these analyses; only the magnitude of amplitude deviation from the norm is expressed. An abrupt change between an area of low and high amplitude can be very significant and may indicate the presence of a major buried interface between two media. Degrees of amplitude variation in each slice can be assigned arbitrary colors or shades of gray along a nominal scale. Usually there are no specific amplitude units assigned to these color or tonal changes.
Slices that are produced in thicknesses based on radar travel time can readily be converted to depth slices, if the velocity of energy movement through the material (or its RDP) is calculated. This is the preferred format for most archaeological applications. There are a number of computer programs available that can estimate velocity of radar travel times from individual reflection profiles; alternatively, direct measurements can be made in the field if open excavations are present (Conyers and Lucius 1996). Direct velocity measurements can be obtained by inserting a metal object (a pipe or other object of this sort) horizontally into the face of an excavation and measuring its depth in centimeters. Metal is a perfect radar reflector, and when antennas are pulled over the buried pipe, it will often be visible as distinct reflection hyperbolas. Radar-wave travel times to the object can then be measured and velocity easily calculated. This average velocity can then be used to convert all time measurements to approximate depth in the ground for final data presentation.
Methods of Ground Truthing GPR Maps and Profiles
Two-dimensional reflection profiles, once processed and corrected spatially, give an accurate representation of what lies below the surface. However, it is always important to recognize that reflection records do not necessarily mimic exactly what is in the sub-surface. This is because radar energy travels not only in a vertical line from the surface antenna to the object or surface of interest and then directly back to the receiving an-tenna but also in other complex paths. It spreads out from the antenna, and therefore reflections are recorded that were generated from outside the plane of the transect and from in front of and behind the surface antenna. In addition, radar waves often reflect multiple times from buried objects, as they “bounce around” between layers in the ground and other large objects, before finally being recorded back at the surface. Waves of radar energy can also refract at boundaries between distinct layers, further creating a sometimes confusing picture of the subsurface. An understanding of the complexity of GPR reflection profiles comes with experience, as well as from directly comparing
144 ~ Lawrence B. Conyers
reflection profiles to the “real world,” using ground truthing methods (comparing geo-physical images with what is known to be in the ground).
The same holds true for three-dimensional maps produced from the spatial analy-sis of the amplitudes of GPR reflections. These maps are produced from many hun-dreds or thousands of reflections in a grid. Often in ground truthing the amplitude slice-maps it is necessary first to compare the amplitudes mapped with the two-dimensional profiles in order to make sure the origin of the mapped images in the slices is known. At that point, if subsurface confirmation of at least some of the reflections can be made, the overall confidence of the remaining portions of the maps increases. But in all cases some kind of subsurface confirmation of features imaged with GPR is important.
This kind of verification can be accomplished by standard archaeological excava-tions including shovel test pits, square excavations, and trenches. If the mapped fea-tures visible in amplitude slice-maps are found to be strata of interest (for instance, a layer that could be a buried soil), cores or auger samples can be taken and their depth compared with the GPR reflections in individual profiles. Sometimes, if mapped fea-tures are fairly close to the surface, hard layers (perhaps rocks or buried walls) can be discerned by soil probes, which give less direct confirmation but are easy to use, and this testing is very quickly accomplished.
In all cases interpretations based only on GPR reflections can be prone to errors. While many very distinct features, such as standing walls or hard-packed and dense stratigraphic surfaces, are easily recognizable and can be interpreted with some con-fidence, more subtle features such as soil composition changes are often difficult to discover and interpret. For this reason, integration of good subsurface information from cores, excavations, probes, or augers with GPR amplitude slice-maps and profiles is always a necessity.
Limits of GPR in Archaeology
Although GPR is a powerful tool for imaging and mapping the subsurface, there are some limitations in its applicability to CRM archaeology, the most obvious limita-tion being depth of investigation. The trade-off that exists between depth of investi-gation and resolution can be important if buried features and stratigraphic interfaces of interest are buried too deeply. Below about 2–3 m, low-frequency antennas (300 MHz and lower) are necessary for the transmission of radar energy. With those anten-nas, resolution is diminished, making many subtle changes in beds and archaeological features all but invisible in GPR profiles and maps. If high resolution is necessary to map smaller features of interest, with the present technology, they must be fairly close to the surface.
The chemical and physical properties of the medium through which radar energy must pass can also be a limiting factor in GPR studies. Any medium that is electrically conductive, such as some wet clays, or any sediment or soil with a high electrolyte
Ground-Penetrating Radar ~ 145
content (those high in salts or carbonate, for instance) will attenuate radar energy quite rapidly and often the resulting GPR data can be unusable. The same can hold true for sediment or soil that is highly magnetic, but materials of this sort are relatively rare.
Soil moisture differences can often severely disrupt radar energy, producing reflec-tions that are difficult to interpret and obscuring those that are potentially meaningful. If an area has been recently irrigated or there has been a recent heavy rain, pools of water can be differentially preserved in buried sediments and soils. When this happens, radar reflections may occur from both the pools of water and the zones or objects of interest, complicating the data.
It is often difficult to know in advance whether ground conditions are conducive for GPR studies. Some have tried to predict GPR success based on soil survey maps or gross generalizations about the geology of an area (Collins and Kurtz 1998). While these types of analyses can be a useful guide in a general sense, GPR success in a specific area can usually only be determined by actually collecting and processing data.
One of the greatest limitations to the GPR method in CRM archaeology is the tim-ing of its use. Usually GPR surveys are conducted prior to excavations, which is only natural because archaeologists would always like to know in advance what is under the ground before they dig. When surveys are done in this way, there are usually anxious excavators waiting for results, with often unrealistic expectations that GPR surveys will tell them everything they want to know about the subsurface (Conyers 1999). Some-times this approach works well and exciting archaeological features just jump out of processed maps, leaving little ambiguity about their origin. These types of features are usually those that are most distinct, such as house floors, walls, and other architecture that would be hard to miss by even the most inexperienced GPR interpreter. In much CRM archaeology, when the target features are often much more subtle, they can be difficult to find, and it is often challenging to make a definitive interpretation. In these cases interpretations that would please the excavator, the client, and the geophysi-cal archaeologist can be arrived at only by merging and integrating information from excavations, GPR data, and other sources. Unfortunately, the timing of many CRM projects precludes this iterative process of give and take, making many GPR maps less useful to many archaeological projects than they should be.
The correct way to use GPR in archaeological mapping would be to first collect the reflection data and interpret them, with the knowledge that the results will often reveal only a little about the subsurface. Those maps and profiles can then be used as a guide to test interesting features and horizons using excavations or coring and augering. The data from this ground truthing should then be integrated back into the GPR data so that horizons and features of interest can be remapped, using stratigraphic information obtained from the ground. This type of timing necessitates what amounts to a “first look” at the GPR, then a reinterpretation of it, and often a third round of data analy-sis, as new information comes to light. CRM archaeologists who expect this type of prolonged analysis and budget for it in terms of time and expenses will be much more satisfied with the final results.
146 ~ Lawrence B. Conyers
Examples of Successful GPR Surveys
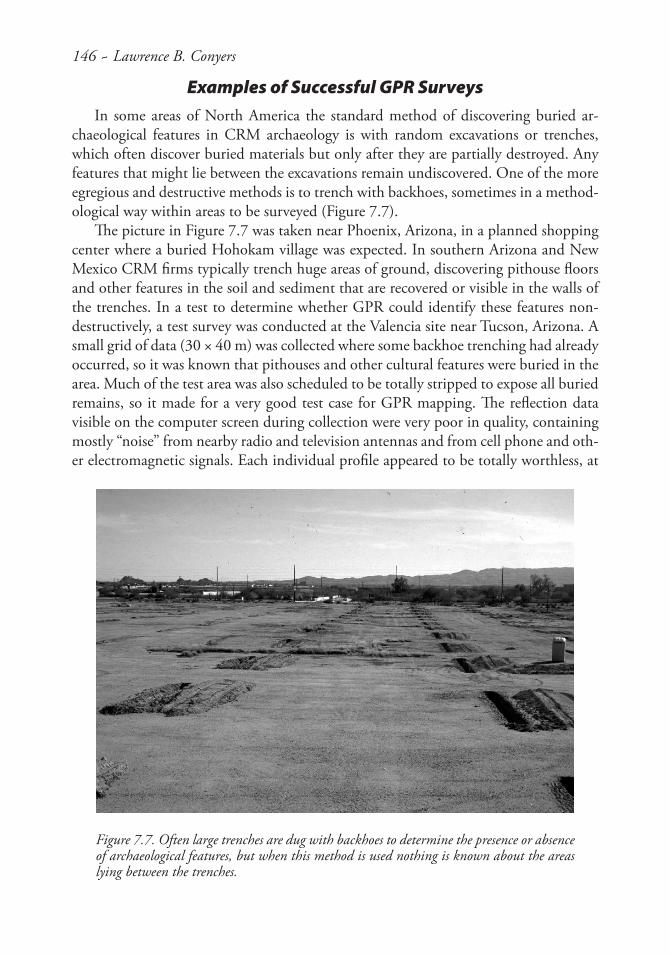
In some areas of North America the standard method of discovering buried ar-chaeological features in CRM archaeology is with random excavations or trenches, which often discover buried materials but only after they are partially destroyed. Any features that might lie between the excavations remain undiscovered. One of the more egregious and destructive methods is to trench with backhoes, sometimes in a method-ological way within areas to be surveyed (Figure 7.7).
The picture in Figure 7.7 was taken near Phoenix, Arizona, in a planned shopping center where a buried Hohokam village was expected. In southern Arizona and New Mexico CRM firms typically trench huge areas of ground, discovering pithouse floors and other features in the soil and sediment that are recovered or visible in the walls of the trenches. In a test to determine whether GPR could identify these features non-destructively, a test survey was conducted at the Valencia site near Tucson, Arizona. A small grid of data (30 × 40 m) was collected where some backhoe trenching had already occurred, so it was known that pithouses and other cultural features were buried in the area. Much of the test area was also scheduled to be totally stripped to expose all buried remains, so it made for a very good test case for GPR mapping. The reflection data visible on the computer screen during collection were very poor in quality, containing mostly “noise” from nearby radio and television antennas and from cell phone and oth-er electromagnetic signals. Each individual profile appeared to be totally worthless, at
Figure 7.7. Often large trenches are dug with backhoes to determine the presence or absence of archaeological features, but when this method is used nothing is known about the areas lying between the trenches.
Ground-Penetrating Radar ~ 147
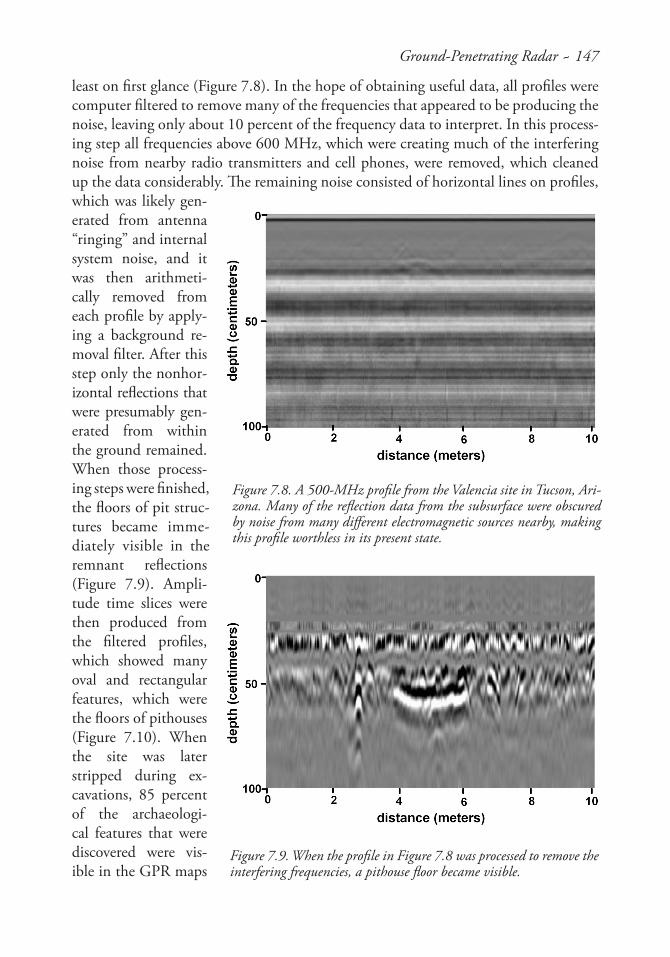
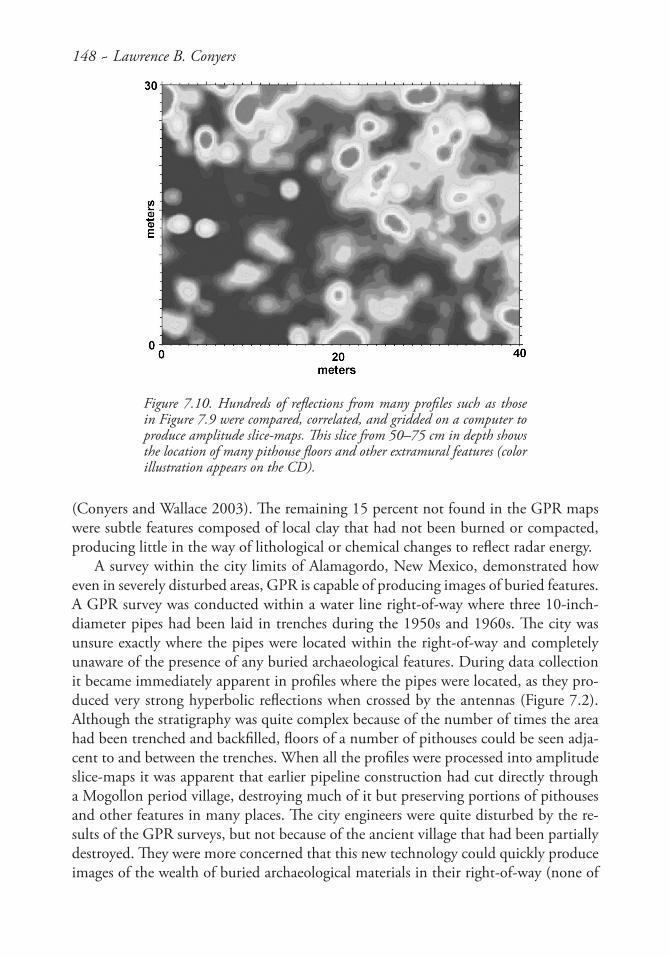
least on first glance (Figure 7.8). In the hope of obtaining useful data, all profiles were computer filtered to remove many of the frequencies that appeared to be producing the noise, leaving only about 10 percent of the frequency data to interpret. In this process-ing step all frequencies above 600 MHz, which were creating much of the interfering noise from nearby radio transmitters and cell phones, were removed, which cleaned up the data considerably. The remaining noise consisted of horizontal lines on profiles, which was likely gen-erated from antenna “ringing” and internal system noise, and it was then arithmeti-cally removed from each profile by apply-ing a background re-moval filter. After this step only the nonhor-izontal reflections that were presumably gen-erated from within the ground remained. When those process-ing steps were finished, the floors of pit struc-tures became imme-diately visible in the remnant reflections (Figure 7.9). Ampli-tude time slices were then produced from the filtered profiles, which showed many oval and rectangular features, which were the floors of pithouses (Figure 7.10). When the site was later stripped during ex-cavations, 85 percent of the archaeologi-cal features that were discovered were vis-ible in the GPR maps
Figure 7.8. A 500-MHz profile from the Valencia site in Tucson, Ari-zona. Many of the reflection data from the subsurface were obscured by noise from many different electromagnetic sources nearby, making this profile worthless in its present state.
Figure 7.9. When the profile in Figure 7.8 was processed to remove the interfering frequencies, a pithouse floor became visible.
148 ~ Lawrence B. Conyers
(Conyers and Wallace 2003). The remaining 15 percent not found in the GPR maps were subtle features composed of local clay that had not been burned or compacted, producing little in the way of lithological or chemical changes to reflect radar energy.
A survey within the city limits of Alamagordo, New Mexico, demonstrated how even in severely disturbed areas, GPR is capable of producing images of buried features. A GPR survey was conducted within a water line right-of-way where three 10-inch-diameter pipes had been laid in trenches during the 1950s and 1960s. The city was unsure exactly where the pipes were located within the right-of-way and completely unaware of the presence of any buried archaeological features. During data collection it became immediately apparent in profiles where the pipes were located, as they pro-duced very strong hyperbolic reflections when crossed by the antennas (Figure 7.2). Although the stratigraphy was quite complex because of the number of times the area had been trenched and backfilled, floors of a number of pithouses could be seen adja-cent to and between the trenches. When all the profiles were processed into amplitude slice-maps it was apparent that earlier pipeline construction had cut directly through a Mogollon period village, destroying much of it but preserving portions of pithouses and other features in many places. The city engineers were quite disturbed by the re-sults of the GPR surveys, but not because of the ancient village that had been partially destroyed. They were more concerned that this new technology could quickly produce images of the wealth of buried archaeological materials in their right-of-way (none of
Figure 7.10. Hundreds of reflections from many profiles such as those in Figure 7.9 were compared, correlated, and gridded on a computer to produce amplitude slice-maps. This slice from 50–75 cm in depth shows the location of many pithouse floors and other extramural features (color illustration appears on the CD).
Ground-Penetrating Radar ~ 149
which was detectible by traditional methods), necessitating additional cultural analysis before their proposed construction could begin.
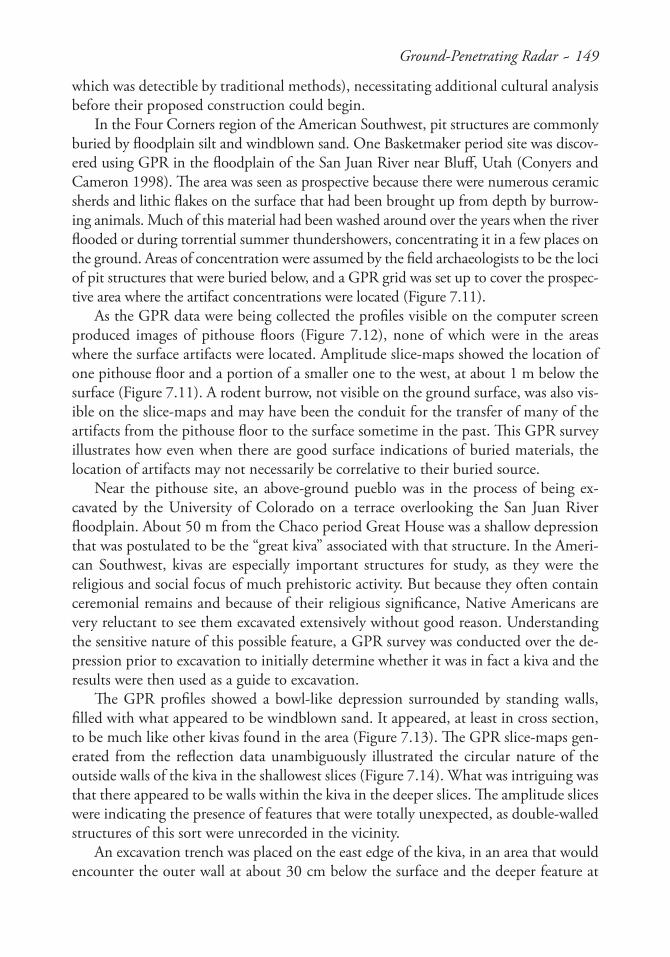
In the Four Corners region of the American Southwest, pit structures are commonly buried by floodplain silt and windblown sand. One Basketmaker period site was discov-ered using GPR in the floodplain of the San Juan River near Bluff, Utah (Conyers and Cameron 1998). The area was seen as prospective because there were numerous ceramic sherds and lithic flakes on the surface that had been brought up from depth by burrow-ing animals. Much of this material had been washed around over the years when the river flooded or during torrential summer thundershowers, concentrating it in a few places on the ground. Areas of concentration were assumed by the field archaeologists to be the loci of pit structures that were buried below, and a GPR grid was set up to cover the prospec-tive area where the artifact concentrations were located (Figure 7.11).
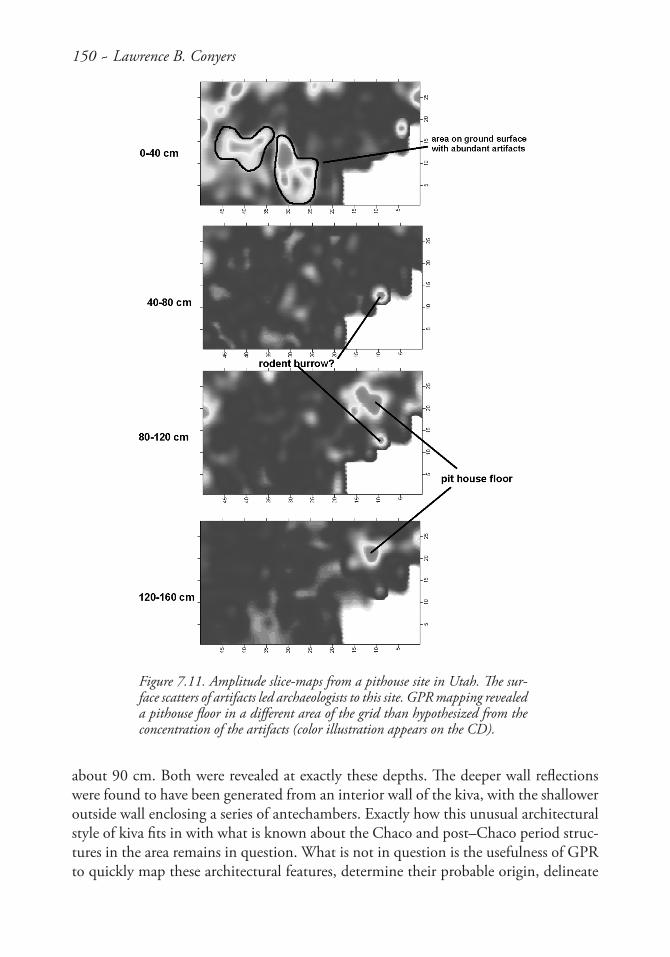
As the GPR data were being collected the profiles visible on the computer screen produced images of pithouse floors (Figure 7.12), none of which were in the areas where the surface artifacts were located. Amplitude slice-maps showed the location of one pithouse floor and a portion of a smaller one to the west, at about 1 m below the surface (Figure 7.11). A rodent burrow, not visible on the ground surface, was also vis-ible on the slice-maps and may have been the conduit for the transfer of many of the artifacts from the pithouse floor to the surface sometime in the past. This GPR survey illustrates how even when there are good surface indications of buried materials, the location of artifacts may not necessarily be correlative to their buried source.
Near the pithouse site, an above-ground pueblo was in the process of being ex-cavated by the University of Colorado on a terrace overlooking the San Juan River floodplain. About 50 m from the Chaco period Great House was a shallow depression that was postulated to be the “great kiva” associated with that structure. In the Ameri-can Southwest, kivas are especially important structures for study, as they were the religious and social focus of much prehistoric activity. But because they often contain ceremonial remains and because of their religious significance, Native Americans are very reluctant to see them excavated extensively without good reason. Understanding the sensitive nature of this possible feature, a GPR survey was conducted over the de-pression prior to excavation to initially determine whether it was in fact a kiva and the results were then used as a guide to excavation.
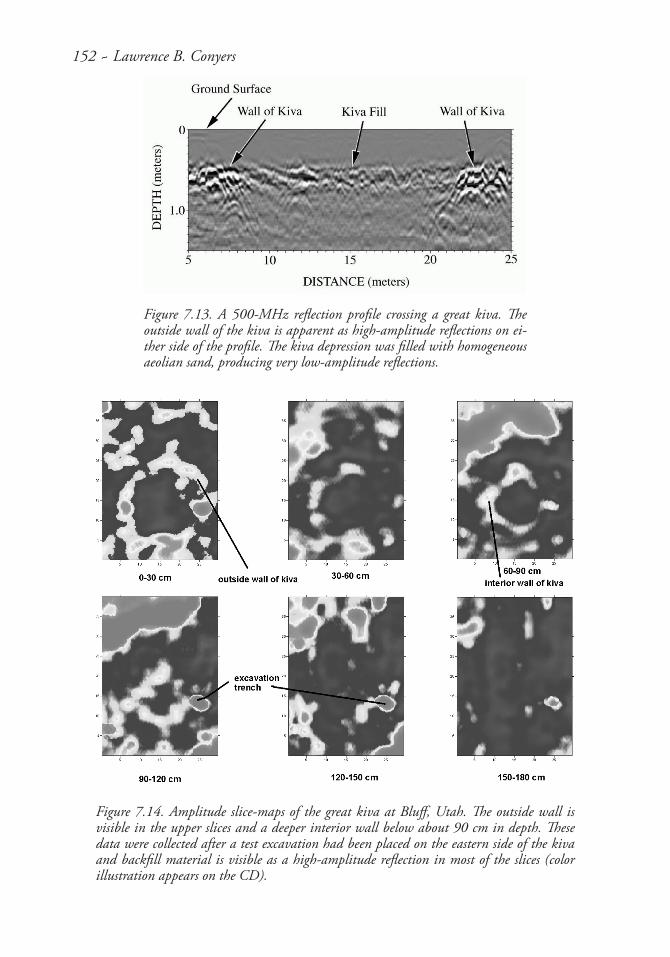
The GPR profiles showed a bowl-like depression surrounded by standing walls, filled with what appeared to be windblown sand. It appeared, at least in cross section, to be much like other kivas found in the area (Figure 7.13). The GPR slice-maps gen-erated from the reflection data unambiguously illustrated the circular nature of the outside walls of the kiva in the shallowest slices (Figure 7.14). What was intriguing was that there appeared to be walls within the kiva in the deeper slices. The amplitude slices were indicating the presence of features that were totally unexpected, as double-walled structures of this sort were unrecorded in the vicinity.
An excavation trench was placed on the east edge of the kiva, in an area that would encounter the outer wall at about 30 cm below the surface and the deeper feature at
150 ~ Lawrence B. Conyers
about 90 cm. Both were revealed at exactly these depths. The deeper wall reflections were found to have been generated from an interior wall of the kiva, with the shallower outside wall enclosing a series of antechambers. Exactly how this unusual architectural style of kiva fits in with what is known about the Chaco and post–Chaco period struc-tures in the area remains in question. What is not in question is the usefulness of GPR to quickly map these architectural features, determine their probable origin, delineate
Figure 7.11. Amplitude slice-maps from a pithouse site in Utah. The sur-face scatters of artifacts led archaeologists to this site. GPR mapping revealed a pithouse floor in a different area of the grid than hypothesized from the concentration of the artifacts (color illustration appears on the CD).
Ground-Penetrating Radar ~ 151
features within the kiva, and guide excavations precisely so that impor-tant elements could be studied with limited in-trusion into the ceremo-nial structure.
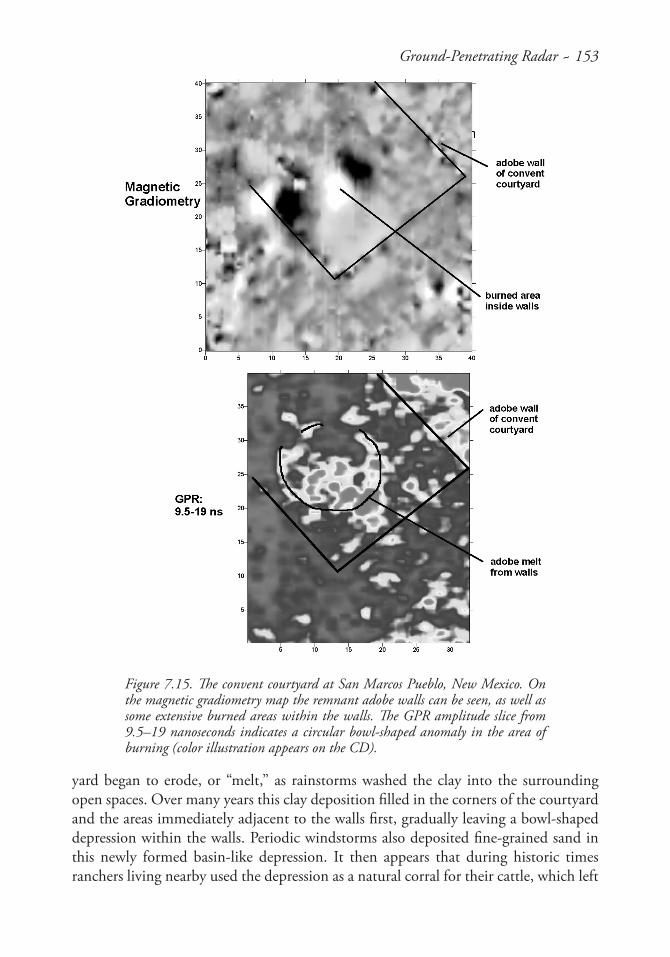
The utility of employ-ing multiple geophysi-cal methods at the same archaeological site is just being realized and will play an increasingly im-portant role in archaeo-logical geophysics. At the San Marcos Pueblo in New Mexico, both GPR and magnetic gradiometry data were collected, which provided different but comple-mentary images of the subsurface. The grids were collected at this huge site just to the south of a Spanish colonial church, which had been burned during the Pueblo revolt of the late seventeenth century. The magnetic gradiometry map indicated a series of linear features in an area that previous work has postulated was the location of the convent courtyard, as it was adjacent to the church (Figure 7.15). Of equal interest was the discovery of two strong dipole features within these walls that suggested strong burn-ing episodes or perhaps large pieces of metal. A grid of GPR data was collected directly on top of this feature, and the amplitude slice-maps showed a roughly circular feature in the same location as the large magnetic anomalies (Figure 7.15). Many different working hypotheses were proposed about the origin of the circular feature within the walls of the convent courtyard that was visible by GPR and that the magnetic maps showed to have been burned. One of the more exciting, but also somewhat outlandish, hypotheses was that the circular anomaly was a kiva that had been constructed within the convent courtyard during mission times as a way to attract Native Americans to the new Roman Catholic faith.
To test this idea, as well as other hypotheses, a large excavation trench was placed directly on the edge of the circular feature. At about 50 cm below the surface a partially burned layer of what appeared to be cow manure was discovered, lying on a sloping surface of silty clay. Further digging exposed more clay layers beneath, interbedded with fine sand, which were interpreted to have been periodic depositional episodes of adobe wall melt alternating with aeolian sand deposition. It now appears that the GPR and magnetic features discovered within the walls of the courtyard are the product of events that occurred long after the burning and abandonment of the church and its as-sociated buildings. Once abandoned, the adobe walls surrounding the convent court-
Figure 7.12. Reflections from one 500-MHz profile that crossed the pithouse floor visible in the amplitude slice-maps in Figure 7.11.
152 ~ Lawrence B. Conyers
Figure 7.13. A 500-MHz reflection profile crossing a great kiva. The outside wall of the kiva is apparent as high-amplitude reflections on ei-ther side of the profile. The kiva depression was filled with homogeneous aeolian sand, producing very low-amplitude reflections.
Figure 7.14. Amplitude slice-maps of the great kiva at Bluff, Utah. The outside wall is visible in the upper slices and a deeper interior wall below about 90 cm in depth. These data were collected after a test excavation had been placed on the eastern side of the kiva and backfill material is visible as a high-amplitude reflection in most of the slices (color illustration appears on the CD).
Ground-Penetrating Radar ~ 153
yard began to erode, or “melt,” as rainstorms washed the clay into the surrounding open spaces. Over many years this clay deposition filled in the corners of the courtyard and the areas immediately adjacent to the walls first, gradually leaving a bowl-shaped depression within the walls. Periodic windstorms also deposited fine-grained sand in this newly formed basin-like depression. It then appears that during historic times ranchers living nearby used the depression as a natural corral for their cattle, which left
Figure 7.15. The convent courtyard at San Marcos Pueblo, New Mexico. On the magnetic gradiometry map the remnant adobe walls can be seen, as well as some extensive burned areas within the walls. The GPR amplitude slice from 9.5–19 nanoseconds indicates a circular bowl-shaped anomaly in the area of burning (color illustration appears on the CD).
154 ~ Lawrence B. Conyers
a thick layer of manure on the clay and sand surface. This manure was then set on fire, naturally or intentionally, and partially burned, creating the strong magnetic feature visible on the magnetic gradiometry map.
The San Marcos geophysical mapping demonstrates how multiple tools can indi-cate very different aspects of a site’s nature, allowing for multiple working hypotheses to be developed and then tested. In this case excavations supported none of the work-ing hypotheses, and the origin of the geophysical features visible with both tools was very different from any that had been considered. Although the exciting archaeological materials that the excavators were hoping for were not present, the use of multiple geo-physical methods proved to be a very useful tool for feature definition and analysis.
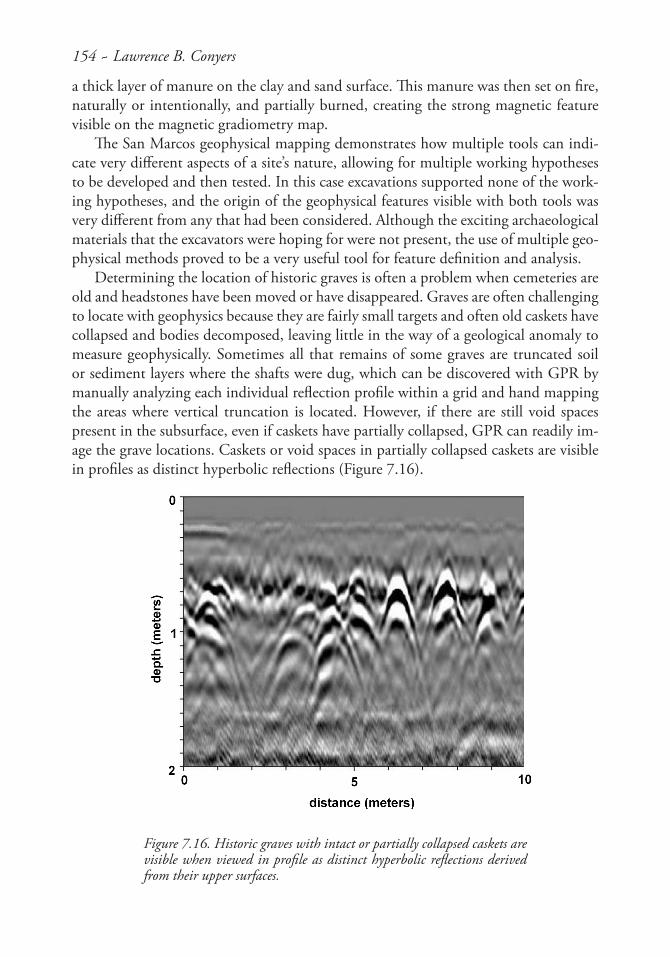
Determining the location of historic graves is often a problem when cemeteries are old and headstones have been moved or have disappeared. Graves are often challenging to locate with geophysics because they are fairly small targets and often old caskets have collapsed and bodies decomposed, leaving little in the way of a geological anomaly to measure geophysically. Sometimes all that remains of some graves are truncated soil or sediment layers where the shafts were dug, which can be discovered with GPR by manually analyzing each individual reflection profile within a grid and hand mapping the areas where vertical truncation is located. However, if there are still void spaces present in the subsurface, even if caskets have partially collapsed, GPR can readily im-age the grave locations. Caskets or void spaces in partially collapsed caskets are visible in profiles as distinct hyperbolic reflections (Figure 7.16).
Figure 7.16. Historic graves with intact or partially collapsed caskets are visible when viewed in profile as distinct hyperbolic reflections derived from their upper surfaces.
Ground-Penetrating Radar ~ 155
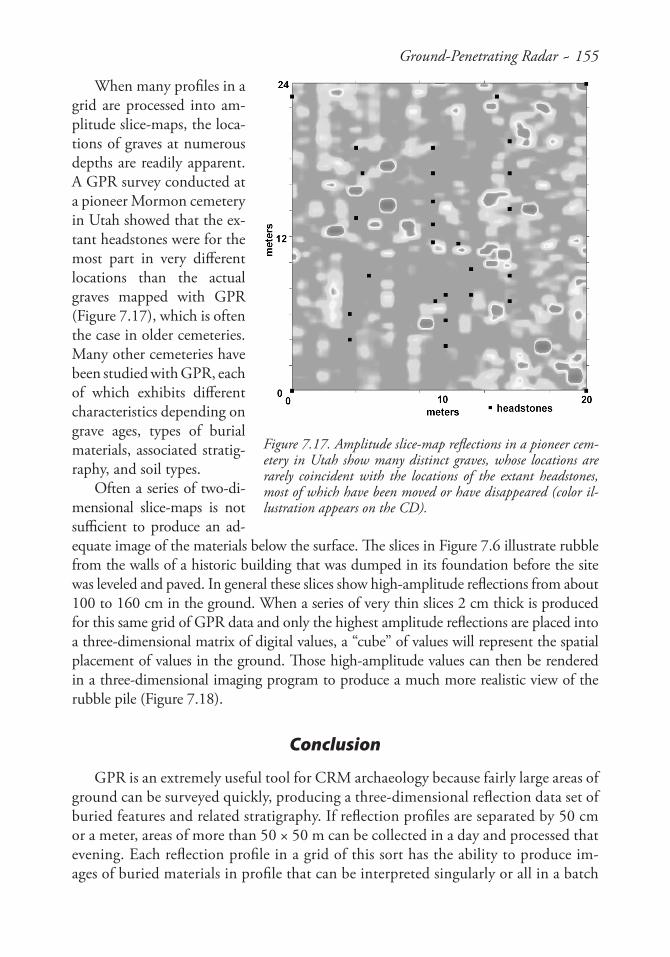
When many profiles in a grid are processed into am-plitude slice-maps, the loca-tions of graves at numerous depths are readily apparent. A GPR survey conducted at a pioneer Mormon cemetery in Utah showed that the ex-tant headstones were for the most part in very different locations than the actual graves mapped with GPR (Figure 7.17), which is often the case in older cemeteries. Many other cemeteries have been studied with GPR, each of which exhibits different characteristics depending on grave ages, types of burial materials, associated stratig-raphy, and soil types.
Often a series of two-di-mensional slice-maps is not sufficient to produce an ad-equate image of the materials below the surface. The slices in Figure 7.6 illustrate rubble from the walls of a historic building that was dumped in its foundation before the site was leveled and paved. In general these slices show high-amplitude reflections from about 100 to 160 cm in the ground. When a series of very thin slices 2 cm thick is produced for this same grid of GPR data and only the highest amplitude reflections are placed into a three-dimensional matrix of digital values, a “cube” of values will represent the spatial placement of values in the ground. Those high-amplitude values can then be rendered in a three-dimensional imaging program to produce a much more realistic view of the rubble pile (Figure 7.18).
Conclusion
GPR is an extremely useful tool for CRM archaeology because fairly large areas of ground can be surveyed quickly, producing a three-dimensional reflection data set of buried features and related stratigraphy. If reflection profiles are separated by 50 cm or a meter, areas of more than 50 × 50 m can be collected in a day and processed that evening. Each reflection profile in a grid of this sort has the ability to produce im-ages of buried materials in profile that can be interpreted singularly or all in a batch
Figure 7.17. Amplitude slice-map reflections in a pioneer cem-etery in Utah show many distinct graves, whose locations are rarely coincident with the locations of the extant headstones, most of which have been moved or have disappeared (color il-lustration appears on the CD).

156 ~ Lawrence B. Conyers
for three-dimen-sional analysis. The production of com-plex maps in the form of amplitude slices or rendered three-dimensional visualizations can occur quickly, mak-ing GPR one of the most accurate meth-ods for determining depth and dimen-sion of archaeologic features while oper-ators are still in the field. When this is
accomplished, GPR results from one day can be used the next to plan excavations or further GPR data collection.
If little is known about what lies under the surface in a prospective area, the spatial geometry and orientation of reflection anomalies in GPR amplitude slice-maps can be studied to see whether features of interest are discovered. If the velocity of radar waves in the grid is known, not only can the orientation of the features be determined but also their depth. Areas of greater interest can then be resurveyed in smaller grids with more closely spaced profiles for greater feature definition. Lower or higher frequency antennas can also be used for either greater depth penetration or higher resolution, depending on what is discovered in the first survey.
The GPR maps can also be compared and integrated with maps from other geo-physical tools as a way to measure different properties of the subsurface. For in-stance, magnetic maps can determine burned areas or areas of more highly magnetic materials associated with certain archaeological features. GPR maps show only com-positional or water saturation differences and therefore are imaging very different properties than are measured with other methods. If multiple GPR surveys are com-bined with subsurface information gathered by excavation, auger, or core testing, the origin of important reflections can be determined, giving the geophysical maps even more utility.
In areas where subsurface testing has already uncovered features of interest, GPR data can be used to project that information into areas of a site where nothing is known. In this way a great deal of knowledge about a small excavation area can be used to determine a great deal about potentially large areas in the immediate vicinity. Most important, that information can be obtained without expensive and potentially destructive digging.
Figure 7.18. A three-dimensional rendering of the highest amplitudes in the same grid of data used to make the slices in Figure 7.6. This image is rubble from a historic house that was pushed into its basement before the site was leveled and paved over.
Ground-Penetrating Radar ~ 157
The GPR tools discussed here can be employed for benefits beyond just the dis-covery and mapping of unknown areas, although that has been GPR’s greatest historic contribution to CRM archaeology. If enough is learned about the subsurface using both excavations and geophysical mapping, working hypotheses about the spatial dis-tribution of features that have cultural significance can be formulated and tested. In this way GPR maps can be used as a primary database for the analysis of anthropologi-cal ideas about past lifeways.
References CitedBevan, B., and J. Kenyon1975 Ground-Penetrating Radar for Historical Archaeology. MASCA Newsletter
11(2):2–7.
Buderi, R.1996 The Invention That Changed the World. Simon & Schuster, New York.
Collins, M. E., and J. L. Kurtz1998 Assessing GPR Performance in Three Soil Geographic Regions. In Proceedings
of the Seventh International Conference on Ground-Penetrating Radar, Radar Systems and Remote Sensing Laboratory, pp. 171–175. Radar Systems and Remote Sensing Laboratory, University of Kansas, Lawrence.
Conyers, L. B.1995 The Use of Ground-Penetrating Radar to Map the Buried Structures and
Landscape of the Ceren Site, El Salvador. Geoarchaeology 10(4):275–299.1999 Geophysics, Ground-Penetrating Radar and Archaeology. Society for American
Archaeology Bulletin 17(4):26–29.2004 Ground-Penetrating Radar for Archaeology. AltaMira, Walnut Creek, California.
Conyers, L. B., and C. Cameron1998 Ground-Penetrating Radar Techniques and Three-Dimensional Computer
Mapping in the American Southwest. Journal of Field Archaeology 25(4):417–430.
Conyers, L. B., E. G. Ernenwein, and L.-A. Bedal2002a Ground-Penetrating Radar Discovery at Petra, Jordan. Antiquity 76:339–340.2002b Ground Penetrating Radar (GPR) Mapping as a Method for Planning Excavation
Strategies, Petra, Jordan. E-tiquity 1 (http://e-tiquity.saa.org/%7Eetiquity/title1.html).
Conyers, L. B., and D. Goodman1997 Ground-Penetrating Radar: An Introduction for Archaeologists. AltaMira, Walnut
Creek, California.
158 ~ Lawrence B. Conyers
Conyers, L. B., and J. E. Lucius1996 Velocity Analysis in Archaeological Ground-Penetrating Radar Studies.
Archaeological Prospection 3(1):25–38.
Conyers, L. B., and H. D. Wallace2003 Ground-Penetrating Radar. In Archaeological Excavations at Valencia Vieja, edited
by H. D. Wallace and M. W. Lindeman. Technical Report No. 2001-11. Desert Archaeology, Inc., Tucson.
Fischer, P. M., S. G. W. Follin, and P. Ulriksen1980 Subsurface Interface Radar Survey at Hala Sultan Tekke, Cyprus. In Applications of
Technical Devices in Archaeology, edited by Peter M. Fischer. Studies in Mediterranean Archaeology 63:48–51.
Goodman, D.1994 Ground-Penetrating Radar Simulation in Engineering and Archaeology.
Geophysics 59:224–232.
Goodman, D., and Y. Nishimura1993 A Ground-Radar View of Japanese Burial Mounds. Antiquity 67:349–354.
Goodman, D., Y. Nishimura, H. Hongo, and O. Maasaki1998 GPR Amplitude Rendering in Archaeology. In Proceedings of the Seventh
International Conference on Ground-Penetrating Radar, pp. 91–92. Radar Systems and Remote Sensing Laboratory, University of Kansas, Lawrence.
Goodman, D., Y. Nishimura, and J. D. Rogers1995 GPR Time-Slices in Archaeological Prospection. Archaeological Prospection
2:85–89.
Goodman, D., Y. Nishimura, R. Uno, and T. Yamamoto1994 A Ground Radar Survey of Medieval Kiln Sites in Suzu City, Western Japan.
Archaeometry 36(2):317–326.
Imai, T., T. Sakayama, and T. Kanemori1987 Use of Ground-Probing Radar and Resistivity Surveys for Archaeological
Investigations. Geophysics 52:137–150.
Kenyon, J. L.1977 Ground-Penetrating Radar and Its Application to a Historical Archaeological
Site. Historical Archaeology 11:48–55.
Ground-Penetrating Radar ~ 159
Leckebusch, J., and R. Peikert2001 Investigating the True Resolution and Three-Dimensional Capabilities of Ground-
Penetrating Radar Data in Archaeological Surveys: Measurements in a Sand Box. Archaeological Prospection 8:29–40.
Moran, M., S. A. Arcone, A. J. Delaney, and R. Greenfield1998 3-D Migration/Array Processing Using GPR Data. In Proceedings of the Seventh
International Conference on Ground-Penetrating Radar, pp. 225–228. Radar Systems and Remote Sensing Laboratory, University of Kansas, Lawrence.
Neubauer, W., A. Eder-Hinterleitner, S. Seren, and P. Melichar2002 Georadar in the Roman Civil Town Carnuntum, Austria: An Approach for
Archaeological Interpretation of GPR Data. Archaeological Prospection 9:135–156.
Olhoeft, G. R.1981 Electrical Properties of Rocks. In Physical Properties of Rocks and Minerals,
edited by Y. S. Touloukian, W. R. Judd, and R. F. Roy, pp. 257–330. McGraw-Hill, New York.
Sellman, P. V., S. A. Arcone, and A. J. Delaney1983 Radar Profiling of Buried Reflectors and the Ground Water Table. Cold Regions
Research and Engineering Laboratory Report 83-11:1–10.
Sheets, P. D., W. M. Loker, H. A. W. Spetzler, and R. W. Ware1985 Geophysical Exploration for Ancient Maya Housing at Ceren, El Salvador.
National Geographic Research Reports 20:645–656.
Stern, W.1929 Versuch einer elektrodynamischen Dickenmessung von Gletschereis. Gerlands
Beitrage zur Geophysik 23:292–333.
Vaughan, C. J.1986 Ground-Penetrating Radar Surveys Used in Archaeological Investigations.
Geophysics 51(3):595–604.
Vickers, R. S., and L. T. Dolphin1975 A Communication on an Archaeological Radar Experiment at Chaco Canyon,
New Mexico. MASCA Newsletter 11(1):6–8.