expanding the public transport network ... the public transport network through a feeder bus system...
TRANSCRIPT
EXPANDING THE PUBLIC TRANSPORTNETWORK THROUGH A FEEDER BUSSYSTEM – CHALLENGES AND NEED
Pawan Mulukutla, MSProject Manager - EMBARQ India([email protected] )
Priyanka Vasudevan, MURPAssociate, EMBARQ India
4 Dec 2013

Urgent need for cities to meet the mobilityneeds of the current and futuregenerations
285 Mi in 2001
473 Mi in 2021
Urbanization in India
820 Mi by 2051
Source: NUTP

Vicious Circle
LongerCycleTimes
LowerFrequency
Lower PublicTransportDemand
IncreasedPrivateVehicle
IncreasedCongestion
ReducedRevenue
CustomerDissatisfaction

Bus Procurement under JnNURM
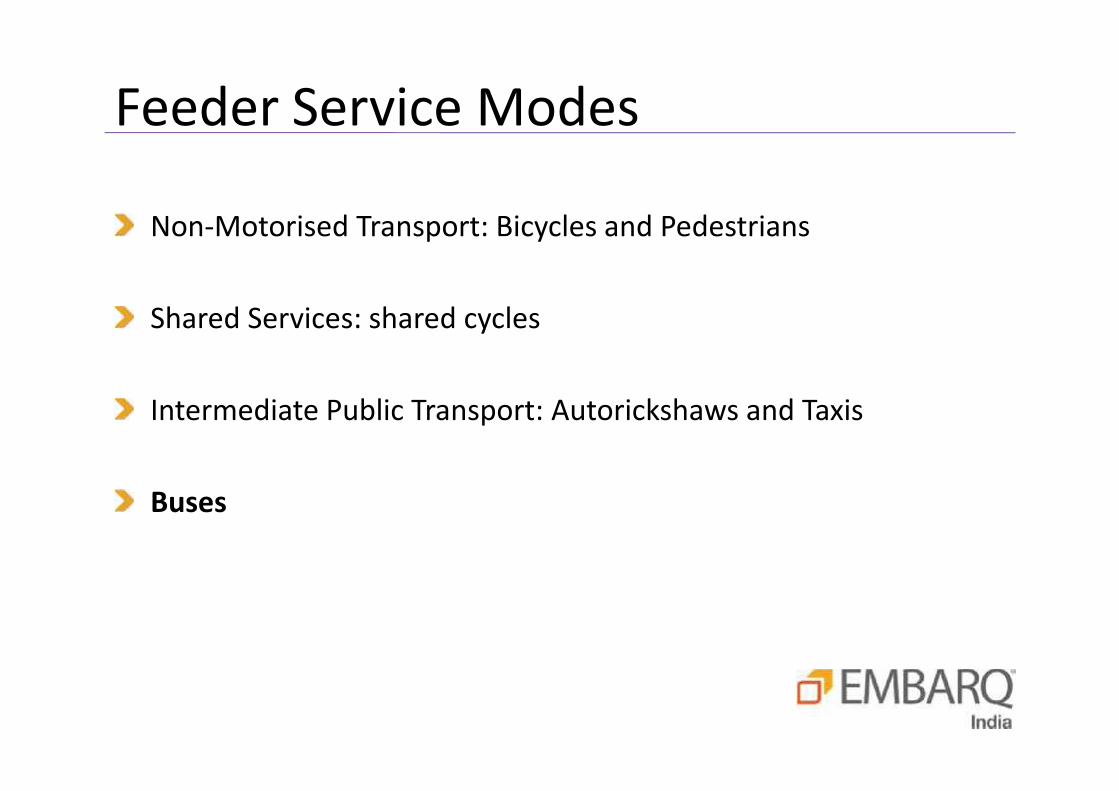
Non-Motorised Transport: Bicycles and Pedestrians
Shared Services: shared cycles
Intermediate Public Transport: Autorickshaws and Taxis
Buses
Feeder Service Modes


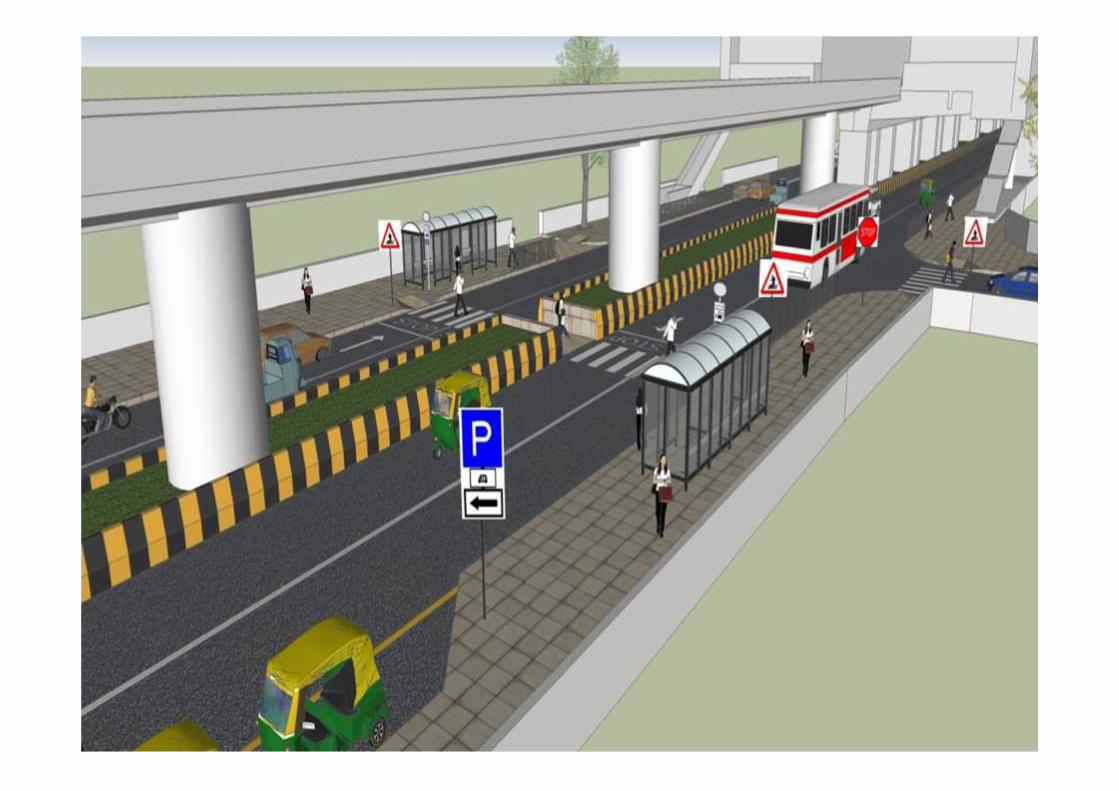
Feeder bus stops locations areretained as they presently,without any improvement to theenvironment and access to them

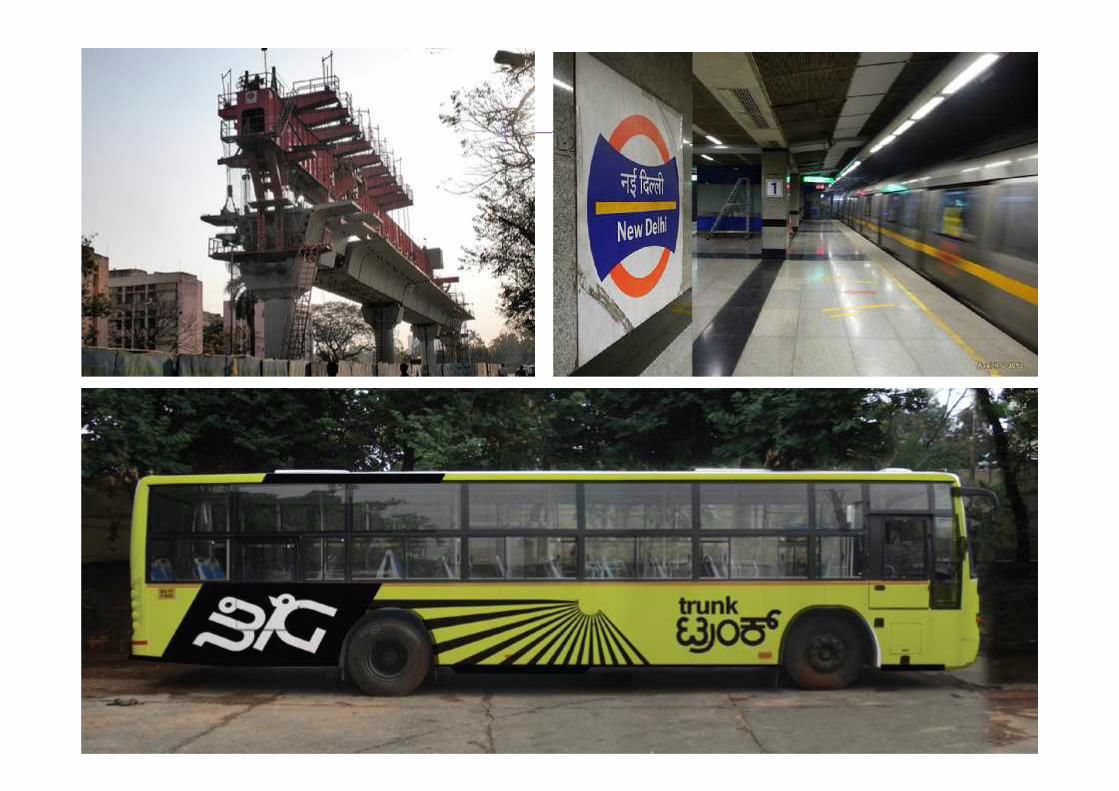
designed to pick up passengers and take them to a transferpoint where they make an onward journey on a trunk servicetrunk services can be a BRT, metro, tram or traina key part of a wider local network or a regional network
Feeder Systems

Typical Feeder CharacteristicsTypical Characteristic Examples in Metropolitan Areas
Serve short distances 4 - 6 Kms / 7-12 KmsHigh frequency service 5 - 10 minutesConnects commercial, residential nodes to the trunkcorridor or major destinations feeders to the CBDs/stations
Requires a transfer at the end of the journeyfeeder stop should be located within50-100m walking distance
Provides first / last mile connectivity
Extend the trunk corridor's area of influenceOperates amongst mixed traffic, without priorityinfrastructure or spaceBus stops are generally spaced within walking distanceof each other 300 - 400m apart

The Conventional Approach to feeder bus planningCase Analysis takes into consideration over 15 routes and theircharacteristics from Mumbai’s feeder system. These aredocumented and analysed to understand how feeders wereconventionally designed.Data sets relating to fares, operations, fleet size, route lengths,ridership, ticket sales and travel times facilitate the case analysis.Studying challenges and discussing how cities address them.Emerging trends as seen in cities like Bangalore, Indore, andAhmedabad indicate how cities approach feeder design.Conclusion and way forward
Methodology
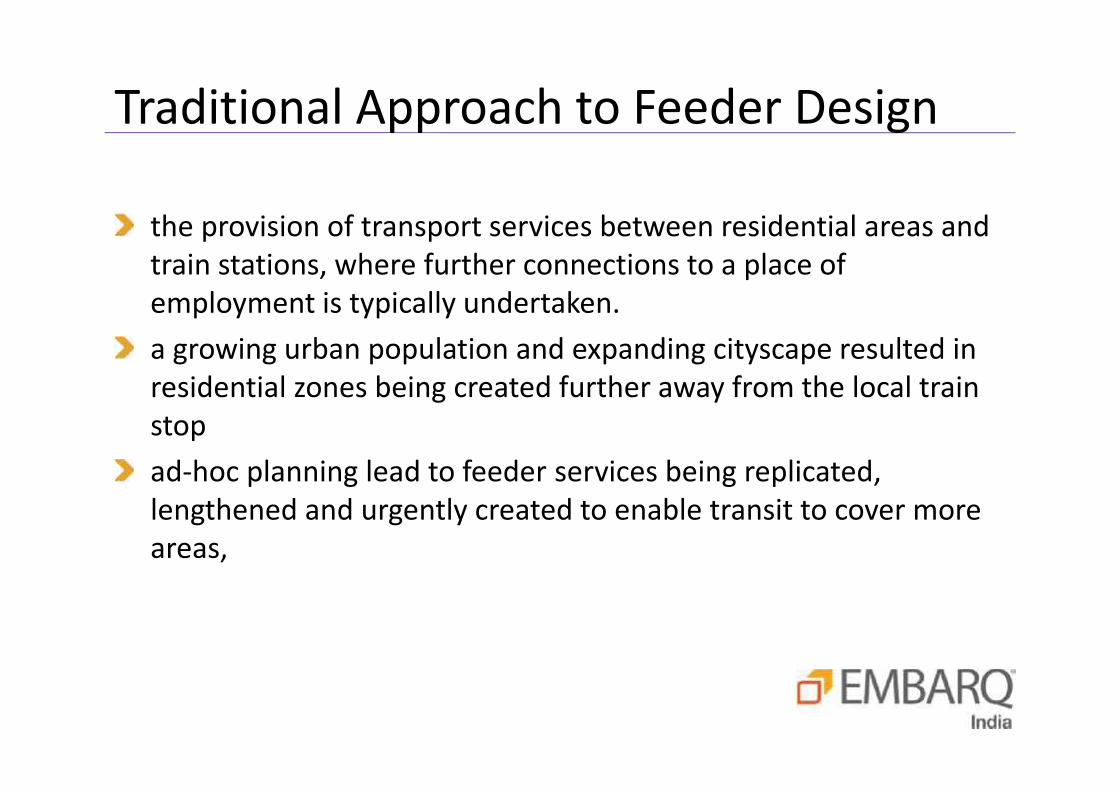
Traditional Approach to Feeder Design
the provision of transport services between residential areas andtrain stations, where further connections to a place ofemployment is typically undertaken.a growing urban population and expanding cityscape resulted inresidential zones being created further away from the local trainstopad-hoc planning lead to feeder services being replicated,lengthened and urgently created to enable transit to cover moreareas,
Traditional Approach to Feeder Design

Mumbai Feeder Statistics
Total BEST Routes 4,176
Operational Buses 4,011
Total Number of Routes 506
Number of Feeder Routes 265 (52% of total)
Number of Feeder Buses 1,533 (38% of total)
Number of Passengers (daily average) 3 Million

Neighbourhood ConnectorRoutes
Long Feeder Routes
CBD Feeder Routes
Mumbai Feeder Planning
Amendment of existing routes toreflect change in demand and
development patterns
Rescheduling of routes and shiftsallocated to each driver and timetables
of bus routes
Allocation of new routes based onresource (fleet and personnel) and
depot space proximity

Route Characteristics & DataRoute # Origin Destination Route Length Frequency Fleet Occupancy
Type #1: Neighbourhood Connector Routes
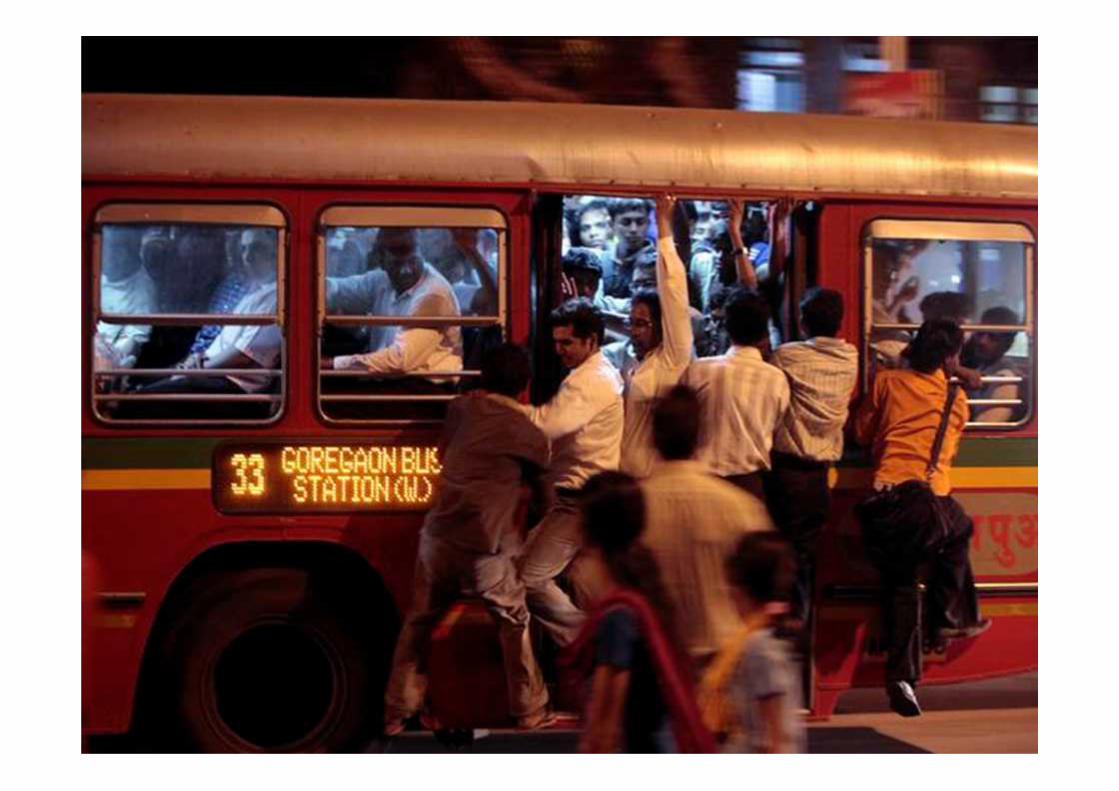
343 Goregaon Station Aarey Colony 4.7 9 - 10 10 75%
344 Goregaon Station Goregaon Station 9.3 5 - 6 8 76%
346 Goregaon Station Nagari Niwara 4.9 6 - 8 8 72%
452 Goregaon Station Mayur Nagar 4.8 17 - 20 6 63%
602 Kanjurmarg StationHiranandani Bus
Station 5.2 8 - 10 7 91%
604 Kanjurmarg Station Bhandup Station 3.5 11 - 15 5 75%
608 Kanjurmarg Station Hanuman Nagar 2 8 5 93%Type #2: Long Feeder Routes
340 Ghatkopar StationAgarkar Chowk,
Andheri 8.8 6 - 7 28 100%
172 Pratikshanagar Mahalaxmi Station - 12 - 13 - -Type #3: CBD-Feeder Routes
Fort Pheri CST CST 6.3 4 - 5 - -
Special 1 NCPA Nariman Point 3 2 - 4 - -
Special 2 CST World Trade Centre 4.8 5 - -
Special 8 Churchgate World Trade Centre 7.6 7 - 8 - -
Special 9 Churchgate Nariman Point 3.5 2 - 3 - -

Fare Structure
0-2 kms Rs. 62-3 kms Rs. 83-5 kms Rs. 105-7 kms Rs. 127-10 kms Rs. 15
Returns are high for short-distance trips0 – 2kms for Rs.6 allows buses to compete with share autos / taxisSome routes have a flat rate of Rs. 6, like the Fort Pheri
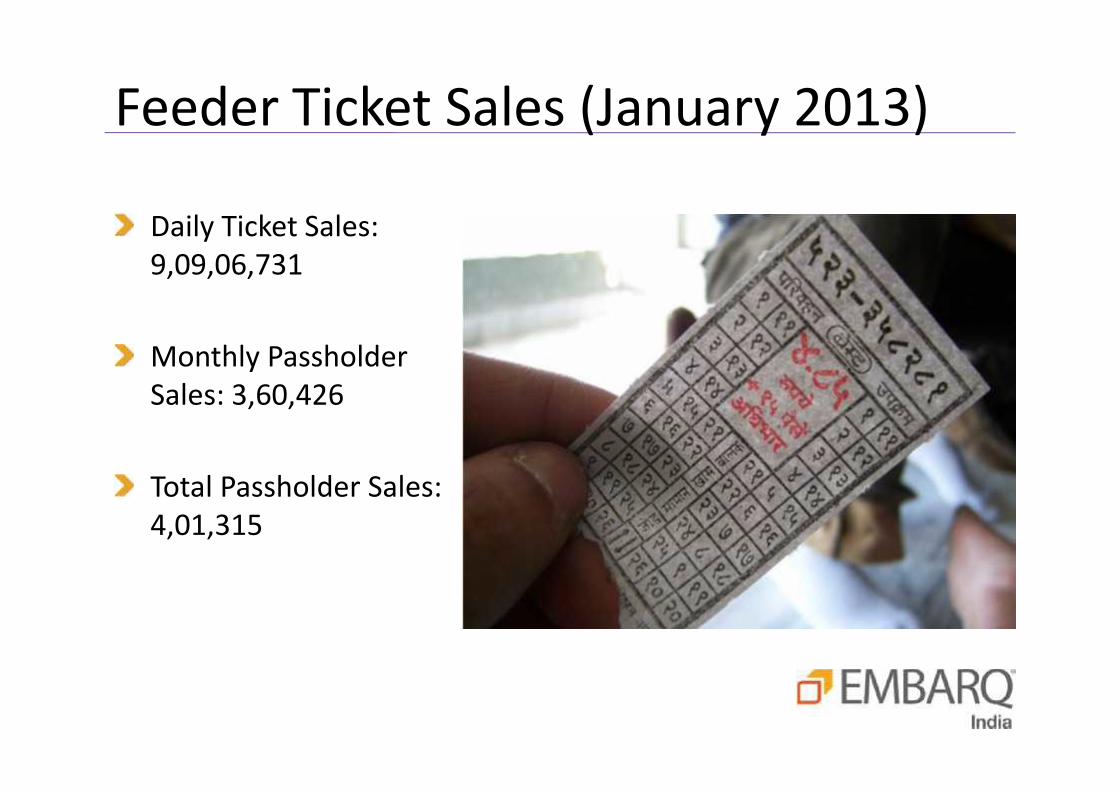
Daily Ticket Sales:9,09,06,731
Monthly PassholderSales: 3,60,426
Total Passholder Sales:4,01,315
Feeder Ticket Sales (January 2013)

Capacity of roadand usage byother ModesLack ofcoordinationbetween landuse andtransportaspectsPoor physicalintegration
Challenges in Mumbai
Route 343Route 344Route 346
Gen. AK Vaidya Rd
OberoiMall
NagariNiwara
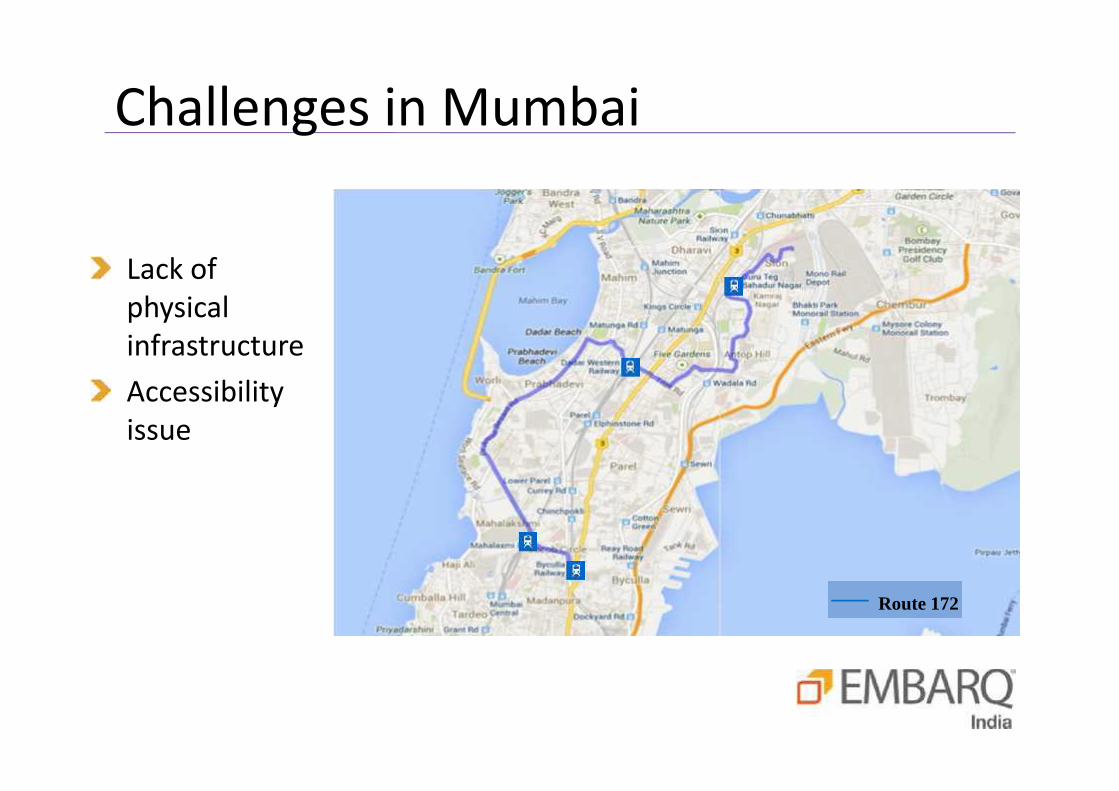
Lack ofphysicalinfrastructureAccessibilityissue
Challenges in Mumbai
Route 172

Lack of infrastructure / space at interchanges to supportintegration of trunk and feeder servicesNeed for terminal/depot space within close proximity of feederroute (turning radii)Unidirectional travel pattern - private vehicles, autos, taxis pickpeople up in off-peak direction after completing their actual trip,making the service more financially viableLimited resources - Fleet / PersonnelNeed for pedestrian discipline and vehicle discipline
Summary of Challenges

BIG (Bangalore Intra-City Grid) Network wasupgradedHigh-frequency trunkroutes, serviced byfeeder routes forperipheral areas
Changing Trends – Bangalore
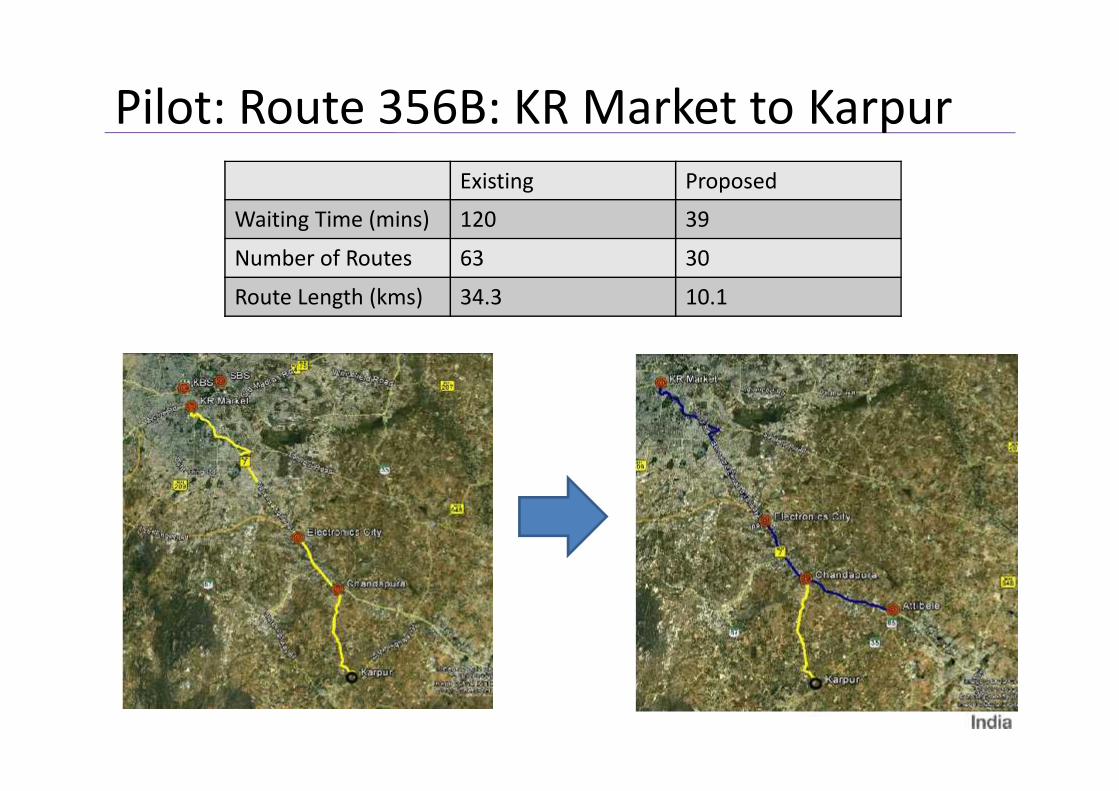
Pilot: Route 356B: KR Market to KarpurExisting Proposed
Waiting Time (mins) 120 39
Number of Routes 63 30
Route Length (kms) 34.3 10.1
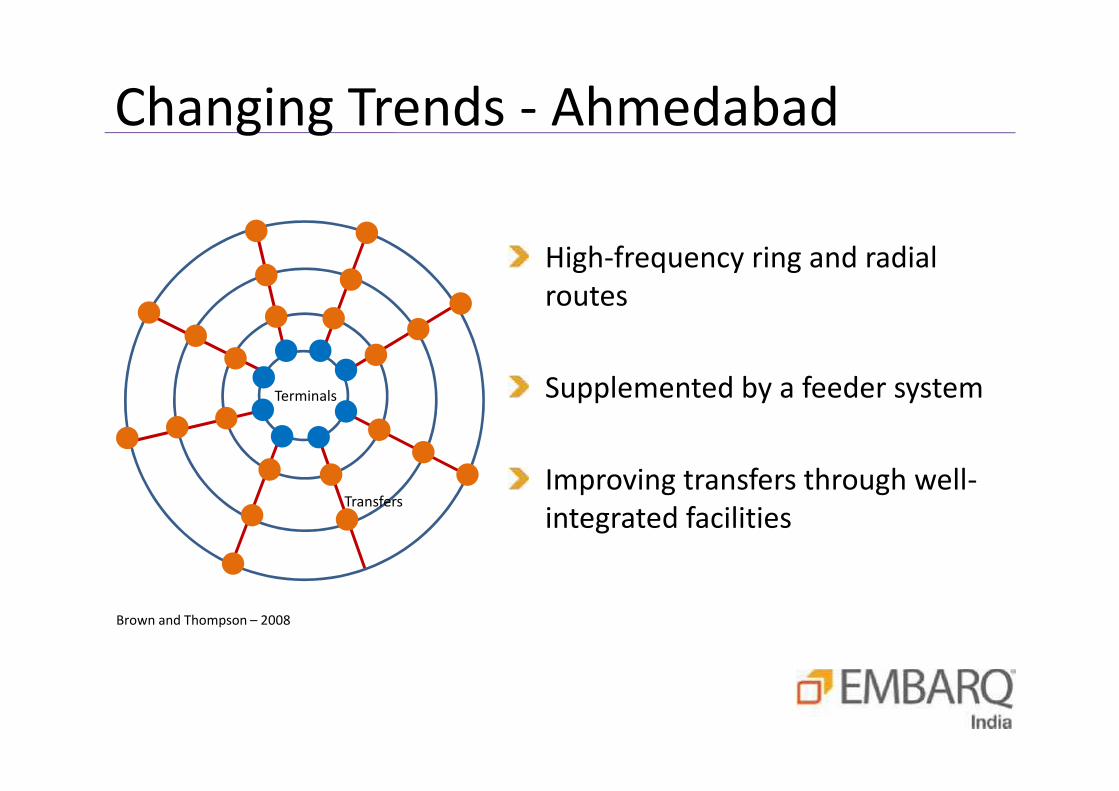
High-frequency ring and radialroutes
Supplemented by a feeder system
Improving transfers through well-integrated facilities
Changing Trends - Ahmedabad
Terminals
Transfers
Brown and Thompson – 2008
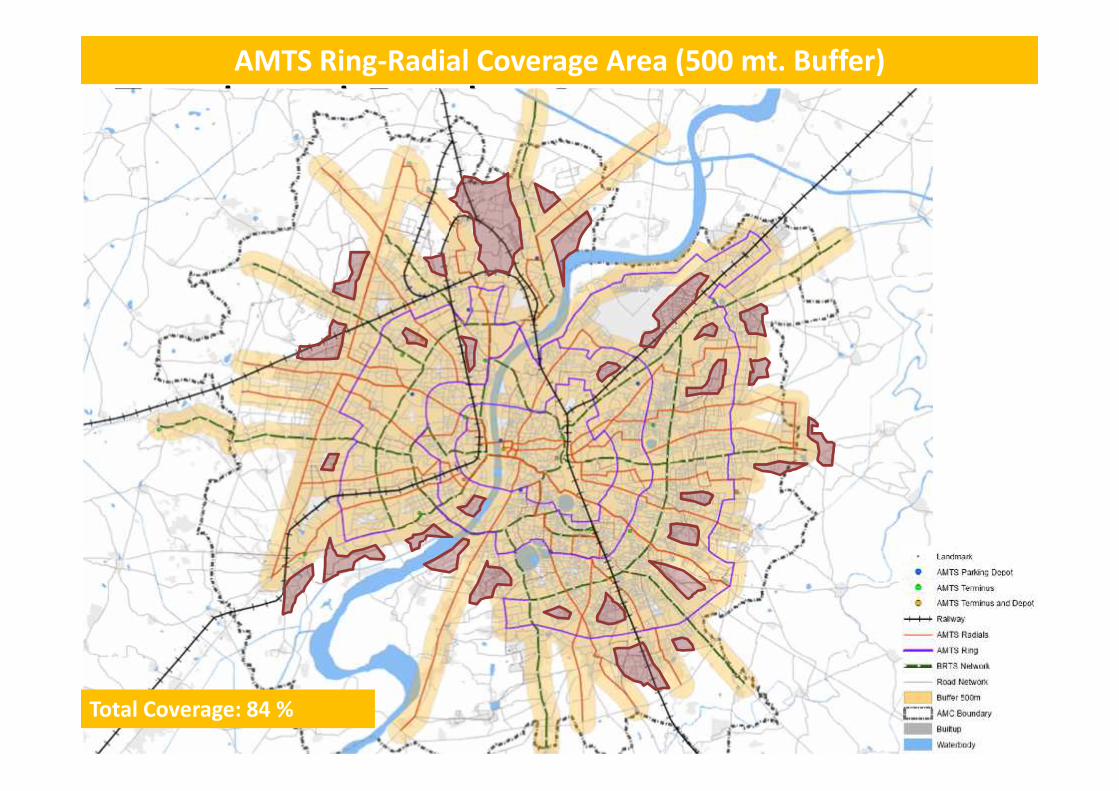
Trunk and Feeder Coverage
Total Coverage: 84 %
AMTS Ring-Radial Coverage Area (500 mt. Buffer)

AMTS Ring-Radial Feeder Routes & Coverage Area
Total Coverage: 95 %
Feeder System – 21 Routes
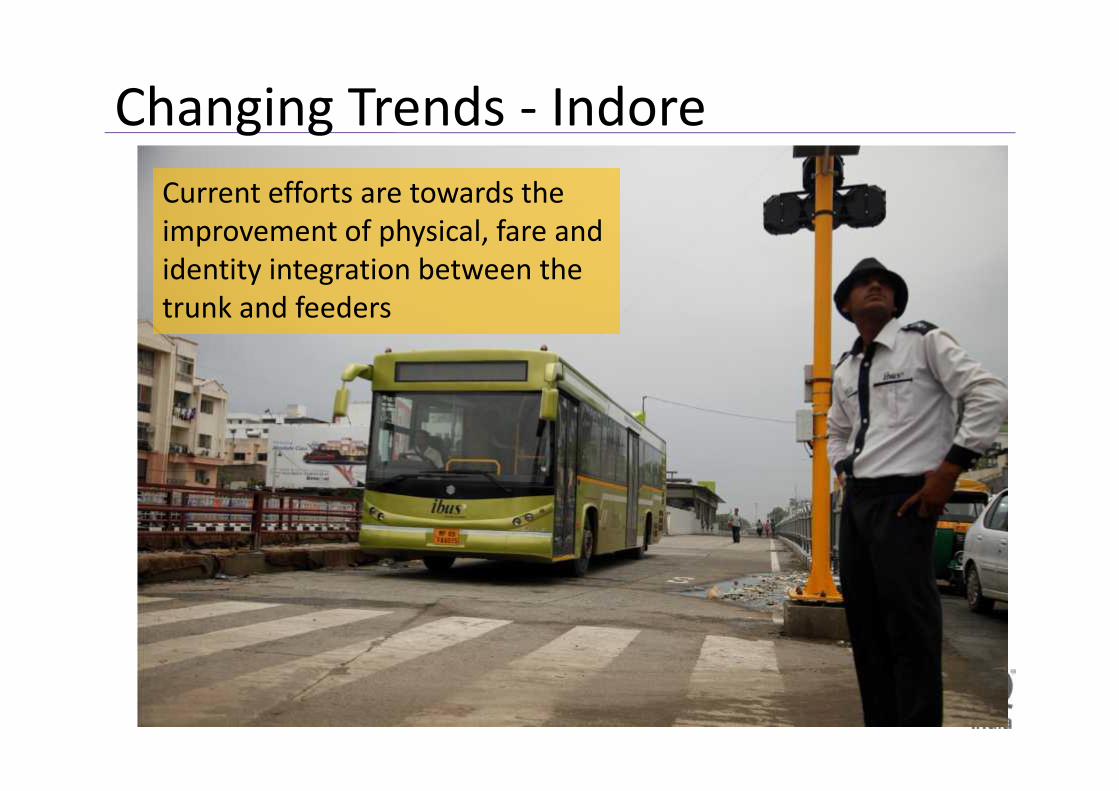
Changing Trends - IndoreCurrent efforts are towards theimprovement of physical, fare andidentity integration between thetrunk and feeders

Changing Trends - IndoreFeeders for the Indore BRTSextend the trunk’s overallcoverage, inducing more ridership

Estimate the level of demand: data collection will assist indetermining the characteristics of the route
Assess the site and physical conditions of the site to understandcongestion levels, roadway geometry, capacity aspects, etc.
Work with the constraints: final consideration to ensure optimalsolutions; common constraints include turnaround space, trunk-feeder integration space, proximity to depots, lack of resources
Planning a Feeder Bus System
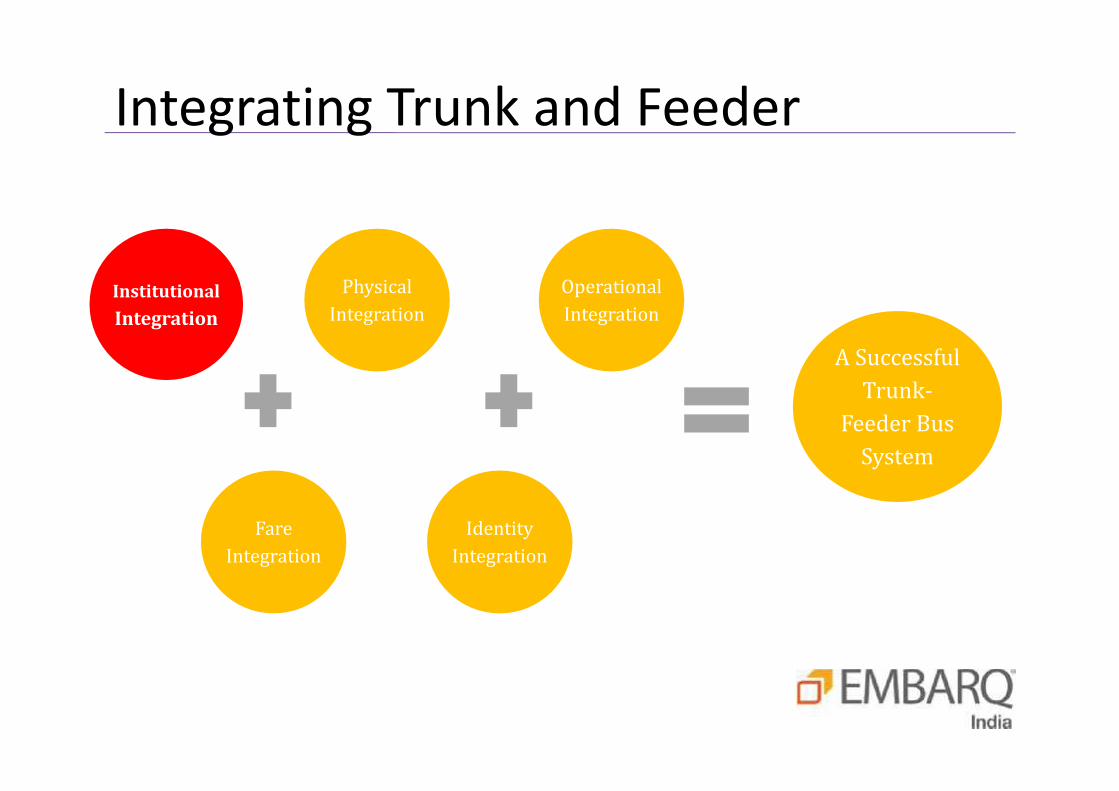
Integrating Trunk and Feeder
InstitutionalIntegration
IdentityIntegrationFareIntegration
OperationalIntegrationPhysicalIntegration A SuccessfulTrunk-Feeder BusSystem


Building and strengthening coordination to implement a cohesivetransit network to attract usersAn integrated approach to ensure a better transport system.Coordination between the many entities and agencies thatmanage the system,Revenue Sharing: managing revenue and implementing acohesive approach to building a shared vision for fare andticketing integration and revenue sharing between agencies
Institutional Integration

feeder bus system design must be incorporated into the planning phase,attracting ridership through high frequencies, easy visibility and accessto feeder, and significant coverage
huge investments in developing Metros, Monorails, BRTS, a keycomponent for successful implementation of these projects ismultimodal integration and providing last mile connectivity throughfeeder bus systems
Bus priority lanes at station area will improve the operational efficiencyof feeder system
feeder bus systems enhance coverage and operational efficiency andshould not be an afterthought
Conclusion

Thank you!