evaluation of the ontario ministry of education's student ... · evaluation of the ontario...
TRANSCRIPT

Evaluation of the Ontario Ministry of Education’s Student Success / Learning to 18 Strategy
Final Report
Dr. Charles Ungerleider Principal Investigator and Study Director
September 2008
______________ September 2008 ii
Evaluation Team Principal Investigator and Study Director Dr. Charles Ungerleider, Director of Research and Knowledge Mobilization (Canadian Council on Learning (CCL)) Project Manager Dr. Julie Bélanger, Senior Research Analyst (CCL) Field Relations Director Ruth Baumann Field Team Ruth Baumann, Susan Adamson, Pierre Boutin, Paul Inksetter, Donna Lacavera, Susan Langley, Raymond Vaillancourt, Liliane Vincent, Dr. Susan Winton Qualitative Data Analysis Team Dr. Julie Bélanger (CCL), Isabelle Eaton (CCL), Dr. Tracy Lavin (CCL), Godfrey von Nostitz‐Tait (CCL) Quantitative Data Analysis Team Dr. Julie Bélanger (CCL), Fernando Cartwright (CCL), Tracy Cassels (CCL), Dr. Sonia Guerriero (CCL) Survey Development Team Dr. Julie Bélanger (CCL), Fernando Cartwright (CCL)
Acknowledgements The evaluation team wishes to thank all the participants who gracefully accepted to take part in the interviews, focus groups, and surveys. Their insightful comments and responses to our questions were essential to this evaluation. The evaluation team would also like to acknowledge the assistance provided by the staff at the Ministry of Education – Student Success Learning to 18 Implementation, Training and Evaluation Branch throughout the evaluation and thank the staff at the Ministry of Education – Information Management Branch for responding to data‐related requests and enquiries. The evaluation team also gratefully acknowledges all the school board and school staff members for their contributions to the data collection effort through online surveys, interviews, and focus groups.

______________ September 2008 iii
Table of Contents
Executive Summary ......................................................................................................v Introduction..................................................................................................................1 Context and Background...........................................................................................1 A Formative Evaluation.............................................................................................2 Evaluation Framework ..............................................................................................4 Standards and Values................................................................................................5
Stage 1: Summary .........................................................................................................6 Document Analysis ...................................................................................................6 Interviews and Focus Groups ....................................................................................7 Stage 1 Preliminary Findings and Recommendations ................................................8
Strengths......................................................................................................................................8 Vulnerabilities ..............................................................................................................................8 Preliminary Recommendations.....................................................................................................9
Stage 2: Methods and Analyses ..................................................................................11 Qualitative Data Collection Methodology ...............................................................11
Field team .................................................................................................................................. 11 Sampling information ................................................................................................................. 12 Qualitative data collection instruments ...................................................................................... 13
Qualitative Data Coding and Analysis......................................................................15 Coding........................................................................................................................................ 15 Analyses..................................................................................................................................... 16
Quantitative Data Collection Methodology.............................................................18 Online surveys............................................................................................................................ 18 Ministry data.............................................................................................................................. 18
Quantitative Analyses .............................................................................................18 Online surveys............................................................................................................................ 18 Ministry Data ............................................................................................................................. 22 Limitations of Evaluation ............................................................................................................ 22
Stage 2: Findings .........................................................................................................25 Research Questions.................................................................................................25
What has changed in the last four years in Ontario’s secondary schools to help students succeed?.................................................................................................................................................. 25 What have been the main benefits arising from these changes to date?...................................... 27 Which elements and actions implemented under SS/L18 Strategy appear to be yielding student success? ..................................................................................................................................... 36 How have changes within Ontario’s secondary schools aimed at increasing student success been supported?................................................................................................................................. 39 What barriers to increased student success have been encountered? And how have these been addressed?................................................................................................................................. 42 What further strategies and actions, if any, are suggested to further increase secondary student success? ..................................................................................................................................... 52 Is there any evidence that graduation rates are increasing and drop‐out rates decreasing? ......... 58 Is there any evidence that structures and supports are changing to better provide viable pathways for all students to learn to 18 years and beyond?........................................................................ 60 Is there any evidence that new learning opportunities are changing to better capture and build on the strengths and interests of all students?................................................................................. 61

______________ September 2008 iv
Is there any evidence that structures and supports are changing to better assist students in their transition from elementary to secondary school? ....................................................................... 61 Is there any evidence that accountability measures (monitoring, tracking, reporting and planning) are in place in schools and school boards and being used by schools and boards in order to drive improvement?............................................................................................................................ 62 Is there any evidence that capacity to implement the SS/L18 Strategy is being built in schools and school boards? ........................................................................................................................... 64 Is there any evidence that schools and school boards are acting upon their student and school‐level data and information to intervene with and support students appropriately?..................... 65 Is there any evidence that schools and school boards are making decisions in an effort to align resources and practices to the goals of the SS/L18 Strategy?....................................................... 65 Is there any evidence that low impact initiatives are being replaced by high impact initiatives at all levels of the education system?.................................................................................................. 67
Evaluation Framework for Individual Initiatives ......................................................67 Findings: Concluding Statements ............................................................................72
Conclusions and Recommendations............................................................................75 The Change Process Taking Place in Ontario Secondary Schools..............................75 The Changing Value Structure for Ontario Secondary Schooling..............................81 Benchmarking the Change Process..........................................................................91 Producing Stable School Effects is a Long‐Term Challenge.......................................92 Concluding Observations ........................................................................................93
References..................................................................................................................94 Appendix A: Stage 1 Interview and Focus Group Guides .............................................96 Appendix B: Stage 2 Interview and Focus Group Guides .............................................99 Appendix C: Stage 2 Field Notes Guide......................................................................106 Appendix D: Stage 2 Qualitative Analysis Procedures and Codes ..............................107 Appendix E: Qualitative Coding Consultation Journal................................................120 Appendix F: Evaluation Framework Elements of the SS/L18 Strategy........................136 Appendix G: Stage 2 Surveys.....................................................................................150 Appendix H: Number of Respondents for Questions on the School Staff Survey .......178 Appendix I: Number of Respondents for Questions on the Student Survey...............189

Executive Summary
______________ September 2008 v
Executive Summary
The Student Success/Learning to 18 (SS/L18) Strategy is a broad, province‐wide strategy designed to ensure that every student is provided with the tools to successfully complete their secondary schooling and reach their post‐secondary goals, whether these goals involve apprenticeships, college, university, or the workplace. As part of the SS/L18 Strategy, the Ontario Ministry of Education (hereafter, the “Ministry”) has implemented a support system (in the form of funding, policy and legislative changes, resources and training, and consultation) to encourage the development of innovative and flexible educational opportunities that reflect regional, social, and cultural differences affecting students’ learning experiences and outcomes, and to foster positive student engagement with education in a manner that respects their individual needs and circumstances. The Ministry has articulated five key goals for the SS/L18 Strategy:
1. Increase graduation rate and decrease drop‐out rate; 2. Support a good outcome for all students; 3. Provide students with new and relevant learning opportunities; 4. Build on students’ strengths and interests; and 5. Provide students with an effective elementary to secondary school transition.
The Canadian Council on Learning (CCL) was engaged by the Ministry to evaluate the extent to which the SS/L18 Strategy as currently implemented is aligned with the Ministry’s goals and is producing the intended outcomes. A combination of quantitative and qualitative methods was chosen to gather information to address these questions. The sources of qualitative data used throughout this evaluation included several hundred in‐depth, semi‐structured field interviews and focus groups with key informants from the Ministries of Education and of Training, Colleges and Universities, more than 40 school boards, more than 50 schools and nearly 10 colleges across the province. Key informants included seniors managers from both Ministries, education officers, consultants to the Minister of Education, directors of education, Student Success Leaders (SSLs), superintendents of programs, school trustees, college presidents and vice‐presidents, school principals, members of school Student Success Teams (including several Student Success Teachers (SSTs)), teachers who were not members of their school’s Student Success Team, parents, and students. The sources of quantitative data were the responses from online surveys developed by the evaluation team, to which more than 14,000 secondary students and school staff responded, as well as student achievement data provided by the Ministry of Education.

Executive Summary
______________ September 2008 vi
The surveys were designed to complement the depth of information provided by the interviews and focus groups by gathering data from a wider population. The data provided by the Ministry of Education was comprised of depersonalised student biographic (including diploma records) and achievement data for students in Grades 9 to 12 collected from the Legacy system and stored in the Elementary/Secondary Data Warehouse (ESDW) for the academic years 2000‐2001 through 2004‐2005 as well as depersonalized student biographic and achievement data from the Ontario School Information System (OnSIS) for the 2005‐2006 and 2006‐2007 academic years. Finally, depersonalized individual student records from the 2005‐2006 and 2006‐2007 academic years on the Ontario Secondary School Literacy Test (OSSLT) administered by the Education Quality and Accountability Office (EQAO) were also made available to the evaluation team. In‐depth qualitative analyses of interview and focus group transcripts and field notes as well as quantitative analyses of the survey and Ministry data were performed to answer specific research questions put forth by the Ministry of Education. It is on the basis of this evidence and of the findings outlined elsewhere in this report that the evaluation team concludes that the SS/L18 Strategy appears to be achieving a number of its objectives. The summary of the findings yielded by these analyses follows. Overall, the SS/L18 Strategy has garnered an enthusiastic response from all parties who participated in this evaluation. While there are elements that respondents did not like or about which participants expressed concern, the overwhelming response of the majority of participants was that the SS/L18 Strategy was improving the learning conditions for, and the success of, secondary students in Ontario. What has changed in the last four years in Ontario’s secondary schools to help students succeed? The data collected throughout the field visits show that a number of changes aimed at increasing student success have occurred in the secondary school system over the past four years. Critically, there is good evidence of an overall shift from an implied or presumed focus to an explicit and highly intentional focus on the learner as the focal point for the work of schools. Other important changes highlighted during the field visits include improved communication among different system actors, increased flexibility in meeting diploma requirements, increased focus on a caring school culture, increased focus on tracking and monitoring individual students, especially with respect to the transition period

Executive Summary
______________ September 2008 vii
between elementary and secondary school, and expanded program choices and flexibility for students. What have been the main benefits arising from these changes to date? The types of benefits most frequently reported by school and school board informants were classified as human‐related benefits. These types of benefits include:
• improved internal communication within schools, • increased student engagement, and • improved teaching practices.
There is less evidence that the SS/L18 Strategy has led to benefits with respect to improving communication with community partners or stakeholders and to supporting the systematic sharing of effective practices. Measurement and accountability‐related benefits account for the second most frequently mentioned category of benefits produced by the SS/L18 Strategy by those interviewed, and include improvements in student monitoring and tracking as well as in data use. The findings also point to resource‐related benefits as important outcomes of the SS/L18 Strategy. Three specific resource‐related benefits were identified by informants as resulting from the SS/L18 Strategy:
• increased number of program options, • increased scheduling flexibility, and • increased access to human resources—primarily teaching staff and SSTs—to
support student success. The most significant academic‐related benefits reported by informants are:
• smoother transitions from secondary school to postsecondary education and/or work and between the elementary and secondary levels,
• improvements in test results, and • improvements in graduation rates and decreases in drop‐out rates.
Informants also identified systemic benefits from changes associated with the SS/L18 Strategy. Systemic benefits reflect changes in values, dispositions or beliefs manifested across individuals and/or at various levels of the educational system. It is encouraging to note that the most often cited systemic benefits produced by the SS/L18 Strategy are culture change and an improved professional culture.

Executive Summary
______________ September 2008 viii
Which elements of the SS/L18 Strategy and actions that have been implemented appear to be yielding student success? Overall, the great majority of those who responded to the survey and who were familiar with specific elements of the SS/L18 Strategy (such as expanded cooperative education, apprenticeships, Student Success Teachers, Credit Recovery, School‐College‐Work Initiatives, Dual Credit programs, and Specialist High Skills Majors) agreed or strongly agreed that they helped student become more successful. Survey data also suggests that different elements of the Strategy are complementary and suited to meeting the diverse needs of students. How have changes within Ontario’s secondary schools aimed at increasing student success been supported? Government has provided additional resources – both financial and human – to support the change process and the changes themselves. Based on the data collected throughout both stages of this evaluation, the evaluation team concludes that many factors have been instrumental in supporting changes that have helped increase student success. These factors include:
• targeted funding, • the designation of dedicated student success staff in each school and of SSLs in
each board, • increased scheduling and funding flexibility, • the provision of professional development opportunities, • improved information sharing about individual students, • increased focus at key transition points of students’ educational trajectories, • specific components of the SS/L18 Strategy that have acted as foundations or
rallying points for the development of supportive pedagogical practices and alternative means of assessing student progress and success,
• the ongoing availability of long‐established programs such as cooperative education and apprenticeships, and
• the development of innovative offerings such as the SHSMs. Responses to the survey show that secondary school staff generally agree that educators possess the professional skills and knowledge needed to implement the SS/L18 Strategy. Secondary school staff who responded to the survey are concerned, however, that current human resource allocations are insufficient to support the range of initiatives implemented under the SS/L18 Strategy.

Executive Summary
______________ September 2008 ix
What barriers to increased student success have been encountered? And how have these been addressed? Although efforts have been made by the Ministry, school boards, and schools to inform students of the programs and initiatives part of the SS/L18 Strategy that are available to them, one challenge still facing the Strategy is a relative lack of student awareness of the Strategy and its constituent initiatives or components. Although most students are familiar with at least one of the components of the Strategy, many are unaware of the scope of programs and supports available to them. Information gathered from interviews and focus groups offers valuable insight into other barriers facing the SS/L18 Strategy. The challenges most frequently reported during field visits were human‐related challenges, including:
• staff perceptions and student dispositions, • the needs of specific student subpopulations (especially students with persistent
or marked behavioural difficulties), and • inadequate or underdeveloped pedagogy in specific areas of practice.
Resource‐related challenges accounted for the second most frequently mentioned category of barriers to student success and to the effectiveness of the SS/L18 Strategy. Within this category, the specific factors that were most frequently mentioned by respondents as impeding greater student success were:
• insufficient human resources, • limited funding, • lack of (programmatic) flexibility, and • issues related to transportation and/or school location.
The concerns expressed during the interviews and focus groups regarding human resources and transportation were echoed by the responses of secondary school staff to the online survey. Many survey respondents reported a lack of physical and human resources at their school to implement successfully components of the SS/L18 Strategy. The Ministry has been addressing and continues to address these challenges by acknowledging the great need for human and other resources to ensure student success by allocating funding for such resources. For example, the Ministry has invested over $100 million for the hiring of 1,600 teachers since 2005. Informant statements collected during field visits were deemed to reflect systemic challenges when they referred to resistance and/or misunderstanding of the SS/L18 Strategy’s values, beliefs or goals and to resulting barriers on student success. Public perceptions (for example persistent negative or inaccurate perceptions about the values
Executive Summary
______________ September 2008 x
of different educational pathways) were widely identified as the most significant systemic barrier to student success. Although less frequently mentioned, challenges related to data collection and use were sometimes identified by informants during the field visits as examples of measurement and accountability challenges currently facing the SS/L18 Strategy. Field data suggest that the knowledge and capacity to properly collect meaningful data and to use these data to get a reliable sense of student performance at the aggregate level are reportedly less well developed than necessary for these tasks. These challenges are being addressed by the development of an efficient and accurate provincial data collection system, which is well underway. These changes have led to increases in the frequency of data collection in the majority of schools and school boards visited, as well as in increases in the quality of these data. This change process in not complete and there are reported instances of problems with data collection and use. The pressures of curricular expectations were also frequently mentioned during field visits. Informants regularly indicated that the vast amount of mandated curricular content and the timelines within which this content was expected to be addressed were acting as significant barriers to greater student success. What further strategies and actions, if any, are suggested to further increase secondary student success? Given how frequently the human‐ and resource‐related barriers to student success that were previously discussed were mentioned by respondents, it comes as no surprise that school and school board informants focused most of their recommendations on actions having to do with human‐ and resource‐related factors. Suggested human‐related improvements were mainly related to various aspects of capacity building, communication with primary stakeholders and meeting the diverse needs of learners. The three most frequently suggested resource‐related improvements were meeting staffing needs, increasing or securing existing funding to offer suitable program options as dictated by local needs and conditions, and increasing flexibility around program and course delivery. Systemic improvements drawn from informant statements addressed the need to continue reinforcing a system‐wide culture shift from teaching to learning, on increasing awareness of the value of different educational pathways, and on fostering a climate of planning certainty at all levels of the educational system. A common recommendation heard by the field team was to “stay the course” with the SS/L18 Strategy. Informants unequivocally stated that the flexibility and variety afforded

Executive Summary
______________ September 2008 xi
by different initiatives and components of the SS/L18 Strategy were significant determinants of educators’ ability to stay focused on relevant goals and to maintain morale. Is there any evidence that graduation rates are increasing and drop‐out rates decreasing? Informants stated that graduation rates are increasing as a result of the SS/L18 Strategy. The Ministry has reported that provincial graduation rates have been increasing steadily from 68% in 2003‐04 to 75% in 2006‐07. Is there any evidence that structures and supports are changing to better provide viable pathways for all students to learn to 18 years and beyond? The expansion of cooperative education opportunities, the development of Specialist High Skills Majors and Dual Credit programs, and the increased opportunities for apprenticeship placements are examples of the efforts being made to provide viable pathways for students. Survey data show that students generally feel that they get good advice and guidance for career preparation and for planning their future education. In contrast, a sizable proportion of teachers who responded to the survey reported knowing very little about what is available to students after graduation. Is there any evidence that new learning opportunities are changing to better capture and build on the strengths and interests of all students? Many secondary school students and staff agree that initiatives such as Dual Credit programs, Specialist High Skills Majors (SHSMs), expanded cooperative education, apprenticeships, and School‐College‐Work Initiatives (SCWIs) help students by providing them interesting new learning opportunities. More than half of the students who responded to the survey say that they are often or always interested in what they are learning in class and the majority of student respondents say they have been able to take courses that they find interesting and challenging. Is there any evidence that structures and supports are changing to better assist students in their transition from elementary to secondary school? Improved communication, especially between secondary schools and their feeder elementary schools, the development of student profiles, individual timetabling for students identified as “at‐risk” and a multitude of transition activities were discussed during school visits. They point to a strong focus on ensuring that students experience a successful transition between elementary and secondary school. The vast majority of secondary school staff who responded to the survey agree that their school is making efforts to welcome its Grade 9 students, to make them feel that they can succeed in secondary school, and that teachers in their school monitor how

Executive Summary
______________ September 2008 xii
Grade 9 students are doing. Furthermore, approximately three‐quarters of respondents agree that their school creates individual timetables that build on students’ strengths. Is there any evidence that accountability measures (monitoring, tracking, reporting and planning) are in place in schools and school boards and being used by schools and boards in order to drive improvement? The vast majority of staff survey respondents agree that monitoring measures are in place in their school and that these are being used to support student success. Is there any evidence that capacity to implement the SS/L18 Strategy is being built in schools and school boards? Although all school staff who responded to the survey report having taken part in some form of professional development since September 2005, there is considerable variability in the level of participation in professional development related specifically to the SS/L18 Strategy. It is clear from the survey responses that the Ministry is focusing on SSTs, principals, vice‐principals, and guidance or career counsellors to build capacity to implement the SS/L18 Strategy and that direct capacity building for teachers who are not part of the Student Success Team is less well developed or prevalent. Is there any evidence that schools and school boards are acting upon their student and school‐level data and information to intervene with and support students appropriately? Survey data show that most secondary school staff agree that data is now being used more than before to help support individual students in their school. Data use was also identified during interviews and focus groups as representing a challenge to student success and as a growth area. Many interviewees reported having access to data but indicated they lacked the knowledge and capacity to use these data to drive improvement, though informants in some schools described active professional conversations about student achievement data both at the class/course levels and in terms of a student’s overall progress. Is there any evidence that schools and school boards are making decisions in an effort to align resources and practices to the goals of the SS/L18 Strategy? Secondary school staff report that efforts are being made to align resources and practices to the goals of the SS/L18 Strategy. The vast majority of respondents also agree that teachers in their school build literacy skills into their daily lessons, that their school can make individual timetables that build on students’ strengths, and that there is a new focus in their school on building students’ competencies in mathematics.

Executive Summary
______________ September 2008 xiii
Is there any evidence that low impact initiatives are being replaced by high impact initiatives at all levels of the education system? It is still early in the implementation of the SS/L18 Strategy to assess the real impact of most initiatives within the Strategy, and therefore it is to be expected that few instances were observed of low impact initiatives being replaced by others. The term initiative is used to encompass a variety of approaches, resources and specific program changes. While informants in the field visits rarely identified the replacement of a low‐impact initiative with a different, higher impact initiative, they frequently identified a process of fine‐tuning and adjustment for resources, approaches and program delivery. Summary of Recommendations Based on the extensive data gathered during this formative evaluation, the evaluation team recommends that
• the Ministry actively encourage collaboration among schools and school boards to ensure the efficient use of available resources;
• in order to offer the range of options that will attract, retain and prepare students for secondary school success, the Ministry maintain current expenditure levels even in the face of declining enrolment;
• the Ministry consider and provide guidance to school boards on succession planning for SSTs and SSLs;
• the Ministry increase allocations for support from specially trained professionals such as youth workers, social workers, and psychologists to help address the needs of many students identified as “at‐risk”;
• the Ministry significantly augment its efforts at capacity building surrounding data use and make provision for collaborative discussion about how data might affect practice among staff members;
• the SS/L18 Strategy depending upon collaboration among the many educational professionals with whom students interact, the Ministry play a leadership role in bringing representatives of relevant agencies and services together to identify the challenges that such collaboration entails and to suggest mechanisms for facilitating such collaboration wherever it is required;
• as the architect of the SS/L18 Strategy, the Ministry endeavour to communicate more effectively with those ensuring the daily implementation of the Strategy to clarify lingering misconceptions and to provide the tools necessary to alter practices in a way that reflects the central values and goals of the Strategy;
• the Ministry attempt to identify the more effective vehicles for communicating information to diverse target audiences (this might productively begin with an enumeration of the better means of communicating with students and their parents about opportunities that schools provide);

Executive Summary
______________ September 2008 xiv
• the Ministry devote additional attention to ensuring that messages about the SS/L18 Strategy reach all secondary school students, especially those in larger secondary schools, and should ensure the tailoring of messages to specific subgroups within secondary schools, which might prove more effective than broadcasting messages to the entire population;
• schools and school boards work cooperatively with neighbouring schools and boards to ensure that students have the widest range of opportunities that can be provided – given student numbers and resources;
• the Ministry continue to hold consultations with key stakeholders, such as teachers, to ensure that the set of guiding principles developed for Credit Recovery is adhered to throughout the province and to ensure that standards and fairness are maintained;
• school boards closely monitor the implementation of practices such as credit recovery and credit rescue to ensure that, in the course of providing students with additional opportunities to demonstrate achievement, standards are being maintained;
• the Ministry devote attention to the use of certain language within the context of the SS/L18 Strategy (e.g., phrases such as “four‐year program,” “failure is not an option, and “16 by 16” are convenient short‐hand among people familiar with both the denotative and connotative meanings intended, however, for audiences unfamiliar with such meanings or for audiences that wish to intentionally misconstrue intentions, these phrases can confuse or be used to muddle or undermine the goal and effectiveness of the Strategy);
• school boards work cooperatively with neighbouring boards to ensure complementarity among program offerings across jurisdictions – more effective use of resources can be achieved by such collaboration;
• as part of its curriculum revision process, the Ministry engage educators in identifying the core objectives that must be mastered in order for a student to succeed in subsequent course work, and in refashioning the curriculum to focus upon these core objectives;
• the Ministry examine ways to ensure that there are no financial or other disincentives to ensuring that students stay in school until graduation;
• the Ministry devote more attention, resources and support to the practices aimed at the retention and re‐engagement of 16‐ and 17‐year‐olds, including consideration of complementary social policies to address impediments to school success (such as substance abuse and anger management) that are, at present, beyond the jurisdiction of schools;
• schools explicitly plan for the reintegration of students and carefully monitor the consequences of such reintegration on the individual student, the student’s peers, and on the school environment;

Executive Summary
______________ September 2008 xv
• the Ministry consider conceptualizing the progress of the implementation of the SS/L18 Strategy among secondary schools as stages in a change process and be cognizant that individual schools will be at different stages depending upon a broad range of factors; and
• everyone involved in Ontario’s school system become engaged, including school trustees, directors and superintendents, principals, teachers and support staff. Ensuring success for all students must become the paramount goal of everyone involved in education in Ontario, because success is achieved one student at a time.
Introduction
______________ September 2008 1
Introduction
Context and Background Important changes have been initiated and, in some cases, are well underway in the Ontario secondary school system. These changes, happening under the ambit of the Student Success/Learning to 18 (SS/L18) Strategy, reflect a commitment by the Ontario Ministry of Education (hereafter “the Ministry”) to improving secondary school success for all students and increasing the provincial secondary school graduation rate to 85% by 2010‐2011. The origins and motivations of the SS/L18 Strategy can be traced in part to reactions to a four‐phased double‐cohort longitudinal study by Alan King (King, 2002, 2003; King et al., 2004), which cited alarmingly low graduation rates within the province (68% in 2003‐2004) and identified credit accumulation in Grade 9 and 10 as a key correlate of secondary school graduation. In addition, subsequent research (Ferguson, Tilleczek, Boydell, Rummens, Cote & Roth‐Edney, 2005; Institut franco‐ontarien, 2005) identified student disengagement as a critical component of students’ early departure from secondary schools. Together, these findings have helped motivate the development of specific programs to help every student acquire the required number of secondary school credits and subsequently graduate from secondary school. The SS/L18 Strategy is a broad, province‐wide strategy consisting of three phases and designed to ensure that every student is provided with the tools to successfully complete their secondary schooling and reach their post‐secondary goals, whether these goals involve apprenticeships, college, university, or the workplace. As part of the SS/L18 Strategy, the Ministry has implemented a support system (in the form of funding, policy and legislative changes, resources and training, and consultation) to encourage the development of innovative and flexible educational opportunities that reflect regional, social, and cultural differences affecting students’ learning experiences and outcomes, and to foster positive student engagement with education in a manner that respects their individual needs and circumstances. The SS/L18 Strategy was designed to meet five key goals focused on the secondary school system:
1. Increase graduation rate and decrease drop‐out rate; 2. Support a good outcome for all students; 3. Provide students with new and relevant learning opportunities; 4. Build on students’ strengths and interests; and 5. Provide students with an effective elementary to secondary school transition.

Introduction
______________ September 2008 2
As is the case with every major policy endeavour, the SS/L18 Strategy can also be characterized by the purposes it is designed to achieve and the values that underlie it. This characterization provides an additional way of conceptualizing the Strategy and its reach. Although not explicitly expressed by its architects, the SS/L18 Strategy rests upon values about what schools should do for students or enable them to do, and about the relationship between those who govern Ontario’s system of secondary education and those responsible for carrying out its mission. After having heard from those involved in the development of the Strategy and by those involved in its implementation, the evaluation team considers that the SS/L18 Strategy can be characterized by the following values, some of which represent a change in the orientation of the province’s educational system, about what schools should do for students or enable them to do:
• Schools should equip all students with the skills they will need as lifelong learners.
• Schools should accord equal respect to all secondary school programs and post‐secondary destinations, including immediate post‐secondary employment, apprenticeship and other forms of training, college study, and university attendance.
• Schools should provide all students with opportunities to explore the connections between what they learn in school and future employment or study.
• Schools should credit student accomplishments and build upon those accomplishments to help students overcome barriers to further mastery.
• Schools should eliminate or minimize the difficulties that students face when they make a transition from one level to the next.
• Schools should accommodate the different ways that students learn. • Schools should actively engage all students and enable them to persist in school
despite the challenges the individual student may face. A Formative Evaluation The Canadian Council on Learning (CCL)1 was engaged through a competitive process by the Ministry to evaluate the extent to which the SS/L18 Strategy as currently implemented is aligned with the Ministry’s goals and is producing the intended outcomes. More specifically, the formative evaluation strived to address the following high‐level research questions:
1. What has changed in the last four years in Ontario’s secondary schools to help students to succeed?
1 CCL is an independent, non‐profit, pan‐Canadian corporation committed to improving learning across the life course in Canada by: (1) monitoring and reporting about the state of learning in Canada; (2) encouraging the use of evidence to inform decisions about learning; and (3) filling in gaps, and building capacity for, research on learning.

Introduction
______________ September 2008 3
2. What have been the main benefits arising from these changes to date? 3. Which elements of the SS/L18 Strategy and actions that have been implemented
appear to be yielding student success? 4. How have changes within Ontario’s secondary schools aimed at increasing
student success been supported? 5. What barriers to increased student success have been encountered? And how
have these been addressed? 6. What further strategies and actions, if any, are suggested to further increase
secondary student success? In addition to these high‐level questions, the evaluation team examined whether there was evidence that:
1. Graduation rates are increasing and drop‐out rates decreasing. 2. Structures and supports are changing to better provide viable pathways for all
students to learn to 18 and beyond. 3. New learning opportunities are changing to better capture and build on the
strengths and interests of all students. 4. Structures and supports are changing to better assist students in their transition
from elementary to secondary school. Furthermore, the following questions were investigated through exchanges with various stakeholders in the field:
1. Are accountability measures (monitoring, tracking, reporting and planning) in place in schools and school boards and being used by schools and boards in order to drive improvement?
2. Is capacity to implement the SS/L18 Strategy being built in schools and school boards?
3. Are schools and school boards acting upon their student and school‐level data and information to intervene with and support students appropriately?
4. Are schools and school boards making decisions in an effort to align resources and practices to the goals of the SS/L18 Strategy?
5. Are low impact initiatives being replaced by high impact initiatives at all levels of the education system?
The evaluation process was composed of two main stages. The goals of Stage 1 were to provide a description and chronology of SS/L18 Strategy‐related changes and to make general observations about the conduct of the SS/L18 Strategy, its strengths and vulnerabilities, as well as some preliminary recommendations for the future of the Strategy. The goals of Stage 2 of the evaluation were to build on the findings of Stage 1, to examine the research questions listed above in more depth, and to provide

Introduction
______________ September 2008 4
recommendations to the Ministry with regard to future developments of the SS/L18 Strategy. This report begins with a description of the framework, standards, and values that guided this evaluation. A brief overview of the activities performed during Stage 1 of the evaluation is then offered, with a brief summary of the preliminary findings from the information gathered at Stage 1 of the project. A detailed account of the qualitative and quantitative data collection and analysis activities conducted during Stage 2 (with additional information found in appendices) follows the exposition devoted to Stage 1. Findings are then presented with respect to how they address each of the research questions guiding the evaluation. A concluding section containing a summary of the main findings and recommendations for future developments of the SS/L18 Strategy completes the report and is organized according to how they related to the set of values characterizing the SS/L18 Strategy (as listed on p. 2). Although this final report provides a detailed account of Stage 2 of the formative evaluation, the conclusions and recommendations are based on the information gathered throughout the entire period of the project.
Evaluation Framework
In gathering and interpreting evidence of the extent to which the SS/L18 Strategy is achieving its goals, CCL has followed a specific framework based on widely accepted evaluation procedures (see Popham, 1971; Stake, 1972; Stufflebeam, 2000. See Figure 1. Starting with each of the five key goals provided by the Ministry during Stage 1 of the evaluation, CCL identified some of the specific programs along with intended elements associated with each initiative. These elements included: (a) the specific goal of the initiative or activity and how it is associated to the SS/L18 Strategy’s main goals, (b) the target population, (c) the necessary ingredients, (d) the activities, (e) and the outcomes. This framework is useful in three important ways: (a) in determining whether the goals and objectives of a program are sufficiently explicit and specific; (b) in determining whether the intended components of the program, including the target population, resource allocation, programs, and outcomes are logically related to the goals and to each other; and (c) in evaluating the gap between the intended and observed components of the program. Stage 1 of the evaluation focused on identifying the intended elements of each initiative or component. This was done by searching for and gathering information regarding

Introduction
______________ September 2008 5
these elements in documents provided by the Ministry, during Stage 1 interviews and focus groups, and in consultations with Ministry officials. Stage 2 focused on identifying the observed elements to determine whether there are gaps between the intentions and actual implementation of each initiative. This was achieved by gathering information during field visits in schools and school boards.
Figure 1: Diagram of the Evaluation Framework
Initiative/Activity Goals or Objectives
IntendedTarget Population
Necessary Ingredients
IntendedActivities/Strategies
IntendedOutcome
ObservedTarget Population
ObservedIngredients
ObservedActivities/Strategies
ObservedOutcome
Initiative/Activity and Alignment with Overall Goals
Standards and Values This evaluation adheres to the Program Evaluation Standards of the Joint Committee on Standards for Educational Evaluation at Western Michigan University (http://www.wmich.edu/evalctr/jc/). In keeping with those standards, the team has made every effort to maximize the values of utility, feasibility, propriety, and accuracy.

Stage 1: Summary
Stage 1: Summary
In Stage 1 of the evaluation, CCL undertook a preliminary content analysis of Ministry source documents and reports, conducted interviews with a total of 39 individuals identified as likely to provide useful information for the initial stage of the evaluation, and conducted four focus groups with Student Success Leaders (SSLs). The purpose of the interviews and focus groups was to produce a comprehensive inventory and description of the programs undertaken during Phases One, Two, and Three of the SS/L18 Strategy, and to explore the perceptions of the Strategy held by system leaders. Document Analysis During Stage 1 of the evaluation, the Ministry and other key respondents provided CCL with documents related to the SS/L18 Strategy that were catalogued and consulted as reference documents for the elaboration of the state of implementation of the SS/L18 Strategy (see Stage 1 report). Details regarding the origins and unfolding of the SS/L18 Strategy were gathered using documents provided by the Ministry during this first stage of the evaluation and can be found in the timeline included in the Stage 1 report. Below is a brief summary of the chronology of the SS/L18 Strategy’s development and implementation. Phase One of the SS/L18 Strategy was launched in 2003. This first phase included, among other initiatives, a $114‐million investment, revised Grade 9 and 10 applied mathematics curricula, the development of new locally developed compulsory credit courses, and the appointment of Student Success Leaders (SSLs) in each board. Phase Two of the SS/L18 Strategy was launched in May 2005, continuing the programs instigated in Phase One with an additional allocation of $158 million for human resources, including Student Success Teachers (SSTs) in every secondary school, and to expand the Lighthouse projects initiative (started in the Fall of 2004). Phase Three of the SS/L18 Strategy began in December 2005 with the introduction of the Learning to 18 legislation (Bill 52) and additional funding for the continuing support of existing programs and professional development, as well as the development of the Specialist High Skills Majors (SHSMs), programs focused on facilitating Grade 8 to 9 transition, expanded cooperative education programs, and programs with a focus on student success in rural areas.

Stage 1: Summary
______________ September 2008 7
Interviews and Focus Groups A total of 39 semi‐structured interviews were conducted by CCL (see Appendix A for the interview guide used in Stage 1) to gain a better understanding of the intended programs within their broader policy contexts. Interviews were conducted in English and in French. Each interview was digitally recorded and transcribed by a professional transcription service for further analysis. Interviewees were given the opportunity to view the transcript of their interviews to edit any inaccuracies or add any information they considered to be pertinent to the evaluation team.
The interviews were carried out with individuals who hold or have held positions in which the occupants could be expected to be knowledgeable about the SS/L18 Strategy. Within the Ministries of Education and of Training, Colleges and Universities, individuals were selected who had program and policy responsibilities for the SS/L18 Strategy, or whose program and policy responsibilities intersected with those of the strategy. Participants included both head office and field staff. Among the interviewees were 17 current or former senior managers from the Ministries of Education and of Training Colleges and Universities, seven educations officers with the Ministry of Education, and three consultants to the Ministry.
School board staff members were interviewed as well, including four directors of education, two current or former SSLs, a superintendent of programs and the current or former project coordinator responsible for board‐level implementation of the strategy. All four board types were represented (English‐language and French‐language; Catholic and public) among these interviewees, as were all the geographic regions of Ontario. Within the colleges sector, a college president and a vice‐president of student services were also interviewed.
In addition to individual interviews, the evaluation team organized four focus groups with SSLs (see Appendix A for focus group guide used in Stage 1). A total of 25 SSLs participated in the focus groups. One focus group was conducted with five SSLs from French‐language public district school boards and French‐language catholic district school boards. A second group was conducted with seven SSLs from Northern Ontario English‐language public district school boards and Northern Ontario English‐language catholic district school boards. Two focus groups were conducted with a total of 13 SSLs from Southern Ontario English‐language public district school boards and Southern Ontario English‐Language catholic district school boards. Being directly involved in the programs, these key respondents had valuable insights into the significance and the perceived success of the programs implemented under the SS/L18 Strategy and were able to shed light on the actual resources available to school

Stage 1: Summary
______________ September 2008 8
boards to aid in the implementation of the SS/L18 Strategy. Each focus group was digitally recorded and transcribed for analysis. Transcripts were coded for statements pertaining to the following pre‐determined analytical categories: (a) respondents’ understanding of the SS/L18 Strategy and of its origins and chronology; (b) their views on the strengths and weaknesses of the Strategy; (c) their opinions about the factors of success and challenges impacting the Strategy; (d) as well as their recommendations for the future of the Strategy. Stage 1 Preliminary Findings and Recommendations Strengths While the observations contained in the first report were necessarily preliminary and subject to further verification in Stage 2, the evaluation team concluded that Ontario has created an educational strategy that integrates a wide range of programs and encourages considerable programmatic innovation and professional autonomy on the part of educators. Observations made in Stage 1 led to the conclusion that there appears to be considerable mutuality and complementarity among the elements of the SS/L18 Strategy that, although still in early stages of development, appears to be succeeding in providing a more respectful and responsive school environment for students and increased opportunities for them to remain in and benefit from secondary schooling in ways that provide a foundation for work and study following secondary school. Systems of resources and support appear to be in place, with a focus on funding and capacity building to promote monitoring, tracking, and accountability at all system levels. In particular, at the outset of Stage 1, the evaluation team concluded that the SS/L18 Strategy provides more choices for students not bound for university, more chances to make up lost ground, more recognition of the maturation process of adolescence, and more supportive and individualized attention through program and transition planning. A more detailed description of the methods, findings, observations, and recommendations from the initial stage of the evaluation can be found in the Stage 1 report. Vulnerabilities Notwithstanding the strengths identified in Stage 1 of the evaluation, the evaluation team considered that the SS/L18 Strategy was vulnerable and faced challenges on a number of fronts. The widespread and deep penetration of the spirit of the Strategy (representing a change in culture at many levels) within every school, reaching

Stage 1: Summary
______________ September 2008 9
principals, teachers, students, and members of the larger community in the province was identified as a challenge that would require a long‐term commitment and sustained resources to overcome. This was seen as especially relevant given staff and student transience and the fact that the implementation of a number of programs inherent to the SS/L18 Strategy (e.g. Credit Recovery, Dual Credit) remain contentious. At the time of completing Stage 1, the evaluation team identified the danger posed by the perception that, in a desire to ensure success for all learners, standards would be relaxed or perceived to have been relaxed, which would ultimately undermine key stakeholder commitment and public confidence in quality. Related to this challenge was one faced by most complex initiatives that require sustained effort from the part of all players in the system, namely system fatigue. The risk was identified that increased workload and professional development requirements could lead to fatigue that would be felt at all levels of the system and threaten the long‐term viability of the initiative. Certain components of the SS/L18 Strategy require developing effective partnerships between schools, school boards, colleges, and other community agencies and organization, which in turn require considerable time and money. Logistical barriers such as transportation and accommodation were apparent in this early stage of the evaluation, especially in remote, rural, or French‐speaking areas, and the evaluation team identified these as requiring attention. The evaluation team also noted that provisions for some flexibility with regard to local program implementation, although in many ways essential, could also lead to infidelity of implementation or create unwanted imbalances, such that successful schools, projects, or programs might become magnets for students and staff resulting in a loss of enrolment and therefore resources to less successful schools. Finally, the evaluation team noted that the goal of re‐engaging disaffected students in the secondary school system entailed the challenge of bringing back to school individuals with social or behavioural issues that could be disruptive or negatively affect other students. The presence of students with mental health issues was identified as requiring special attention and cooperation among agencies and ministries charged with public health, education, and the provision of services to children and youth. Preliminary Recommendations Based on the conversations carried out with key respondents at the Ministry and school boards and on the source document analysis, the evaluation team formulated a number of preliminary recommendations which are summarized below.

Stage 1: Summary
______________ September 2008 10
Innovation and cultural change In light of the numerous strengths of the SS/L18 Strategy that were identified in Stage 1 of the evaluation, and the palpable level of excitement observed during the initial interviews and focus groups, the evaluation team echoed the recommendation given by many key informants to “stay the course” and “maintain the initiative.” It was deemed important that the SS/L18 Strategy continue to be multi‐faceted and even complex. Maintaining signal continuity (the consistency and duration of the core message) was seen as essential in such a large and diverse human system as the education sector. In its absence, practitioners might lose sight of long‐term goals and objectives, risking becoming cynical that the initiative(s) being pursued are the “flavour of the month” – something that would pass and could be passively resisted in the interim. The Ministry was encouraged to consider how it might use social marketing to reach parents and the wider community to create a climate of support and positive expectations for the goals of the SS/L18 Strategy. Effective and flexible capacity building The evaluation team also recommended that the resources provided under the ambit of the SS/L18 Strategy remain special allocations to school boards made in response to approved plans and demonstrated results. To facilitate the planning and reporting processes that accompany the provision of such resources, the Ministry was encouraged to inform and assure boards of continuity of resources so long as the plans and demonstrated outcomes meet approved standards. Collaboration between school boards and schools with coterminous or primarily contiguous boundaries was also identified as desirable and to be encouraged by the Ministry. The evaluation team felt that such collaborations would be likely to help avoid missing opportunities and to optimize the use of available resources. It was also recommended that the formula for the allocation of SSLs and SSTs reflect the student populations served by, and the unique conditions of, each region. Strong, effective, and committed leadership The Ministry was encouraged to provide educators with clear information about the implementation of the Learning to 18 legislation, about Ministry expectations regarding attendance by 16‐ and 17‐year‐old students, and what resources and mechanisms would be required and/or made available to track and support students. Monitoring and evaluation It was also suggested that attention be paid to a continued adjustment of the key indicators of student success. The evaluation team recommended continued and ongoing formative evaluation of the SS/L18 Strategy as a whole and of its components as an essential monitoring and evaluation mechanism for the SS/L18 Strategy.

Stage 2: Methods and Analyses
Stage 2: Methods and Analyses
The preliminary findings of Stage 1 and the Ministry’s specific evaluation questions were examined in more detail during the second stage of this evaluation. In this section, details regarding the qualitative and quantitative methods used and analyses performed in Stage 2 are presented. Qualitative Data Collection Methodology In order to properly evaluate a major policy initiative such as the SS/L18 Strategy and its impacts, attention needs to be directed to both the outputs and outcomes of the initiative as well as the processes, localized conditions, and contextual dynamics that have shaped its implementation. Consequently, many of the analyses examining the research questions guiding this evaluation, as well as the potential gap between intended and observed components of the evaluation framework (see Figure 1 on p. 5), were conducted using qualitative data sources (namely in‐depth field interviews and focus groups). The use of field interviews and focus groups was deemed essential to uncover the actual changes experienced by those directly involved in the SS/L18 programs, as well as to understand any hidden barriers to success that would not be revealed by relying solely on quantitative student achievement data (Taylor & Bogdan, 1998). There is ample evidence in the education literature that qualitative research methods, when implemented judiciously and according to the highest standards, can reveal factors that are of fundamental importance in understanding the impact of a particular initiative, factors that are likely to remain undiscovered if only quantitative techniques are used (Berg, 2007; Creswell, 2005). Rigour in qualitative research entails the use of a transparent accounting of all processes (including tracking and reporting decisions made with respect to coding and analysis) and incorporates opportunities for performing inter‐rater reliability. These standards and practices were espoused throughout this evaluation. Field team The Field Relations Director built a team of eight interviewers (three of whom were French‐speaking), each with extensive experience and knowledge of the Ontario education system. The interview team was trained by the Field Relations Director and the Project Manager to ensure that interviews were carried out in a uniform and consistent manner, while maintaining sensitivity to local conditions present in the various interview sites (e.g., Ferguson et al., 2005). The Field Relations Director ensured that the interview process was sufficiently piloted and that debriefing meetings with the

Stage 2: Methods and Analyses
______________ September 2008 12
interviewers occurred regularly to identify problems with the administration of the interview instruments as well as emerging themes of interest to the evaluation team. 2 Sampling information Individual schools and school boards were identified early in the research as the primary units for the data collection through the field interviews because they are the locus of change and bear primary responsibility for the implementation of educational programs. Key respondents were recruited at each of these levels for semi‐structured interviews or focus groups. Schools and school boards were sampled according to a purposive method (Creswell, 2005) to ensure representation of schools (and their corresponding school boards) in each of the six regions for school boards (Barrie, London, North Bay/Sudbury, Ottawa, Thunder Bay, and Toronto), while maximizing the number of school boards involved. In addition, sampled schools included a representation of schools from rural and urban areas, and a representation of small (400 students or less), medium (between 401 and 1,600 students), and large (more than 1,600 students) schools. Table 1 details the attributes of schools and school boards included in the sample used for qualitative data collection.
Table 1: Attributes of selected school boards and schools Number of school boards Number of schools Region Barrie 11 12 London 7 8 North Bay / Sudbury 6 6 Ottawa 8 9 Thunder Bay 3 4 Toronto 8 14 Language English 36 46 French 7 7 Area3 Urban 34 43 Rural 9 10 School Size Small (<400) 8 8 Medium (401‐1,600) 31 41 Large (>1,600) 4 4 Total 43 53
2 During the training sessions, each interview question was reviewed, practiced, and modified to remove any ambiguities and modified according to the length of the interview needed. Moreover, the Field Director accompanied each interviewer during their first interview to ensure consistency. 3 The urban/rural classification for each school was provided to the evaluation team by the Ministry of Education.

Stage 2: Methods and Analyses
______________ September 2008 13
The field team conducted semi‐structured, individual interviews and focus groups with school and school board informants who were deemed most likely to provide responses from complementary perspectives. In French‐language school boards and schools, interviews and focus groups were conducted in French. In most cases, interviews and focus groups were jointly conducted by two members of the field team, with one moderator and one observer responsible for taking notes. Focus groups typically comprised between two and 10 informants, chosen by the school administration (usually the principal or vice‐principal) based on their availability and willingness to participate in the discussion.4 In each school, up to one interview and four focus groups were conducted:
• Principal (interview) • Members of the Student Success Team (focus group) • One or more teachers who were not part of the Student Success Team (focus
group) • Parents (focus group) • Students5 (focus group)
At the school board level, up to three interviews were conducted: • Director of education (interview) • One or more school trustees (interview or focus group) • Student Success Leader (interview)
In addition, seven representatives from the college sector who had direct experience with schools and school boards were interviewed by telephone. Qualitative data collection instruments CCL developed semi‐structured interview and focus group instruments and protocols that were used with the key informants listed in the previous section (see Appendix B for the interview and focus group guides used in Stage 2 of the evaluation). The
4 Sampling methods in qualitative research differ from the probability (or random) methods used in quantitative research (see for example Marshall, 1996). A combination of purposeful and convenience sampling was used in this research. Participants were chosen to ensure that we obtained information from key categories of respondents who were most likely to have the knowledge and experience necessary to address the questions pertinent in this research, while being readily available during the time allotted for the discussions. 5 Whenever possible, separate focus groups were conducted with students identified by the school as being “at‐risk” and other students not identified as such.

Stage 2: Methods and Analyses
______________ September 2008 14
interview and focus group instruments were developed to investigate the research questions motivating this stage of the evaluation. Each interview and focus group was digitally recorded. Due to the high cost of transcribing audio files, a proportional random6 sample of 117 interview and focus group sessions was transcribed verbatim by a professional transcription service for detailed analyses (see Table 2). Interview and focus group session were selected for inclusion in the coding and analysis process to ensure a balanced representation of informants according to the attributes listed in Table 1. The depth of data provided by this sample was complemented by the breath of data afforded by the summary field notes, which interviewers completed after each interview or focus group (see Appendix C for the field note guide). All summary field notes were coded and included in the analyses.
Table 2: Number of Field Visits and Transcripts
Respondents Number of interviews or focus group sessions
Number of sessions transcribed
Directors of Education 39 14 SSLs 39 17 Trustees 9 3 Principals 53 20 Student Success Teams 50 22 Teachers 50 16 Students 587 198 Parents 13 6 Total 3119
117
6 The selection of audio files for transcription was done in a proportional random way such that a representative proportion of files from each of the following categories was included: (1) type of respondent, (2) type of school board, (3) region, and (4) school size. This sampling method ensures that the analyses based on the transcripts alone are not biased for one type of respondent, school board, region, or school size. The analyses based on the field notes further ensures that details from each interview and focus group are included in the analyses and are reflected in the findings. 7 Of the field notes produced from these sessions, seven were from focus groups composed exclusively of students that were identified by the school as being “at‐risk”. 8 Of these transcripts, 14 were from focus groups with students that were identified by the school as being “at‐risk”. 9 A total of 13 field notes failed to be produced or were missing (1 principal interview, 3 Student Success team focus groups, 5 teacher focus groups, and 4 student focus groups). The final analyses are therefore based on 298 field notes and 117 verbatim transcripts.

Stage 2: Methods and Analyses
______________ September 2008 15
Qualitative Data Coding and Analysis Coding A team of qualitative data specialists from CCL coded and analyzed10 retained transcripts and all field notes using detailed coding protocols that were developed to reflect the research questions identified by the Ministry and findings of interest identified in Stage 1 of the evaluation (the steps of the coding process, from initial coding to the grouping of coded material into thematic categories, are detailed in Appendices D and E). Initial coding focused specifically on retaining statements that were seen to provide evidence of:
• The state of implementation of the various components or programs of the SS/L18 Strategy;
• The benefits resulting from the SS/L18 Strategy at both the school and school board level;
• The challenges associated with the SS/L18 Strategy at both the school and school board level;
• Specific evidence of change associated with the SS/L18 Strategy at both the school and school board level;
• Informant recommended improvements affecting the ongoing implementation of the SS/L18 Strategy at both the school and school board level;
• Understanding of the SS/L18 Strategy and its goals; and • Understanding of the SS/L18 Strategy’s specific components and their respective
goals. This focus yielded a total of 275 evidence codes. Meaningful informant statements were assigned to one or more of these codes, yielding a total of 13,788 coded references. To allow the evaluation team to make sense of this large quantity of data, secondary‐level coding occurred which consisted in the collapsing of these initial 275 codes into the following thematic categories that addressed the impact and state of implementation of the SS/L18 Strategy and its components (see Appendix E for descriptions of each category):
• Benefits resulting from the SS/L18 Strategy Academic‐related, Human‐related, measurement & accountability, resource‐related, systemic.
• Challenges associated with the SS/L18 Strategy
10 The coding and analyses were done using qualitative research software QSR NVivo 7.

Stage 2: Methods and Analyses
______________ September 2008 16
Academic‐related, Human‐related, measurement & accountability, resource‐related, systemic.
• Evidence of change produced by the SS/L18 Strategy completion and success, resources, test results, other.
• Recommended improvements to the SS/L18 Strategy Human‐related, resource‐related, systemic, other.
The evidence codes used during initial coding pertaining to evidence of implementation, of understanding of the SS/L18 Strategy and its goals, and understanding of the SS/L18 Strategy components and their goals were not re‐classified into thematic categories but were used in the analyses that followed. Coding was a multi‐stage process involving regular meetings with the team of qualitative analysts. All decisions made during these meetings were recorded in a coding and analysis journal (see Appendix E for the coding journal). Random audits of the qualitative data were conducted at various stages of the coding process to maximize opportunities for inter‐coder agreement and to ensure the integrity of the coding process. Analyses11 The resulting coded data were used: (1) to address the main research questions guiding this evaluation; (2) to examine emerging issues identified during Stage 1 or Stage 2 and; (3) using the evaluation framework, to examine the gaps between the intended and
11 It is important to note that findings from the qualitative analyses are not meant to represent precise proportions of respondents or statements reflecting particular view or opinions. When numbers or percentages are reported with reference to interview or focus group data, they are merely used as a guide to illustrate the overall relative frequency of a particular discussion topic or expressed opinion. Similarly, when terms such as “some informants” or “a few interviewees” are used to express the frequency of an expressed view, they should be interpreted as meaning “a notable minority of respondents” or “fewer than half of the informants.” On the other hand, when terms such as “many teachers” or “several respondents” are used, they should be interpreted as meaning “the majority of teachers” or “more than half of the respondents.”

Stage 2: Methods and Analyses
______________ September 2008 17
observed components of a number of initiatives undertaken or further developed under the ambit of the SS/L18 Strategy. Analyses relating to the main research questions Following the completion of secondary‐level coding, each broad thematic category was examined for dominant patterns. The approach used was to determine the relative importance of the evidence codes contained in each thematic category by calculating the proportion of statements assigned to each code relative to the total number of coded statements contained in each thematic category. The statements assigned to the most frequently used codes were then reviewed to gain understanding and to enable an accurate description of their meaning. This approach allowed the evaluation team to: (a) determine which major thematic categories of benefits, challenges, and recommended improvements were perceived to be most significant by the informants; and (b) to identify which factors contributed most to the perceived importance of each thematic category. The same analytical process was used to explore patterns in the data assigned to codes that were not systematically collapsed into new thematic categories during secondary‐level coding, such as evidence of component implementation and statements made about the understanding of the SS/L18 Strategy and its goals. The most significant findings yielded by the qualitative data collection and analyses were used in combination with the quantitative data garnered from the online surveys to answer the evaluation questions. Analyses relating to emerging issues The same analytical methods as described above were used. Analyses relating to the evaluation framework In order to populate the right‐hand side of the evaluation framework diagram depicted in Figure 1 on p. 5 for each of the selected initiatives or components identified in Stage 1, an in‐depth examination of the statements assigned to relevant codes was performed. Representative excerpts—in other words those deemed most typical of overall informant feedback—addressing the “observed target population”, the “observed necessary ingredients”, the “observed activities”, and the “observed outcomes” were extracted and amalgamated into one document for each initiative. These diagrams can be found in Appendix F and a discussion of the findings can be found in the Findings section of this report.

Stage 2: Methods and Analyses
______________ September 2008 18
Quantitative Data Collection Methodology Online surveys CCL developed two online surveys (each available in English and in French) that were used to collect information from students and secondary school staff (see Appendix G for full questionnaires). These surveys were designed to complement the interviews and focus groups conducted during Stage 2 of the evaluation. Input on the content of the two surveys was sought from the Ministry and a committee from the Council of Ontario Directors of Education. The online surveys enabled the evaluation team to gather information from a wider population than was possible only through individual or group interviews, thereby making findings from the evaluation more reliable and generalizable. Each secondary school was provided with a unique username and password to be used by staff members and a unique username and password to be used by students. These were used by respondents to log onto the appropriate survey from any computer connected to the Internet. The completion of the student and school staff surveys required between five and twenty minutes. Ministry data The Ministry provided CCL with depersonalised student biographic (including diploma records) and achievement data for students in Grades 9 to 12 collected from the Legacy system and stored in the Elementary/Secondary Data Warehouse (ESDW) for the academic years 2000‐2001 through 2004‐2005. Depersonalized student biographic and achievement data from the Ontario School Information System (OnSIS) for the 2005‐2006 and 2006‐2007 academic years were also made available by the Ministry. Finally, the Ministry provided the research team with depersonalized individual student records from the 2005‐2006 and 2006‐2007 academic years on the Grade 9 Assessment of Mathematics and on the Ontario Secondary School Literacy Test (OSSLT) administered by the Education Quality and Accountability Office (EQAO). Quantitative Analyses Online surveys A total of 3,202 secondary school staff members and 10,038 secondary school students completed the survey. Given an estimated 46,434 secondary school teachers and

Stage 2: Methods and Analyses
______________ September 2008 19
administrators and 707,000 secondary school students12 in the Ontario public school system, this represents less than a 6% response rate for school staff and less than a 2% response rate for students.13 These response rates should be considered when interpreting all reported findings from the survey. The overall pattern of responses does not necessarily reflect the opinions and views of the entire secondary school staff and student population. Standard descriptive statistics were calculated for both the student survey and staff survey data sets and are shown below. More detailed analyses were performed to address the research questions motivating this evaluation and are described in the “Findings” section of this report. Tables containing the number of respondents who completed each questions is available in Appendices H and I. These tables can be consulted when interpreting results from the surveys in the Findings section of the report. Student survey Students from 58 of the 72 school boards participated in the survey. Once again, it should be noted that the contexts experienced by the student respondents from these 58 school boards do not necessary mirror those of students from the 14 schools boards not represented in the sample. Of these 58 school boards, seven had fewer than 10 respondents, 18 had fewer than 50 respondents, and 33 had fewer than 100 respondents. Furthermore, only 18 school boards had more than 200 respondents. Students from 355 different secondary schools took part in the survey. The number of respondents from each school ranged from one to 659. One hundred and forty‐nine schools had fewer than 10 students respond whereas 52 schools had 50 or more students respond. Below is a short description of the student sample that responded to the survey. This short description is meant to help interpret the findings in the next section. The following table depicts the frequency of student responses in each of the six geographical regions. Toronto and London had the largest percentage of respondents in this sample, whereas Thunder Bay had the lowest.
12 For 2005‐2006 school year. http://www.edu.gov.on.ca/eng/educationFacts.html 13 It should be noted that a large proportion of school staff and students did not receive the information about the survey due to the logistics involved in reaching such a large population in a short period of time and providing them with school‐specific user names and passwords. Thus, a sizable (though unknown) proportion of those who did not participate were simply unaware of the survey.

Stage 2: Methods and Analyses
______________ September 2008 20
Table 3: Frequency and percentage of student respondents in each region
Region Number of respondents Percentage
North Bay/Sudbury 643 6.4% Ottawa 1,446 14.4% London 2,749 27.4% Barrie 2,043 20.4% Thunder Bay 344 3.4% Toronto 2,813 28% Total 10,038 100
The largest proportion of students responding to the survey were attending English public secondary schools (50.5%), followed by those attending French Catholic schools (22.1%), French public schools (16.1%), and finally English Catholic schools (11.4%). Slightly more females (52.9%) than males (47.1%) responded to the survey, the large majority of responding students were born in Canada (84.1%), and as shown in Table 4, most were 14 or 15 years old.
Table 4: Age distribution of student respondents
Age (yrs) Percentage
12 or younger 1.0% 13 1.0% 14 25.3% 15 24.9% 16 19.2% 17 19.8% 18 4.9% 19 or older 3.9% Total 100
School staff survey Secondary school staff members from 63 school boards participated in the survey. It should again be noted that the contexts experienced by the school staff respondents from these 63 school boards do not necessary mirror those of staff members from the 9 schools boards not represented in the sample. Ten school boards had 20 respondents or fewer, 37 school boards had 40 respondents or fewer and only eight school boards had 100 respondents or more. Staff members from 425 schools participated in the survey. Of these schools, 103 had only one participant, 250 had five respondents or fewer, 141

Stage 2: Methods and Analyses
______________ September 2008 21
had between six and 19 respondents and 35 schools had 20 respondents or more. Five schools had 50 respondents or more and the school with the most respondents had 75. Below is a short description of the school staff sample that responded to the survey. As for the student sample, this short description is meant to help interpret the findings in the next section. Not surprisingly, the great majority of respondents were teachers who were not designated as SSTs (see Table 5).
Table 5: Current position held by respondents
Current position in the school Frequency Percentage
Teacher* 2127 66.4% Student Success Teacher 234 7.3% Special education teacher 157 4.9% Guidance and/or career counsellor 201 6.3% Vice‐principal 89 2.8% Principal 118 3.7% Administrative assistant 23 0.7% Other 248 7.7% Missing 5 0.2% Total 3202 100.0 * The “teacher” category included only teachers who were not designated as SSTs.
Teachers who responded to the survey currently taught a wide range of courses from all secondary grades (see Table 6).
Table 6: Types of courses and grades currently taught by respondents
Percentage
Percentage Type of course Course subject Applied 48.0% Languages 31.6% Academic 57.2% Social Sciences 27.8% College 39.4% Science & Tech 32.1% Essentials 22.2% Math 23.8% LDC 16.5% Art 11.4% Open 51.2% Religion 6.8% University 44.8% Phys Ed 8.4% Workplace 19.3% Law 3.8% Grade Administration 8.1% Grade 9 53.5% Marketing & Retailing 4.1% Grade 10 59.8% Trades 6.6% Grade 11 65.1% Career Planning 15.2% Grade 12 60.3% Coop 10.1%
Other 29.5%

Stage 2: Methods and Analyses
______________ September 2008 22
Half of the respondents had less than 10 years experience in the Ontario education system (50.1%), although more than one in five respondents had more than 20 years experience (21.9%). Ministry Data A team of quantitative data specialists performed provincial‐level analyses of the Ministry data sources to evaluate changes in student outcomes since the implementation of the SS/L18 Strategy.14 It is of note that at this early stage of the implementation of the Strategy, it unlikely that desired student outcomes would be observable on a consistent basis at the school or school board levels. School and school board‐level analyses will be more reliable and useful in the next few years as the SS/L18 Strategy becomes more deeply rooted in the system. Individual data sources were linked and samples of data were extracted from the resulting large set to perform exploratory analyses, followed by analyses on full data sets.15 These analyses focused on changes over time (between 2003‐200416 and 2006‐2007) in outcomes related to the three of the Student Success indicators developed by the Ministry17:
• Credit accumulation, Grades 9 • Credit accumulation, Grade 10 • Compulsory credit pass rates, Grades 9 • Compulsory credit pass rates, Grade 10
Limitations of Evaluation In order to accurately interpret the results presented in this report, careful consideration should be given to the limitations inherent to the overall design of this evaluation, as well as to the types of data and methods of data collection used. First and foremost, this evaluation is formative in nature and is meant to be useful for informing further development of the SS/L18 Strategy and of its components. The
14 All quantitative analyses were performed using the application SSPS 15.0. 15 Note that data from the following six boards were excluded from 2005/06 and 2006/07 analyses because of data inconsistencies: Superior Greenstone District School Board, Renfrew County Catholic District School Board, Conseil scolaire de district catholique Centre‐Sud, Greater Essex County District School Board, London Catholic District School Board, and Hamilton‐Wentworth Catholic District School Board. 16 2003/2004 was chosen as a baseline year for the analyses performed on the student achievement data provided by the Ministry because it was the first year of implementation of the SS/L18 Strategy. 17 It was not possible to examine outcomes related to the other indicators with the data provided.

Stage 2: Methods and Analyses
______________ September 2008 23
evaluation was not undertaken at the outset of the Ministry’s initiative, but rather four years after its introduction. As a consequence, it was not possible to collect baseline or initial measures to be re‐examined as the initiative developed through the years, nor to identify clear and definitive causal relationships between the Strategy’s components and student achievement or engagement. Rather, it is meant to provide a “snapshot” of the state of implementation of the Strategy and a related examination of secondary school student’s success. The use of interviews, focus groups, and online surveys provides us with the views and perceptions of those directly involved with the Strategy, namely, school board and school staff, students and parents. Student population examined The SS/L18 Strategy includes initiatives that encompass the transition period between elementary and secondary school that are directed toward students and school staff in Grades 7 and 8. Although these are important initiatives, the current evaluation focused on secondary school students and therefore did not collect data in elementary schools (either through field visits18 or online surveys). The findings reported here cannot be extended to the elementary school context. Moreover, some information concerning certain initiatives that overlap the two levels may therefore be incomplete for the elementary grades.19 Qualitative data sources There are common limitations associated with the use of qualitative data sources such as documents and transcripts/field notes of interviews and of focus groups. A limitation associated with document analysis lies in the difficulty in determining the quality and veracity of the information and data contained in those documents. The logistics involved with conducting interviews and focus groups limit the sample size to a small proportion of the population, which hinders the ability to generalize the findings from the sample to the population. There is also a possibility of participant selection bias in that only those individuals particularly interested in the topic to be discussed may agree to participate. Interviewer bias can occur when the interviewer or moderator influences, whether knowingly or not, the responses given by the participants. In focus groups, the presence of individuals who dominate may create an inaccurate picture of what the overall opinions may be. Online surveys The use of surveys also comes with drawbacks. Because of the greater structure involved in surveys, it is not always possible to determine participants’ interpretations of
18 With the exception of a small number of small schools housing both secondary and elementary grades. 19 For example, in information gathered as part of the evaluation framework diagrams regarding some numeracy and literacy initiatives that target students in Grades 7 to 12.

Stage 2: Methods and Analyses
______________ September 2008 24
questions or terms used. Participant bias is also a problem with surveys since it is almost impossible to give every individual equal opportunity to respond (especially when the target population is comprised of over 800,000 individuals as was the case with the student survey) and those interested in the subject matter are more likely to take the time to respond than those who are less interested. That these issues can hardly be avoided and affect the validity of the findings should be considered when interpreting survey results. Ministry data The student‐level biographical and achievement data (including EQAO data) provided by the Ministry covers a period ranging from the 2000‐2001 academic year to the 2006‐2007. During this 6‐year period, different methods of collecting and managing data were used by different schools and school boards and by the Ministry. Though the rigorousness of the data collection and management has improved greatly, the quality of the data collected in previous years is not consistently high. Moreover, the indicators of student success cannot be easily extracted from these data in all cases.

Stage 2: Findings
I think that there’s a focus on learning as opposed to teaching . . . and then a professional response to that so that we are acting as professionals to meet the needs of our students academically, but also socially and emotionally.
‐ Director of Education
Stage 2: Findings
This section of the report contains the main findings that emerged from the analyses of the interview and focus groups data, the surveys, and the student achievement data provided by the Ministry. In what follows, the findings are first used to address the specific research questions posed by the Ministry, and second, according to the evaluation framework described earlier, to examine a number of key initiatives of the SS/L18 Strategy more closely. Research Questions What has changed in the last four years in Ontario’s secondary schools to help students succeed? The data collected throughout the field visits suggest that a number of changes aimed at increasing student success have occurred in the secondary school system over the past four years. It is noteworthy that information gathered during the 311 interviews and focus groups points to an overall shift from an implied or presumed focus to an explicit and highly intentional focus on the learner as the focal point for the work of schools. This shift was illustrated by several statements made by school board and school interviewees related to the change in culture that has been developing over the past four years.
Notwithstanding this encouraging finding, it is of concern that 11.5% of teachers who are not part of the Student Success Team and who responded to the online survey reported that they were not familiar with the terms “Student Success” or “Learning to 18.” Furthermore, 35.7% of these teachers said they were not familiar with Dual Credit programs and 40.9% said they were not familiar with Specialist High Skills Majors (SHSMs).20 Briefly described below are some of the other important changes that were highlighted during the field visits.
20 This finding is perhaps less surprising given the fact that Dual Credit programs and SHSMs are not yet widely implemented.

Stage 2: Findings
______________ September 2008 26
Some kids are in school because it’s the safest or the only safe place they have to go.
‐Student Success Team member
The professional conversations are changing, and that’s at least partly as a result of this new focus on other ways of redefining success for different students.
‐ Teacher not designated as an SST
Better communication Important changes were reported by those interviewed surrounding the various levels of communications between the different actors in the system. The message being communicated to students is one of inviting them to consider their futures with the assurance that they will be provided with support in finding an appropriate path to further education and employment. School personnel are seeking to intentionally communicate with parents regarding the many pathways available to students and are providing assistance to parents and students in making choices for future success. Informants reported that communication among staff about the learning and needs of individual students as well as the degree and frequency of professional collaboration with colleagues had increased. Survey data also suggest increased communication among school staff. The great majority of secondary school staff respondents (81.3%) agree or strongly agree that there was now more discussion among teachers about marking and standards than there was four years ago. Compulsory diploma requirements and substitutions Increased flexibility in meeting diploma requirements is generally welcomed. In some schools, the substitution of the GLE (General Learning Strategies) course for Grade 9 French for students taking Applied or Locally Developed Grade 9 English was reported. Other schools reported an appreciation for the greater latitude provided for substitution of compulsory courses and for the use of cooperative education to fulfil compulsory course requirements. An increased focus on a caring school culture The fourth pillar of the SS/L18 Strategy had been identified by many interviewees in Stage 1 as signifying a school culture of community and caring. The field visits in Stage 2 permitted the evaluation team to observe significant variation in the extent to which schools have been successful in establishing a school‐wide culture of caring and community. The Student Success Team at one school for instance reported that the school motto “Take care of yourself, take care of each other, take care of this place” influenced the behaviour of staff in all of their interactions with students, whether in the classroom or in the hallways. In many schools, teachers also showed considerable preoccupation with and awareness of the out‐of‐school

Stage 2: Findings
______________ September 2008 27
All our at‐risk students are hand timetabled. We don’t just let the computer do it. A computer has no heart.
‐ Student Success Team member
challenges, such as poverty, hunger, and insecure or unsafe living environments faced by many students. A number of schools have developed orientation programs (such as a Student Success Camp) or organized on‐going mentoring and leadership programs to help students get the right start in secondary school. A notable change associated with the SS/L18 Strategy is, therefore, that some of these programs provide leadership opportunities to struggling students, opportunities that would only have been available to successful students in the past. Many of these programs have an explicit focus on communication, problem‐solving and conflict resolution and are thought to build students’ interpersonal skills, self‐advocacy skills and confidence. Focus on individual students Many respondents reported that there was a new focus on the monitoring of individual students, beginning with elementary school teachers identifying students transitioning to secondary schools who should be carefully monitored and supported for success. In many schools this entailed a change from a simple “form‐completion exercise” to a conversation between elementary and secondary teachers about recommended course choices or about individual students’ interests and strengths. The evaluation team also noted that in many schools, Grade 9 students are monitored regularly and Student Success Teams intervene at early signs of difficulty. Expanded program choices and flexibility for students Schools are actively working to design ways of changing or beginning programs in mid‐term for students who return to school or who need to move to a more appropriate course. Independent study, cooperative education and alternative education models are all being used by a wide variety of schools. More attention is being paid to customizing
students’ timetables according to their interests and strengths, and not just to meeting the requirements imposed by compulsory subjects or the constraints of scheduling applications.
What have been the main benefits arising from these changes to date? The data obtained from the focus group and interview transcripts and from the field notes were coded to produce broad categories of benefits from the SS/L18 Strategy. An analysis of the resulting data indicates that, out of nearly 3,000 interview and focus group statements coded as evidence of benefits produced by the SS/L18 Strategy, the types of benefits most frequently reported were human‐related benefits (33%), followed by measurement and accountability benefits (24%), and resource‐related

Stage 2: Findings
______________ September 2008 28
I’d like to say I’ve seen some students who have completely changed their path in life because of Student Success. They’re very happy, they feel that someone believes in them. I think it was a chance to have some one‐on‐one mentoring, and they start to believe in themselves, and they were able to turn over and go back into a regular classroom and soar, or take other routes through coop and focus programs. There [are] some kids that I keep in contact with from my former school, who are now in focus programs and it’s been a lifesaver for them. We would have lost them.
‐ Student Success Team member
benefits (21%; see Table 7). Academic‐related benefits (10%) and systemic benefits (11%) were less frequently reported. These numerical results, although based on subjective statements made by the informants, accurately reflect the overall understanding gained from reading focus group and interviews transcripts and from the field notes produced by the field team.
Table 7: Distribution of statements coded as benefits derived from the SS/L18 Strategy
Benefit categories
Number of statements coded
Percentage
Academic‐related benefits 303 10%21 Human‐related benefits 996 33% Measurement & accountability benefits 713 24% Resource‐related benefits 638 21% Systemic benefits 328 11% TOTAL for benefits
2,978
100%
Academic‐related benefits resulting from the SS/L18 Strategy The most significant academic‐related benefits reported by the informants were: (a) smoother transitions by individual students from secondary school to post‐secondary education and/or work (39%); (b) smoother transitions by individual students between the elementary and secondary levels (27%); (c) reported improvements in test results at the school level (11%); (d) reported improvements in graduation rates at the school level; and (e) reported decrease in drop‐out rates at the school level. The fact that these benefits were primarily identified by the informants as having been significant22 at the school level suggests that the benefits produced by the SS/L18 Strategy are most easily observed in individual schools. This also suggests,
21 This distribution should not be taken to suggest that the SS/L18 Strategy has failed to have significant, positive academic impacts. The qualitative data collected during Stage 2 of this evaluation can only speak to the importance of different categories benefits as reflected in the statements made by informants. The relative importance and meaning of each thematic category should be interpreted according to the kinds of benefits described by each category. 22 Statements made by informants pertaining to benefits would have been coded as a school board benefit, for example, if these benefits were considered to have either occurred or to be important at the

Stage 2: Findings
______________ September 2008 29
however, that our informants were mostly and sometimes only aware of what was happening within their individual school, an interpretation which is supported by frequent statements made by informants having to do with the need for more effective, system‐wide communication, particularly with respect to professional development. Human benefits resulting from the SS/L18 Strategy The most frequently cited human benefits of the SS/L18 Strategy by the informants during the interviews and focus groups were: (a) improved internal communication within schools (33%)23; (b) increased student engagement (17%); and (c) improved teaching practices (15%). Analyses of informant input suggest that the SS/L18 Strategy has produced relatively fewer benefits with respect to improving communication with community partners or stakeholders and to supporting the systematic sharing of effective practices. Although these were not identified as high priority recommendations by the informants who took part in Stage 2 of our evaluation, it is reasonable to consider that the future of the SS/L18 Strategy would be facilitated by mechanisms that would support greater information sharing about factors such as effective pedagogical practices, program variations and factors contributing to effective program implementation, and determinants of successful partnership with non‐school stakeholders. Measurement and accountability benefits resulting from the SS/L18 Strategy Measurement and accountability benefits account for the second most frequently mentioned category of benefits produced by the SS/L18 Strategy by those interviewed in Stage 2. The majority of benefits in this category, however, are accounted for by improvements in student monitoring and tracking (47%) and in data use at the school level (36%).24 Focus group and interview transcripts suggest that improved student monitoring and tracking along with increased use of factual or documented information about individual students were very frequently facilitated by an in‐house leader, generally a designated SST. The qualitative data also suggest these two benefits resulted from and supported improved internal communication as well as significant changes in
school board level. A similar procedure would have been followed for statements pertaining to benefits considered to have occurred or to be important at the school level. 23 The code “improved internal communication” was used at the school level to capture statements pertaining to improved communication between administrators and staff, between administrators and students, among staff, between staff and students and, although less frequently, between students. At the school board level, in contrast, it was used to capture improved communication primarily among school board personnel, school board personnel and schools, and school board personnel and trustees. 24 These results should be interpreted with some caution, as statements made by the informants were often coded, by virtue of their content, as indicative of both improved student monitoring and tracking and increased use of data, even though the “data” mentioned by informants often referred to the informal or casual exchange of factual information among practicing teachers about individual students’ progress and performance.
Stage 2: Findings
______________ September 2008 30
organizational culture that have helped reinforce new values and ways of thinking about students’ learning, the role of teachers, and the means available to support student success. It is noteworthy that few of the statements that were eventually classified as measurement and accountability benefits pertained to data collection and data management. It is unlikely that this was simply a result of our coding procedures. Rather, our examination of the focus group and interview transcripts suggests that informants viewed the everyday exchange of information between front‐line practitioners regarding individual students as being different than the more formal process of system‐wide data collection, management and data use. This intentional, though informal, exchange of factual information among teachers may have a great positive impact on an individual student’s experience. Resource‐related benefits resulting from the SS/L18 Strategy Resource‐related benefits were the third most frequently mentioned types of benefits produced by the SS/L18 Strategy. Three specific factors, in particular, were identified by informants as benefits resulting from the SS/L18 Strategy: (a) increases in the number of program options (42%), (b) increased scheduling flexibility (18%), and (c) increased access to human resources–primarily teaching staff and SSTs—to support student success (14%). These findings stand in contrast to many statements made by informants pertaining to persistent challenges and the need for improvement with regard to these same factors.25 The contextual information found in the transcripts analyzed offers a possible explanation for this apparent paradox: the SS/L18 Strategy has provided the financial and human resources and the flexibility required to implement programs and establish mechanisms that have allowed schools to address the most tractable and obvious barriers to student achievement and success (such as enabling students to complete only the missed or failed portions of a course, rather than the entire course, or to make up for missed assignments as a result of illness or personal difficulties). These resources and this flexibility also have allowed schools to begin establishing programs and services that are most suited to the specific and often highly localized needs of the populations they serve26. Having said this, the interview
25 These are discussed in the section addressing the question of barriers to student success. 26 This interpretation is further supported by findings pertaining to the individual elements of the SS/L18 Strategy that appear to be having the most impact on student success.
We offer a wide range of extracurricular opportunities in the school and there’s always several things to choose from. And I think if you want students to be in school until they’re 18 I think there has to be . . . they have to make a personal connection.
‐ Teacher not member of the Student Success Team

Stage 2: Findings
______________ September 2008 31
And more and more people are defining them as “our kids” as opposed to “somebody else’s problem.” So you see a lot more people really thinking more along the lines of “those kids,” what are their needs? What can I do?” And a lot of regular staff, if that’s the right phrase, are coming on board as far as doing the best they can for the kids too.
‐ Student Success Team member
and focus group data also show that the SS/L18 Strategy has reached a point in its implementation where schools and teachers are faced with the challenge of tackling what are, in many cases, the complex needs of various subgroup of students, needs that they are ill‐equipped to meet without the coordinated support of other agents, services or organizations. The data also indicate that many of the province’s frontline educational practitioners are struggling to find meaningful ways of keeping students in school until 18 while these students remain largely disengaged from school, whether because of their individual needs and/or their disposition toward school. Systemic benefits resulting from the SS/L18 Strategy Statements made by informants were classified as belonging to the systemic benefit categories when they were associated with changes brought about by the SS/L18 Strategy that reflected new values, dispositions or beliefs perceived to be held across individuals and/or at various levels of the educational system. It is encouraging to note that the most often cited systemic benefit produced by the SS/L18 Strategy is culture change (at both the school and school board level), accounting for over 60% of statements coded in this category, followed by an improved professional culture. These benefits were reflected in the frequency with which informants associated the SS/L18 Strategy with a change in orientation from teaching to learning and with the need to ensure success for all students, irrespective of individual need or circumstance. They were also reflected in statements by individual informants that revealed a sense of ownership and responsibility for the success of all students. The information contained in the transcripts also suggests that teachers, in particular, increasingly feel they are valued and capable professionals who play a proactive role and are a positive agent in making each student successful.
Provincial‐level improvements on student success indicators An examination of provincial‐level student achievement indicators (such as course pass rates, credit accumulation, and OSSLT success rates) over time generally shows stability or encouraging improvement.27
27 All analyses for course pass rates and credit accumulation for 2005/06 and 2006/07 exclude the following six boards due to inconsistencies in data: Superior Greenstone District School Board, Renfrew County Catholic District School Board, Conseil scolaire de district catholique Centre‐Sud, Greater Essex

Stage 2: Findings
______________ September 2008 32
Analyses of the student achievement data provided by the Ministry indicate that the overall compulsory Grade 9 and 10 course pass rates have been generally stable between the 2003/2004 (baseline28) and 2006/2007 academic years, with a slight increase in the overall compulsory Grade 10 courses (from 88.1% to 91.2%) and compulsory Grade 9 courses (from 88.9% to 91.2%).
Figure 2: Compulsory course pass rates (overall) in Grade 9 and 10, 2003/2004 to 2006/2007
88.9%90.4%
92.5%91.2%
88.1% 89.3%90.8% 91.2%
50%
55%
60%
65%
70%
75%
80%
85%
90%
95%
2003-2004 2004-2005 2005-2006 2006-2007
Grade 9 Grade 10
Source: Calculations by CCL on student achievement data provided by the Ontario Ministry of Education
As might be expected, the compulsory pass rates are higher for academic courses than for applied or locally developed courses (see Figures 3 and 4). Pass rates for each type of courses have generally been stable with slight increases over time compared to the baseline year (2003/2004).
County District School Board, London Catholic District School Board, and Hamilton‐Wentworth Catholic District School Board. 28 2003/2004 was chosen as a baseline year for the analyses performed on the student achievement data provided by the Ministry because it was the first year of implementation of the SS/L18 Strategy. Data from this academic year should be used with caution as data collection methods were not consistently reliable.

Stage 2: Findings
______________ September 2008 33
Figure 3: Compulsory course pass rate for academic, applied and locally developed Grade 9 courses, 2003/2004 to 2006/2007
95.5%
77.7%
82.6%
93.4%
95.5%94.5%
81.2%83.8%
86.6% 86.4%
80.8%83.1%
50%
55%
60%
65%
70%
75%
80%
85%
90%
95%
100%
2003-2004 2004-2005 2005-2006 2006-2007
Academic Applied Locally Developed/Basic Level
Source: Calculations by CCL on student achievement data provided by the Ontario Ministry of Education
Figure 4: Compulsory course pass rate for academic, applied, locally developed, and open Grade 10 courses, 2003/2004 to 2006/2007
93.7%
76.9%
91.6%93.8%
92.5%
83.2%84.7%
81.0% 83.9%85.2%83.9%84.7%
91.3%91.3%89.6%88.8%
50%
55%
60%
65%
70%
75%
80%
85%
90%
95%
100%
2003-2004 2004-2005 2005-2006 2006-2007
Academic Applied Locally developed/Basic Level Open
Source: Calculations by CCL on student achievement data provided by the Ontario Ministry of Education

Stage 2: Findings
______________ September 2008 34
Analyses on credit accumulation (using 2003/2004 academic year as a baseline year) show encouraging trends. There has been a gradual increase in the percentage of students who have earned eight or more credits by the end of Grade 9 (from 72% in 2003/2004 to 77% in 2006/2007) and of students who have gained 16 or more credits by the end of Grade 10 (from 62% in 2004/2005 to 66% in 2006/2007) (see Figures 5 and 6). On the other hand, the proportion of students with fewer than 5 credits by the end of Grade 9 or fewer than 13 credits by the end of Grade 10 has decreased over the same time period (from 13% to 10% and from 21% to 18% respectively).
Figure 5: Percentage of students with fewer than 5, 6 or 7, and 8 or more credits earned by the end of Grade 9, 2003/2004 to 2006/2007
13% 13% 11% 10%
15% 14% 16%13%
72% 73% 74%77%
0%
10%
20%
30%
40%
50%
60%
70%
80%
90%
2003-04 2004-05 2005-06 2006-07
5 or fewer 6 or 7 8 or more
Source: Calculations by CCL on student achievement data provided by the Ontario Ministry of Education

Stage 2: Findings
______________ September 2008 35
Figure 6: Percentage of students with fewer than 13, 14 or 15, and 16 or more credits earned by the end of Grade 10, 2004/2005 to 2006/2007
21%18%
17% 16%
62%
66% 66%
16%
18%
0%
10%
20%
30%
40%
50%
60%
70%
2004-05 2005-06 2006-07
13 or fewer 14 or 15 16 or more
Source: Calculations by CCL on student achievement data provided by the Ontario Ministry of Education
The Education Quality and Accountability Office (EQAO) reports significant improvements in provincial literacy success rates over the past five years. The success rate for students taking the OSSLT for the first time rose from 72% in 2002 to 84% in 2007 (see Table 8).
Table 8: Success rate on the OSSLT for first‐time eligible students between 2002 and 2007
Year
Success rate
2002 72% 2003 77% 2004 82% 2006 84% 2007 84%
Source: EQAO In addition, improvements in the past five years are noted for students enrolled in academic English courses (10 % improvement) and applied English courses (24% improvement), for boys (12% improvement), for English as a second language (ESL) and

Stage 2: Findings
______________ September 2008 36
English literacy development (ELD) learners (18% improvement), and for students with special needs (16% improvement) (see Table 9).
Table 9: OSSLT success rates in 2002 and 2007 for each group of students
Year
Academic English
Applied English
Boys
ESL/ELD
Special needs
2002 85% 38% 68% 34% 37% 2007 95% 62% 80% 52% 53%
Source: EQAO Which elements and actions implemented under SS/L18 Strategy appear to be yielding student success? It was not possible for this evaluation to examine possible causal relationships between the SS/L18 Strategy and its elements and their effect on student success. Those most affected by the Strategy, namely those who work directly with students and students themselves, were given the opportunity to complete a survey that included a series of questions regarding their perception of the success of certain elements of the SS/L18 Strategy (such as expanded cooperative education, SSTs, Credit Recovery, School‐College‐Work initiatives (SCWIs), apprenticeships, Dual Credits, and SHSMs). Overall, the great majority of survey respondents who were familiar with the specific elements of the Strategy agreed or strongly agreed that these are helping student become more successful (see Figure 8). Cooperative education and apprenticeships were considered to have a positive impact on student success by the largest proportion of students (84.7% and 87.1% respectively) and school staff (93.2% and 95.3% respectively) who responded to the surveys. Students and school staff respondents also considered Credit Recovery to be helpful (80.9% and 74.8% respectively). Overall, a slightly higher proportion of school staff than students respondents agreed or strongly agreed that each specific element (with the exception of Credit Recovery) helps students become more successful.

Stage 2: Findings
______________ September 2008 37
Figure 8: Percentage of secondary school staff and student respondents who agree or strongly agree that each element of the SS/L18 Strategy helps students become more successful
0
10
20
30
40
50
60
70
80
90
100
Coop SSTs Credit Recovery SCWIs Apprenticeships Dual Credits SHSMs
Strongly agree (staff) Agree (staff) Strongly agree (students) Agree (students)
Students who responded to the survey generally expressed positive attitudes towards Credit Recovery (see Table 10). More than half of those who responded to these questions agreed or strongly agreed that Credit Recovery is helpful. Students especially agreed that Credit Recovery helps get course credit (93.5%), helps improve chances for graduation (92.6%), and that it helps understand the material taught in class (72.3%).
Table 10: Percentage of secondary school students who agree or strongly agree that Credit Recovery helps students in each way listed
Credit Recovery… Percent who agree or strongly agree
Helps get course credit 93.5% Improves chances for graduation 92.6% Helps understand material taught in class 72.3% Helps gain self‐confidence 62.1% Helps maintain interest in school 54.9% Prepares for courses in the future 67.7% Prepares for PSE & training 62.8%
In most cases, students and staff survey respondents who were familiar with elements of the SS/L18 Strategy agreed that each element helps students in many ways, though some variation in opinion was observed (see Table 11). School staff who responded to the survey believed that SSTs are the most successful at improving chances for graduation (98.2%) and helping students gain self‐confidence (93.4%).

Stage 2: Findings
______________ September 2008 38
Credit Recovery was also seen by many school staff respondents as being useful for improving students’ chances of graduating (97.4%), but even more so as being useful for helping students get course credit (98.4%). Almost all school staff respondents believed that SHSMs help students gain self‐confidence (94.8%), maintain their interest in school (94.7%), and prepare for post‐secondary education and training (94.7%). More than nine out of 10 staff respondents considered Dual Credit programs helpful when it comes to getting course credit (94.1%) and improving chances for graduation (90.5%). Almost all school staff respondents believed that cooperative education allows students to gain work‐related skills (99.0%), helps students gain self‐confidence (98.9%), and helps students get course credit (96.2%). SCWIs were seen as being particularly useful for preparing students for future courses (89.3%) and for post‐secondary education and training (94.8%). Finally, nearly all secondary school staff who responded to the survey believed that apprenticeships help students gain self‐confidence (98.6%) and work‐related skills (99.1%). (See Table 11.) Table 11: Percentage of secondary school staff respondents who agree or strongly agree that each element helps students in each way listed
SSTs Credit
Recovery SHSM Dual Credit Coop SCWIs Apprenticeships
Helps get course credit 89.7% 98.4% 90.2% 94.1% 96.2% * 89.3% Improves chances for graduation 98.2% 97.4% 89.2% 90.5% 95.7% 83.8% 93.3% Helps understand material taught in class 66.4% 66.0% 81.5% 67.6% 62.4% 59.1% 76.6% Helps gain work‐related skills 70.7% * 92.9% 71.0% 99.0% 70.3% 99.1% Helps gain self‐confidence 93.4% 80.7% 94.8% 89.2% 98.9% 85.9% 98.6% Helps maintain interest in school 90.2% 75.5% 94.7% 89.4% 93.1% 91.4% 90.4% Prepares for courses in the future 79.6% 64.5% 91.4% 88.1% 80.3% 89.3% 86.7% Prepares for PSE & training 72.6% 56.2% 94.7% 88.9% 92.7% 94.8% 94.0%
* No data available Table 11 also illustrates how the different elements of the SS/L18 Strategy are complementary by helping students in different ways. For example, nearly all respondents (98.4%) agree that Credit Recovery helps students get course credit, while fewer agree that it helps students prepare for courses in the future (64.5%). A larger proportion of staff who responded to the survey believed that SHSMs (91.4%), Dual

Stage 2: Findings
______________ September 2008 39
With regard to Credit Recovery, I think it goes back to the fundamental question of what is its purpose? Is it simply for the purpose of credit accumulation? And if that is its purpose, then yeah, it’s effective. If it’s for the purpose of helping the students actually learn what is required to move on, I don’t believe it’s effective
‐ Student Success Teacher
Credit programs (88.1%), SCWIs (89.3%), and apprenticeships (86.7%) are better suited to preparing for future courses.
The relatively lower level of agreement among respondents with the notion that Credit Recovery helps better understand the material taught in class (66.0%)
appears to hide large differences in opinion between staff members holding different positions within the school. Overall, fewer teacher respondents who are not part of the Student Success Team have positive attitudes towards the benefits of Credit Recovery compared to SSTs or principals respondents. Although more than eight out of 10 SSTs and principals who responded to the survey agree that Credit Recovery helps students in many ways, as little as 50% of teacher respondents who are not members of a Student Success Team say that Credit Recovery helps student prepare for post‐secondary education and training (see Figure 9).
Figure 9: Percentage of teacher (not members of the Student Success Team), SST, and principal respondents who agree or strongly agree with each statement
0102030405060708090
100
Credit recoveryhelps students
better understandthe material
taught in class.
Credit recoveryhelps students
gain self-confidence.
Credit recoveryhelps studentsmaintain their
interest in school.
Credit recoveryhelps students
prepare forcourses in the
future.
Credit recoveryhelps students
prepare for post-secondary
education andtraining.
Teacher SST Principal
How have changes within Ontario’s secondary schools aimed at increasing student success been supported? The section that details the main benefits arising from the SS/L18 Strategy points to the underlying processes supporting the changes that have been implemented to date.

Stage 2: Findings
______________ September 2008 40
Based on the information gathered during the interviews, focus groups, document analyses, and on the online surveys, the evaluation team concludes that the following factors have been instrumental in supporting changes that have helped increase student success:
1. Targeted funding to offer courses and programs that are of interest to students and perceived as relevant in their pursuit of specific educational pathways;
2. The designation of dedicated student success staff in each school and of SSLs in each board29;
3. Increased flexibility with regard to timetabling; 4. Increased flexibility with regard to funding allocations, to allow for the
development of programs intended primarily to retain or engage at‐risk students, such as: a. homework clubs, b. in‐school resource centres, c. extracurricular sports or activity programs accessible to students meeting,
specific educational milestones, d. programs for pregnant and/or parenting students; e. etc.
5. The fostering of staff “buy‐in” through professional development opportunities focusing specifically on important goals of the SS/L18 Strategy as well as, albeit less frequently, practical capacity‐building;
6. Improved information sharing about individual students; 7. Increased focus on key transition points of students’ educational trajectories,
specifically the elementary to secondary school transition and the secondary to post‐secondary education or work transition and development of in‐school methods to monitor at‐risk students at such times of transition;
8. Specific, high profile initiatives implemented under the SS/L18 Strategy that have acted as foundations or rallying points for the development of supportive pedagogical practices and alternative means of assessing student progress and success, such as credit recovery and credit rescue;
9. The ongoing availability of long‐established programs such as cooperative education and apprenticeships30; and
10. The development of innovative initiatives such as the SHSMs.
29 In 2005 the Ministry allocated 89 million for 1,300 secondary school teachers (including 800 SSTs) and in 2006, increased this investment to $108 million for the hiring of an additional 300 secondary school teachers (and $6 million for the hiring of an additional teacher per French‐language secondary school to expand unique course offerings). For more information, see Zagarac, G. (September 7, 2008) Memorandum: Student Success Strategy 2006‐07. 30 It should be noted that, while widely appreciated and seen as particularly effective with at‐risk students, statements made about these programs suggest that they do not yet exist in sufficient numbers to meet demand. Feedback provided by interviewees also indicates clearly that these programs continue to be viewed in some circles as embodying lower standards and to place fewer demands on students.

Stage 2: Findings
______________ September 2008 41
The extent to which these supports and processes have been available and effectively utilized varies considerably across schools and school boards. The ability to implement changes leading to student success is largely determined by the specific economic, geographic, cultural and demographic realities faced by each school. Whether individual schools can capitalize upon existing and/or new resources to implement positive changes will continue to depend on where each school finds itself along the continuum of change described in the concluding section of this report. Greater information exchange and supportive partnerships among schools facing similar challenges might play a significant role in helping educators and decision‐makers identify the specific needs of their schools and the means necessary to addressing these. As the data gleaned from the surveys clearly show, while certain resources and supports—such as staff allocations, funding, and scheduling flexibility—were necessary to produce change, educators believe that further investments are required to continue to tackle barriers to student success. Responses to the online survey also offer an insight into how secondary school staff members believe the changes brought about by the SS/L18 Strategy have been supported. There was general agreement among respondents that schools possess the professional skills and knowledge needed to implement the SS/L18 Strategy, however, one out of five respondents disagree that this is the case (20.1%). When asked whether there were sufficient human resources to support the individual elements of the SS/L18 Strategy, a number of secondary school staff who responded to the survey expressed concern (see Table 12). Nearly two‐thirds believed there is a lack of human resource to support SHSMs (64.4%) and Dual Credit programs (62.7%). More than half of survey respondents said there is not enough personnel to support SCWIs (60.3%), apprenticeships (57.0%), and Credit Recovery (55.0%), and nearly half (43.8%) believed cooperative education programs need more staff.
Oui parce que, tu sais . . . Enlève les argents, le personnel d’extra, c’est certain qu’on a beaucoup plus d’élèves qui auraient décroché. Je veux dire : je n’aurais pas été capable d’offrir certains services. Si je n’avais pas été capable d’offrir certains services, j’ai un certain nombre d’élèves qui seraient disparus. Peut‐être qu’ils auraient été dans une autre école. D’habitude ici quand ils vont dans une autre école, c’est une école anglophone. Il y en a plusieurs qui, oui, auraient décroché et puis aujourd’hui, bien, ils seraient sur le chômage ou bien. Je ne sais pas où ils seraient.
‐ Principal

Stage 2: Findings
______________ September 2008 42
Table 12: Percentage of secondary school staff survey respondents who agree or strongly agree with each statement
Statement
Percent There is not enough staff to support SHSMs (N = 1501) 64.4% There is not enough staff to support Dual Credit programs (N = 1532) 62.7% There is not enough staff to support SCWIs (N = 1961) 60.3% There is not enough staff to support apprenticeships (N = 2199) 57.0% There is not enough staff to support Credit Recovery (N = 2660) 55.0% There is not enough staff to support cooperative education (N = 468) 43.8%* * Because of a technical problem, this question was only asked to respondents completing the survey in French. Therefore, the results for cooperative education in this table should be treated with caution.
What barriers to increased student success have been encountered? And how have these been addressed? One challenge facing the SS/L18 Strategy is a relative lack of student awareness of the Strategy and its different components. The vast majority (81.1%) of students who responded to the online survey were not aware of the terms “Student Success Strategy” or “Learning to 18”. This finding could reflect a general lack of awareness of the overall Strategy, or could reflect the fact that students are unfamiliar with the terms “Student Success Strategy” or “Learning to 18.” When students were probed further during the focus groups, however, it was apparent that they were not aware of the Strategy as a whole. Although most student respondents were familiar with at least one of the components or elements of the Strategy, many remain unaware of the various programs and supports available to them (see Figure 10). It became clear to the field team that several efforts have been made by the Ministry, school boards and schools to increase students’ awareness of supports available to them through the SS/L18 Strategy, though the effectiveness of these measures were not evaluated as part of this evaluation. The Ministry has developed Student Success brochures to be distributed to all parents of students of Grades 8‐12 as part of the course selection process for 2008‐09 and will also display these brochures in such places as driver testing centres, libraries, recreation centres and other community service organizations.31 Several school board and school staff provided the field team with examples of brochures, flyers, and advertisement documents aimed at providing their students with information concerning initiatives that are part of the SS/L18 Strategy.32
31 Zagarac, G. (June 23, 2008) Memorandum: Divisional focus for 2008‐09. 32 Examples of such documents include: a brochure developed by the Ministry entitled “Strategies for Student Success” containing information about programs, strategies, and resources to help students

Stage 2: Findings
______________ September 2008 43
Students who completed the survey were given both the name of specific initiative or component and a description or definition of the latter. A small minority of student respondents reported NOT being familiar with cooperative education programs (18.4%), but more than a third reported not being aware of apprenticeship programs (37.5%) or Credit Recovery (42.2%). Although it is to be expected that fewer students would know about Dual Credit programs (69.4%) and SHSM programs (75.8%), given that these have not been implemented in the majority of schools, it is somewhat surprising that over half of the students who responded to the survey were not familiar with SSTs (51.1%). These results are even more pronounced in larger schools, where more student respondents report a lack of awareness of these initiatives. For example, 33.7% of student respondents attending schools with fewer than 400 students reported not being familiar with SSTs, whereas 64.1% of student respondents attending schools with more than 1,600 students reported the same.
Figure 10: Percentage of students who responded to the survey and who report not being aware of each initiative or form of support
0
10
20
30
40
50
60
70
80
Coop Apprenticeships Credit Recovery SCWIs SSTs Dual Credits SHSMs
Information gathered during interviews and focus groups offers valuable insight into the barriers facing the SS/L18 Strategy. There is, as might be expected, considerable variability across schools with respect to such elements as resources, the diverse and complex needs of their student populations, geographical location, to name but a few. The highly localized conditions and circumstances under which each school operates
succeed in Grades 7‐12, a small card left on tables at local fast‐food restaurants and other popular locations advertising a program tailored for students who have left secondary school before graduation to help them obtain their OSSD, a flyer outlining the details of a SHSM offered at a rural school, a glossy transitions guide for students and parents distributed in the mail to all students from a board, and a pathways to success guide outlining all pathways to graduation within a school board.
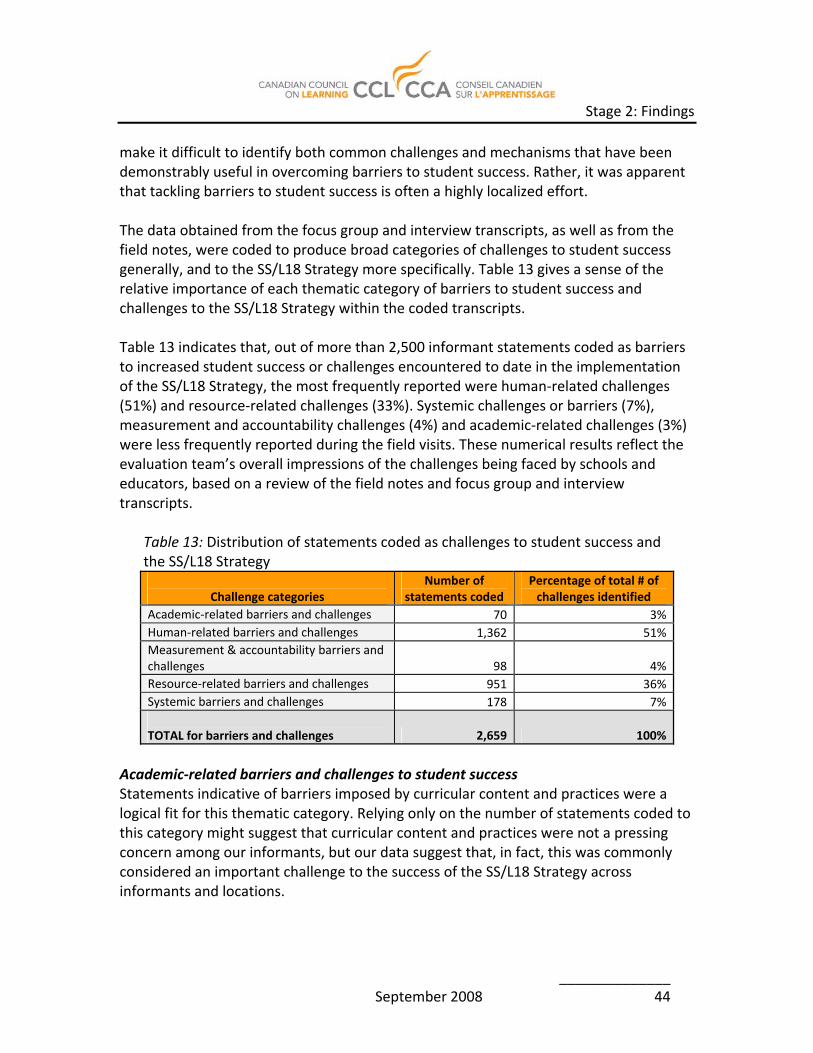
Stage 2: Findings
______________ September 2008 44
make it difficult to identify both common challenges and mechanisms that have been demonstrably useful in overcoming barriers to student success. Rather, it was apparent that tackling barriers to student success is often a highly localized effort. The data obtained from the focus group and interview transcripts, as well as from the field notes, were coded to produce broad categories of challenges to student success generally, and to the SS/L18 Strategy more specifically. Table 13 gives a sense of the relative importance of each thematic category of barriers to student success and challenges to the SS/L18 Strategy within the coded transcripts. Table 13 indicates that, out of more than 2,500 informant statements coded as barriers to increased student success or challenges encountered to date in the implementation of the SS/L18 Strategy, the most frequently reported were human‐related challenges (51%) and resource‐related challenges (33%). Systemic challenges or barriers (7%), measurement and accountability challenges (4%) and academic‐related challenges (3%) were less frequently reported during the field visits. These numerical results reflect the evaluation team’s overall impressions of the challenges being faced by schools and educators, based on a review of the field notes and focus group and interview transcripts.
Table 13: Distribution of statements coded as challenges to student success and the SS/L18 Strategy
Challenge categories
Number of statements coded
Percentage of total # of challenges identified
Academic‐related barriers and challenges 70 3%Human‐related barriers and challenges 1,362 51% Measurement & accountability barriers and challenges 98 4%Resource‐related barriers and challenges 951 36% Systemic barriers and challenges 178 7% TOTAL for barriers and challenges 2,659 100%
Academic‐related barriers and challenges to student success Statements indicative of barriers imposed by curricular content and practices were a logical fit for this thematic category. Relying only on the number of statements coded to this category might suggest that curricular content and practices were not a pressing concern among our informants, but our data suggest that, in fact, this was commonly considered an important challenge to the success of the SS/L18 Strategy across informants and locations.

Stage 2: Findings
______________ September 2008 45
There’s like, ten tons of curriculum, and two hours to do it in.
‐ Teacher not designated as SST
As reflected in some of the representative quotes provided here, school informants regularly indicated that the amount of mandated curricular content, and the rigid timelines within which this content was expected to be covered, acted as a significant barrier to student success. These common barriers have been (and continue to be addressed), for example, by curricular revisions such as the changes initiated by the Ministry in 2003 (during Phase One of the SS/L18 Strategy) with the curricular revisions to the Grade 9 and 10 applied math curricula and the addition of new locally developed compulsory credit courses and the more recent changes to the English Grades 9‐12 curriculum. A number of other curricula are under review to ensure than they remain relevant and engaging.33 Moreover, the Ministry established the Curriculum Council in March 2007, whose role, in collaboration with key stakeholders, is to examine curriculum issues and provide advice to the Ministry regarding these issues.34 A number of informants felt that the pressures placed upon students to demonstrate mastery of specific content at fixed points in time through major standardized testing efforts (such as the OSSLT) and the resulting incentive for teachers to “teach to the test” undermined some of the central goals of the SS/L18 Strategy, namely to ensure the success of all students while meeting the individual needs of students. In addition, some informants indicated that the course options available to younger students (specifically those in grades 7 and 8) were often not sufficiently varied to keep at‐risk students engaged up to the point when they entered secondary school. Human‐related barriers and challenges to student success The most frequently cited human‐related challenges reported by the informants were: (a) staff attitude (24% of statements indicative of a human‐related challenge or barrier); (b) student disposition (13%); (c) the needs of specific student subpopulations, especially students with persistent or marked behavioural difficulties (12%); (d) issues related to increased workload and fatigue (7%); and (e) inadequate or underdeveloped pedagogical practices (6%). Because various types of challenges were eventually grouped into the category of human‐related barriers, and because many of these challenges either overlapped or represented different aspects of broader issues, care must be taken in interpreting results. Items coded as speaking about staff attitude, for example, were varied and represented a variety of dispositional factors that are perceived to affect student
33 See Zagarac, G. (June 23, 2008). Memorandum: Divisional focus for 2008‐09 (particularly, see the curriculum review cycle (7 year) in Appendix A). 34 For more information on the Curriculum Council, see http://www.edu.gov.on.ca/curriculumcouncil/index.html

Stage 2: Findings
______________ September 2008 46
Yeah, I mean some kids will hand it on time because that’s the kind of kid they are. But then there [are] other kids who are a day late or something like that. But the kid who is not too worried about it and you got no mark for five assignments that were due in September. And they can hand it in, in January, at the end of the course and it’s now an issue for us to evaluate that material four, five months later. And what does it show him or her about the requirements or expectations? I mean, in the real world, you don’t make your deadline, you’re in trouble.
‐Teacher not designated as SST
success. It would, in short, be a mistake to conclude that unsupportive staff are a widespread barrier to student success35. If anything, statements that were coded to this type of challenge were more indicative of persistent staff insecurity or of a lack of knowledge about how to adapt teaching practices to match the values promoted by the SS/L18 Strategy (see section discussion professional development on p. 64) while simultaneously coping with the constraints imposed by curricular requirements (see academic challenges above). In addition, informants frequently expressed uncertainty and confusion about the most appropriate means of countering negative perceptions about the values of educational pathways and alternative means of achieving success and demonstrating achievement. Some respondents also suggested that, for all the positive accomplishments of the SS/L18 Strategy, the impression remained that the welcomed focus on low‐achieving students that had come about with the SS/L18 Strategy had sometimes occurred at the expense of academically stronger students. There were also instances when staff expressed the frustration at their inability to help all students succeed, given available human and financial resources, scheduling challenges, and the demanding needs of certain student subpopulations. In short, the data suggest that the importance of staff attitudes as a barrier to student success must be understood as reflecting two subtle underlying challenges. The first challenge is the need for the architects of the SS/L18 Strategy to communicate more effectively with those ensuring the daily implementation of the SS/L18 Strategy to clarify lingering misconceptions and to provide the tools necessary to alter practices in a way that reflects the central values and goals of the Strategy. The second, and equally important challenge, is to understand that the Strategy is at a point in its implementation when the most tractable barriers to student success have likely been addressed and that further progress will require the implementation of mechanisms that can address a number of often complex and fluid personal and organizational barriers to student success. This interpretation is also reflected in the identification of student disposition as the second most important human‐related barrier or challenge to student success. The data
35 Nonetheless, the data did reveal instances of informants reporting challenges to student success posed by others’ attitudes as well as instances of informants inadvertently revealing their own predispositions and biases that may work against the realization of the goals of the SS/L18 Strategy.

Stage 2: Findings
______________ September 2008 47
Because what I’m finding right now, and again, it’s all good work, but what’s happening is our research, and our IT who work alongside, they’re producing volumes and volumes of data, but the reality is they’re probably sitting somewhere in a filing cabinet, or on a desk somewhere, because two things – I don’t think people know what to do with it, and really understand it.
‐ Student Success Leader
show that the belief in the importance of making students at least partly responsible for their own success is widespread. This belief reflects a position repeatedly articulated by the informants that there are limits to what teachers and schools can do to ensure student success if and when individual students are not willing to engage or to help themselves succeed. This belief is also reflected in numerous comments by school informants indicating that students are at times getting counterproductive or mixed messages about the goals and implicit curriculum of the SS/L18 Strategy—for example, that deadlines don’t matter—and that, consequently, they are acquiring dispositions or outlooks that are ill‐suited to success after graduation. Teachers’ perception about the challenges presented by students’ negative disposition seems to be corroborated by students’ responses to one question on the online survey. More than a quarter of secondary school students who responded to the survey (27.3%) say that school is a waste of time often, most of the time, or always. 22.6% say that school is a place where they feel like an outsider or like they are left out of things often, most of the time, or always. Negative student dispositions towards school and education and a lack of engagement in their learning are issues that have been recognized by the Ministry and are central in the development of the SS/L18 Strategy. Many components of the strategy are aimed at providing low‐achieving and disengaged students with new, relevant, and exciting learning opportunities, providing these students with greater choices and support to achieve success (examples include more opportunities for experiential learning, new LDCs offerings, SHSMs, Dual Credit programs, Credit Recovery, to name but a few). Measurement and accountability barriers and challenges to student success Data use, representing 45% of statements in this category, and data collection (37%) were the two measurement and accountability challenges to student success most frequently mentioned by informants. Important changes in data collection and use are underway and notable progress has been made in this area which points to considerable improvements in the (largely informal) exchange of information about individual students among practitioners. Informant statements suggest, however, that the knowledge and capacity are still lacking in some cases to properly collect meaningful data and to use these data to get a reliable sense of student performance at the aggregate level.
Stage 2: Findings
______________ September 2008 48
Informants recognized that extensive discussion around data collection and use had occurred during, for example, professional development days and suggested that the value of using data to support decision‐making was now increasingly accepted. Informants were also quite clear, however, that current data collection and use mechanisms had not been set up to meet many of their needs and that data collected through system‐wide mechanisms still had limited influence on their practices. These challenges have been recognized by the Ministry. Led by the Information Management Branch and the Managing Information for Student Achievement (MISA) initiative, significant efforts have made and funds have been invested towards improving data management and capacity building related to data collection and use in school boards and schools. For example, in 2005 the Ministry established seven MISA Professional Network Centres (PNCs) across the province (including one French‐language centre) with the aim of assisting in local capacity building in this area.36 Resource‐related barriers and challenges to student success Resource‐related challenges accounted for the second most frequently mentioned category of barriers to student success and to the effectiveness of the SS/L18 Strategy. Within this category, the specific factors that were most frequently mentioned by respondents as impeding greater student success were insufficient human resources (21% of statements coded as resource‐related barriers), limited funding (17%), lack of (programmatic) flexibility (12%) and issues related to transportation and/or school location (11%). While informants acknowledged that the allocation of staff focussed specifically on the SS/L18 Strategy had been welcomed37, they also identified three challenges that had resulted from this same staff allocation: (a) regular instances of fewer teaching staff being available to provide courses that were required to promote student engagement; (b) lack of knowledgeable non‐teaching specialists (e.g., psychologists, social and youth workers) to help meet the needs of specific student subpopulations struggling in school; and (c) either insufficient allocations or reductions in the number of staff dedicated specifically to student success, thereby compromising the long‐term viability of the SS/L18 Strategy. The latter was deemed by some principal and teacher interviewees a particularly crucial consideration in large schools and large school districts serving high numbers of students with considerably variable needs.
36 For more information about this initiative, see http://www.edu.gov.on.ca/eng/research/PNC.html 37 For example, in 2005 the Ministry allocated 89 million for 1,300 secondary school teachers (including 800 SSTs) and in 2006, increased this investment to $108 million for the hiring of an additional 300 secondary school teachers (and $6 million for the hiring of an additional teacher per French‐language secondary school to expand unique course offerings). For more information, see Zagarac, G. (September 7, 2008) Memorandum: Student Success Strategy 2006‐07.

Stage 2: Findings
______________ September 2008 49
Informants also identified challenges pertaining to limited funding and the lack of programmatic flexibility. As in the case of human resources, the evaluation team observed with interest that informants reported that the SS/L18 Strategy had led to significant progress with regard to funding and programmatic flexibility. In fact, since 2003, an estimated $1.5 billion have been invested in the Strategy.38 The feedback gathered from the informants was, however, also quite unambiguous in noting that insufficient funding as well as programmatic and scheduling rigidity continue to be considerable challenges, particularly where the needs of the most difficult to reach and engage students are concerned. For example, some school informants reported that the ability for students to move from locally developed to applied courses, applied to academic courses, workplace to college, or college to university is very limited. Informants’ concerns about the barriers this imposed on student success also reflected the difficulties involved in meeting the needs of students who, in addition to educational responsibilities, may be working long hours to support themselves and/or their families, be responsible for the care of younger siblings, or who may themselves be parenting young children. Finally, school location and transportation issues were cited as a barrier to student success. Getting students to and from appropriate programs and cooperative education placements was reported by a number of informants as an important challenge facing the SS/L18 Strategy, although this challenge was, as can be expected, more significant in certain regions and for certain boards than others. While many schools for example offer programs in all pathways or destinations, almost none offer a large array of technology studies or employment‐related programs. As a result, students are sometimes required to attend another school to get one or more courses necessary for their chosen path. For isolated boards in areas such as Northern Ontario, this may involve a student doing an entire semester in another town and boarding with friends or family during the week. In the Greater Toronto area, in contrast, students are often expected to make their own transportation arrangements and there is limited financial support for their use of public transit. A student in Toronto using public transit to travel between home, school and a cooperative education placement might spend well over $100 per month on transportation alone, a financial burden that might act as a further deterrent to student engagement among at‐risk or marginalized students. The Ministry addresses these issues by continuing to provide funding for student transportation. For example, the 2008‐09 school year will see a $10 million increase in funding to support student transportation and wage increases for bus drivers.39 In
38 http://www.edu.gov.on.ca/eng/document/nr/08.02/bg0228b.html 39 Naylor, N. (March 26, 2008). Memorandum 2008 B2: Education Funding for 2008‐09.

Stage 2: Findings
______________ September 2008 50
addition, an additional $17.5 million was announced to help school boards face the rising fuel costs for the 2007‐08 school year.40,41 The concerns expressed during the interviews and focus groups regarding human resources and transportation were echoed by the responses made by the secondary school staff to the online survey. Many survey respondents reported a lack of physical and human resources at their school to successfully implement the SS/L18 Strategy. More specifically, they were asked whether their school had the physical facilities, human resources, and specialized non‐teaching staff (such as social workers, psychologists, youth workers, and educational assistants) to implement the Strategy or support students to become successful. Between one‐quarter and one‐half of respondents holding various positions in the school report that their school does not have the necessary facilities to implement the Strategy and between 37.2% and 55.9% of the respondents believe that there are insufficient human resources. There is even greater concern regarding the lack of special staff to support students, with over two‐thirds (between 68.6% and 86.7%) of respondents in each category reporting a lack of social and youth workers, psychologists, and educational assistants. (See Table 14.)
Table 14: Percentage of secondary school staff survey respondents who disagree or strongly disagree with each statement
Statement Teachers SSTs Spec Ed teachers Guidance VPs Principals
This school has the physical facilities to implement the SS/L18 Strategy. (N = 2445) 37.6% 32.6% 49.3% 37.2% 38.0% 26.9% This school has the human resources necessary to implement the SS/L18 Strategy. (N = 2456) 49.4% 37.2% 55.9% 49.7% 53.6% 44.2% This school has enough non‐teaching support staff (social workers, psychologists, youth workers, ed. assistants) to support students to become successful. (N = 2487) 71.4% 68.6% 86.7% 80.4% 78.9% 79.6%
40 Hayward, C. (March 13, 2008). Memorandum: Fuel Costs. 41 Naylor, N. (June 26, 2008). Memorandum 2008: B8 Student Transportation.
Je pense qu’il faut axer un petit plus sur le socio‐affectif de l’enfant parce que l’enfant a deux parents aujourd’hui qui travaillent, les enfants ont besoin d’orientation, ont besoin de mentorat, encadrement . . . [M]oi, je deviens de plus en plus un papa à ces enfants‐là. Et puis, je n’ai pas de problème à jouer ce rôle‐là, mais avoir un petit plus de travailleurs sociaux, des aide‐enseignants, enseignantes . . . L’appui social d’adulte, ça, on manque ça, là, dans les ressources humaines.
‐ Student Success Teacher

Stage 2: Findings
______________ September 2008 51
The majority of secondary school staff survey respondents stated that there are not enough SCWIs (59.3%), apprenticeships (56.9%), Dual Credit programs (62.5%), and SHSMs (65.0%) for all students who want them (see Table 15). Transportation was also identified by more that half of the secondary school staff respondents to the survey as being a challenge facing students who want to participate in SCWIs (64.4%), apprenticeships (62.5%), Dual Credit programs (60.3%), and SHSMs (56.6%). (See Table 14) Table 15: Percentage of secondary school staff survey respondents who agree and strongly agree that “availability and transportation are challenges for each initiative or program”
Cooperative education N(1) = 467 N(2) = 468
SCWIs N(1) = 2017 N(2) = 1987
ApprenticeshipsN(1) = 2235 N(2) = 2198
Dual Credit N(1) = 1539 N(2) = 1536
SHSMs N(1) = 1510 N(2) = 1497
(1) Not enough for all students 32.3%* 59.3% 56.9% 62.5% 65.0% (2) Transportation is a challenge 33.5%* 64.4% 62.5% 60.3% 56.6%
* Because of a technical problem, these two questions regarding cooperative education were only asked to respondents completing the survey in French. Therefore, the results for cooperative education in this table should be treated with caution. Systemic barriers and challenges to student success Statements made by informants were classified as belonging to the systemic challenge categories when they suggested that resistance and/or misunderstanding of the SS/L18 Strategy’s values, beliefs or goals acted as impediments to student success. Public perceptions were widely identified as the most significant systemic barrier to student success, accounting for a total of 82% of the statements coded in this category. The impacts of public perceptions on student success, like other significant barriers discussed to date, were multi‐faceted. Ongoing negative perceptions and assumptions about the values of different educational pathways among parents42, community stakeholders and society “at large” were repeatedly cited as significant barriers to some of the SS/L18 Strategy’s core objectives.
42 Efforts have been made to inform parents about the different pathways available to their children (for example, the Ministry brochure mentioned earlier and provided to parents about pathways).

Stage 2: Findings
______________ September 2008 52
I had […] a pile of questions about the OYAP program and sent parents to guidance, who said, “No, there is no program for that.” But there is a program…so there’s misinformation in a lot of places.
‐ Teacher not designated as SST
Many informants mentioned the difficulties they encountered in securing parental support, in particular, for students to pursue “non‐academic” educational trajectories and post‐secondary education options such as apprenticeships, college training, and direct work opportunities. Many also mentioned their frustration at lacking the means to proactively demonstrate the value of these same alternative pathways to interested stakeholders. This issue is related in turn to respondents’ comments pertaining to inadequate knowledge of the availability or requirements of alternative educational pathways, as well as a lack of knowledge of assessment methods and standards that would demonstrate the skills and content mastery of students. In contrast with the challenge posed by the more exclusively academic aspirations of some parents, the evaluation team also identified that, in certain communities and among certain groups where completion of a secondary education has not traditionally opened the door to economic or career opportunities, low parental aspirations also acted as a barrier to student success. One interviewee framed this barrier as a “first generation” issue, suggesting that some groups of parents—either because of their own negative experiences with formal schooling, because of values, or because of their desire to have their children join the family business as early as possible—may be much less supportive of their children’s educational future than schools anticipate. Efforts are being made to increase parental involvement through the development of a new Provincial Parent Board whose role is to monitor current levels of parental involvement in the education system and to advise the Ministry about the best ways of increasing parental involvement in their children’s education. Funding was also made available for the creation of Parental Involvement Committees within each board starting in the 2005‐06 academic year.43 In addition, during the current school year (2007‐08), over 1,300 Parents Reaching Out grants were offered to support the development of projects supporting parental involvement.44 What further strategies and actions, if any, are suggested to further increase secondary student success? Given the importance of human‐ and resource‐related barriers to student success discussed previously, it comes as no surprise that Stage 2 informants focused most of
43 Giroux, D., Glaze, A., Naylor, N., Pervin, B., Zagarac, G. (June 1, 2007). Memorandum 2007 B6: Education Programs Other Funding for 2007‐08 Reporting Entity Project Funding 44 http://www.edu.gov.on.ca/eng/parents/reaching.html

Stage 2: Findings
______________ September 2008 53
their recommendations on actions having to do with human‐related and resource‐related factors. The section of the report that addresses the principal barriers and challenges to student success as identified by the informants contains implicit recommendations about a number of areas of action to which the Ministry may wish to attend. Moreover, the recommendations contained in the conclusion section of this report, outline what the evaluation team considers to be the most pressing issues requiring policy action to ensure achievement of the SS/L18 Strategy’s goals, based on the analysis and interpretation of all the data collected during this evaluation. The present section should therefore be understood as reflecting the specific needs and perceptions of the informants interviewed during the field visits, the majority of whom are involved with and affected by the day‐to‐day implementation of the SS/L18 Strategy. The data obtained from the focus group and interview transcripts, as well as from the field notes, were coded to produce broad categories of recommended improvements to the SS/L18 Strategy (see Appendices D and E for a detailed description of the coding categories). Table 16 gives a sense of the relative importance of each thematic category of suggested improvements to further promote student success and the viability of the SS/L18 Strategy.
Table 16: Distribution of recommended improvements, as expressed by informants
Improvement categories
Number of statements coded
Percentage of total # of improvements identified
Human‐related improvements 573 48% Resource‐related improvements 313 26% Systemic improvements 78 7%Other improvements 220 19% TOTAL for recommended improvements 1,184 100%
Table 16 indicates that nearly 1,200 informant statements were coded as suggested improvements to continue promoting student success and ensuring the ongoing effectiveness of the SS/L18 Strategy. Human‐related improvements, which mainly contained suggestions for actions pertaining to various aspects of capacity building, communication with primary stakeholders and meeting the diverse needs of learners, accounted for 48% of all statements made by the informants.45 Resource‐related improvements accounted for the second most prominent area in need of attention (26% of statements coded in this category), followed by a varied group of “other” 45 Interestingly, this matched closely the relative importance of reported human‐related barriers and challenges to student success.

Stage 2: Findings
______________ September 2008 54
recommended improvements that were not readily classifiable (19%). System‐wide or “systemic” improvements (7%) were the least frequently mentioned. The relatively low priority accorded to systemic improvements by the informants may be more a reflection of the pressing needs identified by informants than an indication that systemic improvements are not particularly important. Indeed, our own recommendations outline some systemic concerns that, if addressed, could play a significant role in shaping the future of the SS/L18 Strategy. It is also worth noting that a number of the recommended human‐related improvements discussed below are related to the informants’ suggestions of improvements to optimize resource allocation and use under the SS/L18 Strategy. Recommended human‐related improvements Suggestions of actions and strategies made by the informants that pertained to identifiable and/or group‐specific human behaviours, needs, or beliefs were grouped into the thematic category “human‐related improvements.” This category therefore identifies unmet human‐related needs that are believed to have a direct impact either on student success or on the achievement of the SS/L18 Strategy’s goals and that are likely to be positively affected by direct policy and/or practice intervention.46 Within this category, informants identified the need to: (a) improve capacity building around pedagogy (25% of all coded statements classified as indicative of a recommended human‐related improvement); (b) address group‐specific needs (24%); and (c) foster more accurate definitions and better understanding of different actors’ roles and of the scope of programs operating under the ambit of the SS/L18 Strategy. Informants also identified the need for greater capacity building for data collection, management, and use (11% of statements).47 Finally, 6% of coded statements pertained specifically to the need to foster greater parental involvement and support in promoting student success and, in particular, in opening up discussions about the values of different educational pathways.
46 The distinction between human‐related and systemic improvements is subtle but important: while systemic improvements refer, for example, to the need to continue to support broad cultural change within the province’s educational system, human‐related improvements address issues that have at least the potential to be dealt with at the level of individuals and/or small groups through concrete and specific actions. 47 It bears remembering that data collection and data use, in particular, were identified as significant barriers to student success and to the SS/L18 Strategy’s objective, as discussed in the section of this report dealing with barriers.

Stage 2: Findings
______________ September 2008 55
I feel that the Student Success Teacher role in the school is a very large role, and I think that really needs to be examined in terms of workload that’s dumped on the Student Success Teachers. As I said, in our board, we had two thirds of the teachers leave at the end of last year, who had been doing it for two years. They just said, “Enough was enough.”
‐ Student Success Teacher
It is likely that the relatively low importance of parental involvement, when measured as a proportion of all statements pertaining to recommended human‐related improvements, is an artefact of our coding scheme. Indeed, it bears remembering that lack of support for different educational pathways was identified by the informants as a significant barrier to student success. The evaluation team considers, on the basis of all the data collected to date that fostering direct communication and exchange between educators and parents, as well as greater parental support and understanding of the goals of the SS/L18 Strategy, is urgently required and some of our own recommendations reflect this interpretation. The data clearly suggest that, while perhaps outside the immediate sphere of influence of the school, parental beliefs and parental involvement are widely seen by the informants as key determinants of student persistence and success. This finding is encouraging insofar as the importance of these factors has been widely recognized in the research literature. The issue of capacity building for improved pedagogy also requires a brief explanation. It is the interpretation of the evaluation team that the predominance of this factor is strongly related to the most important human‐related barrier to student success identified by the informants during the field visits, namely what was labelled “staff attitude” during the course of our analysis. It is also related to the barrier imposed by a high workload and staff fatigue. Informants repeatedly indicated that frontline practitioners needed to acquire the skills and tools to adapt their pedagogy both to the goals of the SS/L18 Strategy as well as to the diverse learning needs of different students. The data collected during the field visits suggest considerable differences across practitioners and across schools regarding the extent to which the values embodied in the SS/L18 Strategy have been translated into concrete practice and policies. Even within schools, for example, there appears to be considerable variability with regard to how to address something as seemingly simple as the policy directive on acceptance of late assignments.
Spend more money on advertising skilled trades. Parents need to be more educated as to what opportunities are out there.
‐ Teacher not designated as SST

Stage 2: Findings
______________ September 2008 56
Pedagogical gaps were also noted by the informants with regard to the “operationalization” of the shift from teaching to learning promoted by the SS/L18 Strategy, as well as the requirements of programs resulting directly from the latter, such as Credit Recovery and Credit Rescue, and other long‐standing programs such as cooperative education and apprenticeships that are commonly perceived as significant contributors to student engagement. Based on the analysis of the data, it can be concluded that the Ministry should pay direct attention to ensuring that all frontline practitioners have access to pedagogical skill‐building opportunities that are in line with the goals of the SS/L18 Strategy. The Ministry should also ensure that the opportunities are provided in a manner that is convenient to frontline staff and does not add significantly to their considerable workload. Understanding recommended human‐related improvements also requires attending to group‐specific needs. During Stage 1 of the evaluation, the evaluation team identified a number of specific student subpopulations that were deemed, by the informants interviewed during this stage, as presenting with specific needs. These subpopulations included Aboriginal students, rural students, Francophone students, and others.
The evaluation team paid specific attention to statements made about these groups during Stage 2, but informant feedback collected during this second stage suggested that, while still important, the needs of another group of students emerged as highly significant. Specifically, informants identified students presenting with behavioural difficulties as a group in urgent need of attention if the goal of ensuring success for all students is to be achieved. While many students in this group may have also been coping with mental health, substance use, or learning challenges, for example, these students also shared common difficulties around attendance, ability to function in “traditional” academic contexts or to meet the
demands of more traditional educational programs. They were also often perceived to be lacking soft skills such as interpersonal relationships, problem‐solving and decision‐making, or to be facing personal challenges such as pregnancy. Many school informants expressed the desire to see greater capacity building in addressing the needs of these students within the school, as well as increased resources in the form of specialized staff such as youth and social workers, and in the form of increased program funding. Recommended resource‐related improvements The three most frequently suggested resource‐related improvements were both interrelated as well as intimately associated with many of the human‐related barriers
A lot of the students that are 16 and 17, who are disengaged, are now causing, let’s say, a fair number of problems. Whereas in the past, we would have said, “Go out and go to work and if you’re prepared and ready to come back o school, we’ll see you when you are.” Now we can’t do that and it’s having a negative impact. Not only on the school tone, but on discipline and attendance. So probably we’re having a higher truancy rate this year.
‐ Student Success Teacher

Stage 2: Findings
______________ September 2008 57
So if I had one message to give today it's the money's been really good money, we appreciate it, we value, it, it needs to be maintained.
‐ Director of Education
and improvements discussed previously. Meeting staffing needs was mentioned frequently, representing 33% of the resource‐related improvements recommended by the informants.48 Equally important according to the informants was increasing or securing existing funding to offer suitable program options (33% of statements) to
reflect local needs and circumstances. Increasing flexibility for program and course delivery was also viewed as important, accounting for just under one fifth of all statements pertaining to resource‐related improvements.
Recommended systemic improvements Systemic improvements drawn from informant statements centred on the need to foster greater and/or ongoing culture change, and to promote planning certainty. Promoting a system‐wide change of culture for the role of teachers and fostering values supportive of a shift from teaching to learning accounted for nearly half of all coded statements considered as indicative of recommended systemic improvements. The need to increase awareness of the value of different educational pathways throughout the educational system and, indeed, in the greater societal environment accounted for more than a quarter of all informant statements. Interestingly, this was reported to be as important as fostering a climate of planning certainty at all levels of the educational system. These reported systemic needs further underscore the importance of the barriers and recommendations identified elsewhere in this report and, as such, are not discussed in great detail here. They are, however, reflected in the recommendations in the concluding section of this report. Other recommended improvements One type of recommended improvement that did not fit in readily with any of the aforementioned thematic categories was to stay the course with the SS/L18 Strategy. Informants unequivocally stated that securing the flexibility and diversity afforded by the different initiatives and programs offered under the SS/L18 Strategy was a significant determinant of their ability to stay focused on relevant goals and to maintain morale. The fear, in short, seemed to be of major policy changes or reversals that would compromise the considerable work undertaken to date by educators.
48 Statements coded to this type of recommended improvement related to: (a) increasing staffing numbers to reduce workload and/or ensure proper delivery of core and/or required courses and programs; (b) securing specialized teachers to offer program options; (c) securing specialized staff to meet the needs of specific student populations; and (d) ensuring the necessary pedagogical and professional development of educators, to reflect local circumstances.

Stage 2: Findings
______________ September 2008 58
Stay the course. Don’t cancel the program or start something else. Send the signal this program is here to stay and spare us the glossy folders and brochures.
‐ Teacher not designated as SST
The desire to stay the course, coupled with the recommendation that future efforts of the SS/L18 Strategy be focussed on implementation rather than the development of new initiatives was characteristic of the vast majority of informants contacted by the evaluation team. Is there any evidence that graduation rates are increasing and drop‐out rates decreasing? According to data released by the Ministry, provincial graduation rates have been slowly, but steadily, increasing from 68% in the 2003‐04 academic year to 75% in the 2006‐07 academic year (see Table 17). The Ministry’s calculation of graduation rates is based on a student cohort of approximately 150,000 over five years. Each year, a one percentage increase in graduation rate results in approximately 1,500 graduates compared to the previous year. Compared to the 2003/2004 academic year, an additional 22,500 students have graduated from secondary school.
Table 17: Provincial graduation rates, as reported by the Ministry
Year
Graduation rate
Total graduates1 Additional graduates since 2003/2004
2003/2004 68% 102,000 ‐‐ 2004/2005 71% 106,500 4,500 2005/2006 73% 109,500 7,500 2006/2007 75% 112,500 10,500 Total 430,500
22.500
Source: Ontario Ministry of Education 1 Approximate numbers
During interviews and focus groups, informants were not widely able to refer to specific data demonstrating that the SS/L18 Strategy had had significant impacts on graduation and abandonment rates. They readily identified, however, provincial increases in graduation rates and decreases in school abandonment rates as two benefits of the SS/L18 Strategy. Having said this, informant input suggests that smoother transitions between the elementary and secondary levels, between secondary school and post‐secondary education or work, student retention, and increased credit accumulation are considered, at this stage of the SS/L18 Strategy, as more significant benefits. The data suggest strongly that it is still too early in the implementation of the SS/L18 Strategy to know the precise impact it has had on graduation and abandonment rates.49
49 In fact, feedback provided by the interviewees suggests that the Ministry’s desire to show a demonstrable impact by the SS/L18 Strategy on graduation and abandonment rates is often considered to

Stage 2: Findings
______________ September 2008 59
The survey data suggest that many secondary school staff members who responded to the survey, especially teachers who are not part of the Student Success Team, believe that schools are under too much pressure50 to improve graduation and pass rates (see Figure 11). SSLs and Student Success Team members often voiced the opinion that ensuring student success was more about engaging students and changing school culture than the change measured by the indicators alone. This may be reflected in the significant number of survey respondents who agree or strongly agree that “schools are under too much pressure to improve graduation and pass rates”. Among survey respondents, teachers51 were the most likely to agree or strongly agree that schools were under too much pressure to improve graduation and pass rates. Figure 11: Percentage of respondents in each position who agree and strongly agree that “schools are under too much pressure to improve graduation and pass rates”
0
10
20
30
40
50
60
70
80
90
100
Teachers SSTs Special EdTeachers
Guidance/Careercounselors
Vice-principals Principals
strongly agree agree
be driving the process of change in ways that are not always compatible with effectively addressing the specific needs of schools and students. 50“Too much pressure” was not defined in the survey for respondents; its meaning was left to respondents’ interpretation. 51 Teachers are more likely to feel direct pressure on their own classroom practice when questions are raised about pass rates than are other educators in the school (guidance counsellors, principals) since it is the classroom teachers’ instructional and assessment practices that are being scrutinized.
Stage 2: Findings
______________ September 2008 60
Is there any evidence that structures and supports are changing to better provide viable pathways for all students to learn to 18 years and beyond?
Information gathered during the field visits suggests that efforts are being made to promote pathways other than the traditionally valued university pathway and that schools provide more opportunities for students to follow these pathways than before. The majority (56.1%) of students who responded to the survey say that they plan to go to university after high school. Another 22.3% plan to go to college, 6% claim that they want to work and 4.6% want to become apprentices. The remaining 11% had not yet decided what to do after high school. As mentioned earlier, an increase in program options for students was the most often cited resource‐related benefit produced by the SS/L18 Strategy, accounting for 42% of the coded statements in this category of benefits. The expansion of cooperative education opportunities, the development of SHSMs and Dual Credit programs52, and the increased opportunities for apprenticeship placements are all good examples of efforts being made to provide viable pathways for students who do not necessarily wish to go to university. Data provided by the Ministry indicate that the number of cooperative education credits achieved is on the rise. Although the number of students enrolled in cooperative education fell from 92,952 students during the 2004/2005 academic year to 87,000 during the 2005/2006 year, the number of credits achieved has increased from nearly 110,000 to 120,000. This indicates that students are completing more than one cooperative education credit. Revisions applied to Ontario Secondary School (OSS) in February 2006 have permitted students to count up to 2 cooperative education credits as part of their 18 compulsory credits needed to obtain their OSSD.53 Students who responded to the survey generally feel that they get good advice and guidance for career preparation (67.7%), though more students felt they get good advice for planning their future education (72.4%). Nearly one quarter (24.2%) of teachers who responded to the survey report knowing very little about what is available
52 According to data provided by the Ministry, during the 2007/2008 academic year, approximately 4,300 students were enrolled in Dual Credit programs and 6,650 were enrolled in SHSM programs. 53 Kennedy, G. & Levin, B. (1 Feb. 2006). PPM 139: Revisions to Ontario Secondary Schools (OSS) to support student success and learning to 18.
We’re also promoting Pathways much more. Before we’d always be like, “Well why don’t you go to college?” And it’s always that the college and university streams are the way to go . . . we need individuals in the trades. We’re lacking that now, and it’s a very honourable profession. So if somebody says they’re not going to college, you can say, “Why not?” or whatever, but to be positive about what they’re planning and doing, and that college and university is not the only option, and that it’s not always the option for everybody.
‐ Student Success Teacher

Stage 2: Findings
______________ September 2008 61
to students after graduation. Nevertheless, most secondary school staff respondents believe that students get good advice for career preparation (83.3%), and for planning their future education (85.2%). Is there any evidence that new learning opportunities are changing to better capture and build on the strengths and interests of all students?
Many secondary school students and staff who responded to the survey agree that initiatives such as Dual Credits, SHSMs, expanded cooperative education, apprenticeships, and SCWIs help students by providing them interesting new learning opportunities (see Table 18). More than half of the students who responded to the online survey (55.1%) say that they are interested in what they are learning in class often, most of the time, or always.
Table 18: Percentage of survey respondents who agree or strongly agree that each initiative or program “helps students maintain interest in school”
Initiatives Staff Students
Cooperative education 93.1% 72.0% SCWIs 91.4% 77.7% Apprenticeships 90.4% 71.4% Dual Credit 89.4% 73.3% SHSMs 94.7% 79.3%
The majority of students who responded to the survey (77.9%) say that they have been able to take courses that they find interesting and challenging, but more than half of student respondents (55.6%), report that there are not enough courses in subjects that interest them. Is there any evidence that structures and supports are changing to better assist students in their transition from elementary to secondary school? Improved communication, especially between secondary schools and their feeder elementary schools, the development of student profiles, individual timetabling for at‐risk students and a multitude of transition activities were discussed in many of the school interviews and point to a strong focus on ensuring that students experience a
On cherche à leur faire reconnaître leurs propres forces, puis vraiment de . . . Il faut identifier la force pour que le jeune comprenne ses forces. Souvent, c’est ça qui les apporte de réussir leur secondaire puis avoir un bon séjour chez nous qui leur apporte beaucoup.
‐ Student Success Teacher

Stage 2: Findings
______________ September 2008 62
successful transition between elementary and secondary school. Some interviewees reported being given more time than ever before to develop channels of communication with elementary schools to share information about individual students, and about academic and curriculum expectations at each level. Secondary school staff who participated in the online survey were asked about efforts made to support success in Grade 9 students. The vast majority of respondents agree or strongly agree that their school is making efforts to welcome its Grade 9 students to make them feel that they can succeed in secondary school (95.7%) and that teachers in their school monitor how Grade 9 students are doing (92.4%). Furthermore, approximately three‐quarters of respondents (78.8%) agree or strongly agree that their school makes individual timetables that build on students’ strengths. Is there any evidence that accountability measures (monitoring, tracking, reporting and planning) are in place in schools and school boards and being used by schools and boards in order to drive improvement? The vast majority of survey respondents (more than nine out of 10 respondents) agree or strongly agree that monitoring measures are in place and being used by the school to support student success (see Figure 12). A slightly higher proportion of respondents say that the measure are in place than that they are in use.
I really like the fact that we're gathering information from the feeder schools before they get here. So the fact that we have, you know, lists of names of who to look for and what to watch for. We've always done that in terms of Spec Ed with our IEP kids. But some of these kids have other issues and they're not identified, so there's other at‐risk factors for them. So getting transition profiles for these students has been tremendously helpful.
‐ Student Success Teacher

Stage 2: Findings
______________ September 2008 63
Figure 12: Percentage of respondents in each position who agree and strongly agree that “monitoring, tracking, reporting, and planning measures are in place and are being used by their school in order to drive improvement in student success”
0102030405060708090
100
Teachers SSTs Spec EdTeachers
Guidance/Careercounselors
Vice-principals Principals
Measures in place (strongly agree) Measures in place (agree)
Measures in use (strongly agree) Measure in use (agree)
Similarly, data gathered during the field visits suggest that school and school board staff consider measurement and accountability changes to be important benefits resulting from the SS/L18 Strategy,54 though many informants expressed concerns regarding the capacity within schools to use data to intervene with students when needed55.
54 See the more detailed discussion in the earlier section on the benefits of the SS/L18 Strategy. 55 See the more detailed discussion in the earlier section on the barriers and challenges facing the SS/L18 Strategy.
Well, and we’re a data‐driven board in many ways. And that’s not a harsh term that we’re afraid to use, but we are accountable through the data that we generate in our board. And we look at credit accumulation, we look at in Grade 9 and Grade 10 very strongly, as well as in Grade 11 and Grade 12. We look at our graduation rates. And we have seen a steady, positive increase in all areas of our data around Student Success. And that’s just not at‐risk students, of course, that’s all our students.
‐ Student Success Leader

Stage 2: Findings
______________ September 2008 64
Is there any evidence that capacity to implement the SS/L18 Strategy is being built in schools and school boards?
Secondary school staff who participated in the online survey were asked several questions about the professional development (PD) opportunities in which they have participated since September 2005. Although all respondents report having taken part in some form of PD since September 2005, there is considerable variability in the level of participation in professional development related specifically to the SS/L18 Strategy (see Table 19).
Table 19: Percentage of respondents holding different position in the school and who have taken part in PD specifically related to the SS/L18 Strategy since September 2005
Position in school Percentage
Teacher (not member of Student Success Team) 58.1% Student Success Teacher 93.8% Special education teacher 77.0% Guidance/Career counsellor 87.5% Vice‐principal 88.2% Principal 92.1%
More specifically, teachers who are not part of the Student Success Team and Special Education teachers who responded to the survey were much less likely to have attended a regional conference or symposium (17.5% and 37.5% respectively) or a provincial conference or symposium (11.9% and 16.5% respectively) compared to SST or principal respondents (82.4% and 89.0% respectively for regional conferences or symposia and 58.2% and 64.8% respectively for provincial conferences or symposia). Most teachers who responded to the survey, however, report having received some information about the SS/L18 Strategy during workshops offered in their school (92.6%). These survey findings indicate that there are more PD opportunities to build capacity to implement the SS/L18 Strategy for SSTs, principals, vice‐principals, and guidance or career counsellors and that there are fewer opportunities for this capacity building for teachers who are not part of the Student Success Team.
The Student Success (board) program has basically a monthly meeting, in terms of getting all the Student Success Teachers together, as well as the intermediate ones, and the PD is ongoing for that, so it’s just continual.
‐ Student Success Teacher

Stage 2: Findings
______________ September 2008 65
Is there any evidence that schools and school boards are acting upon their student and school‐level data and information to intervene with and support students appropriately? Data from the online survey shows that most secondary school staff respondents (between 87.0% for teachers not designated as SST to 94.3% for guidance/career counsellors) agree or strongly agree that data is being used to help support individual students in their school (see Figure 13).
Figure 13: Percentage of respondents in each position who agree and strongly agree that “staff at their school act upon student‐level data and information to intervene with and support students”
0102030405060708090
100
Teachers SSTs Special EdTeachers
Guidance/Careercounselors
Vice-principals Principals
strongly agree agree
During the field visits, it was also apparent, however, that data collection and use represent a significant challenge in many schools. As illustrated by the following quote from a member of a school’s Student Success Team, several informants reported having access to data, but not always knowing how best to use the data in their daily practices.
Is there any evidence that schools and school boards are making decisions in an effort to align resources and practices to the goals of the SS/L18 Strategy? It was widely reported by interviewed respondents that efforts are being made to align resources and practices to the goals of the SS/L18 Strategy. Most survey respondents,
We use . . . we're not nearly as good at data as we should be. Data frightens a lot of people and I'll include myself in that group. We have the data warehouse and we can access student's marks and different information. I don't . . . we don’t do much of that here.
‐Member of a Student Success Team

Stage 2: Findings
______________ September 2008 66
especially SSTs (95.3%) and principals (98.1%) agree with this view, as is illustrated in Figure 14.
Figure 14: Percentage of respondents in each position who agree and strongly agree that their “school is making efforts to align resources and practices to the goals of the SS/L18 Strategy”
0
10
20
30
40
50
60
70
80
90
100
Teachers SSTs Special EdTeachers
Guidance/Careercounselors
Vice-principals Principals
strongly agree agree
There is wide agreement among secondary school staff respondents that various practices that are aligned with the goals of the SS/L18 Strategy are established in their schools (see Figure 15). Nearly all respondents agree or strongly agree that their school makes efforts to welcome Grade 9 students and make them feel that they can succeed in secondary school (95.7%) and that teachers keep an eye on how Grade 9 students are doing (92.4%). Almost nine respondents out of 10 (88.5%) say that teachers in their school build literacy skills into their daily lessons and more than three‐quarters of respondents report that their school can make individual timetables that build on students’ strengths (78.8%) and that there is a new focus in their school on building students’ competencies in mathematics (76.1%).

Stage 2: Findings
______________ September 2008 67
I think, well, with the homework room, it went to be something that teachers assigned the student if they weren’t done. And there were forms to fill out, and if students didn’t show up, it went to the principal and we decided just to can that. Now it’s a voluntary thing…student can be encouraged by their teacher to go, but now that it’s been made totally voluntary, I think we’ve more students than ever.
‐ Student Success Team member
Figure 15: Percentage of secondary school staff respondents who agree and strongly agree with each statement
0 10 20 30 40 50 60 70 80 90 100
There is a new focus in this school on buildingstudents’ competencies in mathematics.
For students who might struggle, this school canmake an individual timetable that builds on
students’ strengths.
Teachers in my school build literacy skills intotheir daily lessons.
Teachers in my school keep an eye on how Grade9 students are doing.
This school makes an effort to welcome its Grade9 students and make them feel that they can
succeed in secondary school.
Agree Strongly agree
Is there any evidence that low impact initiatives are being replaced by high impact initiatives at all levels of the education system? It is still early in the implementation of the SS/L18 Strategy to assess the full level of impact of most initiatives within the Strategy, and therefore it is to be expected that few instances of initiatives being replaced by others would be observed. The field team observed that few initiatives were being completely replaced, but rather, changes were being made to improve upon initiatives that were not always producing the desired outcomes.
Evaluation Framework for Individual Initiatives After consultations with Ministry officials and following the qualitative data collection and document analysis performed in Stage 1 of the evaluation, CCL identified a sample of 14 of the specific initiatives or programs thought to be central to the SS/L18 Strategy, along with intended elements associated with each initiative or program. The initiatives or programs identified for further investigation are:

Stage 2: Findings
• Dedicated Student Success
Personnel • Credit Recovery programs • Credit Rescue initiatives • Specialist High Skills Majors • Grade 8 to 9 Transition initiatives • Dual Credit programs • School‐College‐Work Initiatives • Later literacy initiatives
• Numeracy programs • Expanded cooperative education • Apprenticeships • Alternative programs • Renewal of Technological
Education • Destination Réussite (in French
boards and schools)
The intended elements identified for each of the above initiative or program included: (a) the specific goal of the initiative or activity and how it is associated to the SS/L18 Strategy’s main goals, (b) the target population, (c) the necessary ingredients, (d) the activities, (e) and the outcomes. The information was summarized and gathered in a visual representation for each initiative (see diagram depicted in Figure 1 on p. 5 of the report). The extensive data collected in schools and school boards during Stage 2 of the evaluation were used to identify the observed elements of each initiative or program and to determine whether gaps exist between these intended and observed elements of the initiatives (see Appendix F).56 Based on the information gathered during the evaluation, the evaluation team considers that, as a whole, the initiatives and programs that were examined align well with the five goals of the SS/L18 Strategy.57 In general, the extent of the implementation of the initiatives and programs varied widely across boards and schools. In many cases, however, it is too early to assess whether the intended outcomes have been reached. Continued monitoring over the next few years remains critical. Briefly described below are some observations regarding the main gaps that emerged between the intended and observed elements of each initiative or program. For more details about the intended and observed elements of each individual initiative or program can be found in the diagrams in Appendix F. 56 Please note that in cases where the intended elements of certain initiatives included students in elementary grades, it was not always possible to verify the corresponding observed elements for students in those grades because data was not collected in elementary schools as part of this evaluation. In some cases, however, respondents had some knowledge of the initiatives being pursued in the elementary grades, and, when they shared this information with the evaluation team, it was included in the analyses. 57 The goals articulated by the Ministry for the SS/L18 Strategy are: (1) Increase graduation rate and decrease drop‐out rate, (2) support a good outcome for all students, (3) provide students with new and relevant learning opportunities, (4) build on students’ strengths and interests, and (5) provide students with an effective transition from elementary to secondary.

Stage 2: Findings
______________ September 2008 69
Dedicated Student Success personnel In addition to the dedicated personnel identified in Stage 1 (SSLs and SSTs), a number of schools reported the support of other personnel dedicated to Student Success, such as youth workers or Aboriginal counselors (funded by bands), yet, in some larger boards and schools, the allocation for one full‐time equivalent SSL or SST was considered insufficient. Credit Recovery The target population observed for Credit Recovery programs varied widely across schools. In some cases, Credit Recovery was focused on Grades 9 and 10, in others only on Grades 11 and 12. Returning students who have been out of school were cited as being difficult to serve with Credit Recovery, as it was more difficult to identify what learning was missing. Prior learning assessment recognition was identified by some schools as a potentially more appropriate starting point for these students, especially if they were lacking a large number of credits. The most often identified gaps in necessary ingredients included the lack of course‐appropriate materials (e.g., the reliance on Independent Learning Centre material was not judged to be very successful by some schools) or knowledge by the Credit Recovery teacher, who is often a generalist rather than a subject specialist. Some schools noted that the flexibility to offer Credit Recovery throughout the day should be viewed as a necessary ingredient. Credit Rescue Considerable variation in the audience served by Credit Rescue programs was also observed. In some schools, it is offered to students in all grades, while in others, it is only open to students in Grades 9 and 10. Most of the necessary ingredients seem to be in place and a wide range of activities related to Credit Rescue were observed in most schools, however, there was no clear evidence of additional resources (in the form of additional staff or reduction of teacher‐student ratios) being allocated specifically for Credit Rescue. Specialist High Skills Majors SHSMs are still in the early stages of implementation in the system and are only developed in a minority of schools. When present, they draw a wide range of students, but can attract students who are at risk of leaving school, if the student has a focus. The necessary resources and partnerships are in place; however, concerns have been voiced by administrators about the long‐term sustainability of the program. Smaller schools and boards struggle with getting sufficient enrolment for such programs and face challenges with respect to timetabling. Facilities and equipment issues have also been identified as a challenge in some cases.

Stage 2: Findings
______________ September 2008 70
In some schools there were “focus programs” which were similar (in some, but not all features) to the SHSMs and predated them. Schools considered these to be quite successful in providing a focus for students who might otherwise have been at‐risk. Grade 8 to 9 transition initiatives A wide range of activities devoted to elementary to secondary school transition was observed in most schools, often overseen by the SST or the Student Success Team. Communication between secondary and elementary feeder schools has been reported to have increased greatly in the past few years and early identification and support for at‐risk students is often in place. In addition, many schools are running special orientation and/or mentorship programs for students making the transition from Grade 8 to Grade 9. Dual Credit programs Although the primary focus of these programs is on students facing challenges in graduating, some schools reported that successful students wanting to get a head start on their post‐secondary programs also participate in Dual Credit programs. It should be noted, however, that overall, a very small minority of students participate in Dual Credit programs. Support from teachers’ federations and/or unions is still noted to be a challenge in some cases and concerns regarding the harmonization of two different funding models (one for secondary schools and the other for colleges) were voiced. School‐College‐Work initiatives Many resources and necessary ingredients were reported as being present to support SCWIs. Collaborations between schools or boards and colleges (as well as universities in some cases) were frequently mentioned. Resources for transportation and accommodation, however, were lacking in some cases, especially in remote locations. Later literacy initiatives Although initiatives related to improving literacy skills are directed to all students, special attention is being paid to students considered to be at‐risk of not succeeding on the OSSLT, to English language learners, and to boys.58 Resources and professional development and learning opportunities appear to be available for teachers. Numeracy initiatives General professional development on differentiated instruction has been provided for teachers in Grades 7 and 8, and increased collaboration between teachers of Mathematics in Grades 7‐10 is evident. Resources such as manipulatives and technology
58 Very little or no data on Grades 7 and 8 were gathered for this evaluation and although this group was identified in Stage 1 as being part of the intended audience for these initiatives, will not be discussed further.

Stage 2: Findings
______________ September 2008 71
(and professional development related to the use of these resources) were often mentioned as being insufficient to meet the demands of the schools. Expanded cooperative education Although the target population for cooperative education opportunities has been expanded in many schools, in others, it remained restricted (for example, to students in Grade 11 or 12). It was made clear, however, that cooperative education was now open to students at risk of not graduating, to returning students, and to students with developmental delays, which has led to a perceived increase in the range and number of students in coop programs. Nevertheless, a number of gaps with respect to necessary ingredients have been identified. The coordination of placements appears to be a larger problem in larger urban areas than in smaller communities. Transportation issues were often mentioned in terms of their cost in urban areas and in terms of the lack of availability in smaller rural communities. Although there is generally good support from local businesses, challenges arise in shrinking, high unemployment communities and access to placements in French is often a challenge for students attending French‐language schools. When coop is available in Grade 9 and 10, more staff support is needed for students. Finally, there are logistic problems with scheduling and timetabling, especially in French and Catholic schools because of the added English and religion requirements. Apprenticeship programs Curriculum alignment between technological programs at the secondary school level and apprenticeships has been identified as one challenge by respondents both at the secondary and at the collegial levels. In addition, some secondary teachers report having insufficient knowledge of the apprenticeship system. Apprenticeship placements can be scarce, especially when they are only available when the spaces are not required by adults. As was the case for cooperative education, transportation was often cited as a problem and more support was being requested. Alternative Education programs A gap in some necessary ingredients were noted on several occasions, notably with regards to classroom and electronic resource materials that are not always suitable for independent learning as well as a lack of physical space to house the programs. In some cases, access to student support staff such as child and youth workers, social workers, and guidance was identified as challenges. Renewal of technological education The population identified for the renewal of technological education is extensive and expands to Grade 7 and 8 students in some cases. Many creative instances of collaborations between schools from the same board, from different boards, and with

Stage 2: Findings
______________ September 2008 72
industry partners to obtain and share facilities and equipment were noted. In many cases, however, resources and software were reported to be insufficient or outdated and schools with declining enrolments face challenges to build facilities under their capital programs. One major gap identified in many instances was with the recruitment of skilled teachers from the trades. Destination Réussite The main gaps identified by respondents from French language schools and school boards were related to a lack of resources, materials, and community or business placements in French. In addition, some smaller schools that are distributed across large geographic areas (especially in South‐central and Northwestern Ontario) present program challenges due to low enrolments and transportation issues. Findings: Concluding Statements The qualitative data collected during this stage of the evaluation supports the conclusions that can be drawn from the analysis of the survey results. Because of the high degree of concordance among data sources, certain evaluations questions were addressed primarily by survey results when these were able to speak directly to these questions and when findings from the qualitative analysis did not contribute additional information that helped answer these questions. The evaluation team would like to stress however that, while there is broad agreement about many of the core principles and impacts of the SS/L18 Strategy across the province’s educational system, the qualitative data reveals that the practice of and results associated with the SS/L18 Strategy vary considerably across school boards and schools. For example, the quantitative and qualitative data sources both show clearly that specific core components such as Credit Recovery and Credit Rescue, cooperative education, and the existence of dedicated student success personnel are generally well known and implemented across the province.59 Yet the interviews and focus groups also revealed that how each component is understood and operationalized locally can differ markedly from one school board to another and even among schools that are part of the same school board. This poses a challenge to the Ministry as well as to individual schools in assessing which components are best at promoting student success, what circumstances
59 The coding team looked for specific evidence that specific components of the SS/L18 Strategy were known and being implemented in schools. The analysis shows that Credit Recovery and Credit Rescue, taken together, accounted for 20% of informant statements pertaining to component implementation. Also important were dedicated student success personnel (12% of coded statements), cooperative education (10%), professional development (10%), SHSMs (7%), as well as literacy and Grade 8 to 9 transition programs (both of which accounted for 6% of coded informant statements pertaining to implementations).

Stage 2: Findings
______________ September 2008 73
or conditions support or impede the effectiveness of these components, and what indicators can be used to reliably demonstrate the relevance of these components60. Furthermore, the data show quite clearly that unique local initiatives and programs established for the particular purpose of meeting local students’ needs were often just as important, among those working on the frontlines, to the promotion of student engagement and success as major core initiatives.61 Many examples were provided of such initiatives and programs, including the use of engagement coaches or mentors; financial assistance programs for poor students (through independent foundations); dedicated homework clubs; breakfast or meal programs; student success and leadership camps; mentoring programs for Aboriginal youth established in conjunction with community partners; childcare supports for parenting students; and others too numerous to name. The flexible and customizable nature of these programs appears essential to meeting local needs and to promoting student success, especially among at‐risk or high needs students. The challenge for schools, school boards, and the Ministry will be to develop means by which the effectiveness and relevance of such programs can be monitored to ensure that they continue to contribute to student success and to achieving the goals of the SS/L18 Strategy. What is perhaps most encouraging, and what is strongly supported by the data collected as part of this evaluation effort, is that the core messages and values associated with the SS/L18 Strategy appear to be well understood and increasingly accepted. The evidence amassed by the evaluation team suggests that the SS/L18 Strategy is understood as representing a significant culture shift that is associated with meeting the needs of all students, ensuring the success of all students, paying particular attention to the needs of low‐achieving or at‐risk students, and recognizing the importance of different educational pathways. This is further reflected in the frequency with which major goals of the SS/L18 Strategy such as supporting good outcomes for students, increasing graduation rates and decreasing drop‐out rates, building on students’ strengths, providing relevant learning opportunities, and supporting students through major transitions were mentioned by the informants.
60 Evidence in support of this conclusion is found in various descriptions of Credit Recovery and Credit Rescue, which reveal (a) significant overlap between these components with respect to their conceptualization and their implementation; (b) the use of local “admission criteria” for students to access these components which can vary considerably across schools, thereby making large‐scale comparisons difficult; and (c) occasional confusion between the focus and intent of each component. 61 Indeed, the evaluation team found that 15% of the informant statements about implementation could only be classified as pertaining to the miscellaneous category “other initiatives”. Examined in conjunction with the category “alternative programs”, which accounted for 5% of all informant statements, this suggests that the relevance of localized, highly customized program delivery options is perceived as a key factor supporting student success and engagement.

Stage 2: Findings
______________ September 2008 74
It is on the basis of this evidence and of the findings outlined elsewhere in this report that the evaluation team concludes that the SS/L18 Strategy appears to be achieving a number of its objectives. This evidence base and the findings related to specific evaluation questions also provide the basis upon which the evaluation team bases its recommendations regarding the ongoing implementation of the SS/L18 Strategy discussed in the next section of this report.
Conclusions and Recommendations
Conclusions and Recommendations
This report concludes with a discussion of the significant change process that has been initiated in the Ontario secondary school system and of how the key elements of the SS/L18 Strategy support the changing value structure underlying the change process. Recommendations are presented throughout when relevant and are highlighted in italics. It is noteworthy that the findings that emanated from the second stage of the evaluation were consistent with those that arose from the first stage. The preliminary conclusions drawn at end of Stage 1 were generally confirmed by the findings in Stage Two and are therefore incorporated in this concluding chapter as final conclusions and recommendations. The Change Process Taking Place in Ontario Secondary Schools Ontario has pursued a course of action that has encouraged much needed change in secondary schooling. The Premier and Ministers of Education have used their leadership positions to articulate broad outcomes for the changes: increasing graduation rates, ensuring higher levels of knowledge, and ensuring that students leaving school are prepared for the opportunities available to them. Government has given prominence to the individual and societal benefits of persistence and success in secondary schooling. And, although not without controversy, Government has also signalled to students, their parents and the surrounding community that it is prepared to use its legislative authority to make it more difficult for students to leave school prior to graduation. As an agent of change, Government has mobilized three important ingredients: social pressure for change, the articulation of the benefits of change, and penalties for the maintenance of the status quo. To facilitate the needed changes, Government has removed many of the principal barriers to change. First, and perhaps most important, the SS/L18 Strategy is predicated on respect for the persons responsible for carrying out the mission of Ontario’s secondary schools and for their professional judgement. Many school and school board informants made reference to the “[teaching] profession being valued again.” As evidence of the respect accorded to professionals, these informants pointed to the discretion accorded to teachers and administrators in developing approaches and initiatives, the encouragement to experiment and modify one’s approach if the experiment was unsuccessful in achieving the desired outcome, the ability to make and modify decisions, and the provision of resources in support of the plans developed and the decisions made. Many school and school board administrators interviewed expressed satisfaction with the flexibility embedded in the implementation

Conclusions and Recommendations
______________ September 2008 76
of many of the SS/L18 initiatives and expressed the wish that this flexibility to meet local needs be maintained. Government has also been strategic in allowing for the accommodation of alternatives where such alternatives are aligned with and capable of producing the desired outcomes. It has allowed experimentation, permitting people to practice, apply and assess the effectiveness of the change, and has encouraged the modification of practices that have not produced results or the abandonment of practices and initiatives that have proven unworthy of modification. The enthusiasm that the SS/L18 Strategy has engendered among professionals is palpable and infectious. The changes that have occurred and are continuing to occur in Ontario’s secondary schools would not have taken place if it were not obvious that Government respects the persons responsible for carrying out the mission of Ontario’s secondary schools and their professional judgement. Government has provided additional resources – both financial and human – to support the change process and the changes themselves, including resources for professional development. The professional development provided has been largely concentrated on SSLs, SSTs and principals. Particularly, professional development provided by the Ministry to SSLs and SSTs has been well‐received. There was enthusiasm from those directly involved with the SS/L18 Strategy for the board‐level professional learning opportunities as well. While the majority of the informants interviewed were appreciative of the professional development opportunities afforded to them and their colleagues62, there were some individuals who spoke of being “sick of being pulled away from their instructional responsibilities to attend a PD session,” or who said that professional development opportunities provided for the SS/L18 Strategy were mismatched with their responsibilities63. The field team also heard about the difficulty of taking up professional development opportunities in French settings where distances were great and supply teachers not available.
62 Our findings in this regard are consistent with those described in the Grade 8 to 9 Transition Planning Initiative Evaluation (Mueller, Bovaird, Tilleczek, & Feruson, 2007). The authors of the report state as part of their main findings that “SSL’s found the Ministry’s training sessions positive and that they provided clear guidance and training with regard to both deliverables and expectations regarding components.” (p.8) The current evaluation suggests that teachers who are not identified as having direct SS/L18 responsibilities had somewhat more mixed views of the professional development they had received. There were fewer opportunities for these teachers in general, and the professional development was of shorter duration. Some teachers urged that attention continue to be given to improving pedagogy and content within the subject discipline. 63 This represents the view of but a few, especially those who serve special needs populations.

Conclusions and Recommendations
______________ September 2008 77
Government has made significant investments in professional development and capacity building. Nonetheless, interviews, focus groups and surveys all reveal some distance between the leaders (directors, SSLs, Principals, SSTs and guidance counsellors) and the rest of the school staff. While many school staff members are enthusiastic about the focus on struggling students, they are often uncertain about the rules and policies, and the expectations regarding their own classroom practice. At the same time that they are being asked to accommodate the various learning needs of students in their classrooms, they feel that they are still expected to cover the curriculum expectations laid down by the Ministry within the 110 hour credit unit. To date, the professional development opportunities have been focussed upon SSLs, SSTs, and school‐based administrators. The SS/L18 Strategy is gaining momentum with the classroom teachers who shoulder the day‐to‐day instructional responsibility for students. Further momentum may be achieved by engaging classroom teachers in Grades 7 to 12 in active, collaborative professional activity and learning related to the objectives of the new secondary school system. Critical to the success of programs like Credit Recovery and Credit Rescue, and to enabling students to move between program types, is the identification of what learning (knowledge, skills and attitudes) is necessary for success in each course, and how each course relates to others in the same subject with different destinations, or in successive years. This core of essential content provides the foundation from which the individual teacher can make appropriate professional judgments about what content must be addressed and to what level of mastery, and what is optional. Engaging teachers in every school and in every discipline in working to develop a common set of understandings of the essential content to improve learning and teaching, would be a powerful force for the building of shared practice, experience, and values. Although resources have been provided to schools and school boards to implement the SS/L18 Strategy, declining enrolment poses another obstacle to the accomplishment of its goals. As the number of students in any given school or school board declines, resources also decline. Because the decline in student numbers is not uniform (i.e. occurring in class lots), it is often as costly to educate a smaller number of students as it is a larger number. Having fewer students also reduces the number of courses that can be offered. Declining enrolment also increases competition among schools and among school boards to retain and attract students, which, in turn, diminishes collaboration. Few Ontario school boards visited during this evaluation are sharing resources and facilities, enabling them to aggregate sufficient students for specialized programs. Ensuring the

Conclusions and Recommendations
______________ September 2008 78
efficient use of available resources through collaboration among schools and boards is desirable and should be encouraged. Declining enrolment pressures, however, may diminish such collaboration – especially in those instances where employee groups believe that their jobs are at risk. In order to offer the range of options that will attract, retain and prepare students for secondary school success, it will be necessary to maintain current expenditure levels even in the face of declining enrolment. This is particularly true in situations where success depends upon smaller teacher to student ratios as is the case in some alternative programs – especially ones that are designed to engage disaffected youth 16 and 17 years of age or teen mothers. Cognizant that no change of any consequence can be implemented without the concurrence of those responsible for making the changes, Government has encouraged involvement in the change process. There is widespread engagement in the change process. Collective discussion of the issues has been encouraged and group problem solving fostered in many schools. Opinion leaders and social networks have been mobilized in support of the change process. Field visit informants expressed concern about the pace of the changes occurring and the number of initiatives being pursued. Many said, “we want to do this well and it takes time to do well.” The emotional and intellectual demands upon education professionals – especially SSTs and SSLs – are significant. Quite a few professionals talked about the potential for ‘burn out.’64 It was opined that there would be significant turn over among SSTs in the coming years. An SST said, “I’ve been doing this [job] for three years. I love it, but I can’t keep up the pace.” These and other similar comments indicate that the Ministry will need to consider and provide guidance to school boards on succession planning for SSTs and SSLs. It was also opined that the SS/L18 Strategy has intensified the work of teachers, setting the stage for workload issues to arise during the collective bargaining process. In addition, many expressed the need for support from specially trained professionals such as youth workers, social workers, and psychologists to help address the needs of many students identified as at‐risk.
64 Note that this finding was also highlighted in the recent report Beacons to Becoming: A Qualitative Research Study of Learning to 18 Lighthouse and Rural Schools Lighthouse Projects (Wideman & Shileds, 2007). In their report, the authors identify workload issues and burnout as a challenge to the success of SS/L18 Lighthouse projects: “Teacher burnout was also identified as an issue in several projects, and it was perceived that there was an increased strain on project teachers because of the range of programs and student needs they were addressing.” (p.53)

Conclusions and Recommendations
______________ September 2008 79
The demands of the SS/L18 Strategy include a significant administrative burden. Although they were cognizant that an undertaking as complex and multi‐dimensional as this initiative requires monitoring and reporting, respondents said that these activities are time consuming. Some respondents also complained about “money bombs” – announcements of available funding that required application on short notice and often late in the school year. These announcements were often not aligned with the school and school board planning schedules, creating problems with allocating staff and resources appropriately. It is rarely the case that administrative structures are able to keep pace with changes during the early stages of a process as complex and multi‐faceted as the SS/L18 Strategy. Over time, however, one would expect administrative structures and processes to catch up and become regularized so that such matters can be addressed with as little effort as possible. OnSIS – which is also in its infancy – will, in time, help to reduce the administrative burden of providing data to the Ministry that some have associated with the SS/L18 Strategy. A number of obstacles stand in the way of the effective use of data. There are, of course, the challenges of data collection and verification. Equally important are the challenges affecting the use of data. According to the interview, focus group, and survey data, those who might use data to inform their decisions often do not know how to do so. There is a significant need to further develop capacity for using data to inform decision‐making. But, even in those instances where such capacity exists, the opportunities for making use of the information are often limited. For example, there is too little time for school staffs to interpret the information pertinent to their setting and to consider how the information might be used to inform their decisions about policy and practice at the school level. These are issues of which the Ministry is aware and ones that the Ministry has begun to address. Based on the information gathered throughout the evaluation process, the evaluation team considers that the Ministry is on the right track, but will need to significantly augment its efforts at capacity building and make provision for collaborative discussion among staff members if data‐informed decision‐making is to figure prominently in the SS/L18 initiative – which it should. The SS/L18 Strategy depends upon collaboration. Support for students facing the challenge of secondary schooling requires cooperation among the many educational professionals with whom the student interacts. Cooperative education placements require collaboration between school personnel and employers. Smoothing the transitions from secondary to post secondary studies requires coordination among personnel working in both systems. The success of 16 and 17 year olds returning to school will depend upon the communication and synchronization among a variety of professionals who are employed by different agencies, including teachers, psychologists,

Conclusions and Recommendations
______________ September 2008 80
guidance counsellors, child and youth workers, social workers, and sometimes even law enforcement personnel. The collaboration required is extensive and unprecedented. For that reason, the Ministry must play a leadership role in bringing representatives of the relevant parties together to identify the challenges that such collaboration entails and to suggest mechanisms for facilitating such collaboration wherever it is required.65 It is inevitable that communication will figure as an issue in large, complex systems. Based on data from the interview, focus groups, and online surveys, everyone concerned with the SS/L18 Strategy wants more information. Schools seek more information from school boards about the decisions to allocate the resources for the SS/L18 Strategy. Teaching staff not directly affected to the SS/L18 Strategy want more information about the initiatives.66 There were schools where the SS/L18 Strategy was seen as something “new” that was the responsibility of the SST and Student Success Team. In other schools, the entire staff was involved and committed and saw themselves as an integral part of the effort. The variation can be attributed at least in part to the degree to which the staff as a whole has been involved in discussing the reasons for, and means of achieving changes being made. The first challenge is the need for the architects of the SS/L18 Strategy to communicate more effectively with those ensuring the daily implementation of the Strategy to clarify lingering misconceptions and to provide the tools necessary to alter practices in a way that reflects the central values and goals of the Strategy. Parents and students want more information about the range of options available. While communication is a complex phenomenon that depends on a wide range of factors including the intentions and dispositions of the individuals involved, it is essential to identify the more effective vehicles of communicating information that the various audiences seek. This might productively begin with an enumeration of the better means of communicating with students and their parents about opportunities that schools provide. Where communication efforts were personal and face‐to‐face, there seemed to be much greater impact, according to the field reports. The evidence reviewed by the evaluation team confirms that scale or size of schools and school boards poses a challenge for change. Communication challenges increase with
65 The evaluation team notes that the development of the Student Support Leadership Initiative by the Ministries of Education and Children and Youth Services is a step in the right direction. See Policy and Program Memorandum (PPM): Student Support Leadership Initiative, February 6, 2008. 66 In one focus group, the teachers who were not identified as having direct SS/L18 responsibilities could not even name a single person on the Student Success Team and had very little knowledge about the components of the SS/L18 Strategy. In several schools, teachers who were not part of the Student Success Team expressed the desire to attend more SS/L18‐related professional development to learn more about the Strategy.

Conclusions and Recommendations
______________ September 2008 81
the size and diversity of the audience. The strategic considerations involved in communicating to large, heterogeneous audiences are different than those that apply to small, relatively homogeneous audiences. The survey data collected by the evaluation team indicates that students in large secondary schools tend to be less aware of the Strategy and of its components than those in smaller schools. The evaluation team suggests that additional attention be devoted to ensuring that messages about SS/L18 reach all secondary school students, especially in larger schools. Because, communication directed toward specific audiences is more effective than communication directed at a general audience, the tailoring of messages to specific sub‐groups within secondary schools might prove more effective than broadcasting messages to the entire population. Thus, communication to interest and grade level groupings of students might be more effective than general announcements to the entire student body. Communicating a message among 200 staff members is more difficult than communicating the same message among 40 staff members. Focussed communication is recommended. For example, identifying ways that secondary teachers of mathematics can support the success of learners might prove more successful than identifying ways that teachers, in general, can support the success of learners. In a similar vein, communication in boards that have many secondary schools will be more complex than in boards that have relatively few secondary schools. If the schools in the larger boards are differentiated in terms of their programs and student populations, communication will be more challenging than it would be in boards with few schools offering similar programs to similar student bodies. A number of respondents recommended that the Ministry highlight what appear to be exemplary programs and practices, providing descriptions that others consider useful in considering the implementation of those programs.67 The Changing Value Structure for Ontario Secondary Schooling Fundamentally, the SS/L18 Strategy is about rethinking the traditional model for secondary education in Ontario. It involves changes in goals and assumptions, the 67 The Ministry has developed a website (http://community.elearningontario.ca) addressing this particular issue. Although this website is currently accessible only to Student Success Teams it contains potentially useful information for all educators. Another potentially useful resource produced by the Ministry is a series of DVDs (Student Success Grades 7‐12: Promising Practices, Volume 1) following province‐wide symposia with SSLs in January 2007. Each contains short clips of best practices, but it is unclear how widely these DVDs were distributed or used.

Conclusions and Recommendations
______________ September 2008 82
organization and delivery of learning, and in the culture of the secondary school. Under the new model, schools take a more active role in engaging the learning, and in enabling the learner to overcome barriers to success. The needs and aspirations of the student are central, not secondary. The role of the teacher is expanding to include attention to different ways of learning and accommodating students who learn at different rates. Teachers are being asked to consider the student as whole person, who may have a job, be part of a family and face personal challenges outside of school, in addition to being enrolled in a set of courses. Students, some of whom might have looked forward to leaving school before graduation, must now legally remain enrolled until the completion of the OSSD or attaining the age of 18. This is a change in the entire culture of the secondary school system, which was traditionally viewed as a place of preparation primarily for university. The evaluation team encountered three related conceptualizations of the SS/L18 Strategy: (1) as a place/program (e.g. alternative programs, apprenticeship, cooperative education, Credit Recovery) to which students are referred for assistance; (2) as a person (e.g. the SST, a social services worker) to whom a student is referred for help; and (3) as a philosophical stance toward students – namely, ensuring the success of all students and the valuing of all destinations and pathways. One commentator characterized the SS/L18 Strategy succinctly as “necessary for some, good for all.” The field team heard repeatedly about students receiving one‐to‐one attention from and feeling cared for by their teachers and, in schools imbued by the philosophy of SS/L18, about the staff members taking collective responsibility for the education and well‐being of students. This latter characterization was frequently accompanied by references to a “changed mandate for secondary schools” in which “all students are a priority.” Many respondents indicated that the SS/L18 Strategy was itself undergoing a change from a response to students who were failing to a proactive approach to prevent failure. Acknowledging that there is some overlap among the various initiatives pursued and among the values that characterize the SS/L18 Strategy (as described on p. 2), the evaluation team has attempted to locate each of the major initiatives in relation to the value with which the team believes it is most closely aligned. Provided below is a discussion of the results of the evaluation in relation to each of these core values. Schools should equip students with the skills they will need as lifelong learners. The SS/L18 Strategy puts emphasis on ensuring that students possess sufficient knowledge of reading, writing and numeracy to pursue the post‐secondary work and learning opportunities that are of interest to them. Many teachers who were interviewed reported participating in professional development focused on promoting

Conclusions and Recommendations
______________ September 2008 83
literacy skills in all subjects. Moreover, many instances of OSSLT preparation activities and of lunch or after school programs to help students gain numeracy and literacy skills were described by informants during school visits. Schools that offer continuous intake, Credit Rescue and alternative programs provide opportunities for students who are failing behind or who have been out of school to re‐engage in their learning regardless of the normal school calendar’s stop and start points. Schools should accord equal respect to post‐secondary destinations, including immediate post secondary employment, apprenticeship and other forms of training, college study, and university attendance. As a consequence of a variety of factors, secondary schooling has traditionally appeared to focus on the preparation of students who plan to attend universities rather than the students who intend to pursue other post secondary destinations such as work or apprenticeships and other forms of post secondary training. The SS/L18 Strategy has sought to accord equal respect to post‐secondary destinations, including immediate post secondary employment, apprenticeship and other forms of training, college study, and university attendance. According to many respondents, “the mandate of secondary schools has changed: all students are a priority, not simply those who are planning to go to university.” One of the barriers faced by students who may have encountered difficulty in school is the timetabling process that has traditionally favoured university‐bound students. To remove the obstacle that course selection sometimes plays for students facing academic challenges, some schools give priority to those students in the process of course selection in an attempt to ensure that they can obtain the courses they need. Schools are providing students with a greater number of program and course options targeted at providing skills preparing students for pathways other than university. Such programs include SHSMs, and expanded cooperative education and apprenticeships, as well as increased offerings of college and workplace courses in the secondary school. Moreover, considerable attention has been given at the local level to informing students and parents of the range of course choices and pathways available. SSLs and school informants in the field visits identified that many parents are reluctant to have their children choose locally developed or applied courses because of a concern that this will close doors to other choices in the future. While many schools and school board are holding information sessions to promote interest in non‐university pathways, especially college and the skilled trades, there also appears to be some confusion among students and parents about the secondary school program requirements for entry to college programs, the skilled trades and apprenticeships. Some college informants expressed concern that students were arriving at college without appropriate mathematical or communications skills for their chosen fields.

Conclusions and Recommendations
______________ September 2008 84
Streaming of students according to perceived ability was a long established practice in Ontario that was abandoned in the 1990s. The secondary school program introduced in 1999 was built on destinations: workplace, college, university and apprenticeships. The document outlining the diploma requirements and the structure of the new secondary program (Ontario Secondary Schools, Grades 9 to 12)68 suggested that transfer courses would be available to enable students to bridge from one destination to another without having to start over again. These courses were envisioned to function in a similar manner to the principle of Credit Recovery: identify the learning essential to the desired program that is missing, and fill the gaps. Although Credit Recovery is in place in virtually all schools, the availability of transfer courses was rarely if ever mentioned in the field interviews and focus groups. The concept of student success includes the notion that a student’s goals and aspirations may change over the course of secondary school, and that the student may need to acquire additional skills and knowledge to meet those goals. Appropriate bridging mechanisms available between courses and programs with different designations (locally developed, applied, academic, open, college, university, workplace) help persuade parents and students to choose courses appropriate to an individual’s present skills and interests in order to maintain engagement. It is of the view of the evaluation team that student transitions would be enabled if there was a focus to engage subject teachers in the mapping of essential content across courses (locally developed to applied, applied to academic, workplace to college, etc.) and in the identification of what essential content must be completed to enable students to move successfully between destinations or designations. Schools should provide students with opportunities to explore the connections between what they learn in school and future employment or study. The SS/L18 Strategy provides a wide range of opportunities for students to explore the connections between what they learn in school and what future employment or study, including apprenticeship programs, cooperative learning opportunities in community work sites, focussed studies (e.g., SHSMs), and the chance to earn credits at both the secondary and post secondary school levels (e.g., Dual Credit programs). A number of teacher respondents flagged the necessity of hands‐on and applied learning opportunities in Grades 7 and 8 to engage students in their learning. Expanding the range of opportunities for students is sometimes difficult where student numbers are modest. Schools and school boards are strongly encouraged to work cooperatively with neighbouring schools and boards to ensure that students have the
68 Document available at: http://www.edu.gov.on.ca/eng/document/curricul/secondary/oss/oss.html

Conclusions and Recommendations
______________ September 2008 85
widest range of opportunities that can be provided – given student numbers and resources. Schools should credit student accomplishments and build upon those accomplishments to help students overcome barriers to further mastery. In most jurisdictions, students who have not successfully completed a course of study are either required to re‐enrol in the course during summer school or in a subsequent term or year, or to enrol in an alternative course that, if successfully completed, would fulfil a credit or diploma requirement. It is rarely the case, however, that students have been completely unsuccessful in a course by failing to master each and every outcome. More typically, students have achieved some outcomes and failed to achieve others – either because they have not been assiduous in pursuing each outcome or because they lack requisite ability to achieve the outcome. In recognition of this, secondary schools are encouraged to credit students with what they have accomplished and allow them to address those aspects of a course of study that they have failed to master sufficiently well to earn full credit (i.e., Credit Recovery programs) and to intervene with students who are exhibiting achieving an outcome before the student fails (i.e., Credit Rescue programs). Credit Recovery was the most widely recognized tool mentioned by teachers and principals during the interviews and focus groups. The majority recognized the wisdom and benefits of allowing students to demonstrate competence in material that previously defeated them without requiring the students to repeat the entire course. A comparatively small number of teachers wondered whether the practice would encourage students to take their studies less seriously than if the penalty was course repetition. For the teachers raising the topic, the central issue seemed to be ambiguity about the definition of Credit Recovery and inconsistency in its application. In the first instance, teachers wondered how much of a course could a student fail and still be afforded the opportunity to recover the course credits. In the latter case, teachers believed that inconsistencies in the application of Credit Recovery would undermine standards and create inequalities. Credit Recovery was also a source of tension between SSTs and their colleagues on the Student Success Team and the teachers in whose classes the failing students were enrolled. Credit Recovery appeared most successful where its meaning and application were discussed by the school’s entire staff and less well where the meaning and application were determined idiosyncratically or by administrative declaration. Credit Recovery as a policy is a major change in the operational culture of secondary schools that results in increased scrutiny of teaching and assessment practices and as one that in some applications generates significant extra work for the original classroom

Conclusions and Recommendations
______________ September 2008 86
teacher. In 2006, based on recommendations from the Student Success Commission69, the Ministry released a set of guiding principles intended to provide a consistent framework for all Credit Recovery programs throughout the province.70,71 Yet, the interview and focus group data indicates that wide variations among schools remain in their approaches to practices such as Credit Recovery, which raises issues about standards and fairness across schools. In some schools, students who have failed and, then, passed an examination on a second attempt are awarded the mark they earned on their second attempt. In other schools, the student is awarded a low passing grade (51%) to signal that s/he has passed a course in a subsequent attempt.72 The evaluation team considers that matters such as this are best left to the collective judgment of teachers, and recommends that the Ministry continue to hold consultations with key stakeholders, such as teachers, to ensure that the set of guiding principles for Credit Recovery is adhered to throughout the province and to ensure that standards and fairness are maintained. Moreover, school boards should closely monitor the implementation of practices such as Credit Recovery and Credit Rescue to ensure that, in the course of providing students with additional opportunities to demonstrate achievement, standards are being maintained.73 The SS/L18 Strategy is no different from other strategies in which language has both denotative and connotative meaning. The evaluation team observed confusion and concern about the meaning of the expression “failure is not an option.” For some, the phrase implied that educators would do everything in their power to ensure that students were successful. Others expressed concern that standards would be lowered to ensure that all students earned graduation. Some informants said that they felt compelled to accept student work – even when such work was handed in long after
69 The Student Success Commission first convened in March 2006 and is composed of members of school board management and all four teachers’ federations. 70 Levin, B. (June 28, 2006). Memorandum: Credit Recovery 71 Durst, S., Parker, K., & Plourde, G. (December 13, 2006). Memorandum: Credit Recovery Implementation – Template and Process 72 Other differences in approaches to Credit Recovery include: (1) In some schools, credit recovery‐like initiatives where implemented long before the SS/L18 Strategy and are now focusing on Credit Rescue programs; (2) In some schools, Credit Recovery is only open to Grade 9 and 10 students, in other it open to all students; (3) In some schools, students must have a minimum grade to participate (such as 35% or 40%), in other there is no minimum required; and (4) In some school minimum attendance in the failed course is required, whereas in others it is not. 73 A useful definition for success in credit recovery or rescue in courses that are key building blocks (e.g. Grade 9 or 10 math) might be that the student has achieved the learning necessary for success in the next course in the discipline. Such a standard would ensure that the student has the capacity to succeed in the subsequent course.

Conclusions and Recommendations
______________ September 2008 87
others had completed the assignment. These informants wondered whether such a practice gave students an inaccurate message about meeting commitments in a timely fashion. To the evaluation team, these issues point to a tension between supporting and encouraging students to persist in their studies, on the one hand, and helping them to acquire dispositions that will serve them well after they complete secondary school. Informants at the college level said that some of the students entering colleges were unable to meet the demands of the new setting because they had acquired poor work habits such as handing work in late. The SS/L18 strategy would benefit from attention to language. Phrases such as “four –year program,” “failure is not an option,” “16 by 16” are convenient short‐hand among people familiar with both the denotative and connotative meanings intended. For audiences unfamiliar with the intended denotative and connotative meanings or audiences that wish to intentionally misconstrue intentions, however, these phrases can confuse or be used to confuse and undermine the Strategy. Schools should eliminate or minimize the difficulties that students face when they make a transition from one level to the next. Transitions within or between systems typically involve changes that pose challenges to those trying to make the transition and where those challenged are likely to fail or abandon the effort to make a successful move. In recognition of this, the Ministry has encouraged schools and school boards to eliminate or minimize the difficulties that students face when they make a transition from one level to the next such as the attention given to the transition between elementary and secondary schooling and between secondary schools and post‐secondary institutions. Schools should accommodate the different ways that students learn. Despite considerable variation among students in their preferred learning styles, secondary schools have traditionally given prominence to verbal and symbolic learning. While verbal and symbolic abilities are extremely important, many students require concrete, kinaesthetic experiences and the opportunity to work with others collaboratively to master material. Ontario’s secondary schools offer a variety of alternative programs tailored to the needs of particular sub‐groups of students. In some cases, however, the state of technological learning facilities is at best uneven. In areas where new schools are being built because of enrolment growth, some new facilities have been included. In a few boards, financial reserves have been used to upgrade facilities. In many boards, facilities lag far behind industry standards. These challenges are also having an impact on the kinds of facilities being installed – there seems to be an

Conclusions and Recommendations
______________ September 2008 88
emphasis in many boards on the programs that require the least expensive equipment, such as hospitality and tourism. More effective use of resources can be achieved by school boards when they are able to work cooperatively with neighbouring boards to ensure complementarity among program offerings across jurisdictions. Interviewers were told that there were structural and procedural barriers to success for vulnerable students. Seventy‐five minute periods were considered too lengthy for students who found it difficult to concentrate on a single topic for that period of time. Some schools have changed their timetables to accommodate shorter, more frequent periods of instruction. In schools that had not adopted a timetable with shorter periods, teachers modified their classroom practices to provide more variety in both their instructions and in the activities planned for students. Differentiated instruction was a theme mentioned by some as a necessary ingredient in gaining and maintaining student attention and providing for student success. A few teachers and principals interviewed mentioned having received information (in some cases during professional development sessions) on differentiated instruction. Educators are looking to differentiated instruction as a means of addressing the diversity of learning needs students exhibit. They reason that students exhibiting different learning needs would benefit from, if not require, different instructional approaches. The evaluation team notes that the interest in differentiated instruction seen during the interviews and focus groups, as well as the current research on such teaching practices (e.g., Jobin, 2007; Ross, Ford, & Xu, 2006) calls for a careful examination of its use. The Ministry is in the early stages of introducing the Differentiated Instruction Professional Learning Strategy to Grade 7 and 8 educators, nested within a larger focus on effective instruction, assessment and evaluation and plans to monitor and evaluate the strategy as it develops further. Schools should actively engage students and enable them to persist in school despite the challenges the individual student may face. For much of its history, secondary schooling in Ontario and elsewhere in Canada was traditionally treated as if it were an opportunity that students could either take or leave as they wished. Over the course of the last quarter century, it became increasingly obvious to many jurisdictions that such an attitude toward secondary schooling was not serving the students, the families, or the larger community. Students who decided to leave secondary schools prior to graduation found it more difficult to obtain employment, were employed more intermittently, contributed less in taxes and consumed more social, health, and justice‐related services than those who completed secondary school. Ontario, like other Canadian jurisdictions, sees graduation from

Conclusions and Recommendations
______________ September 2008 89
secondary school as a necessary, but insufficient, milestone in the integration of the young into the larger social fabric as contributing members of society. Other ingredients include the acquisition of the knowledge needed to become lifelong learners, and a sense of having accomplished something–rather than endured something–in school. Cognizant that the acquisition of knowledge and the attainment of graduation are not the only important outcomes of secondary schooling, the Ontario government seeks to communicate to all students that they are valued human beings whose engagement in school and the wider community is essential for Canada’s social and economic well‐being. This is most evident in the desire to retain students in school until graduation and attract back to secondary schools those students who have left prior to graduation.74 Although it is unclear whether he was referring to secondary schooling, the humorist, Woody Allen, once quipped that “eighty percent of success is showing up.” In secondary schools, irregular student attendance is often cited as a major challenge and is almost certainly a prelude to failure for many students. For example, issues with attendance were identified as a risk factor for early school leavers in the final report prepared by Ferguson and his colleagues investigating student disengagement in secondary school (Ferguson et al., 2005). The once common and paradoxical approach to students with poor attendance in some secondary schools of suspending the errant students is increasingly labelled “stupid.” In its place, schools have implemented “attendance teams” and “engagement coaches” ‐ teachers and sometimes child and youth workers who attempt to engage students who find regular school attendance difficult to maintain. For some students, employment and family responsibilities create particular attendance challenges. Recognition by school personnel of these challenges, and accommodation in the student’s timetable can sometimes enable students to remain actively engaged in school, even if on a part‐time basis. The field team learned of a variety of innovative approaches to maintaining the engagement of students and re‐engaging those who had left school prior to graduation. In one jurisdiction, for example, a team of teachers persuaded the local Tim Horton’s to place a notice in the pay‐envelope of all employees inviting persons who had not completed their secondary schooling to contact the school to arrange a program that would enable them to earn a high school diploma. Some attendance problems are structural and likely beyond the ability of schools to address on their own such as the poor intersection of the school’s timetable with public
74 Programs used to engage or re‐engage students include alternative or off‐site programs, Cooperative Education, Dual Credit programs, Credit Recovery, and SHSMs. Of course, one role of the Student Success Team is to ensure that at‐risk students are engaged.

Conclusions and Recommendations
______________ September 2008 90
transportation schedules and the cost of transportation associated with attending specialized programs outside of the local school’s attendance area. Curriculum compression and the challenge of coverage are two facets of the curriculum that pose obstacles to the accomplishment of the goals of SS/L18. One consequence of the elimination of Grade 13 in Ontario was that the time available for students to explore their interests and talents through course work and extra‐curricular activity was reduced. While true for all students, the obstacles for Catholic and French students are greater as the former must typically enrol in religious instruction and the latter in English. For students who are sometimes referred to as “at‐risk” of not successfully completing a secondary school program, the challenge is often great. The intensification of the secondary school experience is further compounded by the pressure that many teachers feel to ensure that they address the many objectives included in the curricula for which they are responsible: there is simply too much to be taught and too little latitude for teachers to exercise individual judgment about the content of instruction. While the evaluation team has no ready remedy for the problem of curriculum compression, it is suggested that, as part of its curriculum revision process, the Ministry engage educators in identifying as core those objectives that must be mastered in order for a student to succeed in subsequent course work, and refashioning the curriculum around the core objectives.
Students today often require more time to complete the requirements of a program leading to graduation than the years typically associated with the program. There are many reasons why students require more time to achieve graduation. Some students whose families depend upon the income the students earn from out‐of‐school employment need extra time to achieve an appropriate balance between work and school. Older students who have returned to school will likely take more time to complete the program requirements leading to graduation than students whose attendance has been continuous and unproblematic. Some jurisdictions limit support to older students to whom funding entitlement does not extend. This, of course, would be a disincentive to the engagement and education of such students. The evaluation team encourages the Ministry to examine ways to ensure that there are no financial or other disincentives to ensuring that students stay in school until graduation.
[T]he teacher needs to have a lot of flexibility in where they’re going [with students at‐risk]. So in other words, the curriculum can’t constrain the teacher. And all the curriculum documents that indicate spending this amount of time on a particular unit, that should not be the case with a lot of these types of courses. Because if you find the kids have an interest, you need to go with that interest and you need to spend maybe a much, much longer time just on that one activity.
‐ Teacher not designated as SST

Conclusions and Recommendations
______________ September 2008 91
Reengagement of students who have left school has posed some challenges for Ontario’s secondary schools by re‐engaging students with mental health challenges and records of aberrant behaviour. Many respondents, especially teachers and principals, identified concerns about the tracking required for the 16‐ and 17‐year‐olds who, given the new Learning to 18 legislation, are now obliged to attend. A number of respondents observed that secondary schools are not well equipped to address the needs of disaffected and challenged youth unaccustomed to being in school and accommodating themselves to the demands of timetables and complex social systems. Some respondents wondered whether the successes achieved by the SS/L18 Strategy would be contaminated by these challenges. Among the concerns expressed were students returning to school to sell drugs or engage in other anti‐social practices such a bullying. The data collected during this evaluation suggests that the retention and re‐engagement of 16 and 17 year olds will require more attention than they have received to date. Additional resources, supports, and complementary social policies will be required concerning issues such as substance abuse and anger management that at present are beyond the jurisdiction of schools to provide. The reintegration of students will require that schools explicitly plan for the reintegration of students and carefully monitor the consequences of such reintegration on the individual student, the student’s peers, and on the school environment. Benchmarking the Change Process As previously noted, the evaluation team observes that the difference between seeing the SS/L18 Strategy as a place, program or person – on the one hand – and as a philosophical stance or an orientation toward students is more than semantic. Ensuring the success of all students implies acceptance of personal responsibility for the educational welfare of all students in distinction to attributing responsibility for student educational welfare to others or to some programmatic approach. Working to ensure acceptance of the SS/L18 Strategy as a philosophical stance is the appropriate long‐term objective, signifying a desirable cultural change among Ontario’s secondary schools. The Ministry has established twelve indicators75 by which progress toward the goals of the SS/L18 Strategy might be judged. While useful for calling attention to specific facets of the Strategy, they are less helpful in gauging the depth and the permanence of the aforementioned cultural change among Ontario’s secondary schools. The evaluation
75 The indicators include: credit accumulation in Grades 9 and 10, compulsory credit pass rates in Grades 9 and 10, literacy success rate, workplace credit offerings ni Grades 11 and 12, college credit offerings in Grades 11 and 12, locally developed course offerings, coop related course offerings, annual school leaver rate, Grade 7 and 8 students at risk, mark distribution, French‐language student retention rate in Grade 7 to 12, and French‐language at‐risk student transfer rate.

Conclusions and Recommendations
______________ September 2008 92
team considers that it is useful to conceptualize stages in acceptance of change that observers and participants might use to determine where each school is in the process. There is a variety of choices one might make in this regard, but the evaluation team suggests that the following stages may prove to be helpful distinctions:
1. The belief that no change is required or that change is not possible; 2. Acceptance of the need for change; 3. Planning for change is underway; 4. Implementation of planned changes is underway; 5. Implemented changes are being monitored; 6. Adjustments to the implemented changes are being made as a consequence of
the monitoring process; and 7. Changes are consistently producing the desired outcomes for students.
These stages or others similar to these can be arrayed along a vertical axis and each school and school board can be located at a point along that axis, depending upon the evidence of its location. Benchmarking the process in this, or in another similar way will help determine the level of diffusion and implementation of the changes associated with the SS/L18 Strategy. Producing Stable School Effects is a Long‐Term Challenge In addition to the immaturity of the SS/L18 Strategy itself, the production of stable school effects is elusive. While there is ample evidence of progress of the SS/L18 Strategy, one would not expect any school to be able to have implemented and refined changes to the point where they are capable of producing the desired student outcomes on a consistent basis. Nonetheless, it is the development in all Ontario secondary schools of a culture dedicated to producing consistent, positive outcomes for all students to which the SS/L18 Strategy is dedicated. To become wide‐spread and permanent, the changes underway in Ontario’s secondary schools will require the active support of everyone in the system. Elsewhere in this report, the evaluation team noted the important contribution to SS/L18 of visible champions such as government, the Ministry of Education, and dedicated staff members such as Student Success Leaders and Teachers. Their efforts will not be sufficient to ensure the spread and permanence of the changes occurring. Everyone involved in Ontario’s school system must become engaged, including school trustees, directors and superintendents, principals, teachers and support staff. Because success is achieved one student at a time, ensuring success for all students must become the paramount goal of everyone involved in education in Ontario.
Conclusions and Recommendations
______________ September 2008 93
I’d like to say that I think it is probably the most exciting initiative that I’ve seen come from the Ministry. I’m absolutely thrilled first of all that you’re here and that you’re asking the students, the parents, the teachers, and myself about it. I think that it’s a wonderful initiative.
‐ Principal
Concluding Observations Overall, the SS/L18 Strategy has garnered an enthusiastic response from all parties. While there are reservations about some features among some audiences, the dominant reaction is enthusiasm and optimism. Parents of students who have faced challenges report that their children have renewed interest in coming to school.
Teachers and administrators who once looked forward to retirement have been reinvigorated and are planning to continue teaching. Students who endured their school experiences as they might a prison sentence and students who have failed in school are experiencing success in opportunities that were previously unattainable. While there are elements that participants did not like or about which participants expressed concern, the overwhelming response of the majority of participants was that the SS/L18 Strategy was improving the learning conditions for, and the success of, secondary students in
Ontario. It was averred that increasing students’ school success has a ripple effect, improving their success outside of school as well in, for example, increasing the likelihood of post school employment and diminishing the likelihood that successful students will become involved in the criminal justice system. These are, of course, empirical assertions that deserve to be investigated as the SS/ L18 Strategy matures over time. The majority of respondents either implicitly or explicitly attributed the success of the SS/L18 Strategy to “teachers who care.” The predominant view – expressed by almost everyone, including those with reservations about specific elements – was that it should continue for the benefit of Ontario’s secondary students and for the citizens of Ontario. Essential to the success of this or any other such initiative is the cultivation and maintenance of respect and support for the professionals who carry out the considerable work that such initiatives require.

References
References
Berg, B. L. (2007). Qualitative research methods for the social sciences, fourth edition.
Toronto: Allyn and Bacon. Creswell, J.W. (2005). Educational Research: Planning, conducting, and evaluating
quantitative and qualitative research. Upper Saddle River, NJ: Pearson Education, Inc.
Ferguson, B., Tilleczek, K., Boydell, K., Rummens, J. A., Cote, D., & Roth‐Edney, D. (2005). Early School Leavers: Understanding the Lived Reality of Student Disengagement from Secondary School. Final report submitted by Community Health Systems Resource Group and The Hospital for Sick Children to the Ontario Ministry of Education, May 30, 2005. http://www.edu.gov.on.ca/eng/parents/schoollevers.pdf
Gauthier, C. (2005). Education research and reforms in education: Weaving connections. Education Canada, Winter 2005/2006. http://www.cea‐ace.ca/media/en/Gauthier.pdf
Institut Franco‐Ontarien, Université Laurentienne (2005). Le décrochage au secondaire en Ontario français. Final report submitted to the Ontario Ministry of Education, October 2005. http://www.edu.gov.on.ca/fre/parents/schoolleaversf.pdf
Jobin, V. (2007). Pédagogie différenciée : Nature, évolution et analyse des études ayant pour objet les effets de cette pratique pédagogique sur la réussite des élèves. Unpublished master’s thesis, Université Laval, Québec, Québec.
King, (2002). Double Cohort Study: Phase 2 Report for the Ontario Ministry of Education, http://www.edu.gov.on.ca/eng/document/reports/cohortph2.pdf
King, (October, 2003). Double Cohort Study: Phase 3 Report for the Ontario Ministry of Education, http://www.edu.gov.on.ca/eng/document/reports/phase3/report3.pdf
King, A. J. C., Warren, W. K., Boyer, J. C., & Chin, P. (2004). Double Cohort Study: Phase 4 Report Submitted to the Ontario Ministry of Education, 2005. http://www.edu.gov.on.ca/eng/policyfunding/reports.html.
Marshall, M. N. (1996). Sampling for qualitative research. Family Practice, 13(6), 522‐525.
Mueller, M.P., Bovaird, S., Tilleczek, K., & Ferguson, B. (2007). Grade 8 to 9 Transition Planning Initiative Planning Evaluation. Report submitted to the Ontario Ministry of Education, October 2007.
Popham, W. J. (1971). An Evaluation Guidebook. A Set of Practical Guidelines for the Educational Evaluator. Bureau of Indian Affairs (Dept. of Interior), Washington, DC, 129 pages.
Ross, J. A., Ford, J., Xu, Y. (2006). Programming, Remediation and Intervention for Students in Mathematics: Kawartha Pine Ridge DSB PRISM Project Final Report.

References
______________ September 2008 95
Report submitted to the Ontario Ministry of Education, May, 2006. http://www.edu.gov.on.ca/eng/studentsuccess/lms/files/prism/PRISMreportKPR.pdf
Stake, R. E. (1972). An approach to the evaluation of instructional programs. Paper presented at the annual meeting of the American Educational Research Association (Chicago, Illinois, April 1972).
Stufflebeam, D.L. (2000). The CIPP model for evaluation. In: Stufflebeam, D.L., Madaus, G.F., Kellaghan, T. (ed.): Evaluation Models: Viewpoints on educational and human services evaluation (2nd ed.) (pp. 279‐317). Boston, MA: Kluwer Academic.
Taylor, S. J. and Bogdan. R. (1998). Introduction to qualitative research methods: A guidebook and resource. New York: Wiley.
Wideman, R. & Shields, C. (2007). Beacons to Becoming: A Qualitative Research Study of Learning to 18 Lighthouse and Rural Schools Lighthouse Projects. Final report submitted by Curriculum Services Canada to the Ontario Ministry of Education, August 2007.

Appendix A: Stage 1 Interview and Focus Group Guides
______________ September 2008 96
Appendix A: Stage 1 Interview and Focus Group Guides
Interview Schedule – Key Respondents
1. Please describe briefly the nature of your responsibilities and your connection with the Student Success/Learning to 18 Strategy.
2. When you think about Student Success/Learning to 18 in Ontario Strategy, what initiatives, practices, or programs come to mind?
3. For each of the aforementioned initiatives ask: What is the connection between [name the initiative on the list] and Student Success/Learning to 18?
4. Was that a new initiative or an extension of an initiative that was already underway in Ontario?
5. What is the purpose of [name the initiative on the list]? 6. Who is the main audience for [name the initiative on the list]? 7. How does [name the initiative on the list] accomplish that purpose? 8. What factors (human and material resources, time, and political support) do you think are
essential for ensuring that [name the initiative on the list] is successful? 9. To what extent are those factors present? 10. Are there particular obstacles that stand in the way of [name the initiative on the list] being
successful? 11. What has been accomplished by [name the initiative on the list] thus far? 12. When you think of the purpose(s) you mentioned earlier, would you say that it/they have been
achieved? 13. In making that judgment, what evidence are you thinking about? 14. The next question tries to capture the unexpected. What has been particularly surprising or
disappointing about [name the initiative on the list] or worked in ways other than you might have anticipated?
15. One last question, is there something we should have asked and did not? In other words, is there a question that you would have liked us to ask that we did not? If so, please feel free to ask that question and to provide the answer that you think most appropriate?

Appendix A: Stage 1 Interview and Focus Group Guides
______________ September 2008 97
Focus Group Moderator Guide76 While they are convening, group participants will reflect upon the following questions:
a. What is the first thing that comes to mind when you think of the Student Success / Learning to 18 Strategy?
b. If someone moved here from another country and you had to provide them with a definition of the Student Success / Learning to 18 Strategy (SS/L18), what would you tell them?
c. What would you say are the 3 best things about SS/L18? d. What are the 3 worst things? e. What preparation did you have in order to help you fulfil your SS/L18 responsibilities? By
preparation, please include anything you did on your own as well as any other orientation or planning that you received.
f. What should the future be of SS/L18? 1. Introduction and General Learning Moderator will introduce herself, explain the process, then ask participants to put aside the written exercise for later discussion and to introduce themselves (mostly for the moderator’s benefit). As part of this introduction, they will include something that no one else here is likely to know about them (an ice breaker).
• Now, let’s review some of the questionnaire. What was the first thing that came to your mind about the Student Success / Learning to 18 Strategy?
• How would you define SS/L18 for someone who has never heard of it? 2. Focus on Origins
• When did you first hear about the idea behind SS/L18? • How did things get started for you regarding it? How did you first get involved? • How prepared did you feel in terms of fulfilling your SS/L18 responsibilities?
- How did you prepare? Did you have an agenda? - Did you do the preparatory work on our own, were you given a plan, or just
what? • Who were the key people to whom you related? Why were they pivotal?
3. Focus on Processes/Activities, then Consequences/ Outcomes
• What are your responsibilities as a Success Leader? Probe data collection, advocating those higher up to buy into the initiative, monitoring
student engagement • And what is everything that you considered to get the job done (steps, approaches, etc.),
whether you actually did this or not? List on flipchart marking whether the task was pursued or not - Of each pursued: Why did you choose to pursue this? Did you get it done?
And what were the consequences/ outcomes? - Of each not pursued: Why did you choose not to do this? - Are there still other things you wanted to do but didn’t or couldn’t for whatever
reason? If so, what and why?
76 Prepared by Catherine Fournier, Moderator

Appendix A: Stage 1 Interview and Focus Group Guides
______________ September 2008 98
• What skills does one need to develop to do what your doing? What skills need to be taught at the school level? as a Success Leader? What other capacities does a good Success Leader have that contribute to the success of SS/L18?
4. Focus on Strengths and Weaknesses (20 Min.)
• What are the main strengths of SS/L18? • What are its main weaknesses? How can these weaknesses be overcome? e.g.
interventions needed if a student is falling flat 5. Review of Goals and Objectives (30 Min.) As a reference, hand respondents a list of the following objectives broken down into single points. Goal 1
• How well would you say SS/L18 has increased high school graduation rates? Why do you say that (what evidence do you have of this)?
Goal 2 • How well would you say SS/L18 suports a good outcome for all students? Why do you
say that (what evidence do you have of this)? Goal 3
• How well would you say SS/L18 provides students with new and relevant learning opportunities? Why do you say that (what evidence do you have of this)?
Goal 4 • And how well would you say SS/L18 builds on student strengths and interests? Why do
you say that (what evidence do you have of this)? Goal 5
• And how well would you say SS/L18 provides students with an effective elementary to secondary school transition? Why do you say that (what evidence do you have of this)?
6. Focus on the Future (10 Min.)
• What more could be done to make SS/L18 a success? • How would you like to see it develop in the future?
7. Closing Comments
• Looking back, what have been some of the most special moments for you in your SS/L18 involvement?
• Is there anything else that you would like me to pass along on your behalf regarding SS/L18?
• Do you have any other advice for the people working on this initiative? Thank you for your cooperation

Appendix B: Stage 2 Interview and Focus Group Guides
______________ September 2008 99
Appendix B: Stage 2 Interview and Focus Group Guides
ONTARIO STUDENT SUCCESS/LEARNING TO 18 STRATEGY
Interview Schedule – Key School Board and School Informants
Notes for Interviewers: CCL employs semi-structured interviews to collect information from a variety of respondents. Semi-structured interviews are conversational, two-way communications. Semi-structured interviews are guided by a set of questions prepared in advance that provide a framework for the interview. The interview guide does not contain all of the questions. Some questions are created during the interview, allowing both the interviewer the flexibility to probe for details or discuss issues. The annotations below are designed to alert you to various issues that are likely to arise or that we would like you to consider, if the circumstances warrant. Thank you.
1. Please describe briefly the nature of your responsibilities. 2. Please describe what the term Student Success or Learning to 18? means to you. 3. Please describe the changes that have been made during the last four years to help secondary school students (in this school or school board) succeed.
While the following statements are likely to characterize the responses, please be alert to other formulations: o The changes are primarily about paying attention to what is happening to individual
students, and making sure they don’t fall between the cracks o The changes are primarily about new program opportunities like the specialist high skills
major and dual credit programs o The changes are about making secondary schools better places to learn for a wider
range of students o The changes are just another example of government policy change, and won’t make
much difference at the school level. 4. Please describe how these changes have been received.
Respondents are likely to describe changes from the frame of reference of one particular audience (staff, students, parents, community partners such as employers and cooperative education placements). You might probe to ask them if there have been any other reactions to the proposed changes.
5. Describe the main benefits of these changes. Probe for concrete examples of benefits. 6. Please describe those practices, elements or changes that have proven to be most successful in promoting student success. 7. Please describe any barriers to increased student success that have been encountered during the past four years and how these barriers been addressed.
If the respondent is a person working at the School Board level personnel, please be attentive to their comments about the engagement of the trustees, and of key partners such as the teachers’ federations and principals’ associations.
8. Describe the accountability measures (such as monitoring, tracking, reporting and planning) have been established in this school (or this school boards) and how they are being used by this school (or this school board) to facilitate improvement. 9. Describe how the capacity to implement changes aimed at helping secondary school students succeed has been developed in this school (or this school board)? 10. Describe how this school (or school board) uses student (or school-level) data and information to intervene with and support students. Probe: Are data available for your school on such questions as graduation rate and credit accumulation?

Appendix B: Stage 2 Interview and Focus Group Guides
______________ September 2008 100
11. Describe how this school (or this school board) aligns resources and practices to the goals of the Ministry’s Student Success Learning to 18 Strategy. Probe: Is there any initiative or strategy that you think has been particularly successful? If so, for which students has it been successful? Do you have any thoughts about why? 12. Please describe any instances where an initiative that was having little impact on student success was replaced by other initiatives that had greater impact. 13. Depending upon whether the respondent is school board or school based, ask:
• (School Board) Describe the contributions of student success leaders to student success in this school board?
• (School Based) Describe the contributions of student success teachers to student success in this school?
Describe the role of professional development. Please be attentive to the groups of persons to whom the professional development has been provided: Student success teachers; Principals; Guidance counsellors; Teachers who are not members of the student success team; Other school level staff; Other board level staff
14. How effective was the professional development that you received? 15. Describe the necessary ingredients to ensure the delivery of technological education in
secondary schools. 16. Describe the impact of the SS/L18 strategy on student timetabling. 17. For French-language respondents: Describe the contribution of SS/L18 to student retention
and recruitment in the French-language system. 18. Describe anything that has been particularly surprising, or disappointing about initiatives
implemented in the last four years. 19. Describe any improvements that you would suggest be made to ensure greater secondary student success. 20. One last question, is there something we should have asked and did not? In other words, is there a question that you would have liked us to ask that we did not? If so, please feel free to ask that question and to provide the answer that you think most appropriate?
Thank you for your cooperation!

Appendix B: Stage 2 Interview and Focus Group Guides
______________ September 2008 101
ONTARIO STUDENT SUCCESS/LEARNING TO 18 STRATEGY: STAGE 2 EVALUATION
Focus Group Guide – Students
Introduction Moderator will introduce herself or himself, explain the process and ask the participants to introduce themselves (mostly for moderator’s and transcribers’ benefit). As part of this introduction and to break the ice, the participants will be asked to say something that no one else there is likely to know about them. Moderator will provide participants with the list of initiatives. 1. We would like to get your impressions of some programs and initiatives that schools are using to help students succeed.First, could you please describe the changes that have been made during the last four years to help secondary school students succeed in your school?
• Please refer to the list of initiatives in front of you. Which of these initiatives are you familiar with? Please put a mark next to the name of the initiative on your list. Apprenticeship programs Cooperative Education Credit Recovery Credit Rescue Dual Credit programs with colleges or apprenticeships Programs for literacy improvements Programs for math improvements School-College-Work* Specialist High Skills Major programs Student Success Teachers & Teams Grade 8-9 transition initiatives Alternative programs Renewal of Technology Education Destination réussite (French only)
* In School-College-Work programs, faculty, teachers and administrators work to collaboratively provide learning opportunities for students to prepare them for successful transition from high school to post-secondary education, training and the workforce.
For each initiatives, ask the following questions: • How did you become familiar with this initiative?
Moderator can probe things such as advertisements (TV, flyers, posters etc), own child participated, other known child participated, etc.
• Describe the purpose of [name the initiative on the list]. • What kinds of students take part in [name the initiative on the list]? • Describe how [name the initiative on the list] work. • Describe how [name the initiative on the list] is working well for students in your
secondary school. • Describe how [name the initiative on the list] could been improved to increase student
success in your secondary school. • Describe what has been particularly surprising, or disappointing about [name the initiative
on the list] or worked in ways other than you might have anticipated. 2. We would like to get your impressions about student success. Moderator will provide each participant with a piece of paper.

Appendix B: Stage 2 Interview and Focus Group Guides
______________ September 2008 102
• Please write your description of what the terms student success or learning to 18 mean to you.
When participants are done writing their definitions, the moderator will encourage them to share their definitions with the group. • Could you describe what more could be done to improve student success in your
secondary school? Closing comments
• One last question, is there something you would like us to know about your child’s school experience that we haven’t asked?
• Do you have any other comments?
Thank you for your cooperation!

Appendix B: Stage 2 Interview and Focus Group Guides
______________ September 2008 103
ONTARIO STUDENT SUCCESS/LEARNING TO 18 STRATEGY: STAGE 2 EVALUATION
Focus Group Guide – Parents
Introduction Moderator will introduce herself or himself, explain the process and ask the participants to introduce themselves (mostly for moderator’s and transcribers’ benefit). As part of this introduction and to break the ice, the participants will be asked to say something that no one else there is likely to know about them. Moderator will ask the following background questions about parent’s children in secondary school: 1. How long has your child been in secondary school? 2. How many secondary schools has your child attended? 3. Are there teachers/counsellors/other adults in the school who notice how well your child is doing or who take an active interest in the success of your child? Moderator can probe for specific examples. Moderator will provide participants with the list of initiatives. 4. We would like to get your impressions of some programs and initiatives that schools are using to help students succeed.
• First, could you please describe the changes that have been made during the last four years to help secondary school students succeed in your child’s school?
• Please refer to the list of initiatives in front of you. Which of these initiatives are you familiar with? Please put a mark next to the name of the initiative on your list. Apprenticeship programs Cooperative Education Credit Recovery Credit Rescue Dual Credit programs with colleges or apprenticeships Programs for literacy improvements Programs for math improvements School-College-Work* Specialist High Skills Major programs Student Success Teachers & Teams Grade 8-9 transition initiatives Alternative programs Renewal of Technology Education Destination réussite (French only)
* In School-College-Work programs, faculty, teachers and administrators work to collaboratively provide learninf opportunities for students to prepare them for successful transition from high school to post-secondary education, training and the workforce.
For each initiatives, ask the following questions:
• How did you become familiar with this initiative? Moderator can probe things such as advertisements (TV, flyers, posters etc), own child participated, other known child participated, etc.
• Describe the purpose of [name the initiative on the list]. • What kinds of students take part in [name the initiative on the list]? • Describe how [name the initiative on the list] work.

Appendix B: Stage 2 Interview and Focus Group Guides
______________ September 2008 104
• Describe how [name the initiative on the list] is working well for students in this secondary school.
• Describe how [name the initiative on the list] could been improved to increase student success in your child’s secondary school.
• Describe what has been particularly surprising, or disappointing about [name the initiative on the list] or worked in ways other than you might have anticipated.
5. We would like to get your impressions about student success. Moderator will provide each participant with a piece of paper.
• Please write your description of what the terms student success or learning to 18 mean to you.
When participants are done writing their definitions, the moderator will encourage them to share their definitions with the group. • Could you describe what more could be done to improve student success in your child’s
secondary school? Closing comments
• One last question, is there something you would like us to know about your child’s school experience that we haven’t asked?
• Do you have any other comments? Thank you for your cooperation!

Appendix B: Stage 2 Interview and Focus Group Guides
______________ September 2008 105
ONTARIO STUDENT SUCCESS/LEARNING TO 18 STRATEGY: STAGE 2 EVALUATION
Interview Guide – Colleges
1. The operational relationship with the school and the board – who is the contact for the
College, and what level(s) do discussions take place? How does it work? After the field visits, my impression is that there is considerable variance – sometimes it’s the school that has a direct relationship, in other places there is a highly developed board/college relationship 2. What arrangements does the college make with schools for students to visit as part of
their recruitment process? Is there an outreach to students in Grades 7&8 as well as secondary school? Have there been events for Grade 7&8 or secondary teachers (academic as well as others) to have in-depth visits at the colleges?
We heard about systems where students (and maybe parents) were invited to visit the college as early as late elementary school – to begin to think about this as a future option. In other schools, it was the (old) college recruiters at tables, one day in the high school. 3. To what degree do the public and Catholic (and French?) boards collaborate in working
with the college? 4. Are there any shared programs between the secondary schools and the colleges?
Shared facilities, or dual credit programs? 5. Is there an Industry Education Council involving school boards, industry representatives
and college and training organizations active in the area? How does it work? In at least one board, this seems to have been a foundation point for collaboration between boards, as well as really active partnerships with the college and industry.

Appendix C: Stage 2 Field Notes Guide
______________ September 2008 106
Appendix C: Stage 2 Field Notes Guide
General Information Date (mm/dd/yy) Check on of the following: Focus Group Interview Location (City / School Board / School): Interviewer: Interviewee(s):
Interviewer Summary Notes on Main Themes Memo (for CCL staff only) Overall understanding of SS/L18 Strategy
Overall sense of implementation of SS/L18 Strategy
Main accomplishments of SS/L18
Main barriers/challenges
Main recommendations
Supporting Observations
(Please include any important points pertaining to a specific initiative that was discussed, particular issues about data collection or use, a particularly telling quote, your overall sense of the climate of the discussion, etc.).
Memo (for CCL staff only)
Emerging Themes
Use this space to describe any significant themes or topics that dominated the discussion but which were unexpected or fell outside the five main categories listed above.
Memo (for CCL staff only)

Appendix D: Stage 2 Qualitative Analysis Procedures and Codes
______________ September 2008 107
Appendix D: Stage 2 Qualitative Analysis Procedures and Codes
Summary
Detailed coding steps - Step 1: Get a sense of the content - Step 2: Determine need for coding - Step 3: Import transcript into NVivo - Step 4: Import related field note file - Step 5: Coding a field note file - Step 6: Coding a transcript - Step 7: Document completed coding
Coding guidelines Adding coding nodes Node descriptions
Detailed Coding Steps STEP 1: GETTING A SENSE OF THE CONTENT
• Retrieve and read through the transcript to be analyzed, to get an initial sense of the content.
• You will want to look for content that speaks to the following major themes. A. Evidence of a clear understanding (or confusion about) of:
the strategy and its goals its components and their goals
B. Evidence of implementation of the strategy in the field: Changes in schools & boards in the past 4 years (with a focus on
accountability measures, capacity building, use of student-level data, resource alignment with strategy, data-based decision making, “culture change” at all levels)
Benefits of changes Challenges to implementation
C. Suggestions/recommendations for future improvement of the strategy • Retrieve and read through the field note associated with the transcript to be
analyzed, to get an initial sense of the content.∗ STEP 2: DETERMINE NEED FOR CODING
• As coding goes on and we move toward saturation, it may not be necessary to code all incoming transcripts, if new transcripts do not add significantly to current materials.
∗ The steps prescribed for the field note files will be followed even if its transcript is not coded (see Step 2).

Appendix D: Stage 2 Qualitative Analysis Procedures and Codes
______________ September 2008 108
• If you judge that a transcript should be coded, go to Step 3. • If you judge that a transcript does not require coding, you should take the
following steps: Import the transcript into the appropriate folder (see Step 3). Create and link a memo to the transcript to:
- document the reasons why you are choosing not to code it. - document which previously coded transcripts are, in your
judgement, closest in content to the new transcript. Import into the appropriate folder the Field Note file associated with the
transcript you are choosing not to code (see Step 4). Code only the Field Note file using established codes (See Step 5).
STEP 3: IMPORT TRANSCRIPT INTO NVIVO
• Import transcript to be analyzed into the proper sub-folder, in the Documents section of NVivo:
− FG Parents – Other − FG Parents – SS L18 − FG Students – Other − FG Students – SS/L18 − FG Teachers – Other − FG Teachers – SS Team − Field Notes − Interviews Directors of Education − Interviews Principals − Interviews SSLs (Student Success Leaders) − Interviews Trustees
• Create a case for the source transcript you have just imported (see How to create a case below). This will allow attributes to be assigned to each source transcript, which might be useful during the actual analysis phase. The basic attributes we will assign to each case are as follows:
− Category of respondent − Involved in SS/L18 − Language − Region − Related school − Related school board − School size − School type
• Assign the relevant attributes to the case. STEP 4: IMPORT THE FIELD NOTE FILE ASSOCIATED WITH THE TRANSCRIPT
• Import the field note file associated with the transcript you imported in Step 3 to be analyzed into the Field Notes sub-folder, in the Documents section of NVivo.

Appendix D: Stage 2 Qualitative Analysis Procedures and Codes
______________ September 2008 109
• Create a case for the field note transcript you have just imported (see How to create a case).
• Assign the relevant attributes to the field note case. • Link the transcript to the associated field note file.
STEP 5: CODING A FIELD NOTE FILE
• Open the field note file you want to code by double-clicking on it. • Code it using established codes. See coding guidelines later in this document. • Develop extra codes as necessary and use these as required (see Adding Coding
Nodes). STEP 6: CODING A TRANSCRIPT FILE
• Open the transcript file. • Code it using established codes. See coding guidelines later in this document. • Develop extra codes as necessary and use these as required (see Adding Coding
Nodes). STEP 7: DOCUMENT COMPLETED CODING
• Save your work. • Open the master tracking document. • Add your initials to identify who did the coding and indicate the date when coding
was completed. Coding Guidelines
• Material that pertains to benefits of change, evidence of change, challenges, and recommended improvements related to the SS/L18 Strategy at the SCHOOL BOARD LEVEL should be coded to parent nodes (and their child nodes) identified with SB, regardless of whether the respondent “belongs” to the school or school board level.
• Material that pertains to benefits of change, evidence of change, challenges, and
recommended improvements related to the SS/L18 Strategy at the SCHOOL LEVEL should be coded to parent nodes (and their child nodes) identified with SCHOOL, regardless of whether the respondent “belongs” to the school or school board level.
• The parent node, or general category, labelled Implementation should be used to
code material that specifically speaks to evidence of implementation of programs and/or SS/L18 components (for example, statements such as “we now have a dual credit program”). Whenever possible, code materials according to the child nodes available under the Implementation parent node.

Appendix D: Stage 2 Qualitative Analysis Procedures and Codes
______________ September 2008 110
• The parent node category labelled Benefits of Change should be used specifically to code statements that suggest the SS/L18 and its programs have had benefits. Specifically, statements that suggest benefits resulting from the Strategy without providing verifiable evidence to support claims and/or statements based on anecdotal observations, should be coded under Benefits of Change and/or its specific “child” nodes (for example, statements such as “(I think) our graduation rate has gone up”; or “We can see that our kids are more engaged.”). Whenever possible, code materials according to the child nodes available under the Benefits of Change parent node.
• The parent node category labelled Evidence of Change should be used
specifically to code statements that provide concrete, verifiable evidence of the changes brought about by SS/L18 (for example, statements such as “Our graduation rate has gone up by 15% (or is not at 83%)). Whenever possible, code materials according to the child nodes available under the Evidence of Change parent node.
• The parent node category labelled Challenges should be used to code statements
that offer evidence of challenges or that reveal perceived challenges pertaining to the implementation of SS/L18 to date. This is not the parent node within which challenges pertaining to the ongoing or future implementation of the Strategy should be coded. Whenever possible, code materials according to the child nodes available under the Challenges parent node.
• The parent node category labelled Recommended Improvements should be used
to code statements offering evidence of perceived challenges to the ongoing or future implementation of SS/L18. Whenever possible, code materials according to the child nodes available under the Recommended Improvements parent node.
• Descriptions have been provided for most parent and child nodes where the name
of the node may not provide obvious indication of its intended use. Contact your coding team if you are unsure of the meaning and/or intended use of a given node.
• Remember that material can be coded directly against a parent node, if there are
no suitable child nodes within a given parent node. For example if you find a statement about a benefit of change brought about the SS/L18 but cannot find an appropriate child node against which to code it, simply code it against the broader Benefits of Change parent node.
• Be sure to document any particularly illustrative, meaningful, or revealing
statement made by a respondent by assigning an annotation to the statement that could be useful when producing the final report. See How to make an annotation next.

Appendix D: Stage 2 Qualitative Analysis Procedures and Codes
______________ September 2008 111
Adding Coding Nodes
• For codes that fit with existing categories or parent nodes − Go to Tree Nodes. − Create new node: give new code name and provide code description. − Merge into existing parent node, as appropriate (cut & paste).
• For codes that do not fit with existing categories or parent nodes − Go to Free Nodes. − Create new node: give new code name and provide code description. − Merge into existing parent node, as appropriate (cut & paste).
• Share your new code with members of coding team. − Email them and let them know you’ve added content so they can
update the newest version! Node Descriptions Name of “parent” node Implementation Name of “child” node IMP - Alternative programs IMP - Apprenticeships IMP - Cooperative education IMP - Credit recovery IMP - Credit rescue IMP - Dedicated student success personnel IMP - Destination Réussite IMP - Dual credit IMP - Grade 8 to 9 transition IMP - Literacy programs IMP - Numeracy programs IMP - Other initiatives IMP - Professional development IMP - School-college-work IMP - Specialist high skills majors
Name of “parent” node SB - Benefits of change Name of “child” node SB - Culture change SB - Funding SB - Human resources SB - Improved capacity building

Appendix D: Stage 2 Qualitative Analysis Procedures and Codes
______________ September 2008 112
Name of “parent” node SB - Improved communication (internal) SB - Improved communication with community
partners SB - Improved data collection SB - Improved data management SB - Improved data use SB - Improved relationships SB - Improved staff attitudes SB - Improved test results SB - Increased graduation rate SB - Increased program options SB - Perceived decreased drop-out rate SB - Pooling of resources SB - Sharing of practices
SB - Challenges Name of “child” node SB - Administrative capacity SB - Communication between schools SB - Communication with Ministry SB - Communication with parents SB - Communication with schools SB - Communication with staff SB - Communication with students SB - Coordination with colleges and universities SB - Coordination with community stakeholders SB - Data collection SB - Data management SB - Data use SB - Funding SB - Lack of collaboration between school boards SB - Planning cycle SB - Planning requirements SB - Public perceptions SB - Resources to support planning SB - Trustees SB - Unions and federations

Appendix D: Stage 2 Qualitative Analysis Procedures and Codes
______________ September 2008 113
Name of “parent” node SB - Evidence of change Name of “child” node SB - Drop out rate SB - Graduation rate SB - Human resources SB - Number of programs offered SB - Other evidence SB - Student achievement - EQAO SB - Student achievement - OSSLC SB - Student achievement - OSSLT
SB - Recommended improvements
Name of “child” node
SB - Capacity building Change Management SB - Capacity building Pedagogy SB - Capacity building Planning SB - Capacity building Data SB - Certainty around planning SB - Community stakeholders SB - Coordination of services SB - Funding SB - Group-specific needs SB - Implementation fatigue SB - Maintain initiative(s) SB - Meeting staffing needs SB - Practice sharing
SCHOOL - Benefits of change Name of “child” node SCHOOL - Culture change SCHOOL - Funding SCHOOL - Human resources SCHOOL - Improved capacity building SCHOOL - Improved communication (internal) SCHOOL - Improved communication with community
partners SCHOOL - Improved data collection SCHOOL - Improved data management SCHOOL - Improved data use SCHOOL - Improved relationships SCHOOL - Improved teaching practices SCHOOL - Improved test results

Appendix D: Stage 2 Qualitative Analysis Procedures and Codes
______________ September 2008 114
Name of “parent” node SCHOOL - Increased graduation rate SCHOOL - Increased number of program options
Name of “parent” node SCHOOL - Benefits of change (continued) Name of “child” node
SCHOOL - Increased scheduling flexibility SCHOOL - Perceived decreased drop-out rate SCHOOL - Pooling of resources SCHOOL - Sharing of effective practices SCHOOL - Smoother transitions elementary to
secondary SCHOOL - Smoother transitions secondary to PSE or
work SCHOOL - Student engagement SCHOOL - Student monitoring and tracking
SCHOOL - Challenges Name of “child” node SCHOOL - Administrative capacity SCHOOL - Communication with Ministry SCHOOL - Communication with parents SCHOOL - Communication with school board SCHOOL - Communication with staff SCHOOL - Communication with students SCHOOL - Coordination with colleges and universities SCHOOL - Coordination with community stakeholders SCHOOL - Curricular content and practices SCHOOL - Data collection SCHOOL - Data management SCHOOL - Data use SCHOOL - Flexibility SCHOOL - Funding SCHOOL - Human resources SCHOOL - Infrastructure SCHOOL - Lack of collaboration between schools SCHOOL - Pedagogical practices SCHOOL - Planning cycle SCHOOL - Planning requirements SCHOOL - Public perceptions SCHOOL - Resources to support planning

Appendix D: Stage 2 Qualitative Analysis Procedures and Codes
______________ September 2008 115
Name of “parent” node SCHOOL - School location and transportation SCHOOL - School size SCHOOL - Specific needs of Aboriginal students SCHOOL - Specific needs of Francophone students SCHOOL - Specific needs of poor students
Name of “parent” node SCHOOL – Challenges (cont’d) Name of “child” node SCHOOL - Specific needs of rural students SCHOOL - Specific needs of special needs students SCHOOL - Specific needs of students - other SCHOOL - Specific needs of students with mental
health SCHOOL - Specific needs of substance using
students SCHOOL - Staff attitude SCHOOL - Staff knowledge SCHOOL – Student disponisitions SCHOOL - Unions and federations
SCHOOL - Evidence of change Name of “child” node
SCHOOL - Class attendance SCHOOL - Course take-up SCHOOL - Credit accumulation SCHOOL - Drop out rate SCHOOL - Graduation rate SCHOOL - Human resources SCHOOL - Number of programs offered SCHOOL - Other evidence SCHOOL - Student achievement - EQAO SCHOOL - Student achievement - Grades SCHOOL - Student achievement - OSSLC SCHOOL - Student achievement - OSSLT SCHOOL - Student retention
SCHOOL - Recommended improvements
Name of “child” node
SCHOOL - Better definition of roles or programs SCHOOL - Capacity building Change Management SCHOOL - Capacity building Pedagogy
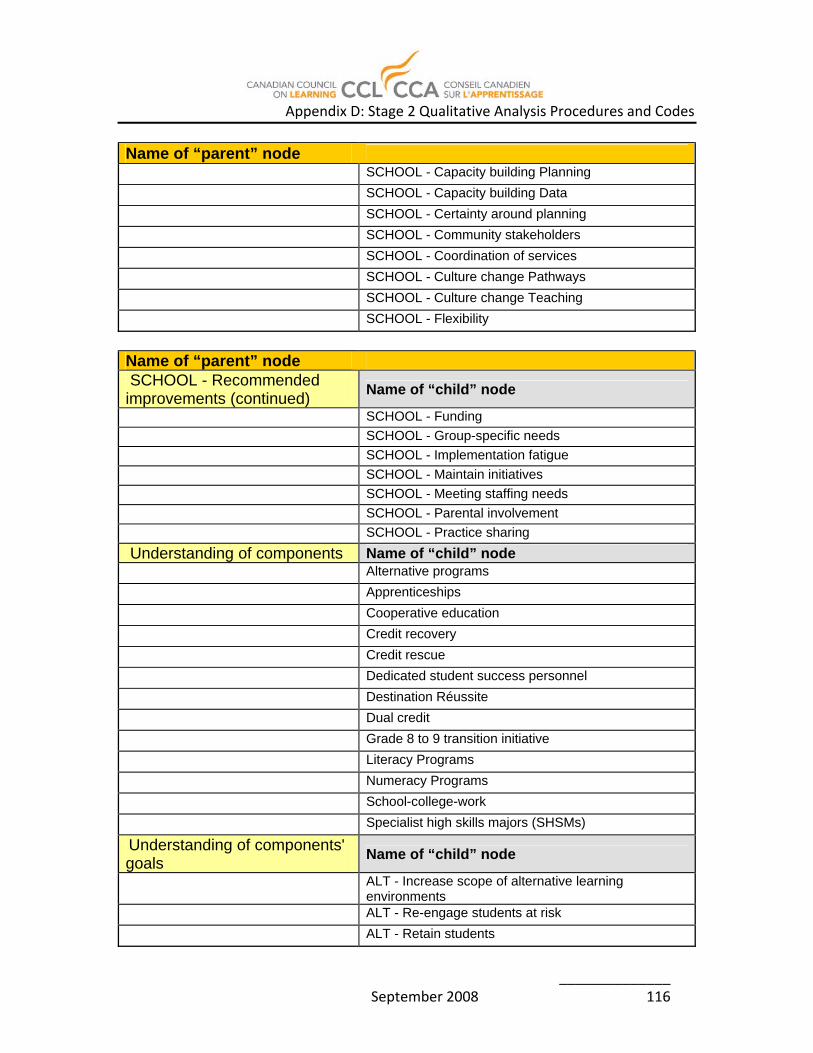
Appendix D: Stage 2 Qualitative Analysis Procedures and Codes
______________ September 2008 116
Name of “parent” node SCHOOL - Capacity building Planning SCHOOL - Capacity building Data SCHOOL - Certainty around planning SCHOOL - Community stakeholders SCHOOL - Coordination of services SCHOOL - Culture change Pathways SCHOOL - Culture change Teaching SCHOOL - Flexibility
Name of “parent” node SCHOOL - Recommended improvements (continued) Name of “child” node
SCHOOL - Funding SCHOOL - Group-specific needs SCHOOL - Implementation fatigue SCHOOL - Maintain initiatives SCHOOL - Meeting staffing needs SCHOOL - Parental involvement SCHOOL - Practice sharing Understanding of components Name of “child” node Alternative programs Apprenticeships Cooperative education Credit recovery Credit rescue Dedicated student success personnel Destination Réussite Dual credit Grade 8 to 9 transition initiative Literacy Programs Numeracy Programs School-college-work Specialist high skills majors (SHSMs)
Understanding of components' goals
Name of “child” node
ALT - Increase scope of alternative learning environments
ALT - Re-engage students at risk ALT - Retain students

Appendix D: Stage 2 Qualitative Analysis Procedures and Codes
______________ September 2008 117
Name of “parent” node APP - Encourage careers in the skilled trades APP - Expand number of students attracted to skilled
trades APP - Increase graduation rates APP - Increase student retention rates APP - Provide greater career opportunities in skilled
trades APP - Provide students with options other than PSE COOP - Enable students to apply knowledge and
skills COOP - Expand range of students attracted to coop COOP - Increase scope of coop placements COOP - Re-engage students
Name of “parent” node Understanding of components' goals (continued)
Name of “child” node
DESTREUSSITE - Ensure adaptation of SSL18 for Francophones
DESTREUSSITE - Provide support for struggling schools
DUAL - Allow students to experiment with pathways DUAL - Encourage student retention DUAL - Facilitate transitions between high school and
PSE or work DUAL - Increase graduation rates G89 - Adult partnerships G89 - Individual timetables G89 - Student Profiles G89 - Support individual student needs G89 - Transition plans G89 - Welcoming environments LITERACY - Expand instruction across curriculum
areas LITERACY - Strengthen literacy foundations NUMERACY - Appropriate skills to join workforce NUMERACY - Close gap between instruction and
assessment NUMERACY - Raise math competencies NUMERACY - Reduce failure rate in high school math RECOVERY - Facilitate catching up RECOVERY - Facilitate re-engagement

Appendix D: Stage 2 Qualitative Analysis Procedures and Codes
______________ September 2008 118
Name of “parent” node RECOVERY - Facilitate re-entry into school RECOVERY - Increase student engagement RESCUE - Identify students at risk of failing a course RESCUE - Intervene prior to failure RESCUE - Prevent course failure SCW - Greater inter-institutional collaboration SCW - Increase collaborative opportunities SCW - Promote creation of programs that support
transition SHSM - Increase graduation rates via a formal
pathway SHSM - Increase retention of students SHSM - Provide learning opportunities suited to
individual interests SHSM - Transition
Name of “parent” node Understanding of components' goals (continued)
Name of “child” node
SS STAFF - Develop and nurture relationships with staff
SS STAFF - Ensure faithful and smooth implementation
SS STAFF - Track and monitor at-risk students Understanding of Strategy Name of “child” node Capacity-building Culture shift Facilitate innovation Favour evidence-informed decision making Favour flexibility to meet local needs Increase accountability Increase tracking Meet the needs of all students Open doors to community Pillars - Community Culture and Caring Pillars - Literacy Pillars - Numeracy Pillars - Pathways Shift of focus from teaching to learning Success for above-average students

Appendix D: Stage 2 Qualitative Analysis Procedures and Codes
______________ September 2008 119
Name of “parent” node Success for all students Success for average students Success for each student irrespective of need or
circumstance Success for low-achieving student
Understanding of Strategy's goals
Name of “child” node
Goal of SSL18 - Build on students' interests Goal of SSL18 - Build on students' strengths Goal of SSL18 - Decrease drop-out rate Goal of SSL18 - Ensure transition from elementary to
secondary Goal of SSL18 - Ensure transition from secondary to
PSE or work Goal of SSL18 - Increase graduation rate (to 85%) Goal of SSL18 - Master basic competencies in literacy Goal of SSL18 - Master basic competencies in
numeracy Goal of SSL18 - Provide NEW learning opportunities
Understanding of Strategy's goals (continued)
Name of “child” node
Goal of SSL18 - Provide RELEVANT learning opportunities
Goal of SSL18 - Retain students in Francophone system
Goal of SSL18 - Support good outcomes for students Notes: • ALT: Alternative Programs • APP: Apprenticeships • COOP: Cooperative Education Programs • DESTREUSSITE: Destination Réussite • DUAL: Dual Credit Programs • G89: Grade 8 to 9 Transition Programs • LITERACY: Literacy Programs • NUMERACY: Numeracy Programs • RECOVERY: Credit Recovery Programs • RESCUE: Rescue Programs • SCW: School-College-Work Programs • SHSM: Specialist High Skills Majors • SS STAFF: Student Success dedicated staff

Appendix E: Qualitative Coding Consultation Journal
______________ September 2008 120
Appendix E: Qualitative Coding Consultation Journal
Meeting#: 1 Date: December 6, 2007 Attending: Julie Bélanger, Tracy Lavin, Godfrey von Nostitz-Tait, Isabelle Eaton Topic(s): Review of first attempts at coding Changes to first draft of nodes Working Well
• Early stages so hard to tell. • Coding stripes are working well for people.
Not Working Well
• Software seems a bit “sensitive”. • Our network seems to be causing some issues. Godfrey has had two systems crashes
(Julie recommends moving his project to his own U: drive rather than working from the S: drive). Julie might have experienced difficulties, and Nvivo wouldn’t open for Isabelle this morning until she re-booted her computer.
• Concerns should be mentioned to tech. for monitoring of system. Procedural Changes
• If time is available, it would be prudent to plan for reliability testing of coding. • Could entail:
- thorough check by JB of a sample of all transcripts (e.g. 10%); - random audit of coded transcripts for each of key respondent groups (may not
add up to 10%); - coder comparisons (team members pair up and review each other’s coding of a
couple of transcripts, to develop consensus and ensure inter-coder reliability); - review of first transcripts coded by individual coders once we get to saturation, to
make sure nothing was missed during initial coding attempts. Coding SB/S Parent Node Nodes to be dropped Date
Effective SB/S Benefits of change Improved system effectiveness 12/06/2007 SB/S Parent Node Nodes to be added Date
Effective SB/S Benefits of change Culture shift
Did not implement this change as found that change in name to two existing nodes to culture change would create unnecessary overlap. Kept only Culture change, in the Benefits of change parent nodes, at both the school board and school levels.
Not implemented
SB Benefits of change Increased program options 12/06/2007 SB/S Benefits of change Funding (Use this node to code content referring 12/06/2007

Appendix E: Qualitative Coding Consultation Journal
______________ September 2008 121
SB/S Parent Node Nodes to be added Date Effective
to availability of funds to secure personnel, spaces, resources, materials, etc. to support delivery of specific programs and/or initiatives, or components thereof.)
SB/S Benefits of change Improved communication (Use this node to code materials referring to improved communication within the unit of analysis (either school board or school) as a benefit of changes brought about by the Strategy.)
12/06/2007
SB/S Benefits of change Human resources (Use this node to code content referring to availability of personnel to support delivery of specific programs. This node doesn't speak to funding but to personnel availability, flexibility in scheduling of personnel, etc.)
12/06/2007
SB/S Benefits of change Improved communication with community partners
12/06/2007
S Challenges Staff knowledge (Use this node to code content referring to staff knowledge as a barrier, for example, lack of content knowledge of subject area staff are responsible for teaching, lack of skills and/or lack of knowledge of alternative pathways options.)
12/06/2007
S Challenges Student dispositions (Use this node to code content referring to student attendance, attitudes, motivations, beliefs, or level of engagement as barriers to success.)
12/06/2007
SB Challenges Trustees 12/06/2007 S Recommended
improvements Better definition of roles or programs (Use this node to code content referring to the need for clearer and shared definitions of programs, initiatives, expectations, etc.)
12/06/2007
SB Recommended improvements
Maintain initiative(s) (Use this node to code content referring to recommendations to stay the course, to give SS/L18 a chance to properly develop, to stop revising or asking for proposals for new initiatives, etc. Essentially, to give frontline staff a chance to implement it.)
12/06/2007
SB/S Parent Node Nodes to be modified Date
Effective SB Benefits of change Different professional culture →
Culture change 12/06/2007
S Benefits of change Improved professional culture → Culture change
12/06/2007
SB/S Challenges Planning cycle (Use this node to code statements about the strengths or constraints of the planning cycle on the implementation of SS/L18, OR discrepancies or lags between planning timelines and confirmation of resources and funds.)
12/06/2007

Appendix E: Qualitative Coding Consultation Journal
______________ September 2008 122
SB/S Parent Node Nodes to be modified Date Effective
SB/S Challenges Public perceptions (Use this node to code statements about the impact of public perceptions of SS/L18, its components and effectiveness, including those of parents. Pay particular attention to impact of misunderstanding of Strategy's intent.)
12/06/2007
S Challenges School location → Change it to School location and transportation
12/06/2007
S Challenges Flexibility (needs definition) 12/06/2007 SB/S Recommended
improvements Certainty of funding → Change it to Funding (Use this node to code content referring to the need to either maintain or stabilize funding, as well as the need to make future funding predictable
12/06/2007
SB: School Board S: School Other Decisions
• Don’t forget to create case files for each transcript and field note imported and analyzed and to assign attributes to the case files.
• Interviews are almost done and expected to be completed by Dec. 14. • Some director/trustee interviews will be done by phone; goal is for end of December,
beginning of January. • Clarification around meaning of capacity building. Can include:
- teaching people to do things; - hiring people to do things; - supporting people in developing understanding of how what is done contributes
to a goal. Meeting#: N/A Date: December 19, 2007 Attending: Julie Bélanger, Tracy Lavin, Godfrey von Nostitz-Tait, Isabelle Eaton Topic(s): Addition of a node SB/S Parent Node Nodes to be added Date
Effective S Recommended improvements Flexibility 12/19/2007 Meeting#: 2 Date: January 8, 2008 Attending: Julie Bélanger, Tracy Lavin, Godfrey von Nostitz-Tait, Isabelle Eaton Topic(s): Check-in, addition of some nodes, clarifications

Appendix E: Qualitative Coding Consultation Journal
______________ September 2008 123
SB/S Parent Node Nodes to be added Date Effective
SB/S Challenges Workload or Fatigue 01/08/2008 S Challenges Attendance 01/08/2008 Clarifications
- When (staff) safety is listed as concern for or challenge to the implementation of SS/L18, code it for now to the parent node “Challenge”.
- Statements about improved communication with parents and/or students as one of the benefits of change brought about by SS/L18 should be coded to Improved communication (internal), at either the school board or school level.
- Statements about increased accountability as one of the benefits of change brought about by SS/L18 could be coded to culture change, improved data collection, improved data management, improved data use, and/or student monitoring and tracking. Use context of statement to make judgement of most suitable node and/or code against more than one node.
Meeting#: 3 Date: February 7, 2008 Attending: Julie Bélanger, Tracy Lavin, Godfrey von Nostitz-Tait, Isabelle Eaton Topic(s): Coding update Nothing of significance to report. Started discussing possible approaches to collapsing the data, and combining codes, to facilitate analysis. Reviewed questions that must be answered as part of report to Ministry of Education. Discussed target date for completion of coding. Meeting#: 4 Date: February 18, 2008 Attending: Julie Bélanger, Godfrey von Nostitz-Tait, Isabelle Eaton Topic(s): Closing of coding Considerations for node collapsing and data analysis were reviewed. The following significant decisions were made. 1. Elimination of Nodes
• Will not happen until individual coders’ project files have been merged into a single combined project file to see what nodes are not being used.
• Deletion of unused nodes will be made only from the combined project file and all eliminations will be made by the lead analyst.
• If an individual node has less than five (5) coded references, attempts to re-code these against a more conceptually useful node will be made.
2. Addition of New Node: Question 3
• A new node, called Question 3, will be added to the combined project file, once individual files have been merged.
• Components/initiatives of the SS/L18 Strategy that were mentioned by respondents as having contributed to student success in a specific manner will be re-coded against this node (see re-coding instructions section).

Appendix E: Qualitative Coding Consultation Journal
______________ September 2008 124
• The materials to be explored and possibly re-coded against this node will be drawn from the current node categories: Implementation, Benefits of Change, and Evidence of Change.
• Re-coding for this question will be done by the lead analyst.
This node will be mined for answers to the following question:
Which elements of the strategy and actions that have been implemented appear to be yielding student success?
3. Collapsing of Nodes
• See sections 6, 7, 8 and 9 below. 4. Procedures
The master file will be updated to incorporate new, broader thematic nodes developed during the meeting (see relevant tables at the end of sections 6, 7, 8, and 9).
Individual coders will create a copy of their file on their own computers, and label it as follows “SSL18 – Stage 2 YourInitials Recoded.nvp” (for ex.: SSL18 Stage 2 IE Recoded.nvp.).
Individual coders will import the updated master file into the “Recoded” project file. Existing nodes will be recoded against the new thematic nodes, to facilitate analysis (see
re-coding instructions at end of this document). These new thematic nodes will be “free nodes”.
Once re-coding is complete, individual coders will save their work on their desktop and upload a copy of their “Recoded” project file to the S: drive.
The lead analyst will assume responsibility for merging individual recoded files into the combined SSLL18 Stage 2 project file.
5. Parent Node: Implementation
• Statements made by respondents that spoke to a lack of implementation of specific components/initiative of the SS/L18 Strategy were coded against this parent node and its child nodes.
• This approach will be made uniform for all coders and, as appropriate, re-coding will be undertaken before merging occurs.
• Once coders’ individual project files are merged into the combined project file, reports on the Implementation nodes will first be produced by region, to look for variations in program implementation.
• Statements offering evidence of a lack of implementation will be screened for attention to the factors that may have impeded the launch of a specific component/initiative of the SS/L18 Strategy (such as region, size of school, urbanicity, language, etc.)
• The analysis of the material coded under this parent node and its child nodes will focus on identifying:
- what components/initiatives of the SS/L18 Strategy have been implemented; - what components/initiatives already existed but changed as a result of the
SS/L18 Strategy; - what components/initiatives already existed, continue, but have not changed in
scope or quality or focus as a result of the SS/L18 Strategy; - and what components/initiatives of the SS/L18 Strategy have not been
implemented. • It was noted that in reporting the results associated with these nodes, lack of mention of a
component/initiative shall not be equated with actual lack of implementation.

Appendix E: Qualitative Coding Consultation Journal
______________ September 2008 125
• If any material is found to have been coded under the Implementation parent node, it will be re-coded to one of the child nodes to facilitate analysis. The fallback child node will be “Other initiatives”.
IMPLEMENTATION
Alternative programs Apprenticeships Cooperative education Credit recovery Credit rescue Dedicated student success personnel Destination Reussite Dual credit Grade 8 to 9 transition Literacy programs Numeracy programs Other initiatives Professional development School-college-work Specialist high skills majors
This parent node and its child nodes will be mined for answers the following questions:
What has changed in the last four years in Ontario’s secondary schools to help students succeed? Which elements of the strategy and actions that have been implemented appear to be yielding student success? (re-coded under Question 3 free node)
6. Parent Nodes: Benefits of Change
• Material originally coded under school board and school “Benefits of Change” nodes will be combined77 and collapsed under the following new thematic nodes: Academic benefits: Human benefits; Measurement & accountability benefits; Resource-related benefits; and Systemic benefits.
• Original codes will be preserved. • Existing material will be re-coded by individual coders against the new thematic nodes
according to the table below (see instructions at the end of this document). • Material coded only against the parent nodes “Benefits of change” will be re-coded
whenever possible by the lead analyst into one of the newly created thematic nodes. 77 There will no longer be separate nodes for school and school boards.

Appendix E: Qualitative Coding Consultation Journal
______________ September 2008 126
SCHOOL BOARD
Benefits of change Associated thematic node
Culture change Systemic benefits Different professional culture Systemic benefits Funding Resource-related benefits Human resources Resource-related benefits Improved capacity building Human benefits Improved communication (internal) Human benefits Improved communication with community partners Human benefits Improved data collection Measurement & accountability benefits Improved data management Measurement & accountability benefits Improved data use Measurement & accountability benefits Improved relationships Human benefits Improved staff attitudes Human benefits Improved system effectiveness Systemic benefits Improved test results Academic benefits Increased graduation rate Academic benefits Increased program options Resource-related benefits Perceived decreased drop-out rate Academic benefits Pooling of resources Resource-related benefits Sharing of practices Human benefits
SCHOOL
Benefits of change Associated thematic node
Culture change Systemic benefits Funding Resource-related benefits Human resources Resource-related benefits Improved capacity building Human benefits Improved communication (internal) Human benefits Improved communication with community partners
Human benefits
Improved data collection Measurement & accountability benefits Improved data management Measurement & accountability benefits Improved data use Measurement & accountability benefits Improved professional culture Systemic benefits Improved relationships Human benefits Improved system effectiveness Systemic benefits Improved teaching practices Human benefits Improved test results Academic benefits Increased graduation rate Academic benefits Increased number of program options Resource-related benefits

Appendix E: Qualitative Coding Consultation Journal
______________ September 2008 127
SCHOOL
Benefits of change Associated thematic node
Increased scheduling flexibility Resource-related benefits Perceived decreased drop-out rate Academic benefits Pooling of resources Resource-related benefits Sharing of effective practices Human benefits Smoother transitions elementary to secondary
Academic benefits
Smoother transitions secondary to PSE or work
Academic benefits
Student engagement Human benefits Student monitoring and tracking Measurement & accountability benefits
These thematic nodes will be mined for answers the following questions:
What have, to date, been the main benefits arising from the changes that have been implemented in Ontario secondary schools over the last four years? Which elements of the strategy and actions that have been implemented appear to be yielding student success? (re-coded under Question 3 free node) How have changes within Ontario’s secondary schools aimed at increasing student success been supported?
7. Parent Nodes: Challenges
• Material originally coded under school board and school “Challenges” nodes will be combined and collapsed under the following new thematic nodes: Academic challenges: Human challenges; Measurement & accountability challenges; Resource-related challenges; and Systemic challenges.
• Original codes will be preserved. • Existing material will be re-coded by individual coders against the new thematic nodes
according to the table below (see instructions at the end of this document). • Material coded only against the parent nodes “Challenges” will be re-coded whenever
possible by the lead analyst into one of the newly created thematic nodes.
SCHOOL BOARD Challenges Associated thematic node
Administrative capacity Resource-related challenges Communication between schools Human challenges Communication with Ministry Human challenges Communication with parents Human challenges Communication with schools Human challenges Communication with staff Human challenges Communication with students Human challenges Coordination with colleges and universities Resource-related challenges

Appendix E: Qualitative Coding Consultation Journal
______________ September 2008 128
SCHOOL BOARD Challenges Associated thematic node
Coordination with community stakeholders Resource-related challenges Data collection Measurement & accountability challenges Data management Measurement & accountability challenges Data use Measurement & accountability challenges Funding Resource-related challenges Lack of collaboration between school boards Resource-related challenges Planning cycle Systemic challenges Planning requirements Systemic challenges Public perceptions Systemic challenges Resources to support planning Resource-related challenges Trustees Human challenges Unions and federations Resource-related challenges Workload or fatigue Human challenges
SCHOOL
Challenges Associated thematic node
Administrative capacity Resource-related challenges Attendance Human challenges Communication with Ministry Human challenges Communication with parents Human challenges Communication with school board Human challenges Communication with staff Human challenges Communication with students Human challenges Coordination with colleges and universities Resource-related challenges Coordination with community stakeholders Resource-related challenges Curricular content and practices Academic challenges Data collection Measurement & accountability challenges Data management Measurement & accountability challenges Data use Measurement & accountability challenges Flexibility Resource-related challenges Funding Resource-related challenges Human resources Resource-related challenges Infrastructure Resource-related challenges Lack of collaboration between schools Resource-related challenges Pedagogical practices Human challenges Planning cycle Systemic challenges Planning requirements Systemic challenges Public perceptions Systemic challenges Resources to support planning Resource-related challenges School location and transportation Resource-related challenges School size Resource-related challenges

Appendix E: Qualitative Coding Consultation Journal
______________ September 2008 129
SCHOOL
Challenges Associated thematic node
Specific needs of Aboriginal students Human challenges Specific needs of Francophone students Human challenges Specific needs of poor students Human challenges Specific needs of rural students Human challenges Specific needs of special needs students Human challenges Specific needs of students - other Human challenges Specific needs of students with mental health Human challenges Specific needs of substance using students Human challenges Staff attitude Human challenges Staff knowledge Human challenges Student disposition Human challenges Unions and federations Resource-related challenges Workload or fatigue Human challenges
These new thematic nodes will be mined for answers the following question:
How have changes within Ontario’s secondary schools aimed at increasing student success been supported? What barriers to increased student success have been encountered? And how have these been addressed? What further strategies and actions, if any, are suggested to further increase secondary student success?
8. Parent Nodes: Evidence of Change
• Material originally coded under school board and school “Evidence of change” nodes will be combined and collapsed under the following new thematic nodes: Completion and success; Resources; Test results, and Other evidence.
• Original codes will be preserved. • Existing material will be re-coded by individual coders against the new thematic nodes
according to the table below (see instructions at the end of this document). • Material coded only against the parent nodes “Evidence of change” will be re-coded
whenever possible by the lead analyst into one of the newly created thematic nodes.
SCHOOL BOARD Evidence of change Associated thematic node
Drop out rate Completion and success Graduation rate Completion and success Human resources Completion and success Number of programs offered Resources Other evidence Other evidence Student achievement - EQAO Test results Student achievement - OSSLC Test results Student achievement - OSSLT Test results

Appendix E: Qualitative Coding Consultation Journal
______________ September 2008 130
SCHOOL
Evidence of change Associated thematic node
Class attendance Completion and success Course take-up Completion and success Credit accumulation Completion and success Drop out rate Completion and success Graduation rate Completion and success Human resources Resources Number of programs offered Resources Other evidence Other evidence Student achievement - EQAO Test results Student achievement - Grades Test results Student achievement - OSSLC Test results Student achievement - OSSLT Test results Student retention Completion and success
These new thematic nodes will be mined for answers the following question:
How have changes within Ontario’s secondary schools aimed at increasing student success been supported? What have, to date, been the main benefits arising from the changes that have been implemented in Ontario secondary schools over the last four years? Which elements of the strategy and actions that have been implemented appear to be yielding student success?
9. Parent Nodes: Recommended Improvements
• Material originally coded under school board and school “Recommended improvements” nodes will be combined and collapsed under the following new thematic nodes: Human improvements; Resource-related improvements; Systemic improvements; and Other improvements.
• Original codes will be preserved. • Existing material will be re-coded by individual coders against the new thematic nodes
according to the table below (see instructions at the end of this document). • Material coded only against the parent nodes “Recommended Improvements” will be re-
coded whenever possible by the lead analyst into one of the newly created thematic nodes.
SCHOOL BOARD
Recommended improvements Associated thematic node
Capacity building Change management Human improvements Capacity building Data Human improvements Capacity building Pedagogy Human improvements

Appendix E: Qualitative Coding Consultation Journal
______________ September 2008 131
SCHOOL BOARD Recommended improvements Associated thematic node
Capacity building Planning Human improvements Certainty around funding Resource-related improvements Certainty around planning Systemic improvements Community stakeholders Resource-related improvements Coordination of services Resource-related improvements Funding Resource-related improvements Group-specific needs Human improvements Implementation fatigue Human improvements Maintain initiative(s) Other improvements Meeting staffing needs Resource-related improvements Practice sharing Human improvements
SCHOOL
Recommended improvements Associated thematic node
Better definition of roles or programs Human improvements Capacity building Change management Human improvements Capacity building Data Human improvements Capacity building Pedagogy Human improvements Capacity building Planning Human improvements Certainty around funding Resource-related improvements Certainty around planning Systemic improvements Community stakeholders Resource-related improvements Coordination of services Resource-related improvements Culture change Pathways Systemic improvements Culture change Teaching Systemic improvements Flexibility Resource-related improvements Funding Resource-related improvements Group-specific needs Human improvements Implementation fatigue Human improvements Maintain initiatives Other improvements Meeting staffing needs Resource-related improvements Parental involvement Human improvements Practice sharing Human improvements
These new thematic nodes will be mined for answers the following question:
What barriers to increased student success have been encountered? And how have these been addressed? What further strategies and actions, if any, are suggested to further increase secondary student success?

Appendix E: Qualitative Coding Consultation Journal
______________ September 2008 132
10. Parent Node: Understanding of Strategy Understanding of Strategy’s Goals Understanding of Components Understanding of Components’ Goals
• No decision was made at this point about any collapsing and/or re-coding of the materials currently coded under these nodes. These will be revisited at a later stage in the analysis.
• The materials coded against these codes will likely inform the initial and concluding
chapters of our report. It will also likely be help answer, in combination with other data, the following questions:
Accountability measures (monitoring, tracking, reporting and planning) are in place in schools and school boards and being used by schools and boards in order to drive improvement? The capacity to implement the SS/L18 Strategy is being built into schools and school boards? Schools and school boards are acting upon their student and school-level data and information to intervene with a support students appropriately? Schools and school boards are making decisions in an effort to align resources and practices to the goals of the SS/L18 Strategy? Schools and school boards are making decisions in an effort to align resources and practices to the goals of the SS/L18 Strategy?
STRATEGY Understanding of Strategy
Capacity-building Culture shift Facilitate innovation Favour evidence-informed decision making Favour flexibility to meet local needs Increase accountability Increase tracking Meet the needs of all students Open doors to community Pillars - Community Culture and Caring Pillars - Literacy Pillars - Numeracy Pillars - Pathways Shift of focus from teaching to learning Success for above-average students Success for all students Success for average students

Appendix E: Qualitative Coding Consultation Journal
______________ September 2008 133
Success for each student irrespective of need or circumstance Success for low-achieving student
Understanding of Strategy's goals
Goal of SSL18 - Build on students' interests Goal of SSL18 - Build on students' strengths Goal of SSL18 - Decrease drop-out rate Goal of SSL18 - Ensure transition from elementary to secondary Goal of SSL18 - Ensure transition from secondary to PSE or work Goal of SSL18 - Increase graduation rate (to 85%) Goal of SSL18 - Master basic competencies in literacy Goal of SSL18 - Master basic competencies in numeracy Goal of SSL18 - Provide NEW learning opportunities Goal of SSL18 - Provide RELEVANT learning opportunities Goal of SSL18 - Retain students in Francophone system Goal of SSL18 - Support good outcomes for students
COMPONENTS Understanding of components Understanding of components' goals
ALT - Increase scope of alternative learning environments ALT - Re-engage students at risk
Alternative programs
ALT - Retain students APP - Encourage careers in the skilled trades APP - Expand number of students attracted to skilled trades
Apprenticeships
APP - Increase graduation rates APP - Increase student retention rates APP - Provide greater career opportunities in skilled trades
APP - Provide students with options other than PSE COOP - Enable students to apply knowledge and skills COOP - Expand range of students attracted to coop COOP - Increase scope of coop placements
Cooperative education
COOP - Re-engage students DESTREUSSITE - Ensure adaptation of SSL18 for Francophones Destination Réussite DESTREUSSITE - Provide support for struggling schools DUAL - Allow students to experiment with pathways DUAL - Encourage student retention DUAL - Facilitate transitions between high school and PSE or work
Dual credit
DUAL - Increase graduation rates G89 - Adult partnerships Grade 8 to 9 transition initiative G89 - Individual timetables

Appendix E: Qualitative Coding Consultation Journal
______________ September 2008 134
COMPONENTS Understanding of components Understanding of components' goals
G89 - Student Profiles G89 - Support individual student needs G89 - Transition plans G89 - Welcoming environments LITERACY - Expand instruction across curriculum areas Literacy Programs LITERACY - Strengthen literacy foundations NUMERACY - Appropriate skills to join workforce NUMERACY - Close gap between instruction and assessment NUMERACY - Raise math competencies
Numeracy Programs
NUMERACY - Reduce failure rate in high school math RECOVERY - Facilitate catching up RECOVERY - Facilitate re-engagement RECOVERY - Facilitate re-entry into school
Credit recovery
RECOVERY - Increase student engagement RESCUE - Identify students at risk of failing a course RESCUE - Intervene prior to failure
Credit rescue
RESCUE - Prevent course failure SCW - Greater inter-institutional collaboration SCW - Increase collaborative opportunities
School-college-work
SCW - Promote creation of programs that support transition SHSM - Increase graduation rates via a formal pathway SHSM - Increase retention of students SHSM - Provide learning opportunities suited to individual interests
Specialist high skills majors (SHSMs)
SHSM - Transition SS STAFF - Develop and nurture relationships with staff SS STAFF - Ensure faithful and smooth implementation
Dedicated student success personnel
SS STAFF - Track and monitor at-risk students 11. Re-coding Instructions
Double-click on a node to be recoded (for example: SCHOOL – Challenges SCHOOL – Communication with staff) so that a list of all materials coded to this node appears in a new window.
Click in this new window and click on Ctrl+A (or Right-click in this new window and choose “Select all”).
Click on Ctrl+F2 (or go to the Code menu and select “Code”, followed by “Code Selection at Existing Nodes”).
In the window that appears, click on the “Free Nodes” category (not on the check box next to Free Nodes but on the words themselves).
Place a checkmark in the box next to the thematic node to which you want to recode the selected content.
Click O.K. Close the window showing all the previously selected coded material.

Appendix E: Qualitative Coding Consultation Journal
______________ September 2008 135
Proceed to next node to be recoded. Save your work when you are done.

Appendix F: Evaluation Framework Elements of the SS/L18 Strategy
______________ September 2008 136
Appendix F: Evaluation Framework Elements of the SS/L18 Strategy
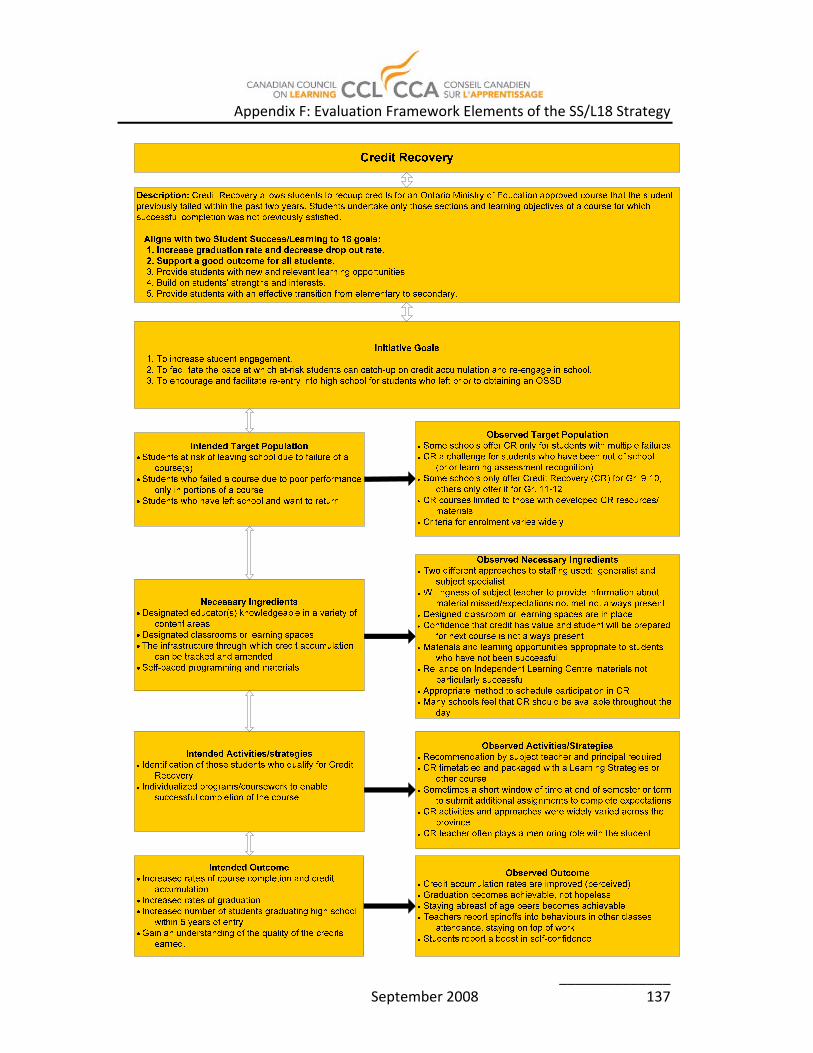
Appendix F: Evaluation Framework Elements of the SS/L18 Strategy
______________ September 2008 137

Appendix F: Evaluation Framework Elements of the SS/L18 Strategy
______________ September 2008 138

Appendix F: Evaluation Framework Elements of the SS/L18 Strategy
______________ September 2008 139

Appendix F: Evaluation Framework Elements of the SS/L18 Strategy
______________ September 2008 140
Grade 8 to 9 Transition Initiative
Intended Target Population Students making the transition from elementary to
secondary school.
Necessary Ingredients Collaboration between elementary and secondary schoolsIntroductory Transition Planning and Implementation
trainingSchool-based Transition TeamStudent Success Teacher, Student Success LeaderBoard-level Transition Plans
Intended Activities/Strategies A caring adult - staff member - is partnered with students,
based on student need, to assist them in their transition
The development of student profiles that highlight theindividual strengths, needs and interests of students including academic, emotional, social and/or physical.
Where possible, the semester one creation ofindividualized timetables for grade 9 students – based upon students’ strengths and interests - with a focuson students who may be at-risk.
Board development, implementation and monitoring of a grade 8 to 9 transition plan (including studentorientation activities and other interventions andstrategies).
Tracking and monitoring of school-level transition activities and strategies coordinated by the StudentSuccess Transition Team.
Intended Outcome Increased Gr. 9 and 10 credit accumulation.
Observed Target Population All students in Grade 8Sometimes, programs for students and parents in Grade 6
and 7 regarding pathway and career choicesStudents in Grades 7 and 8 who would benefit from enrolling
in Locally Developed or Applied coursesAboriginal students coming from schools on the reserveStudents identified as high-risk in Grade 8
Observed Necessary Ingredients Better communication with the feeder schoolsMany SS Teams visit the feeder schoolBoard planning and support for transition activities at the
school levelFinancial support for release time for Grade 7/8 and 9/10
teachers to meet
Observed Activities/Strategies Pairing students with caring adult more common in smaller
schoolsDevelopment of student profiles in many casesIndividualized timetables to students at risk, sometimes for all
enteringStudents identified at risk invited to participate in high school
activities in springTransitional programs for students coming to school from
reserveOrientation programs for incoming Grade 9 students in
AugustStudent Success Camp for students identified at riskStudent and staff mentors for Grade 9 studentsExplicit attention to orientation, communication skills,
problem-solving and leadership skillsMore focussed and personal approach to providing students
and parents with information and advice about appropriate program choices
Improving the understanding of both elementary and secondary teachers about the programs, instruction, and culture of the other panel
Observed Outcome Many school report Grade 9 credit accumulation
improvementsStudents report feeling welcome, cared for and supportedSchool - parent conversations are improvedStudents are timetabled for greater success
Description: Support for school board transition plans that focus on students as they move from elementary to secondary school.
Aligns with four Student Success/Learning to 18 goals: 1. Increase graduation rate and decrease drop out rate. 2. Support a good outcome for all students. 3. Provide students with new and relevant learning opportunities. 4. Build on students’ strengths and interests. 5. Provide students with an effective transition from elementary to secondary.
Initiative Goals1. To provide support for the individual needs of students as they move from elementary to secondary school.2. To support secondary schools in the creation of welcoming, caring environments for Grade 9 students.3. To partner a caring adult staff member with students according to student needs.4. To develop student profiles that highlight student strengths, needs, interests (e.g. academic, emotional, social, physical).5. To create, where possible, individual timetables in Semester One for Grade 9 students who may be at-risk. 6. To ensure boards develop, implement, and monitor a Grade 8-9 transition plan, including student orientation activities, and other
interventions and strategies

Appendix F: Evaluation Framework Elements of the SS/L18 Strategy
______________ September 2008 141
Dual Credit
Description The Dual Credit program allows high school students to earn a number of credits which simultaneously count toward the OSSD and a postsecondary diploma, postsecondary degree or apprenticeship certification.
Aligns with four Student Success/Learning to 18 goals: 1. Increase graduation rate and decrease drop out rate. 2. Support a good outcome for all students. 3. Provide students with new and relevant learning opportunities. 4. Build on students’ strengths and interests. 5. Provide students with an effective transition from elementary to secondary.
Initiative Goals1. To encourage student retention and graduation from secondary school by providing disengaged and underachieving students,
at risk of not graduating. 2. To improve credit accumulation through a broader range of engaging learning opportunities. 3. To encourage more students to pursue further education or training.
3. To allow students to reach ahead along postsecondary education or training pathways. 4. To facilitate transitions between secondary school and post-secondary education or training.
Intended Target PopulationPrimary focus is on students facing biggest challenges
in graduating, including disengaged and underachieving students with the potential to succeed, and students who have left secondary school before graduating.
Necessary IngredientsCollaborative agreements between post secondary
institutions and school boards, endorsed by Regional Planning Teams and approved by SCWI.
Secondary school and post secondary educators and administrators.
Boards to ensure planning and delivery of supports and services, coordinated with with public postsecondary institutions.
Involvement of secondary schools and a dedicated role for secondary school teachers, ranging from direct instruction to support and supervisory roles.
Boards and college to coordinate the exchange of academic progress information.
Entry into dual credit program to be guided through Student Success Team.
Intended Activities/strategiesStudents enrol in a “Dual Credit” course through their
secondary school. This includes dual credit courses delivered through advanced standing agreements, team-taught by secondary and college teachers, and college-delivered college courses and level 1 apprenticeship training.
Intended Outcome Increase credit accumulationIncrease secondary school graduation rates.Retrieve dropouts to enable them to achieve their
potential.Improve attendance rates.Increase postsecondary education and training
participation rates.
Observed Target Population Disengaged senior students for whom the college
environment/credit may be a motivatorSchool leavers who are more comfortable in the college
setting Struggling and previously disengaged students who
respond to an alternative education experience in a college setting
Successful students wanting to get a head start on their post-secondary program
Observed Necessary IngredientsArticulation agreements between some colleges and the
schools/boardsSupport from secondary teacher and college facultySupport from teachers’ federation/union still a challenge
in some casesIf student is in regular school part of the time, alignment
of schedule is sometimes a challengeConcerns about harmonisation of 2 different funding
models (secondary schools and college models)Secondary teacher engaged with studentsAppropriate content match for credit is being examined
Observed Activities/Strategies Team teaching (secondary teacher and college
teacher)School within a college model (secondary teacher with
a group of students located on college campus)College credit recognition through articulation
agreementCurriculum analysis undertaken by school and college
staff jointlyParticipation in college program structured as
cooperative education
Observed Outcome Students earn credits toward diploma completion, get
head start in college programHelps formerly disengaged students see themselves as
college capableGood environment for some older returning students

Appendix F: Evaluation Framework Elements of the SS/L18 Strategy
______________ September 2008 142
School-College-Work
Description: SCWI, which has been funded since 1997, now involves all Ontario district school boards and colleges. Faculty teachers and administrators work through 16 SCWI Regional Planning Teams to collaboratively provide learning opportunities for students to prepare them for successful transition from high school to post-secondary education training and the workforce.
Aligns with four Student Success/Learning to 18 goals: 1. Increase graduation rate and decrease drop out rate. 2. Support a good outcome for all students. 3. Provide students with new and relevant learning opportunities. 4. Build on students’ strengths and interests. 5. Provide students with an effective transition from elementary to secondary.
Initiative Goals 1. To increase opportunities for system collaboration between colleges and school boards by creating strong links between the
systems through the work of Regional Planning Teams (forums, activities and dual credit projects). 2. To increase secondary student, parent and teacher awareness of the broader range of education/training and related career
opportunities offered through the college system. 3. To provide students with a broader range of learning opportunities, i.e., access to dual credit courses, to enhance student
engagement and increase reach-ahead opportunities. 4. To encourage more students to pursue further education and training. 5. To link teachers in the college and secondary panels through discussion seminars, professional development and exchange and internship opportunities.
Intended Target PopulationStudents, parents, administrators and teachers in school
boards and colleges.
Necessary IngredientsECU/TCU inter-ministerial collaboration and funding
support.System to system collaboration among board and college
administrators, teachers, professors and instructors through Regional Planning Team structure.
SCWI project management to ensure constructive Dialogue among participants, equitable distribution of
Ministries’ funding to the two sectors, and communication of Ministry policy directives to RPT chairs.
Intended Activities/strategiesSCWI Regional Planning Teams will coordinate activities,
participate in technical briefings, meetings, Symposia, and commit to meet SCWI accountabilityrequirements.
High school teachers and college professors work together to provide students with Dual Credit learning opportunities.
Over 100 activities with a focus on curriculum alignment and pathways to college; pre-service teacher preparation, teacher development and internships; awareness of college programs.
Over 100 one-day forums to support communication between colleges and school boards.
Intended Outcome To provide a broader range of learning opportunities for
secondary school students.To increase awareness of the pathways to college and
apprenticeship programs.To increase attendance, credit accumulation, retention
and graduation rates of secondary school students.To increase access to and participation in college and
apprenticeship programs.
Observed Target Population Secondary school studentsGrade 7 and 8 studentsParentsTeachers
Observed Necessary IngredientsResources to coordinate student and staff visits to colleges
often providedResources for curriculum gap analysis, development of
articulation agreements (release time, other support) present
Resources for transportation, accommodation (in some cases)
Incentives and invitations (free meeting space for school staff, with tour) provided
Observed Activities/Strategies Regional Planning Teams in placeWide array of experiences, ranging from college presence
at school Career Days to extended visits by students to college campus to Dual Credit programs at secondary school or at college
School and college staff undertake curriculum analysis for Dual Credits, articulation agreemetns
Shared professional development activities between secondary school and college staff
Organized programs/visits for parents, sometimes with personal invitation
Secondary school staff visits to college programs, some in corresponding disciplines, others more general to see the scope of the college programs and experience
Extended visits to college by faculty of education studentsSampler programs for secondary students, and in some
cases for Grades 6-8
Observed Outcome Increasing knowledge of college system and opportunities
by school personnelIncreased direct from secondary school enrolment at
collegesExperiences which allow students to see themselves in the
college environment

Appendix F: Evaluation Framework Elements of the SS/L18 Strategy
______________ September 2008 143

Appendix F: Evaluation Framework Elements of the SS/L18 Strategy
______________ September 2008 144
Numeracy
Description Designed to promote effective teaching, learning, and assessment of secondary school mathematics.
Aligns with all five of the Student Success/Learning to 18 goals: 1. Increase graduation rate and decrease drop out rate. 2. Support a good outcome for all students. 3. Provide students with new and relevant learning opportunities. 4. Build on students’ strengths and interests. 5. Provide students with an effective transition from elementary to secondary.
Initiative Goals 1. To raise the math competencies of Ontario Grade 7 to 12 school children. 2. To reduce the failure rate in Grade 7 to 12 mathematics. 3. To ensure secondary students have the skills necessary to join the workforce. 4. To close the gap between the curriculum and instruction/assessment.
Intended Target PopulationStudents in grades 7-12
Necessary IngredientsProfessional development and teacher trainingOnline teaching resources for students and
teachersContent differentiation between Applied and
Academic MathLocally Developed Courses (LDC)
Intended Activities/strategiesRevise the Applied Math CurriculumAllow the implementation of innovative Locally
Developed math courses Assessment instruction for teachersProvide teachers with new resource materials
Intended Outcome To increase the number students who meet the
minimal math requirement to graduate from highschool
To improve Ontario’s performance on national standardized math tests.
To increase the number of students enrolling in senior math courses.
Observed Target Population Students Grades 7-12Teachers Grades 7-12
Observed Necessary IngredientsProfessional development for teachers has been provided, but
not always overtly connected to the SS/L18 StrategyCollaboration between teachers of mathematics Grades 7-10
is happening frequentlyInsufficient manipulatives, technology and related PD for
students to participate effectivelyLocally Developed courses available
Observed Activities/Strategies Revised math curriculum implementedLocally Developed courses availableProfessional development, coaching on differentiated
instruction and assessmentNew resources and related PD reported in some schoolsRegular extra help sessions organized by math departmentGrade 9 math timetabled in same time slot to allow regrouping
of classes to provide extra support, smaller classes to those in need
Use of instructional technology such as the Smart Board, clickers
Some use of manipulativesSome peer tutoringRegular after school math sessionsSummer math camp prior to Grade 9Assignment of experienced, strong math teachers to Grade 9
Observed Outcome Many school report that EQAO test results show improvementMany schools report improved pass rates

Appendix F: Evaluation Framework Elements of the SS/L18 Strategy
______________ September 2008 145
Cooperative Education
Intended Target Population Students in grades 9 -12 Early school leavers Students at-risk of being early school leavers
Necessary IngredientsClassroom teachers’ knowledge of workplace
demands.Persons to organize and supervise placements of
students.TransportationEmployers willing to take on and train Coop students.Link to in-school courseRoom in student’s program for Coop as a choice
Intended Activities/Strategies Classroom preparation for the workplaceLocating Coop placements that match students’
interest.Workplace experience
Intended Outcome To increase the range and number of students
enrolled in Cooperative Education programs.To encourage students enrolled in Cooperative
Education programs to see connections between what they learn in school and what they do in the workplace.
Observed Target Population Some schools offering Coop in Grades 9 and 10, others not
until 11 or 12Some schools require all students to do Coop in Grade 12Early school leavers of all agesCoop for high risk students (needing more staff support)Coop for returning students 18 and 19 years oldNow including students with developmental delays
Observed Necessary Ingredients Coordination of placement is a larger challenge in urban areasGrade 9 and 10 Coop needs additional staff supportFor high needs students, job coaches (specially trained EAs) as a
supportTransportation issues for some in urban (cost) and rural
(availability) communitiesGenerally good support from local businesses, but challenges in
shrinking, high unemployment communitiesAccess to appropriate placement is a challenge in remote and in
French communitiesRequired link to an in‐school course sometimes a challengeRoom in the student’s schedule for Coop is a challenge, especially
in Catholic, French schoolsSeeing Cooperative Education as a possibility for all students
Observed Activities/Strategies Efforts to find good match between employer and student for
successContinuous intake CoopA graduated program for high risk students: job shadow, site
visit, short placement precede actual Coop placementJob coaches (specially trained EAs) help at risk students
negotiate difficultiesCoop within the school as a means of earning a credit where
a student was failingCan provide experiences that are unavailable in the school
setting (like a specific trade)
Observed Outcome Increase in range and number of students in Coop programsPractical introduction to job searching and job-related skills
and behaviourAccumulation of credits while doing practical, applied workPaid Coop permits students who would otherwise be early
leavers to earn credits to graduationFor Grade 9 and 10 students, Coop is a better solution than
SALEP
Description: A planned learning experience for which credits are earned that integrates classroom and workplace learning.
Aligns with four Student Success/Learning to 18 goals: 1. Increase graduation rate and decrease drop out rate. 2. Support a good outcome for all students. 3. Provide students with new and relevant learning opportunities. 4. Build on students’ strengths and interests. 5. Provide students with an effective transition from elementary to secondary.
Initiative Goals 1. To increase the scope of Cooperative Education placements. 2. To expand the range of students attracted to Cooperative Education – especially students at risk of leaving school prior to
graduation or failing to graduate. 3. To re-engage students and enable them to apply knowledge and skills from related coursework to learning in practical
settings.

Appendix F: Evaluation Framework Elements of the SS/L18 Strategy
______________ September 2008 146
Apprenticeship
Description Program designed to allow students to meet OSSD requirements while participating in an occupation that requires an apprenticeship.
Aligns with four Student Success/Learning to 18 goals: 1. Increase graduation rate and decrease drop out rate. 2. Support a good outcome for all students. 3. Provide students with new and relevant learning opportunities. 4. Build on students’ strengths and interests. 5. Provide students with an effective transition from elementary to secondary.
Initiative Goals1. To provide students with greater career opportunities in the skilled trades. 2. To provide students with tangible post-graduation option other than post-secondary education3. To expand the number of students attracted to skilled trades.4. To increase retention rates for students who are uninterested in pursuing an academic path
5. To increase graduation rates by awarding credit for apprenticeships 6. To encourage careers in the skilled trades.
Intended Target PopulationStudents who are 16 years of age and older. Students who are at risk of being early school
leavers.
Necessary IngredientsCommunity partnerships for placement positions. Industry involvement for curriculum alignment and the
certification process.Classroom teachers knowledge of workplace and
industry expectations.Persons to organize and supervise placements of
student.
Intended Activities/strategiesWorkplace preparation in the classroomOngoing Collaboration with industry and the Ministry
of Training, Colleges and Universities to facilitate dual credits, Advanced Standing and admission to post-secondary institutions.
Specialized course scheduling to facilitate students in apprenticeships.
Coop diploma apprenticeship which allows students to earn college credit with apprenticeship training.
Intended Outcome Increase high school retention and graduation ratesIncreased number of students choosing careers in
skilled trades.Increase the pace with which students are leaving
high school and entering the skilled trades workforce
Observed Target Population Students being attracted to schools with strong OYAP and
other apprenticeship connectionsApprenticeship appealing to some students who might
otherwise become school leavers
Observed Necessary IngredientsBusiness partnerships a challenge in some communities
(Toronto, smaller Northern communities)Curriculum expectations in tech studies vague when
compared to specific outcomes specified in apprenticeships
Some teachers report insufficient knowledge of apprenticeship system
OYAP coordinator role critical to communications with schools, business, parents
Some areas report difficulty finding OYAP spaces – they report that OYAP only available if the apprenticeship seat is not required by an adult.
Transportation support required in some communities
Observed Activities/Strategies OYAP coordinator presents to Grade 7 and 8 parentsBring Grade 8 students for workshops in tech classroomsAdvanced standing through articulation agreementsProvide exposure to a wide range of career paths for
students and parentsCoop used to provide workplace experience
Observed Outcome Apprenticeship linked to school success increases
relevance of school experience, makes diploma more meaningful
Students achieving level one apprenticeship, advanced standing while in school
A rewarding way to accumulate credits

Appendix F: Evaluation Framework Elements of the SS/L18 Strategy
______________ September 2008 147
Alternative Programs
Description Programs designed to re-engage students who have had trouble succeeding in traditional classrooms. The two most common programs are e-learning and co operative education.
Aligns with four Student Success/Learning to 18 goals: 1. Increase graduation rate and decrease drop out rate. 2. Support a good outcome for all students. 3. Provide students with new and relevant learning opportunities. 4. Build on students’ strengths and interests. 5. Provide students with an effective transition from elementary to secondary.
Initiative Goals 1. To re-engage students who are at risk of leaving school prior to graduation. 2. To increase the scope and number of alternative learning environments available to students struggling in the traditional environment. 3. Keep students in school.
Intended Target PopulationStudents in grades 9 -12 who are at risk of grade
failure or at risk of dropping out of high schoolStudents for whom traditional instruction and or
traditional classroom environments are not engaging or are not appropriate.
Students returning to high school in order to graduate.
Necessary IngredientsTeacher development and training.Computer technology and online resource materials.Extra staffing Student support staffDesignated classroom space Locally Developed Courses
Intended Activities/strategiesInnovative approaches to instruction (eg. E-learning
and Co-operative education)Social and emotional support for studentsTimetable flexibilityAlternative sites (off school, small office, or school
within a school).Allow implementation of Locally Developed Courses.
Intended Outcome To provide alternative educational opportunities for
at risk students.To increase the graduation rate.
Observed Target Population Students who have difficulty in traditional school/
classroom environmentStudents who are parents or pregnantStudents who have non-school challenges such as
homelessnessStudents who are behaviour problems, or who have been
suspended for behaviour issuesStudents who are incarceratedOlder returning school leavers who would not be
comfortable in a class with younger students
Observed Necessary IngredientsTeachers are generally attuned to different learning pace,
complex needsClassroom and electronic resource materials not always
suitable for independent learningInformation technology appropriate to program and needs
is sometimes not presentAccess to sympathetic student support staff: child and
youth workers, social work, guidance is lacking in many cases
Appropriate physical space is not always availableLocally Developed courses available
Observed Activities/Strategies Innovative approaches to instruction present in many
casesSocial and emotional support not always sufficient.
Coordination with other services (mental health, rehabilitation) in some cases.
Individually designed programAlternative sites (storefront centres) available in some
cases onlyProvision for continuous entryPrior learning assessment
Observed Outcome Students often return to mainstream from these programsProvide appropriate learning venues for older learners,
complex needsWell-connected with regular school personnel and
programs – not isolated

Appendix F: Evaluation Framework Elements of the SS/L18 Strategy
______________ September 2008 148
Renewal of Technological Education
Intended Target Population Students in Grades 9 to 12Students at risk of being early school leaversStudents who want to pursue a career in the trades or
technology
Necessary Ingredients Up-to-date equipment and safe learning environments
to support student technical skills developmentIndustrial-type equipment in technological education
facilities in working order including safety features. Long range plans in place and implementation
proceeding for technological education programs.Regular advisory committees meetings (at the board
and school level) to provide advice and input on technological education programs.
Intended Activities/Strategies Conduct an audit if how the 2003-04 and 2004-05
technological education funding provided greater opportunities for students’
Address health and safety issues in technological education equipment and facilities.
Identify and capital equipment needs to address the technological education curriculum (including Specialist High Skills Major(s)).
Intended Outcome Opportunities in technological education programs for
students to use safe, up-to-date industrial-type equipment in healthy facilities (e.g., air quality, noise level, etc.)
School boards and schools implementing long range plans for technological education
School boards and school building capacity to offer the Specialist High Skills Majors.
Observed Target Population Students in Grades 9 – 12Introducing students in Grades 7-8 to technological
educationStudents interested in pursuing careers in trades and
technologyStudents who enjoy learning by doing
Observed Necessary Ingredients Resources and software insufficient or outdated in many
cases In some areas, collaboration between coterminous boards
to share facilitiesSome strategic partnerships with industry to obtain state
of the art/industry facilitiesAreas of population/enrolment growth have been able to
build some facilities under their capital programs, older schools with stable or declining enrolment face bigger challenges
Sometimes, lack of facilities (shop facilities closed/gutted with advent of broad-based technologies and decline of tech enrolment in 1990s and few facilities for hands-on learning in Grades 7 and 8)
Students interested, many programs fullTeaching salaries not always high enough to attract
skilled trades
Observed Activities/Strategies School visits yielded information regarding state of
facilitiesHealth and safety certification often part of the programState of facilities will hinder intended growth of Specialist
High Skills Majors in areas requiring industrial standard facilities
Observed Outcome Growing student interest in tech education and skilled
tradesGrowth of SHSMs being shaped by facilities available
Description: Funds allocated to secondary schools for the renewal of technological education. Allocations are an indication of the role of technological education in SS/L18: (1) Hands-on, project-based approach to learning in technological education appeals to many disengaged students; (2) provides apprenticeship pathways and direct connection to the workplace; (3) approx. half of the workplace courses offered in secondary schools are in technological education subjects.
Aligns with four Student Success/Learning to 18 goals: 1. Increase graduation rate and decrease drop out rate. 2. Support a good outcome for all students. 3. Provide students with new and relevant learning opportunities. 4. Build on students’ strengths and interests. 5. Provide students with an effective transition from elementary to secondary.
Initiative Goals 1. To increase retention and graduation rates by providing formal pathways that encourage students to stay in school. 2. To prepare students for a successful transition to apprenticeship training, the workplace, or postsecondary education 3. To update capital equipment in technological education facilities so that students are engaged by new technology

Appendix F: Evaluation Framework Elements of the SS/L18 Strategy
______________ September 2008 149

Appendix G: Stage 2 Surveys
______________ September 2008 150
Appendix G: Stage 2 Surveys
Student Survey78 The Government of Ontario and the public education system have made efforts to improve students’ secondary school experience, to increase graduation rates, and improve educational outcomes for all secondary students. The Canadian Council on Learning (CCL) has been asked to do some research to see how well Ontario is doing at meeting those goals. This survey is part of that research. General Section The following questions are about your experience with secondary school in Ontario.
1. Are you familiar with the terms “Student Success Strategy” or “Learning to 18 Strategy”? a. Yes b. No
The following questions are about your recent experience in secondary school. When answering these questions, think only about your CURRENT YEAR in secondary school.
2. Are the following statements true or false?
a. Students get good advice and guidance for career preparation. b. Students get good advice and guidance in planning their further education. c. I have been able to take courses that I find interesting and challenging. d. There aren’t enough courses in subjects that interest me. e. The course(s) that I want to take don’t always run because there aren’t enough
students who want to take them. f. I have been able to take an e-learning or on-line course through my school when
the school couldn’t offer the course I was interested in. Co-operative Education Section Cooperative Education is a program that allows students to earn credits while completing a work placement in the community.
1. Are you familiar with co-operative education programs? a. No, I am not aware of this type of program (skip to next section). b. Yes, but I never taken any co-op courses c. Yes, I have taken at least one co-op course
2. Generally, who participates in co-operative education programs?
a. Students who are doing well in school b. Students who struggle in school
78 The student survey was also available in French.

Appendix G: Stage 2 Surveys
______________ September 2008 151
c. All students who want to participate d. Don’t know
3. In your opinion, are the following statements about co-operative education true or false?
a. Cooperative Education programs help students get course credits. b. Cooperative education programs help students improve their chances of
graduating from secondary school. c. Cooperative education programs help students better understand the material
taught in class. d. Cooperative education programs help students gain skills required for success in
the workplace. e. Cooperative education programs help students gain self-confidence. f. Cooperative education programs help students maintain their interest in school. g. Cooperative education programs help students prepare for courses in the future. h. Cooperative education programs help students prepare for post-secondary
education and training. i. Cooperative education programs help students experience a career of interest. j. Cooperative education programs help students in other ways.
4. In your opinion, are the following statements about co-operative education true or false?
a. Students know that co-operative education programs exist. b. There are enough spaces in co-operative education programs for all of the
students who want them. c. The co-operative education placements are conveniently located. d. It is easy for students to travel to the co-operative education placements that are
available. e. Parents support co-operative education programs. f. There are enough teachers/staff to support the co-operative education programs. g. Co-operative education programs take up the right amount of a student’s valuable
time. h. People value co-operative education programs.
5. To what extent do you agree or disagree with the following statement: Co-operative
education programs help students become more successful. a. Strongly agree b. Agree c. Disagree d. Strongly disagree
Student Success Teachers Section Each school has one or more teachers designated to assist students who are at risk of leaving school early or failing to complete high school successfully. These teachers can be known as “Student Success Teachers”.
1. Are you familiar with these teachers in your school? a. No, I am not aware of these teachers (skip to next section). b. Yes, but I have had no contact with such teachers.

Appendix G: Stage 2 Surveys
______________ September 2008 152
c. Yes, I have had contact with such teachers.
2. Who are student success teachers mainly responsible for? a. Students who are doing well in school b. Students who struggle in school c. All students d. Don’t know
3. In your opinion, are the following statements about student success teachers true or false?
a. Student Success Teachers help students get course credits. b. Student Success Teachers help students improve their chances of graduating from
secondary school. c. Student Success Teachers help students better understand the material taught in
class. d. Student Success Teachers help students gain work-related skills. e. Student Success Teachers help students gain self-confidence. f. Student success teachers help students maintain their interest in school. g. Student Success Teachers help students prepare for courses in the future. h. Student Success Teachers help students prepare for post-secondary education and
training. i. Student Success Teachers help students in other ways.
4. In your opinion, are the following statements about student success teachers true or false?
a. Students know that designated student success teachers exist. b. Student success teachers are available for all students who need them. c. Parents support student success teachers. d. People value student success teachers.
5. To what extent do you agree or with the following statement: Student success teachers
help students become more successful. a. Strongly agree b. Agree c. Disagree d. Strongly disagree
Credit Recovery Section Credit Recovery allows students to earn credit for a course that they have failed within the past two years. Students undertake only those portions of a course which were failed or not completed.
1. Are you familiar with credit recovery programs or initiatives? a. No, I am not aware of this type of program or initiative (skip to next section). b. Yes, but I have never participated in credit recovery. c. Yes, I have participated in credit recovery.
2. Generally, who participates in credit recovery programs?
a. Students who are doing well in school

Appendix G: Stage 2 Surveys
______________ September 2008 153
b. Students who struggle in school c. All students who want to participate d. Don’t know
3. In your opinion, are the following statements about credit recovery true or false?
a. Credit Recovery programs help students get course credits. b. Credit Recovery programs help students improve their chances of graduating
from secondary school. c. Credit Recovery programs help students better understand the material taught in
class. d. Credit Recovery programs help students gain self-confidence. e. Credit Recovery programs help students maintain their interest in school. f. Credit Recovery programs help students prepare for courses in the future. g. Credit Recovery programs help students prepare for post-secondary education
and training. h. Credit Recovery programs help students in other ways.
4. In your opinion, are the following statements about credit recovery true or false?
a. Students know that credit recovery programs exist. b. There are enough credit recovery programs for all students who want them. c. Parents support credit recovery programs. d. There are enough teachers/staff to support the credit recovery programs. e. Credit recovery programs take up the right amount of a student’s valuable time. f. People value credit recovery programs.
5. To what extent do you agree with the following statement: Credit recovery programs help
students become more successful. a. Strongly agree b. Agree c. Disagree d. Strongly disagree
School to College Programs Section Some schools work with their local colleges to provide opportunities for students to visit and sample college programs. Sometimes, people from the college offer information nights for students and their parents. These are examples of School to College information and programs. 1. Are you familiar with this type of program?
a. No, I am not aware of this type of program or initiative (skip to next section). b. Yes, but I have never participated in school to college programs. c. Yes, I have participated in school to college programs.
2. Generally, who participates in these programs?
a. Students who are doing well in school b. Students who struggle in school c. All students who want to participate

Appendix G: Stage 2 Surveys
______________ September 2008 154
d. Don’t know 3. In your opinion, are the following statements about school to college information and
experience programs true or false? a. School to College information and experience programs help students improve
their chances of graduating from secondary school. b. School to College information and experience programs help students better
understand the material taught in class. c. School to College information and experience programs help students gain work-
related skills. d. School to College information and experience programs help students gain self-
confidence. e. School to College information and experience programs help students maintain
their interest in school. f. School to College information and experience programs help students prepare for
courses in the future. g. School to College information and experience programs help students prepare for
post-secondary education and training. h. School to College information and experience programs help students in other
ways. 4. In your opinion, are the following statements about school to college information and
experience programs true or false? a. Students know that school to college programs exist. b. There are enough school to college programs for all students who want them. c. School to college programs are conveniently located. d. It is easy for students to travel to the school to college programs that are
available. e. Parents support school to college programs. f. There are enough teachers/staff to support the school to college programs. g. School to college programs take up the right amount of a student’s valuable time. h. People value school to college programs.
5. To what extent do you agree with the following statement: school to college programs
help students become more successful. a. Strongly agree b. Agree c. Disagree d. Strongly disagree
Ontario Youth Apprenticeship Program Section The Ontario Youth Apprenticeship Program or other apprenticeship initiatives give high school students the opportunity to learn a trade or craft under the supervision of an experienced trades or crafts person.
1. Are you familiar with these programs? a. No, I am not aware of this type of program or initiative (skip to next section).

Appendix G: Stage 2 Surveys
______________ September 2008 155
b. Yes, but I have never participated in an apprenticeship program. c. Yes, I have participated in an apprenticeship program.
2. Generally, who participates in apprenticeship programs?
a. Students who are doing well in school b. Students who struggle in school c. All students who want to participate d. Don’t know
3. In your opinion, are the following statements about apprenticeship programs true or
false? a. Apprenticeship programs help students get course credits. b. Apprenticeship programs help students improve their chances of graduating from
secondary school. c. Apprenticeship programs help students better understand the material taught in
class. d. Apprenticeship programs help students gain work-related skills. e. Apprenticeship programs help students gain self-confidence. f. Apprenticeship programs help students maintain their interest in school. g. Apprenticeship programs help students prepare for courses in the future. h. Apprenticeship programs help students prepare for post-secondary education and
training. i. Apprenticeship programs help students in other ways.
4. In your opinion, are the following statements about apprenticeship programs true or
false? a. Students know that apprenticeship programs exist. b. There are enough apprenticeship programs for all students who want them. c. The apprenticeship programs are conveniently located. d. It is easy for students to travel to the apprenticeship programs that are available. e. Parents support apprenticeship programs. f. There are enough teachers/staff to support the apprenticeship programs. g. Apprenticeship programs take up the right amount of a student’s valuable time. h. People value apprenticeship programs.
5. To what extent do you agree with the following statement: Apprenticeship programs or
initiatives help students become more successful? a. Strongly agree b. Agree c. Disagree d. Strongly disagree
Dual Credit Programs Section Dual Credit programs allow high school students to earn credits which simultaneously count toward the OSSD and a post-secondary diploma, a degree or an apprenticeship certification.

Appendix G: Stage 2 Surveys
______________ September 2008 156
1. Are you familiar with dual credit programs? a. No, I am not aware of this type of program or initiative (skip to next section). b. Yes, but I have never participated in a dual credit program. c. Yes, I have participated in a dual credit program.
2. Generally, who participates in dual credit programs?
a. Students who are doing well in school b. Students who struggle in school c. All students who want to participate d. Don’t know
3. In your opinion, are the following statements about dual credit programs true or false?
a. Dual Credit programs help students get course credits. b. Dual Credit programs help students improve their chances of graduating from
secondary school. c. Dual Credit programs help students better understand the material taught in class. d. Dual Credit programs help students gain work-related skills. e. Dual Credit programs help students gain self-confidence. f. Dual Credit programs help students maintain their interest in school. g. Dual Credit programs help students prepare for courses in the future. h. Dual Credit programs help students prepare for post-secondary education and
training. i. Dual Credit programs help students in other ways.
4. In your opinion, are the following statements about dual credit programs true or false?
a. Students know that dual credit programs exist. b. There are enough dual credit programs for all students who want them. c. The dual credit programs are conveniently located. d. It is easy for students to travel to the dual credit programs that are available. e. Parents support dual credit programs. f. There are enough teachers/staff to support the dual credit programs. g. Dual credit programs take up the right amount of a student’s valuable time. h. People value dual credit programs.
5. To what extent do you agree or disagree with the following statement: Dual credit
programs help students become more successful. a. Strongly agree b. Agree c. Disagree d. Strongly disagree
Specialist High Skills Majors Section
Specialist High Skills Major programs allow students to focus their secondary school studies in a specific area of interest while still meeting the requirements for graduation. Students complete a package of eight to twelve courses related to a specific skill or interest area that counts toward the Ontario Secondary School Diploma credit requirements.

Appendix G: Stage 2 Surveys
______________ September 2008 157
1. Are you aware of the Specialist High Skills Major program?
a. No, I am not aware of this type of program or initiative (skip to next section). b. Yes, but I have never participated in a Specialist High Skills Major. c. Yes, I have participated in a Specialist High Skills Major.
2. Generally, who participates in Specialist High Skills Major programs?
a. Students who are doing well in school b. Students who struggle in school c. All students who want to participate d. Don’t know
3. In your opinion, are the following statements about Specialist High Skills Major true or
false? a. Specialist High Skills Major programs help students get course credits. b. Specialist High Skills Major programs help students improve their chances of
graduating from secondary school. c. Specialist High Skills Major programs help students better understand the
material taught in class. d. Specialist High Skills Major programs help students gain work-related skills. e. Specialist High Skills Major programs help students gain self-confidence. f. Specialist High Skills Major programs help students maintain their interest in
school. g. Specialist High Skills Major programs help students prepare for courses in the
future. h. Specialist High Skills Major programs help students prepare for post-secondary
education and training. i. Specialist High Skills Major programs help students in other ways.
4. In your opinion, are the following statements about Specialist High Skills Major true or
false? a. Students know that Specialist High Skills Major programs exist. b. There are enough Specialist High Skills Major programs for all students who
want them. c. The Specialist High Skills Major programs are conveniently located. d. It is easy for students to travel to the Specialist High Skills Major programs that
are available. e. Parents support Specialist High Skills Major programs. f. There are enough teachers/staff to support the Specialist High Skills Major
programs. g. Specialist High Skills Major programs take up the right amount of a student’s
valuable time. h. People value Specialist High Skills Major programs.
5. To what extent do you agree with the following statement: Specialist High Skills Major
programs help students become more successful. a. Strongly agree b. Agree

Appendix G: Stage 2 Surveys
______________ September 2008 158
c. Disagree d. Strongly disagree
Post-Secondary Section The following statements are about your sources of information about learning opportunities at the post-secondary level. 1. To what extent were you made aware during your studies of learning opportunities at college or university or through apprenticeships?
a. Strongly aware (know about admission procedures, have visited a campus, etc.). b. Somewhat aware. c. Know very little about what opportunities are available, or how to gain admission.
2. Are following statements about your sources of information about learning opportunities at
the post-secondary level true or false? a. I learned about such opportunities by participating in a course that will lead to credit
at a college or towards apprenticeship. b. I learned about such opportunities through my parents or other family. members. c. I learned about such opportunities through a secondary school teacher. d. I learned about such opportunities through the guidance counsellor. e. I learned about such opportunities by taking courses that focus on a particular
industry such as manufacturing, hospitality, arts and culture, etc. f. I learned about such opportunities by other means.
3. After high school, you plan to:
a. Go to work b. Go to college c. Become an apprentice d. Go to university e. You don’t have any plans yet.
School Experience Section The following questions are about your recent experience in secondary school. When answering these questions, think only about your current year in secondary school. Remember, your answers will be kept strictly confidential. How often are the following statements true for you?
1. I pay attention to the teacher.
a. Rarely or Never b. Some of the time c. Often d. Most of the time or always
2. I do as little work as possible, I just want to get by.
a. Rarely or Never

Appendix G: Stage 2 Surveys
______________ September 2008 159
b. Some of the time c. Often d. Most of the time or always
3. I get along with teachers.
a. Rarely or Never b. Some of the time c. Often d. Most of the time or always
4. I am interested in what I am learning in class.
a. Rarely or Never b. Some of the time c. Often d. Most of the time or always
5. I complete my homework on time.
a. Rarely or Never b. Some of the time c. Often d. Most of the time or always
6. At my school, it is difficult to make new friends. a. Rarely or Never b. Some of the time c. Often d. Most of the time or always
7. I like to participate in many school activities (for example, sports, clubs, plays).
a. Rarely or Never b. Some of the time c. Often d. Most of the time or always
8. Most of my teachers don’t really care about me.
a. Rarely or Never b. Some of the time c. Often d. Most of the time or always
9. There are teachers or other adults in my school whom I could talk to if I had a problem.
a. Rarely or Never b. Some of the time c. Often d. Most of the time or always
10. School is a waste of time.

Appendix G: Stage 2 Surveys
______________ September 2008 160
a. Rarely or Never b. Some of the time c. Often d. Most of the time or always
11. I have friends at school whom I could talk to about personal things.
a. Rarely or Never b. Some of the time c. Often d. Most of the time or always
12. Most of my teachers really listen to what I have to say.
a. Rarely or Never b. Some of the time c. Often d. Most of the time or always
13. If I need extra help, I receive it from my teachers.
a. Rarely or Never b. Some of the time c. Often d. Most of the time or always
14. My school is a place where I feel like an outsider or like I am left out of things.
a. Rarely or Never b. Some of the time c. Often d. Most of the time or always
Demographic Section The following questions are about you and your family.
1. What is your gender?
a. Male b. Female
2. How old are you (in years)? a. 12 or younger b. 13 c. 14 d. 15 e. 16 f. 17 g. 18 h. 19 or older
3. What type of school do you attend?

Appendix G: Stage 2 Surveys
______________ September 2008 161
a. English Catholic b. English Public c. French Catholic d. French Public
4. What grade are you in? a. Grade 9 b. Grade 10 c. Grade 11 d. Grade 12
5. How many high schools have you attended?
a. One b. Two c. Three d. Four or more
6. How many credits have you earned in secondary school?
a. 5 or less b. 6-10 c. 11-15 d. 16-20 e. 21-25 f. 26-30 g. 31-35 h. 36-40 i. 41 or more
In answering the following questions, think only of your current courses. 7. Are the following statements about your current courses true or false?
a. At least one of the courses I am currently taking has the “Academic” designation. b. At least one of the courses I am currently taking has the “Applied” designation. c. At least one of the courses I am currently taking has the “Open” designation. d. At least one of the courses I am currently taking has the “University” designation. e. At least one of the courses I am currently taking has the “College” designation. f. At least one of the courses I am currently taking has the “Workplace” designation. g. At least one of the courses I am currently taking has the “Locally Developed
Compulsory Credit (LDCC)” designation. 8. Have you successfully completed the Ontario Secondary School Literacy Test (OSSLT)?
a. Yes (skip next question) b. I haven’t taken it yet. (skip next question) c. No
9. If you have been unsuccessful on the Ontario Secondary School Literacy Test, have you taken the Ontario Secondary School Literacy Course (OSSLC)?
a. Yes, I have taken it.

Appendix G: Stage 2 Surveys
______________ September 2008 162
b. I haven’t taken it yet, but plan to take it. c. I don’t plan to take it.
10. Have you attended a secondary school outside of Ontario?
a. Yes (skip the next question) b. No
11. In what grade did you start secondary school in Ontario?
a. Grade 9 b. Grade 10 c. Grade 11 d. Grade 12 e. Other
12. In which country were you born?
a. Canada b. Other c. Don’t know
13. In which country was your mother born?
a. Canada b. Other c. Don’t know
14. In which country was your father born?
a. Canada b. Other c. Don’t know
15. What language do you most often speak at home?
a. English b. French c. Other
Thank you for participating in the survey!

Appendix G: Stage 2 Surveys
______________ September 2008 163
School Staff Survey
The Government of Ontario and the public education system have made efforts to improve students’ secondary school experience, to increase graduation rates, and improve educational outcomes for all secondary students. The Canadian Council on Learning (CCL) has been asked to do some research to see how well Ontario is doing at meeting those goals. This survey is part of that research. Please note that your participation in the survey is entirely anonymous and voluntary. By completing this survey, you are agreeing to participate in this research. This survey will take approximately 15-20 minutes of your time. The following questions are about your experience as a staff member in an Ontario secondary school. While some questions appear to be directed at teachers, we welcome the participation of all interested adults working in the secondary schools, regardless of their position. If a question does not seem to pertain to you, you can simply move on to the next question. Demographic Section 1. What is your position in the school?
a. Teacher b. Student Success Teacher c. Special education teacher d. Guidance and/or career counselor e. Vice-principal f. Principal g. Administrative assistant h. Other
General Section
1. Are you familiar with the terms “Student Success Strategy” or “Learning to 18 Strategy”? a. Yes b. No
Demographic Section
2. Are you a member of the Student Success team at your school? a. Yes b. No
Student Success Teachers Section Each school has one or more teachers designated to assist students who are at risk of leaving school early or failing to complete high school successfully. These teachers can be known as “Student Success Teachers”.

Appendix G: Stage 2 Surveys
______________ September 2008 164
1. Are you familiar with these teachers in your school?
a. No, I am not aware of these teachers (skip to next section). b. Yes, but I have no contact with such teachers. c. Yes, I am a Student Success Teacher or I have direct contact with such teachers.
2. Student Success Teachers are mainly responsible for?
a. Students who are doing well in school b. Students who struggle in school c. All students d. Don’t know
3. In your opinion, are the following statements about Student Success Teachers true or
false? a. Student Success Teachers help students get course credits. b. Student Success Teachers help students improve their chances of graduating from
secondary school. c. Student Success Teachers help students better understand the material taught in
class. d. Student Success Teachers help students gain work-related skills. e. Student Success Teachers help students gain self-confidence. f. Student Success Teachers help students maintain their interest in school. g. Student Success Teachers help students prepare for courses in the future. h. Student Success Teachers help students prepare for post-secondary education and
training. i. Student Success Teachers help students in other ways.
4. In your opinion, are the following statements about Student Success Teachers true or
false? a. Students know that dedicated Student Success Teachers exist. b. Student Success Teachers are available for all students who need them. c. Parents support Student Success Teachers. d. There are enough Student Success Teachers. e. People value Student Success Teachers.
5. To what extent do you agree with the following statement: Student Success Teachers help
students become more successful. a. Strongly agree b. Agree c. Disagree d. Strongly disagree
Credit Recovery Section Credit Recovery allows students to earn credit for a course that they have failed within the past two years. Students undertake only those portions of a course which were failed or not completed.

Appendix G: Stage 2 Surveys
______________ September 2008 165
1. Are you familiar with Credit Recovery programs or initiatives? a. No, I am not aware of this type of program or initiative (skip to next section). b. Yes, but I have no direct experience with such a program or initiative. c. Yes, I have direct experience with such a program or initiative.
2. Generally, who participates in Credit Recovery programs?
a. Students who are doing well in school b. Students who struggle in school c. All students who want to participate d. Don’t know
3. In your opinion, are the following statements about Credit Recovery true or false?
a. Credit Recovery programs help students get course credits. b. Credit Recovery programs help students improve their chances of graduating
from secondary school. c. Credit Recovery programs help students better understand the material taught in
class. d. Credit Recovery programs help students gain self-confidence. e. Credit Recovery programs help students maintain their interest in school. f. Credit Recovery programs help students prepare for courses in the future. g. Credit Recovery programs help students prepare for post-secondary education
and training. h. Credit Recovery programs help students in other ways.
4. In your opinion, are the following statements about Credit Recovery true or false?
a. Students know that Credit Recovery programs exist. b. There are enough Credit Recovery programs for all students who want them. c. Parents support Credit Recovery programs. d. There are enough teachers/staff to support the Credit Recovery programs. e. Credit Recovery programs take up the right amount of a student’s valuable time. f. People value Credit Recovery programs.
5. To what extent do you agree with the following statement: Credit Recovery programs
help students become more successful. a. Strongly agree b. Agree c. Disagree d. Strongly disagree
Cooperative Education Section Cooperative Education is a program that allows students to earn credits while completing a work placement in the community.
1. Are you familiar with Cooperative Education programs? a. No, I am not aware of this type of program (skip to next section). b. Yes, but I have no direct experience in such a program or initiative. c. Yes, I have direct experience with such a program or initiative

Appendix G: Stage 2 Surveys
______________ September 2008 166
2. Generally, who participates in Cooperative Education programs?
a. Students who are doing well in school b. Students who struggle in school c. All students who want to participate d. Don’t know
3. In your opinion, are the following statements about Cooperative Education true or false?
a. Cooperative Education programs help students get course credits. b. Cooperative Education programs help students improve their chances of
graduating from secondary school. c. Cooperative Education programs help students better understand the material
taught in class. d. Cooperative Education programs help students gain skills required for success in
the workplace. e. Cooperative Education programs help students gain self-confidence. f. Cooperative Education programs help students maintain their interest in school. g. Cooperative Education programs help students prepare for courses in the future. h. Cooperative Education programs help students prepare for post-secondary
education and training. i. Cooperative Education programs help students experience a career of interest. j. Cooperative Education programs help students in other ways.
4. In your opinion, are the following statements about Cooperative Education true or false?
a. Students know that Cooperative Education programs exist. b. There are enough spaces in Cooperative Education programs for all of the
students who want them. c. The Cooperative Education placements are conveniently located. d. It is easy for students to travel to the Cooperative Education placements that are
available. e. Parents support Cooperative Education programs. f. There are enough Cooperative Education teachers. g. Students with special needs have difficulty participating in Cooperative
Education because there not appropriate accommodations or supports available in workplace settings.
h. Students who could benefit from a Cooperative Education placement do not take Cooperative Education credits because they do not meet the current criteria for placement readiness.
i. Cooperative Education programs take up the right amount of a student’s valuable time.
j. People value Cooperative Education programs.
5. To what extent do you agree or disagree with the following statement: Cooperative Education programs help students become more successful.
a. Strongly agree b. Agree c. Disagree d. Strongly disagree

Appendix G: Stage 2 Surveys
______________ September 2008 167
School to College Programs Section
Some schools work with their local colleges to provide opportunities for students to visit and sample college programs. Sometimes, people from the college offer information nights for students and their parents. These are examples of School to College information and programs. 1. Are you familiar with this type of program?
a. No, I am not aware of this type of program or initiative (skip to next section). b. Yes, but I have no direct experience with such a program or initiative. c. Yes, I have direct experience with such a program or initiative.
2. Generally, who participates in these programs?
a. Students who are doing well in school b. Students who struggle in school c. All students who want to participate d. Don’t know
3. In your opinion, are the following statements about School to College information and
programs true or false? a. School to College information and experience programs help students improve
their chances of graduating from secondary school. b. School to College information and experience programs help students better
understand the material taught in class. c. School to College information and experience programs help students gain work-
related skills. d. School to College information and experience programs help students gain self-
confidence. e. School to College information and experience programs help students maintain
their interest in school. f. School to College information and experience programs help students prepare for
courses in the future. g. School to College information and experience programs help students prepare for
post-secondary education and training. h. School to College information and experience programs help students in other
ways. 4. In your opinion, are the following statements about School to College information and
programs true or false? a. Students know that School to College programs exist. b. There are enough School to College programs for all students who want them. c. School to College programs are conveniently located. d. It is easy for students to travel to the School to College programs that are
available. e. Parents support School to College programs. f. There are enough teachers/staff to support the School to College programs.

Appendix G: Stage 2 Surveys
______________ September 2008 168
g. School to College programs take up the right amount of a student’s valuable time.
h. People value School to College programs. 5. To what extent do you agree with the following statement: School to College information
and programs help students become more successful. a. Strongly agree b. Agree c. Disagree d. Strongly disagree
Ontario Youth Apprenticeship Programs Section The Ontario Youth Apprenticeship Program or other apprenticeship initiatives give high school students the opportunity to learn a trade or craft under the supervision of an experienced trades or crafts person.
1. Are you familiar with the Ontario Youth Apprenticeship Program or other Apprenticeship initiatives?
a. No, I am not aware of this type of program or initiative (skip to next section). b. Yes, but I have no direct experience with such a program or initiative. c. Yes, I have direct experience with such a program or initiative.
2. Generally, who participates in Apprenticeship programs?
a. Students who are doing well in school b. Students who struggle in school c. All students who want to participate d. Don’t know
3. In your opinion, are the following statements about Apprenticeship programs true or false?
a. Apprenticeship programs help students get course credits. b. Apprenticeship programs help students improve their chances of graduating from
secondary school. c. Apprenticeship programs help students better understand the material taught in
class. d. Apprenticeship programs help students gain work-related skills. e. Apprenticeship programs help students gain self-confidence. f. Apprenticeship programs help students maintain their interest in school. g. Apprenticeship programs help students prepare for courses in the future. h. Apprenticeship programs help students prepare for post-secondary education and
training. i. Apprenticeship programs help students in other ways.
4. In your opinion, are the following statements about Apprenticeship programs true or
false? a. Students know that Apprenticeship programs exist. b. There are enough Apprenticeship programs for all students who want them. c. The Apprenticeship programs are conveniently located.

Appendix G: Stage 2 Surveys
______________ September 2008 169
d. It is easy for students to travel to the Apprenticeship programs that are available. e. Parents support Apprenticeship programs. f. There are enough teachers/staff to support the Apprenticeship programs. g. Apprenticeship programs take up the right amount of a student’s valuable time. h. People value Apprenticeship programs.
5. To what extent do you agree with the following statement: Apprenticeship programs or
initiatives help students become more successful. a. Strongly agree b. Agree c. Disagree d. Strongly disagree
Dual Credit Programs Section
Dual Credit programs allow high school students to earn credits which simultaneously count toward the OSSD and a post-secondary diploma, a degree or an apprenticeship certification. 1. Are you familiar with Dual Credit programs?
a. No, I am not aware of this type of program or initiative (skip to next section). b. Yes, but I have no direct experience in such a program or initiative. c. Yes, I have direct experience with such a program or initiative.
2. Generally, who participates in Dual Credit programs?
a. Students who are doing well in school b. Students who struggle in school c. All students who want to participate d. Don’t know
3. In your opinion, are the following statements about Dual Credit programs true or false?
a. Dual Credit programs help students get course credits. b. Dual Credit programs help students improve their chances of graduating from
secondary school. c. Dual Credit programs help students better understand the material taught in class. d. Dual Credit programs help students gain work-related skills. e. Dual Credit programs help students gain self-confidence. f. Dual Credit programs help students maintain their interest in school. g. Dual Credit programs help students prepare for courses in the future. h. Dual Credit programs help students prepare for post-secondary education and
training. i. Dual Credit programs help students in other ways.
4. In your opinion, are the following statements about Dual Credit programs true or false?
a. Students know that Dual Credit programs exist. b. There are enough Dual Credit programs for all students who want them. c. The Dual Credit programs are conveniently located. d. It is easy for students to travel to the Dual Credit programs that are available.

Appendix G: Stage 2 Surveys
______________ September 2008 170
e. Parents support Dual Credit programs. f. There are enough teachers to support the Dual Credit programs. g. Dual Credit programs take up the right amount of a student’s valuable time. h. People value Dual Credit programs.
5. To what extent do you agree or disagree with the following statement: Dual Credit
programs help students become more successful. a. Strongly agree b. Agree c. Disagree d. Strongly disagree
Specialist High Skills Majors Section
Specialist High Skills Major programs allow students to focus their secondary school studies in a specific area of interest while still meeting the requirements for graduation. Students complete a package of eight to twelve courses related to a specific skill or interest area that counts toward the Ontario Secondary School Diploma credit requirements. 1. Are you familiar with the Specialist High Skills Major program?
a. No, I am not aware of this type of program or initiative (skip to next section). b. Yes, but I have no direct experience with such a program or initiative. c. Yes, I have direct experience with such a program or initiative.
2. Generally, who participates in Specialist High Skills Major programs?
a. Students who are doing well in school b. Students who struggle in school c. All students who want to participate d. Don’t know
3. In your opinion, are the following statements about Specialist High Skills Majors true or
false? a. Specialist High Skills Major programs help students get course credits. b. Specialist High Skills Major programs help students improve their chances of
graduating from secondary school. c. Specialist High Skills Major programs help students better understand the
material taught in class. d. Specialist High Skills Major programs help students gain work-related skills. e. Specialist High Skills Major programs help students gain self-confidence. f. Specialist High Skills Major programs help students maintain their interest in
school. g. Specialist High Skills Major programs help students prepare for courses in the
future. h. Specialist High Skills Major programs help students prepare for post-secondary
education and training. i. Specialist High Skills Major programs help students in other ways.

Appendix G: Stage 2 Surveys
______________ September 2008 171
4. In your opinion, are the following statements about Specialist High Skills Majors true or false?
a. Students know that Specialist High Skills Major programs exist. b. There are enough Specialist High Skills Major programs for all students who
want them. c. The Specialist High Skills Major programs are conveniently located. d. It is easy for students to travel to the Specialist High Skills Major programs that
are available. e. Parents support Specialist High Skills Major programs. f. There are enough teachers for the Specialist High Skills Major programs. g. Specialist High Skills Major programs take up the right amount of a student’s
valuable time. h. People value Specialist High Skills Major programs.
5. To what extent do you agree with the following statement: Specialist High Skills Major
programs help students become more successful? a. Strongly agree b. Agree c. Disagree d. Strongly disagree
General Section For the following statements, indicate to what degree you agree with the statement.
1. Teachers in my school build literacy skills into their daily lessons. a. Strongly agree b. Agree c. Disagree d. Strongly disagree
2. There is a new focus in this school on building students’ competencies in mathematics.
a. Strongly agree b. Agree c. Disagree d. Strongly disagree
3. Teachers in my school keep an eye on how Grade 9 students are doing.
a. Strongly agree b. Agree c. Disagree d. Strongly disagree
4. This school makes an effort to welcome its Grade 9 students and make them feel that they
can succeed in secondary school. a. Strongly agree b. Agree c. Disagree

Appendix G: Stage 2 Surveys
______________ September 2008 172
d. Strongly disagree
5. For students who might struggle, this school can make an individual timetable that builds on students’ strengths.
a. Strongly agree b. Agree c. Disagree d. Strongly disagree
6. There is more discussion among teachers about marking and standards than there was four
years ago. a. Strongly agree b. Agree c. Disagree d. Strongly disagree
7. Schools are under too much pressure to improve graduation and pass rates.
a. Strongly agree b. Agree c. Disagree d. Strongly disagree
8. Monitoring, tracking, reporting, and planning measures are in place in the school.
a. Strongly agree b. Agree c. Disagree d. Strongly disagree
9. Monitoring, tracking, reporting, and planning measures are being used by the school in
order to drive improvement in student success. a. Strongly agree b. Agree c. Disagree d. Strongly disagree
10. This school has the physical facilities to implement the Student Success / Learning to 18 Strategy.
a. Strongly agree b. Agree c. Disagree d. Strongly disagree
11. This school has the human resources necessary to implement the Student Success /
Learning to 18 Strategy. a. Strongly agree b. Agree c. Disagree d. Strongly disagree

Appendix G: Stage 2 Surveys
______________ September 2008 173
12. This school has the professional skills and knowledge needed to implement the Student
Success / Learning to 18 Strategy. a. Strongly agree b. Agree c. Disagree d. Strongly disagree
13. This school has enough non-teaching support staff (social workers, psychologists, youth
workers, educational assistants) to support students to become successful. a. Strongly agree b. Agree c. Disagree d. Strongly disagree
14. Staff at this school act upon student-level data and information to intervene with and
support students. a. Strongly agree b. Agree c. Disagree d. Strongly disagree
15. My school is making efforts to align resources and practices to the goals of the Student
Success / Learning to 18 Strategy. a. Strongly agree b. Agree c. Disagree d. Strongly disagree
16. Programs that were having little impact on student success are being replaced by other
programs that have more impact. a. Strongly agree b. Agree c. Disagree d. Strongly disagree
The following questions pertain to guidance, course opportunities for students in your school, and teaching practices. Some of these questions can best be answered by teachers. If you feel that a question does not apply to you or that you cannot answer a question based on your current knowledge, please do not answer it and move on to the next question.
17. Are the following statements true or false? a. Students get good advice and guidance for career preparation. b. Students get good advice and guidance in planning their further education. c. Students are able to take courses that are interesting and challenging. d. The course(s) that students want or should take don’t always run because there
aren’t enough students to make up a class.

Appendix G: Stage 2 Surveys
______________ September 2008 174
e. E-learning or on-line courses are available through my school when the school can’t offer a regular class.
f. I try to connect what I am teaching to students’ career aspirations and future learning.
g. I focus on my subject and helping students succeed with the course material. h. It’s part of my job to be interested in students’ plans for the future.
The following questions are specifically directed at secondary school teachers and focus on teaching practices. If you feel that a question does not apply to you, please do not answer it and move on to the next question
18. Are the following statements true or false? a. I am aware of opportunities available to my students at university. b. I am aware of opportunities available to my students at the local college. c. I am aware of the opportunities available to my students in the college system. d. I am aware of Apprenticeship opportunities for my students. e. I know very little about what is available to students in this school after
graduation. Professional Development Section The following questions are to do with the different types of professional development you received since September 2006.
1. Are the following questions true or false? a. Since September 2006, I have participated in a professional development day. b. Since September 2006, I have participated in a workshop at my school. c. Since September 2006, I have participated in a workshop at my board. d. Since September 2006, I have participated in a regional workshop or conference. e. Since September 2006, I have participated in a provincial conference. f. Since September 2006, I have participated in an additional qualifications course. g. Since September 2006, I have participated in another kind of course at a faculty
of education. h. Since September 2006, I have participated in in-class visiting or observing. i. Since September 2006, I have been coached by a senior teacher. j. Since September 2006, I have participated in team teaching. k. Since September 2006, I have participated in online or web-cast courses. l. Since September 2006, I have participated in other forms of professional
development.
2. Since September 2005, have you taken part in professional development related to the Student Success/Learning to 18 strategy?
a. Yes b. No (skip to question 60)
3. Are the following statements pertaining to the professional development specifically
related to the Student Success / Learning to 18 Strategy you have received since September 2005 true or false?

Appendix G: Stage 2 Surveys
______________ September 2008 175
a. I received information about the Student Success / Learning to 18 strategy at a staff meeting.
b. I received information about the Student Success / Learning to 18 strategy at a workshop or event on a professional development day.
c. I received information about the Student Success / Learning to 18 strategy at an after school workshop or event.
d. I received information about the Student Success / Learning to 18 strategy at a workshop or event for which I was released from my regular duties.
e. I attended a regional conference or symposium focusing on the Student Success / Learning to 18 strategy.
f. I attended a provincial conference or symposium focusing on the Student Success / Learning to 18 strategy.
Teaching Experience The following questions seek information about your position and assignment.
1. How long have you been in your current position? a. 5 years or less b. 6 to 10 years c. 11 to15 years d. 16 to 20 years e. More than 20 years
The following questions are directed at teachers. If you are not a teacher, please do not answer these questions and move on to the next section.
2. Are the following statements about the courses you currently teach true or false? a. I currently teach Languages (including English, French and other languages). b. I currently teach Social Sciences (including History, Geography, Family Studies,
Politics, Humanities, Philosophy, Sociology, Psychology, etc) c. I currently teach Sciences & Technology (including Biology, Health, Physics,
Chemistry, Computer sciences, Nutrition, etc.) d. I currently teach Math e. I currently teach Art (including Music, Drama, Dance, Visual Arts, Design,
Fashion, etc.) f. I currently teach Religion g. I currently teach Physical Education h. I currently teach Law i. I currently teach Administration (including Business, Accounting, Economics,
etc.) j. I currently teach Marketing & Retailing k. I currently teach Trades l. I currently teach Career Planning m. I currently teach Co-op course n. I currently teach other types of courses.
3. Are the following statements about the courses you currently teach true or false?

Appendix G: Stage 2 Surveys
______________ September 2008 176
a. I currently teach Grade 9 b. I currently teach Grade 10 c. I currently teach Grade 11 d. I currently teach Grade 12
4. Are the following statements about the courses you currently teach true or false?
a. I currently teach an Applied course. b. I currently teach an Academic course. c. I currently teach a College course. d. I currently teach an Essentials course. e. I currently teach a Locally Developed course. f. I currently teach an Open course. g. I currently teach a University course. h. I currently teach a Workplace course.
5. How many years of experience do you have in the Ontario secondary school system? a. 0-5 years b. 6-10 years c. 11-15 years d. 16-20 years e. 21-25 years f. 26-30 years g. More than 30 years
Demographic Section
1. Are you male or female? a. Male b. Female
2. How old are you (in years)?
a. 25 or under b. 26-30 c. 31-35 d. 36-40 e. 41-45 f. 46-50 g. 51-55 h. More than 55
3. In which country were you born?
a. Canada b. Other
4. What language do you most often speak at home? a. English b. French c. Other

Appendix G: Stage 2 Surveys
______________ September 2008 177
5. In what type of school are you employed?
b. English Catholic c. English Public d. French Catholic e. French Public
Thank you for participating in our survey

Appendix H: Number of Respondents for Questions on the School Staff Survey
______________ September 2008 178
Appendix H: Number of Respondents for Questions on the School Staff Survey
Question Number of Respondents
Are you familiar with the terms “Student Success Strategy” or “Learning to 18 Strategy”? 3189
Each school has one or more teachers designated to assist students who are at risk of leaving school early or failing to complete high school successfully. These teachers can be known as “Student Success Teachers”. Are you familiar with these teachers in your school? 3108Who are Student Success Teachers mainly responsible for? 2795Are the following statements true or false? ‐‐
Student Success Teachers help students get course credits. 2784Student Success Teachers help students improve their chances of graduating from secondary school. 2783Student Success Teachers help students better understand the material taught in class. 2763Student Success Teachers help students gain work‐related skills. 2758Student Success Teachers help students gain self‐confidence. 2752Student Success Teachers help students maintain their interest in school. 2725Student Success Teachers help students prepare for courses in the future. 2728Student Success Teachers help students prepare for post‐secondary education and training. 2708Student Success Teachers help students in other ways. 2704Students know that dedicated Student Success Teachers exist. 2715Student Success Teachers are available for all students who need them. 2709Parents support Student Success Teachers. 2596People value Student Success Teachers. 2635
To what extent do you agree or disagree with the following statement? Student Success Teachers help students become more successful. 2716

Appendix H: Number of Respondents for Questions on the School Staff Survey
______________ September 2008 179
Question Number of Respondents
Credit Recovery allows students to earn credit for a course that they have failed within the past two years. Students undertake only those portions of a course which were failed or not completed. Are you familiar with Credit Recovery programs or initiatives? 3115Generally, who participates in Credit Recovery programs? 2761Are the following statements true or false? ‐‐
Credit Recovery programs help students get course credits. 2760Credit recovery programs help students improve their chances of graduating from secondary school. 2751Credit recovery programs help students better understand the material taught in class. 2722Credit recovery programs help students gain self‐confidence. 2727Credit recovery programs help students maintain their interest in school. 2718Credit recovery programs help students prepare for courses in the future. 2695Credit recovery programs help students prepare for post‐secondary education and training. 2697Credit recovery programs help students in other ways. 2689Students know that credit recovery programs exist. 2690There are enough credit recovery programs for all students who want them. 2669Parents support credit recovery programs. 2596There are enough teachers/staff to support the credit recovery programs. 2660Credit recovery programs take up the right amount of a student’s valuable time. 2595People value credit recovery programs. 2633
To what extent do you agree or disagree with the following statement? Credit Recovery programs help students become more successful. 2701
Cooperative Education is a program that allows students to earn credits while completing a work placement in the community. Are you familiar with Cooperative Education programs? 3107Generally, who participates in Cooperative Education programs? 2719

Appendix H: Number of Respondents for Questions on the School Staff Survey
______________ September 2008 180
Question Number of Respondents
Are the following statements true or false? ‐‐Cooperative Education programs help students get course credits. 2711Cooperative education programs help students improve their chances of graduating from secondary school. 2706Cooperative education programs help students better understand the material taught in class. 2671Cooperative education programs help students gain skills required for success in the workplace. 2705Cooperative education programs help students gain self‐confidence. 2692Cooperative education programs help students maintain their interest in school. 2670Cooperative education programs help students prepare for courses in the future. 2668Cooperative education programs help students prepare for post‐secondary education and training. 2673Cooperative education programs help students experience a career of interest. 2674Cooperative education programs help students in other ways. 2195(French Only) Les élèves connaissent l’existence des programmes d’éducation coopérative. 480(French Only) L’offre de programmes d’éducation coopérative suffit à la demande des élèves. 467(French Only) Les établissements offrant des programmes d’éducation coopérative sont bien situés. 463
(French Only) Les élèves peuvent facilement se rendre aux établissements offrant des programmes d’éducation coopérative. 468(French Only) Les parents appuient les programmes d’éducation coopérative. 459(French Only) Il y a suffisamment d’enseignantes et d’enseignants pour les programmes d’éducation coopérative. 468
(French Only) Les élèves ayant des besoins particuliers ont de la difficulté à participer aux programmes d’éducation coopérative car les adaptations ou les supports nécessaires ne sont pas en place dans les milieux de travail. 462
(French Only) Les élèves qui pourraient profiter de stages en éducation coopérative n’accumulent pas de crédits dans ces cours parce qu’ils ne rencontrent pas les critères nécessaires pour les stages en milieu de travail. 451

Appendix H: Number of Respondents for Questions on the School Staff Survey
______________ September 2008 181
Question Number of Respondents
(French Only) Les programmes d’éducation coopérative occupent une part appropriée du précieux temps des élèves. 467(French Only) Les gens apprécient les programmes d’éducation coopérative. 462
To what extent do you agree or disagree with the following statement? Cooperative Education programs help students become more successful. 2683
Some schools work with their local colleges to provide opportunities for students to visit and sample college programs. Sometimes, people from the college offer information nights for students and their parents. These are examples of School to College information and programs. Are you familiar with this type of program? 3049Generally, who participates in School to College programs? 2252Are the following statements true or false? ‐‐
School to College information and experience programs help students improve their chances of graduating from secondary school. 2094
School to college information and experience programs help students better understand the material taught in class. 2059School to college information and experience programs help students gain work‐related skills. 2061School to college information and experience programs help students gain self‐confidence. 2066School to college information and experience programs help students maintain their interest in school. 2071School to college information and experience programs help students prepare for courses in the future. 2062
School to college information and experience programs help students prepare for post‐secondary education and training. 2067School to college information and experience programs help students in other ways. 2052Students know that school to college programs exist. 2080There are enough school to college programs for all students who want them. 2017School to college programs are conveniently located. 1998

Appendix H: Number of Respondents for Questions on the School Staff Survey
______________ September 2008 182
Question Number of Respondents
It is easy for students to travel to the school to college programs that are available. 1987Parents support school to college programs. 1960There are enough teachers/staff to support the school to college programs. 1961School to college programs take up the right amount of a student’s valuable time. 1906People value school to college programs. 1959
To what extent do you agree or disagree with the following statement? School to College information and experience programs help students become more successful. 2018
The Ontario Youth Apprenticeship Program or other apprenticeship initiatives give high school students the opportunity to learn a trade or craft under the supervision of an experienced trades or crafts person. Are you familiar with the Ontario Youth Apprenticeship Program or other apprenticeship initiatives? 3062Generally, who participates in Apprenticeship programs? 2391Are the following statements true or false? ‐‐
Apprenticeship programs help students get course credits. 2327Apprenticeship programs help students improve their chances of graduating from secondary school. 2326Apprenticeship programs help students better understand the material taught in class. 2307Apprenticeship programs help students gain work‐related skills. 2343Apprenticeship programs help students gain self‐confidence. 2334Apprenticeship programs help students maintain their interest in school. 2303Apprenticeship programs help students prepare for courses in the future. 2309Apprenticeship programs help students prepare for post‐secondary education and training. 2318Apprenticeship programs help students in other ways. 2314Students know that apprenticeship programs exist. 2297There are enough apprenticeship programs for all students who want them. 2235Apprenticeship programs are conveniently located. 2188

Appendix H: Number of Respondents for Questions on the School Staff Survey
______________ September 2008 183
Question Number of Respondents
It is easy for students to travel to apprenticeship programs that are available. 2198Parents support apprenticeship programs. 2229There are enough teachers/staff to support apprenticeship programs. 2199Apprenticeship programs take up the right amount of a student’s valuable time. 2172People value apprenticeship programs. 2258
To what extent do you agree or disagree with the following statement? Apprenticeship programs or initiatives help students become more successful. 2296
Dual Credit programs allow high school students to earn credits which simultaneously count toward the OSSD and a post‐secondary diploma, a degree or an apprenticeship certification. Are you familiar with Dual Credit programs? 3056Generally, who participates in Dual Credit programs? 1783Are the following statements true or false? ‐‐
Dual Credit programs help students get course credits. 1632Dual credit programs help students improve their chances of graduating from secondary school. 1615Dual credit programs help students better understand the material taught in class. 1586Dual credit programs help students gain work‐related skills. 1588Dual credit programs help students gain self‐confidence. 1596Dual credit programs help students maintain their interest in school. 1593Dual credit programs help students prepare for courses in the future. 1597Dual credit programs help students prepare for post‐secondary education and training. 1595Dual credit programs help students in other ways. 1578Students know that dual credit programs exist. 1595There are enough dual credit programs for all students who want them. 1539Dual credit programs are conveniently located. 1535

Appendix H: Number of Respondents for Questions on the School Staff Survey
______________ September 2008 184
Question Number of Respondents
It is easy for students to travel to dual credit programs that are available. 1536Parents support dual credit programs. 1511There are enough teachers to support dual credit programs. 1532Dual credit programs take up the right amount of a student’s valuable time. 1507People value dual credit programs. 1522
To what extent do you agree or disagree with the following statement? Dual Credit programs help students become more successful. 1601
Specialist High Skills Major programs allow students to focus their secondary school studies in a specific area of interest while still meeting the requirements for graduation. Students complete a package of eight to twelve courses related to a specific skill or interest area that counts toward the Ontario Secondary School Diploma credit requirements. Are you familiar with the Specialist High Skills Major program? 3039Generally, who participates in Specialist High Skills Major programs? 1663Are the following statements true or false? ‐‐
Specialist High Skills Major programs help students get course credits. 1568Specialist High Skills Major programs help students improve their chances of graduating from secondary school. 1561Specialist High Skills Major programs help students better understand the material taught in class. 1544Specialist High Skills Major programs help students gain work‐related skills. 1556Specialist High Skills Major programs help students gain self‐confidence. 1538Specialist High Skills Major programs help students maintain their interest in school. 1549Specialist High Skills Major programs help students prepare for courses in the future. 1553Specialist High Skills Major programs help students prepare for post‐secondary education and training. 1553Specialist High Skills Major programs help students in other ways. 1533Students know that Specialist High Skills Major programs exist. 1536There are enough Specialist High Skills Major programs for all students who want them. 1510
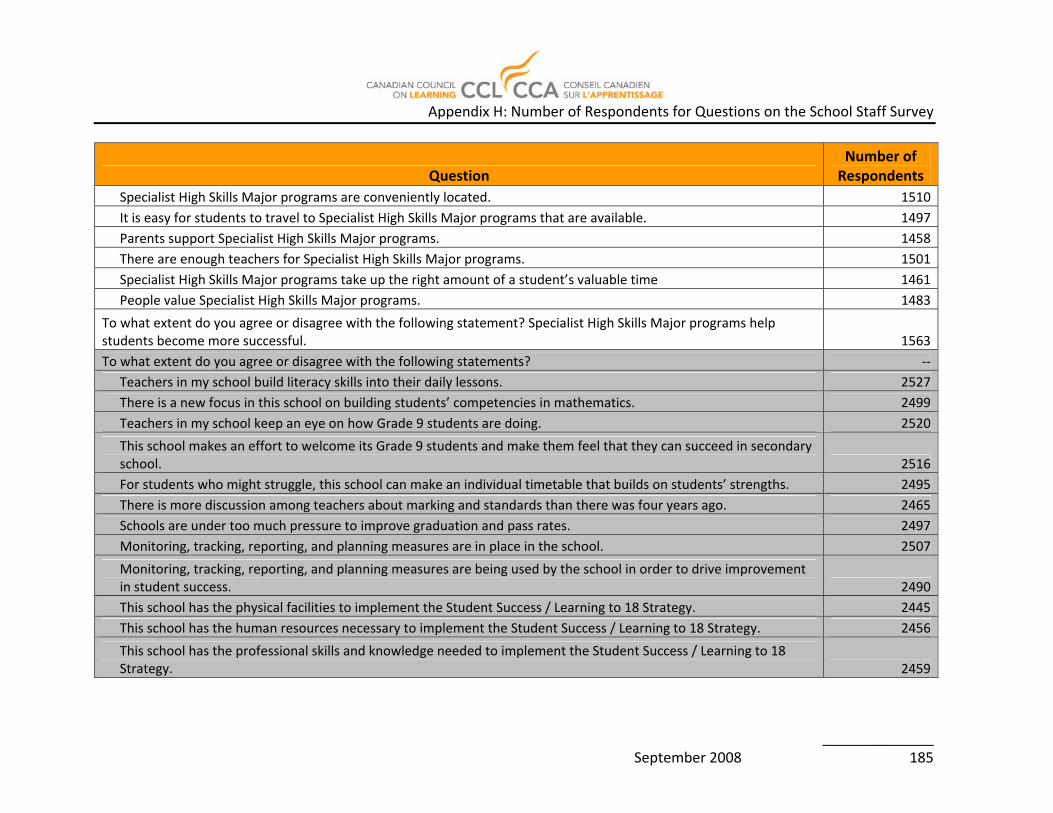
Appendix H: Number of Respondents for Questions on the School Staff Survey
______________ September 2008 185
Question Number of Respondents
Specialist High Skills Major programs are conveniently located. 1510It is easy for students to travel to Specialist High Skills Major programs that are available. 1497Parents support Specialist High Skills Major programs. 1458There are enough teachers for Specialist High Skills Major programs. 1501Specialist High Skills Major programs take up the right amount of a student’s valuable time 1461People value Specialist High Skills Major programs. 1483
To what extent do you agree or disagree with the following statement? Specialist High Skills Major programs help students become more successful. 1563To what extent do you agree or disagree with the following statements? ‐‐
Teachers in my school build literacy skills into their daily lessons. 2527There is a new focus in this school on building students’ competencies in mathematics. 2499Teachers in my school keep an eye on how Grade 9 students are doing. 2520
This school makes an effort to welcome its Grade 9 students and make them feel that they can succeed in secondary school. 2516For students who might struggle, this school can make an individual timetable that builds on students’ strengths. 2495There is more discussion among teachers about marking and standards than there was four years ago. 2465Schools are under too much pressure to improve graduation and pass rates. 2497Monitoring, tracking, reporting, and planning measures are in place in the school. 2507
Monitoring, tracking, reporting, and planning measures are being used by the school in order to drive improvement in student success. 2490This school has the physical facilities to implement the Student Success / Learning to 18 Strategy. 2445This school has the human resources necessary to implement the Student Success / Learning to 18 Strategy. 2456
This school has the professional skills and knowledge needed to implement the Student Success / Learning to 18 Strategy. 2459

Appendix H: Number of Respondents for Questions on the School Staff Survey
______________ September 2008 186
Question Number of Respondents
This school has enough non‐teaching support staff (social workers, psychologists, youth workers, educational assistants) to support students to become successful. 2487Staff at this school act upon student‐level data and information to intervene with and support students. 2474
My school is making efforts to align resources and practices to the goals of the Student Success / Learning to 18 Strategy. 2431
Programs that were having little impact on student success are being replaced by other programs that have more impact. 2376
The following questions pertain to guidance, course opportunities for students in your school, and teaching practices. Some of these questions can best be answered by teachers. If you feel that a question does not apply to you or that you cannot answer a question based on your current knowledge, please do not answer it and move on to the next question. Are the following statements true or false? ‐‐
Students get good advice and guidance for career preparation. 2382Students get good advice and guidance in planning their further education. 2379Students are able to take courses that are interesting and challenging. 2441
The course(s) that students want or should take don’t always run because there aren’t enough students to make up a class. 2429E‐learning or on‐line courses are available through my school when the school can’t offer a regular class. 2288I try to connect what I am teaching to students’ career aspirations and future learning. 2322I focus on my subject and helping students succeed with the course material. 2295It’s part of my job to be interested in students’ plans for the future. 2416I am aware of opportunities available to my students at university. 2407I am aware of opportunities available to my students at the local college. 2401I am aware of the opportunities available to my students in the college system. 2381I am aware of apprenticeship opportunities for my students. 2400

Appendix H: Number of Respondents for Questions on the School Staff Survey
______________ September 2008 187
Question Number of Respondents
I know very little about what is available to students in this school after graduation. 2398
The following questions are to do with the different types of professional development you received since September 2006. Are the following questions true or false? ‐‐
(French Only) Depuis septembre 2006, j’ai participé à une journée de développement professionnel (journée pédagogique). 451Since September 2006, I have participated in a workshop at my school. 2464Since September 2006, I have participated in a workshop at my board. 2469Since September 2006, I have participated in a regional workshop or conference. 2455Since September 2006, I have participated in a provincial conference. 2447Since September 2006, I have participated in an additional qualification courses. 2453Since September 2006, I have participated in another kind of course at a faculty of education. 2435Since September 2006, I have participated in in‐class visiting or observing. 2425Since September 2006, I have been coached by a senior teacher. 2396Since September 2006, I have participated in team teaching. 2387Since September 2006, I have participated in online or web‐cast courses. 2431Since September 2006, I have participated in other forms of professional development. 2442
Since September 2005, have you taken part in professional development specifically related to the Student Success/Learning to 18 strategy? 3042
Are the following statements pertaining to the professional development specifically related to the Student Success / Learning to 18 Strategy you have received since September 2005 true or false?
I received information about the Student Success / Learning to 18 strategy at a staff meeting. 1572
I received information about the Student Success / Learning to 18 strategy at a workshop or event on a professional development day. 1574I received information about the Student Success / Learning to 18 strategy at an after school workshop or event. 1554

Appendix H: Number of Respondents for Questions on the School Staff Survey
______________ September 2008 188
Question Number of Respondents
I received information about the Student Success / Learning to 18 strategy at a workshop or event for which I was released from my regular duties. 1554I attended a regional conference or symposium focusing on the Student Success / Learning to 18 strategy. 1562I attended a provincial conference or symposium focusing on the Student Success / Learning to 18 strategy. 1563

Appendix I: Number of Respondents for Questions on the Student Survey
______________ September 2008 189
Appendix I: Number of Respondents for Questions on the Student Survey
Question Number of Respondents
Are you familiar with the terms “Student Success Strategy” or “Learning to 18 Strategy”? 9989
Thinking about your CURRENT YEAR in secondary school, are the following statements true or false? ‐‐
Students get good advice and guidance for career preparation. 9969
Students get good advice and guidance in planning their further education. 9964
When answering the following questions, think only of your CURRENT school year. ‐‐
I have been able to take courses that I find interesting and challenging. 9753
There aren’t enough courses in subjects that interest me. 9759
The course(s) that I want to take don’t always run because there aren’t enough students who want to take them. 9711
I have been able to take an e‐learning or on‐line course through my school when the school couldn’t offer the course I was interested in. 9214
Are you familiar with Cooperative Education programs? 9438
Generally, who participates in Cooperative Education programs? 7070
Are the following statements true or false? ‐‐
Cooperative Education programs help students get course credits. 7026
Cooperative education programs help students improve their chances of graduating from secondary school. 7014
Cooperative education programs help students better understand the material taught in class. 6891
Cooperative education programs help students gain skills required for success in the workplace. 6917
Cooperative education programs help students gain self‐confidence. 6896
Cooperative education programs help students maintain their interest in school. 6796
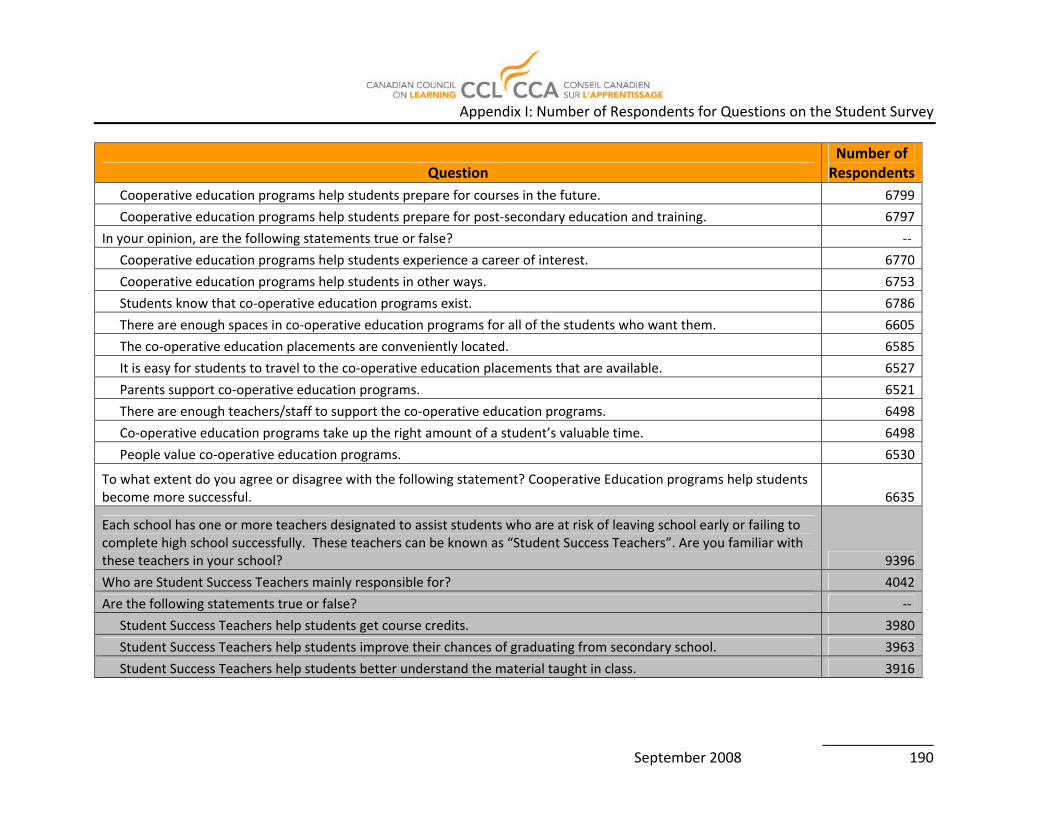
Appendix I: Number of Respondents for Questions on the Student Survey
______________ September 2008 190
Question Number of Respondents
Cooperative education programs help students prepare for courses in the future. 6799
Cooperative education programs help students prepare for post‐secondary education and training. 6797
In your opinion, are the following statements true or false? ‐‐
Cooperative education programs help students experience a career of interest. 6770
Cooperative education programs help students in other ways. 6753
Students know that co‐operative education programs exist. 6786
There are enough spaces in co‐operative education programs for all of the students who want them. 6605
The co‐operative education placements are conveniently located. 6585
It is easy for students to travel to the co‐operative education placements that are available. 6527
Parents support co‐operative education programs. 6521
There are enough teachers/staff to support the co‐operative education programs. 6498
Co‐operative education programs take up the right amount of a student’s valuable time. 6498
People value co‐operative education programs. 6530
To what extent do you agree or disagree with the following statement? Cooperative Education programs help students become more successful. 6635
Each school has one or more teachers designated to assist students who are at risk of leaving school early or failing to complete high school successfully. These teachers can be known as “Student Success Teachers”. Are you familiar with these teachers in your school? 9396
Who are Student Success Teachers mainly responsible for? 4042
Are the following statements true or false? ‐‐
Student Success Teachers help students get course credits. 3980
Student Success Teachers help students improve their chances of graduating from secondary school. 3963
Student Success Teachers help students better understand the material taught in class. 3916

Appendix I: Number of Respondents for Questions on the Student Survey
______________ September 2008 191
Question Number of Respondents
Student Success Teachers help students gain work‐related skills. 3907
Student Success Teachers help students gain self‐confidence. 3904
Student success teachers help students maintain their interest in school. 3843
Student Success Teachers help students prepare for courses in the future. 3855
Student Success Teachers help students prepare for post‐secondary education and training. 3829
Student Success Teachers help students in other ways. 3813
Students know that dedicated Student Success Teachers exist. 3832
Student Success Teachers are available for all students who need them. 3812
Parents support Student Success Teachers. 3789
(French Only) Les gens apprécient le rôle du personnel enseignant responsable de la réussite des élèves. 734
To what extent do you agree or disagree with the following statement? Student Success Teachers help students become more successful. 3849
Credit Recovery allows students to earn credit for a course that they have failed within the past two years. Students undertake only those portions of a course which were failed or not completed. Are you familiar with Credit Recovery programs or initiatives? 9091
Generally, who participates in Credit Recovery programs? 4563
Are the following statements true or false? ‐‐
Credit Recovery programs help students get course credits. 4530
Credit recovery programs help students improve their chances of graduating from secondary school. 4524
Credit recovery programs help students better understand the material taught in class. 4448
(English Only) Credit recovery programs help students gain self‐confidence. 3755
Credit recovery programs help students maintain their interest in school. 4437
Credit recovery programs help students prepare for courses in the future. 4375

Appendix I: Number of Respondents for Questions on the Student Survey
______________ September 2008 192
Question Number of Respondents
Credit recovery programs help students prepare for post‐secondary education and training. 4346
Credit recovery programs help students in other ways. 4355
Students know that credit recovery programs exist. 4390
There are enough credit recovery programs for all students who want them. 4316
Parents support credit recovery programs. 4340
There are enough teachers/staff to support the credit recovery programs. 4273
Credit recovery programs take up the right amount of a student’s valuable time. 4285
People value credit recovery programs. 4324
To what extent do you agree or disagree with the following statement? Credit Recovery programs help students become more successful. 4388
Credit Recovery programs help students become more successful.
Some schools work with their local colleges to provide opportunities for students to visit and sample college programs. Sometimes, people from the college offer information nights for students and their parents. These are examples of School to College information and programs. Are you familiar with this type of program? 9073
Generally, who participates in School to College programs? 4249
Are the following statements true or false? ‐‐
School to College information and experience programs help students improve their chances of graduating from secondary school. 4099
School to college information and experience programs help students better understand the material taught in class. 4074
School to college information and experience programs help students gain work‐related skills. 4036
School to college information and experience programs help students gain self‐confidence. 4026
School to college information and experience programs help students maintain their interest in school. 4027
School to college information and experience programs help students prepare for courses in the future. 4013

Appendix I: Number of Respondents for Questions on the Student Survey
______________ September 2008 193
Question Number of Respondents
School to college information and experience programs help students prepare for post‐secondary education and training. 4004
School to college information and experience programs help students in other ways. 3977
Students know that school to college programs exist. 4030
There are enough school to college programs for all students who want them. 3930
School to college programs are conveniently located. 3894
It is easy for students to travel to the school to college programs that are available. 3857
Parents support school to college programs. 3898
There are enough teachers/staff to support the school to college programs. 3854
School to college programs take up the right amount of a student’s valuable time. 3854
People value school to college programs. 3867
To what extent do you agree or disagree with the following statement? School to College information and experience programs help students become more successful. 3938
The Ontario Youth Apprenticeship Program or other apprenticeship initiatives give high school students the opportunity to learn a trade or craft under the supervision of an experienced trades or crafts person. Are you familiar with the Ontario Youth Apprenticeship Program or other apprenticeship initiatives? 9049
Generally, who participates in Apprenticeship programs? 4504
Are the following statements true or false? ‐‐
Apprenticeship programs help students get course credits. 4390
Apprenticeship programs help students improve their chances of graduating from secondary school. 4367
Apprenticeship programs help students better understand the material taught in class. 4316
Apprenticeship programs help students gain work‐related skills. 4357
Apprenticeship programs help students gain self‐confidence. 4328

Appendix I: Number of Respondents for Questions on the Student Survey
______________ September 2008 194
Question Number of Respondents
Apprenticeship programs help students maintain their interest in school. 4285
Apprenticeship programs help students prepare for courses in the future. 4290
Apprenticeship programs help students prepare for post‐secondary education and training. 4299
Apprenticeship programs help students in other ways. 4286
Students know that apprenticeship programs exist. 4311
There are enough apprenticeship programs for all students who want them. 4239
Apprenticeship programs are conveniently located. 4152
It is easy for students to travel to apprenticeship programs that are available. 4147
Parents support apprenticeship programs. 4189
There are enough teachers/staff to support apprenticeship programs. 4149
Apprenticeship programs take up the right amount of a student’s valuable time. 4154
People value apprenticeship programs. 4215
To what extent do you agree or disagree with the following statement? Apprenticeship programs or initiatives help students become more successful. 4299Dual Credit programs allow high school students to earn credits which simultaneously count toward the OSSD and a post‐secondary diploma, a degree or an apprenticeship certification. Are you familiar with Dual Credit programs? 8887
Generally, who participates in Dual Credit programs? 1877
Are the following statements true or false? ‐‐
Dual Credit programs help students get course credits. 2042
Dual credit programs help students improve their chances of graduating from secondary school. 2032
Dual credit programs help students better understand the material taught in class. 2004
Dual credit programs help students gain work‐related skills. 2003
Dual credit programs help students gain self‐confidence. 1998

Appendix I: Number of Respondents for Questions on the Student Survey
______________ September 2008 195
Question Number of Respondents
Dual credit programs help students maintain their interest in school. 1992
Dual credit programs help students prepare for courses in the future. 1985
Dual credit programs help students prepare for post‐secondary education and training. 1981
Dual credit programs help students in other ways. 1983
Students know that dual credit programs exist. 2000
There are enough dual credit programs for all students who want them. 1969
Dual credit programs are conveniently located. 1958
It is easy for students to travel to dual credit programs that are available. 1947
Parents support dual credit programs. 1961
There are enough teachers to support dual credit programs. 1954
Dual credit programs take up the right amount of a student’s valuable time. 1947
People value dual credit programs. 1955
To what extent do you agree or disagree with the following statement? Dual Credit programs help students become more successful. 1985Specialist High Skills Major programs allow students to focus their secondary school studies in a specific area of interest while still meeting the requirements for graduation. Students complete a package of eight to twelve courses related to a specific skill or interest area that counts toward the Ontario Secondary School Diploma credit requirements. Are you familiar with the Specialist High Skills Major program? 8855
Generally, who participates in Specialist High Skills Major programs? 1699
Are the following statements true or false? ‐‐
Specialist High Skills Major programs help students get course credits. 1650Specialist High Skills Major programs help students improve their chances of graduating from secondary school. 1631
Specialist High Skills Major programs help students better understand the material taught in class. 1620
Specialist High Skills Major programs help students gain work‐related skills. 1625

Appendix I: Number of Respondents for Questions on the Student Survey
______________ September 2008 196
Question Number of Respondents
Specialist High Skills Major programs help students gain self‐confidence. 1617
Specialist High Skills Major programs help students maintain their interest in school. 1612
Specialist High Skills Major programs help students prepare for courses in the future. 1616
Specialist High Skills Major programs help students prepare for post‐secondary education and training. 1606
Specialist High Skills Major programs help students in other ways. 1609
Students know that Specialist High Skills Major programs exist. 1620
There are enough Specialist High Skills Major programs for all students who want them. 1600
Specialist High Skills Major programs are conveniently located. 1594
It is easy for students to travel to Specialist High Skills Major programs that are available. 1586
Parents support Specialist High Skills Major programs. 1596
There are enough teachers for Specialist High Skills Major programs. 1590
Specialist High Skills Major programs take up the right amount of a student’s valuable time 1589
People value Specialist High Skills Major programs. 1585
To what extent do you agree or disagree with the following statement? Specialist High Skills Major programs help students become more successful. 1615
The following statements are about your sources of information about learning opportunities at the post‐secondary level. ‐‐
To what extent were you made aware during your studies of learning opportunities at college or university or through apprenticeships? 7021
Are the following statements true or false? ‐‐
I learned about such opportunities by participating in a course that will lead to credit at a college or towards apprenticeship. 6940
I learned about such opportunities through my parents or other family members. 6949

Appendix I: Number of Respondents for Questions on the Student Survey
______________ September 2008 197
Question Number of Respondents
I learned about such opportunities through a secondary school teacher. 6955
I learned about such opportunities through the guidance counsellor. 6952
I learned about such opportunities by taking courses that focus on a particular industry such as manufacturing, hospitality, arts and culture, etc. 6888
I learned about such opportunities by other means. 6867
After high school, you plan to (go to work, go to college, become an apprentice, go to university, no plans yet) 7037
The following questions are about your recent experience in secondary school. When answering these questions, think only about your current year in secondary school. Remember, your answers will be kept strictly confidential. How often are the following statements true for you? ‐‐
I pay attention to the teacher. 7083
I do as little work as possible, I just want to get by. 7067
I get along with teachers. 7067
I am interested in what I am learning in class. 7068
I complete my homework on time. 7070
At my school, it is difficult to make new friends. 7052
I like to participate in many school activities (for example, sports, clubs, plays). 7035
Most of my teachers don’t really care about me. 7042
There are teachers or other adults in my school whom I could talk to if I had a problem. 7018
School is often a waste of time. 7014
I have friends at school whom I could talk to about personal things. 7023
Most of my teachers really listen to what I have to say. 7003
If I need extra help, I receive it from my teachers. 6991
My school is a place where I feel like an outsider or like I am left out of things. 6990

Appendix I: Number of Respondents for Questions on the Student Survey
______________ September 2008 198