enterprise ux industry report 2017–2018
TRANSCRIPT

Enterprise UX Industry Report
2017 to 2018
Copyright © 2017 by UXPin Inc.
All rights reserved. No part of this publication text may be uploaded or posted online without the prior written permission of the publisher.
For permission requests, write to the publisher, addressed “Attention: Permissions Request,” to [email protected].
Enterprise UX Industry Report
2017 to 2018

Index
Introduction 6
UX Background and Experience 8Most enterprise designers are self-taught 9
Enterprise designers are fairly experienced 9
Majority of enterprise designers are in-house 10
Significantly more enterprise designers join
massive companies after 3 years 10
Enterprise UX Challenges 12Legacy technology issues increase with company size 13
UX consistency is an almost universal challenge 13
Executive buy-in becomes a greater challenge
as company size increases 15
Collaboration becomes more difficult
as developers outnumber designers 16
Product Development Process 17Most organizations use pattern libraries or
design systems (or are currently building them) 18
Waterfall organizations are less likely
to use pattern libraries or design systems 18
Prototyping is one of the most common UX activities 20
Product Platforms 21
Design Leadership 22Mostly self-taught 24
Team Structure 25Complete co-location more prevalent in
waterfall organizations 26
More developers per designer as company size increases 26
UX Maturity and Value 29Full-time UX roles are newer to waterfall vs. Agile companies 30
Most waterfall organizations employ less than 5 full-time UX roles 31
Waterfall organizations tend to value UX less 31
Design Income 33Income By Function 36
Conclusion 37

Marcin Treder
Since co-founding UXPin in 2010, he has helped build and lead prod-uct teams in the Poland and Silicon Valley office. Previously, he was a UX Manager at Grupa Nokaut, an enterprise ecommerce platform. He holds an M.A. in Psychology from the University of Gdansk.
Jerry Cao
Jerry Cao is a content strategist at UXPin where he gets to put his over-ly active imagination to paper every day. In a past life, he developed content strategies for clients at Brafton and worked in traditional ad-vertising at DDB San Francisco. In his spare time he enjoys playing elec-tric guitar, watching foreign horror films, and expanding his knowledge of random facts. Follow me on Twitter
Vince Ho
Before joining UXPin in 2016 Vincent was a Sr. Research Analyst at a fi-nancial institution responsible for the company’s quantitative research design / deployment and analysis. He is currently the Data Analyst at UXPin supporting the Sales, Marketing, and Product teams in measur-ing key metrics and discovering meaningful patterns.
Authors
Introduction
In the world of enterprise products, UX has historically been an af-
terthought. Product teams were engineering-driven. Functionality
came before usability or usefulness. Buyer needs superseded those
of end-users.
While the issues of legacy technology, bureaucracy, and complex use
cases still exist, the status quo is changing. We are undoubtedly in
the midst of an enterprise UX renaissance. Startups like Gusto, Stripe,
and Slack are setting the expectation that business products should
be useful, usable, and satisfying. Meanwhile, large organizations
like IBM, GE, and Salesforce are prioritizing design as a competitive
advantage by hiring thousands of designers to reshape processes
and culture.
At UXPin, we’ve seen this transformation firsthand amongst our
customers. As design thinking comes of age, more enterprise teams
are seeking the right tools and processes to deliver on the promise
of design-driven product development.

Introduction 7
In this report, we aim to illuminate a rapidly expanding and evolving
sector. What challenges do teams face? How are the product teams
structured? Are enterprises really becoming more Agile, or do they
still abide by waterfall methods?
Answered: 3,157
0% 10% 20% 30% 40% 50% 60% 70% 80% 90% 100%
United States or Canada
Europe
Asia
Latin America
Australia
Middle East
Africa
34%
44%
9%
5%
4%
2%
2%
Skipped: 0
In what region do you work?
In total, 3,157 people from around the world answered. What follows
is the first report of its kind to dive deep into one of the most prom-
ising (and profitable) UX opportunities of the past decade.
Jerry Cao, Vince Ho, and Marcin Treder

UX Background and Experience
2675 of the 3157 respondents reported that their roles were either
UX/product design, interaction design, visual design, information
architecture, or user research.
Answered: 3,157
0% 10% 20% 30% 40% 50% 60% 70% 80% 90% 100%
UX/ProductDesigner
UI Designer
Product Manager
Developer
Visual Designer
InteractionDesigner
UX Researcher
11%
43%
8%
7%
7%
7%
5%
Information Architect
Other
3%
8%
Skipped: 0
What best describes your role?
UX Background and Experience 9
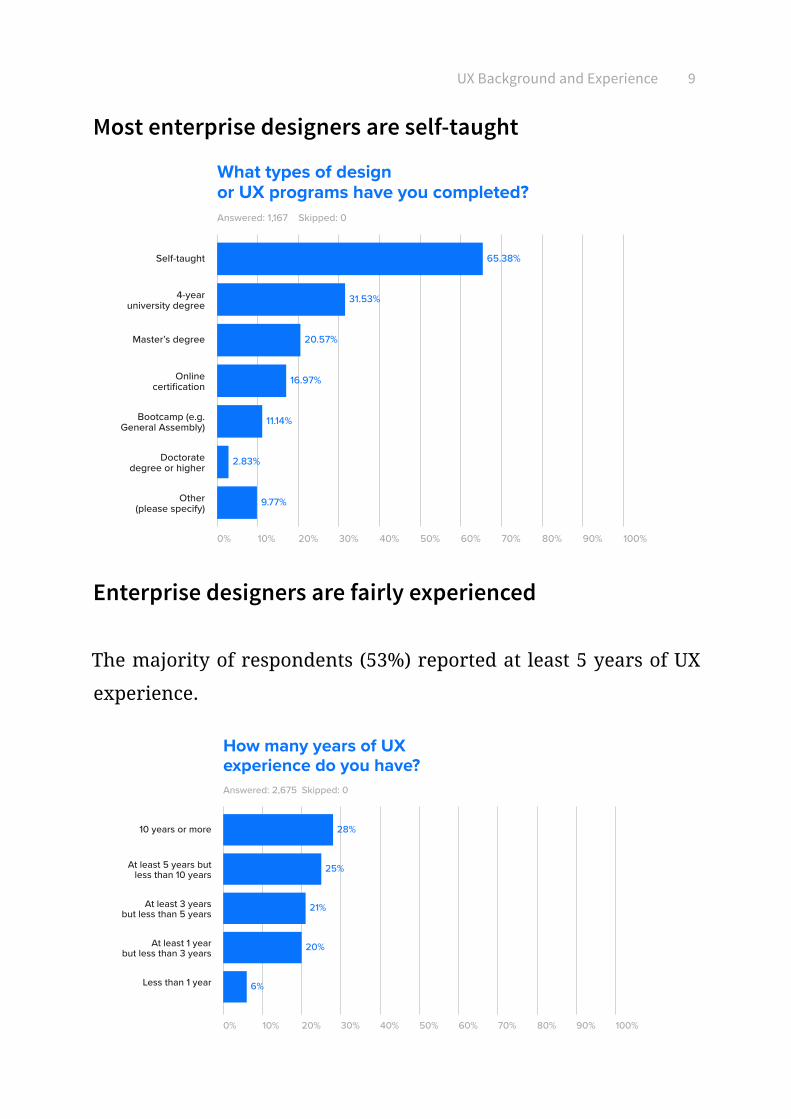
Most enterprise designers are self-taught
Answered: 1,167
0% 10% 20% 30% 40% 50% 60% 70% 80% 90% 100%
Self-taught
4-yearuniversity degree
Master’s degree
Onlinecertification
Bootcamp (e.g.General Assembly)
Doctoratedegree or higher
31.53%
65.38%
20.57%
16.97%
11.14%
2.83%
Other (please specify)
9.77%
Skipped: 0
What types of design or UX programs have you completed?
Enterprise designers are fairly experienced
The majority of respondents (53%) reported at least 5 years of UX
experience.
Answered: 2,675
0% 10% 20% 30% 40% 50% 60% 70% 80% 90% 100%
10 years or more
At least 5 years but less than 10 years
At least 3 years but less than 5 years
At least 1 yearbut less than 3 years
Less than 1 year
25%
28%
21%
20%
6%
Skipped: 0
How many years of UX experience do you have?

UX Background and Experience 10
Majority of enterprise designers are in-house
When focusing on just the 2675 designer respondents, we see that
59% work in-house.
0% 10% 20% 30% 40% 50% 60% 70% 80% 90% 100%
In-house
Agency
Independent consultant/freelance
Other
23%
59%
13%
5%
Significantly more enterprise designers join massive companies after 3 years
Starting at the 3 year mark, over twice as many designers work in
companies with 5001+ employees compared to the previous experi-
ence level.
Less than 1 year experience
At least 1 year but less than 3 years experience
At least 3 years but less than 5 years experience
At least 5 years but less than 10 years experience
More than 10 years experience
7%
Company has 5001+ employees
10%
20%
30%
45%

UX Background and Experience 11
Yet after 10 years of experience, a higher percentage of designers
join small companies (or go independent) compared to the previous
two levels.
Less than 1 year experience
At least 1 year but less than 3 years experience
At least 3 years but less than 5 years experience
At least 5 years but less than 10 years experience
More than 10 years experience
42%
Company has 1-25 employees
26%
20%
14%
23%
Enterprise UX Challenges
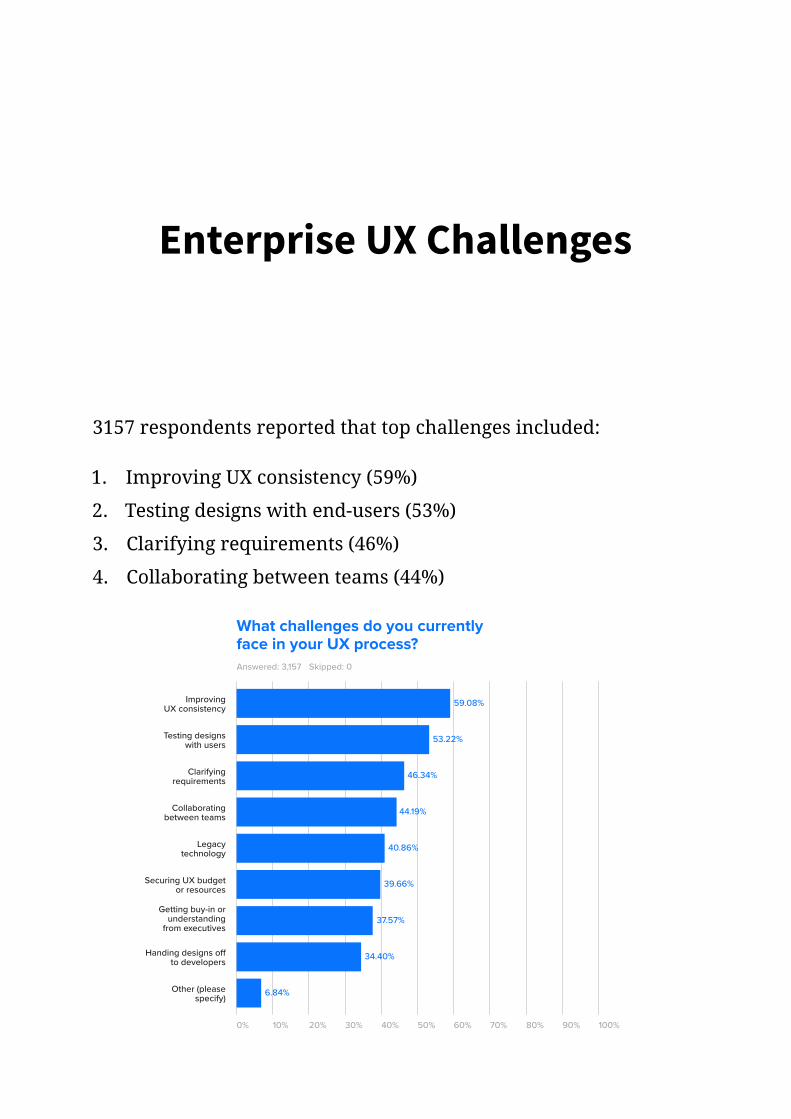
3157 respondents reported that top challenges included:
1. Improving UX consistency (59%)
2. Testing designs with end-users (53%)
3. Clarifying requirements (46%)
4. Collaborating between teams (44%)
Answered: 3,157
0% 10% 20% 30% 40% 50% 60% 70% 80% 90% 100%
Improving UX consistency
Testing designs with users
Clarifying requirements
Collaboratingbetween teams
Legacytechnology
Securing UX budgetor resources
Getting buy-in or understanding
from executives
53.22%
59.08%
46.34%
44.19%
40.86%
39.66%
37.57%
Handing designs o� to developers
34.40%
Other (pleasespecify)
6.84%
Skipped: 0
What challenges do you currently face in your UX process?

Enterprise UX Challenges 13
Let’s explore some major trends below.
Legacy technology issues increase with company size
61% of respondents in companies with 5001 or more employees re-
port legacy technology as a UX challenge.
Meanwhile, only 33% of respondents in companies with 26 to 100
employees reported the same challenge.
1 to 25
Number of Employees
26 to 100
101 to 500
501 to 1000
1001 to 5000
23%
Challenge: Legacy technology
33%
45%
53%
54%
5001 or more 61%
UX consistency is an almost universal challenge
The data indicates that improving design consistency becomes a
significant challenge once a company grows beyond 25 employees.

Enterprise UX Challenges 14
The results aren’t surprising since poor product consistency is a by-
product of poor communication and collaboration (both of which
become increasingly difficult with distance).
1 to 25
Number of Employees
26 to 100
101 to 500
501 to 1000
1001 to 5000
49%
Challenge: Improving UX consistency
62%
64%
64%
62%
5001 or more 63%

Enterprise UX Challenges 15
Executive buy-in becomes a greater challenge as company size increases
Almost half of all respondents from companies with 5001 or more
employees reported that executive buy-in and understanding of UX
as a challenge.
1 to 25
Number of Employees
26 to 100
101 to 500
501 to 1000
1001 to 5000
27%
Challenge: Getting UX buy-in or understanding from executives
34%
40%
41%
47%
5001 or more 49%

Enterprise UX Challenges 16
Collaboration becomes more difficult as developers out-number designers
The data showed that larger companies tend to be distributed and
hire more developers per designer.
As designers support more developers across locations, collaboration
certainly becomes a greater challenge.
1 designer : 5 developers or fewer
Number of Employees
1 designer : 6-10 developers
1 designer : 11-20 developers
1 designer : 21-50 developers
1 designer : 51-70 developers
35%
Challenge: Collaborating between teams
47%
49%
51%
57%
1 designer : 71 developers or higher 55%

Product Development Process
Nearly 17 years after the introduction of the Agile manifesto and 5
years after the introduction of Agile UX, the prevalence of collabo-
rative methodologies is undeniable.
93% of the 3157 respondents indicate their companies either follow a
pure Agile or Agile/Waterfall hybrid process. The almost equal num-
ber of Agile and hybrid respondents doesn’t isn’t surprising since
companies need to adapt processes for their own culture and context.
Answered: 3,157
0% 10% 20% 30% 40% 50% 60% 70% 80% 90% 100%
Agile (Scrum, Kanban, etc.)
Agile/Waterfallhybrid
Waterfall
44%
49%
7%
Skipped: 0
What best describes your productdevelopment process?

Product Development Process 18
Meanwhile, the popularity of pattern libraries and design systems
continues to increase as companies seek to improve consistency and
efficiency.
Most organizations use pattern libraries or design systems (or are currently building them)
69% of all respondents reported that their company either uses a
pattern library or design system (or are actively building one).
Answered: 3,157
0% 10% 20% 30% 40% 50% 60% 70% 80% 90% 100%
No, but we’re currently building one
Yes
No, and we aren’t currently building one
32%
37%
26%
I don’t know 5%
Skipped: 0
Does your company have a pattern library or design system?
Waterfall organizations are less likely to use pattern li-braries or design systems
56% of respondents in waterfall organizations report that a pattern
library or design system currently exists (or that they’re working on
one).

Product Development Process 19
Meanwhile, respondents in Agile and Agile/Waterfall hybrids report
74% and 67% respectively. The data makes sense considering that
the fast pace and collaboration of Agile creates greater demand for
component-based toolkits.
Answered: 3,157
0% 10% 20% 30% 40% 50% 60% 70% 80% 90% 100%
Agile (Scrum, Kanban, etc.)
Agile/Waterfallhybrid
Yes
No, but we’re currently building one
No, and we aren’t currently building one
I don’t know
Waterfall
31%
34% 40% 22%
28%
42%
5%
5%
12%
36%
26%20%
Skipped: 0
Does your company have a pattern library or design system?

Product Development Process 20
Prototyping is one of the most common UX activities
87% of designers reported involvement in prototyping.
And despite that usability testing was reported as a top challenge, de-
signers aren’t backing down. 72% still push forward with validating
their ideas despite the difficulty.
Answered: 2,423
0% 10% 20% 30% 40% 50% 60% 70% 80% 90% 100%
Brainstorming& ideation
Prototyping
Staticwireframing
User research
Usabilitytesting
High-fidelitystatic design
Requirementsgeneration
87%
92%
85%
78%
72%
71%
70%
Data analysis 55%
Development 37%
Skipped: 0
What activities are you involved induring the UX process?
Product Platforms
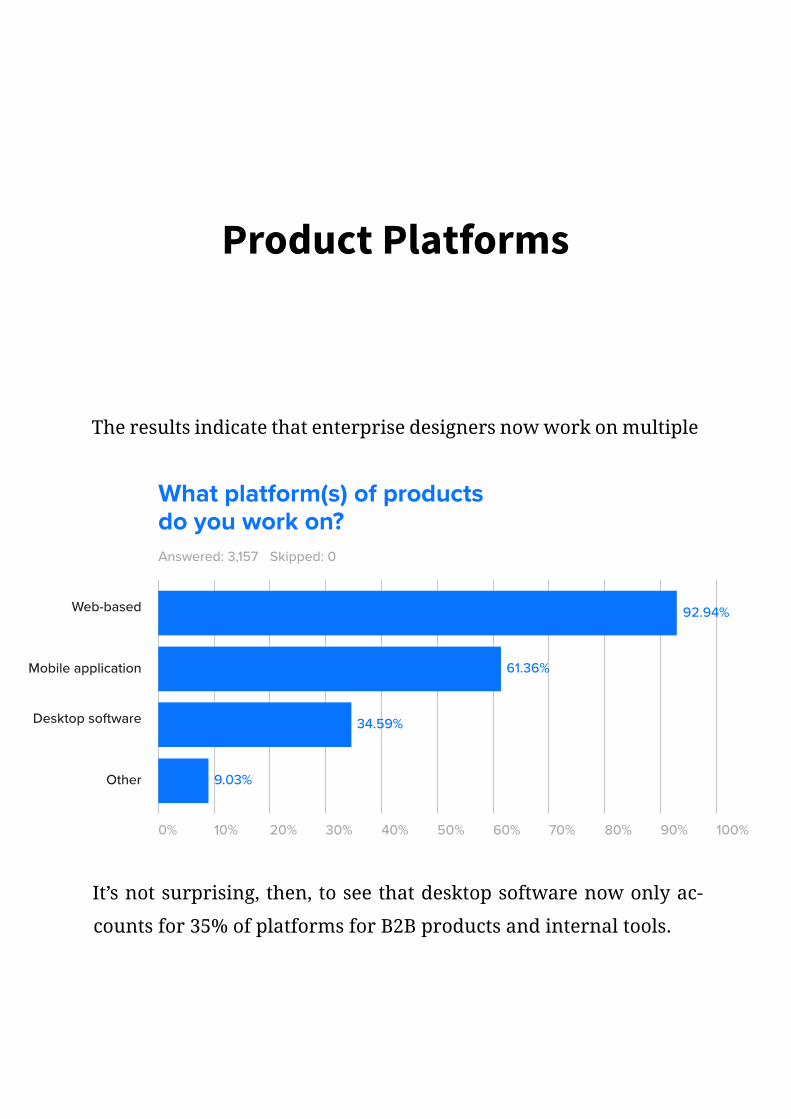
The results indicate that enterprise designers now work on multiple
platforms. Cloud products, however, remain the most popular. Answered: 3,157
0% 10% 20% 30% 40% 50% 60% 70% 80% 90% 100%
Web-based
Mobile application
Desktop software
61.36%
92.94%
34.59%
Other 9.03%
Skipped: 0
What platform(s) of products do you work on?
It’s not surprising, then, to see that desktop software now only ac-
counts for 35% of platforms for B2B products and internal tools.

Design Leadership
To explore design leadership, we zoomed in on respondents who
reported titles of manager/supervisor, director, VP, or C-level. Their
areas of focus include UX/product design, interaction design, visual
design, IA architect, or UX researcher.
The following represents 1167 design leader respondents (37% of
respondents from all roles).
Face similar challenges as individual contributors
Similar to responses of individual contributors, the top challenges
faced by enterprise UX leaders include:
1. Improving UX consistency (56%)
2. Testing designs with end-users (52%)
3. Clarifying requirements (45%)
4. Collaborating between teams (44%)

Design Leadership 23
Answered: 3,157
0% 10% 20% 30% 40% 50% 60% 70% 80% 90% 100%
Improving UX consistency
Testing designs with users
Clarifyingrequirements
Collaborating between teams
Legacytechnology
Securing UX budget or resources
Getting buy-in or understanding
from executives
53.22%
59.08%
46.34%
44.19%
40.86%
39.66%
37.57%
Handing designs o� to developers
34.40%
Other (please specify) 6.84%
Skipped: 0
What challenges do you currently face in your UX process?
Design Leadership 24
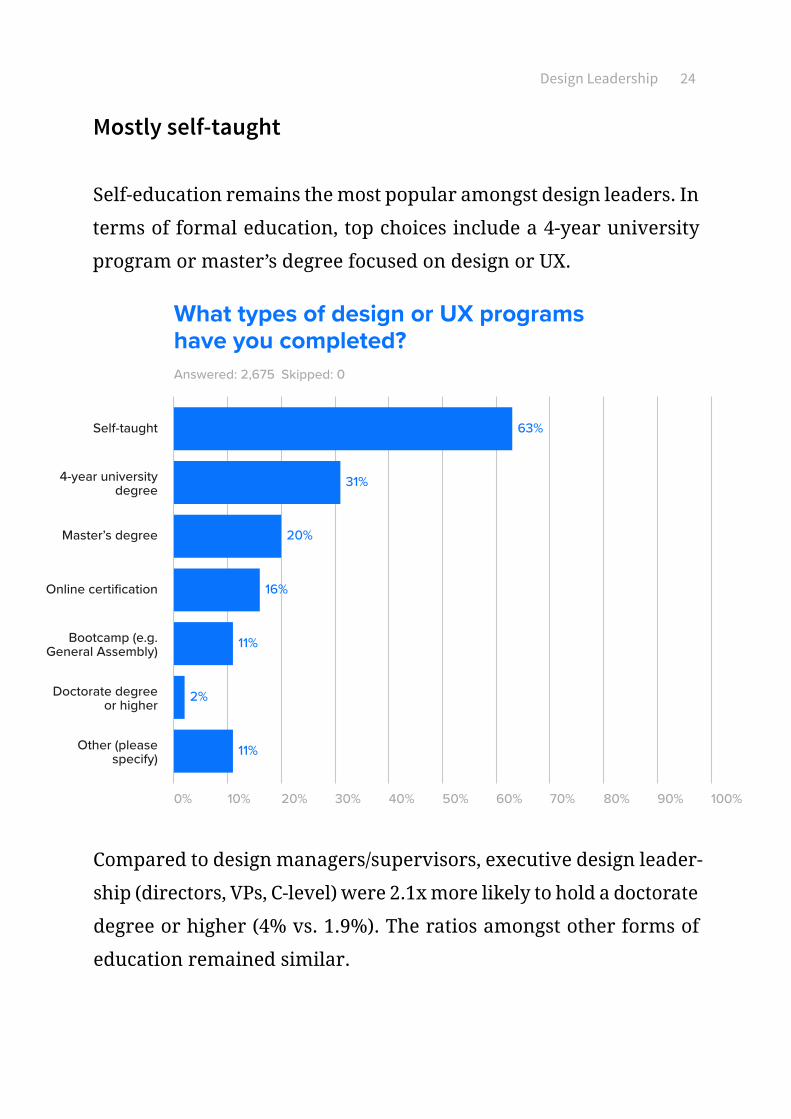
Mostly self-taught
Self-education remains the most popular amongst design leaders. In
terms of formal education, top choices include a 4-year university
program or master’s degree focused on design or UX.
Answered: 2,675
0% 10% 20% 30% 40% 50% 60% 70% 80% 90% 100%
Self-taught
4-year university degree
Master’s degree
Online certification
Bootcamp (e.g. General Assembly)
Doctorate degree or higher
Other (please specify)
31%
63%
20%
16%
11%
2%
11%
Skipped: 0
What types of design or UX programs have you completed?
Compared to design managers/supervisors, executive design leader-
ship (directors, VPs, C-level) were 2.1x more likely to hold a doctorate
degree or higher (4% vs. 1.9%). The ratios amongst other forms of
education remained similar.

Team Structure
Results from all 3157 respondents indicate that distributed teams are
now the norm in product development.
Answered: 3,157
0% 10% 20% 30% 40% 50% 60% 70% 80% 90% 100%
Split (two or more o�ces)
Mixed (mostly in one o�ce, with
some remote
All co-located (all in one o�ce)
32%
39%
23%
All distributed (no o�ce)
6%
Skipped: 0
What best describes the structureof your company?
Team Structure 26
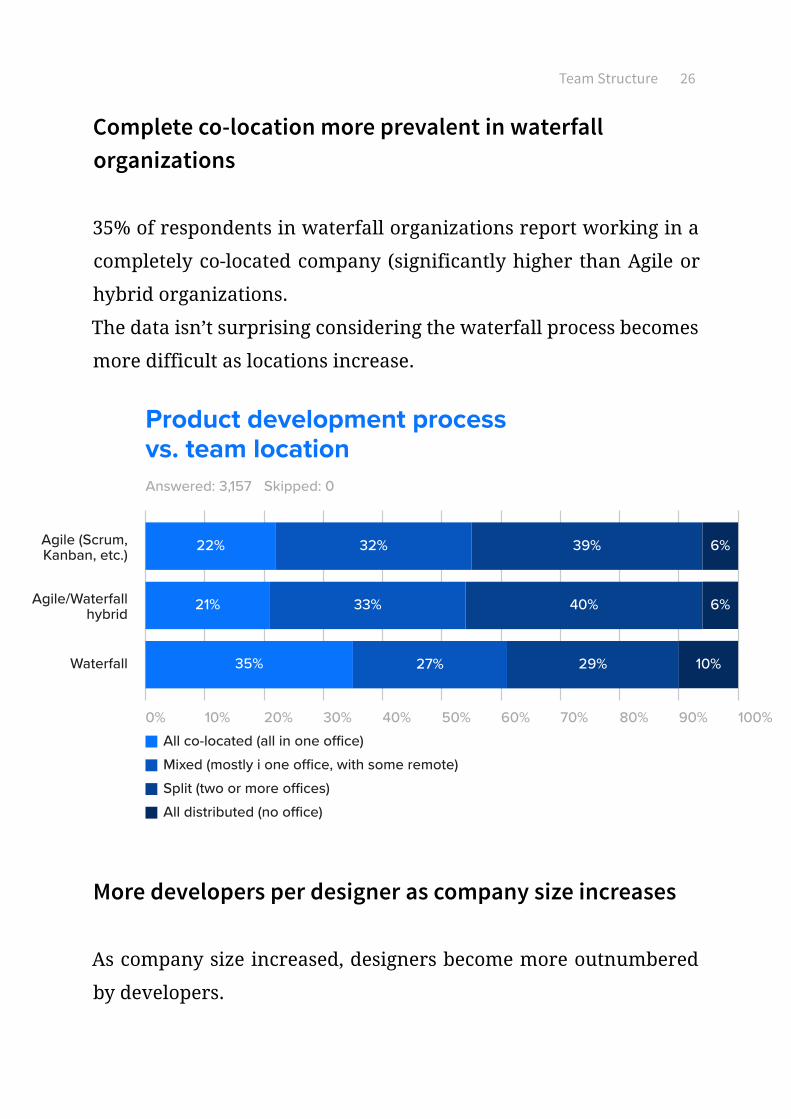
Complete co-location more prevalent in waterfall organizations
35% of respondents in waterfall organizations report working in a
completely co-located company (significantly higher than Agile or
hybrid organizations.
The data isn’t surprising considering the waterfall process becomes
more difficult as locations increase.
Answered: 3,157
0% 10% 20% 30% 40% 50% 60% 70% 80% 90% 100%
Agile (Scrum, Kanban, etc.)
Agile/Waterfallhybrid
All co-located (all in one o�ce)
Mixed (mostly i one o�ce, with some remote)
Split (two or more o�ces)
All distributed (no o�ce)
Waterfall
21%
22% 32% 39%
40%
29%
6%
6%
10%
33%
27%35%
Skipped: 0
Product development process vs. team location
More developers per designer as company size increases
As company size increased, designers become more outnumbered
by developers.

Team Structure 27
In fact, 35% of respondents in companies with more than 1001 em-
ployees report a ratio of 1 designer: 51-70 developers (or more).
Meanwhile, only 16% of respondents in companies with 501 to 1000
employees reported the same ratio.
Answered: 3,140
0% 10% 20% 30% 40% 50% 60% 70% 80% 90% 100%
1 to 25
26 to 100
1 designer : 6 to 10 developers
1 designer : 11 to 20 developers
1 designer : 21 to 50 developers
1 designer : 51 to 70 developers
101 to 500
501 to 1000
1001 to 5000
5001 or more
77% 16%
17%
5%
6%44% 31%
1 designer : 71 developers or higher
1 designer : 5 developers or fewer
7%19% 25%
25% 25%
9%
5%5%
8%16%
16%
17%
24%
24%
11%11%
Skipped: 0
16%20%17%12%
22%
22% 18%
22%15%
Company size vs. designer/developer ratios
Total
27%855
19%591
19%594
7%216
11%344
17%540
3,140
1 to 25
26 to 100
101 to 500
501 to 1000
1001 to 5000
5001 or more
Total respondents
1 designer : 5 de-velopers or fewer
1 designer : 6 to 10 developers
1 designer : 11 to 20 developers
1 designer : 21 to 50 developers
1 designer : 51 to 70 developers
1 designer : 71 developers or higher
77%660
44%260
25%147
19%40
15%51
12%64
16%13916%139
31%18531%185
24%145
25%55
25%55
22%75
17%91
5%40
17%102
25%150
22%47
22%75
20%110
20%110
1%6
6%38
16%93
18%39
16%55
15%88
0%3
1%3
5%325%32
7%15
8%29
11%59
1%7
1%3
5%27
9%20
17%59
24%128
1,222 690 523 319 141 244

Team Structure 28
The data suggests that most enterprises are still new to employing
full-time UX roles.
53% of all 3157 respondents reported a full-time UX role has existed
for less than 3 years.
Answered: 3,157
0% 10% 20% 30% 40% 50% 60% 70% 80% 90% 100%
Less than 1 year
At least 1 year but less than 3 years
At least 3 years but less than 5 years
At least 5 years but less than 10 years
More than 10 years
28%
25%
21%
19%
7%
Skipped: 0
How long has a full-time UX role existed at your company?
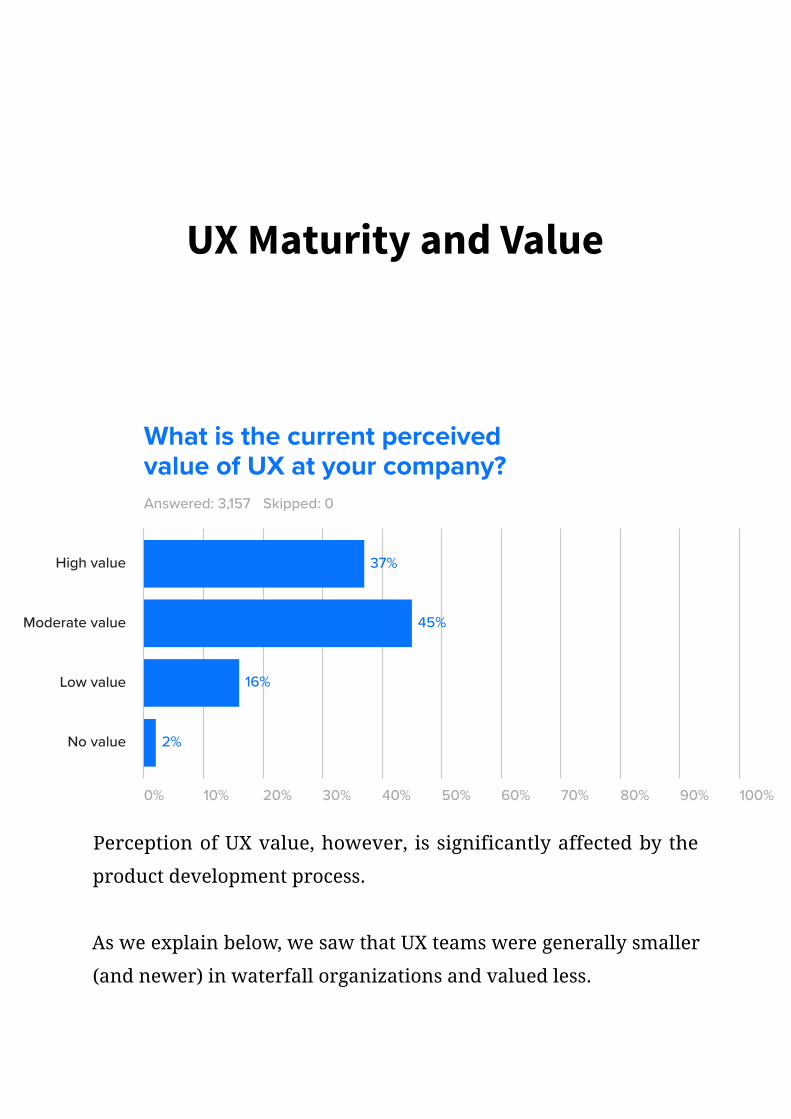
Yet despite relatively new UX adoption, most do seem to value the
practice. 82% of respondents say their company values UX at least
moderately.
UX Maturity and Value
Answered: 3,157
0% 10% 20% 30% 40% 50% 60% 70% 80% 90% 100%
High value
Moderate value
Low value
45%
37%
16%
No value 2%
Skipped: 0
What is the current perceived value of UX at your company?
Perception of UX value, however, is significantly affected by the
product development process.
As we explain below, we saw that UX teams were generally smaller
(and newer) in waterfall organizations and valued less.
UX Maturity and Value 30
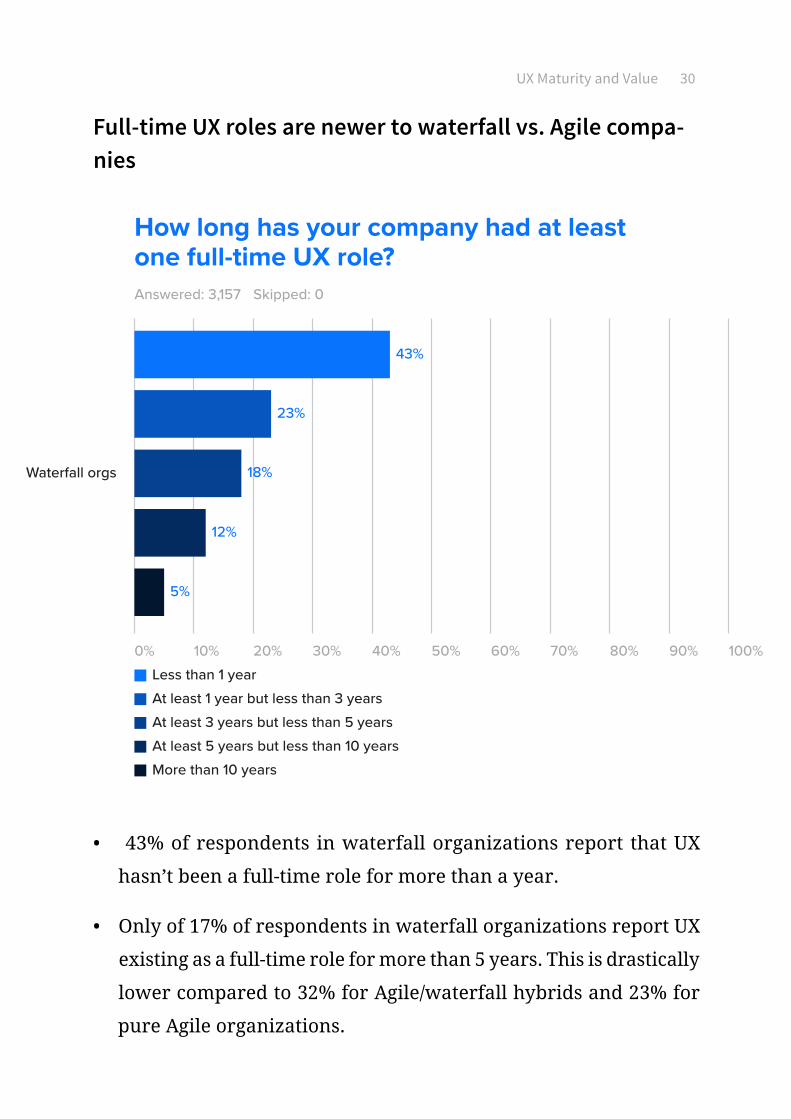
Full-time UX roles are newer to waterfall vs. Agile compa-nies
•
Answered: 3,157
0% 10% 20% 30% 40% 50% 60% 70% 80% 90% 100%
Waterfall orgs
23%
43%
18%
12%
5%
Skipped: 0
How long has your company had at least one full-time UX role?
At least 1 year but less than 3 years
At least 3 years but less than 5 years
At least 5 years but less than 10 years
More than 10 years
Less than 1 year
43% of respondents in waterfall organizations report that UX
hasn’t been a full-time role for more than a year.
• Only of 17% of respondents in waterfall organizations report UX
existing as a full-time role for more than 5 years. This is drastically
lower compared to 32% for Agile/waterfall hybrids and 23% for
pure Agile organizations.

UX Maturity and Value 31
Most waterfall organizations employ less than 5 full-time UX roles
•
Answered: 2,675
0% 10% 20% 30% 40% 50% 60% 70% 80% 90% 100%
Agile (Scrum, Kanban, etc.)
Agile/Waterfallhybrid
0
1 to 5
6 to 15
16 to 30
Waterfall
10%
10% 58% 16%
16%
7%
5% 11%
13%
4%
8%
31 or more
3%
54%
56%29%
Skipped: 0
Product development process vs. full-time UX roles
85% of respondents in waterfall organizations report less than 5
full-time UX roles
• Agile and Agile/Waterfall hybrids are 2-2.5x likelier to have more
than 16 full-time UX roles.
Waterfall organizations tend to value UX less
46% of respondents in waterfall organizations report low or no per-
ceived value of UX.

UX Maturity and Value 32
The percentage is drastically higher than 18% for Agile/waterfall
hybrids and 14% for pure Agile companies.
Answered: 3,157
0% 10% 20% 30% 40% 50% 60% 70% 80% 90% 100%
Agile (Scrum, Kanban, etc.)
Agile/Waterfallhybrid
High value
Moderate value
Low value
No value
Waterfall
33%
42% 43% 13%
16%
34%
1
249%
35%19%
Skipped: 0
Product development process vs. perceived UX value
12%

Design Income
To normalize the data, we’ll only analyze responses from the 1202
respondents in a design role who work in the US & Canada region
(38% of total respondents).
We define a design role as product/UX design, visual design, interac-
tion design, information architecture, or user research.
Here’s our most interesting insights:
• Income dramatically increases at the director level – 67% of
directors report earning $125,001 or more per year.
• Income dramatically increases between 3 to 5 years of ex-
perience – At this level, 3x more respondents earn greater than
$100,001 per year compared to those with 1-3 years of experience.
• Promising long-term career income – After 10 years of experience,
82% of respondents report yearly earnings of at least $150,001.
• Greater number of highly paid designers in larger companies
– In companies with 1001 or more employees, 63% of designers

Design Income 34
earn $100,001 or more per year. In companies with 101 to 500
employees, 46% of designers earn $100,001 or more per year. In
companies with 1 to 100 employees, 43% of designers earn 100,001
or more year.
•
Answered: 1,352
0% 10% 20% 30% 40% 50% 60% 70% 80% 90% 100%
Individual contributor
Supervisor/manager
$75,001 to $100,000
$100,001 to $125,000
$125,001 to $150,000
$150,001 to $175,000
Director-level
VP-level
C-level or higher
21%8% 33% 20%
20%28%
4%
4%
12% 2
8%9%5%
5%
26%
$175,001 or more
$50,001 to $75,000
24%9% 9%
17%2 11%
10%
33%
33%
25%18%
18%6%16%
22%
Skipped: 49
$0 to $50,000 USD
26%
8%10%
What is your approximate annual income (in USD)?
Individual contributors: 72% earn at least $75,000 or more per
year.
• Supervisors/managers: 49% of supervisor/manager roles earn
between $100,001 to $150,000 a year.
• Directors: At the director level, we start to see income increasing
as 67% of directors earn at least $125,001 or more.

Design Income 35
• VPs: At the VP level, income drastically increases with 58% of re-
spondents earning at least $150,001 or more.
• C-level or higher: Interestingly enough, we see more lower in-
come ranges among CEOs than any other group surveyed. In fact,
9.8% of the C suite reported incomes of $0 to $50,000. However,
since 30% still earn at least $175,001 or more, the data leads us to
believe that the C-suite likely earns higher cash salary or takes a
lower salary but significantly higher equity.

Design Income 36
Income By Function
What is your approximate annual income (in USD)?Answered: 1,352
0% 10% 20% 30% 40% 50% 60% 70% 80% 90% 100%
$75,001 to $100,000
$100,001 to $125,000
$125,001 to $150,000
$150,001 to $175,000
23%16% 29% 15%
17%19%
4%
6%
8% 5%
5%18%7%
13%
29%
$175,001 or more
$50,001 to $75,000
27% 23%
30%2% 23%
18%
9%9%
19%
8%10%
16%17%16%
15%
Skipped: 49
$0 to $50,000 USD
21%
10%3%
Less than 1 year
At least 1 year but less than 3 years
At least 3 years but less than 5 years
At least 5 years but less than 10 years
More than 10 years
9%3%
• Less than 1 year experience: 60% earn less than $75,000 a year.
• At least 1 year but less than 3 years: As experience increases,
we seeing more designers earning more than $50,000. Overall,
however, income proportions remain similar to designers with
less than a year of experience.
• At least 3 years but less than 5 years: At the 3 year mark, income
increase significantly. Here, we see 31% of respondents report

Conclusion
incomes of at least $100,001 per year.
• At least 5 years but less than 10 years: Compared to the previ-
ous level of experience, we now see 3x more respondents earn
$125,001 -150,000 per year.
• 10 years or more: 58% of highly experienced design profession-
als (either principal contributors or leadership) will earn at least
$125,001 per year. Compared to the previous level of experience,
5x more respondents in this bracket earn $150,001 or more.

Conclusion 38
With UX spreading across the enterprise, more teams experience the
growing pains of scaling design culture and processes.
• Design consistency, usability testing, and clear requirements re-
main pressing issues with majority of respondents.
• Designers per developer decreases as company size increases.
• Over half of respondents indicated that a full-time UX role was
just introduced in the past 3 years.
Product teams, however, are quickly adapting to enterprise sprawl
with more collaborative processes and toolkits. Nearly 70% of re-
spondents report using a design system and over 90% follow some
form of Agile methods.
Enterprises are finally facing the reality that business users expect
the same quality of experience as consumer products. While trans-
formation won’t happen overnight, the future certainly looks prom-
ising. As UX continues to evolve as a core business competency, so too
will the processes and platforms that support collaborative product
development.
