perpustakaan.uns.ac.id digilib.uns.ac.id elucidating ...perpustakaan.uns.ac.id digilib.uns.ac.id...
TRANSCRIPT
perpustakaan.uns.ac.id digilib.uns.ac.id
commit to user
ELUCIDATING USER ACCEPTANCE OF MOBILE BANKING:
A PERSPECTIVE OF THE EXTENDED TECHNOLOGY ACCEPTED
MODEL (TAM) USING PERCEIVED MOBILITY VALUE AND
PERCEIVED ENJOYMENT VARIABLES
SKRIPSI Submitted as Partial Fulfillment of Requirements for the Degree of Sarjana
Ekonomi (SE) at the Sebelas Maret University Surakarta
By Delariza Rika Fasita
F 0307036
FACULTY OF ECONOMICS SEBELAS MARET UNIVERSITY
SURAKARTA 2011
perpustakaan.uns.ac.id digilib.uns.ac.id
commit to user
iv
perpustakaan.uns.ac.id digilib.uns.ac.id
commit to user
v
perpustakaan.uns.ac.id digilib.uns.ac.id
commit to user
vi
MOTTO
Sungguh bersama kesulitan itu ada kumudahan, karenanya jika kamu telah
selesai (dari suatu urusan) kerjakanlah sungguh-sungguh (urusan yang lain).
Dan kepada Tuhanmulah kamu berharap
(Q.S. Alam Nasyrah: 6-8).
You live you learn, you love you learn, you cry you learn, you lose you learn
(Alanis Morisette).
In the middle of difficulty lies opportunity
(Albert Einstein).
Only those who dare to fail greatly, can ever achieve greatly
(Robert F. Kennedy).
Hidup itu tak selamanya indah, tapi biarkan yang indah itu tetap
hidup dalam kenangan
(anonymous).
perpustakaan.uns.ac.id digilib.uns.ac.id
commit to user
vii
DEDICATION
This skripsi and whatsoever success
that I could achieve is dedicated to
My -greatest - beloved Papa and Mama
If only there is a good enough word to
say my sincerely thanks for you two.
I Love you.
perpustakaan.uns.ac.id digilib.uns.ac.id
commit to user
viii
2. Drs. Jaka Winarna M.Si., Ak., as the Head of Accounting Department, Sebelas
Maret University, Surakarta.
3. Mr. Santoso Tri Hananto, M.Si,Ak., as my skripsi advisor. Thanks for your
advices and support so this skripsi can be done.
4. Mr. Agus Budiatmanto SE., M.Si, Ak., as my academic advisor, thanks for all
your support and advices.
5. My Papa and Mama, thank you for being my greatest parents in the worlds.
Thank you for all support and endless love, even we were separated, I know
you always there for me. This English skripsi is dedicated only for you two
and also my sister, Rensi.
6. My “dudulz” Dedie Saifullah, thank you for all love, care, understanding, and
all you’ve gave for me for whole time. I always could count on you.
ACKNOWLEDGMENT
Researcher will be grateful to Allah SWT for all the mercy and bless so that
she was able to finish this research well. This Skripsi is proposed to complete all the
requirements of achieves the degree of Sarjana Ekonomi of Accounting Department,
Sebelas Maret University, Surakarta.
Researcher realizes that she could not have finished this skripsi without the supports
and involvement of many parties both directly and indirectly. I owe a very great debt
to:
1. Prof.Dr. Bambang Sutopo, M.Com., Ak., as the Dean of Economics
Department, Sebelas Maret University, Surakarta.

perpustakaan.uns.ac.id digilib.uns.ac.id
commit to user
ix
7. Dhinar Adi Nugroho, my best brother, thank you for the story, your support
and care for me.
8. My best friends “LOTIZ”, Dewi Listiani thank you for being my first friend at
UNS until now, your trust for always share to me. Noor Anis Meikawati,
thanks for our story together, I will never forget it. Murdiani Agustiati, thank
you for coloring our day with your odd behavior. When we feel down,
remember our heart fight to through all this. Novi Eka Rahmawati, thank you
for your serenity that always make me so calm.
9. My best friends in Bekasi, Febri Alfalina Saputri, Reynaldi Oey, Allert
Benedicto Ieua Noya, Dian Anggraini Kumalasari thanks for our beautiful
relationship.
10. All of my best friends, Ebray, aunt Weny, Fata’s mom for being my great
English editor. Joe, Hadi, Gandi “Tria” for the never ending support.
11. Thanks to pakde Dr. Nur Julianto and Bude Mochdiyati whom I lived with at
Solo. My big family, Eyang Imam Soeyitno family and Embah Mochammad
Family, thanks for your love, care, and support.
12. My “Agent 007” friends: Ayus, Peka, Irla, Fatania, Dewo, Mba Sri, Oppie,
Nani, Rudi, Rija’, Awang, etc. HMJ Akuntansi friends, Mas Okky, Mba Desta,
Mas Dancrut, Mba Ulli, Mas Fijri, Mba tryas, Mba Hanni, Mba Finik, Reza,
Abhe, Anes, etc. and all of economic faculty friends for all support in the last
four years.
perpustakaan.uns.ac.id digilib.uns.ac.id
commit to user
x
13. And for all parties that Researcher could not mention one by one, but you have
already mentioned in my heart.
Researcher realizes that this research is far from being perfect. This research
has a lot of constraint, thus any suggestions and critics are expected for the sake of
improving this research.
As I close this acknowledgment, I expect that this small print writing will be useful
to all parties.
Surakarta, April, 2011
Delariza Rika Fasita
perpustakaan.uns.ac.id digilib.uns.ac.id
commit to user
xi
TABLE OF CONTENTS
Page
TITLE ................................................................................................................. i
ABSTRACT ........................................................................................................ ii
ABSTRAK ........................................................................................................... iii
PAGE OF ADVISOR’S APPROVAL .............................................................. iv
PAGE OF APPROVAL ..................................................................................... v
PAGE OF MOTTO ............................................................................................. vi
PAGE OF DEDICATION ................................................................................. vii
ACKNOWLEDGEMENT ................................................................................. viii
TABLE OF CONTENT ..................................................................................... xi
LIST OF TABLES .............................................................................. ............... xiv
LIST OF FIGURE.............................................................................. ................ xv
LIST OF APPENDIXES .............................................................................. ..... xvi
CHAPTER
I. INTRODUCTION
A. Background.............................................................................. ............... 1
B. Problem Statements .............................................................................. . 7
C. Research Objectives .............................................................................. . 7
D. Research Advantages .............................................................................. 7
II. THEORETICAL FRAMEWORK
A. Agency Theory .................................... ................................................... 9
perpustakaan.uns.ac.id digilib.uns.ac.id
commit to user
xii
1. Technology Concepts ........................................................................ 9
2. Conceptual of Mobile Banking ........................................................... 11
3. Technology Accpeted Model (TAM) ................................................. 14
B. Conceptualization and Hypotheses Development ................................. 23
C. Conceptual Framework ........................................................................... 26
III. RESEARCH METHODS
A. Research Design .................................................................................... 27
B. Population and Sample ........................................................................... 27
C. Data Source and Data Collecting Technique .......................................... 28
D. Measurement Items ................................................................................ 28
E. Data Analyze Technique and Hypotheses Test ...................................... 31
1. Data Test Technique .......................................................................... 31
2. Model Assumption Test ..................................................................... 33
IV. DATA ANALYSIS
A. Data Collection Analysis ....................................................................... 39
1. Total Data Collection ......................................................................... 40
2. Respondents Demography ................................................................. 40
B. Data Test Analysis .................................................................................. 43
1. Normality Test ................................................................................... 43
2. Outlier Evaluation ............................................................................. 44
3. Validity Test ...................................................................................... 45
4. Reliability Test .................................................................................. 47
perpustakaan.uns.ac.id digilib.uns.ac.id
commit to user
xiii
C. Model Assumption Test .......................................................................... 48
1. Godness of Fit Analysis ..................................................................... 48
2. Model Modification ........................................................................... 49
D. Hypotheses Analysis ............................................................................... 51
V. CONCLUSION
A. Conclusions ............................................................................................ 57
B. Research Constraints .............................................................................. 58
C. Research Suggestion ............................................................................... 59
REFERENCES ................................................................................................... 60
APPENDIXES
perpustakaan.uns.ac.id digilib.uns.ac.id
commit to user
xiv
LIST OF TABLES
PAGE
Table III.1 Research Variables 29
Table III.2 Godness of Fit Indices 37
Table IV.1 Data Research Collection 40
Table IV.2 Respondents Age 41
Table IV.3 Respondents Educational Background 42
Table IV. 4 Normality Test 44
Table IV.5 Outliers Data 45
Table IV.6 Validity Test 46
Table IV.7 Reliability Test 47
Table IV.8 Goodness of Fit Model Before Modified 48
Table IV.9 Goodness of Fit Model After Modified 50
Table IV.10 Goodness of Fit Model Summary 51
Table IV.11 Significant Level 51
Table IV.12 Standardized Regression Weight 52
perpustakaan.uns.ac.id digilib.uns.ac.id
commit to user
xv
LIST OF FIGURE
PAGE
Figure II.1 Technology Accepted Model by Davis et al. (1989) 17
Figure II.2 Conceptual Framework 26
Figure III.1 TAM with Perceived Mobility Value (PMV) and Perceived
Enjoyment (PE) 38
Figure IV.1 Respondents Gender 41
Figure IV.2 Bank Where The Respondents Save Their Money in 42
Figure IV.4 Coefficient Path of TAM 56
perpustakaan.uns.ac.id digilib.uns.ac.id
commit to user
xvi
LIST OF APPENDIXES
Appendix 1 Questionnaire Form
Appendix 2 Respondents Recapitulation
Appendix 3 Research Path Diagram before Modified
Appendix 4 Research Output Path Diagram before Modified
Appendix 5 Normality Test
Appendix 6 Outlier Test
Appendix 7 Validity Test
Appendix 8 Reliability Test
Appendix 9 Goodness of Fit Model before Modified
Appendix 10 Modification Indices before Modified
Appendix 11 Research Path Diagram after Modified
Appendix 12 Goodness of Fit Model after Modified
Appendix 13 Modification Indices after Modified
Appendix 14 HypothesesTest
perpustakaan.uns.ac.id digilib.uns.ac.id
commit to user
xvii
perpustakaan.uns.ac.id digilib.uns.ac.id
commit to user
ii
ABSTRACT
ELUCIDATING USER ACCEPTANCE OF MOBILE BANKING: A PERSPECTIVE OF THE EXTENDED TECHNOLOGY ACCEPTED
MODEL (TAM) USING PERCEIVED MOBILITY VALUE AND PERCEIVED ENJOYMENT VARIABLES
DELARIZA RIKA FASITA NIM F0307036
The objective of this research is to examine and verify that the TAM can be employed to explain and predict the acceptance of mobile banking. This study identifies two factors that account for individual differences, i.e. Perceived Mobile Value (PMV) and Perceived Enjoyment (PE) which is adapted from Huang et al. (2006). Population in this research is bank customers who use mobile banking services in Indonesia. A sample of 131 respondents was selected using a purposive sampling method whereby the respondents have to be mobile banking users to be included in the survey. The constructs’ in the model were measured using existing items adapted from some prior TAM research.
The result shows that the data fit the extended TAM well. Furthermore, the result show that perceived enjoyment and perceived mobility can affect individual intention to use mobile banking. Overall, the result support that perceived mobility value and perceived enjoyment may appropriate to use in predicting user acceptance of mobile banking.
Keywords: Mobile banking, perceived enjoyment, perceived mobility value
perpustakaan.uns.ac.id digilib.uns.ac.id
commit to user
iii
ABSTRAKSI
MENJELASKAN PENERIMAAN PENGGUNA MOBILE BANKING: SEBUAH PERSPEKTIF DARI PERLUASAN MODEL PENERIMAAN TEKNOLOGI
MENGGUNAKAN VARIABEL PERSEPSI NILAI MOBILITAS DAN PERSEPI KENIKMATAN
DELARIZA RIKA FASITA NIM F0307036
Tujuan penelitian ini adalah untuk menguji dan memverifikasi apakah TAM dapat digunakan untuk menjelaskan dan memprediksi penerimaan pengguna mobile banking. Penelitian ini menggunakan dua faktor yang menjelaskan perbedaan-perbedaan individual, yaitu persepsi nilai mobilitas dan persepsi kenikmatan, yang diadaptasi dari Huang et al. (2006). Populasi pada penelitian ini adalah nasabah bank pengguna jasa mobile banking. Sampel dari 131 responden didapat dengan menggunakan metode purposive sampling di mana kriteria responden adalah pengguna mobile banking. Konstruk yang digunakan dalam model diukur dengan menggunakan item pengukuran yang diadaptasi dari penelitian TAM yang pernah ada.
Hasil menunjukkan bahwa data cocok dengan perluasan model TAM ini dan persepsi nilai mobilitas dan persepsi kenikmatan dapat mempengaruhi niat seseorang untuk menggunakan mobile banking. Secara keseluruhan, persepsi nilai mobilitas dan persepsi kenikmatan dimungkinkan untuk digunakan dalam memprediksi penerimaan pengguna mobile banking.
Kata kunci: Mobile banking, persepsi kenikmatan, persepsi nilai mobilitas
perpustakaan.uns.ac.id digilib.uns.ac.id
commit to user
1
CHAPTER I
INTRODUCTORY
A. BACKGROUND
Nowadays technology, provide dynamic collaborative environments that
widely recognized today, becomes an important factor in the future development
(Baten, 2010). Information technology is weakening geographical constraints
and changing the way people communicating to each others (Mazhar, 2006). The
usage of new information technology will also change the individual behaviour
(Hamzah, 2009).
The internet, one of the information technologies, has created an
incredible market space. Same with it, another technology stream has emerged to
play an increasingly important role in business and society: mobile
communications (Feng et al. in Barati and Mohammadi, 2009). Mobile phones
have become an integral part of the 21st century landscape with an expected
penetration of 4.5 billion by 2011. As the number of mobile phone users is
growing, purchasing products and services using mobile phones and other
mobile devices are also increasing (Manochehri and Alhinai in Barati and
Mohammadi, 2009).
The major change has come in the delivery of the content, application,
and services to the mobile communication devices (Sadi et al., 2010). Since the
mid-1990s, there has been a fundamental change in banking delivery channels
toward using self-service channels such as online banking services (Pikkarainen
perpustakaan.uns.ac.id digilib.uns.ac.id
commit to user
2
et al., 2004). Banks began to look at electronic banking (e-banking) as a means
to replace some of their traditional branch functions for two reasons. Firstly,
branches were very expensive to set up and maintain due to the large overheads
associated with them. Secondly, e-banking products or services like Automatic
Teller Machine (ATM) and electronic fund transfer were a source of
differentiation for banks that utilised them. Banks can find significant savings by
serving customers in the mobile channel ($0.08) rather than through the contact
centre ($3.75), IVR banking ($1.25), ATM ($0.85) or even online banking
($0.17) (Eads, 2009: 1). Being a tight competitive industry, the ability of banks
to differentiate themselves based on price is limited (Singh et al. in Goi, 2006).
Mobile banking, the lowest cost banking service, is defined as a way for
the customer to perform banking actions on his or her cell phone or other mobile
device (Miller, 2011). Mobile banking is a financial service access from using
Short Message Services (SMS) technology platform for simple transaction as a
customer’s asks (Hristu in Amin et al. 2006) to using Wireless Application
Protocol (WAP) technology for more complex financial information. With
mobile banking services, customers should not go to ATM. In the past, people
were doing their transactions using ATM. This machine gives an enough
solution to customers for paying without stand in a long line, but it still needs the
attendant from the customers to do their transaction.
Although information technology condition in Indonesia leave behind
from other countries (Harmadi and Hermana, 2005), but compared with other e-
banking services, the mobile banking growth in Indonesia is the quickest. This
perpustakaan.uns.ac.id digilib.uns.ac.id
commit to user
3
rush growth is because mobile banking services, use for different kinds of
banking services ranging from bill payment to making investment, can answer
the needs of modern citizens who have a high mobility. Customers are not the
only beneficiary of this new service, commercial banks may greatly increase the
market coverage and better track customer as well (Shao, 2007).
Now on, almost all banks in Indonesia apply this kind of services. The
government hope with this popular channel from banking services will decrease
the used of cash money. A survey research from the International Financial
Institute reveals that 35% from all over the world online housing work chores
will shift to mobile banking services. It predicted that the value of mobile
banking services will increase two times per years and will increase four times
per years after 2011. According to a study conducted by the telecommunications
analyst firm the number of mobile phone banking users will exceed 150 million
globally by 2011.
Based on Indonesia Bank, internet banking user reached about 2,5
million by 2009. It larger than in 2008 where the internet banking user only
reached about 1,5 million (Ismartunun, 2010). The amount of BCA mobile
banking transaction has increased 57%, from Rp. 27,9 billion at the first quarter
by 2009 to Rp. 43,9 billion at the first quarter by 2010 (Ismartunun, 2010).
TELKOMSEL, one of Indonesia’s cellular network provider, has 2,5 million
mobile banking users, with the highest traffic from BCA and Mandiri Bank, and
has predicted 4 million customers will use mobile banking services by the end of
perpustakaan.uns.ac.id digilib.uns.ac.id
commit to user
4
2007 (Noor in Niagara, 2008: 3). It can conclude that mobile banking users in
Indonesia are quite enough perspective.
The success of mobile banking usage depends on how users would
achieve the systems (Wijayanti and Akhirson, 2009). Thus, the metaphorical tide
is likely to raise all boats by increasing overall customer comfort with mobile
banking and mobile commerce in general, which will decrease costs and
increasing profits through the new customers and more profitable transactions
(Eads, 2009).
Choosing mobile banking as the object of this study analysis is due to
two particular reasons. First, the need of media for people who has a high
mobility is increasing overtime. Second, mobile banking helps to reduce the
transaction cost and give more value-added for the customers.
Human beings, being creatures of habit, will probably view anything that
is new with caution and suspicion. The same applies to multimedia banking.
However, with the threat of globalization and possible squeezes in margins,
banks are attempting to 'push' clients towards multimedia banking (Vijayan et
al., 2005).
Many research were explained by Harmadi and Hermana (2005) in
Indonesia, Lee et al. (2007) in South Korea, Kripanont (2007) in Thailand,
Wessels and Drennan (2009) in Australia, Sadi et al. (2010) in Sultanate Oman
about determinant adoption of internet banking is no longer generally consistent.
It means that those researches not yet found the exact factors affecting the
customers to use mobile banking services. Technology Accepted Models (TAM)
perpustakaan.uns.ac.id digilib.uns.ac.id
commit to user
5
approach, developed by Davis et al. (1989) based on Theory of Reasoned Action
(TRA), used by those researches, which can explain customer acceptance of
information technologies.
TAM consists of six primaries constructs, namely external variables (e.g.
prior experience, voluntariness, compatibility, complexity, etc.), perceived
usefulness, perceived ease of use, attitude, behavioural intention, and actual
usage. It shows that user behaviour is determined by perceptions of usefulness
and the ease of use of the technology (Adams et al., 1992; Davis et al., 1989;
Mathieson, 1991; in Huang et al., 2006). Davis (1989) observed that external
variables enhance the ability of TAM to predict acceptance for future
technology. In other words, the constructs of TAM need to be extended by using
additional factors (Huang et al., 2006).
Many research extended their TAM with external variables in order to
explain further and become the antecedent from perceived usefulness or
perceived ease of use (Jogiyanto, 2008: 124). Choosing additional factors
depends on the target technology, main users, and context (Moon and Kim in
Huang et al., 2006). Wang et al. in Huang et al. (2006) noted that variables
relating to individual differences play a vital role in the implementation of
technology. The more accepting of a new information system the users are, the
more willing they are to make changes in their practices and use their time and
effort to actually start using the new information system (Succi and Walter in
Pikkarainen et al., 2004). Usage of a system can be an indicator of information
system success and computer acceptance in some cases, whether the system is
perpustakaan.uns.ac.id digilib.uns.ac.id
commit to user
6
regarded as good or bad depends on how the user feels about the system
(Pikkarainen et al., 2004).
Mobile banking services are still in infancy. It has a great deal of room
for improvement. Thus, there is a need to study and understand user’s
acceptance of mobile banking services in order to identify the significant
motivational factors affecting their intention to use mobile banking.
From a marketing perspective the greatest advantage of mobile
communication and mobile commerce is that it offers suppliers a channel of
direct communication with consumers via a mobile device at any time and at any
place (Lubbe and Louw, 2009). How to anticipate customer needs and develop
mobile content services is not easy in a rapidly developing mobile market
(Pihlstrom, 2008: 2). Mobile devices create an opportunity to deliver new
services to existing customers and to attract new ones (Lubbe and Louw, 2009)
and when consumers enjoy positive experience in using mobile banking, they
will increase the amount of transaction (Suki and Suki, 2007). From that
explanation, this study will identify two constructs, which are adopted from
Huang et al. (2006), namely “perceived mobility value”, and “perceived
enjoyment” in order to identify the factors that influencing user acceptance of
mobile banking with TAM.
perpustakaan.uns.ac.id digilib.uns.ac.id
commit to user
7
B. PROBLEM STATEMENTS
Previous research, conducted by Huang et al. (2007), explains that user
acceptance of mobile learning can be explained by TAM with two external
variables, i.e. perceived mobility value and perceived enjoyment. Based on the
problem background, the researcher formulates the problems of this research,
using the same model with Huang et al. (2007) but with different object, in
question forms “Are perceived mobility value and perceived enjoyment
variables affecting user acceptance of mobile banking with Technology
Acceptance Model (TAM)?”
C. RESEARCH OBJECTIVES
The objective of this research is to examine and verify that the TAM can be
employed to explain and predict the user acceptance of mobile banking using
two factors that account for individual differences, i.e. Perceived Mobile Value
(PMV) and Perceived Enjoyment (PE).
D. RESEARCH ADVANTAGES
1. Advantages for banking provider
The researcher expects with this research, banking provider would know what
factors affecting their customers using or adopting mobile banking to do their
transaction so that can use for their future strategic plan, substance policy
improving their productivity, and enhance their market section in this
globalization era full with technology adopted.
perpustakaan.uns.ac.id digilib.uns.ac.id
commit to user
8
2. Advantages for bank customer
This research hopefully can give advantages to the customers, so they can
maximize using mobile banking services. Afterwards, for the customers who
not yet known and not yet use it before will know and use it in their daily life.
3. Advantages for next research
Hopefully, this research can contribute a reference for literature development
and knowledge for next research about mobile banking technology.
perpustakaan.uns.ac.id digilib.uns.ac.id
commit to user
9
CHAPTER II
THEORETICAL FRAMEWORK
A. Agency Theory
1. Technology Concepts
Nowadays, technology has been being an unearthed part of human life.
There are so many definitions of technology. In Random House Dictionary
quotes from Kumala (2008: 12) technology is defined tightly relating to life,
citizens, and environment. It means that technology will not be a free valuable.
A technology usually started from individual or group imagination using
nature phenomenon and practical needs. From those imaginations, individual
or group developed it to be an invention. According to Galbraith in Niagara
(2008) technology is defined as a systematic application and obtained from
formulation science knowledge concept or knowledge collection that have
certain function in practical human daily live and technology as the activity
that involving organizational activity and system value.
Technology is defined by Goetch in Kumala (2008: 12) as “people
tools, resources, to solve problems or to extend their capabilities”. Pacey in
Kumala (2008: 12) defines technology as “the application or scientific and
other knowledge to the practical task by ordered systems that involve people
and organization, living things and machines”. From those definitions, there
are obtaining some essence: (1) technology related to eternal idea or human
thought, technology existence together with human culture existence, (2)
perpustakaan.uns.ac.id digilib.uns.ac.id
commit to user
10
technology is the human creation, so it does not come naturally, and it was
artificial; (3) technology is set of means, so it can be bordered or it universals,
depends on the analysis side sight; (4) technology is purposing to facilitate
human endeavour, so technology must be able increasing human ability
performance (Kumala, 2008: 12).
Fichman in Stylanou and Jackson (2007) introduced a related argument
by distinguishing between two types of technologies in terms of the main
knowledge that each type determines the user. Type 1 technologies (e.g.
personal computers, word processing packages, graphics software) are
generally independent use technologies that are intended to facilitate self-
contained tasks performed by individual users. These technologies impose a
relatively small main knowledge and typically require only a few hours of
training before users achieve basic proficiency. In contrast, Type 2
technologies (e.g. software development process technologies) involve
significant knowledge barriers to adoption, including a lengthier training
process and a situation where the user ability, not just the willingness to use, is
a determining factor. As such, experience, attitudes, training, and supervisory
desires become valid predictor variables (Lee et al. in Stylanou and Jackson,
2007).
Facts in technology adoption based on the dynamic process, based on
empirical literature in naturally affecting static network (Ryan and Tucker in
Niagara, 2008: 12). The benefits of technology adoption is a beginning to
indicate economic development and in the next steps, technology can use as
perpustakaan.uns.ac.id digilib.uns.ac.id
commit to user
11
the economic agent of the corporation in the same industry. Decision of
adopting technology can also relate to how a corporation developing
information technology innovation. Thus, manager in a corporation must be
prepared for what strategy will be used to adopt information technology that
took by the end user as technology acceptance (Zhu and Weyant, 2000).
Innovation in technology information done by vendor can be speed, quality
and flexibility increasing for the end user operating (Steinmueller. 2001;
Callantone, et al. 2006; in Niagara, 2008: 13).
Orlikowski and Iacono in Stylanou and Jackson (2007) point to the fact
that not enough attention is paid to the technology itself as well as to the
tendency to threat technologies as an independent and stable constant despite
the empirical evidence that highlights the impact of system design on
perceptions and use. Adopting the perspective that technology use is a
function of how the technology merges with the social environment, they point
to the silence of cultural, normative, and regulatory influences on the usage
decision (Stylanou and Jackson, 2007).
2. Conceptual of Mobile Banking
Mobile phone is no longer known as it traditional functions, i.e. voice
conversation and Short Message Services (SMS). Nowadays, the mobile
phones even facilitate for a real time teleconference through 3G (Third
Generations). Nonetheless, from the banking perspective, mobile phones
introduce a new channel of distribution for the banking industry, and the
perpustakaan.uns.ac.id digilib.uns.ac.id
commit to user
12
demand are keeping on increasing hence entrenched its feasibility as a new
media of banking transaction (Amin et al., 2006).
In Barati and Mohammadi (2009), mobile banking is defined as the
“type of execution of financial services which the customer uses mobile
communication techniques in conjunction with mobile devices” (Pousttchi and
Schurig, 2004). It is defined as “a channel whereby the customer interacts with
a bank via a mobile device, such as a mobile phone or personal digital
assistant” (Barness and Corbit, Scornavacca and Barnes, in Barati and
Mohammadi, 2009). According to Amin et al. (2006), mobile banking defines
as the newest channel in electronic banking to provide a convenience way of
performing banking transaction, which is known as "pocket-banking". The
terms m-banking, m-payments, m-transfers, m-payments, and m-finance refer
collectively to a set of applications that enable people to use their mobile
telephones to manipulate their bank store value in an account linked to their
handsets, transfer funds, or even access credit or insurance products (Donner
and Tellez, 2008).
In Amin et al. (2006), Kohli (2004) claimed that the mobile banking
service gives customers the convenience of account access information and
real-time transaction capabilities. Hamzah (2005) in Amin et al. (2006) said
that "mobile banking" brings the convenience and enhanced value. Riivari
(2005) in Amin et al. (2006) claimed that the opportunity for mobile services is
three times as many mobile phone users as those who use online PCs, and they
are now ready for anywhere, anytime applications that match their lifestyles.
perpustakaan.uns.ac.id digilib.uns.ac.id
commit to user
13
According to Donner (2006) mobile banking services enable consumers, for
example, to request their account balance and the latest transactions in their
accounts, to transfer funds between accounts, to make, buy and sell orders, for
the stock exchange and to receive portfolio and price information.
There are a variety of mobile media channels, including, SMS (Short
Message Service), mobile web, mobile client application, phone banking, etc.
Each mobile media channel has its strengths and weaknesses, and it is
important to identify the delivery mode that is most appropriate for each
banking service. According to Rahardjo in Widyastuti (2008: 32), there are
some conditions for mobile banking services: (1) easy use application, (2) the
services can be reached from everywhere and every time, (3) cheap, (4) secure,
and (5) reliable. Mobile banking services generally classified into three type
characteristics (Kumala, 2008: 15), mention as follow.
1) Informational This type is the simplest of mobile banking. It consists of products
and services information from bank provider. The risk is quite low, because this system does not connect to banks’ main server and network, but connects to web hosting server.
2) Communicative This type is enabling communication between customers and banks
systems. It can be account balance information, transaction report, customer data changed, and also member services form. The risk is higher than the first above, because there is an interaction between the customers and some banking network server, which is susceptible with programs that can harm the system such as viruses.
3) Transactional This last type is the most complete than the others, and generally it
also consist two types above. In this type, customers enable to do transaction directly. Because it has direct flow through bank main server and network, so it has the highest risk than two others. Thus, a good maintenance and direct control is necessary. Customers can directly access their bank account, paying bill, transferring fund, etc.
perpustakaan.uns.ac.id digilib.uns.ac.id
commit to user
14
According to Alsindi et al. (2004) in Kumala (2008: 16), mobile
banking services have some strengths and weaknesses. The strengths are
mentioned as follow.
1) WAP provides more alternatives to connect with bank customers and to increase the number of customers.
2) Bank customer can reach their banking services anytime and anywhere. 3) It can consider as one of the markets competitive advantage. 4) The used of this technology will decrease the number of customers to
visit bank or ATM and also opening new branch. The weaknesses are mentioned as follow.
1) The number of mobile banking users is very minim. 2) Mobile banking, perhaps, considered by some customers is a complex
used of technology. 3) Developing mobile banking services needs a lot of cost because it needs
more effort and infrastructure assure the security to do. 4) Limitation of cell phone screen width considered as one of the
weaknesses because the information than shown is limited.
Mobile banking is still in development phase which needs more
concerned due to enhance the mobile banking system content to fulfill the
customer needs. When it probably completing the customer needs, the
acceptance of consumer will increase and bank can rise up their profitability.
With driving customer loyalty, engaging new segment, and empowering it own
capability, it also probably gives some opportunities to bank provider.
3. Technology Acceptance Model (TAM)
One of the most utilized models in studying information system
acceptance is the Technology Acceptance Model (TAM) (Davis et al., 1989;
Mathieson, 1991; Davis and Venkatesh, 1996; Gefen and Straub, 2000; Al-
Gahtani, 2001) in which system use (actual behaviour) is determined by
Perceived Usefulness (PU) and Perceived Ease of Use (PEOU) relating to the
attitude toward the use that relates to the intention and finally to behaviour
perpustakaan.uns.ac.id digilib.uns.ac.id
commit to user
15
(Pikkarainen et al., 2004). TAM has become so popular that it has been cited
in most of the research that deals with user acceptance of technology (Lee et
al., 2003).
TAM is based on the Theory of Reasoned Action (TRA), which is
concerned with the determinants of consciously intended behaviours (Fishbein
and Ajzen in Pikkarainen et al., 2004). Behavioural intention will determine
individual behavioural. Expression from behavioural intention should be
relating with high accurate prediction of related volitional action (Jogiyanto,
2007: 26). From the information systems' perspective one relevant element of
TRA is its assertion that any other factor that influences behaviour, for
example, systems design variables user, characteristics, task characteristics,
political influences and organizational structure do so only indirectly by
influencing an attitude toward behaviour, subjective norm or their relative
weights (Davis et al. in Pikkarainen et al., 2004).
Since 1967 TRA has been developed, tested and used extensively and
its extension, the Theory of Planned Behaviour (TPB) utilized widely since
1988 by Ajzen. Ajzen included a construct which was not use yet in TRA.
This construct namely perceived behavioural control which is used to control
individual behaviour that is limited by their weaknesses and their boundaries
from lack of sources used to realize their behaviour (Jogiyanto, 2007: 61).
Although the TAM and the TRA share many issues they have some
considerable differences. The first difference is that according to TRA beliefs
are bound to context, and hence they cannot be generalized. Contrary to that,
perpustakaan.uns.ac.id digilib.uns.ac.id
commit to user
16
TAM states that PEOU and PU are issues that affect acceptance of all
information systems. The other significant difference is that in TRA all beliefs
are summed together, but in the TAM both beliefs are seen as distinct
constructs. Modelling each belief separately allows researchers to better trace
influences of all the affecting factors on information system acceptance (Davis
et al. in Pikkarainen et al., 2004).
TAM has been tested in many studies (e.g. Davis, 1989; Davis et al.,
1989; Mathieson, 1991; Adams et al., 1992; Davis, 1993; Segars and Grover,
1993; Taylor and Todd, 1995), and it has been found that TAM’s ability to
explain the attitude toward using an information system is better than other
model’s (TRA and TPB) (Mathieson in Taylor and Todd, 1995). In other
words, the use of an information system acts as an indicator for information
system’s acceptance. There are five main constructs used in TAM:
1) perceived usefulness,
2) perceived ease of use,
3) attitude towards behaviour or attitude towards using technology,
4) behavioural intention or behavioural intention to use,
5) behavioural or actual technology use.
perpustakaan.uns.ac.id digilib.uns.ac.id
commit to user
17
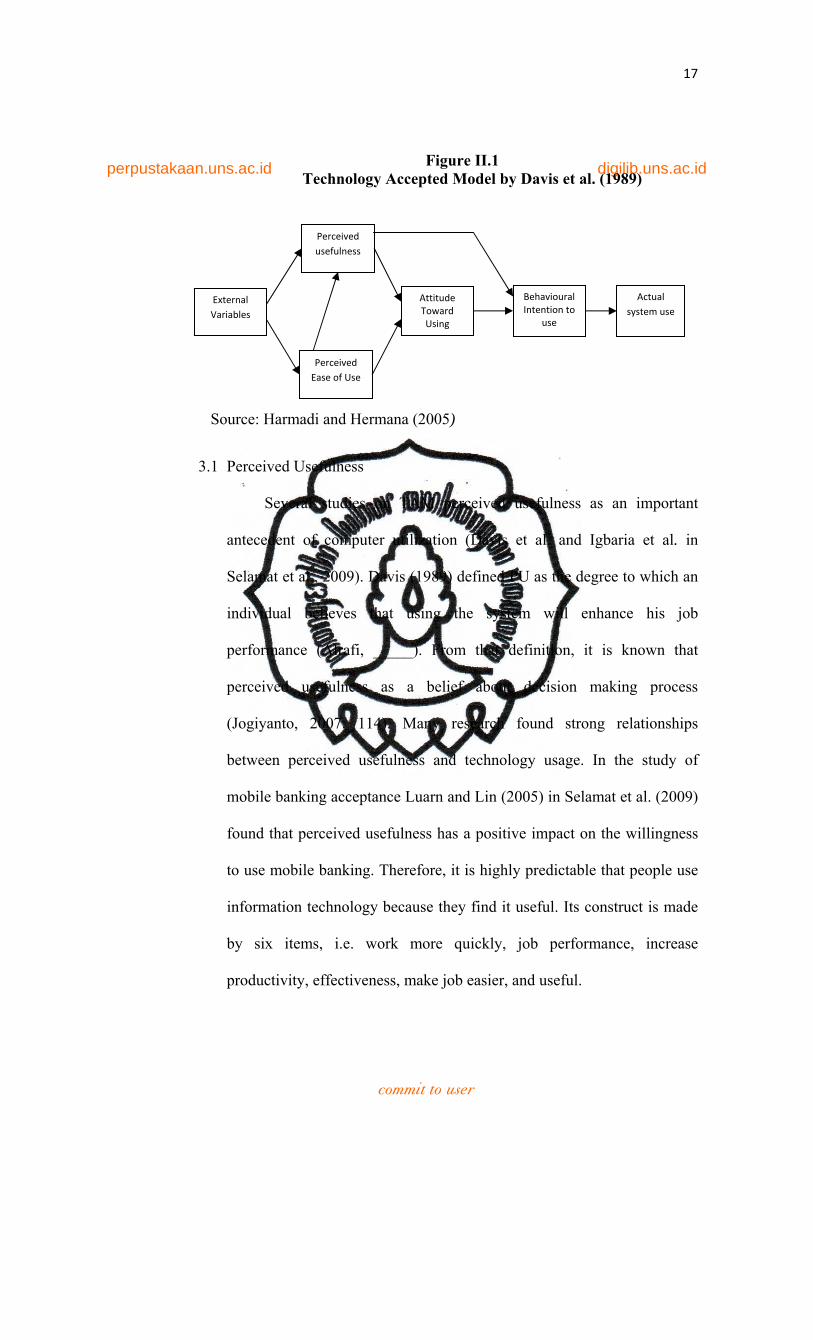
Figure II.1 Technology Accepted Model by Davis et al. (1989)
3.1 Perceived Usefulness
Several studies on TAM perceived usefulness as an important
antecedent of computer utilization (Davis et al. and Igbaria et al. in
Selamat et al., 2009). Davis (1989) defined PU as the degree to which an
individual believes that using the system will enhance his job
performance (Alrafi, _____). From that definition, it is known that
perceived usefulness as a belief about decision making process
(Jogiyanto, 2007: 114). Many research found strong relationships
between perceived usefulness and technology usage. In the study of
mobile banking acceptance Luarn and Lin (2005) in Selamat et al. (2009)
found that perceived usefulness has a positive impact on the willingness
to use mobile banking. Therefore, it is highly predictable that people use
information technology because they find it useful. Its construct is made
by six items, i.e. work more quickly, job performance, increase
productivity, effectiveness, make job easier, and useful.
External Variables
Attitude Toward Using
Perceived Ease of Use
Perceived usefulness
Behavioural Intention to
use
Actual system use
Source: Harmadi and Hermana (2005)
perpustakaan.uns.ac.id digilib.uns.ac.id
commit to user
18
3.2 Perceived Ease of Use (PEOU)
Quote from Selamat et al. (2009), PEOU is a major factor that
affects acceptance of an information system (Davis et al., 1989). PEOU
is defined as the degree to which an individual believes that using
computer or computerized system will be free from physical and mental
efforts (Davis in Alrafi, ______). From the definition, it is known that
PEOU also a belief about decision making process (Jogiyanto, 2007:
115).
According to Teo (2001) if a system is easy to use, it requires less
effort on the part of users, thereby increasing the likelihood of adoption
and usage. Conversely, if systems that are complex or difficult to use are
less likely to be adopted, since it requires significant effort and interest
on the user. Franco and Roldan (2005) in Selamat et al. (2009) found the
relationship between PEOU, and PU was significant and positively
related. This means a difficult system is less useful. The construct of
PEOU is formed by many items (Jogiyanto, 2007: 115), i.e. easy of learn,
controllable, clear and understandable, flexible, easy to become skilful,
and easy to use.
3.3 Attitude Towards Using
Attitude toward using the system is defined as the degree of
evaluative affect that an individual associates with using the target
system in his or her job (Davis et al. in Jogiyanto, 2007: 116). It refers to
the person’s general feeling, favorable or otherwise, for the use of the
perpustakaan.uns.ac.id digilib.uns.ac.id
commit to user
19
new technology. TAM conceptualizes individual perceptions of
usefulness based on instrumentality as being strongly related to attitude
toward technology use. It is also defined by Mathieson (1991) as the
user’s evaluation of the desirability of his or her using the system
(Jogiyanto, 2007: 116). Prior research showed that attitude has positive
influence to the behavioural intention, and some showed negative results.
Thus, some researches do not include this construct (Jogiyanto, 2007:
116).
3.4 Behavioural Intention
The behavioural intent constructs as a proxy to predict the actual
usage had been successful thus far (Ramayah and Ignatius, 2003).
Warshaw and Davis (1985) define behavioural intention as “the degree to
which a person has formulated conscious plans to perform or not perform
some specified future behaviour” (Ramayah and Ignatius, 2003). This is
in line with the Theory of Reasoned Action (Fishbein & Ajzen, 1975)
and its successor Theory of Planned behaviour (Ajzen, 1985), which
contend that behavioural intention is a strong predictor of actual
behaviour. In the application of information systems, the TAM has been
successfull used by many researchers to predict behavioural intent
towards the use of information technology (Ramayah and Jantan, 2003;
Ramayah, Sarkawi and Lam, 2003; Legris, Ingham, and Collerette, 2002;
in Ramayah and Ignatius, 2003).
perpustakaan.uns.ac.id digilib.uns.ac.id
commit to user
20
3.5 Behaviour (Actual Usage)
The behavior construct represents a user’s subjective estimate of
the amount of time or frequency that he/she actually spends using the
technology (Stylianou and Jackson, 2007). Igbaria et al. (1995) defined
perceived usage as the amount of time interacting with a technology and
the frequency of use (Gardner and Amoroso, 2004). They found strong
relationships with behavioural intent to use the technology. Igbaria et al.
in Gardner and Amoroso (2004) found that individuals are likely to use a
system if they believe it is easy to use and will increase their performance
productivity.
Actual usage, as originally conceptualized in the Davis (1989)
study, was measured by the frequency of use and the length of time of
use (Szajna, 1996). Objective measures of actual use are difficult to
obtain for Internet-based technologies and therefore, many of the TAM
studies either left out usage as a dependent variable, focusing solely on
behavioural intention or else moved to perceived usage. The construct
captures both work and entertainment related use. The mobile banking
conceptualization examines use as a function of the time spent
transaction on the mobile banking. Szajna (1996) recommended the
examination of self-reported usage. Sun (2003) in Gardner and Amoroso
(2004), reports that most TAM studies used a perceptual self-report
usage. Felasufazein (2010) and Kusumo (2010) has proven that actual
perpustakaan.uns.ac.id digilib.uns.ac.id
commit to user
21
usage did not fit to the model to their research for mobile banking
acceptance.
3.6 External Variables
Although TAM is a model applicable to a variety of technologies
(Adams et al., 1992; Chin and Todd, 1995; Doll et al., 1998), it has been
criticized for not providing adequate information on individuals’
opinions of novel systems (Mathieson, 1991; Moon and Kim, 2001;
Perea y Monsuwe et al., 2004; in Huang et al., 2006). Davis (1989)
observed that external variables enhance the ability of TAM to predict
acceptance of future technology. In other words, the constructs of TAM
need to be extended by incorporating additional factors. Choosing
additional factors depends on the target technology, main users and
context (Moon and Kim in Huang et al., 2006). Wang et al. (2003) in
Huang et al. (2006) noted that variables relating to individual differences
play a vital role in the implementation of technology. Additionally,
empirical research based on TAM has discovered strong relationships
between individual differences and information technology acceptance
(Agarwal and Prasad in Venkatesh, 2000).
To understand user perception of mobile banking, this study use
two individual difference variables, namely “perceived mobility value”
and “perceived enjoyment”, into the proposed TAM model. These two
constructs are described as follow. Perceived Mobility Value (PMV)
denotes user awareness of the mobility value of mobile banking. Mobility
perpustakaan.uns.ac.id digilib.uns.ac.id
commit to user
22
has three different elements, including convenience, expediency and
immediacy (Seppala and Alamaki in Huang et al. 2006). Mobility
permits users to gain access to service or information anywhere at
anytime via mobile devices. Previous studies found that mobile users
valued efficiency and availability as the main advantages of mobile
banking, and these advantages are a result of the “mobility” of a mobile
device (Chen et al., 2003; Hill and Roldan, 2005; Ting, 2005; in Huang et
al., 2006). From paper build by exploring customer perceived value in
the mobile service field, the majority of respondents show positive
critical incidents when users perceived mobile services to be especially
valuable them, description of reasons why and under which condition
they had used the service, and description of consequences of service use
in their own language (Pihlstrom, 2008: 65). Therefore, mobile banking
is valuable because of its mobility. Consequently, the perceived mobility
value is a critical factor of individual differences affecting users’
behaviors (Huang et al., 2006).
Individuals engage in activities because these activities lead to
enjoyment and pleasure (Teo and Lim, 1997). According to Davis et al.
(1992), Perceived Enjoyment (PE) is defined as “the extent to which the
activity of using the technology is perceived to be enjoyable in its own
right, apart from any performance consequences that may be anticipated”
Jogiyanto, 2007: 131). In this study, perceived enjoyment denotes the
extent to which an individual finds the interaction of mobile banking
perpustakaan.uns.ac.id digilib.uns.ac.id
commit to user
23
intrinsically enjoyable or interesting. Perceived enjoyment is seen as an
example of intrinsic motivation, and it has been found to influence user
acceptance significantly. Furthermore, research on the role of enjoyment
suggested the importance of enjoyment on users’ attitudes and behaviors
(Igbaria et al., 1995; Teo and Lim, 1997; Wexler, 2001; Yi and Hwang,
2003; in Huang et al. 2006).
B. Conceptualization And Hypotheses Development
1. Perceived Mobility Value (PMV)
PMV tested by Huang et al. (2006), it relates to users’ personal
awareness of mobility value. Mobility enables users to receive and transmit
information anytime and anywhere (Huang et al., 2006). The mobility
associated with time-related needs will encourage users to adopt mobile
technology since enhanced accessibility is expected to affect dynamic
interaction and high levels of engagement (Anckar and D’Incau, 2002 in
Huang et al., 2006). Earlier research supports the importance of conditional
value, in that people in general lack motivation to use new mobile services
unless these services create value in situations where mobility really matters
and thereby affect people’s lives positively (Jarvenpaa et al. in Pihlstrom,
2008: 183)
Hence, users who perceive the value of mobility also understand the
uniqueness of mobile banking and have a strong perception of its usefulness.
In other words, perceived mobility value has a positive effect on the
perpustakaan.uns.ac.id digilib.uns.ac.id
commit to user
24
perceived usefulness of mobile banking. Therefore, this work treats perceived
mobility value as a direct antecedence of perceived usefulness.
H1: Perceived mobility value has a positive effect on perceived usefulness of mobile banking.
2. Perceived Enjoyment
The concept of perceived enjoyment (PE) adapted from Davis et al.
(1992) means that users feel enjoyable from the instrumental value of using
mobile banking. Prior studies on technology acceptance behaviour examined
the effects of perceived enjoyment on perceived ease of use (Igbaria et al.,
1996; Venkatesh, 2000; Venkatesh et al., 2002; Yiand Hwang, 2003; in
Huang et al., 2006). New technologies that are considered enjoyable are less
likely to be difficult to use. By extending these results to the context of the
mobile banking, we can therefore postulate that perceived enjoyment will
have a positive effect on perceived ease of use.
H2: Perceived enjoyment has a positive effect on perceived ease of use of mobile banking.
There is a causal relationship between perceived enjoyment and
attitudes. When users feel that mobile banking is enjoyable, the stimulus of
happiness in turn enhances their perception of mobile banking. Venkatesh
(2000) found that perceived enjoyment indirectly influences users on
adoption. Another research showed that attitudinal outcomes, such as
happiness, pleasure, and satisfaction, result from the enjoyable experience
(Childers et al., 2001; Moon and Kim, 2001; Van der Heijden, 2003; Yu et
perpustakaan.uns.ac.id digilib.uns.ac.id
commit to user
25
al., 2005; in Huang et al., 2006). These findings indicate that enjoyment
highly correlates with the users’ positive attitudes.
H3: Perceived enjoyment has a positive effect on attitude toward using mobile banking.
3. Perceived Ease of Use, Perceived Usefulness, Attitude, and Behavioural
Intention
Perceived ease of use has been found to influence the usefulness,
attitude intention, and actual use (Chau in Gardner and Amoroso, 2004).
Chau study revealed that perceived ease of use significantly affected
perceived usefulness, but did not significantly affect intention to use. In the
context of the mobile banking, we can postulate positive relationships
between perceived ease of use and two constructs, perceived usefulness of
mobile banking and attitude toward using mobile banking.
H4: Perceived ease of use of the mobile banking has a positive effect on perceived usefulness of mobile banking. H5: Perceived ease of use of the mobile banking has a positive effect on attitude toward using mobile banking.
Perceived usefulness is the degree to which an individual believes that
using a particular system would enhance his or her performance. Usefulness
has been confirmed to be the most important factor affecting user acceptance
with few exceptions (Sun in Gardner and Amoroso, 2004). Hence, perceived
usefulness of mobile banking is likely to be positively related to attitude
toward using mobile banking.
H6: Perceived usefulness of mobile banking has a positive effect on attitude toward using the mobile banking.
perpustakaan.uns.ac.id digilib.uns.ac.id
commit to user
26
In TAM, behavioural intention is influenced by both perceived
usefulness and attitude. This relationship has been examined and supported
by many prior studies (Adams et al., 1992; Davis et al., 1989; Hu et al., 1999;
Venkatesh and Davis, 1996, 2000; in Huang et al., 2006). Therefore, this
study presents the following hypotheses.
H7: Perceived usefulness of mobile banking has a positive effect on behavioural intention toward using the mobile banking. H8: Attitude has a positive effect on behavioural intention toward using the mobile banking.
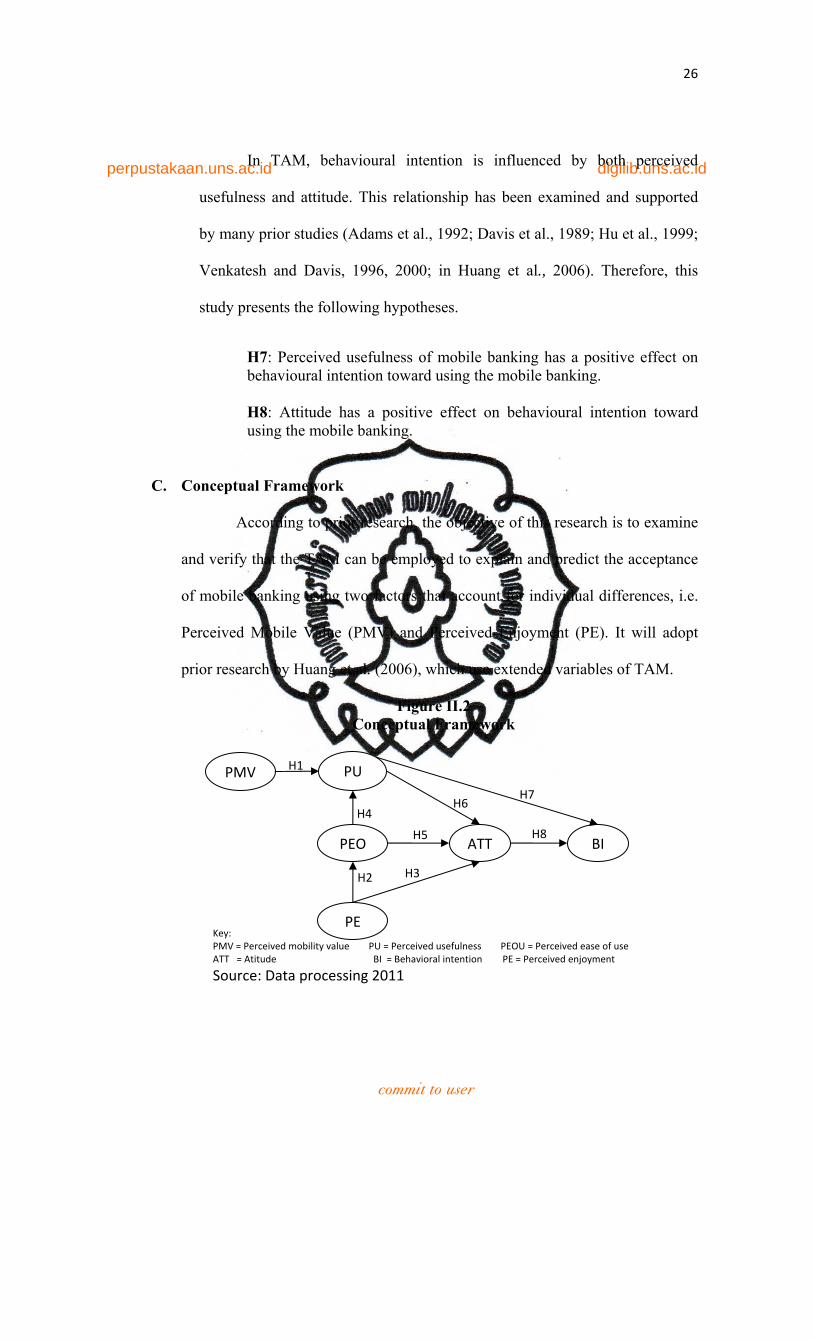
C. Conceptual Framework
According to prior research, the objective of this research is to examine
and verify that the TAM can be employed to explain and predict the acceptance
of mobile banking using two factors that account for individual differences, i.e.
Perceived Mobile Value (PMV) and Perceived Enjoyment (PE). It will adopt
prior research by Huang et al. (2006), which use extended variables of TAM.
Figure II.2 Conceptual Framework
PMV PU
PEO
PE
ATT BI
H1
H2 H3
H4
H5
H6 H7
H8
Key: PMV = Perceived mobility value PU = Perceived usefulness PEOU = Perceived ease of use ATT = Atitude BI = Behavioral intention PE = Perceived enjoyment
Source: Data processing 2011
perpustakaan.uns.ac.id digilib.uns.ac.id
commit to user
27
CHAPTER III
RESEARCH METHODOLOGY
A. Research Design
This research tries to explain an effect of perceived mobile value on
perceived usefulness and perceived enjoyment on attitude towards using mobile
banking and perceived ease of use with TAM model. It uses quantitative research
method with hypothesis test. Sekaran (2000: 108) defines that hypothesis is a
logically conjectured relationship between two or more variables expressed in the
form of a testable statement.
B. Population and Sample
Population in this research is bank customers who use mobile banking
service in Indonesia. The sample is bank customers who use mobile banking
service who stay in Jakarta. Sample size has an important role for SEM
interpretation result. Sample size becomes based on sampling error estimation.
With estimation model using Maximum Likelihood (ML), it requires at least 100
samples. When the sample raises more than 100, the ML sensitivity will increase
to detect differential among data. When sample size become large (400-500
samples), ML will be a very sensitive and will always result in significant
differential so goodness of fit measurement will be poor. Ghozali (2008: 64)
recommends sample size for ML estimation method is 100-200 samples.
perpustakaan.uns.ac.id digilib.uns.ac.id
commit to user
28
C. Data Source and Data Collecting Technique
This research will use primary data, which is directly obtained from the
respondents, with purposive convenience sampling technique. Purposive
convenience sampling is collecting information from members of the population
who are conveniently available to provide it. Each respondent will be asked to
give their evaluation about the statements or questions by choosing answers
served with a Likert scale ranging from 1 for totally disagreeing to 4 for totally
agree.
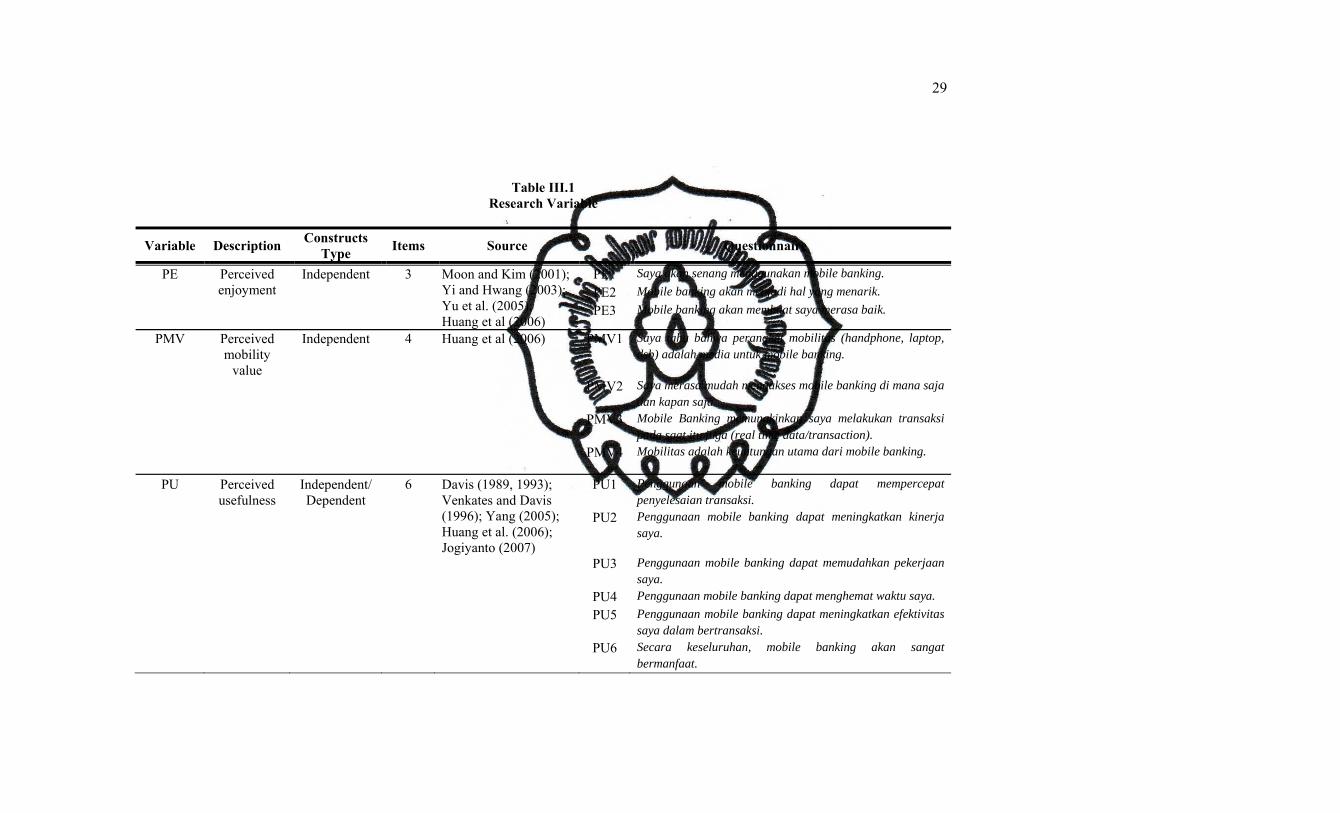
D. Measurement Items
Measurement items used in this research particularly for the core
constructs (six key determinants) of the proposed research model have been
adapted from the measurement items originally used in many theories. All
original measurement items used in measurements of the core constructs of the
theories or models including perceived mobility value, perceived enjoyment,
perceived usefulness, perceived ease of use, attitude toward using, behavioral
intention had statistical explanation and prediction under investigation by
Gardner and Amoroso (2004), Huang et al. (2006), and Jogiyanto (2007). The
measurement item can be seen at table III.1.
perpustakaan.uns.ac.id digilib.uns.ac.id
commit to user
29
Table III.1 Research Variable
Variable Description Constructs Type Items Source Questionnaire
PE Perceived enjoyment
Independent 3 Moon and Kim (2001); Yi and Hwang (2003); Yu et al. (2005); Huang et al (2006)
PE1 Saya akan senang menggunakan mobile banking. PE2
Mobile banking akan menjadi hal yang menarik. PE3 Mobile banking akan membuat saya merasa baik.
PMV Perceived mobility
value
Independent 4 Huang et al (2006) PMV1 Saya tahu bahwa perangkat mobilitas (handphone, laptop, dsb) adalah media untuk mobile banking.
PMV2 Saya merasa mudah mengakses mobile banking di mana saja dan kapan saja.
PMV3 Mobile Banking memungkinkan saya melakukan transaksi pada saat itu juga (real time data/transaction).
PMV4 Mobilitas adalah keuntungan utama dari mobile banking.
PU Perceived usefulness
Independent/ Dependent
6 Davis (1989, 1993); Venkates and Davis (1996); Yang (2005); Huang et al. (2006); Jogiyanto (2007)
PU1 Penggunaan mobile banking dapat mempercepat penyelesaian transaksi.
PU2 Penggunaan mobile banking dapat meningkatkan kinerja saya.
PU3 Penggunaan mobile banking dapat memudahkan pekerjaan saya.
PU4 Penggunaan mobile banking dapat menghemat waktu saya. PU5 Penggunaan mobile banking dapat meningkatkan efektivitas
saya dalam bertransaksi. PU6 Secara keseluruhan, mobile banking akan sangat
bermanfaat.
perpustakaan.uns.ac.id digilib.uns.ac.id
commit to user
30
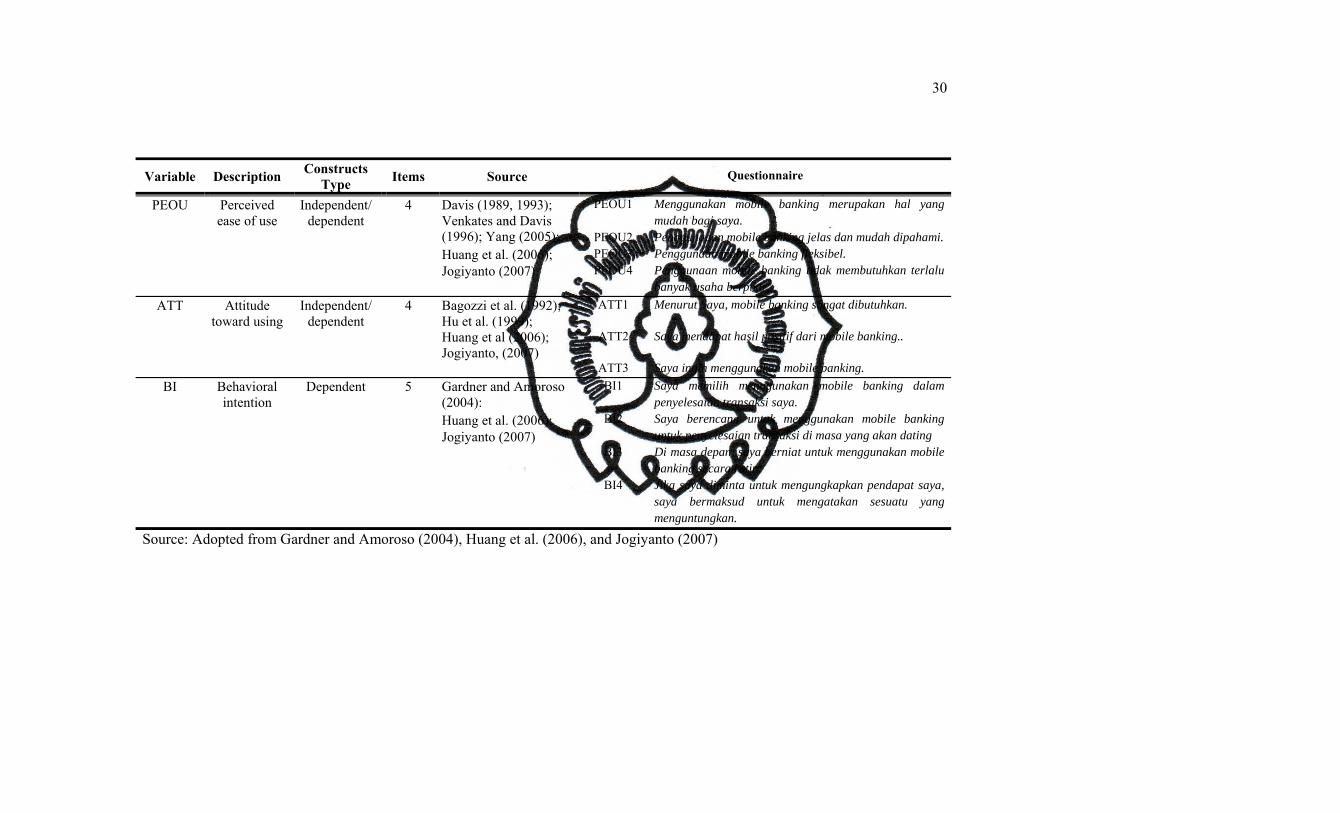
Source: Adopted from Gardner and Amoroso (2004), Huang et al. (2006), and Jogiyanto (2007)
Variable Description Constructs Type Items Source Questionnaire
PEOU Perceived ease of use
Independent/ dependent
4 Davis (1989, 1993); Venkates and Davis (1996); Yang (2005);
PEOU1 Menggunakan mobile banking merupakan hal yang mudah bagi saya.
PEOU2 Penggunaaan mobile banking jelas dan mudah dipahami. Huang et al. (2006); PEOU3 Penggunaan mobile banking fleksibel. Jogiyanto (2007) PEOU4 Penggunaan mobile banking tidak membutuhkan terlalu
banyak usaha berpikir. ATT Attitude
toward using Independent/
dependent 4 Bagozzi et al. (1992);
Hu et al. (1999); Huang et al (2006); Jogiyanto, (2007)
ATT1 Menurut Saya, mobile banking sangat dibutuhkan.
ATT2 Saya mendapat hasil positif dari mobile banking..
ATT3 Saya ingin menggunakan mobile banking. BI Behavioral
intention Dependent 5 Gardner and Amoroso
(2004): BI1 Saya memilih menggunakan mobile banking dalam
penyelesaian transaksi saya. Huang et al. (2006); BI2 Saya berencana untuk menggunakan mobile banking
untuk penyelesaian transaksi di masa yang akan dating Jogiyanto (2007) BI3 Di masa depan, saya berniat untuk menggunakan mobile
banking secara rutin. BI4 Jika saya diminta untuk mengungkapkan pendapat saya,
saya bermaksud untuk mengatakan sesuatu yang menguntungkan.
perpustakaan.uns.ac.id digilib.uns.ac.id
commit to user
E. Data Analyze Technique and Hypotheses Test
1. Data Test Technique
a. Validity test
Validity is the extent to which the data collected truly reflect the
phenomenon being studied. For the sake of the clarity, Sekaran (2000)
can group validity test under three broad headings: content validity,
criterion-related validity, and construct validity. This research use
construct validity test because this approach is more objectives, simple
and it use in many research.
Construct validity testifies to how well the results obtained from
the use of the measure fit the theories around which the test is designed
(Sekaran, 2000: 208). Any biases could also be detected if the
respondents had tended to respond similarly to all items or stuck to only
certain points on the scale (Sekaran, 2000: 208). To test whether latent
constructs are unidimensional or indicators measurement constructs are
valid. First, we must see whether indicators are statistically significant or
not. Second, we must see convergent validity value or loading factor
value for each indicator. Some established research use 0,70 for good
validity value. While convergent validity 0,50-0,60 still acceptable for
earlier research (Ghozali, 2008: 132).
b. Reliability Test
The reliability of a measure indicates the extent to which the
measure is without bias (error free) and hence offers consistent
perpustakaan.uns.ac.id digilib.uns.ac.id
commit to user
32
measurement across time and across the various items in the instrument
(Sekaran, 2000: 204). According to Ticehurst and Veal (2000) in
Kripanont (2007: 128), reliability is the extent to which research findings
would be the same if the research were to be repeated at a later date, or
with a different sample of subjects. A construct or variable is said reliable,
if the Cronbach’s alpha value is >0,70 (Ghozali, 2008: 137). According to
Sekaran (2006) in Bhilawa (2010: 33), reliability less than 0.6 is
considered to be poor, those in the 0.7 is acceptable, and those over 0.8 is
good. The closer the reliability coefficient gets to 1.0 is the better.
c. Normality Data Assumption
SEM requires normal distribution of data. If data distributes
abnormal, maybe it will influence data analysis resulting to high bias
data. In this research, normality test is counted by using computerized
program, AMOS 18. The postulate used in this research to examine data
normality is the critical ratio (cr) value. The data distribution is normal if
cr skewness value or kurtosis cr value is between -2,58 and +2,58
(Wijaya, 2009: 134). Curran et al. in Bhilawa (2010: 34) divides
normality data level into three parts, they are:
• normal, if z statistic value (critical ratio or c.r.) skewness < 2 and
c.r. kurtosis value is < 7,
• moderately non-normal, if c.r skewness is between 2 to 3 and c.r
kurtosis value is between 7 to 21,
perpustakaan.uns.ac.id digilib.uns.ac.id
commit to user
33
• extremely non-normal, if c.r. skewness is >3 and c.r. kurtosis is>
21.
d. Outlier Evaluation
Outlier is the observation that appears with extremely values,
which have a unique different characteristic from other observation, and
it appears on extreme value, whether it on one variable or combination
variables (Hair et al. in Bhilawa, 2010: 33). Outlier can be handled with
erasing one or some data which far from the certain spot center.
Test to multivariate outliers is done using Mahalanobis Distance
criteria at the level p<0,001. Mahalanobis Distance evaluated using χ2 at
free degree as big as variables sum, which is used in research (Ferdinand
in Bhilawa, 2010: 33). This outlier evaluation is done with computer’s
software, AMOS 18.
2. Model Assumption Test
This research uses Structural Equation Modeling (SEM) multivariate
analyzing to examine hypotheses using AMOS 18 software. SEM is a
statistical model that provides approximate calculation of the strength of the
hypothesis on the relationship between variables in a theoretical model, either
directly or through intervening variables (Maruyama in Wijaya, 2009: 1).
SEM refers to the relationship between endogenous variables and exogenous
variables, which is the variable can not be observed or calculated directly
(unobserved variables) or latent variables (Pedhazur in Wijaya, 2009: 2).
perpustakaan.uns.ac.id digilib.uns.ac.id
commit to user
34
AMOS 18 used to examine whether the estimated model has goodness of fit
and has causality relation as hypothesized. The test consists of:
a. Goodness of Fit Measurement
Structural model categorized as “good fit” if it fulfills these conditions
below.
1) Chi-Square (χ2) Measurement Statistic (CMIN)
This analysis is purposing to develop and examine a model
which appropriate with the data. Chi's square is so sensitive to very
small sample as well as to very large sample. Thus, this examination
needs to complete with another examine the instrument (Ghozali,
2008: 130). CMIN shows the likelihood ratio chi-square statistic for
each fitted model (tested against the saturate model). If the p value for
each model is greater than 0.05, this means that the data do not depart
significantly from the model.
Furthermore, if at each step up the hierarchy from the
unconstrained model to the measurement residuals model, the increase
in chi-square is never much larger than the increase in degrees of
freedom (a non-significant chi-square, p value greater than 0.05), the
model up the hierarchy is preferable otherwise, the model up the
hierarchy is worse (a significant chi-square, p value less than 0.05)
(Arbuckle in Kripanont, 2007: 147).
perpustakaan.uns.ac.id digilib.uns.ac.id
commit to user
35
2) Minimum Probability Value Level
P value is the probability of getting as large a discrepancy as
occurred with the present sample under appropriate distributional
assumptions and assuming a correctly specified model. So P is a “p
value” for testing the hypothesis that the model fits perfectly in the
population. Therefore, this is a method to select the model by testing
the hypothesis to eliminate any models that are inconsistent with the
available data (Kripanont, 2007: 192). The minimum probability value
level that needs is 0,1 or 0,2, but for probability level about 0,05 is
still able. (Hair et al. in Bhilawa, 2010: 36).
3) Normed Chi-Square (CMIN/DF)
This index is chi square value divided with degree of freedom.
According to Wheaton et al. (1977), ratio value ≤ 5 is a reasonable
measurement. Other researchers such as Byrne (1988) suggest to this
value ratio < 2 is a fit measurement (Ghozali, 2008: 67). CMIN/DF
(χ2 / df) is the minimum discrepancy divided by its degrees of
freedom; the ratio should be close to 1 for correct models. Although
Arbuckle (2005) claimed that it is not clear how far from 1 we should
let the ratio get before concluding that a model is unsatisfactory. In
contrast, Byrne (2006) suggested that ratio should not exceed 3 before
it cannot be accepted. Since the chi-square statistic (χ2) is sensitive to
sample size it is necessary to look at others that also support goodness
of fit (Kripanont, 2007: 193).
perpustakaan.uns.ac.id digilib.uns.ac.id
commit to user
36
4) Measures Based on the Population Discrepancy
The Root Mean Square of Approximation (RMSEA) indicates
expected goodness of fit if the model estimated in population.
Recommended RMSEA acceptant value is ≤ 0,08 (Wijaya, 2009: 7).
According to Ghozali (2008: 67), RMSEA value between 0,05 to 0,08
is acceptable.
5) Goodness of Fit Index (GFI)
GFI is a goodness- of- fit index for ML (Maximum likelihood)
and ULS (Unweighted Least Squares) estimation (Kripanont, 2007:
193). GFI is used to calculate the weighted proportion of the variance
in the sample covariance matrix described by the covariance matrix in
estimated population (Wijaya, 2009: 8). Recommended acceptant
level by GFI is ≥ 0,90 (Ghozali, 2008: 67).
6) Adjusted Goodness of Fit Index (AGFI)
AGFI is GFI development, adjusted with degree of freedom
that is available to test whether the model accepted. Recommended
value is > 0,90 (Ghozali, 2008: 67). Wijaya (2009: 8) also
recommends AGFI value for at least equals or greater than 0,90.
7) Tucker Lewis Index (TLI)
TLI is an incremental fit index alternative that compares a
tested model against a baseline model (Wijaya, 2009: 8). TLI is a
index fit measure that less influenced by sample size. Recommended
acceptance value by TLI is ≥ 0,90 (Ghozali, 2008: 68).
perpustakaan.uns.ac.id digilib.uns.ac.id
commit to user
37
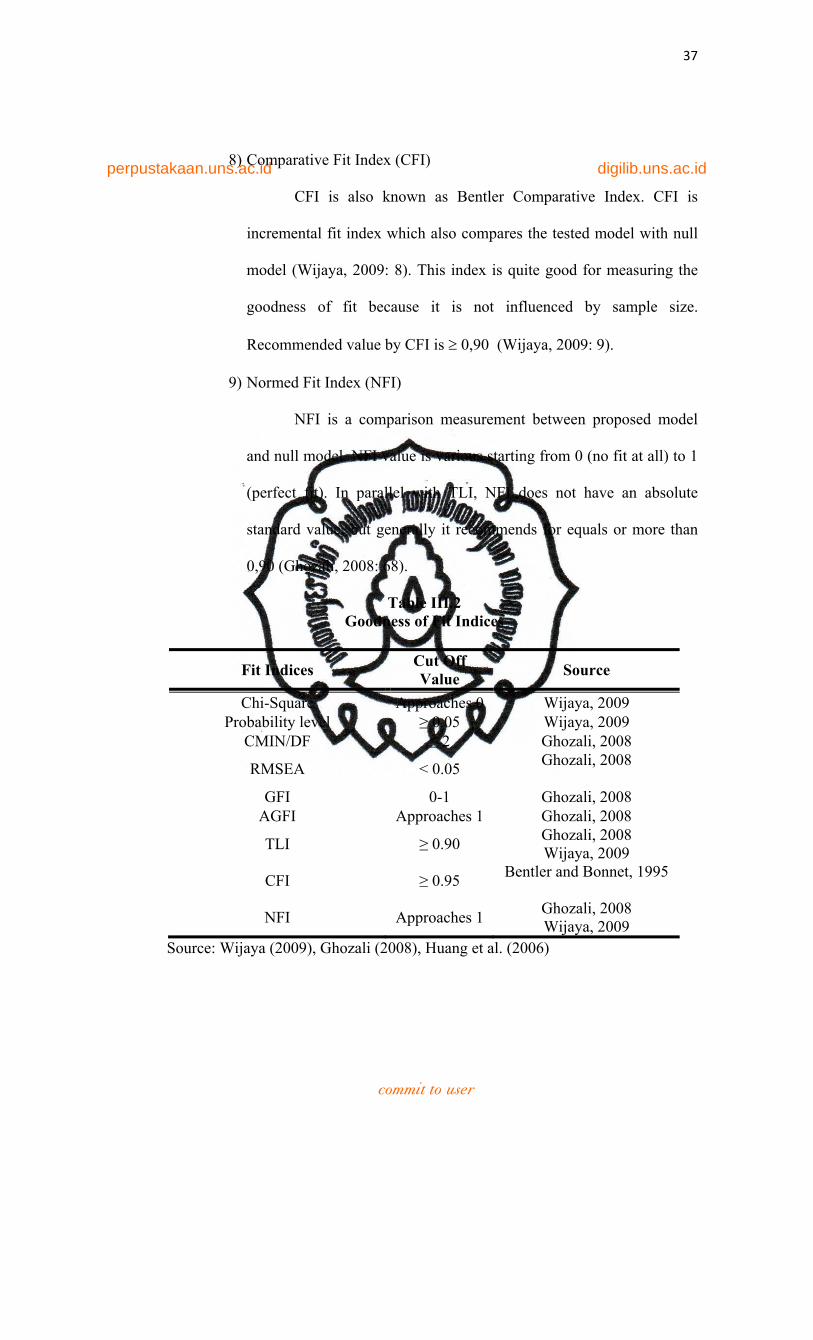
8) Comparative Fit Index (CFI)
CFI is also known as Bentler Comparative Index. CFI is
incremental fit index which also compares the tested model with null
model (Wijaya, 2009: 8). This index is quite good for measuring the
goodness of fit because it is not influenced by sample size.
Recommended value by CFI is ≥ 0,90 (Wijaya, 2009: 9).
9) Normed Fit Index (NFI)
NFI is a comparison measurement between proposed model
and null model. NFI value is various starting from 0 (no fit at all) to 1
(perfect fit). In parallel with TLI, NFI does not have an absolute
standard value, but generally it recommends for equals or more than
0,90 (Ghozali, 2008: 68).
Table III.2 Goodness of Fit Indices
Fit Indices Cut Off Value Source
Chi-Square Approaches 0 Wijaya, 2009 Probability level ≥ 0.05 Wijaya, 2009
CMIN/DF ≤ 2 Ghozali, 2008
RMSEA < 0.05 Ghozali, 2008
GFI 0-1 Ghozali, 2008 AGFI Approaches 1 Ghozali, 2008
TLI ≥ 0.90 Ghozali, 2008 Wijaya, 2009
CFI ≥ 0.95 Bentler and Bonnet, 1995
NFI Approaches 1 Ghozali, 2008 Wijaya, 2009
Source: Wijaya (2009), Ghozali (2008), Huang et al. (2006)
perpustakaan.uns.ac.id digilib.uns.ac.id
commit to user
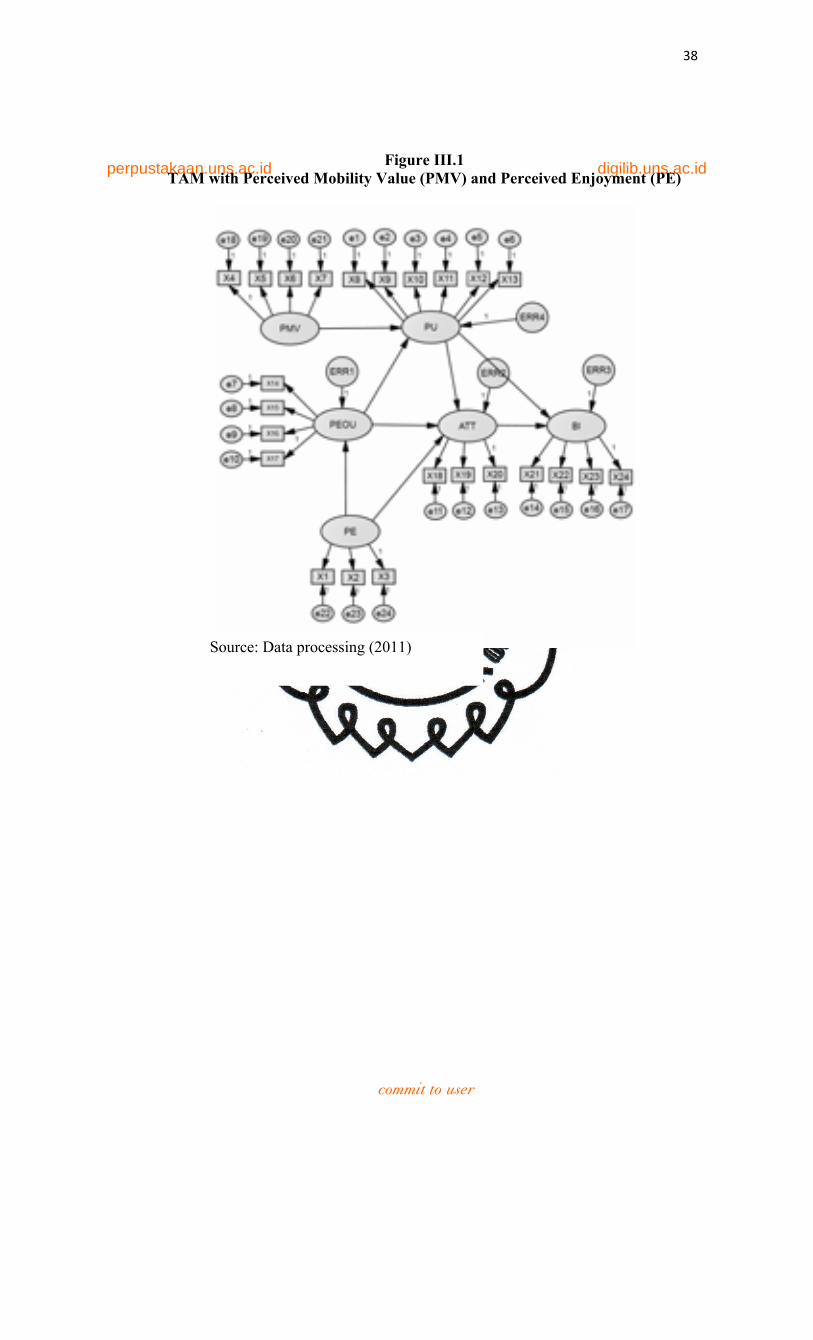
38
Figure III.1 TAM with Perceived Mobility Value (PMV) and Perceived Enjoyment (PE)
3CHAPTER III
Source: Data processing (2011)
perpustakaan.uns.ac.id digilib.uns.ac.id
commit to user
39
CHAPTER IV
DATA ANALYSIS
This chapter will describe the data analysis and research results about mobile
banking acceptance with external variables using perceived mobility value variable
and perceived enjoyment variable with Technology Accepted Model (TAM). It will
be divided into three parts: (1) describing about data research collection and
respondents demographic descriptions, (2) data test analysis, (3) model assumption
analysis, and (4) hypotheses test.
A. Data Collection Analysis
1. Total Data Collection
Data collected from 80 questionnaires were directly distributed to
respondents and 110 questionnaires were distributed by email. Based on the
sample criteria discussed above, this study has obtained 67 respondents by
direct distribution and 65 respondents by email distribution, so 132 samples
total are obtained. From table IV.1 we can see that level of returned
questionnaires is 69.47% from 190 distributed questionnaires which one of
them can not be processed. So, there are 131 questionnaires that can use for
this research test.
perpustakaan.uns.ac.id digilib.uns.ac.id
commit to user
40
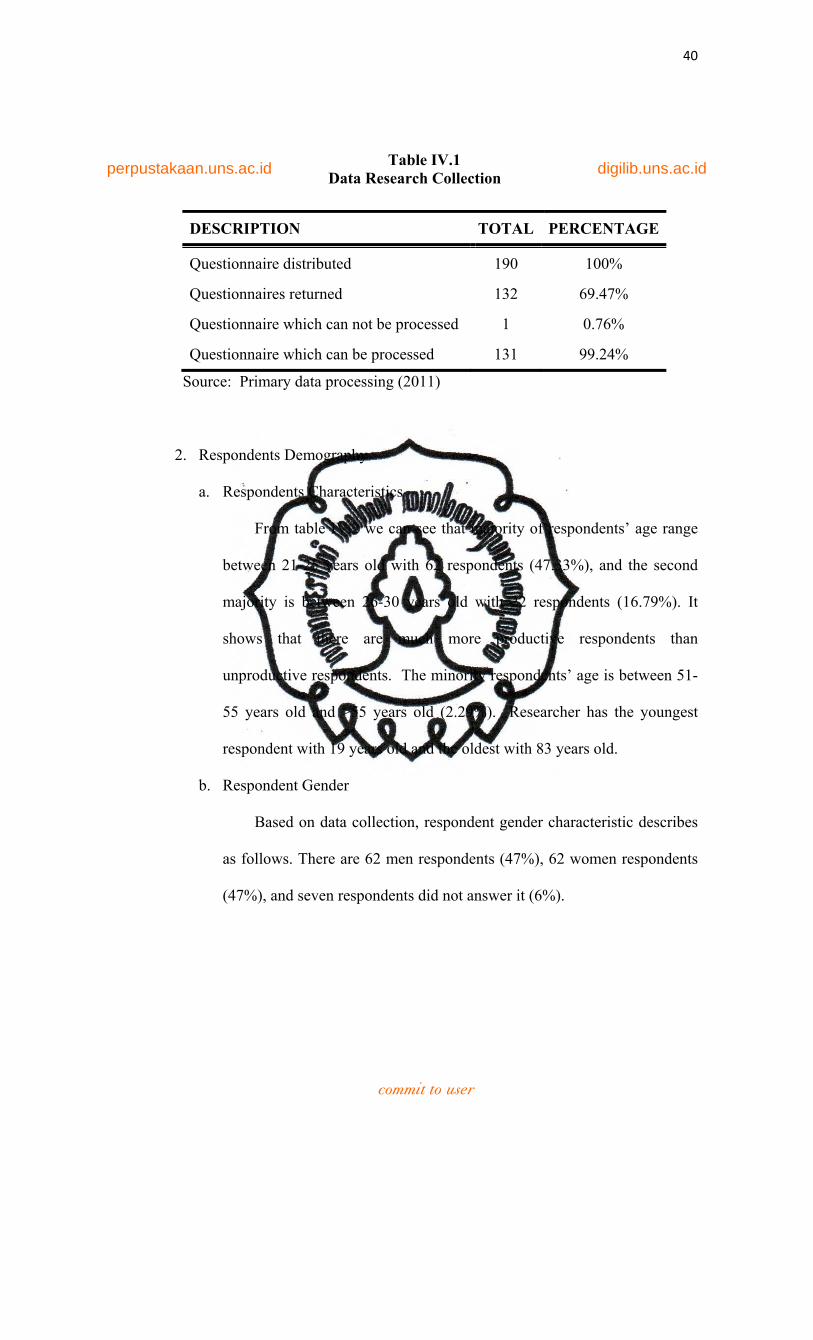
Table IV.1 Data Research Collection
Source: Primary data processing (2011)
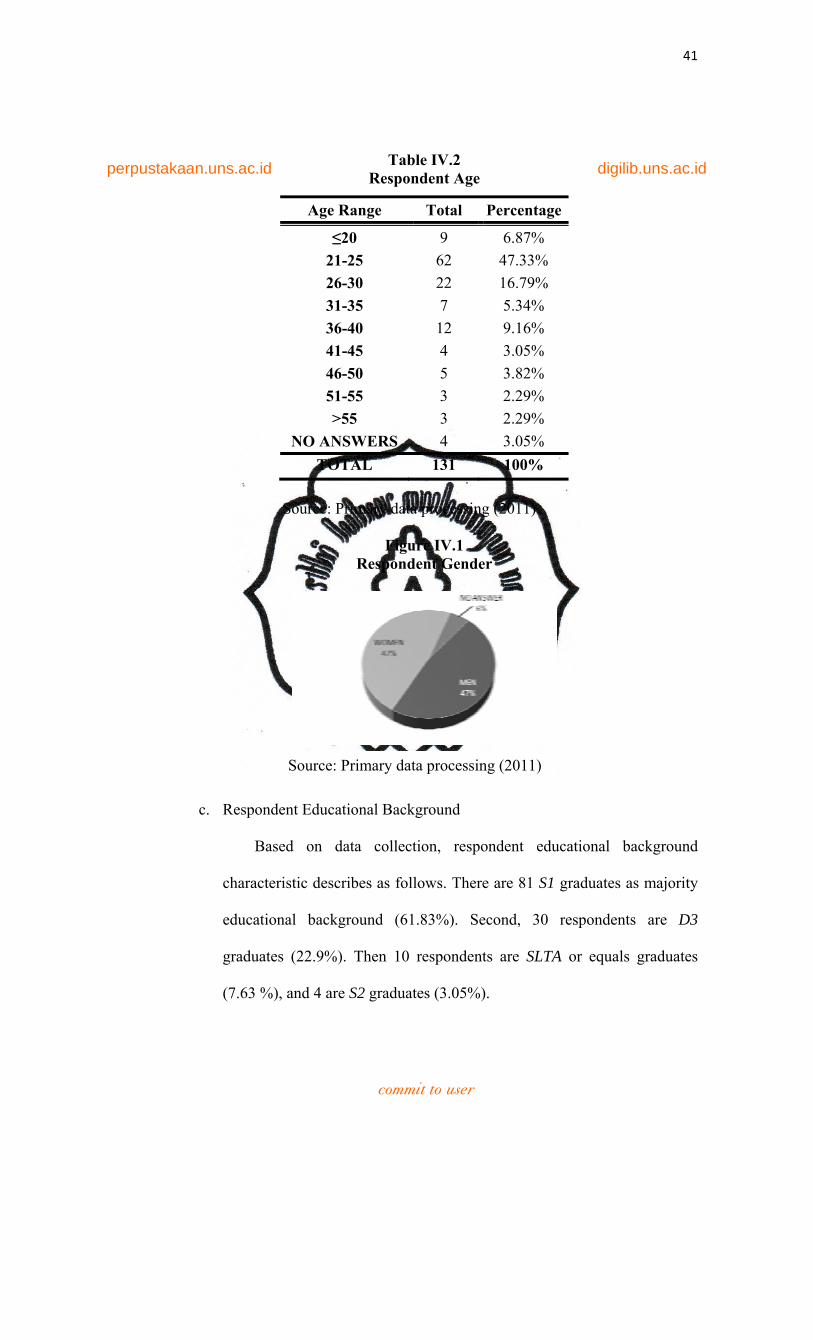
2. Respondents Demography
a. Respondents Characteristics
From table IV.2 we can see that majority of respondents’ age range
between 21-25 years old with 62 respondents (47.33%), and the second
majority is between 26-30 years old with 22 respondents (16.79%). It
shows that there are much more productive respondents than
unproductive respondents. The minority respondents’ age is between 51-
55 years old and >55 years old (2.29%). Researcher has the youngest
respondent with 19 years old and the oldest with 83 years old.
b. Respondent Gender
Based on data collection, respondent gender characteristic describes
as follows. There are 62 men respondents (47%), 62 women respondents
(47%), and seven respondents did not answer it (6%).
DESCRIPTION TOTAL PERCENTAGE
Questionnaire distributed 190 100%
Questionnaires returned 132 69.47%
Questionnaire which can not be processed 1 0.76%
Questionnaire which can be processed 131 99.24%
perpustakaan.uns.ac.id digilib.uns.ac.id
commit to user
41
Table IV.2 Respondent Age
Source: Primary data processing (2011)
Figure IV.1
Respondent Gender
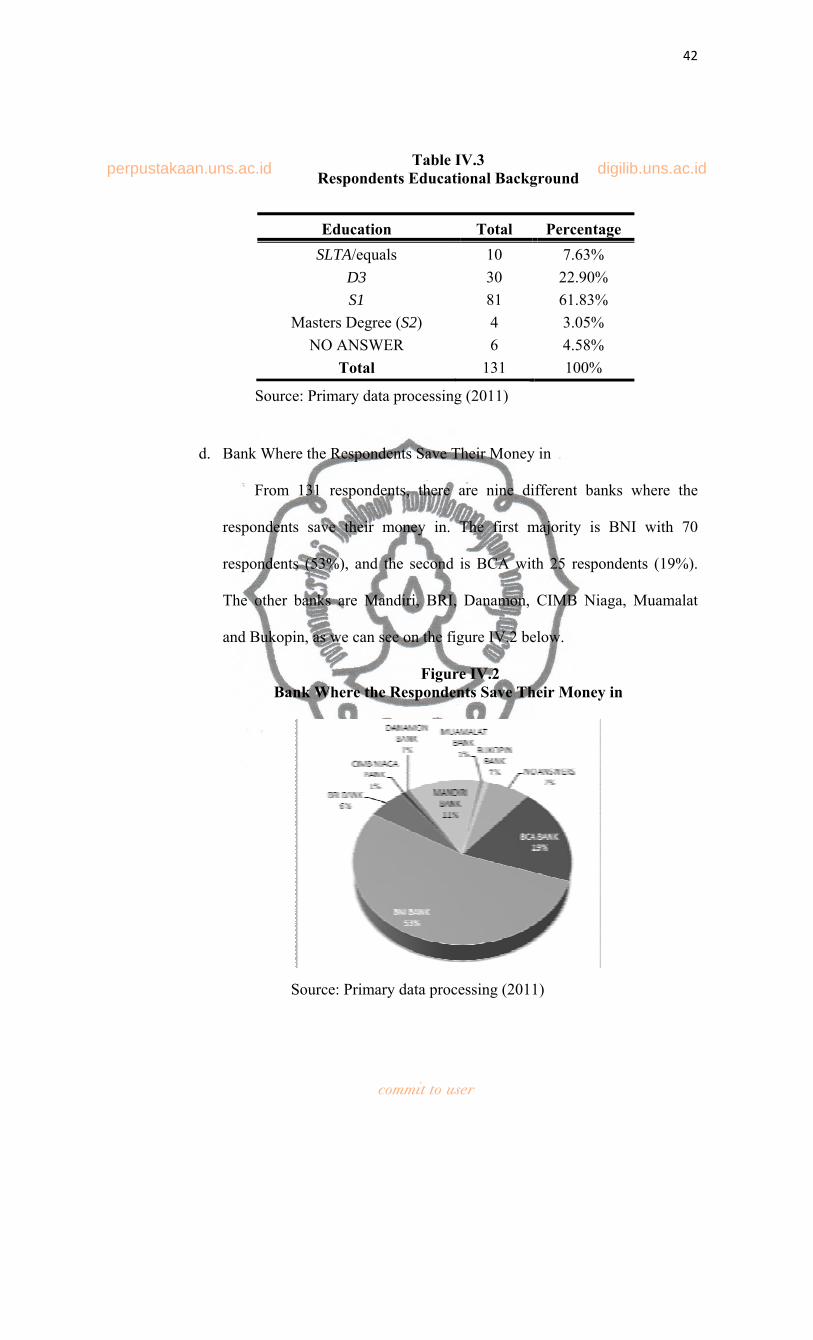
c. Respondent Educational Background
Based on data collection, respondent educational background
characteristic describes as follows. There are 81 S1 graduates as majority
educational background (61.83%). Second, 30 respondents are D3
graduates (22.9%). Then 10 respondents are SLTA or equals graduates
(7.63 %), and 4 are S2 graduates (3.05%).
Age Range Total Percentage
≤20 9 6.87% 21-25 62 47.33% 26-30 22 16.79% 31-35 7 5.34% 36-40 12 9.16% 41-45 4 3.05% 46-50 5 3.82% 51-55 3 2.29% >55 3 2.29%
NO ANSWERS 4 3.05% TOTAL 131 100%
Source: Primary data processing (2011)
perpustakaan.uns.ac.id digilib.uns.ac.id
commit to user
42
Table IV.3 Respondents Educational Background
d. Bank Where the Respondents Save Their Money in
From 131 respondents, there are nine different banks where the
respondents save their money in. The first majority is BNI with 70
respondents (53%), and the second is BCA with 25 respondents (19%).
The other banks are Mandiri, BRI, Danamon, CIMB Niaga, Muamalat
and Bukopin, as we can see on the figure IV.2 below.
Figure IV.2 Bank Where the Respondents Save Their Money in
Education Total Percentage SLTA/equals 10 7.63%
D3 30 22.90% S1 81 61.83%
Masters Degree (S2) 4 3.05% NO ANSWER 6 4.58%
Total 131 100%
Source: Primary data processing (2011)
Source: Primary data processing (2011)
perpustakaan.uns.ac.id digilib.uns.ac.id
commit to user
43
B. Data Test Analysis
1. Normality Test
Normality data can be evaluated with skewness critical ratio value
criteria at -2.58<c.r<2.58 at 0.01 significant level. Data conclude has a
normal distribution if skewness critical ratio value is between the absolute
value of ±2.58. The result of normality data is seen as table IV.4. From the
skewness critical ratio value is seen that all indicators have normal
distribution except for PU5 and PMV1. Analysis to non-normal distributed
data can bias the interpretation because the result of Chi-square value analysis
the lean increases so probability level decreases.
Data that used in this study represents as the real condition which is
obtained from primary data based on the very various answers of the
respondents so it was difficult to get perfect normal data distribution.
According to Hair et al. in Bhilawa (2010: 52) large sample size leans
decreasing the analysis distortion from non-normality data that will be
analyzed. Further more, Maximum Likelihood Estimates (MLE) used in this
study is not too robust to non-normal data, so we can still do the next
analysis.
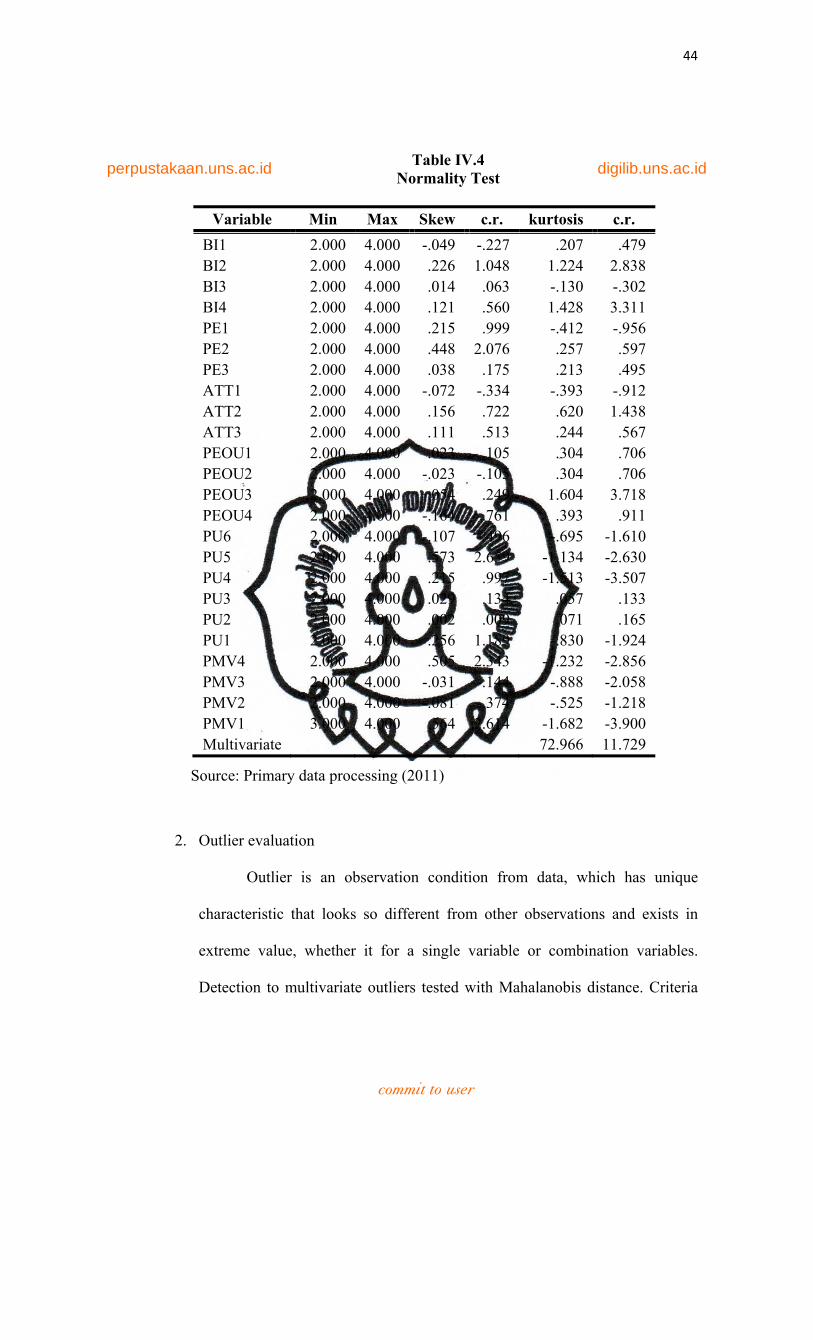
perpustakaan.uns.ac.id digilib.uns.ac.id
commit to user
44
Table IV.4 Normality Test
Variable Min Max Skew c.r. kurtosis c.r.
BI1 2.000 4.000 -.049 -.227 .207 .479 BI2 2.000 4.000 .226 1.048 1.224 2.838 BI3 2.000 4.000 .014 .063 -.130 -.302 BI4 2.000 4.000 .121 .560 1.428 3.311 PE1 2.000 4.000 .215 .999 -.412 -.956 PE2 2.000 4.000 .448 2.076 .257 .597 PE3 2.000 4.000 .038 .175 .213 .495 ATT1 2.000 4.000 -.072 -.334 -.393 -.912 ATT2 2.000 4.000 .156 .722 .620 1.438 ATT3 2.000 4.000 .111 .513 .244 .567 PEOU1 2.000 4.000 .023 .105 .304 .706 PEOU2 2.000 4.000 -.023 -.105 .304 .706 PEOU3 2.000 4.000 .054 .249 1.604 3.718 PEOU4 2.000 4.000 -.164 -.761 .393 .911 PU6 2.000 4.000 -.107 -.496 -.695 -1.610 PU5 2.000 4.000 .573 2.659 -1.134 -2.630 PU4 2.000 4.000 .215 .997 -1.513 -3.507 PU3 2.000 4.000 .029 .134 .057 .133 PU2 2.000 4.000 .002 .009 .071 .165 PU1 2.000 4.000 .256 1.189 -.830 -1.924 PMV4 2.000 4.000 .505 2.343 -1.232 -2.856 PMV3 2.000 4.000 -.031 -.144 -.888 -2.058 PMV2 2.000 4.000 -.081 -.374 -.525 -1.218 PMV1 3.000 4.000 .564 2.614 -1.682 -3.900 Multivariate 72.966 11.729
2. Outlier evaluation
Outlier is an observation condition from data, which has unique
characteristic that looks so different from other observations and exists in
extreme value, whether it for a single variable or combination variables.
Detection to multivariate outliers tested with Mahalanobis distance. Criteria
Source: Primary data processing (2011)
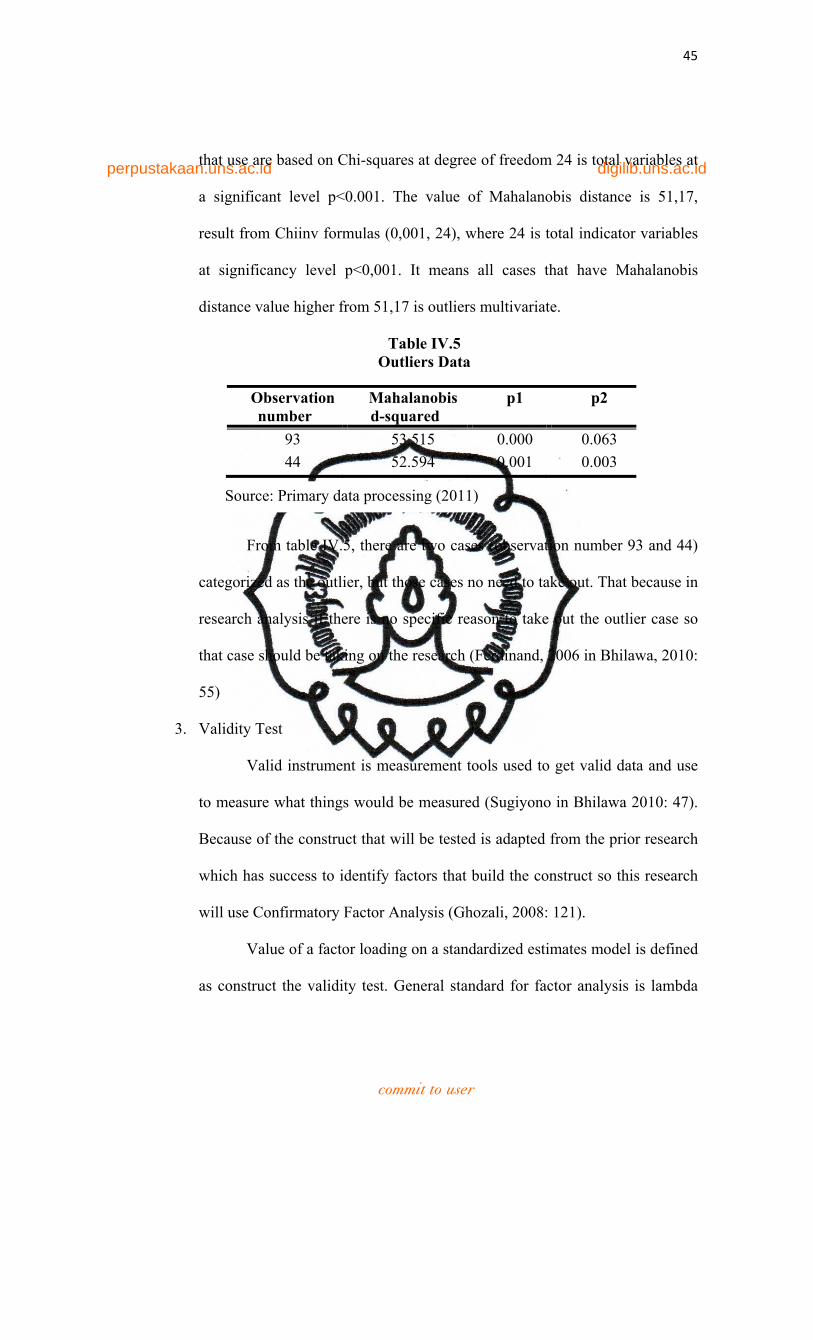
perpustakaan.uns.ac.id digilib.uns.ac.id
commit to user
45
that use are based on Chi-squares at degree of freedom 24 is total variables at
a significant level p<0.001. The value of Mahalanobis distance is 51,17,
result from Chiinv formulas (0,001, 24), where 24 is total indicator variables
at significancy level p<0,001. It means all cases that have Mahalanobis
distance value higher from 51,17 is outliers multivariate.
Table IV.5 Outliers Data
From table IV.5, there are two cases (observation number 93 and 44)
categorized as the outlier, but those cases no need to take out. That because in
research analysis if there is no specific reason to take out the outlier case so
that case should be taking on the research (Ferdinand, 2006 in Bhilawa, 2010:
55)
3. Validity Test
Valid instrument is measurement tools used to get valid data and use
to measure what things would be measured (Sugiyono in Bhilawa 2010: 47).
Because of the construct that will be tested is adapted from the prior research
which has success to identify factors that build the construct so this research
will use Confirmatory Factor Analysis (Ghozali, 2008: 121).
Value of a factor loading on a standardized estimates model is defined
as construct the validity test. General standard for factor analysis is lambda
Observation number
Mahalanobis d-squared
p1 p2
93 53.515 0.000 0.063 44 52.594 0.001 0.003
Source: Primary data processing (2011)
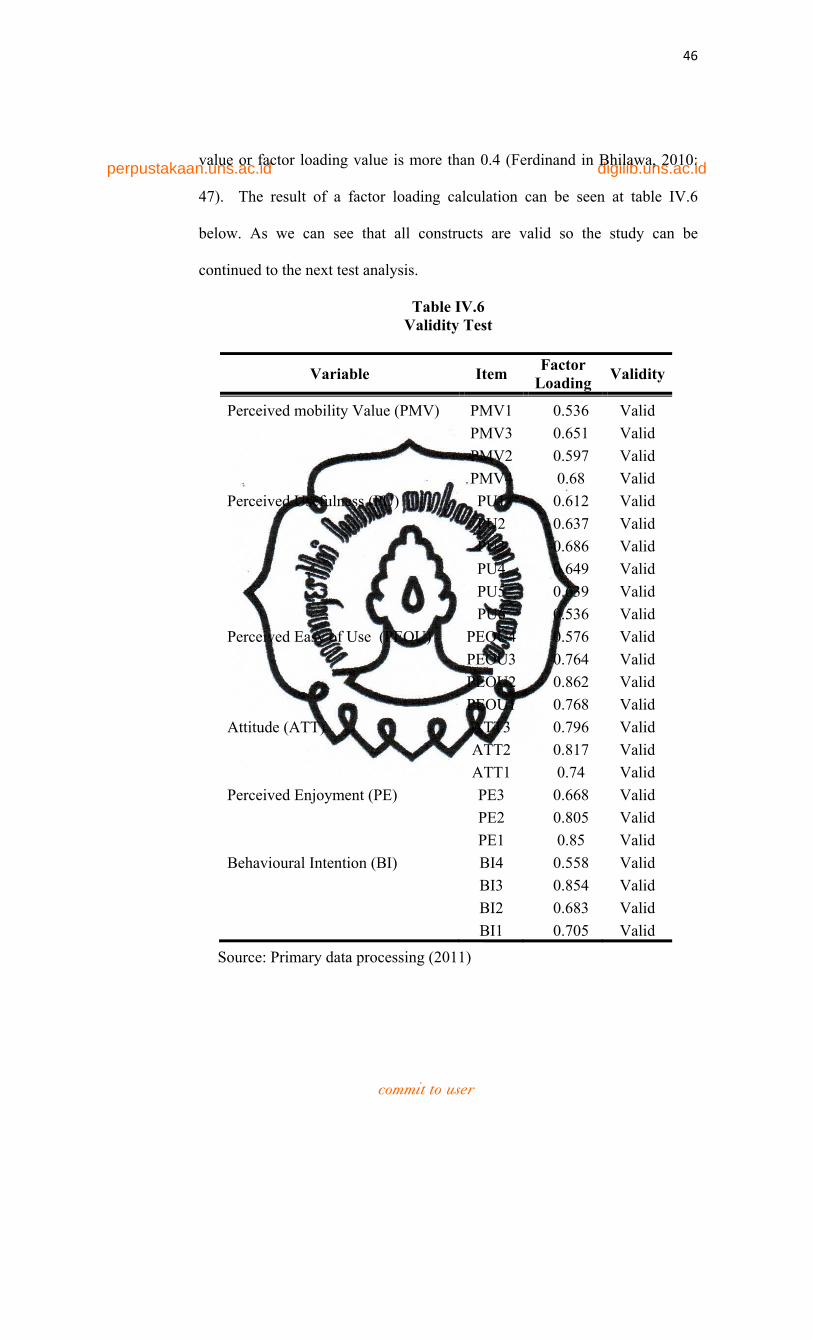
perpustakaan.uns.ac.id digilib.uns.ac.id
commit to user
46
value or factor loading value is more than 0.4 (Ferdinand in Bhilawa, 2010:
47). The result of a factor loading calculation can be seen at table IV.6
below. As we can see that all constructs are valid so the study can be
continued to the next test analysis.
Table IV.6 Validity Test
Variable Item Factor Loading Validity
Perceived mobility Value (PMV) PMV1 0.536 Valid PMV3 0.651 Valid PMV2 0.597 Valid PMV4 0.68 Valid Perceived Usefulness (PU) PU1 0.612 Valid PU2 0.637 Valid PU3 0.686 Valid PU4 0.649 Valid PU5 0.639 Valid PU6 0.536 Valid Perceived Easy of Use (PEOU) PEOU4 0.576 Valid PEOU3 0.764 Valid PEOU2 0.862 Valid PEOU1 0.768 Valid Attitude (ATT) ATT3 0.796 Valid ATT2 0.817 Valid ATT1 0.74 Valid Perceived Enjoyment (PE) PE3 0.668 Valid PE2 0.805 Valid PE1 0.85 Valid Behavioural Intention (BI) BI4 0.558 Valid BI3 0.854 Valid BI2 0.683 Valid BI1 0.705 Valid
Source: Primary data processing (2011)
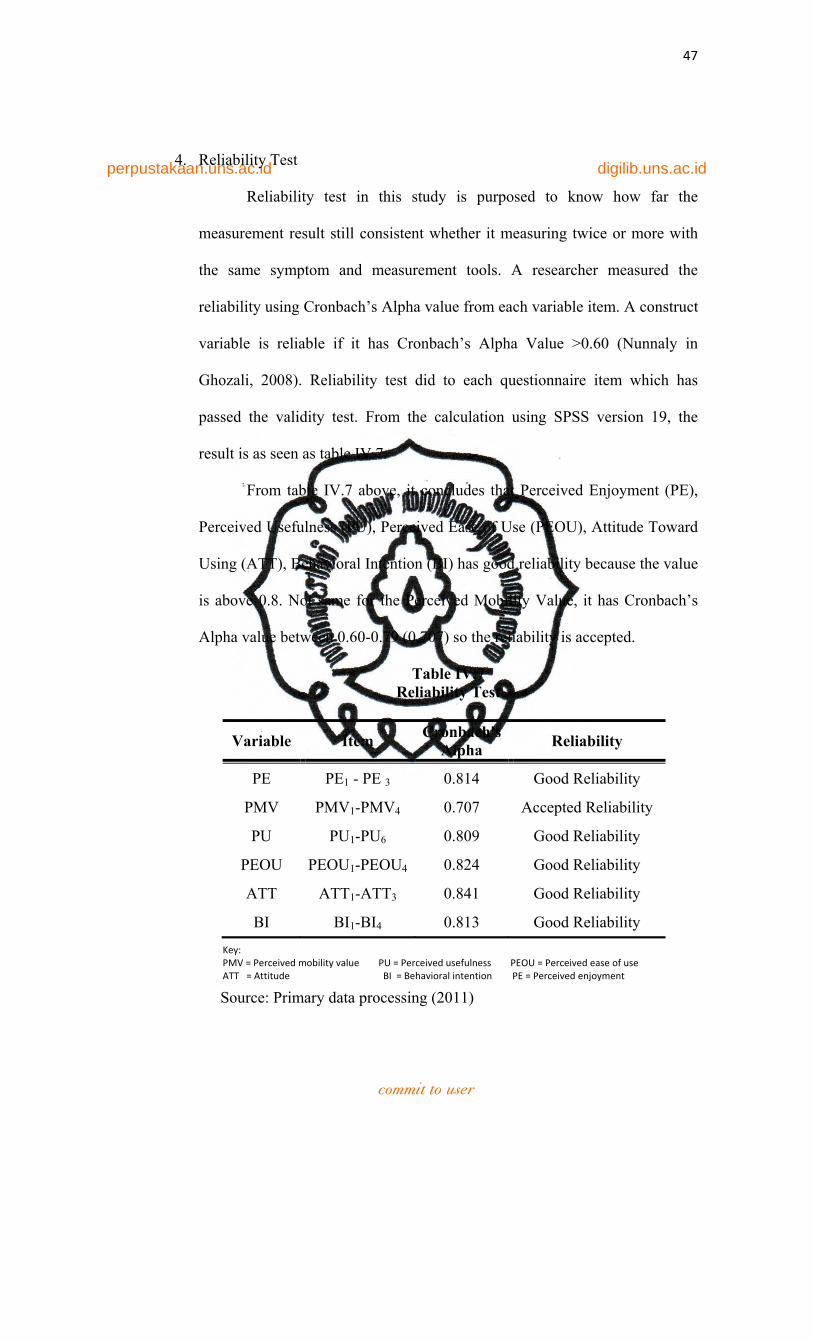
perpustakaan.uns.ac.id digilib.uns.ac.id
commit to user
47
4. Reliability Test
Reliability test in this study is purposed to know how far the
measurement result still consistent whether it measuring twice or more with
the same symptom and measurement tools. A researcher measured the
reliability using Cronbach’s Alpha value from each variable item. A construct
variable is reliable if it has Cronbach’s Alpha Value >0.60 (Nunnaly in
Ghozali, 2008). Reliability test did to each questionnaire item which has
passed the validity test. From the calculation using SPSS version 19, the
result is as seen as table IV.7.
From table IV.7 above, it concludes that Perceived Enjoyment (PE),
Perceived Usefulness (PU), Perceived Ease of Use (PEOU), Attitude Toward
Using (ATT), Behavioral Intention (BI) has good reliability because the value
is above 0.8. Not same for the Perceived Mobility Value, it has Cronbach’s
Alpha value between 0.60-0.79 (0.707) so the reliability is accepted.
Table IV.7 Reliability Test
Variable Item Cronbach's Alpha Reliability
PE PE1 - PE 3 0.814 Good Reliability
PMV PMV1-PMV4 0.707 Accepted Reliability
PU PU1-PU6 0.809 Good Reliability
PEOU PEOU1-PEOU4 0.824 Good Reliability
ATT ATT1-ATT3 0.841 Good Reliability
BI BI1-BI4 0.813 Good Reliability
Key: PMV = Perceived mobility value PU = Perceived usefulness PEOU = Perceived ease of use ATT = Attitude BI = Behavioral intention PE = Perceived enjoyment Source: Primary data processing (2011)
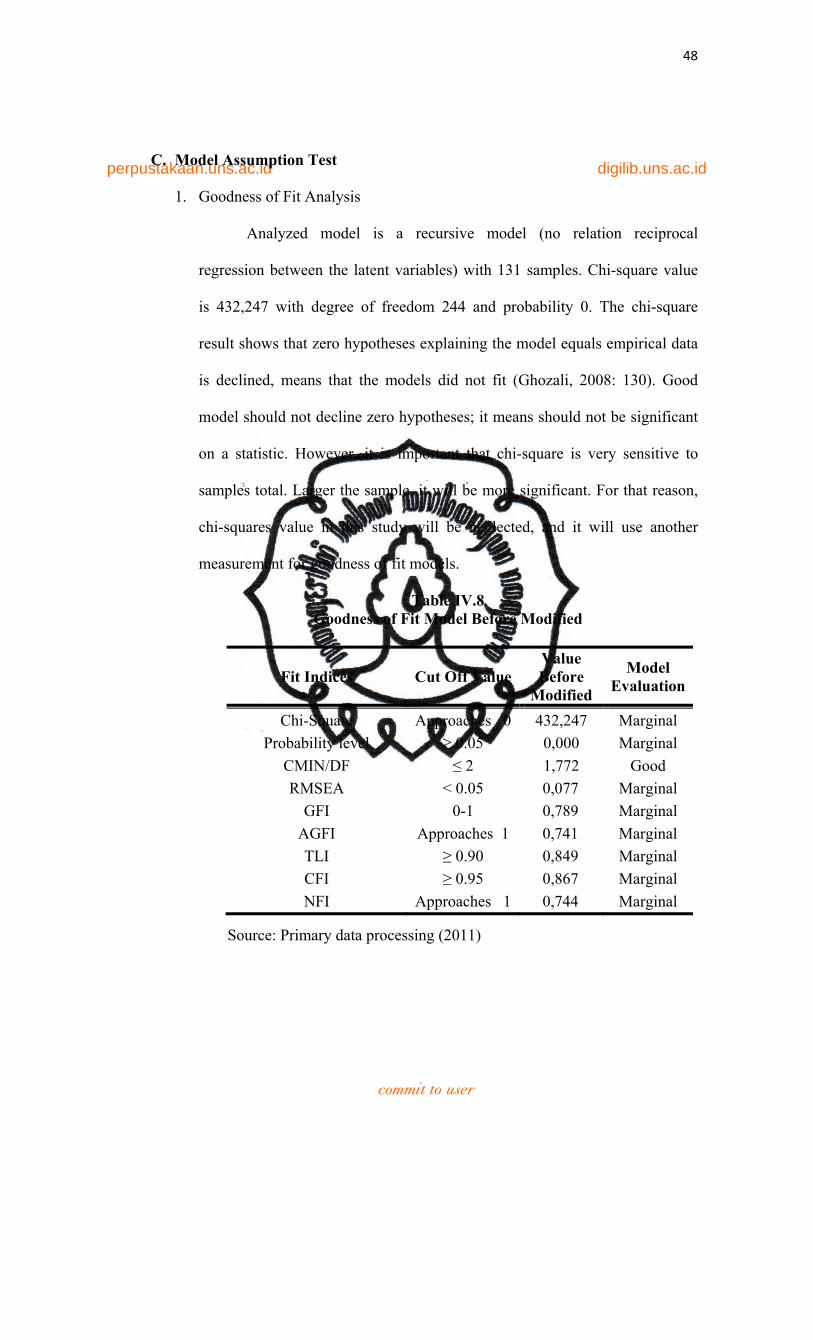
perpustakaan.uns.ac.id digilib.uns.ac.id
commit to user
48
C. Model Assumption Test
1. Goodness of Fit Analysis
Analyzed model is a recursive model (no relation reciprocal
regression between the latent variables) with 131 samples. Chi-square value
is 432,247 with degree of freedom 244 and probability 0. The chi-square
result shows that zero hypotheses explaining the model equals empirical data
is declined, means that the models did not fit (Ghozali, 2008: 130). Good
model should not decline zero hypotheses; it means should not be significant
on a statistic. However, it is important that chi-square is very sensitive to
samples total. Larger the sample, it will be more significant. For that reason,
chi-squares value in this study will be neglected, and it will use another
measurement for goodness of fit models.
Table IV.8 Goodness of Fit Model Before Modified
Fit Indices Cut Off Value Value Before
Modified
Model Evaluation
Chi-Square Approaches 0 432,247 Marginal Probability level ≥ 0.05 0,000 Marginal
CMIN/DF ≤ 2 1,772 Good RMSEA < 0.05 0,077 Marginal
GFI 0-1 0,789 Marginal AGFI Approaches 1 0,741 Marginal TLI ≥ 0.90 0,849 Marginal CFI ≥ 0.95 0,867 Marginal NFI Approaches 1 0,744 Marginal
Source: Primary data processing (2011)
perpustakaan.uns.ac.id digilib.uns.ac.id
commit to user
49
Cut off value for CMIN/DF is equal or less than two. This model
shows the CMIN/DF is 1.772, means it has good value for the model. GFI
with 0,789, RMSEA with 0,077, AGFI with 0,741, TLI with 0.849, CFI with
0.867, NFI with 0,744. All of goodness of fit measurements above show
marginal result because it less than the settled cut off, means that the model is
not acceptable. Because the model is a not acceptable yet, researcher
considered to modify the model developing model modification so it will
have better goodness of fit.
2. Model Modification
Modified model did to get acceptable goodness of a fit model and also
get the new correlation that has a strong theory based, because SEM objective
is to test model that have a correct based theory and not to resulting theory
(Ferdinand in Bhilawa, 2010: 56). Overall unfit model, theoretically, may
because of good theory concept in model development and did not proper to
empirical research, for example, foreign model research did in the domestic
region without considering the condition that may different (Wijaya, 2009:
91). Further more, unfit model also may be caused of poor indicator variable.
Unfit model is allowed to modify as recommended by AMOS program. With
modification indices in covariance test, we will know which items that can be
modified. There are 14 error terms that can be modified. The result of
goodness of fit value after modified can be seen at table IV.9.
From table IV.10 we can see that chi-square level decrease from
432,247 to 230. However, in this research chi-square level will be ignored.
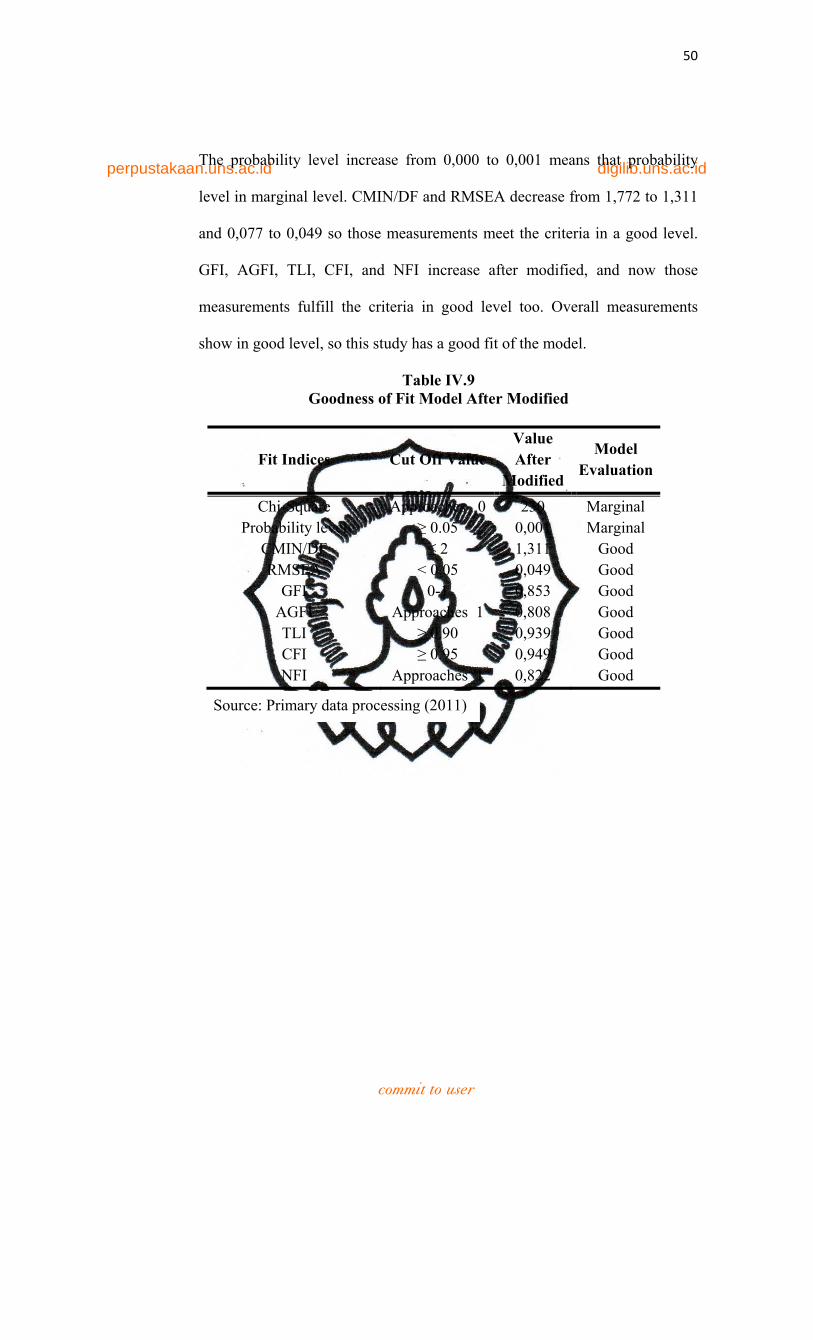
perpustakaan.uns.ac.id digilib.uns.ac.id
commit to user
50
The probability level increase from 0,000 to 0,001 means that probability
level in marginal level. CMIN/DF and RMSEA decrease from 1,772 to 1,311
and 0,077 to 0,049 so those measurements meet the criteria in a good level.
GFI, AGFI, TLI, CFI, and NFI increase after modified, and now those
measurements fulfill the criteria in good level too. Overall measurements
show in good level, so this study has a good fit of the model.
Table IV.9 Goodness of Fit Model After Modified
Fit Indices Cut Off Value Value After
Modified
Model Evaluation
Chi-Square Approaches 0 230 Marginal Probability level ≥ 0.05 0,001 Marginal
CMIN/DF ≤ 2 1,311 Good RMSEA < 0.05 0,049 Good
GFI 0-1 0,853 Good AGFI Approaches 1 0,808 Good TLI ≥ 0.90 0,939 Good CFI ≥ 0.95 0,949 Good NFI Approaches 1 0,822 Good
Source: Primary data processing (2011)
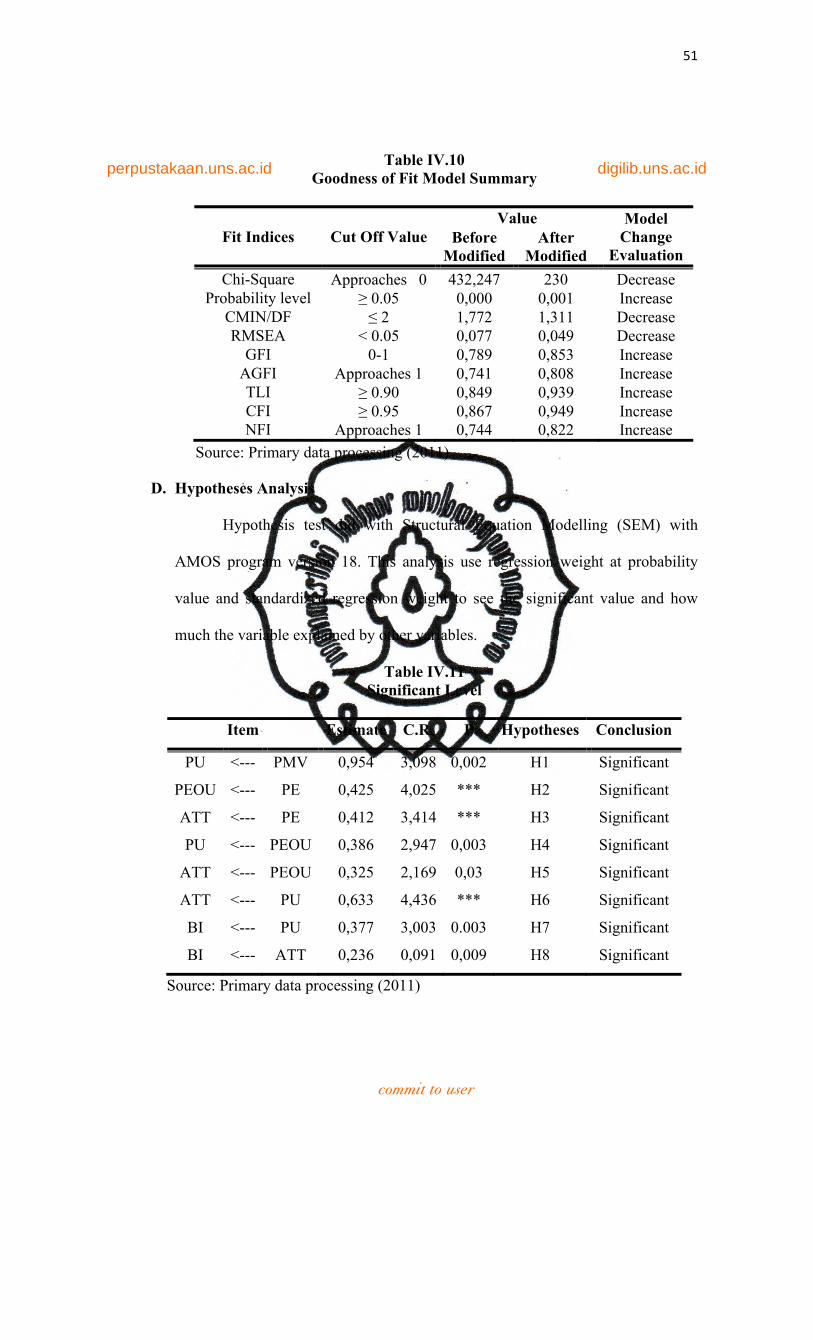
perpustakaan.uns.ac.id digilib.uns.ac.id
commit to user
51
Table IV.10 Goodness of Fit Model Summary
Fit Indices Cut Off Value Value Model
Change Evaluation
Before Modified
After Modified
Chi-Square Approaches 0 432,247 230 Decrease Probability level ≥ 0.05 0,000 0,001 Increase
CMIN/DF ≤ 2 1,772 1,311 Decrease RMSEA < 0.05 0,077 0,049 Decrease
GFI 0-1 0,789 0,853 Increase AGFI Approaches 1 0,741 0,808 Increase TLI ≥ 0.90 0,849 0,939 Increase CFI ≥ 0.95 0,867 0,949 Increase NFI Approaches 1 0,744 0,822 Increase
D. Hypotheses Analysis
Hypothesis test did with Structural Equation Modelling (SEM) with
AMOS program version 18. This analysis use regression weight at probability
value and standardized regression weight to see the significant value and how
much the variable explained by other variables.
Table IV.11 Significant Level
Item Estimate C.R. P Hypotheses Conclusion
PU <--- PMV 0,954 3,098 0,002 H1 Significant
PEOU <--- PE 0,425 4,025 *** H2 Significant
ATT <--- PE 0,412 3,414 *** H3 Significant
PU <--- PEOU 0,386 2,947 0,003 H4 Significant
ATT <--- PEOU 0,325 2,169 0,03 H5 Significant
ATT <--- PU 0,633 4,436 *** H6 Significant
BI <--- PU 0,377 3,003 0.003 H7 Significant
BI <--- ATT 0,236 0,091 0,009 H8 Significant
Source: Primary data processing (2011)
Source: Primary data processing (2011)
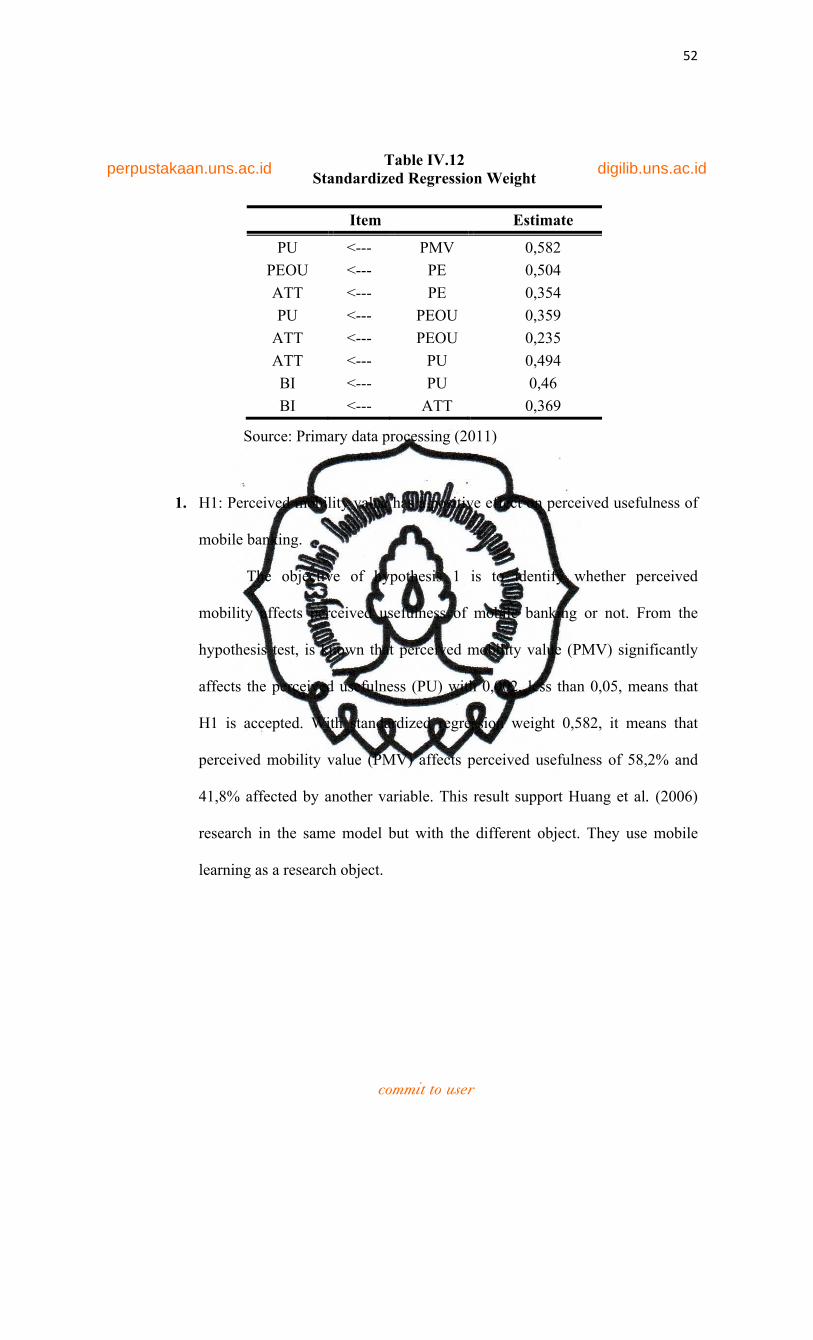
perpustakaan.uns.ac.id digilib.uns.ac.id
commit to user
52
Table IV.12 Standardized Regression Weight
Item Estimate
PU <--- PMV 0,582 PEOU <--- PE 0,504 ATT <--- PE 0,354 PU <--- PEOU 0,359
ATT <--- PEOU 0,235 ATT <--- PU 0,494 BI <--- PU 0,46 BI <--- ATT 0,369
1. H1: Perceived mobility value has a positive effect on perceived usefulness of
mobile banking.
The objective of hypothesis 1 is to identify whether perceived
mobility affects perceived usefulness of mobile banking or not. From the
hypothesis test, is known that perceived mobility value (PMV) significantly
affects the perceived usefulness (PU) with 0,002, less than 0,05, means that
H1 is accepted. With standardized regression weight 0,582, it means that
perceived mobility value (PMV) affects perceived usefulness of 58,2% and
41,8% affected by another variable. This result support Huang et al. (2006)
research in the same model but with the different object. They use mobile
learning as a research object.
Source: Primary data processing (2011)
perpustakaan.uns.ac.id digilib.uns.ac.id
commit to user
53
2. H2: Perceived enjoyment has a positive effect on perceived ease of use
mobile banking.
The objective of hypothesis 2 is to identify whether perceived
enjoyment affects perceived ease of use of mobile banking or not. The result
also shows that Perceived Enjoyment (PE) significantly affects Perceived
Ease of Use (PEOU) with probability value less than 0,05, H2 is accepted. PE
affecting PEOU at 50,4% and 49,6% explained by another variable. It also
supports the Huang et al. (2006) research that perceived enjoyment affects
perceived ease of use at 0,001 significant level, but it affects just 29%. It also
supports Sun and Zhang (2006) research about the relationship between PE
and PEOU. Their research proves that direction PE PEOU is significantly
better than the reverse direction. It also support Pikkarainen et al. (2004),
Ramayah and Ignatius ( _____ ), Selamat et al. (2009) research that perceived
enjoyment have some effect on technology acceptance.
3. H3: Perceived enjoyment has a positive effect on attitude toward using
mobile banking
The objective of hypothesis 3 is to identify whether Perceived
Enjoyment (PE) affects attitude toward using mobile banking or not. It has
*** probability value which means it less than 0,05. This hypothesis also
accepted. With 35,4% PE significantly affects attitude toward using mobile
banking at 0,001 significant level, and 64,6% affected by another variable. It
also supports Huang et al. (2006) research with 31% affection at 0,001
significant level.
perpustakaan.uns.ac.id digilib.uns.ac.id
commit to user
54
4. H4: Perceived ease of use of the mobile banking has positive effect on
perceived usefulness of mobile banking
The objective of hypothesis 4 is to identify whether Perceived Ease of
Use (PEOU) affects Perceived Usefulness (PU) of mobile banking or not.
With probability value 0,003, less than 0,05, this hypothesis is accepted.
PEOU 35,9% affects PU and 64,1% affected by another variables. It supports
the result of Chau (1996), Gardner and Amoroso (2004), and also Huang et
al. (2006).
5. H5: Perceived ease of use of the mobile banking has positive effect on
attitude toward using mobile banking.
The objective of hypothesis 5 is to identify whether Perceived Ease of
Use (PEOU) affects attitude toward using mobile banking (ATT) of mobile
banking or not. PEOU significantly affects ATT at probability level 0,03, less
than 0,05, so H5 is accepted. PEOU 23,5% affects ATT and 76,5% affected
by another variables. It supports Chau (1996), Malholtra and Galletta (1999),
and also Huang et al. (2006) research.
6. H6: Perceived usefulness of mobile banking has a positive effect on attitude
toward using mobile banking.
The objective of hypothesis 5 is to identify whether Perceived
Usefulness (PU) affects attitude towards using mobile banking (ATT) or not.
Perceived usefulness (PU) significantly affects ATT with probability level is
less than 0,05, H6 is acceptable. PU 49,4% affects ATT and 50,6% affected
perpustakaan.uns.ac.id digilib.uns.ac.id
commit to user
55
by another variables. It supports Malholtra and Galletta (1999) and Huang et
al. (2006) research.
7. H7: Perceived usefulness of mobile banking has a positive effect on
Behavioural intention toward using mobile banking.
The objective of hypothesis 7 is to identify whether Perceived
Usefulness (PU) affects Behavioural Intention towards using mobile banking
(BI) or not. PU significantly affects BI at probability level 0,003, less than
0,05, so H7 is accepted. BI affected by PU at 46% and 54% affected by
another variable. It also supports Maholtra and Galletta (1999) research and
Huang et al. (2006) research.
8. H8: Attitude has a positive effect on behavioural intention toward using the
mobile banking.
The objective of hypothesis 8 is to identify whether attitude toward
using mobile banking (ATT) affects Behavioural Intention towards using
mobile banking (BI) or not. Attitude significantly affects behavioural
intention toward using the mobile banking at probability level 0,009, less than
0,05, H8 is accepted. ATT affects BI at 36,9% and 63, 1% affected by
another variable. It also supports Maholtra and Galletta (1999) and Huang et
al. (2006) research.
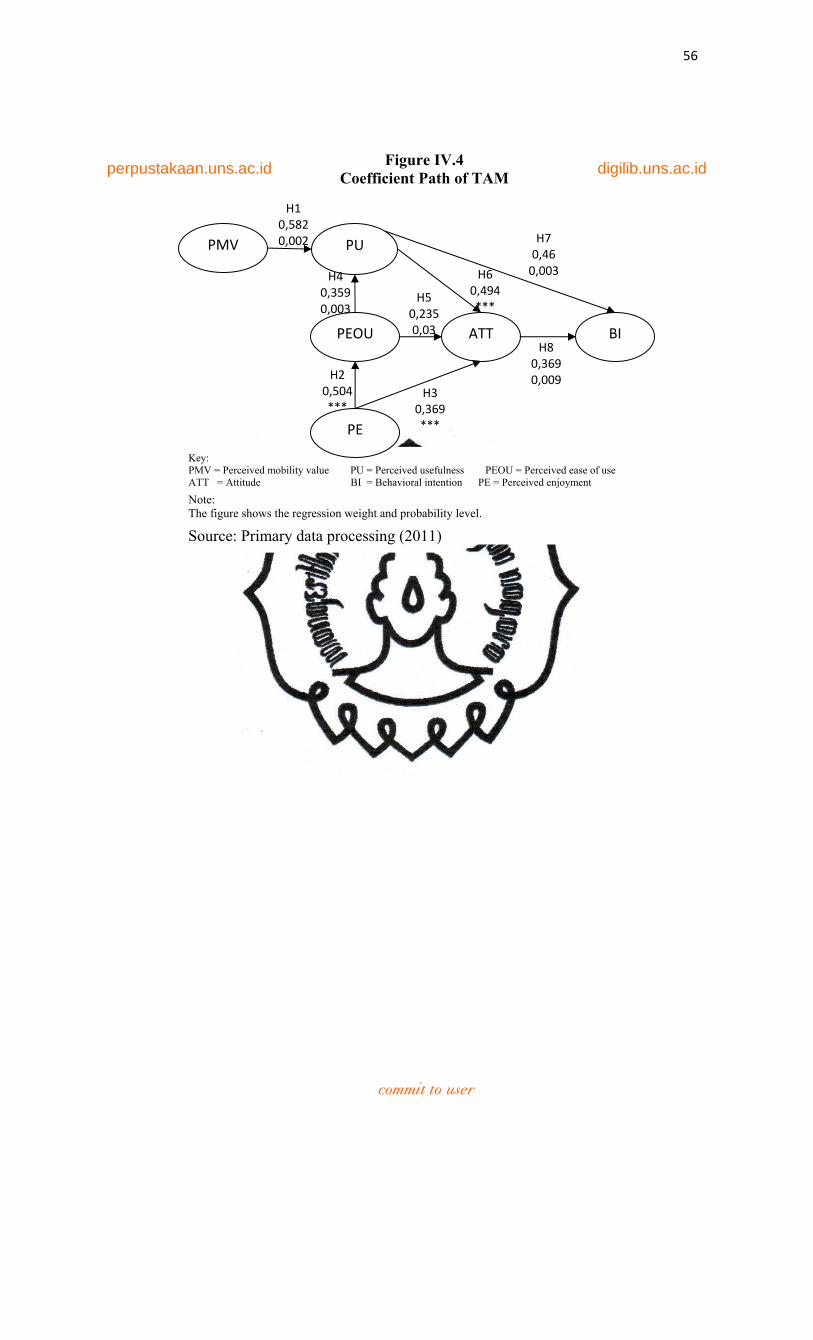
perpustakaan.uns.ac.id digilib.uns.ac.id
commit to user
56
Figure IV.4 Coefficient Path of TAM
Key: PMV = Perceived mobility value PU = Perceived usefulness PEOU = Perceived ease of use ATT = Attitude BI = Behavioral intention PE = Perceived enjoyment
PMV PU
PEOU
PE
ATT BI
H20,504 ***
H30,369 ***
H40,359 0,003
H50,235 0,03
H60,494 ***
H70,46 0,003
H80,369 0,009
Note: The figure shows the regression weight and probability level. Source: Primary data processing (2011)
H1 0,582 0,002
perpustakaan.uns.ac.id digilib.uns.ac.id
commit to user
57
CHAPTER V
CONCLUSION
A. Conclusions
As mentioned in the previous chapters, the objective of this research is
to test and verify that the TAM can be employed to explain and predict the
acceptance of mobile banking using two factors that account for individual
differences, i.e. Perceived Mobile Value (PMV) and Perceived Enjoyment (PE).
This research uses 131 respondents sample which is gotten from primary data.
From the analysis that we have done, we reach several conclusions.
First, TAM is one of the most accepted theories for explaining the
acceptance of technologies. In this research, TAM can be employed to explain
and predict the acceptance of mobile banking. Perceived Ease of Use (PEOU)
affects significantly to Perceived Usefulness (PU). However, PU affects
individual attitudes more than PEOU does and Perceived Enjoyment (PE) also
affects individual attitude more than PEOU does. PU affects Behavioural
Intention (BI) more than ATT does.
Second, this study shows the effect of Perceived Mobility Value (PMV)
to an individual’s acceptance of mobile banking. The most significant feature of
mobile technology is mobility which enables customer to do their transaction at
anytime and anywhere. So the advantages of mobility are crucial to users.
Third, the fact that enjoyable is quite significant to attract users. When
customers enjoy positive experience of mobile banking usage and find that
perpustakaan.uns.ac.id digilib.uns.ac.id
commit to user
58
enjoyable may free from complexity, they will use it. Fourth, this study uses the
same model which is conducted by Huang et al. to explain and predict
technology acceptance by user. The affective level of those two extended
variables, i.e. perceived mobility value and perceived enjoyment, for mobile
banking acceptance is quite high and it supports Huang et al (2006). research.
B. Research Constraints
This study has several limitations that need to be considered for the further
research. Some constraints in this research are mentioned as follow.
1. A researcher did not do the pilot survey. Pilot survey is conducted to detect
weaknesses in design and instrumentation and to provide proxy data for
selection. Any biases could also be detected if the respondents had tended
to respond similarly to all items or stuck to only certain points on the scale.
2. This study has a number of sample 131 respondents which are few and
limit for mobile banking user in Jakarta.
3. The research scope is only in the Jakarta region, so it less represent all over
perception.
4. Inherent limitation on this survey method is researcher cannot control the
respondents’ answers, whether respondents were not honest in answering
the question asked or were not completed the questionnaire.
5. Actual usage frequency did not measure in this study, so it cannot be
defined perceived usage as the amount of time interacting with the mobile
banking and the frequency of use.
perpustakaan.uns.ac.id digilib.uns.ac.id
commit to user
59
C. Research Suggestions
The following is suggestions to future research development.
1. Recommending this instrument for future research is the needs to do the
pilot survey to decrease the probability of invalid indicators so it will
reflect the clearer picture about the real condition.
2. Study scope for next research must be larger so the level of population
generalization will be wider.
3. Interview method may be recommended to obtaine non-bias data.
4. For future research, it may include the mobile banking actual usage
variable so it can define perceived usage as the amount of time interacting
with the mobile banking and the frequency of use.
5. Replacing or even adding more variables to specified respondent answers.
6. This study gives the opportunity for further research to investigate the
others variables (e.g. self-efficacy, compatibility, voluntariness, etc.)
which can not be observed by researcher.