august 27, 2018 neutral thai airways international · (thai tb) share price: bt13.1 target ... they...
TRANSCRIPT
Disclaimer: This publication constitutes information disclosed to the public and believed to be reliable but its accuracy and completeness are not guaranteed. All opinions, suggestions, or projections are for informational purposes only and shall not be construed as an inducement for the sale or purchase of securities. Amendments to this publication may be made without prior notice. Investors are urged to exercise caution in making a decision to invest in any securities.
CO
MP
AN
Y R
ES
EA
RC
H |
Co
mp
an
y U
pd
ate
1
August 27, 2018 NEUTRAL
Thai Airways International (THAI TB) Share Price: Bt13.1 Target Price: Bt16.0 (+22.1%)
A new captain at the helm � Revenue should improve due to higher fuel surcharge, but
earnings would be pressured by higher fuel costs in 3Q18
� Expect to get approval to acquire 23 aircrafts; signing JV
contract for MRO project by year end
� NEUTRAL, Bt16/sh TP is based on 1.0x FY18F P/BV; wait for
turnaround strategy from new president
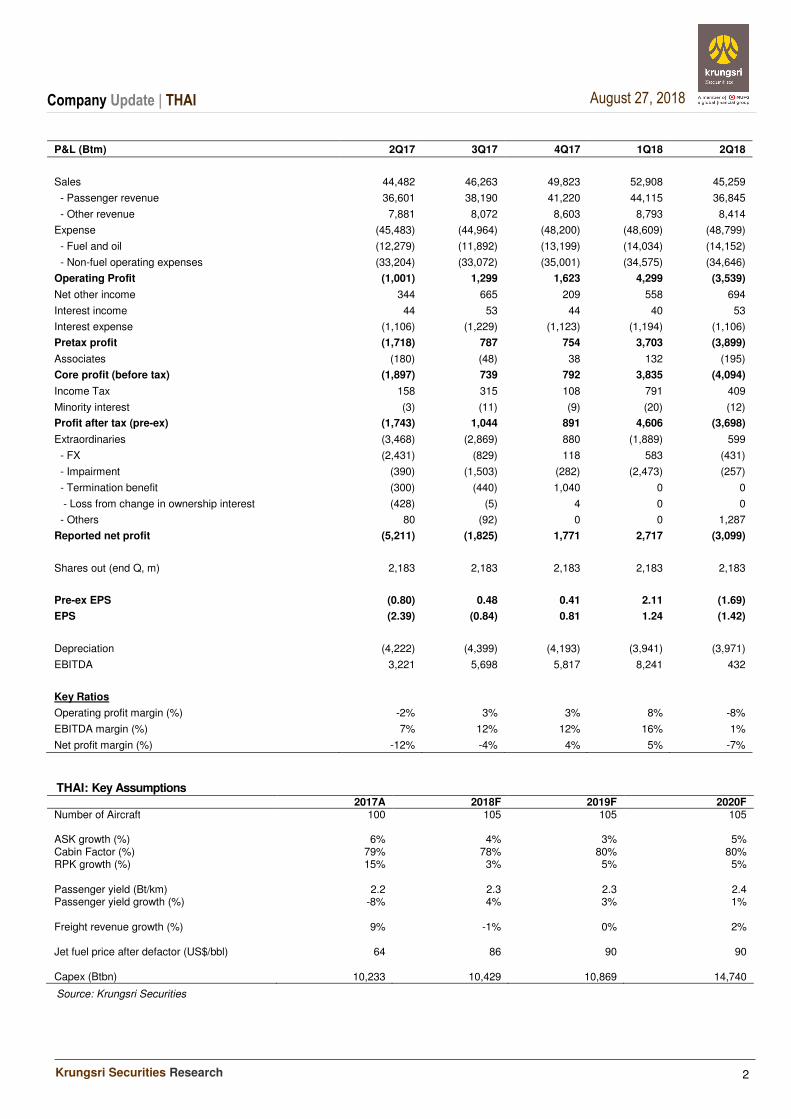
Operations to improve from passenger yield, cabin factor in 3Q18 At the analyst meeting last Friday, management expect operations to improve in 3Q18. Passenger yield should rise yoy due to a hike in fuel surcharge in June, the third hike for THAI this year. Cabin factor, which fell 2.5 ppt yoy to 78% in 1H18, should improve in 3Q18. It still dropped yoy in July but it should improve to flat yoy in August-September driven by strong demand for regional flights. Hence, revenue should grow yoy in 3Q18 but earnings will continue to be pressured by high fuel prices. Fuel spot price is currently US$85/bbl, 27% higher than US$67 average in 3Q17. Although THAI has hedged 55-60% of fuel requirement for 3Q18 with collar at between US$56 and US$67 per barrel (Brent), we estimate fuel expenses net hedging would still increase by 15-20% yoy. On a positive note, THAI should book gains from the sale of property asset in Madrid and a subsidiary company (non-core business) in 3Q18.
Expect 11-year payback period for MRO project THAI took delivery of a new aircraft (last one) in May to take their fleet to 105 planes. They plan to decommission up to 17 aircrafts by 2020, which means they need to buy more aircraft. They plan to buy 23 new aircrafts, which has been approved by the Ministry of Transport and should receive Cabinet approval by year end. Meanwhile, THAI expects to sign a JV contract with Airbus and the Royal Thai Navy for an MRO project by the end of this year. Capex is estimated at Bt3.0bn. THAI expects it to start operation by 2022. Revenue should ramp up from Bt400-500m per year and the project is expected to generate a total of Bt200bn revenue in 50 years with 11 years payback period. We have not yet factored MRO project into our model
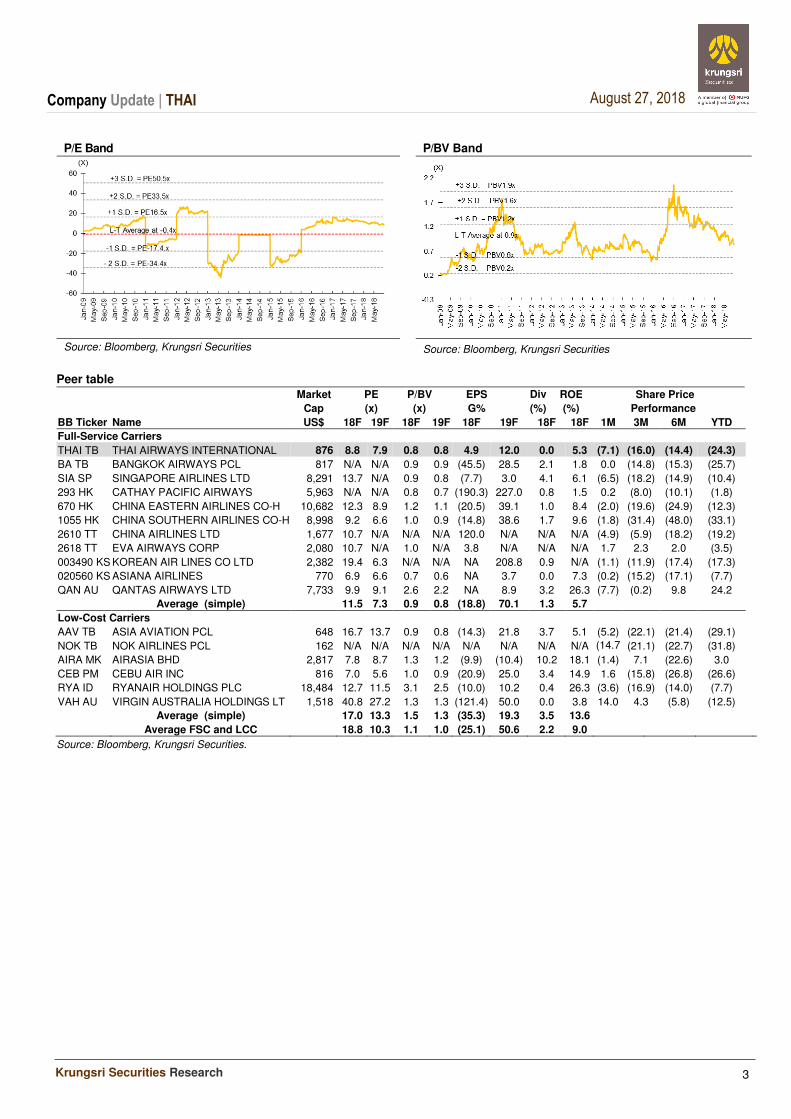
Trading at undemanding valuation but no near term catalyst THAI’s share price fell 11% after weak 2Q18 results. The stock is now trading at 0.8x FY18F P/BV vs regional peers’ average of 1.1x. Although there is 22% upside to our TP, we remain NEUTRAL as near-term earnings would be pressured by rising fuel prices and regular impairment charges. Further, there will be a new President, Khun Sumeth Damrongchaitham, starting September. We will wait for his strategy and vision before revising our assumptions and recommendation.
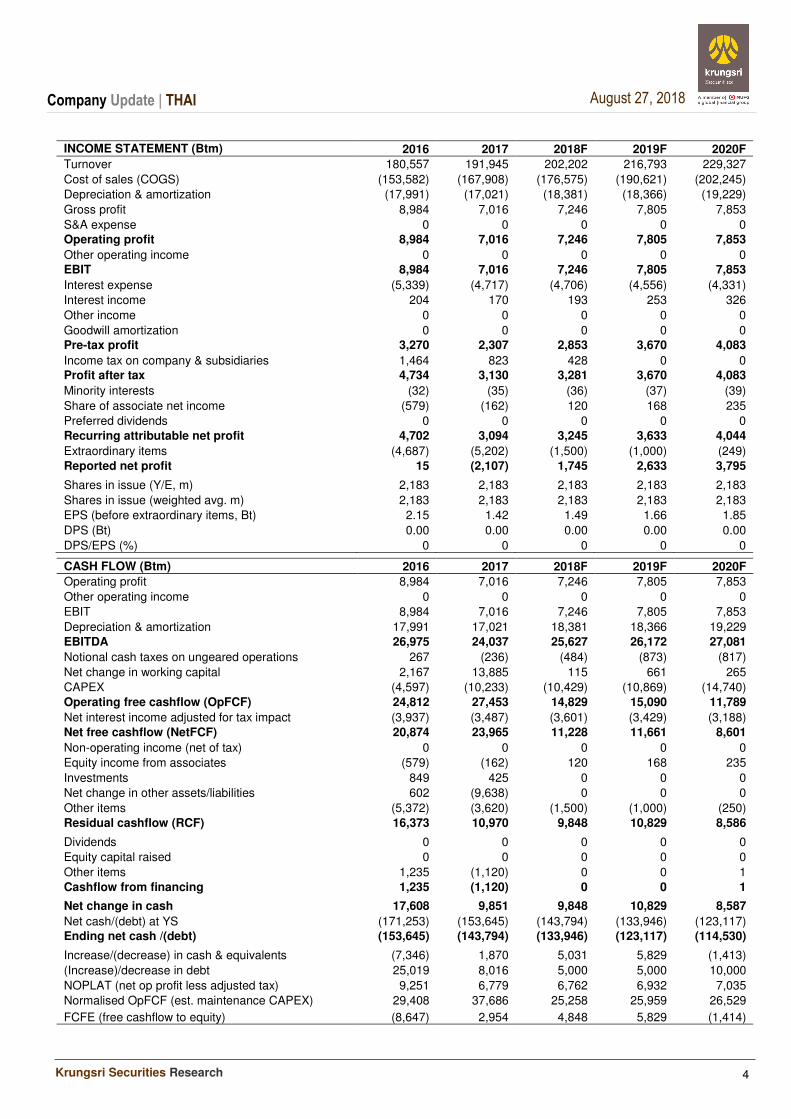
Financial Summary (Btm) Year to Dec 2016 2017 2018F 2019F 2020F
Sales (Btm) 180,557 191,945 202,202 216,793 229,327
Growth (%) (4.3) 6.3 5.3 7.2 5.8 EBITDA (Btm) 26,975 24,037 25,627 26,172 27,081
Growth (%) 20.0 (10.9) 6.6 2.1 3.5
Recurring profit (Btm) 4,702 3,094 3,245 3,633 4,044
Growth (%) 551.9 (34) 5 12 11
Net profit (Btm) 15 (2,107) 1,745 2,633 3,795
FDEPS (Bt) (Core) 2.2 1.4 1.5 1.7 1.9 Growth (%) 551.9 (34) 5 12 11
PE (x) 6.1 9.2 8.8 7.9 7.1 DPS (Bt) 0.00 0.00 0.00 0.00 0.00
Yield (%) 0.0 0.0 0.0 0.0 0.0 BVPS (Bt) 15.35 14.62 15.50 16.71 18.45
P/BV (x) 0.9 0.9 0.8 0.8 0.7
Teerapol UDOMVEJ
662 - 659 7000 ext 5012
Key Data
12-mth High/Low (Bt) 20.1 / 12.2
Market capital (Btm/US$m) 28,594.3 / 876.7
3m avg Turnover (Btm/US$m) 39.6 / 1.2
Free Float (%) 49.0
Issue Shares (m shares) 2,183
Major shareholders:
- FINANCE MINISTRY 51.0
- VAYUPAK FUND I 15.1
- Thai NVDR 3.7
Share Price Performance
YTD 1Mth 3Mth 12Mth
Absolute (%) (24.3) (7.1) (16.0) (21.6)
Relative to index (%) (21.4) (8.8) (13.2) (29.9)
Krungsri Securities vs Market
Positive Neutral Negative
Market Recommend 3 5 6
Krungsri Market % +/-
Target Price (Bt) 16.0 15.7 2.0
’18 Net Profit (Btm) 1,745 3,505 (50.2)
’19 Net Profit (Btm) 2,633 3,852 (31.7)
Krungsri's earnings revision
2018F 2019F
Earnings revision (%) - - Source: Bloomberg, Krungsri Securities
Company Update | THAI
Krungsri Securities Research
2
August 27, 2018
P&L (Btm) 2Q17 3Q17 4Q17 1Q18 2Q18
Sales 44,482 46,263 49,823 52,908 45,259
- Passenger revenue 36,601 38,190 41,220 44,115 36,845
- Other revenue 7,881 8,072 8,603 8,793 8,414
Expense (45,483) (44,964) (48,200) (48,609) (48,799)
- Fuel and oil (12,279) (11,892) (13,199) (14,034) (14,152)
- Non-fuel operating expenses (33,204) (33,072) (35,001) (34,575) (34,646)
Operating Profit (1,001) 1,299 1,623 4,299 (3,539)
Net other income 344 665 209 558 694
Interest income 44 53 44 40 53
Interest expense (1,106) (1,229) (1,123) (1,194) (1,106)
Pretax profit (1,718) 787 754 3,703 (3,899)
Associates (180) (48) 38 132 (195)
Core profit (before tax) (1,897) 739 792 3,835 (4,094)
Income Tax 158 315 108 791 409
Minority interest (3) (11) (9) (20) (12)
Profit after tax (pre-ex) (1,743) 1,044 891 4,606 (3,698)
Extraordinaries (3,468) (2,869) 880 (1,889) 599
- FX (2,431) (829) 118 583 (431)
- Impairment (390) (1,503) (282) (2,473) (257)
- Termination benefit (300) (440) 1,040 0 0
- Loss from change in ownership interest (428) (5) 4 0 0
- Others 80 (92) 0 0 1,287
Reported net profit (5,211) (1,825) 1,771 2,717 (3,099)
Shares out (end Q, m) 2,183 2,183 2,183 2,183 2,183
Pre-ex EPS (0.80) 0.48 0.41 2.11 (1.69)
EPS (2.39) (0.84) 0.81 1.24 (1.42)
Depreciation (4,222) (4,399) (4,193) (3,941) (3,971)
EBITDA 3,221 5,698 5,817 8,241 432
Key Ratios Operating profit margin (%) -2% 3% 3% 8% -8%
EBITDA margin (%) 7% 12% 12% 16% 1%
Net profit margin (%) -12% -4% 4% 5% -7%
THAI: Key Assumptions
2017A 2018F 2019F 2020F Number of Aircraft 100 105 105 105
ASK growth (%) 6% 4% 3% 5% Cabin Factor (%) 79% 78% 80% 80% RPK growth (%) 15% 3% 5% 5% Passenger yield (Bt/km) 2.2 2.3 2.3 2.4 Passenger yield growth (%) -8% 4% 3% 1%
Freight revenue growth (%) 9% -1% 0% 2%
Jet fuel price after defactor (US$/bbl) 64 86 90 90
Capex (Btbn) 10,233 10,429 10,869 14,740
Source: Krungsri Securities
Company Update | THAI
Krungsri Securities Research
3
August 27, 2018
P/E Band P/BV Band
Source: Bloomberg, Krungsri Securities Source: Bloomberg, Krungsri Securities
Peer table
Market PE P/BV EPS Div Yield
ROE Share Price
Cap (x) (x) G% (%) (%) Performance
BB Ticker Name US$ 18F 19F 18F 19F 18F 19F 18F 18F 1M 3M 6M YTD
Full-Service Carriers THAI TB THAI AIRWAYS INTERNATIONAL 876 8.8 7.9 0.8 0.8 4.9 12.0 0.0 5.3 (7.1) (16.0) (14.4) (24.3)
BA TB BANGKOK AIRWAYS PCL 817 N/A N/A 0.9 0.9 (45.5) 28.5 2.1 1.8 0.0 (14.8) (15.3) (25.7)
SIA SP SINGAPORE AIRLINES LTD 8,291 13.7 N/A 0.9 0.8 (7.7) 3.0 4.1 6.1 (6.5) (18.2) (14.9) (10.4)
293 HK CATHAY PACIFIC AIRWAYS 5,963 N/A N/A 0.8 0.7 (190.3) 227.0 0.8 1.5 0.2 (8.0) (10.1) (1.8)
670 HK CHINA EASTERN AIRLINES CO-H 10,682 12.3 8.9 1.2 1.1 (20.5) 39.1 1.0 8.4 (2.0) (19.6) (24.9) (12.3)
1055 HK CHINA SOUTHERN AIRLINES CO-H 8,998 9.2 6.6 1.0 0.9 (14.8) 38.6 1.7 9.6 (1.8) (31.4) (48.0) (33.1)
2610 TT CHINA AIRLINES LTD 1,677 10.7 N/A N/A N/A 120.0 N/A N/A N/A (4.9) (5.9) (18.2) (19.2)
2618 TT EVA AIRWAYS CORP 2,080 10.7 N/A 1.0 N/A 3.8 N/A N/A N/A 1.7 2.3 2.0 (3.5)
003490 KS KOREAN AIR LINES CO LTD 2,382 19.4 6.3 N/A N/A NA 208.8 0.9 N/A (1.1) (11.9) (17.4) (17.3)
020560 KS ASIANA AIRLINES 770 6.9 6.6 0.7 0.6 NA 3.7 0.0 7.3 (0.2) (15.2) (17.1) (7.7)
QAN AU QANTAS AIRWAYS LTD 7,733 9.9 9.1 2.6 2.2 NA 8.9 3.2 26.3 (7.7) (0.2) 9.8 24.2
Average (simple) 11.5 7.3 0.9 0.8 (18.8) 70.1 1.3 5.7
Low-Cost Carriers AAV TB ASIA AVIATION PCL 648 16.7 13.7 0.9 0.8 (14.3) 21.8 3.7 5.1 (5.2) (22.1) (21.4) (29.1)
NOK TB NOK AIRLINES PCL 162 N/A N/A N/A N/A N/A N/A N/A N/A (14.7)
(21.1) (22.7) (31.8)
AIRA MK AIRASIA BHD 2,817 7.8 8.7 1.3 1.2 (9.9) (10.4) 10.2 18.1 (1.4) 7.1 (22.6) 3.0
CEB PM CEBU AIR INC 816 7.0 5.6 1.0 0.9 (20.9) 25.0 3.4 14.9 1.6 (15.8) (26.8) (26.6)
RYA ID RYANAIR HOLDINGS PLC 18,484 12.7 11.5 3.1 2.5 (10.0) 10.2 0.4 26.3 (3.6) (16.9) (14.0) (7.7)
VAH AU VIRGIN AUSTRALIA HOLDINGS LT 1,518 40.8 27.2 1.3 1.3 (121.4) 50.0 0.0 3.8 14.0 4.3 (5.8) (12.5)
Average (simple) 17.0 13.3 1.5 1.3 (35.3) 19.3 3.5 13.6
Average FSC and LCC 18.8 10.3 1.1 1.0 (25.1) 50.6 2.2 9.0
Source: Bloomberg, Krungsri Securities.
Company Update | THAI
Krungsri Securities Research
4
August 27, 2018
INCOME STATEMENT (Btm) 2016 2017 2018F 2019F 2020F
Turnover 180,557 191,945 202,202 216,793 229,327
Cost of sales (COGS) (153,582) (167,908) (176,575) (190,621) (202,245)
Depreciation & amortization (17,991) (17,021) (18,381) (18,366) (19,229)
Gross profit 8,984 7,016 7,246 7,805 7,853
S&A expense 0 0 0 0 0 Operating profit 8,984 7,016 7,246 7,805 7,853
Other operating income 0 0 0 0 0 EBIT 8,984 7,016 7,246 7,805 7,853
Interest expense (5,339) (4,717) (4,706) (4,556) (4,331)
Interest income 204 170 193 253 326
Other income 0 0 0 0 0
Goodwill amortization 0 0 0 0 0 Pre-tax profit 3,270 2,307 2,853 3,670 4,083
Income tax on company & subsidiaries 1,464 823 428 0 0 Profit after tax 4,734 3,130 3,281 3,670 4,083
Minority interests (32) (35) (36) (37) (39)
Share of associate net income (579) (162) 120 168 235
Preferred dividends 0 0 0 0 0
Recurring attributable net profit 4,702 3,094 3,245 3,633 4,044
Extraordinary items (4,687) (5,202) (1,500) (1,000) (249)
Reported net profit 15 (2,107) 1,745 2,633 3,795 Shares in issue (Y/E, m) 2,183 2,183 2,183 2,183 2,183
Shares in issue (weighted avg. m) 2,183 2,183 2,183 2,183 2,183
EPS (before extraordinary items, Bt) 2.15 1.42 1.49 1.66 1.85
DPS (Bt) 0.00 0.00 0.00 0.00 0.00
DPS/EPS (%) 0 0 0 0 0 CASH FLOW (Btm) 2016 2017 2018F 2019F 2020F
Operating profit 8,984 7,016 7,246 7,805 7,853
Other operating income 0 0 0 0 0
EBIT 8,984 7,016 7,246 7,805 7,853
Depreciation & amortization 17,991 17,021 18,381 18,366 19,229
EBITDA 26,975 24,037 25,627 26,172 27,081
Notional cash taxes on ungeared operations 267 (236) (484) (873) (817)
Net change in working capital 2,167 13,885 115 661 265
CAPEX (4,597) (10,233) (10,429) (10,869) (14,740)
Operating free cashflow (OpFCF) 24,812 27,453 14,829 15,090 11,789
Net interest income adjusted for tax impact (3,937) (3,487) (3,601) (3,429) (3,188)
Net free cashflow (NetFCF) 20,874 23,965 11,228 11,661 8,601
Non-operating income (net of tax) 0 0 0 0 0
Equity income from associates (579) (162) 120 168 235
Investments 849 425 0 0 0
Net change in other assets/liabilities 602 (9,638) 0 0 0
Other items (5,372) (3,620) (1,500) (1,000) (250)
Residual cashflow (RCF) 16,373 10,970 9,848 10,829 8,586 Dividends 0 0 0 0 0
Equity capital raised 0 0 0 0 0
Other items 1,235 (1,120) 0 0 1
Cashflow from financing 1,235 (1,120) 0 0 1 Net change in cash 17,608 9,851 9,848 10,829 8,587
Net cash/(debt) at YS (171,253) (153,645) (143,794) (133,946) (123,117) Ending net cash /(debt) (153,645) (143,794) (133,946) (123,117) (114,530) Increase/(decrease) in cash & equivalents (7,346) 1,870 5,031 5,829 (1,413)
(Increase)/decrease in debt 25,019 8,016 5,000 5,000 10,000
NOPLAT (net op profit less adjusted tax) 9,251 6,779 6,762 6,932 7,035
Normalised OpFCF (est. maintenance CAPEX) 29,408 37,686 25,258 25,959 26,529
FCFE (free cashflow to equity) (8,647) 2,954 4,848 5,829 (1,414)
Company Update | THAI
Krungsri Securities Research
5
August 27, 2018
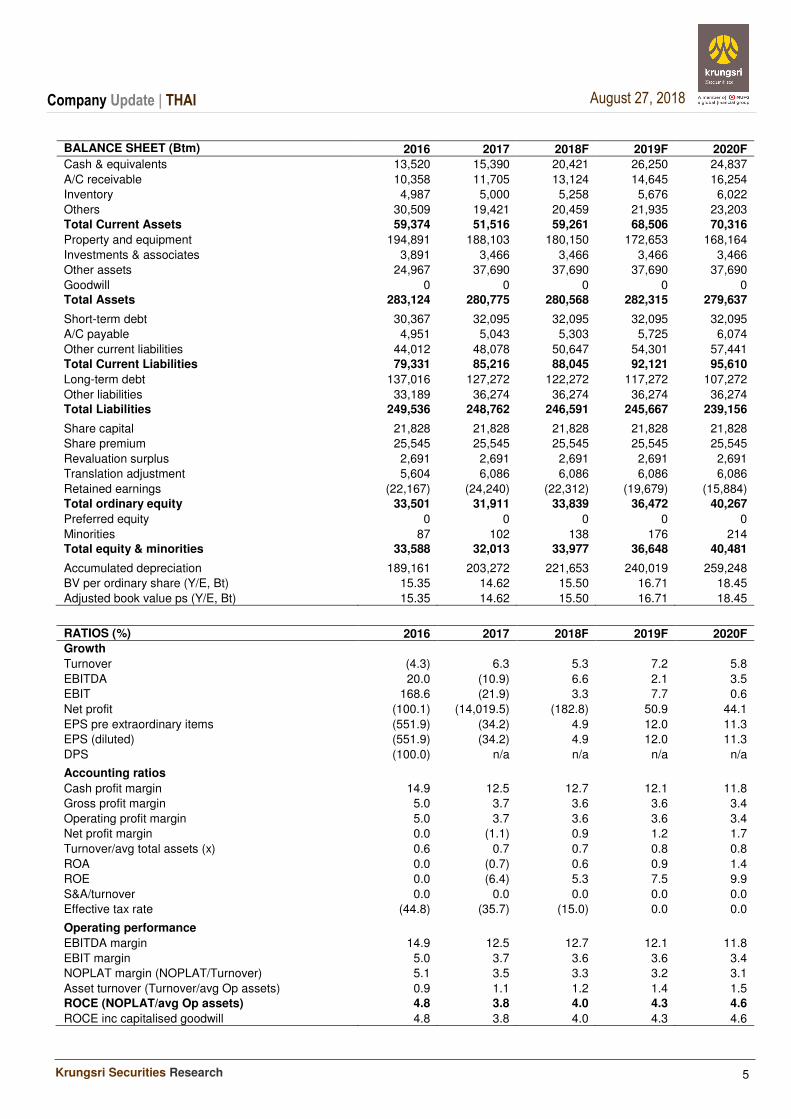
BALANCE SHEET (Btm)
2016 2017 2018F 2019F 2020F
Cash & equivalents 13,520 15,390 20,421 26,250 24,837
A/C receivable 10,358 11,705 13,124 14,645 16,254
Inventory 4,987 5,000 5,258 5,676 6,022
Others 30,509 19,421 20,459 21,935 23,203
Total Current Assets 59,374 51,516 59,261 68,506 70,316
Property and equipment 194,891 188,103 180,150 172,653 168,164
Investments & associates 3,891 3,466 3,466 3,466 3,466
Other assets 24,967 37,690 37,690 37,690 37,690
Goodwill 0 0 0 0 0 Total Assets 283,124 280,775 280,568 282,315 279,637 Short-term debt 30,367 32,095 32,095 32,095 32,095
A/C payable 4,951 5,043 5,303 5,725 6,074
Other current liabilities 44,012 48,078 50,647 54,301 57,441
Total Current Liabilities 79,331 85,216 88,045 92,121 95,610
Long-term debt 137,016 127,272 122,272 117,272 107,272
Other liabilities 33,189 36,274 36,274 36,274 36,274 Total Liabilities 249,536 248,762 246,591 245,667 239,156 Share capital 21,828 21,828 21,828 21,828 21,828
Share premium 25,545 25,545 25,545 25,545 25,545
Revaluation surplus 2,691 2,691 2,691 2,691 2,691
Translation adjustment 5,604 6,086 6,086 6,086 6,086
Retained earnings (22,167) (24,240) (22,312) (19,679) (15,884)
Total ordinary equity 33,501 31,911 33,839 36,472 40,267
Preferred equity 0 0 0 0 0
Minorities 87 102 138 176 214 Total equity & minorities 33,588 32,013 33,977 36,648 40,481 Accumulated depreciation 189,161 203,272 221,653 240,019 259,248
BV per ordinary share (Y/E, Bt) 15.35 14.62 15.50 16.71 18.45
Adjusted book value ps (Y/E, Bt) 15.35 14.62 15.50 16.71 18.45
RATIOS (%) 2016 2017 2018F 2019F 2020F Growth
Turnover (4.3) 6.3 5.3 7.2 5.8
EBITDA 20.0 (10.9) 6.6 2.1 3.5
EBIT 168.6 (21.9) 3.3 7.7 0.6
Net profit (100.1) (14,019.5) (182.8) 50.9 44.1
EPS pre extraordinary items (551.9) (34.2) 4.9 12.0 11.3
EPS (diluted) (551.9) (34.2) 4.9 12.0 11.3
DPS (100.0) n/a n/a n/a n/a Accounting ratios
Cash profit margin 14.9 12.5 12.7 12.1 11.8
Gross profit margin 5.0 3.7 3.6 3.6 3.4
Operating profit margin 5.0 3.7 3.6 3.6 3.4
Net profit margin 0.0 (1.1) 0.9 1.2 1.7
Turnover/avg total assets (x) 0.6 0.7 0.7 0.8 0.8
ROA 0.0 (0.7) 0.6 0.9 1.4
ROE 0.0 (6.4) 5.3 7.5 9.9
S&A/turnover 0.0 0.0 0.0 0.0 0.0
Effective tax rate (44.8) (35.7) (15.0) 0.0 0.0 Operating performance
EBITDA margin 14.9 12.5 12.7 12.1 11.8
EBIT margin 5.0 3.7 3.6 3.6 3.4
NOPLAT margin (NOPLAT/Turnover) 5.1 3.5 3.3 3.2 3.1
Asset turnover (Turnover/avg Op assets) 0.9 1.1 1.2 1.4 1.5
ROCE (NOPLAT/avg Op assets) 4.8 3.8 4.0 4.3 4.6
ROCE inc capitalised goodwill 4.8 3.8 4.0 4.3 4.6
Company Update | THAI
Krungsri Securities Research
6
August 27, 2018
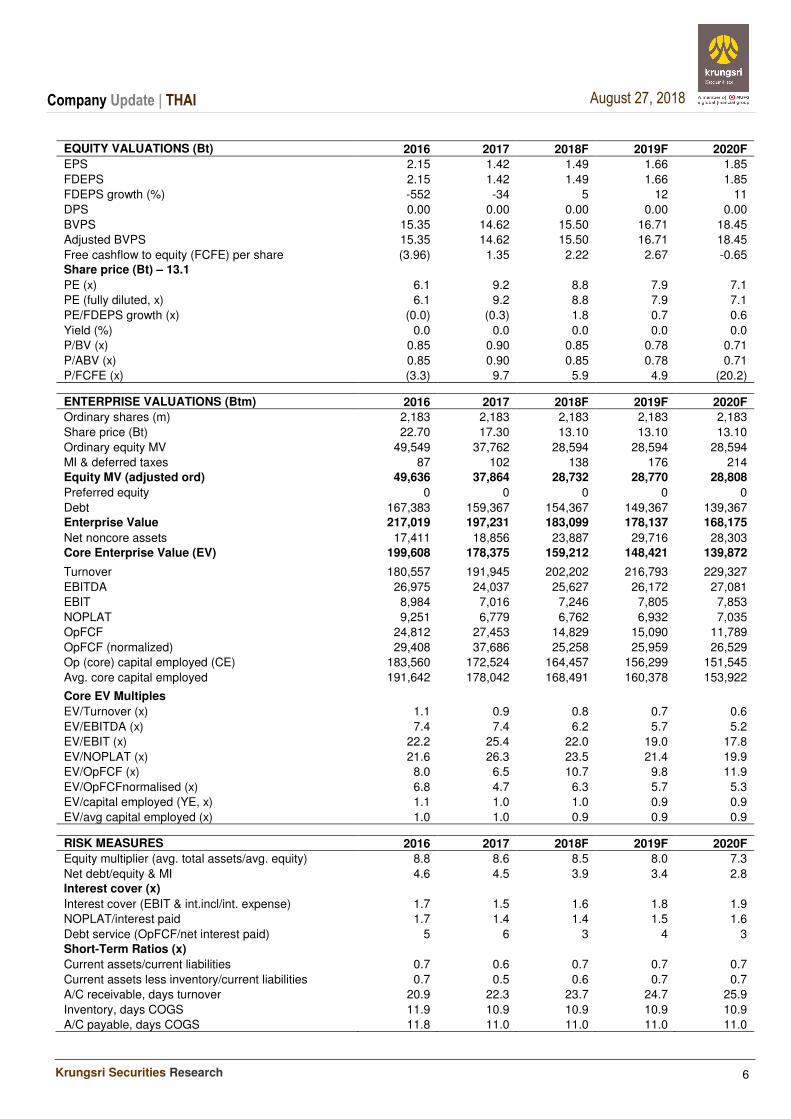
EQUITY VALUATIONS (Bt) 2016 2017 2018F 2019F 2020F
EPS 2.15 1.42 1.49 1.66 1.85
FDEPS 2.15 1.42 1.49 1.66 1.85
FDEPS growth (%) -552 -34 5 12 11
DPS 0.00 0.00 0.00 0.00 0.00
BVPS 15.35 14.62 15.50 16.71 18.45
Adjusted BVPS 15.35 14.62 15.50 16.71 18.45
Free cashflow to equity (FCFE) per share (3.96) 1.35 2.22 2.67 -0.65 Share price (Bt) – 13.1
PE (x) 6.1 9.2 8.8 7.9 7.1
PE (fully diluted, x) 6.1 9.2 8.8 7.9 7.1
PE/FDEPS growth (x) (0.0) (0.3) 1.8 0.7 0.6
Yield (%) 0.0 0.0 0.0 0.0 0.0
P/BV (x) 0.85 0.90 0.85 0.78 0.71
P/ABV (x) 0.85 0.90 0.85 0.78 0.71
P/FCFE (x) (3.3) 9.7 5.9 4.9 (20.2) ENTERPRISE VALUATIONS (Btm) 2016 2017 2018F 2019F 2020F
Ordinary shares (m) 2,183 2,183 2,183 2,183 2,183
Share price (Bt) 22.70 17.30 13.10 13.10 13.10
Ordinary equity MV 49,549 37,762 28,594 28,594 28,594
MI & deferred taxes 87 102 138 176 214
Equity MV (adjusted ord) 49,636 37,864 28,732 28,770 28,808
Preferred equity 0 0 0 0 0
Debt 167,383 159,367 154,367 149,367 139,367 Enterprise Value 217,019 197,231 183,099 178,137 168,175
Net noncore assets 17,411 18,856 23,887 29,716 28,303
Core Enterprise Value (EV) 199,608 178,375 159,212 148,421 139,872 Turnover 180,557 191,945 202,202 216,793 229,327
EBITDA 26,975 24,037 25,627 26,172 27,081
EBIT 8,984 7,016 7,246 7,805 7,853
NOPLAT 9,251 6,779 6,762 6,932 7,035
OpFCF 24,812 27,453 14,829 15,090 11,789
OpFCF (normalized) 29,408 37,686 25,258 25,959 26,529
Op (core) capital employed (CE) 183,560 172,524 164,457 156,299 151,545
Avg. core capital employed 191,642 178,042 168,491 160,378 153,922 Core EV Multiples
EV/Turnover (x) 1.1 0.9 0.8 0.7 0.6
EV/EBITDA (x) 7.4 7.4 6.2 5.7 5.2
EV/EBIT (x) 22.2 25.4 22.0 19.0 17.8
EV/NOPLAT (x) 21.6 26.3 23.5 21.4 19.9
EV/OpFCF (x) 8.0 6.5 10.7 9.8 11.9
EV/OpFCFnormalised (x) 6.8 4.7 6.3 5.7 5.3
EV/capital employed (YE, x) 1.1 1.0 1.0 0.9 0.9
EV/avg capital employed (x) 1.0 1.0 0.9 0.9 0.9 RISK MEASURES 2016 2017 2018F 2019F 2020F
Equity multiplier (avg. total assets/avg. equity) 8.8 8.6 8.5 8.0 7.3
Net debt/equity & MI 4.6 4.5 3.9 3.4 2.8 Interest cover (x)
Interest cover (EBIT & int.incl/int. expense) 1.7 1.5 1.6 1.8 1.9
NOPLAT/interest paid 1.7 1.4 1.4 1.5 1.6
Debt service (OpFCF/net interest paid) 5 6 3 4 3
Short-Term Ratios (x)
Current assets/current liabilities 0.7 0.6 0.7 0.7 0.7
Current assets less inventory/current liabilities 0.7 0.5 0.6 0.7 0.7
A/C receivable, days turnover 20.9 22.3 23.7 24.7 25.9
Inventory, days COGS 11.9 10.9 10.9 10.9 10.9
A/C payable, days COGS 11.8 11.0 11.0 11.0 11.0

CG Rating 2017 Companies with CG Rating
Disclaimer The disclosure of the survey result of the Thai Institute of Directors Association ("IOD") regarding corporate governance is made pursuant to the policy of the Office of the Securities and Exchange Commission. The survey of the IOD is based on the information of a company listed on the Stock Exchange of Thailand and the Market for Alternative Investment disclosed to the public and able to be accessed by a general public investor. The result, therefore, is from the perspective of a third party. It is not an assessment of operation and is not based on inside information. The survey result is as of the date appearing in the Corporate Governance Report of Thai Listed Companies. As a result, the survey result may be changed after that date or when there is any change to the relevant information. Nevertheless, Krungsri Securities Public Company Limited does not confirm, verify, or certify the accuracy and completeness of such survey result.
ADVANC AKP ANAN AOT AP BAFS BANPU BAY BCP BTS BWG CFRESH CHO CK
CNT CPF CPN CSL DELTA DEMCO DRT DTAC DTC EASTW EGCO GC GCAP GFPT
GOLD GPSC GRAMMY GUNKUL HANA HMPRO ICC ICHI INTUCH IRPC IVL JSP KBANK KCE
KKP KTB KTC LHFG LPN MBK MCOT MINT MONO NCH NKI NYT OTO PDJ
PHOL PLANB PPS PRG PSH PSL PTG PTT PTTEP PTTGC PYLON Q-CON QH QTC
RATCH ROBINS SAMART SAMTEL SAT SC SCB SCC SCCC SDC SE-ED SIS SITHAI SNC
SPALI SPRC SSSC STEC SVI SYNTEC TCAP THANA THCOM THREL TISCO TKT TMB TNDT
TOP TRC TRUE TSC TTCL TU TVD UV VGI WACOAL WAVE
2S AAV ACAP AGE AH AHC AIRA AIT ALT AMANAH AMATA AMATAV APCO ARIP
ASIA ASIMAR ASK ASP AUCT AYUD BBL BCPG BDMS BEC BEM BFIT BJC BJCHI
BLA BOL BROOK BRR BTW CEN CENTEL CGH CHARAN CHEWA CHG CHOW CI CIG
CIMBT CKP CM CNS COL COM7 CPI CSC CSP CSS DCC EA EASON ECF
ECL EE EPG ERW FN FNS FORTH FPI FSMART FVC GBX GEL GLOBAL GLOW
HARN HYDRO ILINK INET IRC IT ITD JCKH JWD K KGI KKC KOOL KSL
KTIS L&E LALIN LANNA LH LHK LIT LOXLEY LRH LST M MACO MAJOR MAKRO
MALEE MBKET MC MEGA MFC MFEC MOONG MSC MTC MTI NOBLE NOK NSI NTV
NWR OCC OGC OISHI ORI PAP PATO PB PCSGH PDI PE PG PJW PLANET
PLAT PM PPP PREB PRINC PT RICHY RML RS RWI S S & J SABINA SALEE
SAMCO SAWAD SCG SCI SCN SEAFCO SEAOIL SENA SFP SIAM SINGER SIRI SMK SMPC
SMT SNP SORKON SPC SPI SPPT SR SSF SST STA STPI SUC SUSCO SUTHA
SWC SYMC SYNEX TAE TAKUNI TASCO TBSP TCC TEAM TFG TGCI THAI THANI THIP
THRE TICON TIPCO TIW TK TKN TKS TMC TMI TMILL TMT TNITY TNL TOG
TPAC TPCORP TRT TRU TSE TSR TSTE TSTH TTA TTW TVI TVO TWP TWPC
U UAC UMI UP UPF UPOIC UWC VIH VNT WICE WINNER XO YUASA ZMICO
7UP AEC AEONTS AF AJ AKR ALLA ALUCON AMA AMARIN AMC APURE AQUA ARROW
AS ASEFA ASIAN ASN ATP30 AU B BA BCH BEAUTY BH BIG BIZ BLAND
BPP BR BROCK BTNC CBG CCET CCP CGD CITY CMR COLOR COMAN CPL CSR
CTW CWT DCON DIGI DNA EFORL EKH EPCO ESSO ETE FE FOCUS FSS GENCO
GIFT GJS GLAND GSTEL GTB GYT HPT HTC HTECH IFS IHL INSURE IRCP J
JCK JMART JMT JUBILE KASET KBS KCAR KIAT KWC KYE LDC LEE LPH MATCH
MATI M-CHAI MDX META METCO MGT MILL MJD MK MODERN MPG NC NCL NDR
NEP NETBAY NPK NPP NUSA OCEAN PDG PF PICO PIMO PK PL PLE PMTA
PRECHA PRIN PSTC QLT RCI RCL RJH ROJNA RPC S11 SANKO SAPPE SCP SE
SGP SKR SKY SLP SMIT SOLAR SPA SPCG SPG SPVI SQ SRICHA SSC STANLY
SUPER SVOA T TACC TCCC TCMC TIC TLUXE TM TMD TNP TNR TOPP TPA
TPBI TPCH TPIPL TPOLY TPP TRITN TTI TVT TYCN UOBKH UPA UREKA UT VIBHA
VPO WIIK WIN
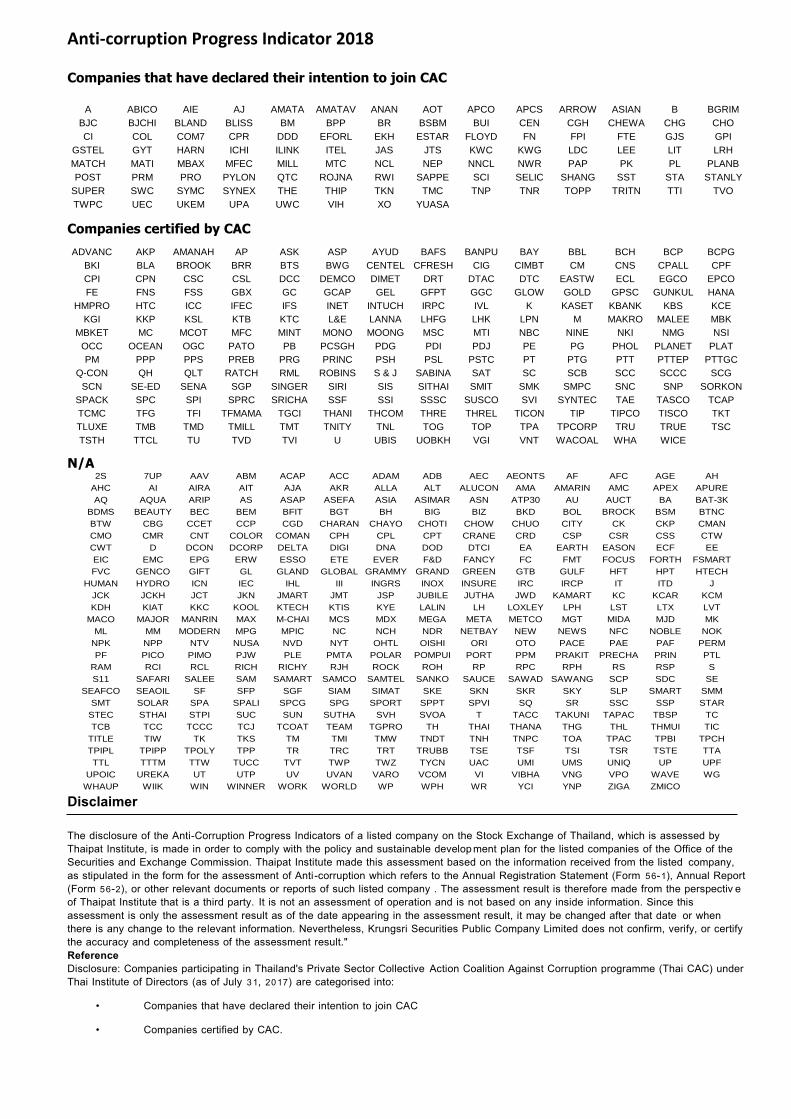
Anti-corruption Progress Indicator 2018
Companies that have declared their intention to join CAC
Companies certified by CAC
N/A
Disclaimer
The disclosure of the Anti-Corruption Progress Indicators of a listed company on the Stock Exchange of Thailand, which is assessed by Thaipat Institute, is made in order to comply with the policy and sustainable development plan for the listed companies of the Office of the Securities and Exchange Commission. Thaipat Institute made this assessment based on the information received from the listed company, as stipulated in the form for the assessment of Anti-corruption which refers to the Annual Registration Statement (Form 56-1), Annual Report (Form 56-2), or other relevant documents or reports of such listed company . The assessment result is therefore made from the perspectiv e of Thaipat Institute that is a third party. It is not an assessment of operation and is not based on any inside information. Since this assessment is only the assessment result as of the date appearing in the assessment result, it may be changed after that date or when there is any change to the relevant information. Nevertheless, Krungsri Securities Public Company Limited does not confirm, verify, or certify the accuracy and completeness of the assessment result." Reference Disclosure: Companies participating in Thailand's Private Sector Collective Action Coalition Against Corruption programme (Thai CAC) under Thai Institute of Directors (as of July 31, 2017) are categorised into:
• Companies that have declared their intention to join CAC
• Companies certified by CAC.
A ABICO AIE AJ AMATA AMATAV ANAN AOT APCO APCS ARROW ASIAN B BGRIM
BJC BJCHI BLAND BLISS BM BPP BR BSBM BUI CEN CGH CHEWA CHG CHO
CI COL COM7 CPR DDD EFORL EKH ESTAR FLOYD FN FPI FTE GJS GPI
GSTEL GYT HARN ICHI ILINK ITEL JAS JTS KWC KWG LDC LEE LIT LRH
MATCH MATI MBAX MFEC MILL MTC NCL NEP NNCL NWR PAP PK PL PLANB
POST PRM PRO PYLON QTC ROJNA RWI SAPPE SCI SELIC SHANG SST STA STANLY
SUPER SWC SYMC SYNEX THE THIP TKN TMC TNP TNR TOPP TRITN TTI TVO
TWPC UEC UKEM UPA UWC VIH XO YUASA
ADVANC AKP AMANAH AP ASK ASP AYUD BAFS BANPU BAY BBL BCH BCP BCPG
BKI BLA BROOK BRR BTS BWG CENTEL CFRESH CIG CIMBT CM CNS CPALL CPF
CPI CPN CSC CSL DCC DEMCO DIMET DRT DTAC DTC EASTW ECL EGCO EPCO
FE FNS FSS GBX GC GCAP GEL GFPT GGC GLOW GOLD GPSC GUNKUL HANA
HMPRO HTC ICC IFEC IFS INET INTUCH IRPC IVL K KASET KBANK KBS KCE
KGI KKP KSL KTB KTC L&E LANNA LHFG LHK LPN M MAKRO MALEE MBK
MBKET MC MCOT MFC MINT MONO MOONG MSC MTI NBC NINE NKI NMG NSI
OCC OCEAN OGC PATO PB PCSGH PDG PDI PDJ PE PG PHOL PLANET PLAT
PM PPP PPS PREB PRG PRINC PSH PSL PSTC PT PTG PTT PTTEP PTTGC
Q-CON QH QLT RATCH RML ROBINS S & J SABINA SAT SC SCB SCC SCCC SCG
SCN SE-ED SENA SGP SINGER SIRI SIS SITHAI SMIT SMK SMPC SNC SNP SORKON
SPACK SPC SPI SPRC SRICHA SSF SSI SSSC SUSCO SVI SYNTEC TAE TASCO TCAP
TCMC TFG TFI TFMAMA TGCI THANI THCOM THRE THREL TICON TIP TIPCO TISCO TKT
TLUXE TMB TMD TMILL TMT TNITY TNL TOG TOP TPA TPCORP TRU TRUE TSC
TSTH TTCL TU TVD TVI U UBIS UOBKH VGI VNT WACOAL WHA WICE
2S 7UP AAV ABM ACAP ACC ADAM ADB AEC AEONTS AF AFC AGE AH
AHC AI AIRA AIT AJA AKR ALLA ALT ALUCON AMA AMARIN AMC APEX APURE
AQ AQUA ARIP AS ASAP ASEFA ASIA ASIMAR ASN ATP30 AU AUCT BA BAT-3K
BDMS BEAUTY BEC BEM BFIT BGT BH BIG BIZ BKD BOL BROCK BSM BTNC
BTW CBG CCET CCP CGD CHARAN CHAYO CHOTI CHOW CHUO CITY CK CKP CMAN
CMO CMR CNT COLOR COMAN CPH CPL CPT CRANE CRD CSP CSR CSS CTW
CWT D DCON DCORP DELTA DIGI DNA DOD DTCI EA EARTH EASON ECF EE
EIC EMC EPG ERW ESSO ETE EVER F&D FANCY FC FMT FOCUS FORTH FSMART
FVC GENCO GIFT GL GLAND GLOBAL GRAMMY GRAND GREEN GTB GULF HFT HPT HTECH
HUMAN HYDRO ICN IEC IHL III INGRS INOX INSURE IRC IRCP IT ITD J
JCK JCKH JCT JKN JMART JMT JSP JUBILE JUTHA JWD KAMART KC KCAR KCM
KDH KIAT KKC KOOL KTECH KTIS KYE LALIN LH LOXLEY LPH LST LTX LVT
MACO MAJOR MANRIN MAX M-CHAI MCS MDX MEGA META METCO MGT MIDA MJD MK
ML MM MODERN MPG MPIC NC NCH NDR NETBAY NEW NEWS NFC NOBLE NOK
NPK NPP NTV NUSA NVD NYT OHTL OISHI ORI OTO PACE PAE PAF PERM
PF PICO PIMO PJW PLE PMTA POLAR POMPUI PORT PPM PRAKIT PRECHA PRIN PTL
RAM RCI RCL RICH RICHY RJH ROCK ROH RP RPC RPH RS RSP S
S11 SAFARI SALEE SAM SAMART SAMCO SAMTEL SANKO SAUCE SAWAD SAWANG SCP SDC SE
SEAFCO SEAOIL SF SFP SGF SIAM SIMAT SKE SKN SKR SKY SLP SMART SMM
SMT SOLAR SPA SPALI SPCG SPG SPORT SPPT SPVI SQ SR SSC SSP STAR
STEC STHAI STPI SUC SUN SUTHA SVH SVOA T TACC TAKUNI TAPAC TBSP TC
TCB TCC TCCC TCJ TCOAT TEAM TGPRO TH THAI THANA THG THL THMUI TIC
TITLE TIW TK TKS TM TMI TMW TNDT TNH TNPC TOA TPAC TPBI TPCH
TPIPL TPIPP TPOLY TPP TR TRC TRT TRUBB TSE TSF TSI TSR TSTE TTA
TTL TTTM TTW TUCC TVT TWP TWZ TYCN UAC UMI UMS UNIQ UP UPF
UPOIC UREKA UT UTP UV UVAN VARO VCOM VI VIBHA VNG VPO WAVE WG
WHAUP WIIK WIN WINNER WORK WORLD WP WPH WR YCI YNP ZIGA ZMICO
www.krungsrisecurities.com
Krungsri Securities Public Company Limited
Headquarters
898 Ploenchit Tower, 3rd Floor, Ploenchit Road, Lumpini Pathumwan, Bangkok 10330 Tel: 0-2659-7000 Fax: 0-2658-5699 Internet Trading: 0-2659-7777
Branches
Emporium 662 Emporium Tower, Fl. 10, Sukhumvit 24 Road Klongton, Klongtoey, Bangkok 10110 Tel: 0-2695-4500 Fax: 0-2695-4599 Central Bangna 589/151 Central City Tower 1 Office, Fl. 27 Bangna-Trad Road, Bangna, Bangkok 10260 Tel: 0-2763-2000 Fax: 0-2399-1448 Rama II 111/917-919 Rama II Road, Smaedum, Bangkhuntien, Bangkok 10150 Tel: 0-2013-7145 Fax: 0-2895-9557 Vibhavadi-rangsit Bank of Ayudhya Public Company Limited 123 Suntowers (B) Building, Vibhavadirangsit Road, Jompol, Jatujak, Bangkok 10900 Tel: 0-2273-8388 Fax: 0-2273-8399 Chonburi 64/17 Sukhumvit Road, Tambol Bang Plasoi, Amphur Muang, Chonburi 20000 Tel: 0-3312-6580 Fax: 0-3312-6588 Hat Yai Branch 90-92-94 Nipat U Tit Nueng Road,Tambol Hat Yai, Amphur Hat Yai, Songkhla 90110 Tel: 0-7422-1229 Fax: 0-7422-1411
Nakhon Pathom 67/1 Ratchadamnoen Road, Tambol Phra Pathom Jaedee, Amphur Muang, Nakhon Pathom 73000 Tel: 0-3427-5500-7 Fax: 0-3421-8989
Suphanburi 249/171-172 Moo 5 Tambol Ta Rahad, Amphur Muang, Suphanburi, 72000 Tel: 0-3596-7981 Fax: 0-3552-2449
Nakhon Ratchasima 168 Chomphon Road, Tambol Nai Muang, Amphur Muang Nakhon Ratchasima, Nakhon Ratchasima 30000 Tel: 0-4425-1211-4 Fax: 0-4425-1215
Khon Kaen 114 Sri Chan Road, Tambol Nai Muang, Amphur Muang, Khon Kaen 40000 Tel: 0-4322-6120 Fax: 0-4322-6180
Chiang Mai 70 Chang Phuak Road, Tambol Sri Phum Amphur Muang, Chiang Mai 50200 Tel: 0-5321-9234-6 Fax: 0-5321-9247
Chiang Rai 231-232 Thamalai Road, Tambol Wiang, Amphur Muang, Chiang Rai 57000 Tel: 0-5371-6489 Fax: 0-5371-6490
Phitsanulok 275/1 Phichaisongkram Road, Tambol Nai Muang, Amphur Muang, Phitsanulok 65000 Tel: 0-5530-3360 Fax: 0-5530-2580
Analyst Team Sector Coverage Central line:
662-659-7000 E-mail
Naphat Chantaraserekul, Head of Research Energy, Petrochemical, Strategy
Construction Materials
ext. 5000 [email protected]
Kittisorn Pruitipat, CFA, FRM Property, ICT, Contractor ext. 5019 [email protected]
Jesada Techahusdin, CFA
Banking, Consumer Finance, Insurance
Insurance Insurance
ext. 5004 [email protected]
Sunthorn Thongthip Food, Transportation, Strategy ext. 5009 [email protected]
Worrapong Tuntiwutthipong Electronic, Automotive, Commerce
Media
ext. 5016 [email protected]
Karun Intrachai Renewable Energy, Food ext. 5010 [email protected]
Teerapol Udomvej Healthcare, Tourism ext. 5012 [email protected]
Kitti Pitakteerabandit Transportation, Media ext. 5008 [email protected]
Artit Jansawang
Mid - Small cap, MAI ext. 5005 [email protected]
Kaushal Ladha, CFA, Assistant Analyst Strategy
Nalinee Praman, Assistant Analyst Mid - Small cap, MAI
Chaiyot Jiwagkul Technical ext. 5006 [email protected]
Fax 662-658-5643 Definition of Ratings
OUTPERFORM - Stocks with an expected capital gain above 10% in the next 12 months for small-caps, above 5% for big-caps
NEUTRAL - Stocks with an expected capital gain between -10% and +10% in the next 12 months for small-caps, -5% to +5% for big-caps
UNDERPERFORM - Stocks with an expected capital gain below 10% in the next 12 months for small-caps, below 5% for big-caps