thai airways international plc. kim eng securities
TRANSCRIPT
1 Investor Relations Department
THAI AIRWAYS INTERNATIONAL PLC.
http://www.thaiairways.com/about-thai/investor-relations/en/investor.html
NDR in USA (May 16-20, 2011)
KIM ENG Securities
2 Investor Relations Department
DISCLAIMER
The information contained herein is intended to represent the Company’s operating and
financial position at a given point in time and may also contain forward looking information
which only reflects expectations based on the prevailing geo-political, economic and
non-controllable factors. Such information has been obtained from sources believed to be
most reliable and the means in analyzing and preparation of such information for disclosure
are based on approved practices and principles in the investment industry. The views are
based on assumption subject to various risks and uncertainties and no assurance is made as
to whether such future events will occur, that projections will be achieved, or that the
assumptions here-in are correct. Consequently no assurance is made as to the accuracy or
completeness of information presented in this document.
This document should not be construed as an investment guide or as an offer or solicitation of an offer to buy or sell the Company’s stock.
3 Investor Relations Department
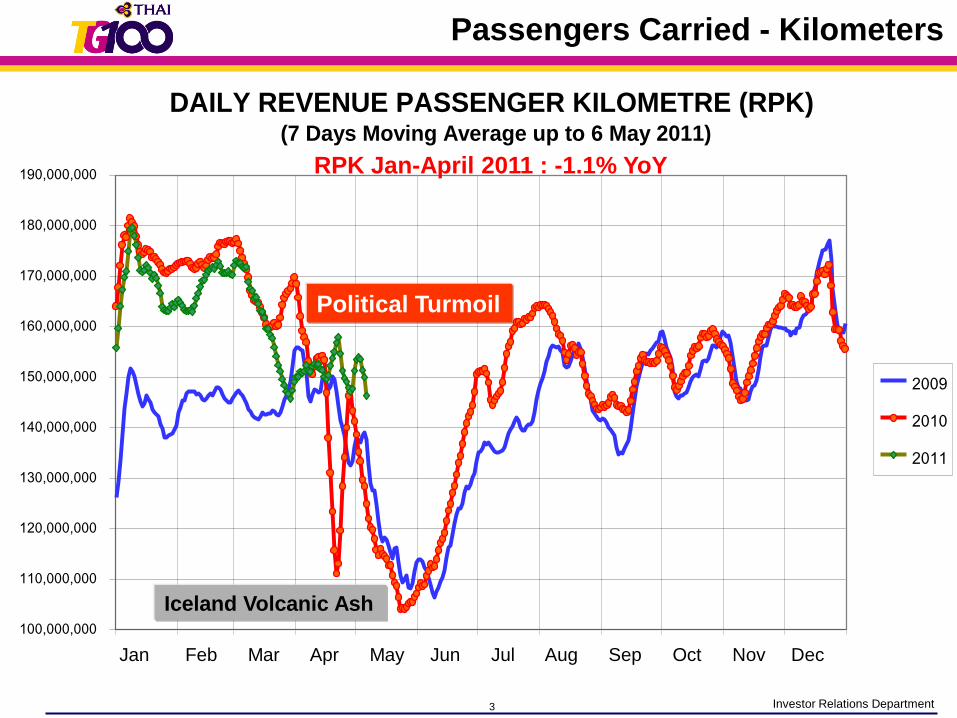
DAILY REVENUE PASSENGER KILOMETRE (RPK) (7 Days Moving Average up to 6 May 2011)
100,000,000
110,000,000
120,000,000
130,000,000
140,000,000
150,000,000
160,000,000
170,000,000
180,000,000
190,000,000
1-Jan 1-Feb 1-Mar 1-Apr 1-May 1-Jun 1-Jul 1-Aug 1-Sep 1-Oct 1-Nov 1-Dec
2009
2010
2011
Passengers Carried - Kilometers
Jan Feb Mar Apr May Jun Jul Aug Sep Oct Nov Dec
Political Turmoil
Iceland Volcanic Ash
RPK Jan-April 2011 : -1.1% YoY
4 Investor Relations Department
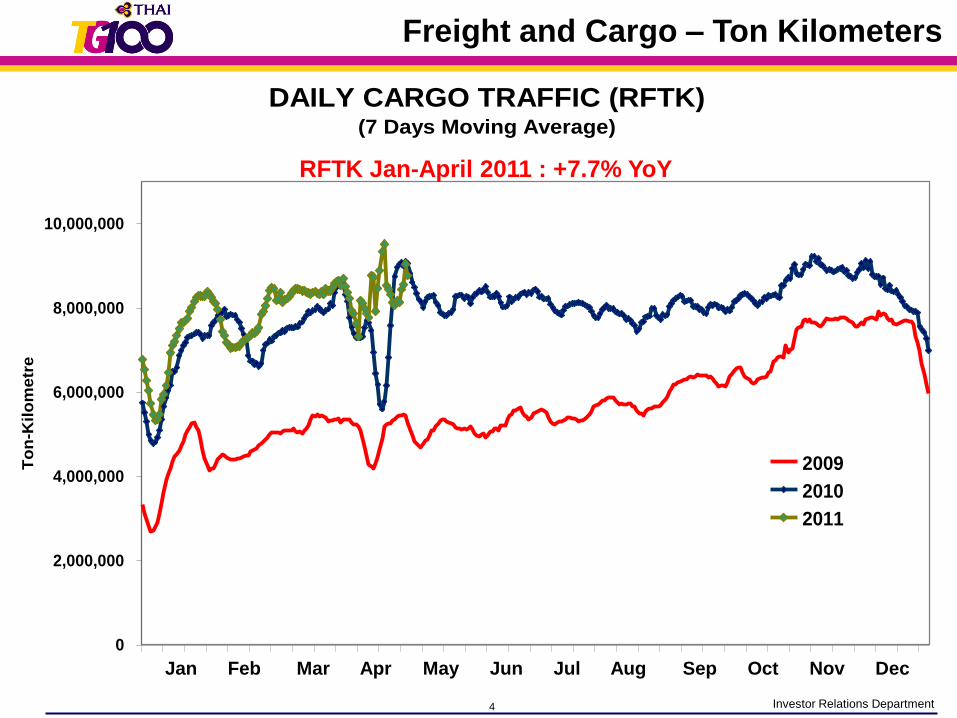
DAILY CARGO TRAFFIC (RFTK)(7 Days Moving Average)
0
2,000,000
4,000,000
6,000,000
8,000,000
10,000,000
J F M A M J J A S O N D
To
n-K
ilo
me
tre
2009
2010
2011
Freight and Cargo – Ton Kilometers
Jan Feb Mar Apr May Jun Jul Aug Sep Oct Nov Dec
DAILY CARGO TRAFFIC (RFTK)(7 Days Moving Average)
0
2,000,000
4,000,000
6,000,000
8,000,000
10,000,000
J F M A M J J A S O N D
To
n-K
ilo
me
tre
2009
2010
2011
RFTK Jan-April 2011 : +7.7% YoY
5 Investor Relations Department
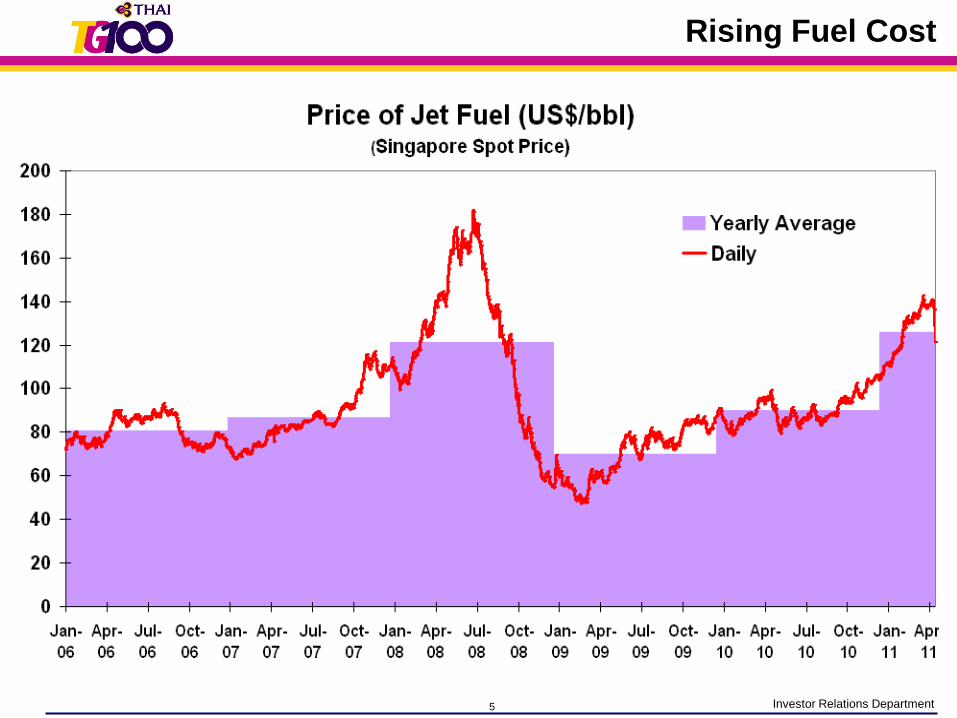
Rising Fuel Cost
6 Investor Relations Department
0
5
10
15
2546
2547
2548
2549
2550
2551
2552
2553
0
5
10
15
20
25
2546
2547
2548
2549
2550
2551
2552
2553
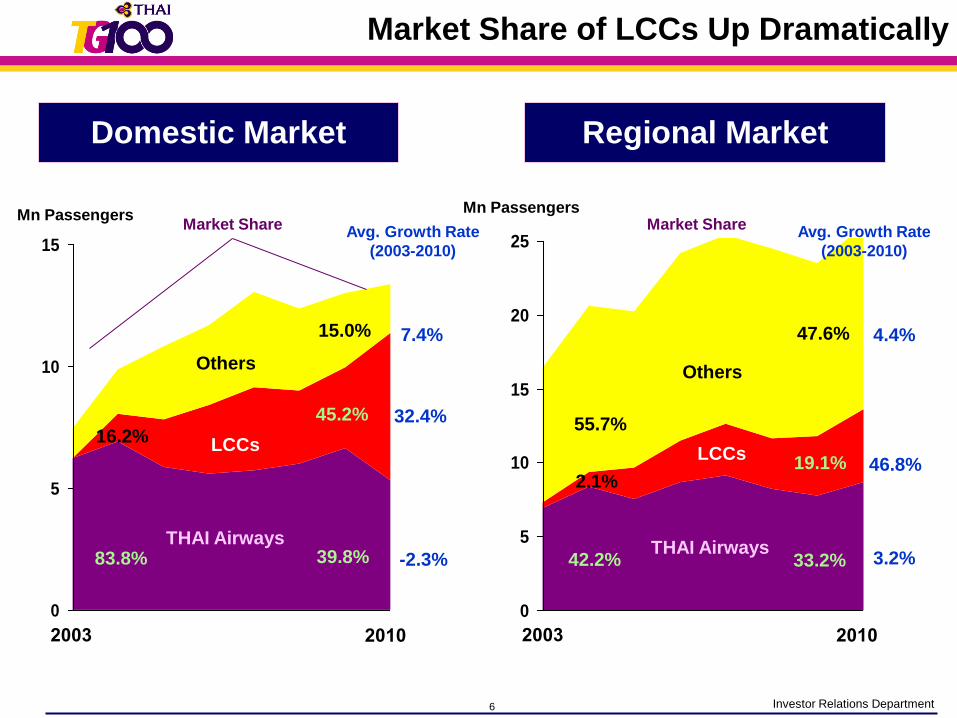
Domestic Market Regional Market
39.8%
45.2%
15.0%
33.2%
19.1%
47.6%
-2.3%
32.4%
7.4%
Avg. Growth Rate
(2003-2010)
3.2%
46.8%
4.4%
83.8%
16.2%
42.2%
55.7%
2.1%
Mn PassengersMarket Share Market Share
Market Share of LCCs Up Dramatically
Mn Passengers
Avg. Growth Rate
(2003-2010)
2003 2010 2003 2010
THAI Airways
LCCs
THAI Airways
Others
LCCs
Others
7 Investor Relations Department
% INTERNET SALE
0.00
1.00
2.00
3.00
4.00
5.00
6.00
7.00
8.00
9.00
10.00
J F M A M J J A S O N D
2009 2010 2011
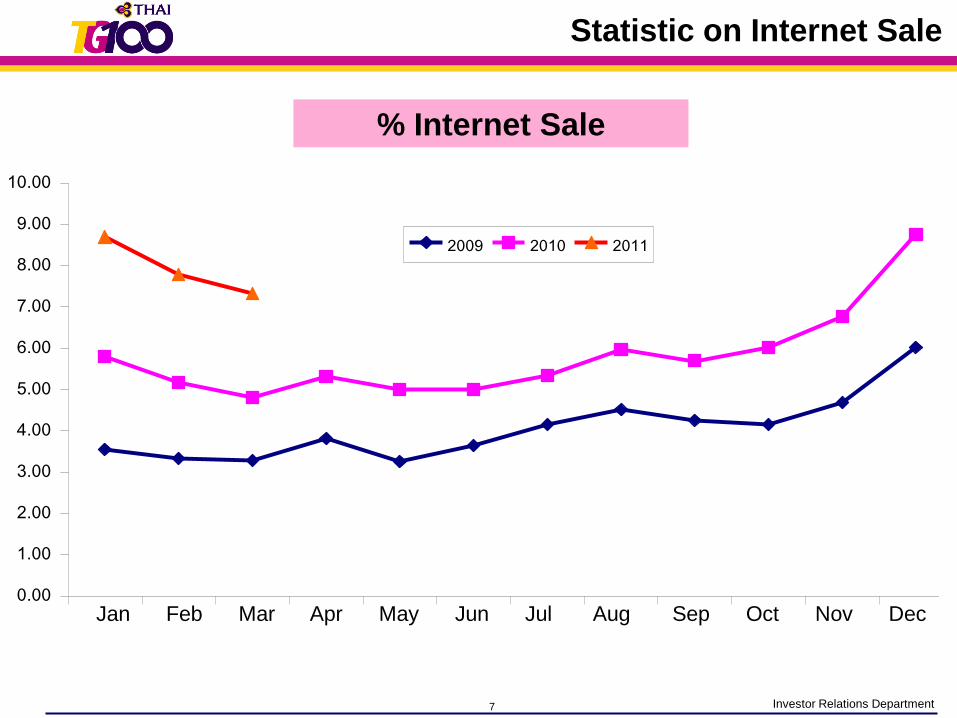
Statistic on Internet Sale
% Internet Sale
Jan Feb Mar Apr May Jun Jul Aug Sep Oct Nov Dec
8 Investor Relations Department
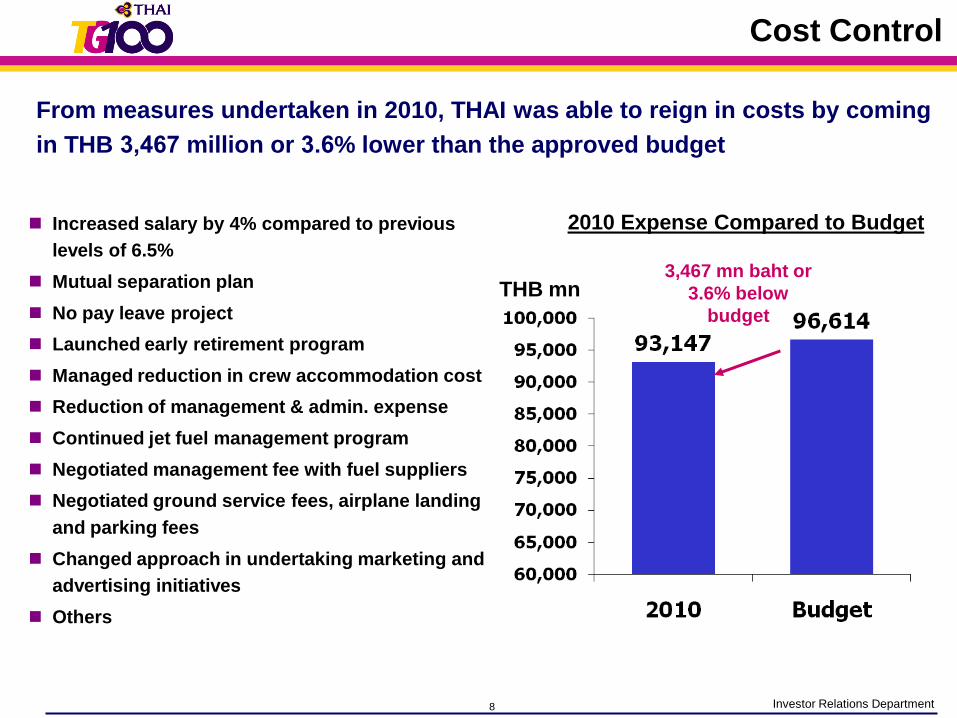
Increased salary by 4% compared to previous
levels of 6.5%
Mutual separation plan
No pay leave project
Launched early retirement program
Managed reduction in crew accommodation cost
Reduction of management & admin. expense
Continued jet fuel management program
Negotiated management fee with fuel suppliers
Negotiated ground service fees, airplane landing
and parking fees
Changed approach in undertaking marketing and
advertising initiatives
Others
From measures undertaken in 2010, THAI was able to reign in costs by coming
in THB 3,467 million or 3.6% lower than the approved budget
3,467 mn baht or
3.6% below
budget
THB mn
2010 Expense Compared to Budget
Cost Control
9 Investor Relations Department
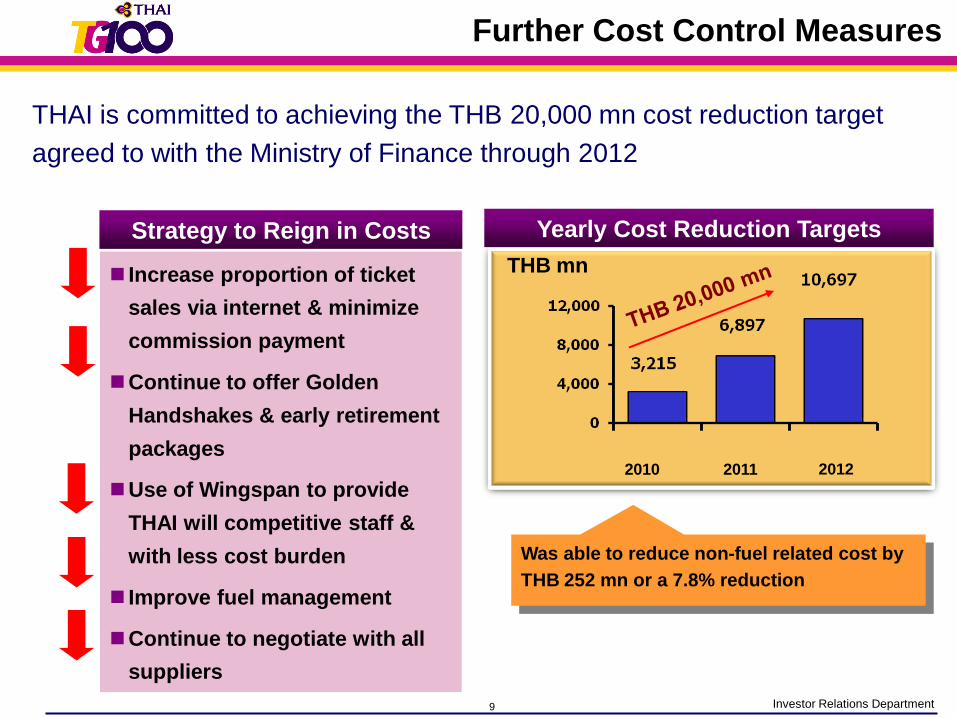
THAI is committed to achieving the THB 20,000 mn cost reduction target
agreed to with the Ministry of Finance through 2012
2010 2011 2012
Strategy to Reign in Costs Yearly Cost Reduction Targets
Increase proportion of ticket
sales via internet & minimize
commission payment
Continue to offer Golden
Handshakes & early retirement
packages
Use of Wingspan to provide
THAI will competitive staff &
with less cost burden
Improve fuel management
Continue to negotiate with all
suppliers
Was able to reduce non-fuel related cost by
THB 252 mn or a 7.8% reduction
THB mn
Further Cost Control Measures

10 Investor Relations Department
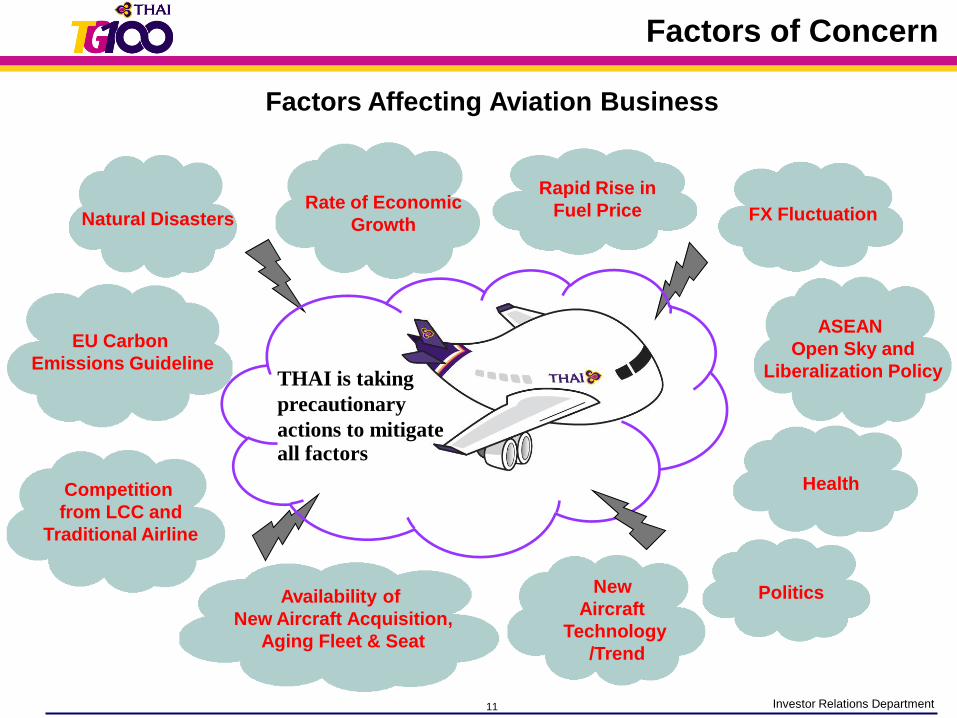
Factors of Concern
11 Investor Relations Department
Factors Affecting Aviation Business
Factors of Concern
ASEAN
Open Sky and
Liberalization Policy
Competition
from LCC and
Traditional Airline
Rapid Rise in
Fuel PriceRate of Economic
GrowthFX Fluctuation
EU Carbon
Emissions Guideline
New
Aircraft
Technology
/Trend
Natural Disasters
Availability of
New Aircraft Acquisition,
Aging Fleet & Seat
THAI is taking
precautionary
actions to mitigate all factors
Politics
Health
12 Investor Relations Department
Industry Outlook
13 Investor Relations Department
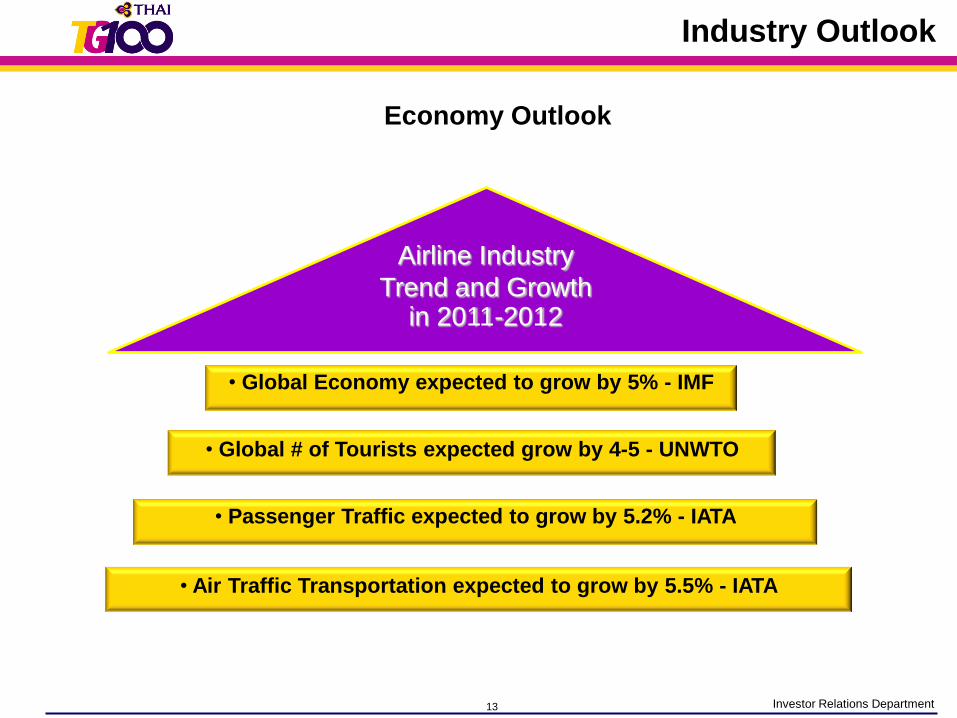
• Global Economy expected to grow by 5% - IMF
Economy Outlook
• Global # of Tourists expected grow by 4-5 - UNWTO
• Passenger Traffic expected to grow by 5.2% - IATA
• Air Traffic Transportation expected to grow by 5.5% - IATA
Airline Industry
Trend and Growth in 2011-2012
Industry Outlook
14 Investor Relations Department
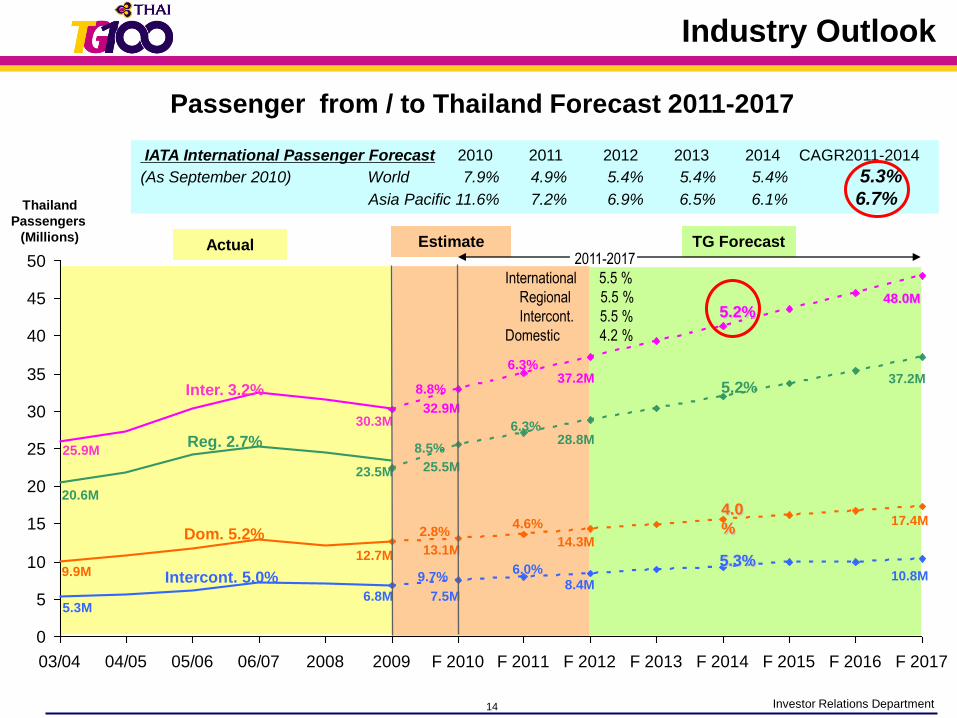
Passenger from / to Thailand Forecast 2011-2017
Industry Outlook
0
5
10
15
20
25
30
35
40
45
50
03/04 04/05 05/06 06/07 2008 2009 F 2010 F 2011 F 2012 F 2013 F 2014 F 2015 F 2016 F 2017
TG ForecastActual
25.9M
20.6M
5.3M
9.9M
Inter. 3.2%
Reg. 2.7%
Intercont. 5.0%
Dom. 5.2%
Thailand
Passengers
(Millions)
2011-2017
International 5.5 %
Regional 5.5 %
Intercont. 5.5 %
Domestic 4.2 %
48.0M
37.2M
17.4M
10.8M
4.0
%
5.3%
5.2%
5.2%
30.3M
23.5M
12.7M
6.8M
IATA International Passenger Forecast 2010 2011 2012 2013 2014 CAGR2011-2014
(As September 2010) World 7.9% 4.9% 5.4% 5.4% 5.4% 5.3%
Asia Pacific 11.6% 7.2% 6.9% 6.5% 6.1% 6.7%
2.8%
9.7%
8.5%
8.8%
Estimate
4.6%
6.0%
6.3%
6.3%
32.9M
25.5M
13.1M
7.5M
37.2M
28.8M
14.3M
8.4M
15 Investor Relations Department
Previous & New Strategy
16 Investor Relations Department
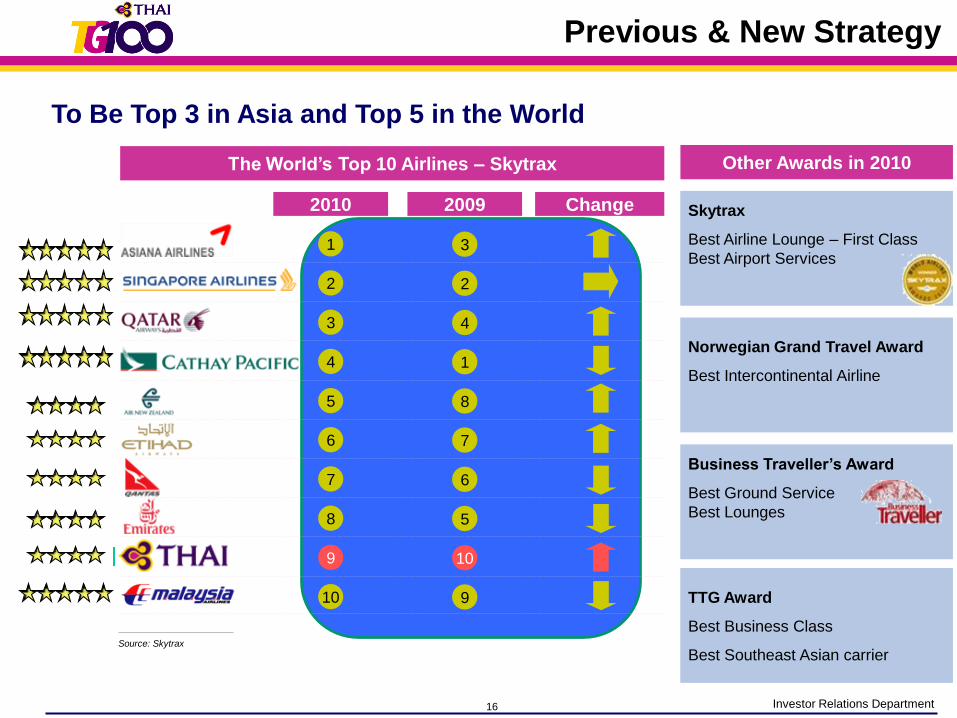
To Be Top 3 in Asia and Top 5 in the World
Business Traveller’s Award
Best Ground Service
Best Lounges
The World’s Top 10 Airlines – Skytrax
2010 Change
1
2
3
4
5
6
7
8
9
10
Skytrax
Best Airline Lounge – First Class
Best Airport Services
Source: Skytrax
3
2
4
1
8
7
6
5
10
9
Other Awards in 2010
2009
Norwegian Grand Travel Award
Best Intercontinental Airline
TTG Award
Best Business Class
Best Southeast Asian carrier
Previous & New Strategy
17 Investor Relations Department
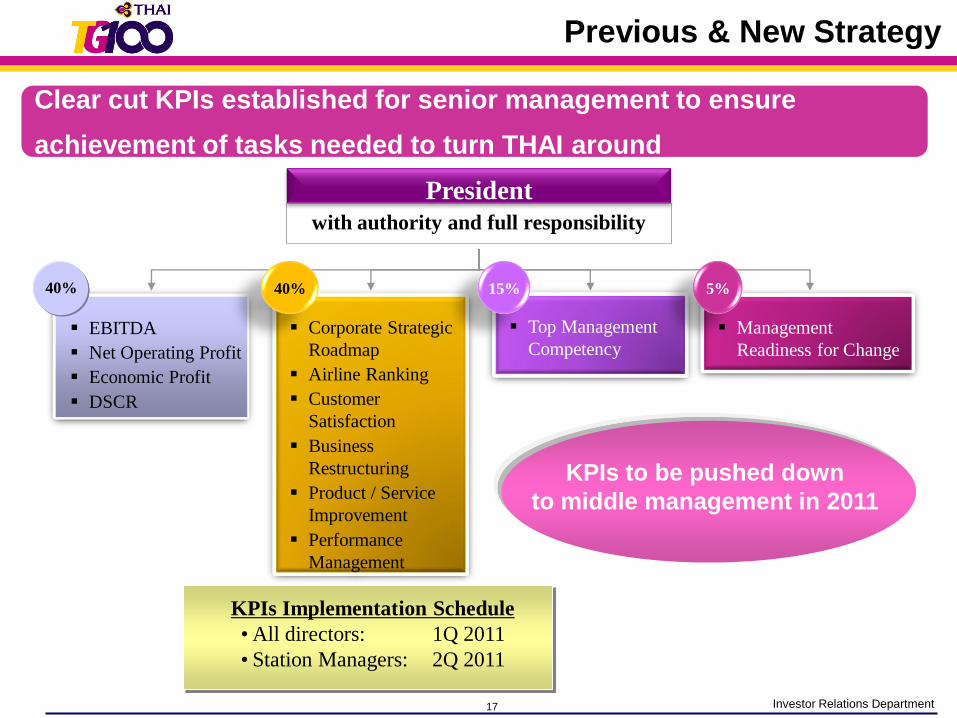
EBITDA
Net Operating Profit
Economic Profit
DSCR
Corporate Strategic
Roadmap
Airline Ranking
Customer
Satisfaction
Business
Restructuring
Product / Service
Improvement
Performance
Management
Top Management
Competency
Management
Readiness for Change
15%40% 5%
President
with authority and full responsibility
KPIs to be pushed down
to middle management in 2011
KPIs Implementation Schedule
• All directors: 1Q 2011
• Station Managers: 2Q 2011
Clear cut KPIs established for senior management to ensure
achievement of tasks needed to turn THAI around
40%
Previous & New Strategy
18 Investor Relations Department
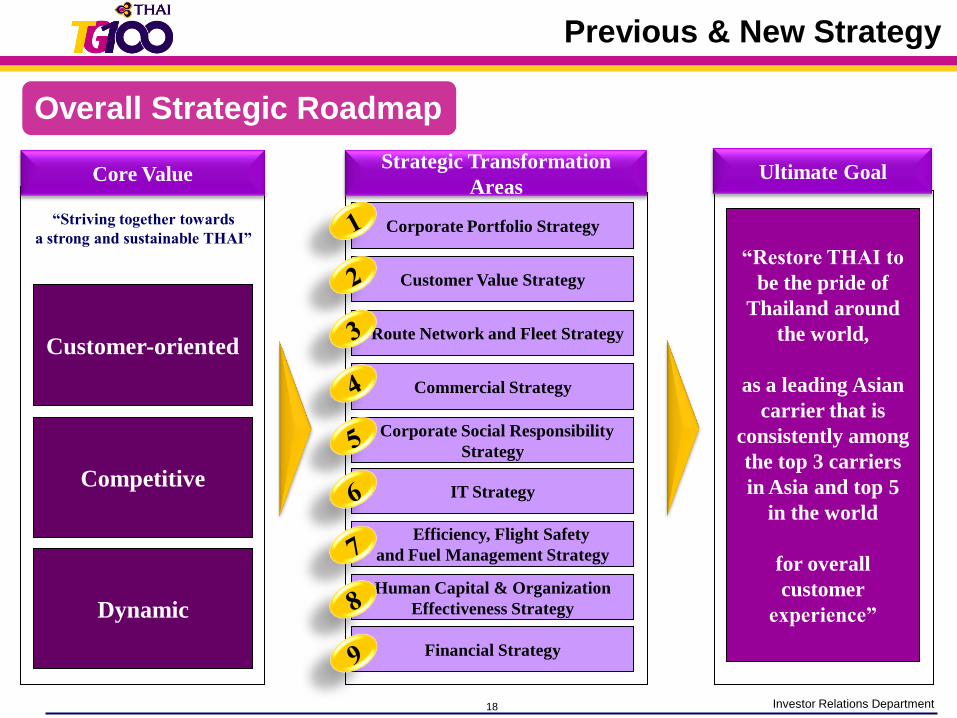
Overall Strategic Roadmap
Ultimate Goal
“Restore THAI to
be the pride of
Thailand around
the world,
as a leading Asian
carrier that is
consistently among
the top 3 carriers
in Asia and top 5
in the world
for overall
customer
experience”
Competitive
Customer-oriented
Dynamic
Core Value
“Striving together towards
a strong and sustainable THAI”
Customer Value Strategy
Commercial Strategy
Corporate Portfolio Strategy
Corporate Social Responsibility
Strategy
Strategic Transformation
Areas
Route Network and Fleet Strategy
Human Capital & Organization
Effectiveness Strategy
Efficiency, Flight Safety
and Fuel Management Strategy
Financial Strategy
IT Strategy
Previous & New Strategy
19 Investor Relations Department
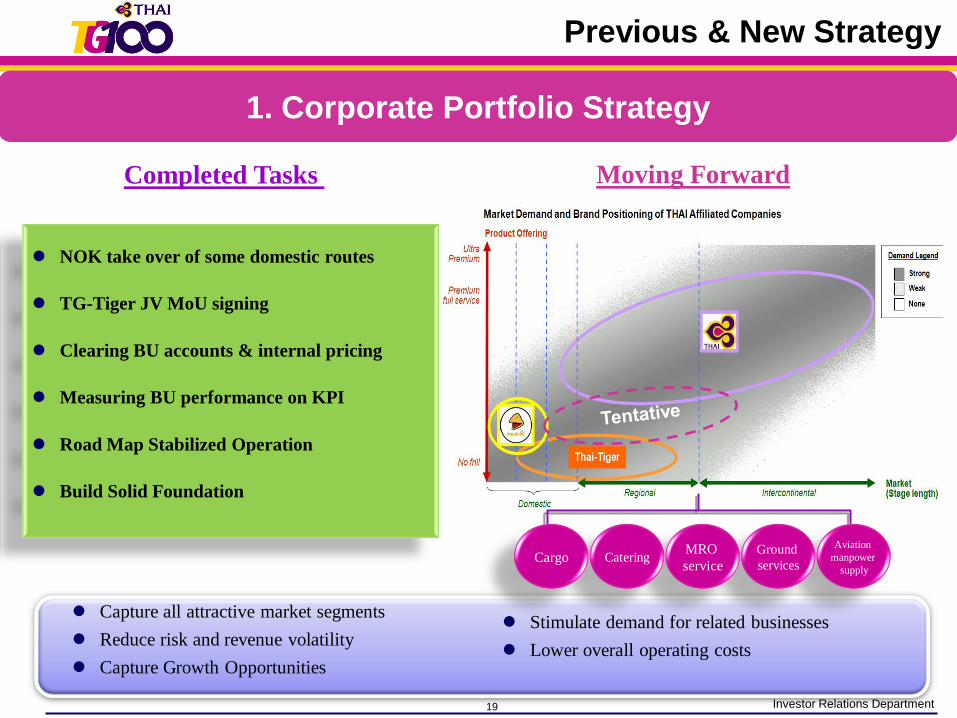
Moving ForwardCompleted Tasks
NOK take over of some domestic routes
TG-Tiger JV MoU signing
Clearing BU accounts & internal pricing
Measuring BU performance on KPI
Road Map Stabilized Operation
Build Solid Foundation
Capture all attractive market segments
Reduce risk and revenue volatility
Capture Growth Opportunities
Stimulate demand for related businesses
Lower overall operating costs
Aviation
manpower
supply
Ground
services
MRO
serviceCateringCargo
1. Corporate Portfolio Strategy
Previous & New Strategy
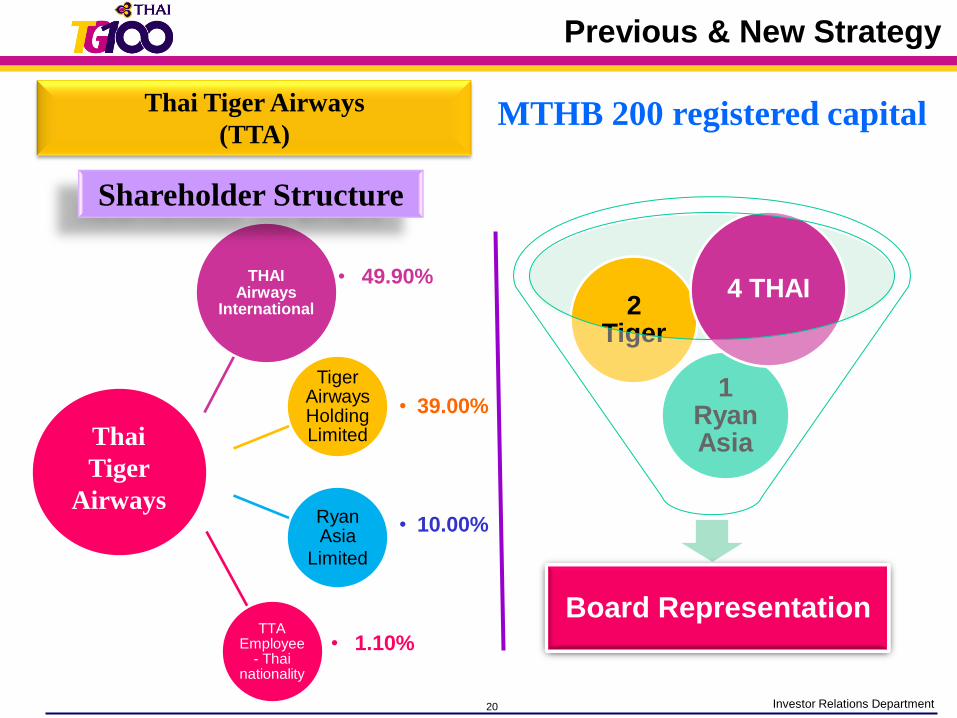
20 Investor Relations Department
Thai Tiger Airways
(TTA)
THAI Airways
International
Tiger Airways Holding Limited
• 39.00%
Ryan Asia
Limited
• 10.00%
TTA Employee
- Thai nationality
• 1.10%
• 49.90%
Thai
Tiger
Airways
MTHB 200 registered capital
Board Representation
1 Ryan Asia
2 Tiger
4 THAI
Shareholder Structure
Previous & New Strategy
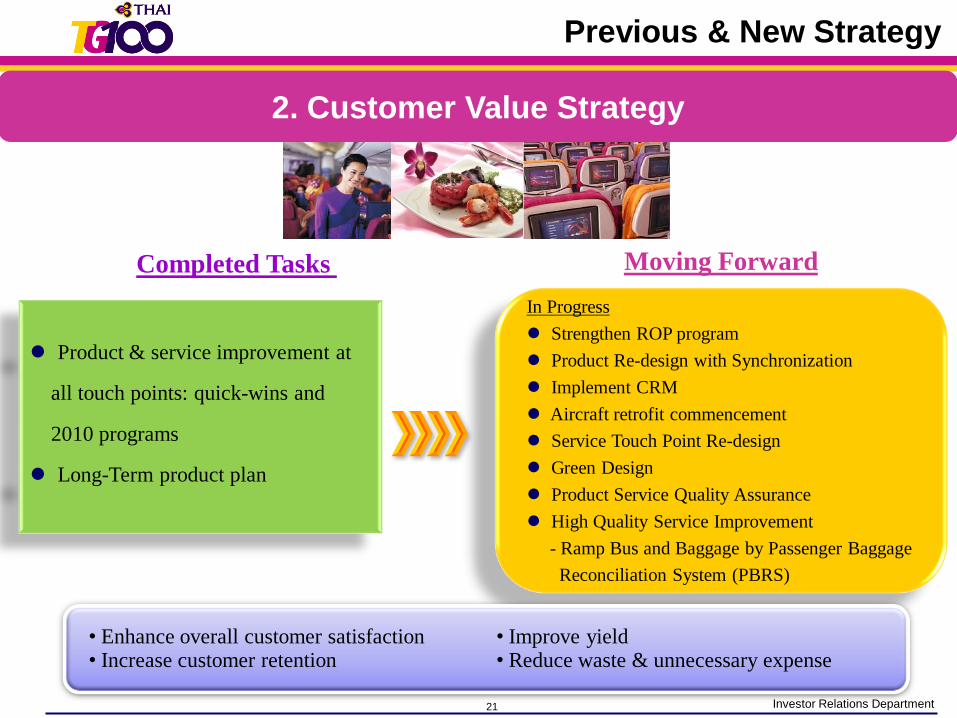
21 Investor Relations Department
Product & service improvement at
all touch points: quick-wins and
2010 programs
Long-Term product plan
In Progress
Strengthen ROP program
Product Re-design with Synchronization
Implement CRM
Aircraft retrofit commencement
Service Touch Point Re-design
Green Design
Product Service Quality Assurance
High Quality Service Improvement
- Ramp Bus and Baggage by Passenger Baggage
Reconciliation System (PBRS)
Moving ForwardCompleted Tasks
• Enhance overall customer satisfaction• Increase customer retention
• Improve yield• Reduce waste & unnecessary expense
2. Customer Value Strategy
Previous & New Strategy
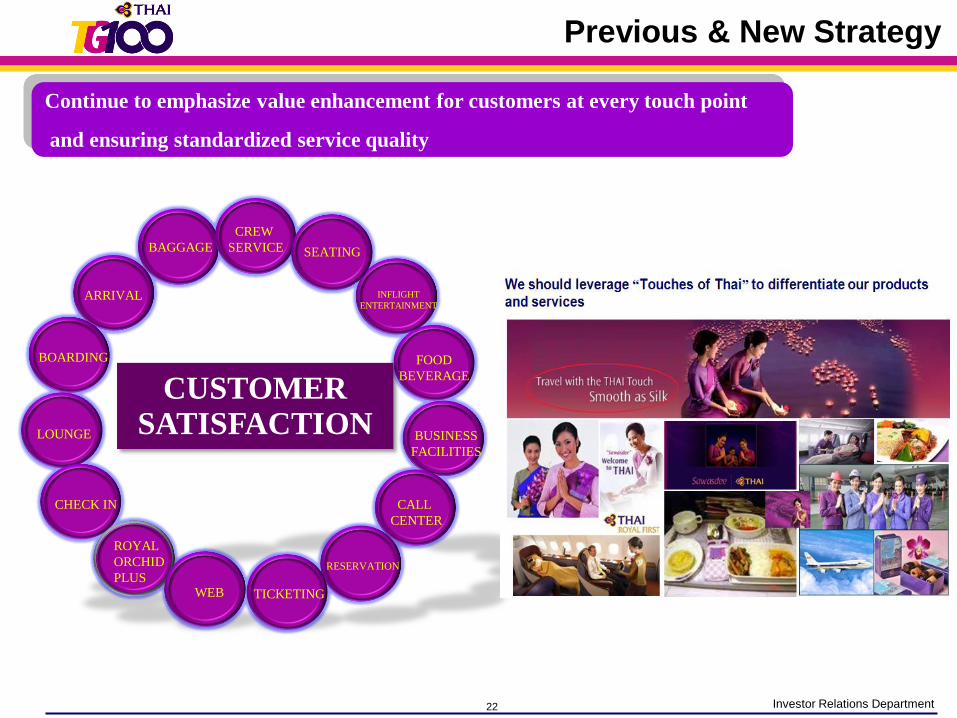
22 Investor Relations Department
CREW
SERVICE SEATING
INFLIGHT
ENTERTAINMENT
FOOD
BEVERAGE
BUSINESS
FACILITIES
CALL
CENTER
RESERVATION
TICKETINGWEB
ROYAL
ORCHID
PLUS
CHECK IN
LOUNGE
BOARDING
ARRIVAL
BAGGAGE
CUSTOMER SATISFACTION
Continue to emphasize value enhancement for customers at every touch point
and ensuring standardized service quality
Previous & New Strategy
23 Investor Relations Department
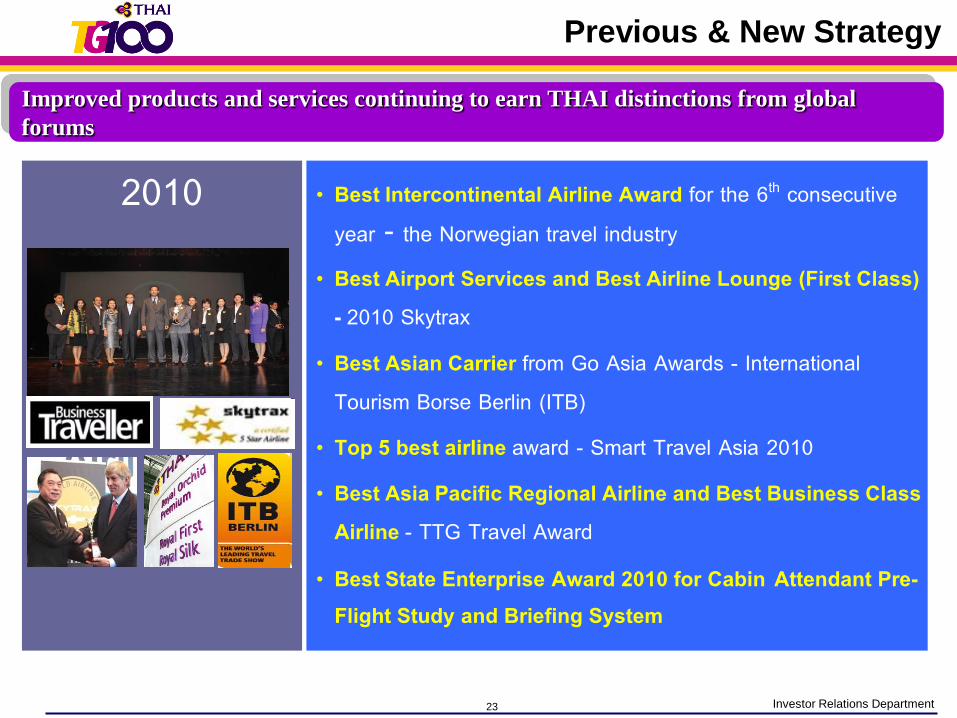
2010 • Best Intercontinental Airline Award for the 6th consecutive year - the Norwegian travel industry
• Best Airport Services and Best Airline Lounge (First Class) - 2010 Skytrax
• Best Asian Carrier from Go Asia Awards - International Tourism Borse Berlin (ITB)
• Top 5 best airline award - Smart Travel Asia 2010
• Best Asia Pacific Regional Airline and Best Business Class Airline - TTG Travel Award
• Best State Enterprise Award 2010 for Cabin Attendant Pre-Flight Study and Briefing System
Improved products and services continuing to earn THAI distinctions from global
forums
Previous & New Strategy
24 Investor Relations Department
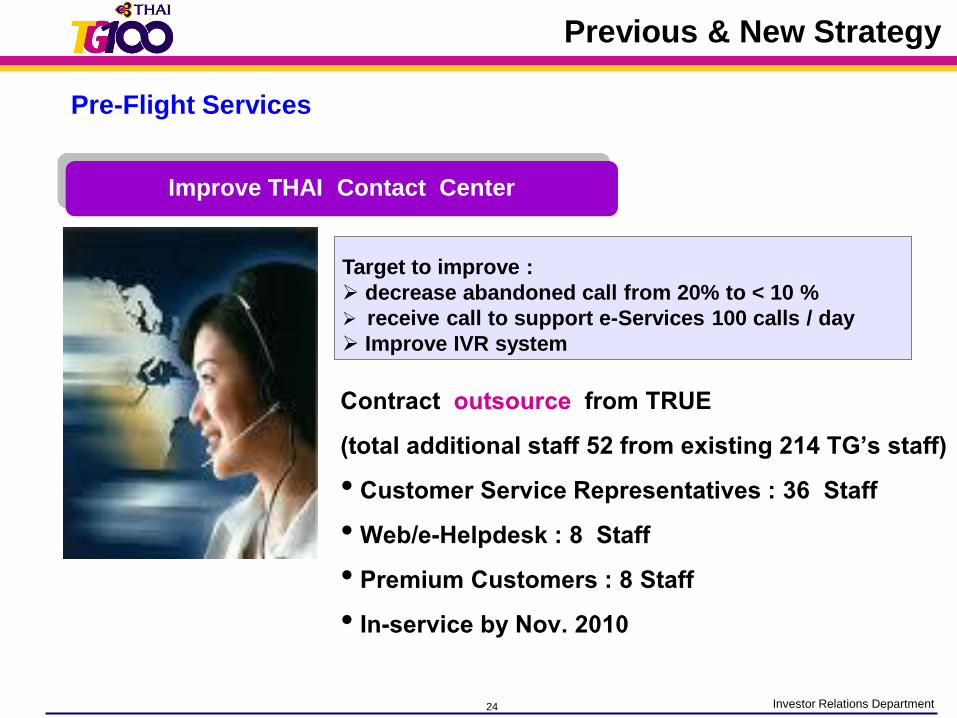
Pre-Flight Services
Improve THAI Contact Center
Contract outsource from TRUE (total additional staff 52 from existing 214 TG’s staff) • Customer Service Representatives : 36 Staff• Web/e-Helpdesk : 8 Staff• Premium Customers : 8 Staff• In-service by Nov. 2010
Target to improve :
decrease abandoned call from 20% to < 10 %
receive call to support e-Services 100 calls / day
Improve IVR system
Previous & New Strategy

25 Investor Relations Department
Moving ForwardCompleted Tasks
• Strengthen THAI’s route network• Enhance efficiency & improve yield
• Appropriate aircraft type selection
• Common product & reliability
• Increase THAI’s market share
Developed Route Network Strategy
for 2013-2017
Discontinued unprofitable routes
and adjust network scheduling
Developed new route networks Bangkok
India
China
Increase Flight
3. Route network and fleet strategy
Previous & New Strategy
26 Investor Relations Department
TG 6
48/6
49 B
KK-F
UK V
V.
TG 6
48/6
49 B
KK-F
UK V
V.
TG 6
46/6
47 B
KK-N
GO
VV.
TG 6
46/6
47 B
KK-N
GO
VV.
TG 6
42/6
71 B
KK-N
RT-H
KT-B
KK
TG 6
42/6
71 B
KK-N
RT-H
KT-B
KK
TG 6
60/6
61 B
KK-H
ND V
V.
TG 6
60/6
61 B
KK-H
ND V
V.
TG 6
42/6
43 B
KK-N
RT V
V.
TG 6
42/6
43 B
KK-N
RT V
V.
TG 6
44/6
45 B
KK-N
GO
VV
.
TG 6
44/6
45 B
KK-N
GO
VV.
TG 6
72/6
73 B
KK-O
SA V
V.
TG 6
72/6
73 B
KK-O
SA V
V.
TG 6
40/6
41 B
KK-N
RT V
V.
TG 6
40/6
41 B
KK-N
RT V
V.TG
622
/623
BKK
-OSA
VV
.
TG 6
22/6
23 B
KK-O
SA V
V.
TG 6
76/6
77 B
KK-N
RT V
V.
TG 6
76/6
77 B
KK-N
RT V
V.
10
20
30
40
50
60
70
80
90
at 14 Mar'11 at 21 Mar'11
TG 6
68/6
69 B
KK-C
AN V
V.
TG 6
68/6
69 B
KK-C
AN V
V.
TG 6
64/6
65 B
KK-S
HA V
V.
TG 6
64/6
65 B
KK-S
HA V
V.
TG 6
78/6
79 B
KK-C
AN V
V.
TG 6
78/6
79 B
KK-C
AN V
V.
TG 6
50/6
51 B
KK-P
US V
V.
TG 6
50/6
51 B
KK-P
US V
V.
TG 6
34/6
35 B
KK-T
PE-S
EL V
V.
TG 6
34/6
35 B
KK-T
PE-S
EL V
V.
TG 6
62/6
63 B
KK-S
HA V
V.
TG 6
62/6
63 B
KK-S
HA V
V.
TG 6
56/6
57 B
KK-S
EL V
V.
TG 6
56/6
57 B
KK-S
EL V
V.
TG 6
58/6
59 B
KK-S
EL V
V.
TG 6
58/6
59 B
KK-S
EL V
V.
TG 6
10/6
11 B
KK-X
MN
VV.
TG 6
10/6
11 B
KK-X
MN
VV.
TG 6
18/6
19 B
KK-C
TU V
V.
TG 6
18/6
19 B
KK-C
TU V
V.
TG 6
12/6
13 B
KK-K
MG
VV.
TG 6
12/6
13 B
KK-K
MG
VV.
TG 6
14/6
15 B
KK-P
EK V
V.
TG 6
14/6
15 B
KK-P
EK V
V.
TG 6
36/6
37 B
KK-T
PE V
V.
TG 6
36/6
37 B
KK-T
PE V
V.
10
20
30
40
50
60
70
80
90
at 14 Mar'11 at 21 Mar'11
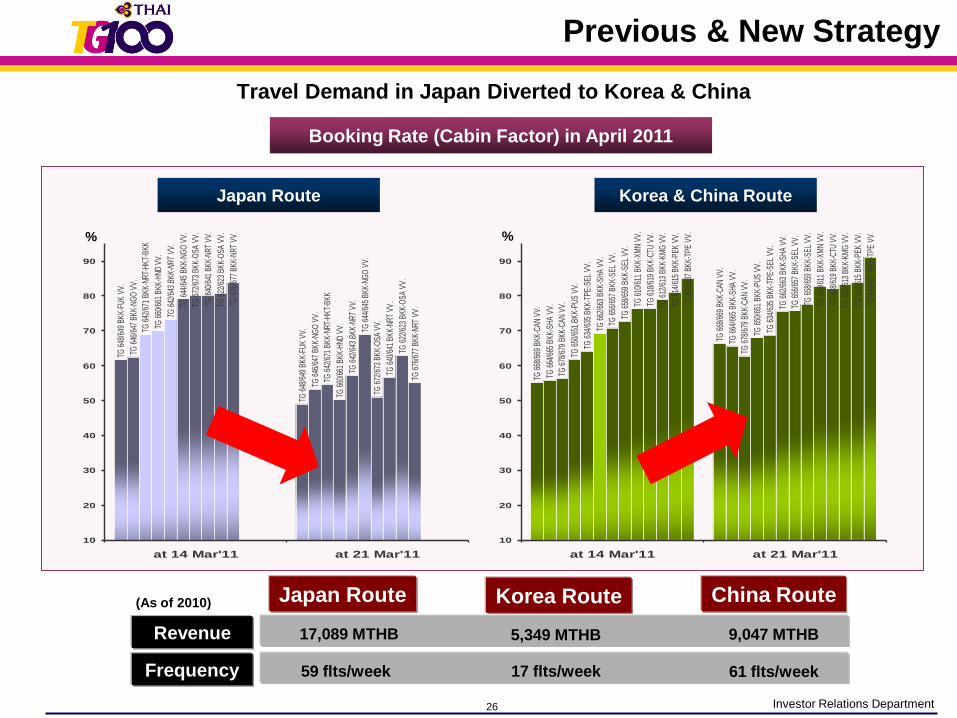
Japan Route Korea & China Route
Booking Rate (Cabin Factor) in April 2011
Travel Demand in Japan Diverted to Korea & China
Previous & New Strategy
Japan Route
17,089 MTHBRevenue
Frequency 59 flts/week
Korea Route China Route
5,349 MTHB 9,047 MTHB
17 flts/week 61 flts/week
(As of 2010)
% %
27 Investor Relations Department
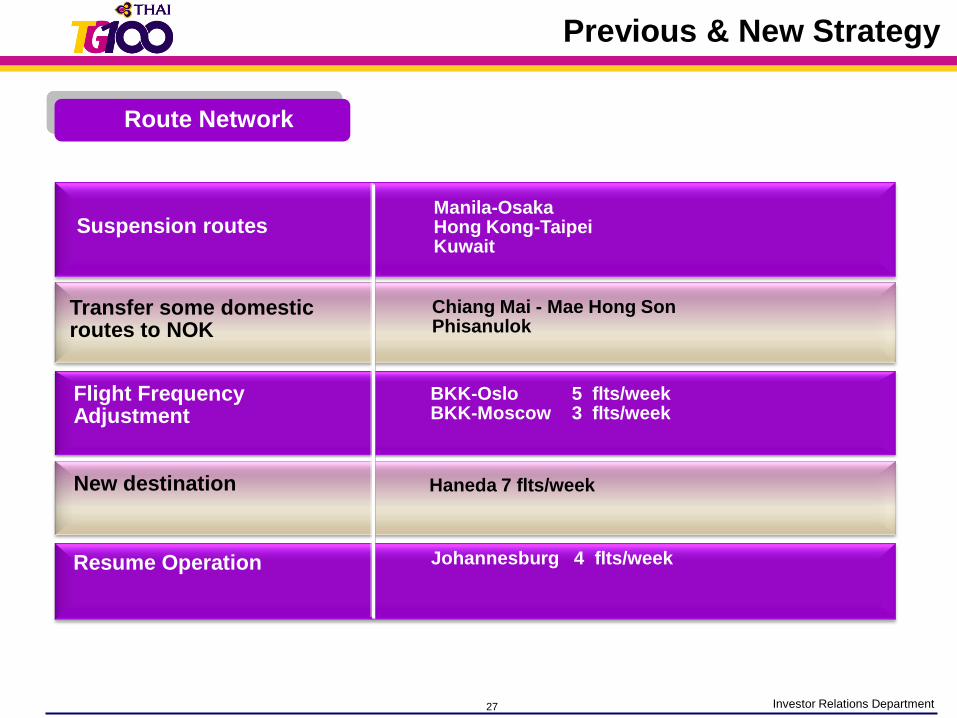
Route Network
Suspension routesManila-Osaka Hong Kong-Taipei Kuwait
Transfer some domestic routes to NOK
Chiang Mai - Mae Hong Son Phisanulok
Flight Frequency Adjustment
BKK-Oslo 5 flts/weekBKK-Moscow 3 flts/week
Resume Operation Johannesburg 4 flts/week
New destination Haneda 7 flts/week
Previous & New Strategy
28 Investor Relations Department
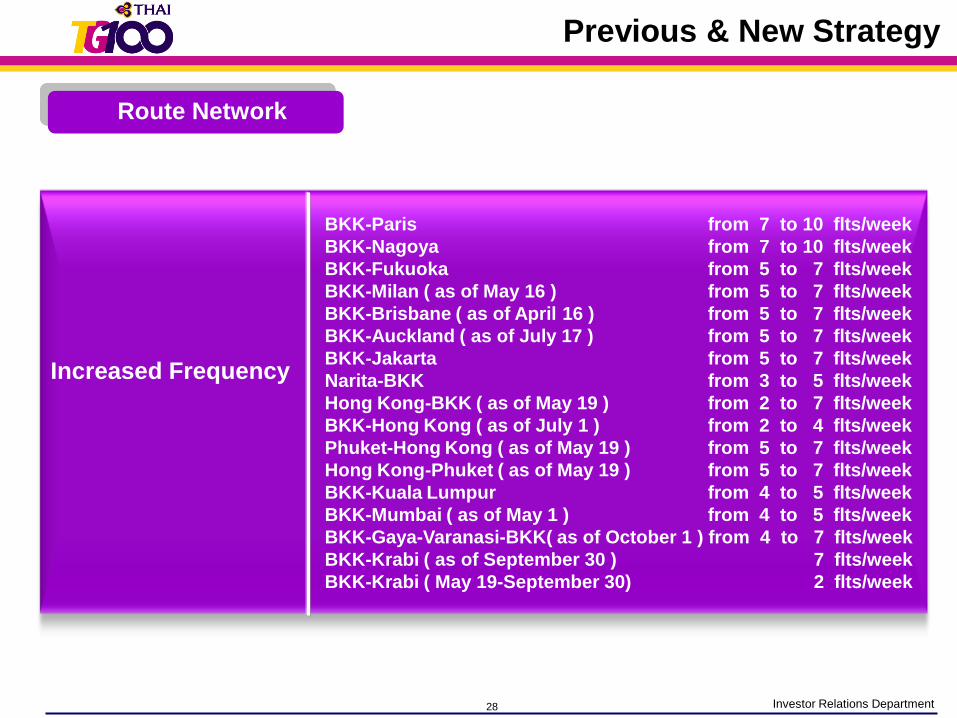
BKK-Paris from 7 to 10 flts/week
BKK-Nagoya from 7 to 10 flts/week
BKK-Fukuoka from 5 to 7 flts/week
BKK-Milan ( as of May 16 ) from 5 to 7 flts/week
BKK-Brisbane ( as of April 16 ) from 5 to 7 flts/week
BKK-Auckland ( as of July 17 ) from 5 to 7 flts/week
BKK-Jakarta from 5 to 7 flts/week
Narita-BKK from 3 to 5 flts/week
Hong Kong-BKK ( as of May 19 ) from 2 to 7 flts/week
BKK-Hong Kong ( as of July 1 ) from 2 to 4 flts/week
Phuket-Hong Kong ( as of May 19 ) from 5 to 7 flts/week
Hong Kong-Phuket ( as of May 19 ) from 5 to 7 flts/week
BKK-Kuala Lumpur from 4 to 5 flts/week
BKK-Mumbai ( as of May 1 ) from 4 to 5 flts/week
BKK-Gaya-Varanasi-BKK( as of October 1 ) from 4 to 7 flts/week
BKK-Krabi ( as of September 30 ) 7 flts/week
BKK-Krabi ( May 19-September 30) 2 flts/week
Increased Frequency
Route Network
Previous & New Strategy
29 Investor Relations Department
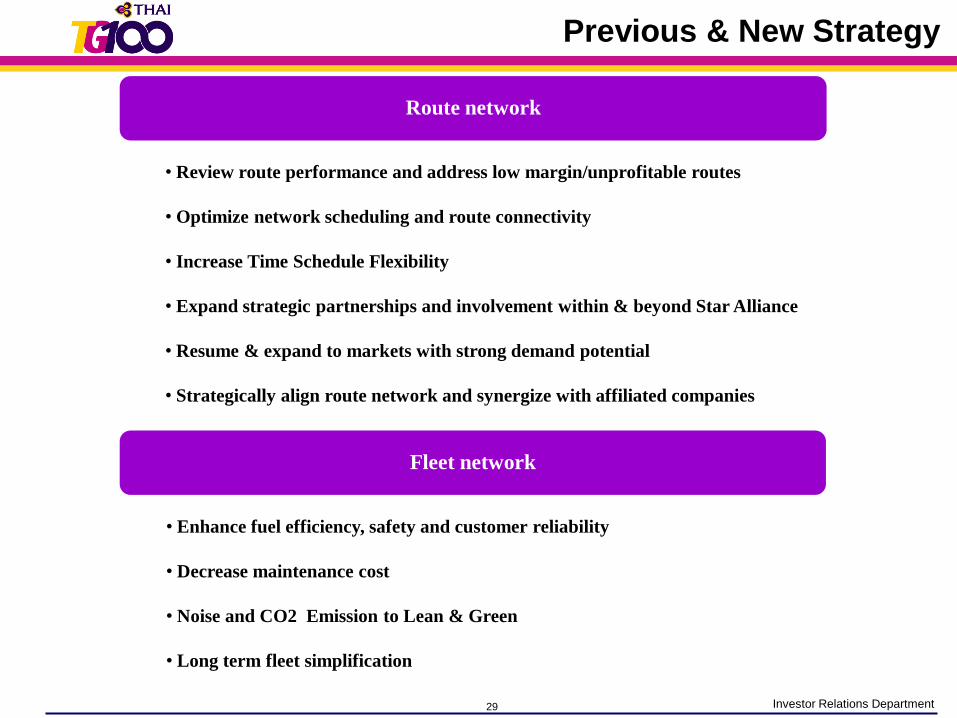
• Review route performance and address low margin/unprofitable routes
• Optimize network scheduling and route connectivity
• Increase Time Schedule Flexibility
• Expand strategic partnerships and involvement within & beyond Star Alliance
• Resume & expand to markets with strong demand potential
• Strategically align route network and synergize with affiliated companies
Route network
Fleet network
• Enhance fuel efficiency, safety and customer reliability
• Decrease maintenance cost
• Noise and CO2 Emission to Lean & Green
• Long term fleet simplification
Previous & New Strategy
30 Investor Relations Department
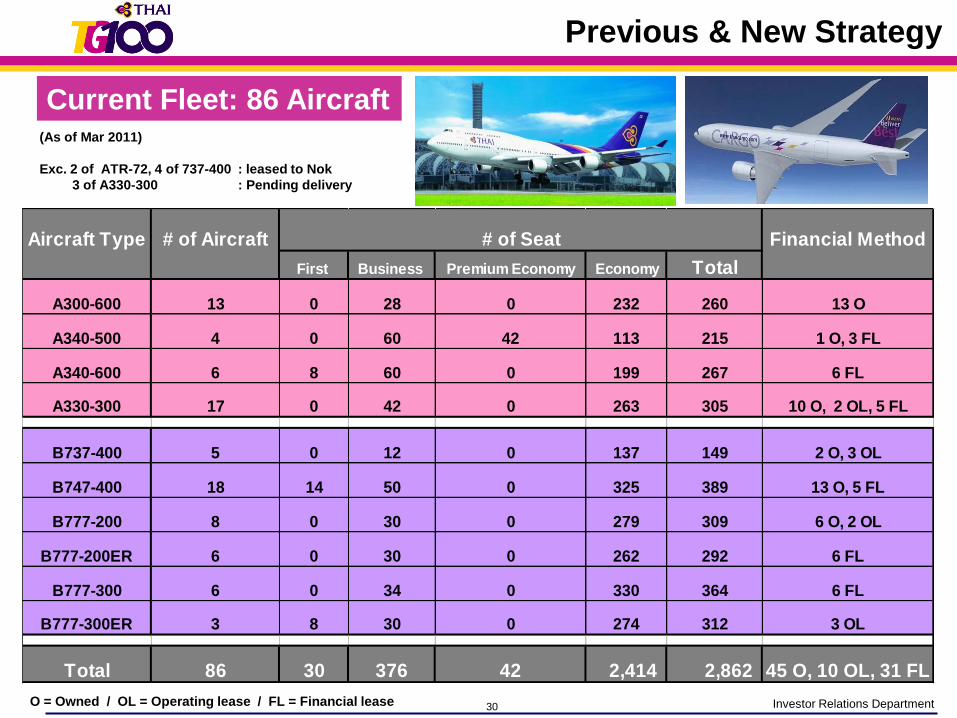
Current Fleet: 86 Aircraft
O = Owned / OL = Operating lease / FL = Financial lease
Previous & New Strategy
Aircraft Type # of Aircraft Financial Method
First Business Premium Economy Economy Total
A300-600 13 0 28 0 232 260 13 O
A340-500 4 0 60 42 113 215 1 O, 3 FL
A340-600 6 8 60 0 199 267 6 FL
A330-300 17 0 42 0 263 305 10 O, 2 OL, 5 FL
B737-400 5 0 12 0 137 149 2 O, 3 OL
B747-400 18 14 50 0 325 389 13 O, 5 FL
B777-200 8 0 30 0 279 309 6 O, 2 OL
B777-200ER 6 0 30 0 262 292 6 FL
B777-300 6 0 34 0 330 364 6 FL
B777-300ER 3 8 30 0 274 312 3 OL
Total 86 30 376 42 2,414 2,862 45 O, 10 OL, 31 FL
# of Seat
(As of Mar 2011)
Exc. 2 of ATR-72, 4 of 737-400 : leased to Nok
3 of A330-300 : Pending delivery
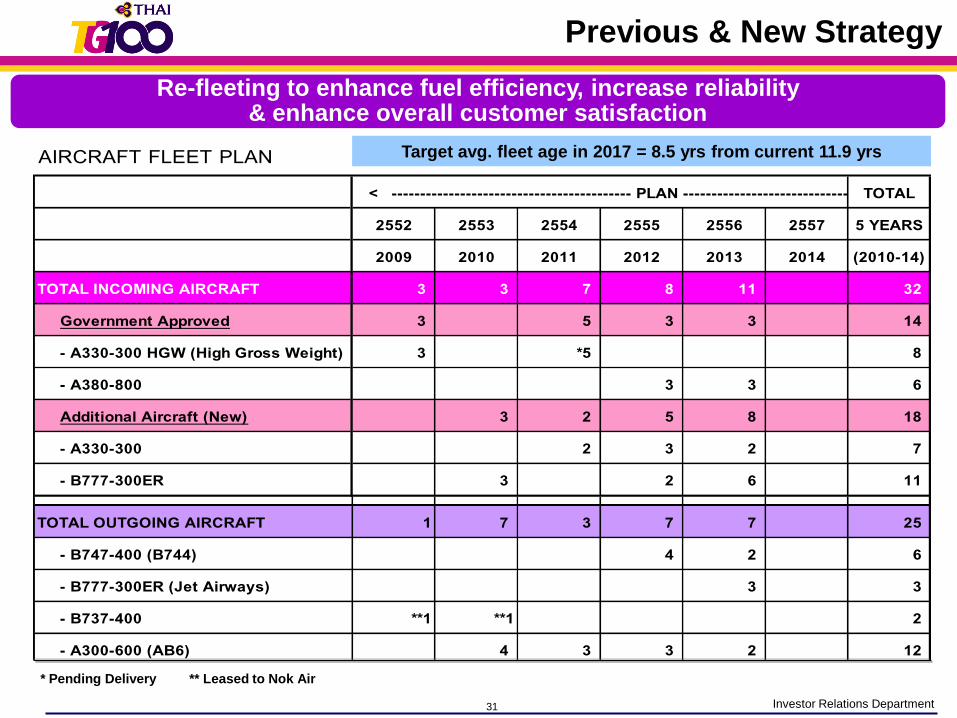
31 Investor Relations Department
AIRCRAFT FLEET PLAN < ------------------------------------------ PLAN --------------------------------------------- >TOTAL
2552 2553 2554 2555 2556 2557 5 YEARS
2009 2010 2011 2012 2013 2014 (2010-14)
TOTAL INCOMING AIRCRAFT 3 3 7 8 11 32
Government Approved 3 5 3 3 14
- A330-300 HGW (High Gross Weight) 3 *5 8
- A380-800 3 3 6
Additional Aircraft (New) 3 2 5 8 18
- A330-300 2 3 2 7
- B777-300ER 3 2 6 11
TOTAL OUTGOING AIRCRAFT 1 7 3 7 7 25
- B747-400 (B744) 4 2 6
- B777-300ER (Jet Airways) 3 3
- B737-400 **1 **1 2
- A300-600 (AB6) 4 3 3 2 12
- ATR-72 **2 2
Re-fleeting to enhance fuel efficiency, increase reliability & enhance overall customer satisfaction
Target avg. fleet age in 2017 = 8.5 yrs from current 11.9 yrs
* Pending Delivery ** Leased to Nok Air
Previous & New Strategy

32 Investor Relations Department
75 Aircraft for Intercontinental and Regional Route
Aircraft Plan 2011-2022
37 Aircraft : 11 narrow-bodied
26 wide-bodiedYear 2011-2017
Year 2018-2022
216,075 MTHB
241,052 MTHB
+ 457,127 MTHB
38 Aircraft : wide-bodied
Previous & New Strategy
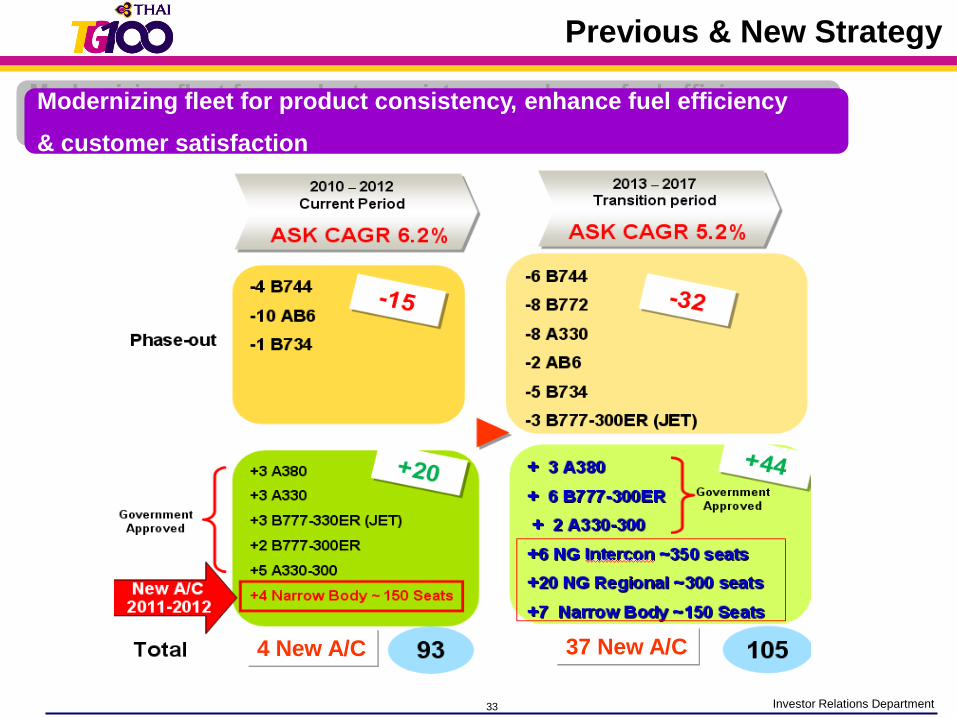
33 Investor Relations Department
Modernizing fleet for product consistency, enhance fuel efficiency
& customer satisfaction
37 New A/C4 New A/C
Previous & New Strategy
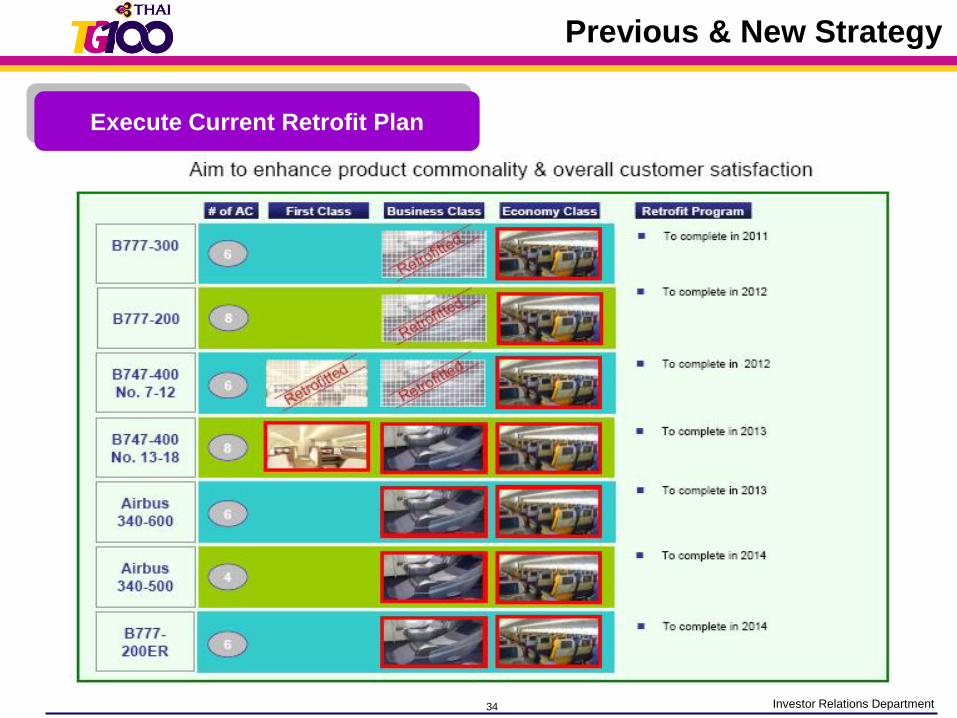
34 Investor Relations Department
Execute Current Retrofit Plan
Previous & New Strategy
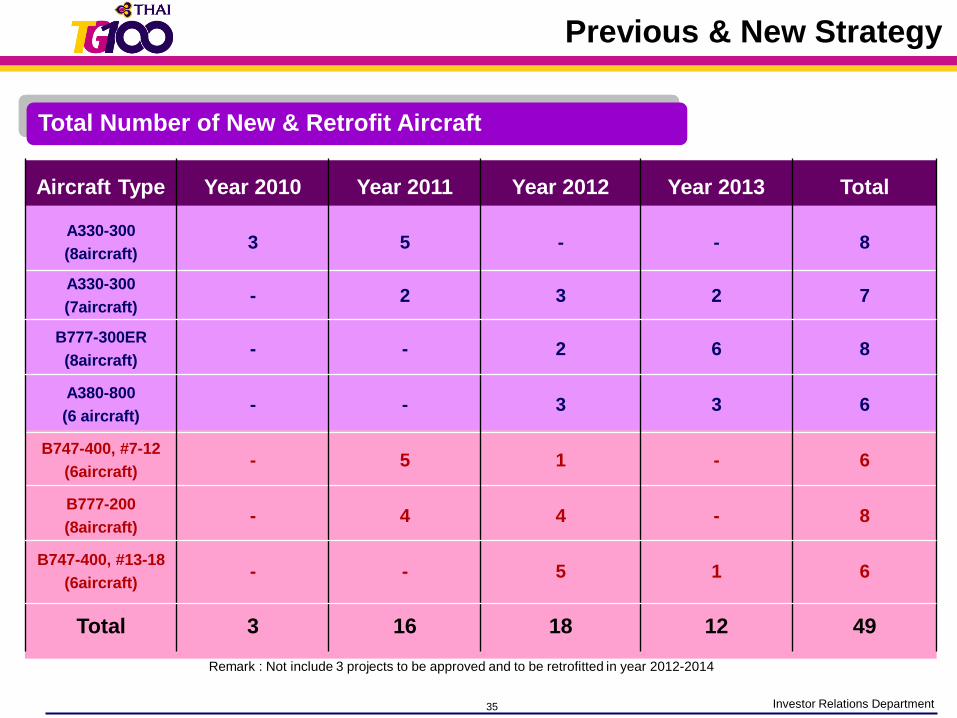
35 Investor Relations Department
Aircraft Type Year 2010 Year 2011 Year 2012 Year 2013 Total
A330-300
(8aircraft)3 5 - - 8
A330-300
(7aircraft)- 2 3 2 7
B777-300ER
(8aircraft)- - 2 6 8
A380-800
(6 aircraft)- - 3 3 6
B747-400, #7-12
(6aircraft)- 5 1 - 6
B777-200
(8aircraft)- 4 4 - 8
B747-400, #13-18
(6aircraft)- - 5 1 6
Total 3 16 18 12 49
Remark : Not include 3 projects to be approved and to be retrofitted in year 2012-2014
Total Number of New & Retrofit Aircraft
Previous & New Strategy
36 Investor Relations Department
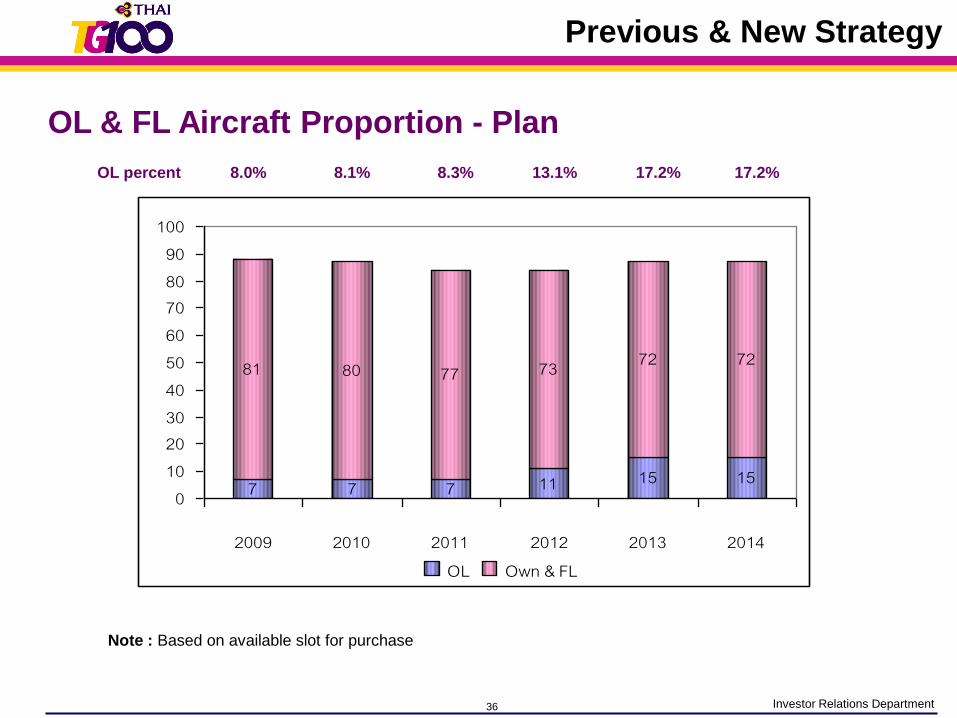
OL & FL Aircraft Proportion - Plan
OL percent 8.0% 8.1% 8.3% 13.1% 17.2% 17.2%
Note : Based on available slot for purchase
7 7 7 11 15 15
81 80 77 73 72 72
0102030405060708090100
2009 2010 2011 2012 2013 2014OL Own & FL
Previous & New Strategy
37 Investor Relations Department
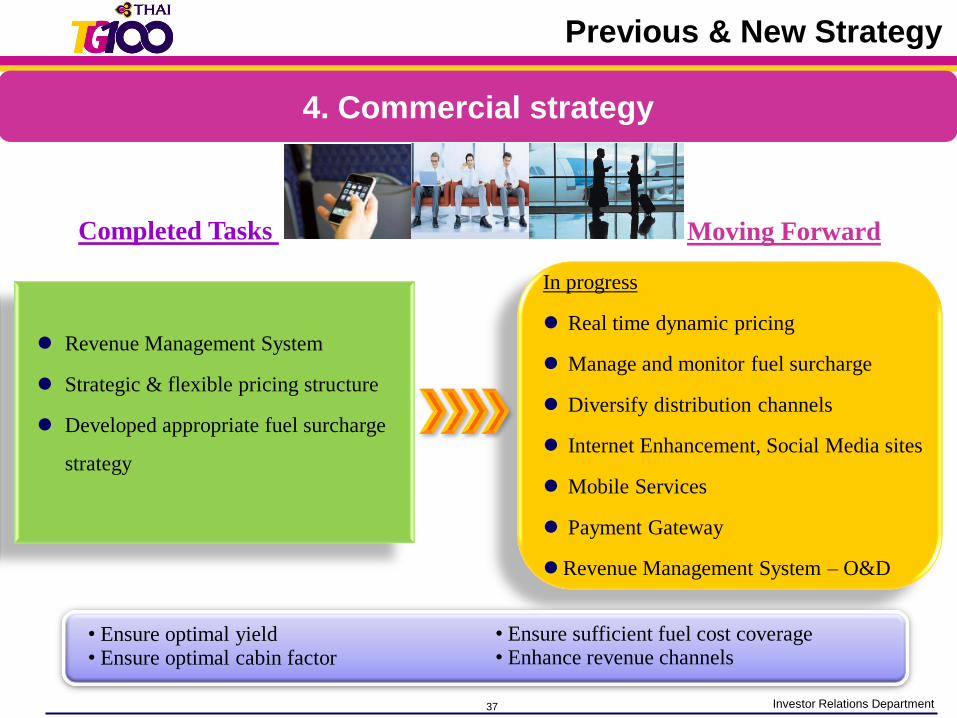
4. Commercial strategy
Moving ForwardCompleted Tasks
• Ensure optimal yield• Ensure optimal cabin factor
• Ensure sufficient fuel cost coverage• Enhance revenue channels
Revenue Management System
Strategic & flexible pricing structure
Developed appropriate fuel surcharge
strategy
In progress
Real time dynamic pricing
Manage and monitor fuel surcharge
Diversify distribution channels
Internet Enhancement, Social Media sites
Mobile Services
Payment Gateway
Revenue Management System – O&D
Previous & New Strategy
38 Investor Relations Department
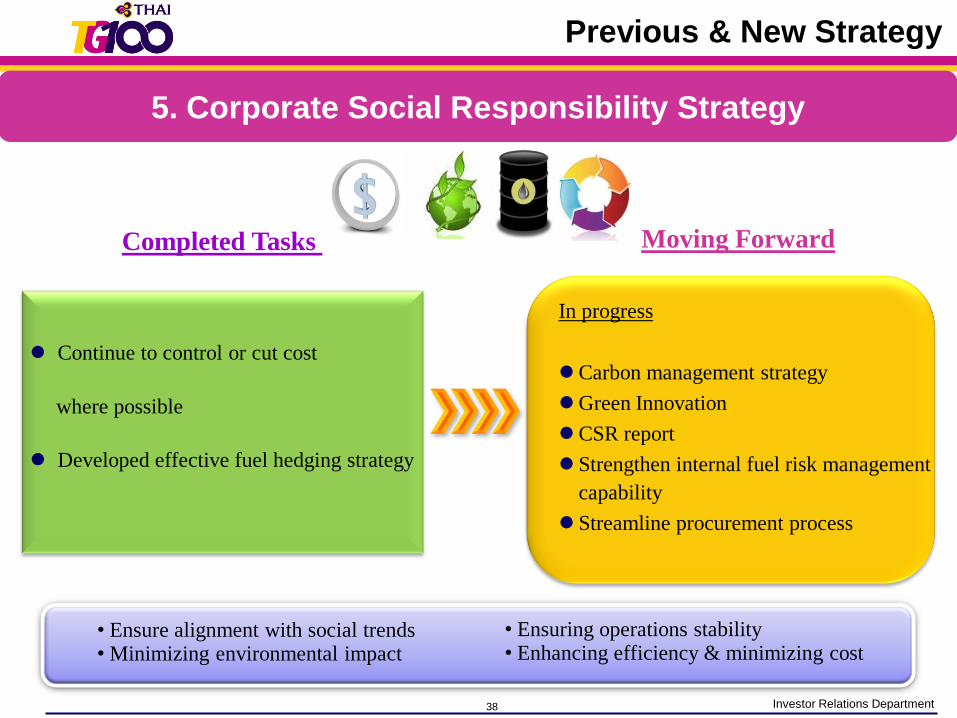
Moving ForwardCompleted Tasks
• Ensure alignment with social trends• Minimizing environmental impact
• Ensuring operations stability• Enhancing efficiency & minimizing cost
Continue to control or cut cost
where possible
Developed effective fuel hedging strategy
In progress
Carbon management strategy
Green Innovation
CSR report
Strengthen internal fuel risk management
capability
Streamline procurement process
5. Corporate Social Responsibility Strategy
Previous & New Strategy
39 Investor Relations Department
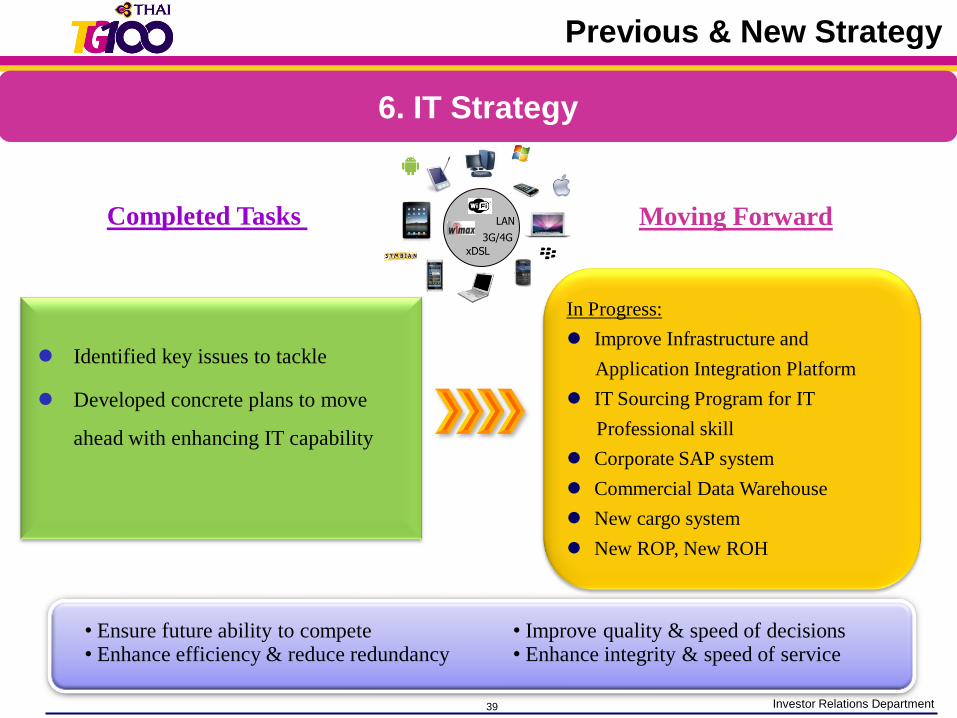
Moving ForwardCompleted Tasks
• Ensure future ability to compete• Enhance efficiency & reduce redundancy
• Improve quality & speed of decisions• Enhance integrity & speed of service
Identified key issues to tackle
Developed concrete plans to move
ahead with enhancing IT capability
LAN
3G/4G
xDSL
In Progress:
Improve Infrastructure and
Application Integration Platform
IT Sourcing Program for IT
Professional skill
Corporate SAP system
Commercial Data Warehouse
New cargo system
New ROP, New ROH
6. IT Strategy
Previous & New Strategy
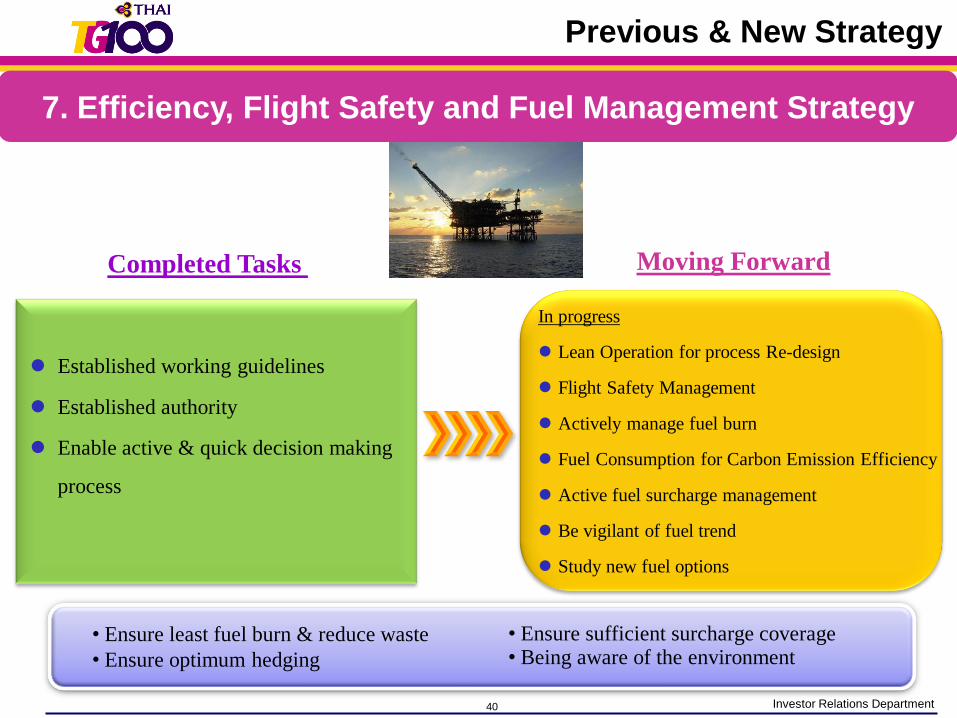
40 Investor Relations Department
Moving ForwardCompleted Tasks
• Ensure least fuel burn & reduce waste
• Ensure optimum hedging
• Ensure sufficient surcharge coverage• Being aware of the environment
Established working guidelines
Established authority
Enable active & quick decision making
process
In progress
Lean Operation for process Re-design
Flight Safety Management
Actively manage fuel burn
Fuel Consumption for Carbon Emission Efficiency
Active fuel surcharge management
Be vigilant of fuel trend
Study new fuel options
7. Efficiency, Flight Safety and Fuel Management Strategy
Previous & New Strategy
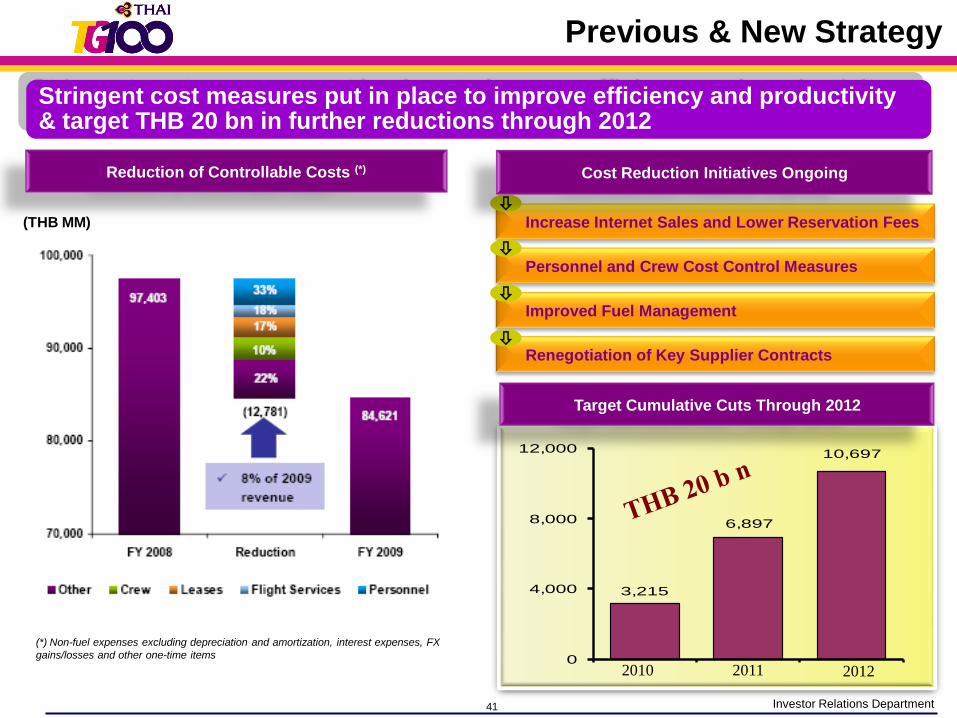
41 Investor Relations Department
(*) Non-fuel expenses excluding depreciation and amortization, interest expenses, FX
gains/losses and other one-time items
Improved Fuel Management
Increase Internet Sales and Lower Reservation Fees
Personnel and Crew Cost Control Measures
Renegotiation of Key Supplier Contracts
(THB MM)
Reduction of Controllable Costs (*) Cost Reduction Initiatives Ongoing
Stringent cost measures put in place to improve efficiency and productivity & target THB 20 bn in further reductions through 2012
10,697
6,897
3,215
0
4,000
8,000
12,000
2010 2011 2012
Target Cumulative Cuts Through 2012
Previous & New Strategy
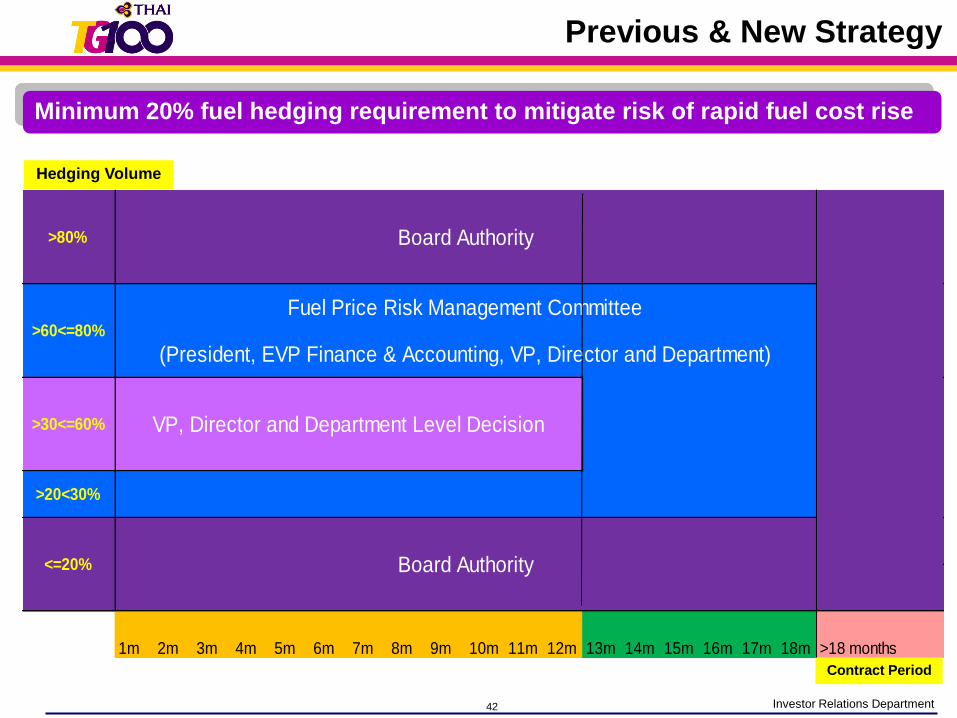
42 Investor Relations Department
>20<30%
1m 2m 3m 4m 5m 6m 7m 8m 9m 10m 11m 12m 13m 14m 15m 16m 17m 18m >18 months
>80%
<=20%
>60<=80%
>30<=60% VP, Director and Department Level Decision
Board Authority
Board Authority
Fuel Price Risk Management Committee
(President, EVP Finance & Accounting, VP, Director and Department)
Hedging Volume
Contract Period
Minimum 20% fuel hedging requirement to mitigate risk of rapid fuel cost rise
Previous & New Strategy
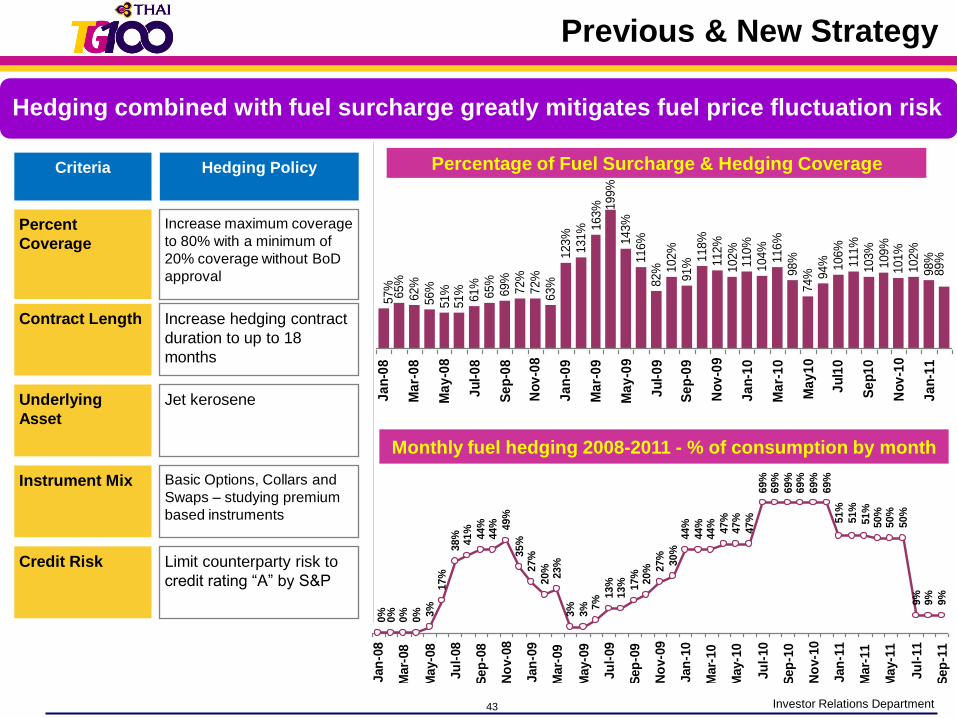
43 Investor Relations Department
Jet keroseneUnderlying
Asset
Limit counterparty risk to
credit rating “A” by S&P
Credit Risk
Basic Options, Collars and
Swaps – studying premium
based instruments
Instrument Mix
Increase hedging contract
duration to up to 18
months
Contract Length
Increase maximum coverage
to 80% with a minimum of
20% coverage without BoD
approval
Percent
Coverage
Hedging PolicyCriteria
Monthly fuel hedging 2008-2011 - % of consumption by month
Percentage of Fuel Surcharge & Hedging Coverage
57%
65%
62%
56%
51%
51%
61%
65%
69%
72%
72%
63%
123%
131% 1
63% 1
99%
143%
116%
82% 1
02%
91%
118%
112%
102%
110%
104%
116%
98%
74% 94% 106%
111%
103%
109%
101%
102%
98%
89%
Ja
n-0
8
Ma
r-0
8
Ma
y-0
8
Ju
l-0
8
Se
p-0
8
No
v-0
8
Ja
n-0
9
Ma
r-0
9
Ma
y-0
9
Ju
l-0
9
Se
p-0
9
No
v-0
9
Ja
n-1
0
Ma
r-1
0
Ma
y1
0
Ju
l10
Se
p1
0
No
v-1
0
Ja
n-1
1
0%
0%
0%
0% 3
%17
%
38
%41
%
44
%44
% 49
%
35
%27
%
20
%23
%
3%
3% 7
%
13
%13
% 17
%20
% 27
%
30
%44
%
44
%44
%
47
%47
%
47
%
69
%69
%
69
%69
%
69
%
69
%
50
%50
%
50
%
9%
9%
9%
51
%
51
%
51
%
Jan
-08
Mar-
08
May-0
8
Ju
l-08
Sep
-08
No
v-0
8
Jan
-09
Mar-
09
May-0
9
Ju
l-09
Sep
-09
No
v-0
9
Jan
-10
Mar-
10
May-1
0
Ju
l-10
Sep
-10
No
v-1
0
Jan
-11
Mar-
11
May-1
1
Ju
l-11
Sep
-11
Hedging combined with fuel surcharge greatly mitigates fuel price fluctuation risk
Previous & New Strategy
44 Investor Relations Department
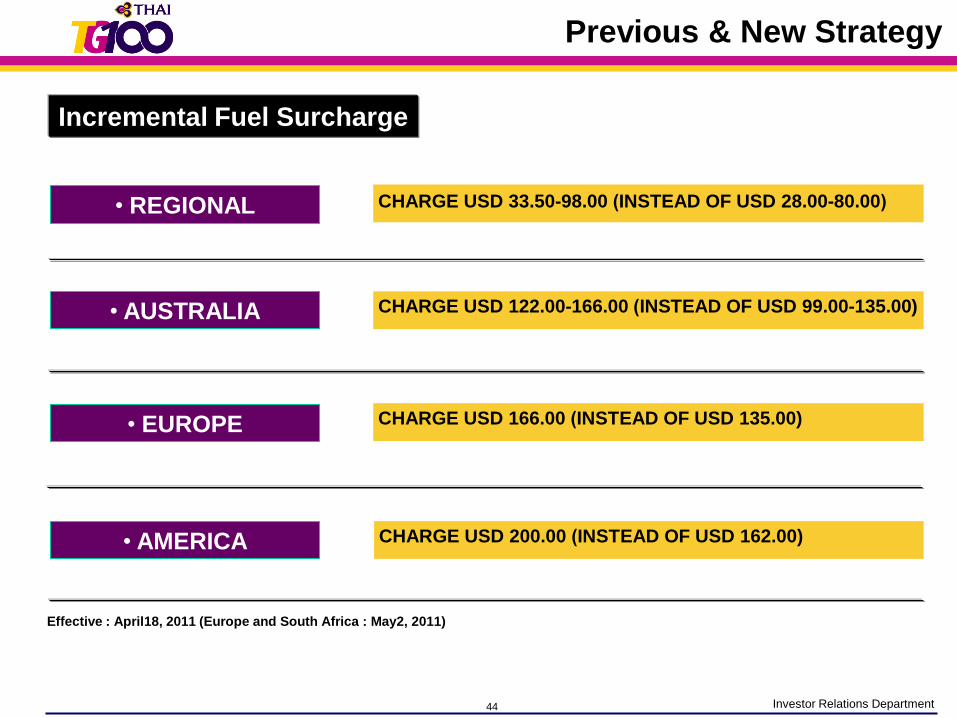
• REGIONAL
• AMERICA
Effective : April18, 2011 (Europe and South Africa : May2, 2011)
• AUSTRALIA
• EUROPE
CHARGE USD 33.50-98.00 (INSTEAD OF USD 28.00-80.00)
Incremental Fuel Surcharge
CHARGE USD 122.00-166.00 (INSTEAD OF USD 99.00-135.00)
CHARGE USD 166.00 (INSTEAD OF USD 135.00)
CHARGE USD 200.00 (INSTEAD OF USD 162.00)
Previous & New Strategy
45 Investor Relations Department
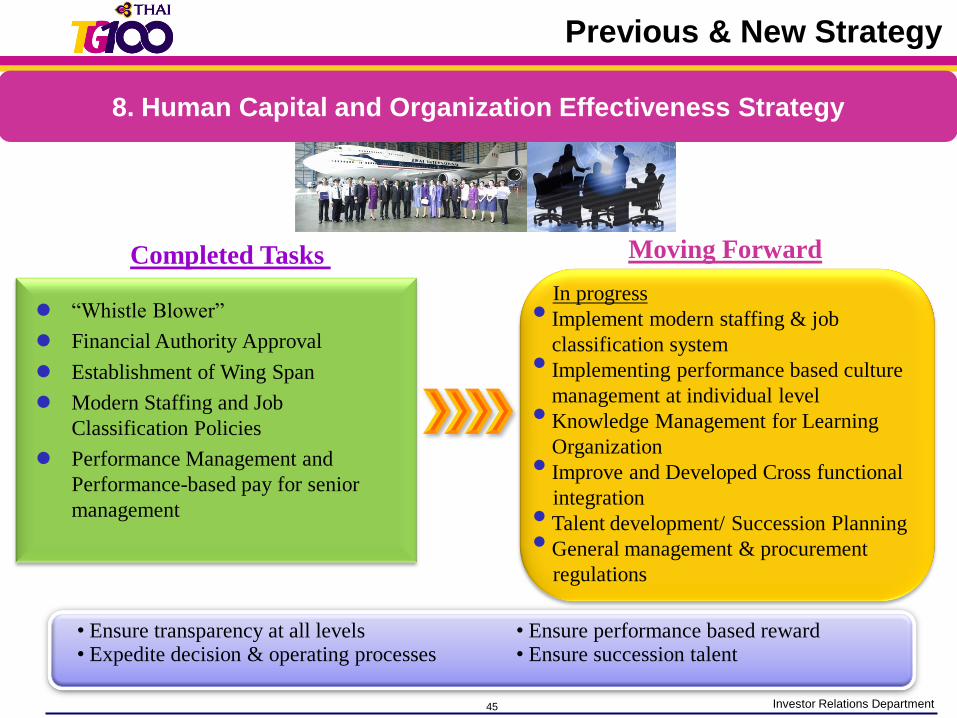
Moving ForwardCompleted Tasks
• Ensure transparency at all levels• Expedite decision & operating processes
• Ensure performance based reward• Ensure succession talent
“Whistle Blower”
Financial Authority Approval
Establishment of Wing Span
Modern Staffing and Job
Classification Policies
Performance Management and
Performance-based pay for senior
management
In progress
• Implement modern staffing & job
classification system
• Implementing performance based culture
management at individual level
• Knowledge Management for Learning
Organization
• Improve and Developed Cross functional
integration
• Talent development/ Succession Planning
• General management & procurement
regulations
8. Human Capital and Organization Effectiveness Strategy
Previous & New Strategy
46 Investor Relations Department
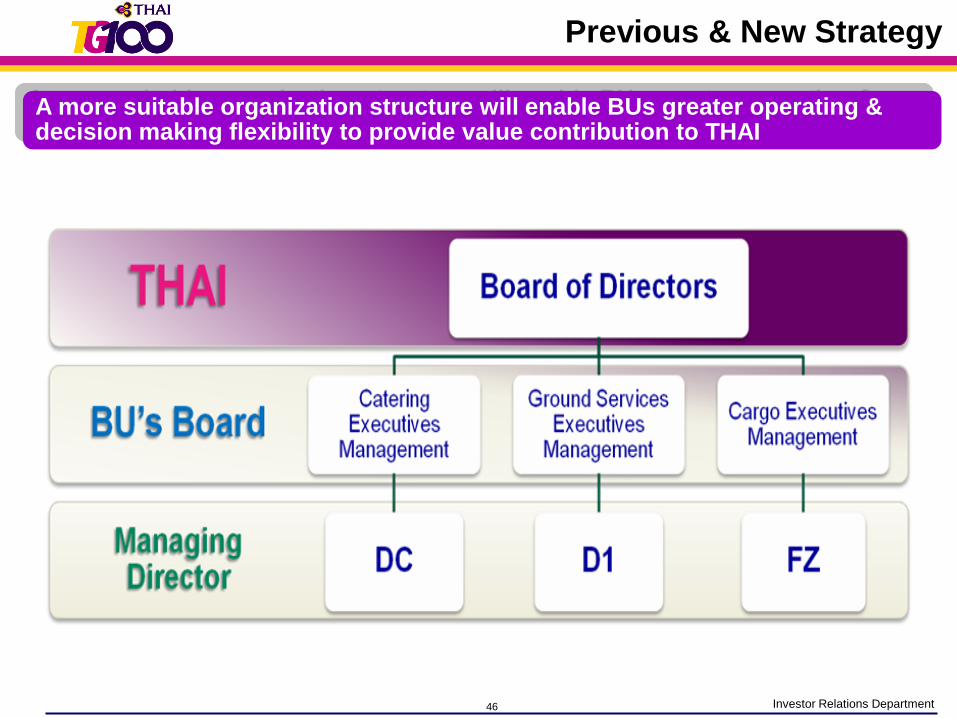
A more suitable organization structure will enable BUs greater operating & decision making flexibility to provide value contribution to THAI
Previous & New Strategy
47 Investor Relations Department
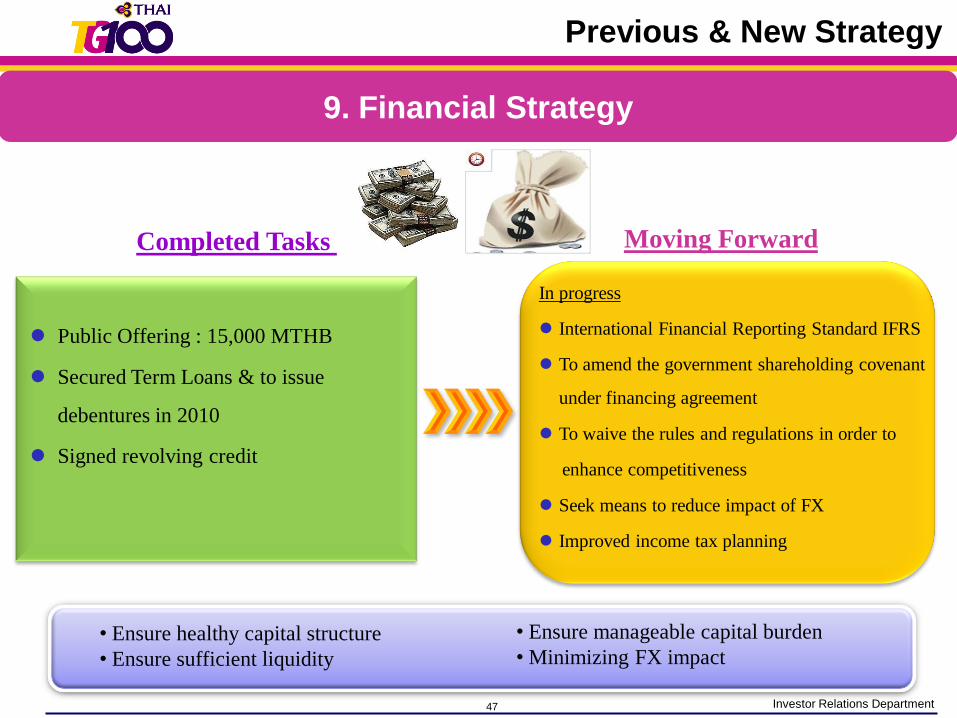
Moving ForwardCompleted Tasks
• Ensure healthy capital structure
• Ensure sufficient liquidity
• Ensure manageable capital burden
• Minimizing FX impact
Public Offering : 15,000 MTHB
Secured Term Loans & to issue
debentures in 2010
Signed revolving credit
In progress
International Financial Reporting Standard IFRS
To amend the government shareholding covenant
under financing agreement
To waive the rules and regulations in order to
enhance competitiveness
Seek means to reduce impact of FX
Improved income tax planning
9. Financial Strategy
Previous & New Strategy
48 Investor Relations Department
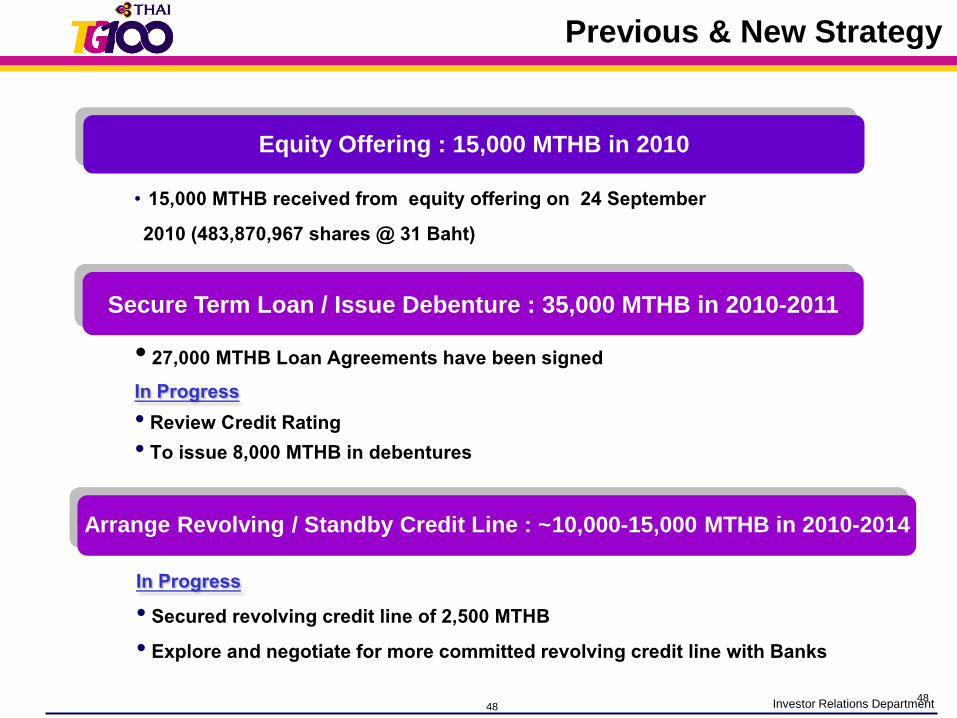
Secure Term Loan / Issue Debenture : 35,000 MTHB in 2010-2011
Equity Offering : 15,000 MTHB in 2010
• 15,000 MTHB received from equity offering on 24 September 2010 (483,870,967 shares @ 31 Baht)
• 27,000 MTHB Loan Agreements have been signedIn Progress• Review Credit Rating• To issue 8,000 MTHB in debentures
Arrange Revolving / Standby Credit Line : ~10,000-15,000 MTHB in 2010-2014
In Progress• Secured revolving credit line of 2,500 MTHB• Explore and negotiate for more committed revolving credit line with Banks
48
Previous & New Strategy
49 Investor Relations Department
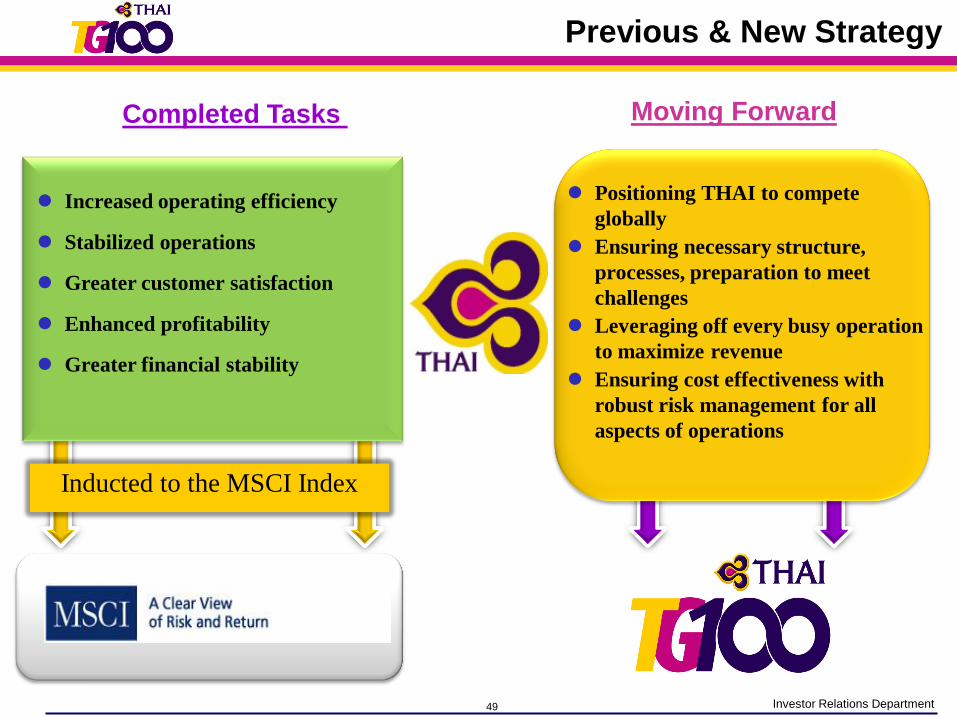
Inducted to the MSCI Index
Increased operating efficiency
Stabilized operations
Greater customer satisfaction
Enhanced profitability
Greater financial stability
Moving ForwardCompleted Tasks
Positioning THAI to compete
globally
Ensuring necessary structure,
processes, preparation to meet
challenges
Leveraging off every busy operation
to maximize revenue
Ensuring cost effectiveness with
robust risk management for all
aspects of operations
Previous & New Strategy
50 Investor Relations Department
Financial Performance
51 Investor Relations Department
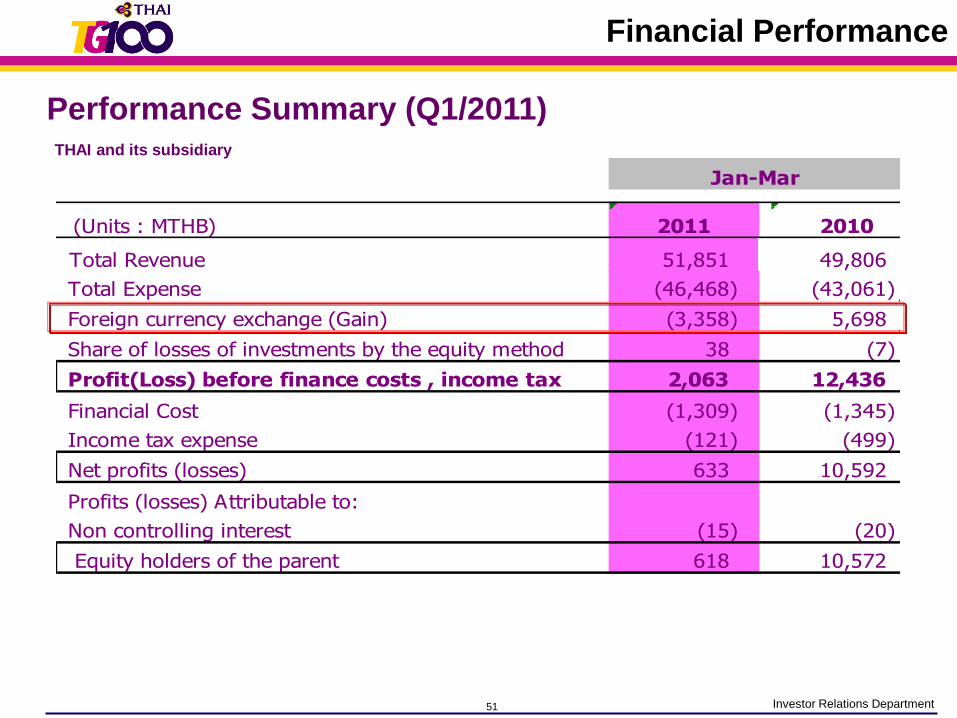
Performance Summary (Q1/2011)THAI and its subsidiary
(Units : MTHB)
Total Revenue 51,851 49,806
Total Expense (46,468) (43,061)
Foreign currency exchange (Gain) (3,358) 5,698
Share of losses of investments by the equity method 38 (7)
Profit(Loss) before finance costs , income tax 2,063 12,436
Financial Cost (1,309) (1,345)
Income tax expense (121) (499)
Net profits (losses) 633 10,592
Profits (losses) Attributable to:
Non controlling interest (15) (20)
Equity holders of the parent 618 10,572
2011
Jan-Mar
2010
Financial Performance
52 Investor Relations Department
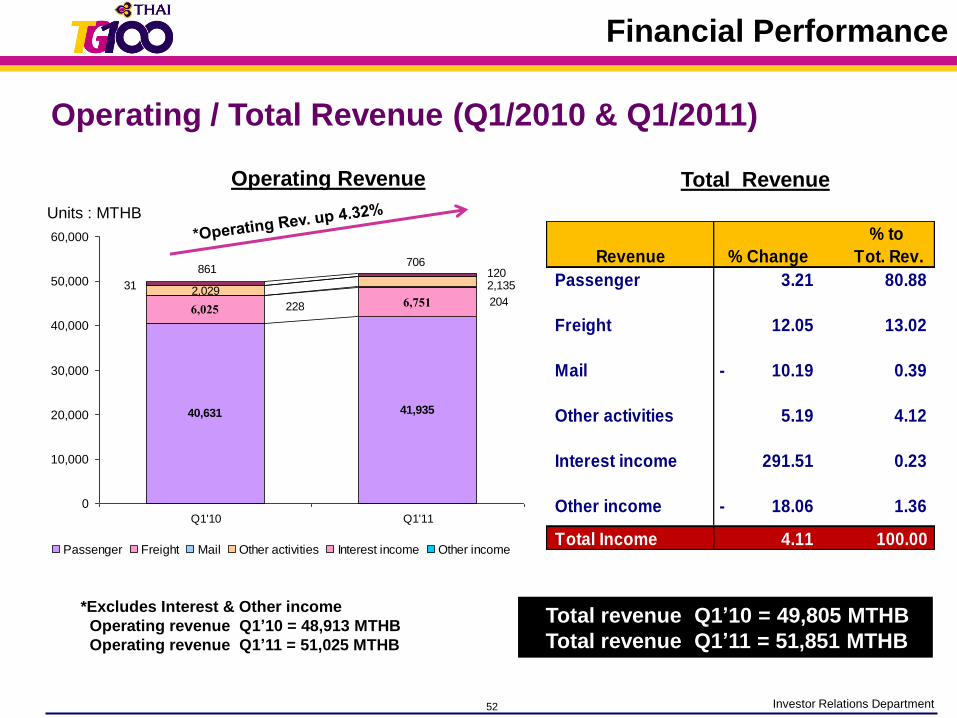
Operating / Total Revenue (Q1/2010 & Q1/2011)
40,631 41,935
6,025 6,751228 204
2,1352,029
12031
861706
0
10,000
20,000
30,000
40,000
50,000
60,000
Q1'10 Q1'11
Passenger Freight Mail Other activities Interest income Other income
% to
Revenue % Change Tot. Rev.
Passenger 3.21 80.88
Freight 12.05 13.02
Mail 10.19- 0.39
Other activities 5.19 4.12
Interest income 291.51 0.23
Other income 18.06- 1.36
Total Income 4.11 100.00
Operating Revenue Total Revenue
*Excludes Interest & Other income
Operating revenue Q1’10 = 48,913 MTHB
Operating revenue Q1’11 = 51,025 MTHB
Total revenue Q1’10 = 49,805 MTHB
Total revenue Q1’11 = 51,851 MTHB
Units : MTHB
Financial Performance
53 Investor Relations Department
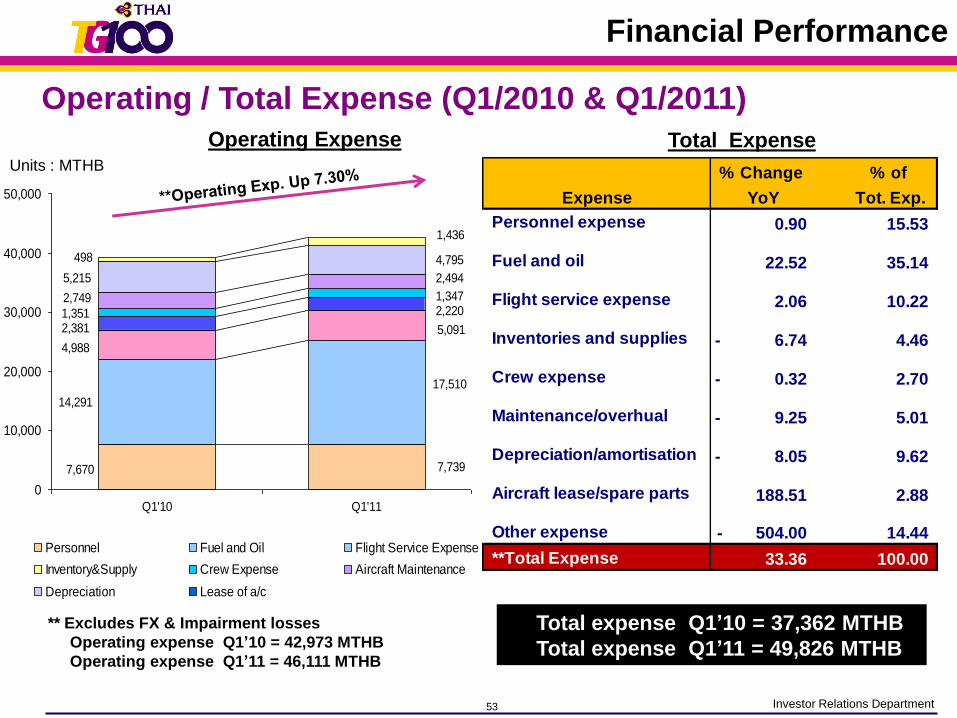
7,670 7,739
14,291
17,510
4,988
5,091
2,220
2,381
1,347
1,351
2,749
2,4945,215
4,795
1,436
498
0
10,000
20,000
30,000
40,000
50,000
Q1'10 Q1'11
Personnel Fuel and Oil Flight Service Expense
Inventory&Supply Crew Expense Aircraft Maintenance
Depreciation Lease of a/c
Total ExpenseOperating Expense
% Change % of
Expense YoY Tot. Exp.
Personnel expense 0.90 15.53
Fuel and oil 22.52 35.14
Flight service expense 2.06 10.22
Inventories and supplies 6.74- 4.46
Crew expense 0.32- 2.70
Maintenance/overhual 9.25- 5.01
Depreciation/amortisation 8.05- 9.62
Aircraft lease/spare parts 188.51 2.88
Other expense 504.00- 14.44
**Total Expense 33.36 100.00
Operating / Total Expense (Q1/2010 & Q1/2011)
** Excludes FX & Impairment losses
Operating expense Q1’10 = 42,973 MTHB
Operating expense Q1’11 = 46,111 MTHB
Total expense Q1’10 = 37,362 MTHB
Total expense Q1’11 = 49,826 MTHB
Units : MTHB
Financial Performance
54 Investor Relations Department
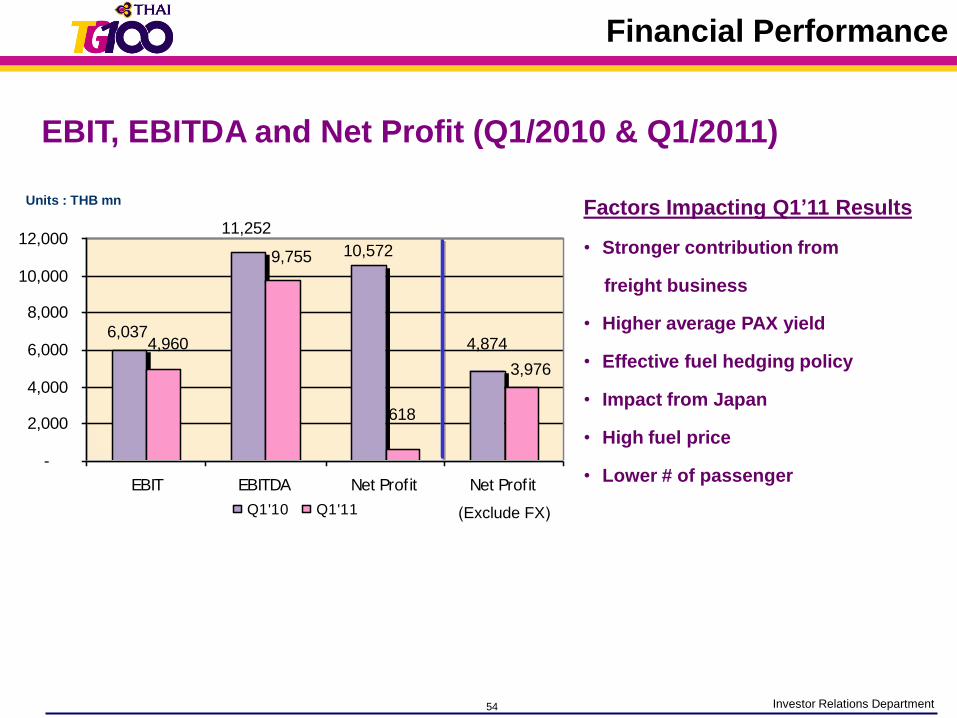
EBIT, EBITDA and Net Profit (Q1/2010 & Q1/2011)
Units : THB mn Factors Impacting Q1’11 Results
• Stronger contribution from
freight business
• Higher average PAX yield
• Effective fuel hedging policy
• Impact from Japan
• High fuel price
• Lower # of passenger
6,037
11,252
10,572
4,8744,960
9,755
618
3,976
-
2,000
4,000
6,000
8,000
10,000
12,000
EBIT EBITDA Net Profit Net Profit
Q1'10 Q1'11
Financial Performance
(Exclude FX)
55 Investor Relations Department
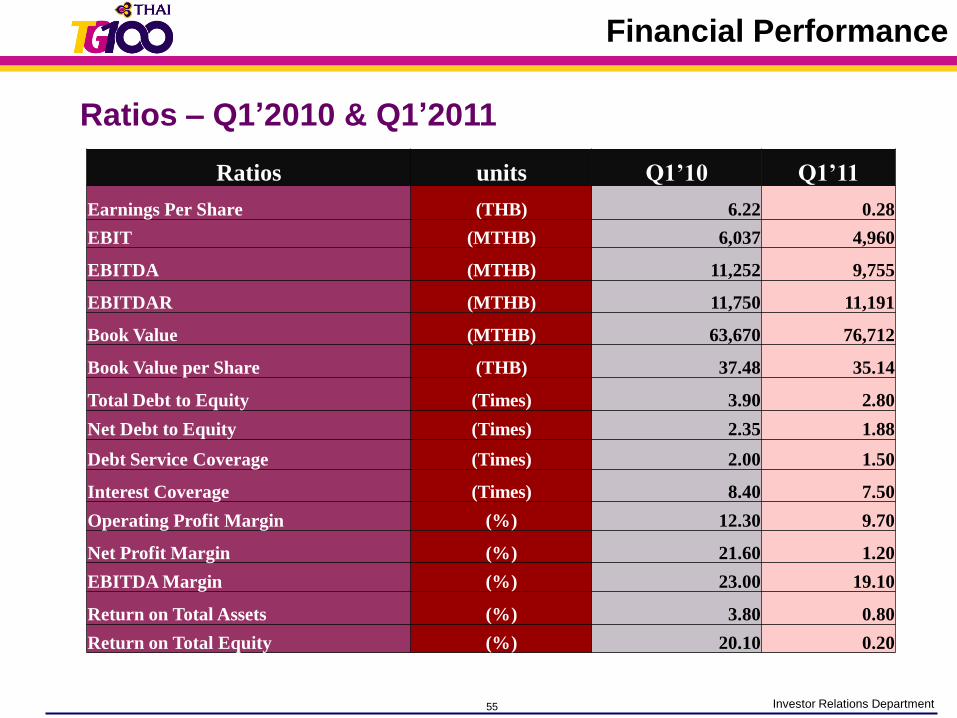
Ratios – Q1’2010 & Q1’2011
Ratios units Q1’10 Q1’11
Earnings Per Share (THB) 6.22 0.28
EBIT (MTHB) 6,037 4,960
EBITDA (MTHB) 11,252 9,755
EBITDAR (MTHB) 11,750 11,191
Book Value (MTHB) 63,670 76,712
Book Value per Share (THB) 37.48 35.14
Total Debt to Equity (Times) 3.90 2.80
Net Debt to Equity (Times) 2.35 1.88
Debt Service Coverage (Times) 2.00 1.50
Interest Coverage (Times) 8.40 7.50
Operating Profit Margin (%) 12.30 9.70
Net Profit Margin (%) 21.60 1.20
EBITDA Margin (%) 23.00 19.10
Return on Total Assets (%) 3.80 0.80
Return on Total Equity (%) 20.10 0.20
Financial Performance
56 Investor Relations Department
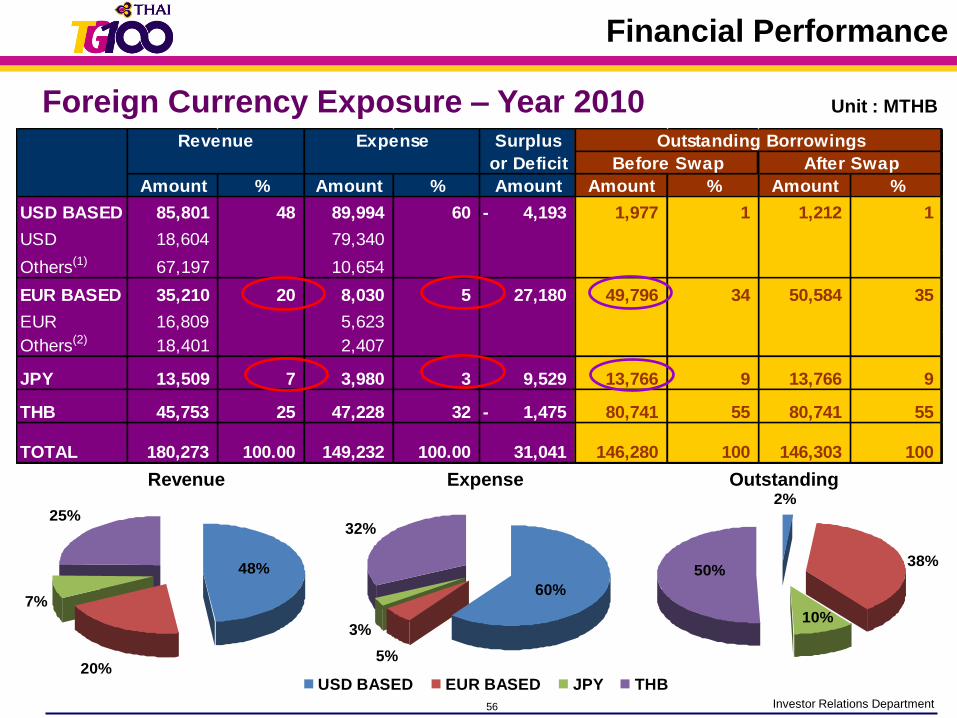
Foreign Currency Exposure – Year 2010Surplus
or Deficit
Amount % Amount % Amount Amount % Amount %
USD BASED 85,801 48 89,994 60 4,193- 1,977 1 1,212 1
USD 18,604 79,340
Others(1) 67,197 10,654
EUR BASED 35,210 20 8,030 5 27,180 49,796 34 50,584 35
EUR 16,809 5,623
Others(2) 18,401 2,407
JPY 13,509 7 3,980 3 9,529 13,766 9 13,766 9
THB 45,753 25 47,228 32 1,475- 80,741 55 80,741 55
TOTAL 180,273 100.00 149,232 100.00 31,041 146,280 100 146,303 100
Outstanding Borrowings
After Swap
Revenue Expense
Before Swap
Unit : MTHB
20%
25%
48%
7%
Revenue Expense Outstanding
32%
5%
60%
3%
38%50%
2%
10%60%
5%
32%
3%
USD BASED EUR BASED JPY THB
Financial Performance
57 Investor Relations Department
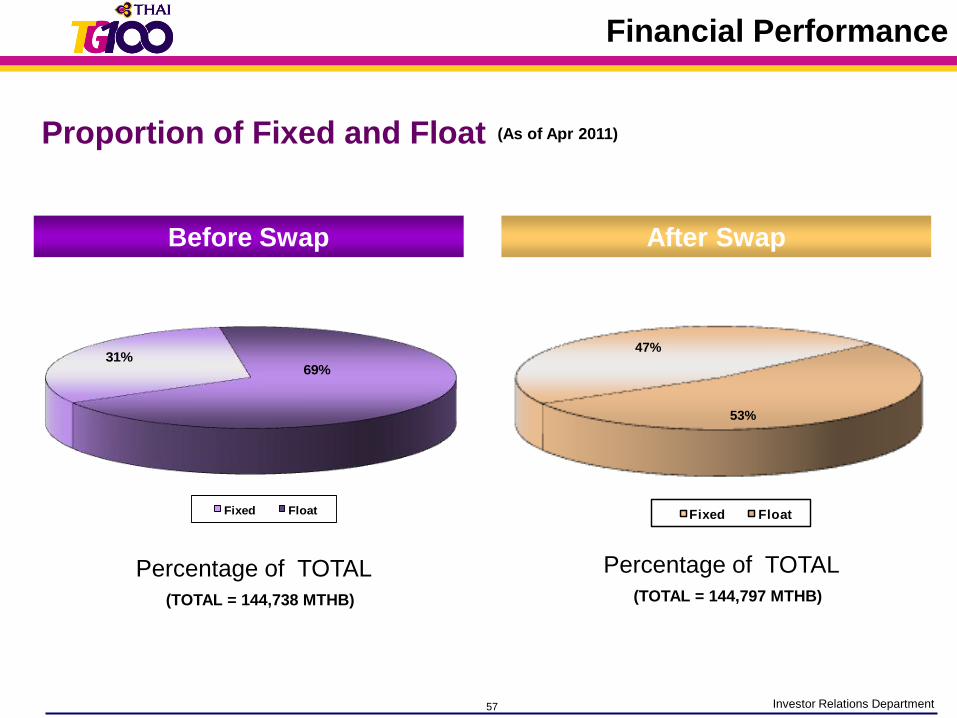
Proportion of Fixed and Float
31%69%
Fixed Float
Percentage of TOTAL
(TOTAL = 144,738 MTHB)
47%
53%
Fixed Float
Percentage of TOTAL
(TOTAL = 144,797 MTHB)
Before Swap After Swap
(As of Apr 2011)
Financial Performance
58 Investor Relations Department
Operating Statistics
59 Investor Relations Department
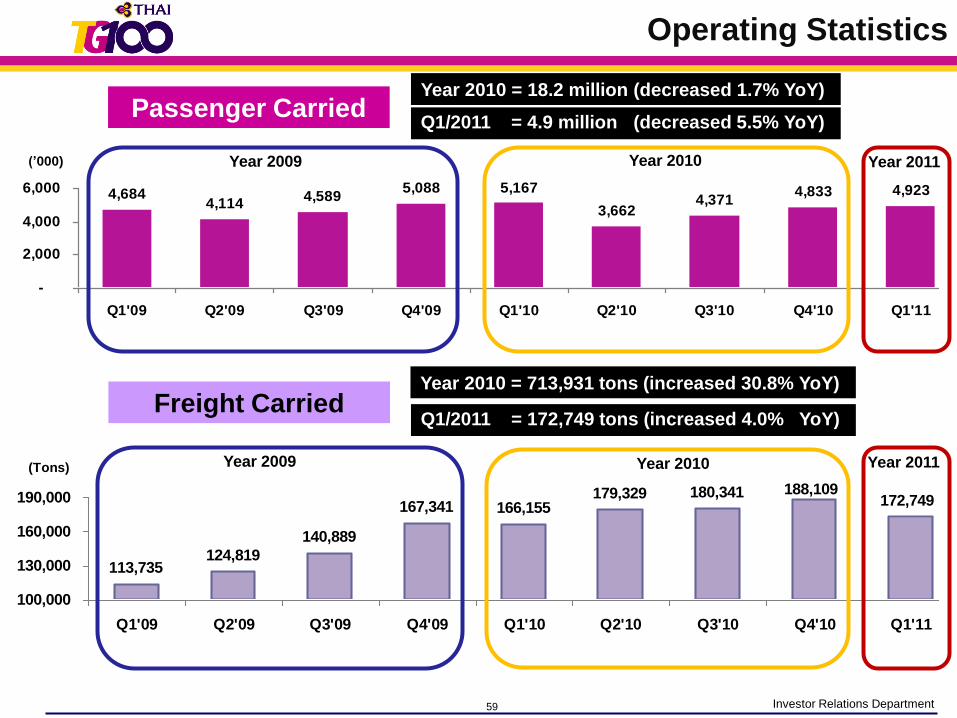
Passenger Carried
4,6844,114
4,5895,088 5,167
3,6624,371
4,833 4,923
-
2,000
4,000
6,000
Q1'09 Q2'09 Q3'09 Q4'09 Q1'10 Q2'10 Q3'10 Q4'10 Q1'11
(’000)
Freight Carried
113,735124,819
140,889
167,341 166,155179,329 180,341 188,109
172,749
100,000
130,000
160,000
190,000
Q1'09 Q2'09 Q3'09 Q4'09 Q1'10 Q2'10 Q3'10 Q4'10 Q1'11
(Tons)
Year 2009 Year 2010
Year 2009 Year 2010
Operating Statistics
Year 2010 = 18.2 million (decreased 1.7% YoY)
Year 2010 = 713,931 tons (increased 30.8% YoY)
Year 2011
Q1/2011 = 4.9 million (decreased 5.5% YoY)
Q1/2011 = 172,749 tons (increased 4.0% YoY)
Year 2011
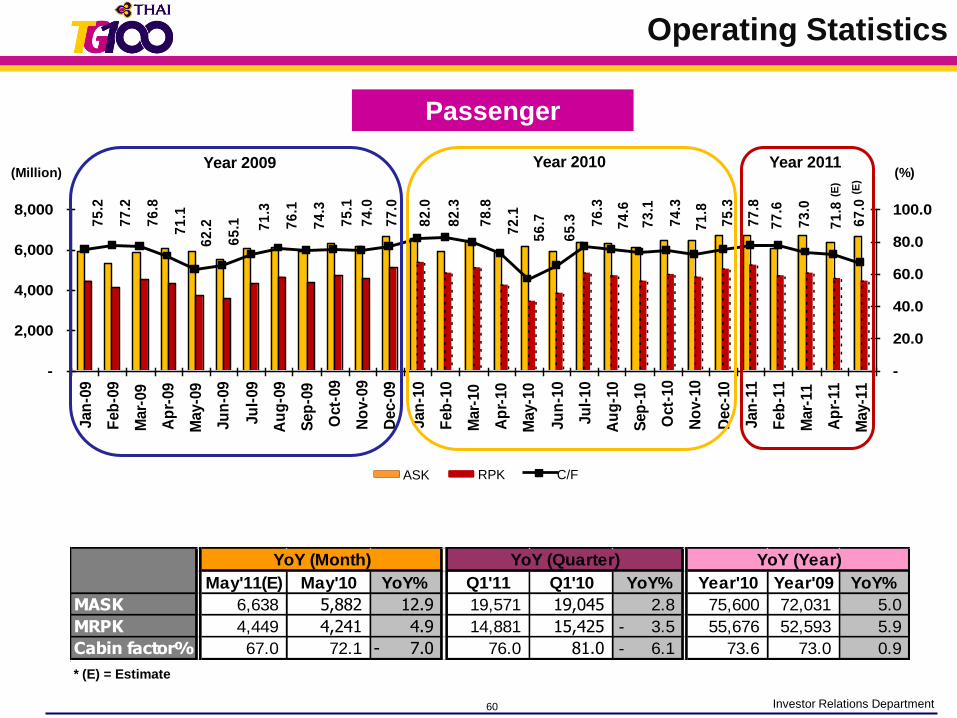
60 Investor Relations Department
75.3
4
71.8
4
74.3
2
73.0
7
74.6
3
76.3
4
65.3
3
56.6
7
72.1
0
78.7
7
82.2
7
82.0
1
76.9
6
73.9
9
75.0
8
74.3
5
76.0
7
71.3
3
65.0
7
62.2
2
71.1
2
76.8
1
75.1
8
77.2
2
2,000
4,000
6,000
8,000
Jan
-09
Feb
-09
Mar-0
9
Ap
r-0
9
May-0
9
Ju
n-0
9
Ju
l-09
Au
g-0
9
Sep
-09
Oct-
09
No
v-0
9
Dec-0
9
Jan
-10
Feb
-10
Mar-1
0
Ap
r-1
0
May-1
0
Ju
n-1
0
Ju
l-10
Au
g-1
0
Sep
-10
Oct-
10
No
v-1
0
Dec-1
0
-
20.00
40.00
60.00
80.00
100.00
ASK RPK C/FC/FRPKASK
Passenger 7
5.2
77
.2
76
.8
71
.1
62
.2
65
.1 71
.3
76
.1
74
.3
75
.1
74
.0
77
.0
82
.0
82
.3
78
.8
72
.1
56
.7
65
.3 76
.3
74
.6
73
.1
74
.3
71
.8
75
.3
77
.8
77
.6
73
.0
71
.8
67
.0
-
2,000
4,000
6,000
8,000
Jan
-09
Feb
-09
Mar-
09
Ap
r-09
May-0
9
Ju
n-0
9
Ju
l-09
Au
g-0
9
Sep
-09
Oct-
09
No
v-0
9
Dec-0
9
Jan
-10
Feb
-10
Mar-
10
Ap
r-10
May-1
0
Ju
n-1
0
Ju
l-10
Au
g-1
0
Sep
-10
Oct-
10
No
v-1
0
Dec-1
0
Jan
-11
Feb
-11
Mar-
11
Ap
r-11
May-1
1
-
20.0
40.0
60.0
80.0
100.0
(%)Year 2009 Year 2010 Year 2011
(Million)
May'11(E) May'10 YoY% Q1'11 Q1'10 YoY% Year'10 Year'09 YoY%
MASK 6,638 5,882 12.9 19,571 19,045 2.8 75,600 72,031 5.0
MRPK 4,449 4,241 4.9 14,881 15,425 3.5- 55,676 52,593 5.9
Cabin factor% 67.0 72.1 7.0- 76.0 81.0 6.1- 73.6 73.0 0.9
YoY (Month) YoY (Year)YoY (Quarter)
* (E) = Estimate
(E)
Operating Statistics
(E)
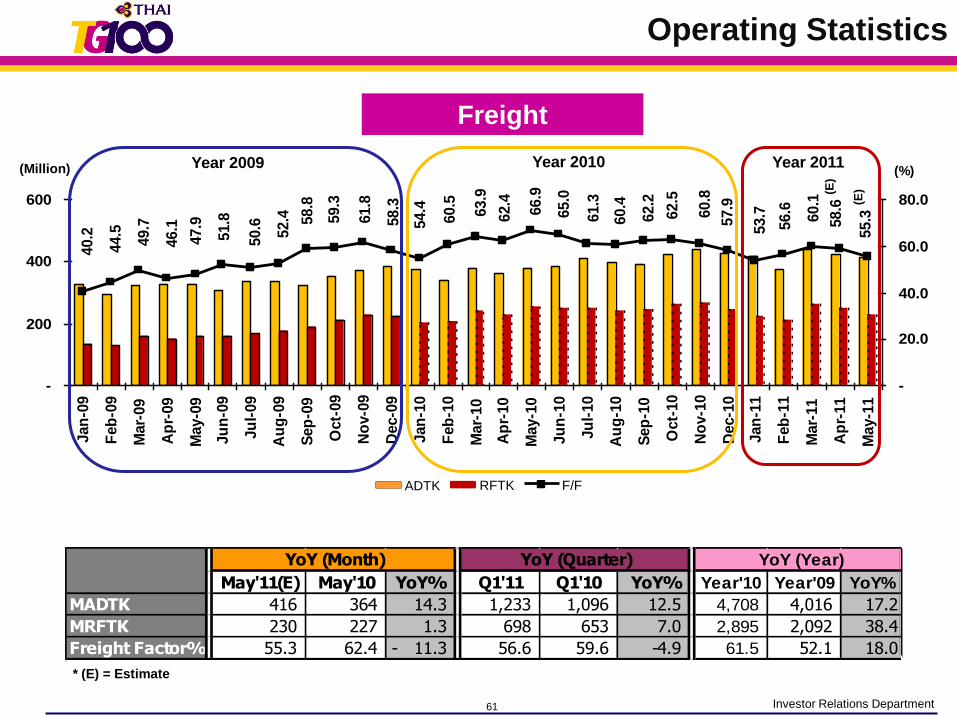
61 Investor Relations Department
40.2
44.5
49.7
46.1
47.9
51.8
50.6
52.4 58.8
59.3
61.8
58.3
54.4
60.5
63.9
62.4
66.9
65.0
61.3
60.4
62.2
62.5
60.8
57.9
53.7
56.6
60.1
58.6
55.3
-
200
400
600
Jan
-09
Feb
-09
Mar-
09
Ap
r-09
May-0
9
Ju
n-0
9
Ju
l-09
Au
g-0
9
Sep
-09
Oct-
09
No
v-0
9
Dec-0
9
Jan
-10
Feb
-10
Mar-
10
Ap
r-10
May-1
0
Ju
n-1
0
Ju
l-10
Au
g-1
0
Sep
-10
Oct-
10
No
v-1
0
Dec-1
0
Jan
-11
Feb
-11
Mar-
11
Ap
r-11
May-1
1
-
20.0
40.0
60.0
80.0
(Million) (%)
Freight
75.3
4
71.8
4
74.3
2
73.0
7
74.6
3
76.3
4
65.3
3
56.6
7
72.1
0
78.7
7
82.2
7
82.0
1
76.9
6
73.9
9
75.0
8
74.3
5
76.0
7
71.3
3
65.0
7
62.2
2
71.1
2
76.8
1
75.1
8
77.2
2
2,000
4,000
6,000
8,000
Jan
-09
Feb
-09
Mar-0
9
Ap
r-0
9
May-0
9
Ju
n-0
9
Ju
l-09
Au
g-0
9
Sep
-09
Oct-
09
No
v-0
9
Dec-0
9
Jan
-10
Feb
-10
Mar-1
0
Ap
r-1
0
May-1
0
Ju
n-1
0
Ju
l-10
Au
g-1
0
Sep
-10
Oct-
10
No
v-1
0
Dec-1
0
-
20.00
40.00
60.00
80.00
100.00
ASK RPK C/FF/FRFTKADTK
May'11(E) May'10 YoY% Q1'11 Q1'10 YoY% Year'10 Year'09 YoY%
MADTK 416 364 14.3 1,233 1,096 12.5 4,708 4,016 17.2
MRFTK 230 227 1.3 698 653 7.0 2,895 2,092 38.4
Freight Factor% 55.3 62.4 11.3- 56.6 59.6 -4.9 61.5 52.1 18.0
YoY (Month) YoY (Quarter) YoY (Year)
* (E) = Estimate
Year 2009 Year 2010 Year 2011
(E)
Operating Statistics
(E)
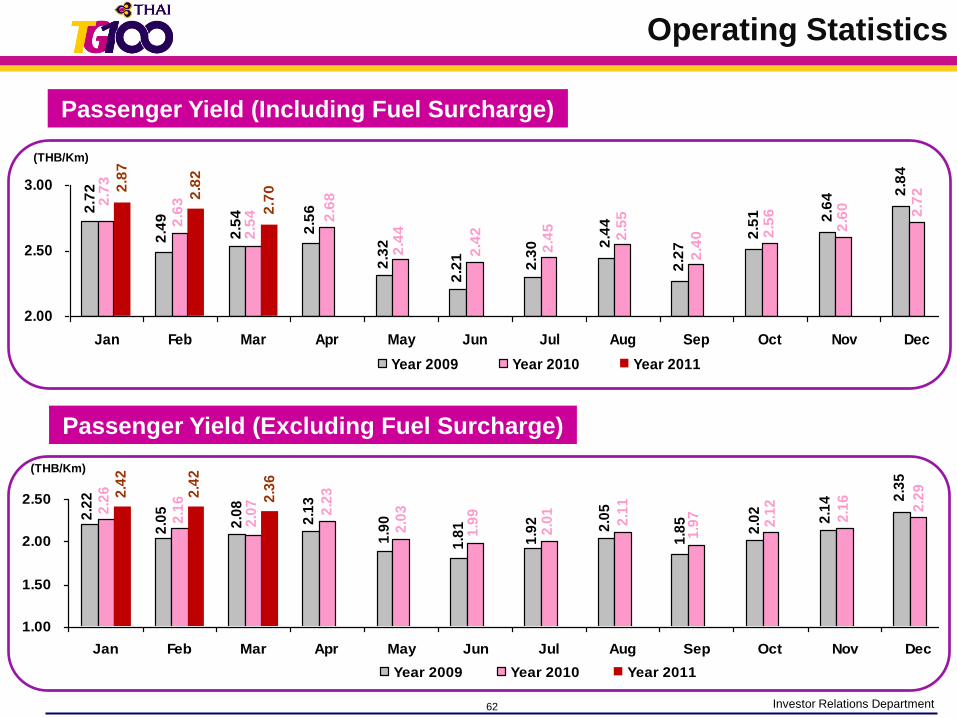
62 Investor Relations Department
2.2
2
2.0
5
2.0
8
2.1
3
1.9
0
1.8
1
1.9
2
2.0
5
1.8
5
2.0
2
2.1
4 2.3
5
2.2
6
2.1
6
2.0
7
2.2
3
2.0
3
1.9
9
2.0
1
2.1
1
1.9
7
2.1
2
2.1
6
2.2
9
2.3
6
2.4
2
2.4
2
1.00
1.50
2.00
2.50
Jan Feb Mar Apr May Jun Jul Aug Sep Oct Nov Dec
Year 2009 Year 2010 Year 2011
(THB/Km)
Passenger Yield (Excluding Fuel Surcharge)
Passenger Yield (Including Fuel Surcharge)
2.5
1 2.6
42
.602.7
0 2.8
4
2.2
72.4
4
2.3
0
2.2
1
2.3
2
2.5
6
2.5
4
2.4
9
2.7
2
2.7
2
2.5
6
2.4
02.5
5
2.4
5
2.4
2
2.4
4
2.6
8
2.5
4
2.6
32.7
3
2.8
2
2.8
7
2.00
2.50
3.00
Jan Feb Mar Apr May Jun Jul Aug Sep Oct Nov Dec
Year 2009 Year 2010 Year 2011
(THB/Km)
Operating Statistics
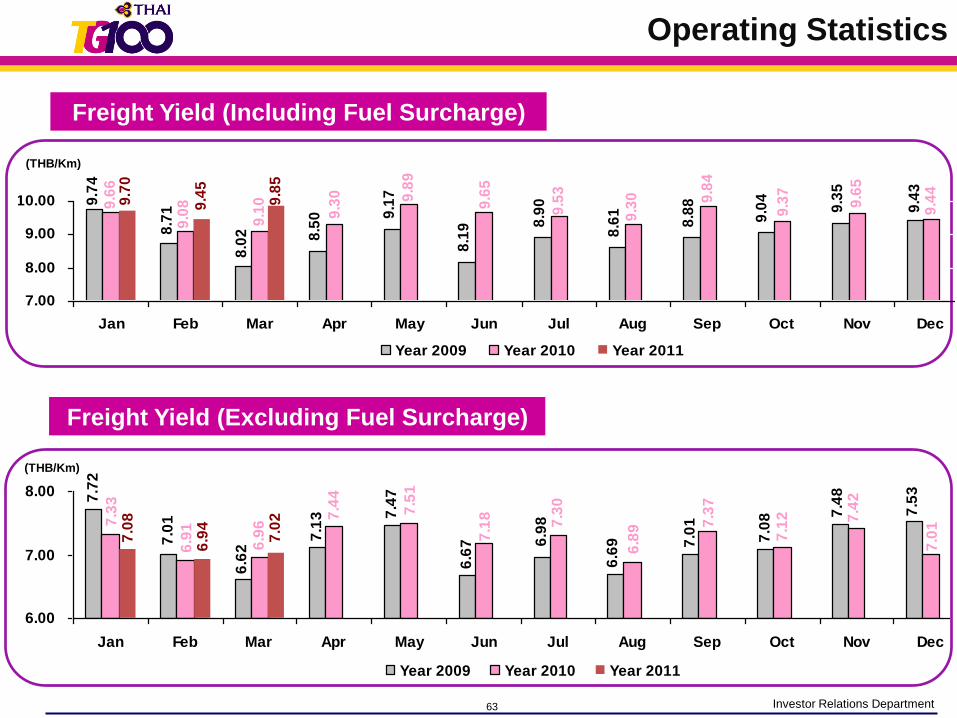
63 Investor Relations Department
Freight Yield (Excluding Fuel Surcharge)
6.9
8
7.0
2 7.5
3
7.4
8
7.0
8
7.0
1
6.6
9
6.6
7
7.4
7
7.1
3
6.6
2
7.0
1
7.7
2
7.0
1
7.4
2
7.1
2
7.3
7
6.8
97.3
0
7.1
87.5
1
7.4
4
6.9
6
6.9
17.3
3
6.9
4
7.0
8
6.00
7.00
8.00
Jan Feb Mar Apr May Jun Jul Aug Sep Oct Nov Dec
Year 2009 Year 2010 Year 2011
(THB/Km)
Freight Yield (Including Fuel Surcharge)
9.6
5
9.8
5
9.7
4
8.7
1
8.0
2 8.5
0 9.1
7
8.1
9 8.9
0
8.6
1
8.8
8
9.0
4
9.3
5
9.4
3
9.6
6
9.0
8
9.1
0
9.3
0 9.8
9
9.6
5
9.5
3
9.3
0 9.8
4
9.3
7
9.4
4
9.7
0
9.4
5
7.00
8.00
9.00
10.00
Jan Feb Mar Apr May Jun Jul Aug Sep Oct Nov Dec
Year 2009 Year 2010 Year 2011
(THB/Km)
Operating Statistics
64 Investor Relations Department
Company Fact

65 Investor Relations Department
OTHERS, 22.92%
STATE STREET BANK
AND TRUST COMPANY,
0.72%HSBC (SINGAPORE)
NOMINEES PTE LTD,
0.87%
NORBAX INC., 13,
1.05%
THE BANK OF NEW
YORK MELLON, 1.33%
GOVERNMENT SAVING
BANK
2.41%
NVDR, 4.57% VAYUPAK (KTAM),
7.56%
VAYUPAK (MFC),
7.56%
MINISTRY OF
FINANCE, 51.03%
Thailand’s National Flag Carrier
51% directly 68% indirectly owned
by the Royal Thai Government
Market Capitalization (MTHB):
86,765
As of Mar’11
Major Shareholder
Company Fact
66 Investor Relations Department
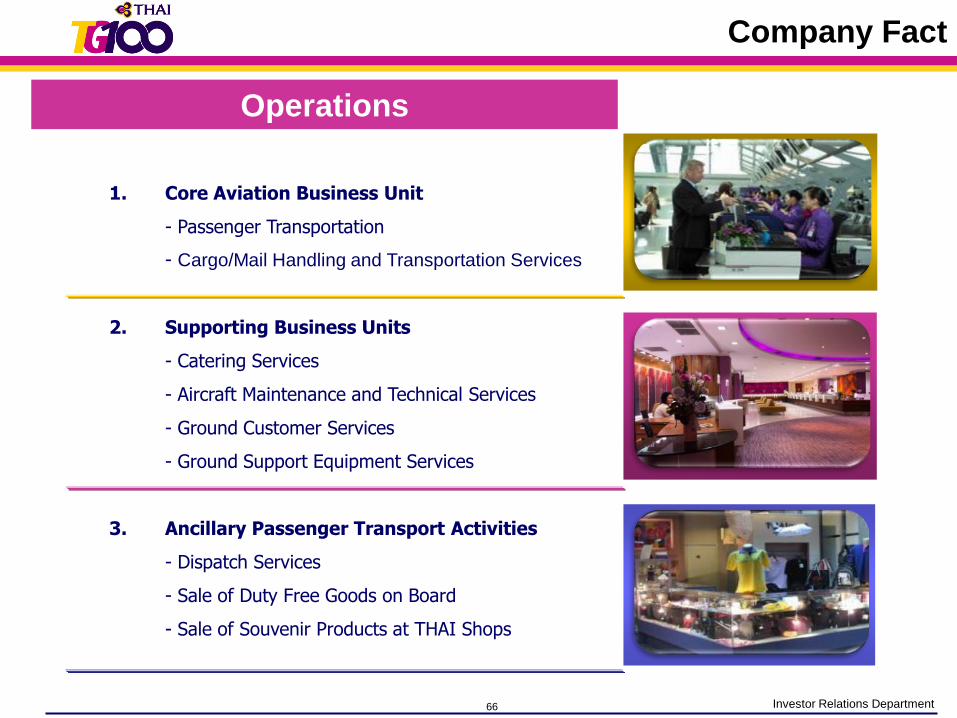
1. Core Aviation Business Unit
- Passenger Transportation
- Cargo/Mail Handling and Transportation Services
2. Supporting Business Units
- Catering Services
- Aircraft Maintenance and Technical Services
- Ground Customer Services
- Ground Support Equipment Services
3. Ancillary Passenger Transport Activities
- Dispatch Services
- Sale of Duty Free Goods on Board
- Sale of Souvenir Products at THAI Shops
Operations
Company Fact
67 Investor Relations Department
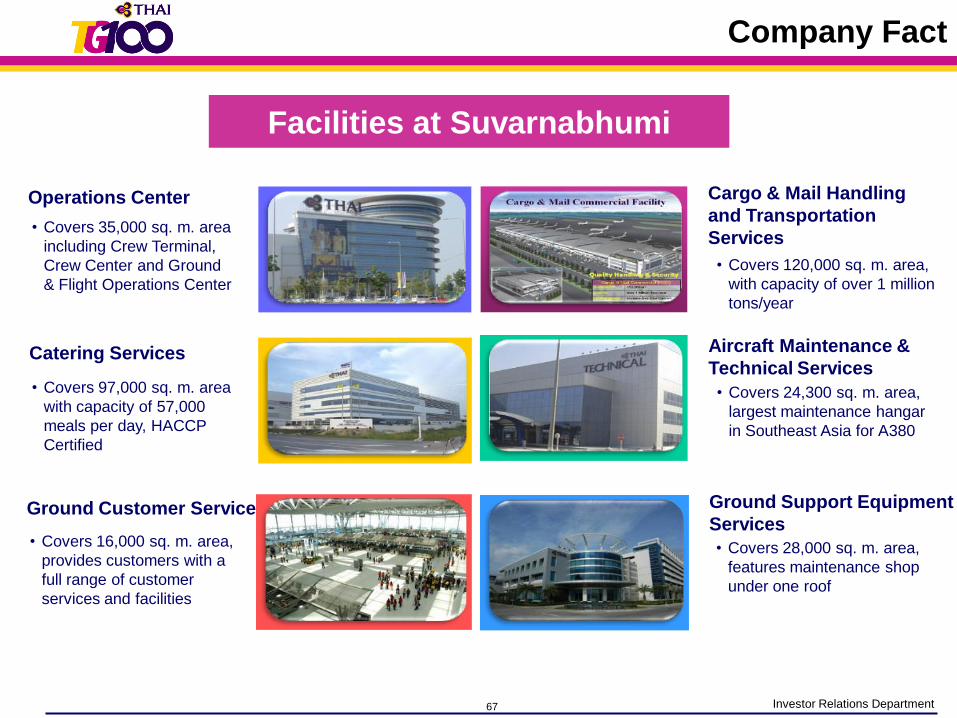
Facilities at Suvarnabhumi
Aircraft Maintenance &
Technical Services
• Covers 24,300 sq. m. area,
largest maintenance hangar
in Southeast Asia for A380
Ground Customer Services
• Covers 16,000 sq. m. area,
provides customers with a
full range of customer
services and facilities
Catering Services
• Covers 97,000 sq. m. area
with capacity of 57,000
meals per day, HACCP
Certified
Ground Support Equipment
Services
• Covers 28,000 sq. m. area,
features maintenance shop
under one roof
Cargo & Mail Handling
and Transportation
Services
• Covers 120,000 sq. m. area,
with capacity of over 1 million
tons/year
Operations Center
• Covers 35,000 sq. m. area
including Crew Terminal,
Crew Center and Ground
& Flight Operations Center
Company Fact
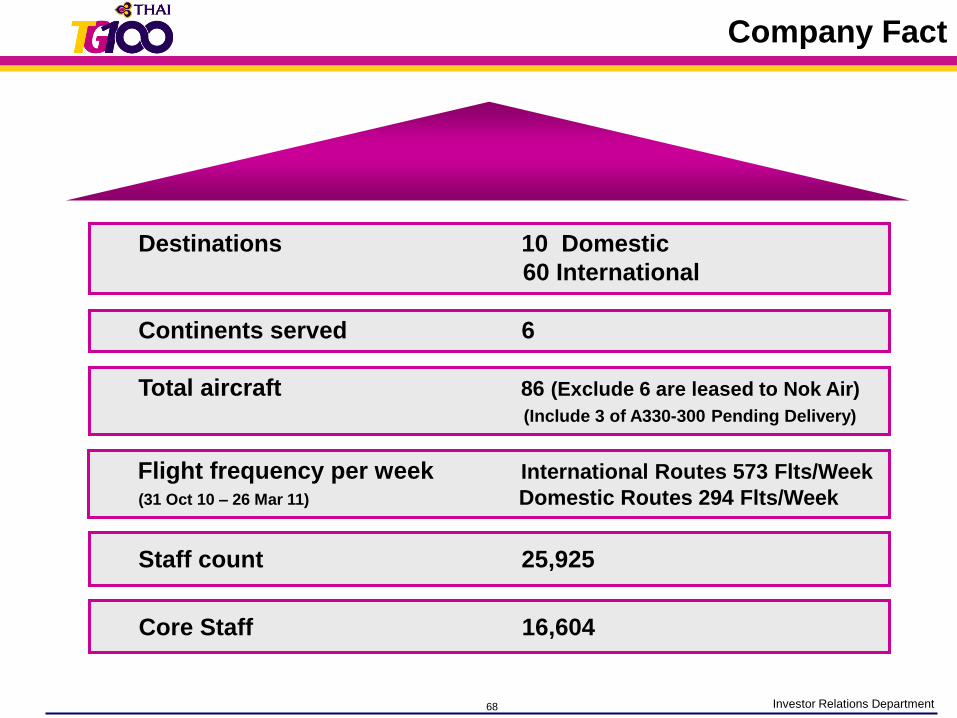
68 Investor Relations Department
Core Staff 16,604
Destinations 10 Domestic
60 International
Continents served 6
Total aircraft 86 (Exclude 6 are leased to Nok Air)
(Include 3 of A330-300 Pending Delivery)
Flight frequency per week International Routes 573 Flts/Week
(31 Oct 10 – 26 Mar 11) Domestic Routes 294 Flts/Week
Staff count 25,925
Company Fact
69 Investor Relations Department
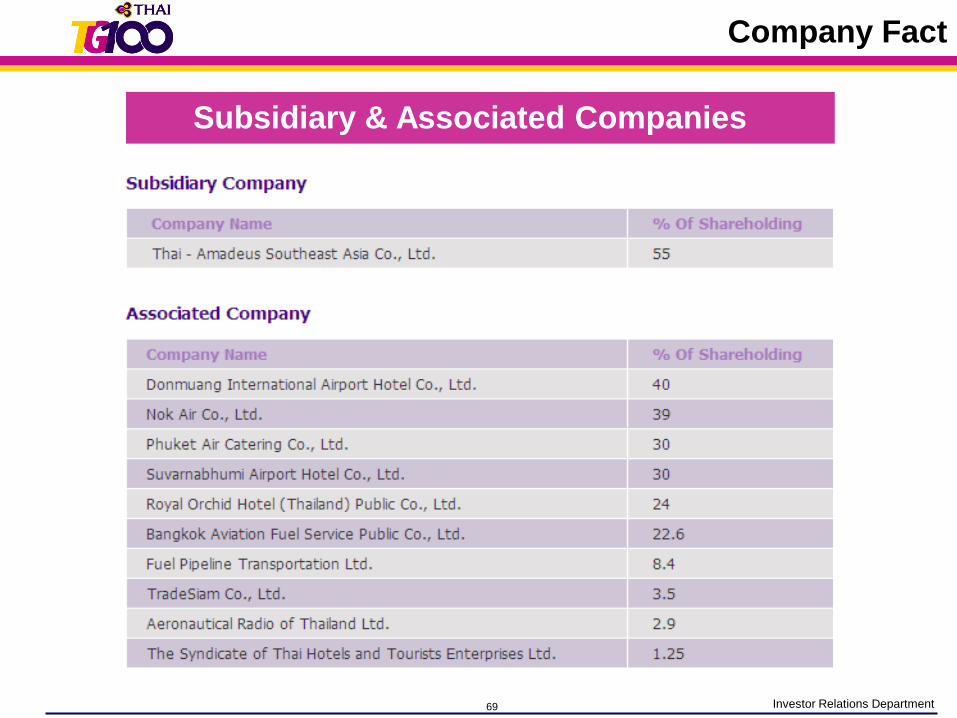
Subsidiary & Associated Companies
Company Fact

70 Investor Relations Department
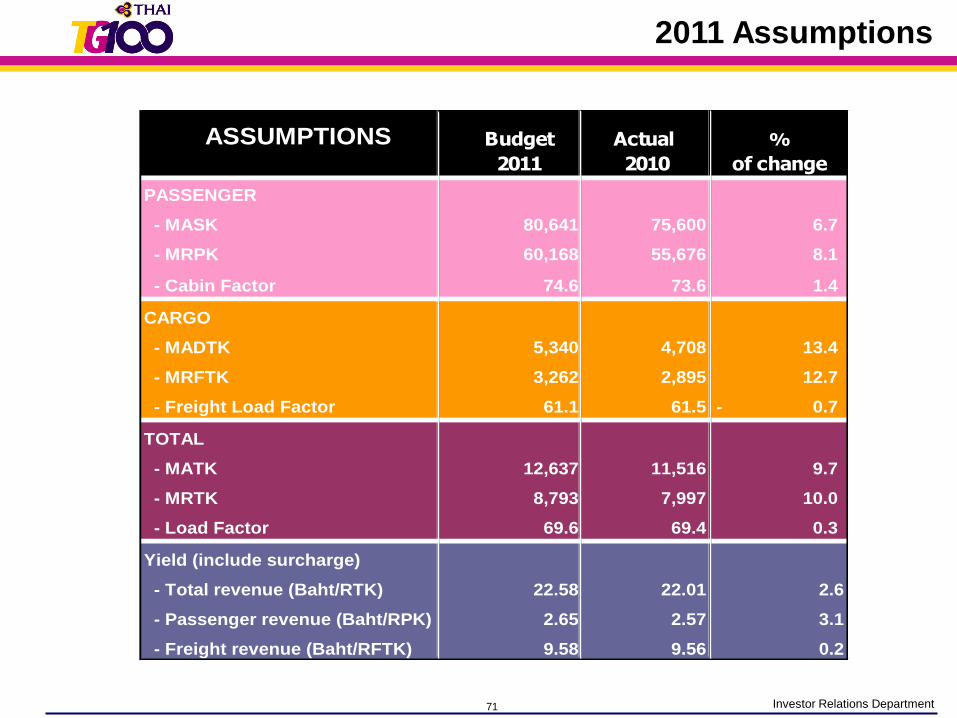
2011 Assumptions
71 Investor Relations Department
ASSUMPTIONS Budget Actual %
2011 2010 of change
PASSENGER
- MASK 80,641 75,600 6.7
- MRPK 60,168 55,676 8.1
- Cabin Factor 74.6 73.6 1.4
CARGO
- MADTK 5,340 4,708 13.4
- MRFTK 3,262 2,895 12.7
- Freight Load Factor 61.1 61.5 0.7-
TOTAL
- MATK 12,637 11,516 9.7
- MRTK 8,793 7,997 10.0
- Load Factor 69.6 69.4 0.3
Yield (include surcharge)
- Total revenue (Baht/RTK) 22.58 22.01 2.6
- Passenger revenue (Baht/RPK) 2.65 2.57 3.1
- Freight revenue (Baht/RFTK) 9.58 9.56 0.2
2011 Assumptions
72 Investor Relations Department72
Five Decades of Pride