investor.html thai airways international plc
TRANSCRIPT

1 Investor Relations Department
THAI AIRWAYS INTERNATIONAL PLC.THAI AIRWAYS INTERNATIONAL PLC.
Q1/2011 Q1/2011 (Updated on 23 June 2011)(Updated on 23 June 2011)
http://www.thaiairways.com/about-thai/investor-rela tions/en/investor.html

2 Investor Relations Department
DISCLAIMER
The information contained herein is intended to represent the Company’s operating and financial position at a given point in time and may also contain forward looking information which only reflects expectations based on the prevailing geo-political, economic and non-controllable factors. Such information has been obtained from sources believed to be most reliable and the means in analyzing and preparation of such information for disclosure are based on approved practices and principles in the investment industry. The views are based on assumptions subject to various risks and uncertainties and no assurance is made as to whether such future events will occur, that projections will be achieved, or that the assumptions here-in are correct. Consequently no assurance is made as to the accuracy or completeness of information presented in this document.
This document should not be construed as an investm ent guide or as an offer or solicitation of an offer to buy or sell the Company ’s stock.

3 Investor Relations Department
THAI in 2010
MTHB USD mn Equiv. % Change
Assets 293,760 9,792 8.1
Total Revenue 180,588 6,020 11.7
Net Profit 15,398 514 107.6
# of Aircraft 90*
Destinations Served 72
Countries Served 35
*Excluding 6 B 737-400 leased to Nok Air
Million % Change
Passengers carried (# of people) 18.2/annum -1.7
Available Seat Kilometers (ASK) 55,676 +5.9
Freight Transport (tons) 713.9 /annum +30.8
Available Ton Kilometer (ATK) 2,895 +38.4

4 Investor Relations Department
Factors Affecting Aviation Business
Factors of Concern
ASEAN Open Sky and
Liberalization Policy
Competition from LCCs and
Traditional Airlines
Rapid Rise inFuel PriceRate of Economic
Growth FX Fluctuation
EU Carbon Emissions Guideline
New Aircraft
Technology/Trend
Natural Disasters
Availability of New Aircraft Acquisition,
Aging Fleet & Seat
THAI is taking precautionary actions to mitigate all risk factors
Politics
Health

5 Investor Relations Department
Units Jan-Apr’11 Jan-Apr’10 % Change
Passenger Production MASK 25,952 24,927 +4.1
Passenger Traffic MRPK 19,460 19,666 -1.0
Cabin Factor % 75.0 78.9 -5.0
Passenger Yield (April) THB/km 2.82 2.68 +5.2
Note : Yield includes fuel surcharge
Freight Production MADTK 1,659 1,461 +13.6
Freight Traffic MRFTK 945 881 +7.3
Freight Factor % 57.0 60.3 -5.5
Freight Yield (April) THB/km 9.65 9.30 +3.8
Note : Yield includes fuel surcharge
Avg. Fuel Cost USD/gallon 2.89 2.15 +34.4
Operating Summary

6 Investor Relations Department
EBIT, EBITDA and Net Profit (Q1/2010 & Q1/2011)
Units : THB mn Factors Impacting Q1’11 Results
• Stronger contribution from
freight business
• Higher average PAX yield
• Effective fuel hedging policy
• Impact from Japan
• High fuel price
• Lower # of passenger
6,037
11,25210,572
4,8744,960
9,755
618
3,976
-
2,000
4,000
6,000
8,000
10,000
12,000
EBIT EBITDA Net Profit Net Profit
Q1'10 Q1'11
Financial Performance
(Exclude FX)

7 Investor Relations Department
Rising Fuel Cost

8 Investor Relations Department
Fuel surcharge now covers fuel cost

9 Investor Relations Department
DAILY REVENUE PASSENGER KILOMETRE (RPK) (7 Days Moving Average up to 23 May 2011)
100,000,000
110,000,000
120,000,000
130,000,000
140,000,000
150,000,000
160,000,000
170,000,000
180,000,000
190,000,000
1-Jan 1-Feb 1-Mar 1-Apr 1-May 1-Jun 1-Jul 1-Aug 1-Sep 1-Oct 1 -Nov 1-Dec
2009
2010
2011
RPK is slightly higher than last year
RPK%YoYApr. +8.0%1-23 May +14.6%YTD +0.8%

10 Investor Relations Department
Total Domestic Indo China Western Southern Northern North Pacific Europe Australia Africa, ME, Others
% RPK/Day
Jan-May 100.0% 5.6% 1.1% 7.5% 4.6% 24.1% 2.9% 38.7% 12.4% 3.1 %
% YoY Growth
Jan-11 -3.1% -15.7% 0.7% -5.6% 1.8% 1.8% 4.9% -5.2% -3.1% 9.6%
Feb-11 -3.0% -16.1% 8.3% 3.1% 2.1% 1.7% 4.3% -5.4% -3.5% -6.3%
Mar-11 -4.4% -12.7% 1.5% 4.7% 10.3% -2.7% 3.7% -6.6% -13.3% 12.7%
Apr-11 8.0% 5.8% 18.8% 5.1% 24.2% -1.8% -4.8% 10.3% 6.9% 63.7 %
May-11 13.9% 18.2% 23.2% 8.9% 38.8% 22.8% 11.2% 1.3% 19.6% -
Change in RPK by Region (%YoY)
RPK by Region

11 Investor Relations Department
Low Cost Carriers
Newly established full service airlines
Traditional full service airlines
Competitors Have Increased Significantly

12 Investor Relations Department
International DestinationsInternational Destinations
Strategic Positioning
Air AsiaTigerJetstar
Nok AirDragon
Shenzhen
Auckland
Guangzhou
Tiruchirapalli
Christchurch
BangaloreChennai
Hanoi
Bandar Seri Begawan
Siem ReapBangkok
Kuala Lumpur
Jakarta
Sydney
Melbourne
Perth
Singapore
Colombo
Dhaka
Phnom PenhHo Chiminh city
Hong Kong
Taipei
Tokyo
Rangoon
Banda Aceh Kota Kinabalu
BandungDenpasar Bali
Johor Bahru
Macau
Penang
Chiang Mai
Guilin
Haikou
Kuching
Surabaya
Krabi
Manado
Medan
PadangPalembang
Pekanbaru
Phuket
Solo CityUjung Pandang
Vientiane
Yogyakarta
Langkawi
Miri
Tawau
Gold Coast
Hat Yai
Brisbane
Darwin
Osaka
Luzon IsManila
Cairns
Kaohsiung
® Made by Ake
® Made by Ake
® Made by Ake
® Made by Ake
® Made by Ake
® Made by Ake
Bangkok
Phuket
Had Yai
Chiang Mai
Chiang Rai
Udorn Thani
Krabi
Ubon Ratchathani
Surat Thani
Nakhon Si Thammarat
Trang
Narathiwat
Domestic DestinationsDomestic Destinations
��
Asia is No Different….

13 Investor Relations Department
0
5
10
15
0
5
10
15
20
25
Domestic Market Regional Market
39.8%
45.2%
15.0%
33.2%
19.1%
47.6%
-2.3%
32.4%
7.4%
Avg. Growth Rate (2003-2010)
3.2%
46.8%
4.4%
83.8%
16.2%
42.2%
55.7%
2.1%
Mn Passengers Market Share Market Share
Market Share of LCCs Up Dramatically
Mn Passengers
Avg. Growth Rate (2003-2010)
2003 2010 2003 2010
THAI Airways
LCCs
THAI Airways
Others
LCCs
Others

14 Investor Relations Department
Middle East HUBEtihadEmiratesQatar
New Strong Competitors from Middle East

15 Investor Relations Department
Competitors’ Fleet Expansion Plan
Existing/Awaiting delivery 15/75 -/5 -/10 11/8 - -/6 -/4 -/6
Competitors’ Fleet and Expansion Plan
0
50
100
150
200
250
300
350
400
EmiratesQatar
EtihadSingapore
CathayMalaysia
VietnamTHAI
Existing
Awaiting delivery
Number
A380

16 Investor Relations Department
2009
2010
2011
2012
2013-2017Ensure
strength and
stability
- Emphasize Customer Value
- Ensure Competitiveness
- Ensure DynamismStrengthen internal Strengthen internal organizationorganization
Build strategic Build strategic competitivenesscompetitiveness
Seek growth Seek growth opportunitiesopportunities
Build operational stabilityBuild operational stability
Overarching Strategic Plan

17 Investor Relations Department
Strategic Roadmap
Overall Strategic Roadmap
Ultimate Goal
“Restore THAI to be the pride of
Thailand around the world,
as a leading Asian carrier
that is consistently
among the top 3 carriers in Asia and top 5 in the
world
for overall customer
experience”
Competitive
Customer-oriented
Dynamic
Core Value
“Striving together towardsa strong and sustainable
THAI”Customer Value Strategy
Commercial Strategy
Corporate Portfolio Strategy
Corporate Social Responsibility Strategy
Strategic Transformation Areas
Route Network and Fleet Strategy
Human Capital & Organization Effectiveness Strategy
Efficiency, Flight Safety and Fuel Management Strategy
Financial Strategy
IT Strategy
1
2
3
4
5
6
7
8
9

18 Investor Relations Department
THAI Wing and Thai Tiger will provide a comprehensi ve product offering for THAI’s product portfolio
Brand positioning matrix for THAI and affiliated co mpanies
Note: * NOK focuses on DMK only; ** Possibilities surrounding expanding fleet to include wide-body aircraft will be evaluated as opportunities ariseSource: Team discussion
Product Offering
Market(Stage length)small* Regional Intercontinentalconnecting
Premium 2 class
Premium 3 class
Premium regional
(wide body)
Domestic
No frill
Premiumfull service
Ill ustrative
Shading indicatesbrand emphasis
TG
StrongLess
THAI Wing
StrongLess Less
Thai TigerStrongLess
NOKSingle emphasis
big
Thai TigerLow cost
Strategic Tools to closing THAI business gap
Narrow body**

19 Investor Relations Department
LOW to MEDIUM
• Domestic focus with some added value and maintaining very low cost
Domestic value-for-moneycarrier
LOW to ULTRA LOW
• No Frills
(max seat density, max utilization)
LOW to MEDIUM
• Low cost base achieved through aspects of LCC model, such as single aircraft type, new fleet, etc.
MEDIUM to HIGH
• Minor improvements could be made in cost efficiency
Cost base
Regional Ultra-low cost carrier
Regional carrier
Premium network carrier
Brand positioningBrand
Product by Cost Base
THAI’s Portfolio
Source: Team discussion and analysis

20 Investor Relations Department
Competition for THAI Wing
Full-service carriersRegional FSCLow-cost carriers
Source: Team discussion and analysis

21 Investor Relations Department
Thai to build short-haul and regional network strength to capture connecting traffic from Europe, Australia, and the Middle East
Selected Kangaroo routes for the ME carriers and TH AI (2009)
THAI
Emirates
Etihad
Gulf
Qatar
Bangkok
Sydney
Melbourne
Perth
Singapore
Brisbane
London
Abu DhabiDubai
Doha
Bahrain
Cost competitiveness is key to developing a robust regional connection to Southeast Asia
from Europe, Australia and the Middle East
THAI Connecting Traffic
Source: Team discussion and analysis
Sapporo
TokyoHaneda
Nagoya
Fukuoka
Intercon trunk routes will be weakened if
THAI is uncompetitive in
regional connections
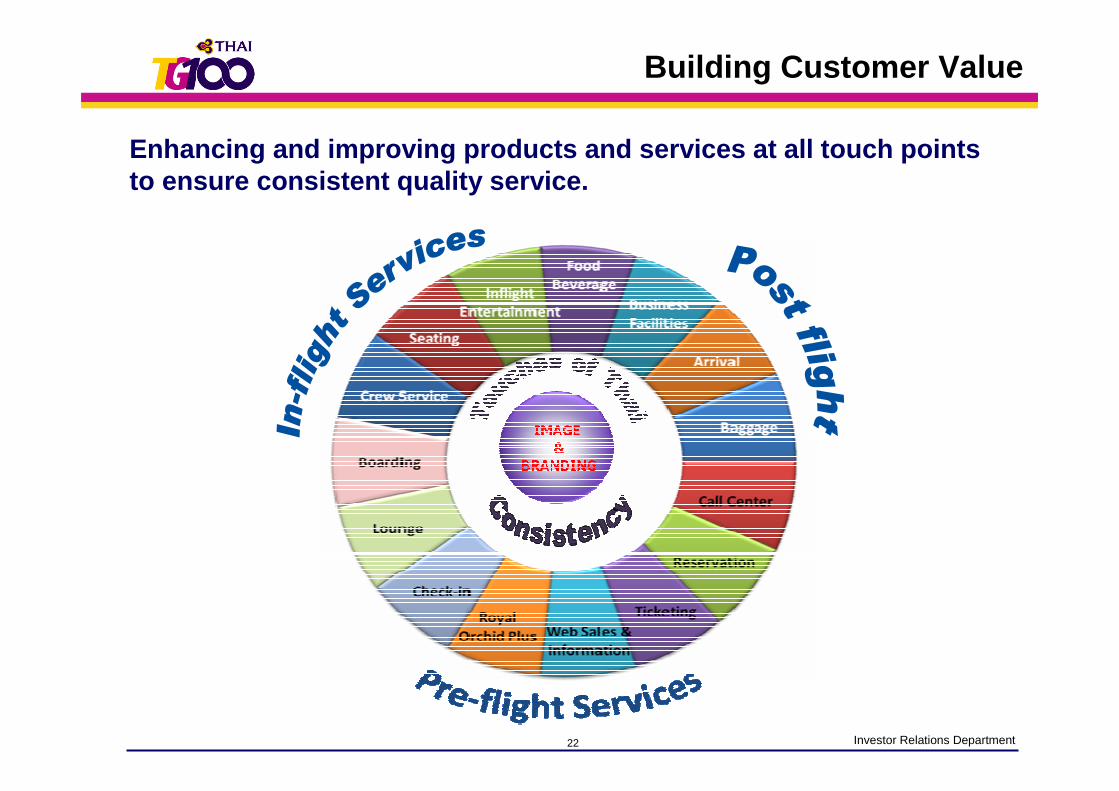
22 Investor Relations Department
Enhancing and improving products and services at all t ouch points to ensure consistent quality service.
Building Customer Value

23 Investor Relations Department
Call CenterCall Center
Premium LoungesPremium Lounges
Increase Selection of Entertainment
Increase Selection of Entertainment
Food & BeverageFood & Beverage
Minimize Time for Baggage Claim
Minimize Time for Baggage Claim
Royal Orchid PlusRoyal Orchid Plus
Product & Service Enhancements

24 Investor Relations Department
E-Service on MobileE-Service on Mobile Internet Booking Internet Booking
E-Payment Services E-Payment Services
Internet check-in with home print boarding pass
Internet check-in with home print boarding pass
Enhance E-Service Capability

25 Investor Relations Department
Check-in via Internet Ticket Sales Via Internet
%
Statistic on Internet Check-in
%
0.0
1.0
2.0
3.0
4.0
5.0
6.0
7.0
8.0
9.0
10.0
Jan
Feb Mar AprMay Ju
n Jul
Aug Sep Aug Nov Dec
0.0
1.0
2.0
3.0
4.0
5.0
6.0
7.0
Jan
Feb Mar Apr
May Jun Jul
Aug Sep Aug Nov Dec
Year 2010
Year 2009
Year 2011
Year 2010
Year 2009
Year 2011

26 Investor Relations Department
To Be Top 3 in Asia and Top 5 in the World
Business Traveler’s Award
Best Ground ServiceBest Lounges
Skytrax 2010
Best Airline Lounge – First ClassBest Airport Services
Norwegian Grand Travel Award
Best Intercontinental Airline
TTG Award
Best Business Class
Best Southeast Asian carrier
Awards and Accolades
The World’s Top Pier Airlines – Skytrax
2010
3
2
1
4
6
5
7
8
4
2
3
1
7
8
6
5
2009
Source: Skytrax
Go Asia Award
Best Asian carrier
Skytrax 2011
Best Airline Seat - Economy ClassBest On Board Catering – Economy Class
2011
1
2
3
4
6
7
8
10
9 10
-9 -
10 9-
5

27 Investor Relations Department
Current Fleet: 88 Aircraft
O = Owned / OL = Operating lease / FL = Financi al lease
Current Fleet
(As of June 2011)
Exc. 2 of ATR-724 of 737-400
Aircraft Type Version # of Aircraft Financial Method
First Business Premium Economy Economy Total
A300-600 36R1 8 0 46 0 201 247 13 O
36R3 5 0 28 0 232 260
A340-500 3452 4 0 60 42 113 215 1 O, 3 FL
A340-600 3461 6 8 60 0 199 267 6 FL
A330-300 3302 12 0 42 0 263 305 10 O, 4 OL, 5 FL
3303 7 0 36 0 263 299
B737-400 7341 5 0 12 0 138 150 2 O, 3 OL
B747-400 7442 6 14 50 0 325 389 13 O, 5 FL
7443 12 10 40 0 325 375
B777-200 7723 8 0 30 0 279 309 6 O, 2 OL
B777-200ER 77E1 6 0 30 0 262 292 6 FL
B777-300 7732 5 0 34 0 330 364 6 FL
7732 TKE 1 0 34 0 325 359
B777-300ER 7739 3 8 30 0 274 312 3 OL
Total 88 40 532 42 3,529 4,143 45 O, 12 OL, 31 FL
# of Seat
leased to Nok

28 Investor Relations Department
*Note : the 5 A330s deferred arrival is included in 2011’s delivery plan
2011 2012 2013 Total
A380-800 3 3 6
B777-300ER 2 6 8
A330-300 5* + 2 3 2 12
Total 7 8 11 26
First Class Seats Business Class SeatsA380-800
Deliveries Over the Next 3 Years
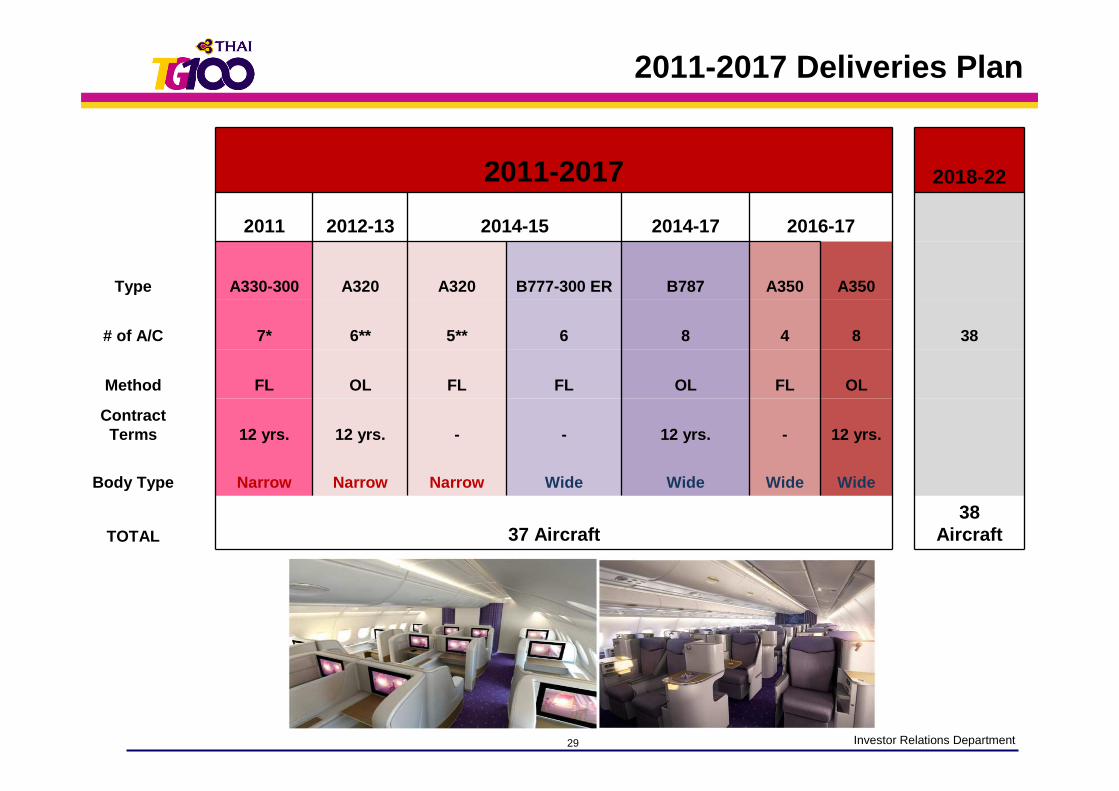
29 Investor Relations Department
2011-2017 2018-22
2011 2012-13 2014-15 2014-17 2016-17
Type A330-300 A320 A320 B777-300 ER B787 A350 A350
# of A/C 7* 6** 5** 6 8 4 8 38
Method FL OL FL FL OL FL OL
ContractTerms 12 yrs. 12 yrs. - - 12 yrs. - 12 yrs.
Body Type Narrow Narrow Narrow Wide Wide Wide Wide
TOTAL 37 Aircraft38
Aircraft
2011-2017 Deliveries Plan

30 Investor Relations Department
< ------------------------------------------ PLAN --------------------------------------------- >TOTAL
2552 2553 2554 2555 2556 2557 5 YEARS
2009 2010 2011 2012 2013 2014 (2010-14)
TOTAL INCOMING AIRCRAFT 3 3 9 12 13 9 49
Previously Approved 3 5 3 3 14
- A330-300 HGW (High Gross Weight) 3 *5 8
- A380-800 3 3 6
Additional Aircraft (New) 3 4 9 10 9 35
- A320 4 2 2 8
- A330-300 2 3 2 7
- B777-300ER 3 2 2 6 3 16
- B787-800 4 4
TOTAL OUTGOING AIRCRAFT 1 5 5 7 11 5 34
- B747-400 (B744) 2 2 2 6
- B777-300ER (Jet Airways) 5 5
- B737-400 1 1 2 4
- A300-600 4 3 3 2 3 15
- A340-500 2 2 4
Re-fleeting to enhance fuel efficiency, increase re liability & enhance overall customer satisfaction
Target avg. fleet age in 2017 = 8.5 yrs from curren t 11.8 yrs
Fleet Plan
*Note : the 5 A330s deferred arrival is included in 2011’s delivery plan

31 Investor Relations Department
OL & FL Aircraft Proportion - PlanOL percent 8.0% 8.1% 8.3% 13.1% 17.2% 17.2%
Note : Based on available slot for purchase
7 7 7 11 15 15
81 80 77 7372 72
0
10
20
30
40
50
60
70
80
90
100
2009 2010 2011 2012 2013 2014
OL Own & FL
Aircraft Proportion

32 Investor Relations Department
ZIM will be providing economy class seats and enabl ing the 5 new A330-300 aircraft to join the fleet in the following months.
A330-300
Resolving Koito Seat Problem
Delivery March April May June July

33 Investor Relations Department
� Sept. 2011 – Jun. 2012
B747-400No. 7-12
B777-200
6
8
B777-300 6
B747-400No. 13-18
6
Airbus340-600 6
B777-200ER 6
Airbus340-500
4
Retrofitte
d
Retrofitte
d
Retrofitte
d
Retrofitte
d
First Business Economy# of Aircraft Tentative Completion
� Completed
� May – Dec. 2011
� Feb. 2012 – Oct. 2012
� 2013
� 2014
� 2014
Upgrades and Retrofit Schedule

34 Investor Relations Department
Business Class Seats
• Leased 3 B777-300ER aircraft from Jet Airways for 3 years
• Another 2 B777 – 300ER will be leased from Jet Airwa ys beginning October 2011
• Used on European flights and to replace routes wher e older A330-300 aircraft flies in the region
Economy Class SeatsHigh level of Privacy
First Class Seats
Aircraft lease to Supplement Capacity

35 Investor Relations Department
2011-2013 2014-2017 2018-2022 Total
Medium sized body aircraft 26 21+17 = 38 47 + 17 = 64
Narrow body aircraft 11 - 11
Total 37 38 75
Avg. Fleet Age to Drop to 7.6 yrs.
Age : yrs
Long-term Fleet Strategy
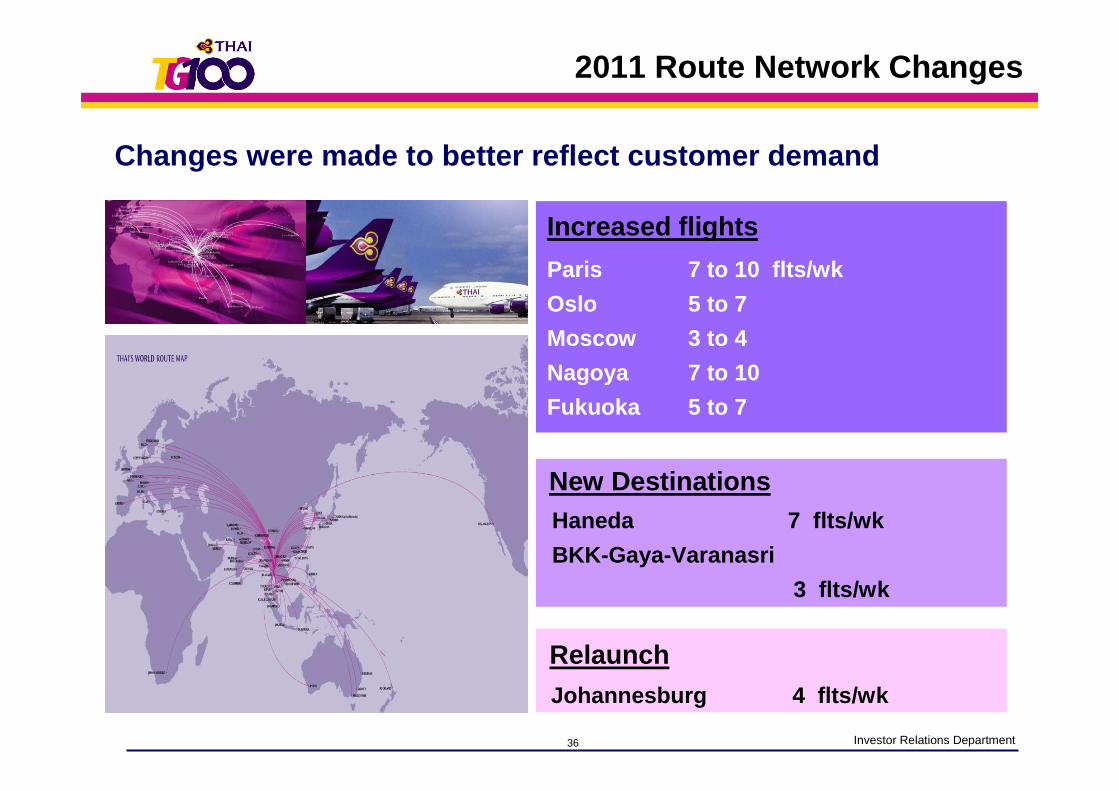
36 Investor Relations Department
Suspension routes
Paris 7 to 10 flts/wk
Oslo 5 to 7
Moscow 3 to 4
Nagoya 7 to 10
Fukuoka 5 to 7
Changes were made to better reflect customer demand
Increased flights
New DestinationsHaneda 7 flts/wk
BKK-Gaya-Varanasri
3 flts/wk
RelaunchJohannesburg 4 flts/wk
2011 Route Network Changes

37 Investor Relations Department
THAI is committed to achieving the THB 20,000 mn cos t reduction target agreed to with the Ministry of Finance through 2012
Strategy to Reign in Costs
� Improved fuel management
� Increased proportion of ticket sales via
internet & minimize commission payment
� Launched early retirement program / Mutual
separation plan / Continue to offer Golden
Handshakes / Use of Wingspan / Manage
reduction in crew accommodation cost
� Reduction of management & admin.
Expense
� Continued to negotiate with all suppliers
� No pay leave project
� Changed approach in undertaking marketing
and advertising initiatives
THB mn
Further Cost Control Measures
3,467 mn baht or 3.6% below budget
3,215
6,897
10,697
0
4,000
8,000
12,000
2010 2011 2012
Yearly Cost Reduction Targets
Was able to reduce non-fuel related cost by
THB 252 mn or a 7.8% reduction
THB 20,000 mnTHB mn
2010 Expense Compared to Budget
93,14796,614
60,000
80,000
100,000
2010 Budget

38 Investor Relations Department
>20<30%
1m 2m 3m 4m 5m 6m 7m 8m 9m 10m 11m 12m 13m 14m 15m 16m 17m 18m >18 months
>80%
<=20%
>60<=80%
>30<=60% VP, Director and Department Level Decision
Board Authority
Board Authority
Fuel Price Risk Management Committee
(President, EVP Finance & Accounting, VP, Director and Department)
Hedging Volume
Contract Period
Minimum 20% fuel hedging requirement to mitigate ri sk of rapid fuel cost riseMinimum 20% fuel hedging requirement to mitigate ri sk of rapid fuel cost rise
Fuel Management

39 Investor Relations Department
Monthly fuel hedging 2008-2011 - % of consumption by month
Percentage of Fuel Surcharge & Hedging Coverage
Hedging combined with fuel surcharge greatly mitiga tes fuel price fluctuation risk
Fuel Management57
% 65%
62%
56%
51%
51% 61%
65%
69%
72%
72%
63%
123%
131%
163%
199%
143%
116%
82% 10
2%
91% 11
8%
112%
102% 110%
104% 116%
98%
74% 94
% 106%
111%
103%
109%
101%
102%
73%98
%
88%
87%
Jan-0
8
Feb
-08
Mar
-08
Apr
-08
May
-08
Jun-0
8
Jul-08
Aug-0
8
Sep
-08
Oct
-08
Nov-
08
Dec
-08
Jan-0
9
Feb
-09
Mar
-09
Apr
-09
May
-09
Jun-0
9
Jul-09
Aug-0
9
Sep
-09
Oct
-09
Nov-
09
Dec
-09
Jan-1
0
Feb
-10
Mar
-10
Apr
l10
May
10
Jun10
Jul1
0
Aug10
Sep
10
Oct
-10
Nov-
10
Dec
-10
Jan-1
1
Feb
-11
Mar
-11
Apr
-11
0% 0% 0% 0% 3%
17%
38%
41%
44%
44%
49%
35%
27%
20%
23%
3% 3% 7% 13%
13%
17%
20% 27%
30% 44
%44
%
44%
47%
47%
47%
69%
69%
69%
69%
69%
69% 78
%
78%
78%
41%
41%
41%50
%
50%
50%
51%
51%
51%
Jan-
08
Mar
-08
May
-08
Jul-0
8
Sep
-08
Nov
-08
Jan-
09
Mar
-09
May
-09
Jul-0
9
Sep
-09
Nov
-09
Jan-
10
Mar
-10
May
-10
Jul-1
0
Sep
-10
Nov
-10
Jan-
11
Mar
-11
May
-11
Jul-1
1
Sep
-11
Nov
-11

40 Investor Relations Department
THAI is the first Asian airline to sign an agreement with IATA to find means to mitigate fuel
Carbon FootprintCarbon Footprint
Carbon OffsetCarbon Offset
• Launched the carbon offset program
1st
airline
Emissions TradingEmissions Trading
Amount of CO 2 ~1.07 mn tons
• CERs 0.47 mn tons THB 239 mn
• EUAs 0.60 mn tons THB 407 mn
•Determined the carbon foot print of 2 meals and provided labeling for customers to choose
2012 Monetary Value
THB 646 mn
Emissions Control

41 Investor Relations Department
� Geared for BUs to enhance efficiency in decision process & management
� Signed “Service Level Agreements”
Project Changes Made
Uphold the principles of Good Corporate Governance
Invest in IT
Facilitate means to expedite decision making
� IT capability improves not only efficiency, decisio n making but also enhances customer satisfaction
� Reduce steps to improve decision process
� Ensuring transparency in all areas of operations
� Whistle Blower Policy
Structural change to enhance flexibility but also responsibility
� Senior management having clear cut KPIs and compensation is measured accordingly
Performance-based Culture
Improvements in Dynamism

42 Investor Relations Department
4,290 MTHB 2,507 MTHB
EC Rescinded all charges against THAIUS Cargo DOJ Stopped further proceedingsUS Cargo Class Action Settled by paying USD 3.5 mnKorea Pending charges is for KW 2.85 mn
Wrote back a portion of reserves that were set aside
Pending Legal Issues

43 Investor Relations Department
Raised 15,000 MTHB in new equity
Raised 15,000 MTHB in new equity
Received additional borrowing from financial
institutions
Received additional borrowing from financial
institutions
Obtained Revolving Credit Lines
Obtained Revolving Credit Lines
Cash to Total Revenue
2009 20102008
3.042.66
1.30 1.45
0
1
2
3
4
5
2009 20102008
Net interest bearing Debt to Equity
Improved Cash PositionImproved Cash Position
Capital Structure StrengthenedCapital Structure Strengthened
Improved Capital Structure
Q1’2011
8,000 MTHB Debentureissued in May 13, 20118,000 MTHB Debentureissued in May 13, 2011

44 Investor Relations Department
THAI’s share price reflects the confidence in the impro ved health of the Company
0
5
10
15
20
25
30
35
40
45
50
55
60
4/1/094/4/09
4/7/094/10/09
4/1/094/4/09
4/7/094/10/09
4/1/104/4/10
4/7/104/10/10
4/1/114/4/11
THB/share
Implemented recovery plan
Share price peaked at THB
57.75 upon being inducted back into the MSCI
103.61USD/bbl
137.57 USD/bbl
Fuel price
Cash flow crisis
Success recapitalization
Drafted & implemented
strategies under TG 100
@ 9 Dec. ‘10@ 20 Apr. ‘11
MSCI = Morgan Stanley Capital International
Resulting Success

45 Investor Relations Department
Financial Performance

46 Investor Relations Department
Performance Summary (Q1/2011)THAI and its subsidiary
(Units : MTHB)
Total Revenue 51,851 49,806 Total Expense -46,468 -43,061
Foreign currency exchange (Gain) -3,358 5,698
Share of losses of investments by the equity method 38 -7
Profit(Loss) before finance costs, income tax 2,063 12,436
Financial Cost -1,309 -1,345
Income tax expense -121 -499
Net profits (losses) 633 10,592
Profits (losses) Attributable to:
Non controlling interest -15 -20
Equity holders of the parent 618 10,572
20102011
Jan-Mar
Financial Performance

47 Investor Relations Department
Operating / Total Revenue (Q1/2010 & Q1/2011)
40,631 41,935
6,0256,751228 204
2,1352,029
12031
861706
0
10,000
20,000
30,000
40,000
50,000
60,000
Q1'10 Q1'11
Passenger Freight Mail Other activities Interest income Other income
% to Revenue % Change Tot. Rev.
Passenger 3.21 80.88
Freight 12.05 13.02
Mail 10.19- 0.39
Other activities 5.19 4.12
Interest income 291.51 0.23
Other income 18.06- 1.36
Total Income 4.11 100.00
*Operating Rev. up 4.32%
Operating Revenue Total Revenue
*Excludes Interest & Other incomeOperating revenue Q1’10 = 48,913 MTHBOperating revenue Q1’11 = 51,025 MTHB
Total revenue Q1’10 = 49,805 MTHBTotal revenue Q1’11 = 51,851 MTHB
Units : MTHB
Financial Performance

48 Investor Relations Department
7,670 7,739
14,29117,510
4,9885,091
2,2202,381
1,3471,3512,749
2,4945,2154,795
1,436
498
0
10,000
20,000
30,000
40,000
50,000
Q1'10 Q1'11
Personnel Fuel and Oil Flight Service Expense
Inventory&Supply Crew Expense Aircraft Maintenance
Depreciation Lease of a/c
**Operating Exp. Up 7.30%
Total ExpenseOperating Expense
% Change % of
Expense YoY Tot. Exp.Personnel expense 0.90 15.53
Fuel and oil 22.52 35.14
Flight service expense 2.06 10.22
Inventories and supplies 6.74- 4.46
Crew expense 0.32- 2.70
Maintenance/overhual 9.25- 5.01
Depreciation/amortisation 8.05- 9.62
Aircraft lease/spare parts 188.51 2.88
Other expense 504.00- 14.44
**Total Expense 33.36 100.00
Operating / Total Expense (Q1/2010 & Q1/2011)
** Excludes FX & Impairment lossesOperating expense Q1’10 = 42,973 MTHBOperating expense Q1’11 = 46,111 MTHB
Total expense Q1’10 = 37,362 MTHBTotal expense Q1’11 = 49,826 MTHB
Units : MTHB
Financial Performance

49 Investor Relations Department
Ratios – Q1’2010 & Q1’2011
Ratios units Q1’10 Q1’11Earnings Per Share (THB) 6.22 0.28
EBIT (MTHB) 6,037 4,960
EBITDA (MTHB) 11,252 9,755
EBITDAR (MTHB) 11,750 11,191
Book Value (MTHB) 63,670 76,712
Book Value per Share (THB) 37.48 35.14
Total Debt to Equity (Times) 3.90 2.80
Net Debt to Equity (Times) 2.35 1.88
Debt Service Coverage (Times) 2.00 1.50
Interest Coverage (Times) 8.40 7.50
Operating Profit Margin (%) 12.30 9.70
Net Profit Margin (%) 21.60 1.20
EBITDA Margin (%) 23.00 19.10
Return on Total Assets (%) 3.80 0.80
Return on Total Equity (%) 20.10 0.20
Financial Performance

50 Investor Relations Department
Foreign Currency Exposure (Year 2010)Surplus
or DeficitAmount % Amount % Amount Amount % Amount %
USD BASED 85,801 48 89,994 60 4,193- 1,977 1 1,212 1
USD 18,604 79,340
Others(1) 67,197 10,654
EUR BASED 35,210 20 8,030 5 27,180 49,796 34 50,584 35
EUR 16,809 5,623 Others(2) 18,401 2,407
JPY 13,509 7 3,980 3 9,529 13,766 9 13,766 9
THB 45,753 25 47,228 32 1,475- 80,741 55 80,741 55
TOTAL 180,273 100.00 149,232 100.00 31,041 146,280 100 146,303 100
Outstanding BorrowingsAfter Swap
Revenue ExpenseBefore Swap
Unit : MTHB
25%
20%
48%
7%
Revenue Expense Outstanding
60%
5%3%
32%
1%
35%
9%
55%
USD BASED EUR BASED JPY THB
Financial Performance

51 Investor Relations Department
Proportion of Fixed and Float
31%69%
Fixed Float
Percentage of TOTAL (TOTAL = 144,738 MTHB)
47%
53%
Fixed Float
Percentage of TOTAL (TOTAL = 144,797 MTHB)
Before Swap After Swap
(As of Apr 2011)
Financial Performance
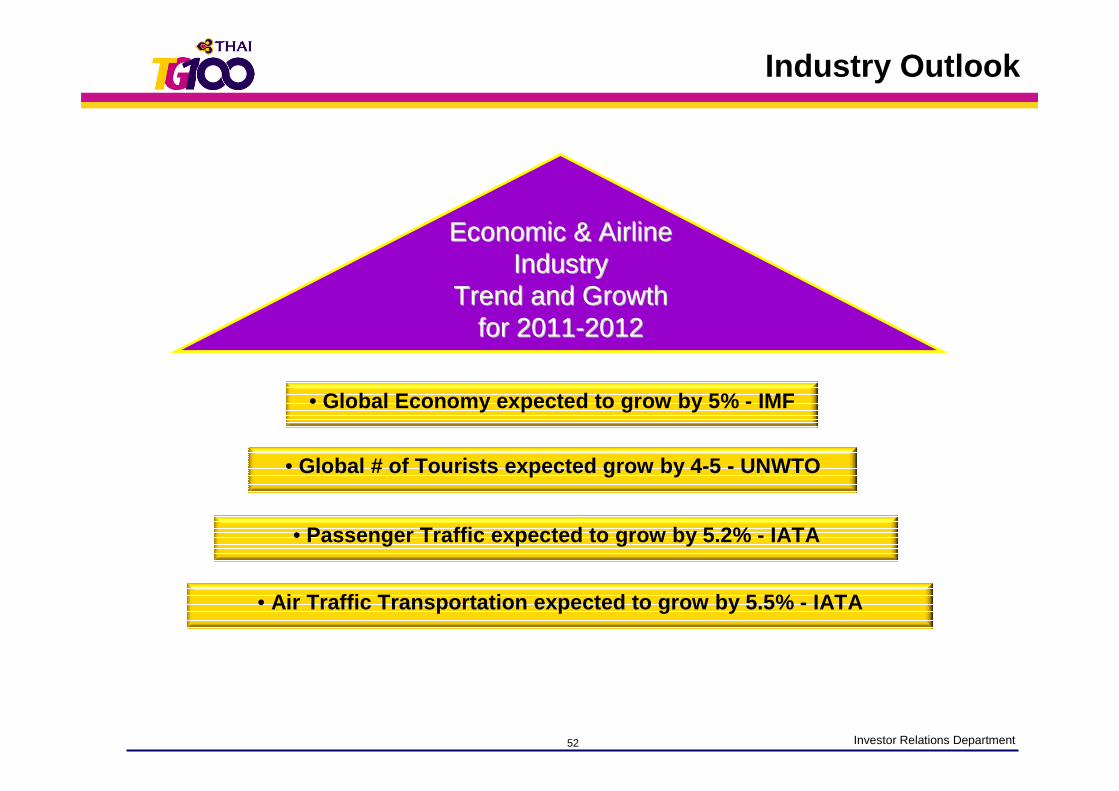
52 Investor Relations Department
• Global Economy expected to grow by 5% - IMF
• Global # of Tourists expected grow by 4-5 - UNWTO
• Passenger Traffic expected to grow by 5.2% - IATA
• Air Traffic Transportation expected to grow by 5.5% - IATA
Economic & Airline Economic & Airline Industry Industry
Trend and Growth Trend and Growth for 2011for 2011--20122012
Industry Outlook

53 Investor Relations Department
Passenger from / to Thailand Forecast 2011-2017
0
5
10
15
20
25
30
35
40
45
50
03/04 04/05 05/06 06/07 2008 2009 F 2010 F 2011 F 2012 F 2013 F 2014 F 2015 F 2016 F 2017
TG ForecastActual
25.9M
20.6M
5.3M
9.9M
Inter. 3.2%
Reg. 2.7%
Intercont. 5.0%
Dom. 5.2%
ThailandPassengers
(Millions)
2011-2017
International 5.5 %
Regional 5.5 %
Intercont. 5.5 %
Domestic 4.2 %
48.0M48.0M
37.2M
17.4M
10.8M
4.04.0%%
5.3%5.3%
5.2%
5.2%5.2%
30.3M
23.5M
12.7M
6.8M
IATA International Passenger Forecast 2010 2011 2012 2013 2014 CAGR2011-2014(As September 2010) World 7.9% 4.9% 5.4% 5.4% 5.4% 5.3%
Asia Pacific 11.6% 7.2% 6.9% 6.5% 6.1% 6.7%
2.8%
9.7%
8.5%
8.8%
Estimate
4.6%
6.0%
6.3%
6.3%
32.9M
25.5M
13.1M
7.5M
37.2M
28.8M
14.3M
8.4M
Industry Outlook

54 Investor Relations Department
Appendix

55 Investor Relations Department
Passenger Carried
4,6844,114 4,589 5,088 5,167
3,6624,371 4,833 4,923
4,168
-
2,000
4,000
6,000
Q1'09 Q2'09 Q3'09 Q4'09 Q1'10 Q2'10 Q3'10 Q4'10 Q1'11 Q2'11
(’000)
Freight Carried
113,735124,819
140,889
167,341 166,155
179,329 180,341173,638
188,109
172,749
100,000
130,000
160,000
190,000
Q1'09 Q2'09 Q3'09 Q4'09 Q1'10 Q2'10 Q3'10 Q4'10 Q1'11 Q2'11
(Tons)
Year 2009 Year 2010
Year 2009 Year 2010
Operating Statistics
Year 2010 = 18.2 million (decreased 1.7% YoY)
Year 2010 = 713,931 tons (increased 30.8% YoY)
Year 2011
Q2/11 (E) = 4.2 million (increased 12.5% YoY)
Q2/11 (E) = 173,638 tons (decreased 3.2% YoY)
Year 2011
(E)
(E)

56 Investor Relations Department
C/FRPKASK
Passenger 7
5.2
77.
2
76
.8
71.
1
62.2
65.
1 71.
3
76.
1
74.
3
75
.1
74.
0
77.0
82.0
82.
3
78.8
72
.1
56.
7
65
.3 76.
3
74.
6
73
.1
74
.3
71.8
75
.3
77.8
77
.6
73
.0
71.8
61.9
60.9
-
2,000
4,000
6,000
8,000
Jan-
09
Feb
-09
Mar
-09
Apr
-09
May
-09
Jun-
09
Jul-0
9
Aug
-09
Sep
-09
Oct
-09
Nov
-09
Dec
-09
Jan-
10
Feb
-10
Mar
-10
Apr
-10
May
-10
Jun-
10
Jul-1
0
Aug
-10
Sep
-10
Oct
-10
Nov
-10
Dec
-10
Jan-
11
Feb
-11
Mar
-11
Apr
-11
May
-11
Jun-
11
-
20.0
40.0
60.0
80.0
100.0
(%)Year 2009 Year 2010 Year 2011
(Million)
Jun'11(E) Jun'10 YoY% Q2'11(E) Q2'10 YoY% Year'10 Year'09 YoY% MASK 6,731 5,919 13.7 19,545 17,972 8.8 75,600 72,031 5.0 MRPK 4,099 3,867 6.0 12,660 11,605 9.1 55,676 52,593 5.9 Cabin factor% 60.9 65.3 6.8- 64.8 64.6 0.3 73.6 73.0 0.9
YoY (Month) YoY (Year)YoY (Quarter)
Operating Statistics
(E)

57 Investor Relations Department
40.2
44.5
49.7
46.1
47.9
51.8
50.6 52
.4 58.8
59.3
61.8
58.3
54.4 60.5
63.9
62.4
66.9
65.0
61.3
60.4
62.2
62.5
60.8
57.9
53.7
56.6 60.1
58.0
57.8
57.4
-
200
400
600
Jan-
09
Feb-
09
Mar
-09
Apr
-09
May
-09
Jun-
09
Jul-0
9
Aug
-09
Sep
-09
Oct
-09
Nov
-09
Dec
-09
Jan-
10
Feb-
10
Mar
-10
Apr
-10
May
-10
Jun-
10
Jul-1
0
Aug
-10
Sep
-10
Oct
-10
Nov
-10
Dec
-10
Jan-
11
Feb-
11
Mar
-11
Apr
-11
May
-11
Jun-
11
-
20.0
40.0
60.0
80.0
(Million) (%)
Freight
F/FRFTKADTK
Jun'11(E) Jun'10 YoY% Q2'11(E) Q2'10 YoY% Year'10 Year'09 YoY% MADTK 397 383 3.7 1,240 1,125 10.2 4,708 4,016 17.2 MRFTK 228 249 8.4- 716 729 1.8- 2,895 2,092 38.4 Freight Factor% 57.4 65.0 11.7- 57.7 64.8 10.9- 61.5 52.1 18.0
YoY (Month) YoY (Quarter) YoY (Year)
Year 2009 Year 2010 Year 2011
Operating Statistics
(E)

58 Investor Relations Department
2.41
2.32
2.22
2.05 2.08 2.13
1.90
1.81 1.92 2.
05
1.85 2.
02 2.14
2.35
2.26
2.16
2.07 2.
23
2.03
1.99
2.01 2.
11
1.97 2.
12 2.16 2.
292.36
2.42
2.42
1.00
1.50
2.00
2.50
Jan Feb Mar Apr May Jun Jul Aug Sep Oct Nov Dec
Year 2009 Year 2010 Year 2011
(THB/Km)
Passenger Yield (Excluding Fuel Surcharge)
Passenger Yield (Including Fuel Surcharge)
2.51 2.
642.
602.70 2.
78 2.84
2.27
2.44
2.30
2.212.
32
2.56
2.54
2.49
2.72
2.72
2.56
2.402.
55
2.45
2.42
2.44
2.68
2.542.
632.73 2.742.
822.87
2.00
2.50
3.00
Jan Feb Mar Apr May Jun Jul Aug Sep Oct Nov Dec
Year 2009 Year 2010 Year 2011
(THB/Km)
Operating Statistics
(E)
(E)

59 Investor Relations Department
Freight Yield (Excluding Fuel Surcharge)
6.98
7.02
7.72
7.01
6.62
7.13
7.47
6.67
6.69 7.
01 7.08
7.48
7.53
7.33
6.91
6.96
7.44 7.51
7.18 7.
30
6.89
7.37
7.12 7.
42
7.017.
08
6.94
6.77
6.83
6.00
7.00
8.00
Jan Feb Mar Apr May Jun Jul Aug Sep Oct Nov Dec
Year 2009 Year 2010 Year 2011
(THB/Km)
Freight Yield (Including Fuel Surcharge)
9.659.
85
9.43
9.35
9.04
8.88
8.618.
90
8.19
9.17
8.50
8.02
8.71
9.74
9.44
9.379.
84
9.309.539.659.
89
9.30
9.109.08
9.66
9.459.70
9.65
7.00
8.00
9.00
10.00
Jan Feb Mar Apr May Jun Jul Aug Sep Oct Nov Dec
Year 2009 Year 2010 Year 2011
(THB/Km)
Operating Statistics
(E)
10.0
5(E
)