universitat de les illes balearsibdigital.uib.cat/.../collect/tesisuib/index/assoc/... · esta...
TRANSCRIPT

Universitat de les Illes Balears
DEPARTAMENTO DE QUÍMICA
DOCTORADO EN CIENCIA Y TECNOLOGÍA QUÍMICA
Exploiting novel automated analytical methodologies
for the monitoring of environmental organic pollutants,
and its potential incorporation to environmental
monitoring regulations
CARLOS RODRÍGUEZ-NAVAS GONZÁLEZ
2012


UNIVERSITAT DE LES ILLES BALEARS
Departamento de Química
El Dr. Víctor Cerdà Martín, Catedrático de Química Analítica del Departamento de
Química de la Universitat de les Illes Balears y
El Dr. Rafael Forteza Coll, Catedrático de Química Analítica del Departamento de
Química de la Universitat de les Illes Balears
HACEN CONSTAR:
Que el presente trabajo titulado "Exploiting novel automated analytical
methodologies for the monitoring of environmental organic pollutants, and its
potential incorporation to environmental monitoring regulations" ha sido realizado
por Carlos Rodríguez-Navas González en el Área de Química Analítica del
Departamento de Química Analítica de la Universitat de les Illes Balears, como requisito
para optar al Título de Doctor en Ciencias Experimentales y Tecnología (Química), con
Mención Europea
Palma de Mallorca, 3 de Septiembre de 2012
Dr. Víctor Cerdà Martín Dr. Rafael Forteza Coll

UNIVERSITY OF THE BALEARIC ISLANDS
Chemistry Department
Dr. Víctor Cerdà Martín, Professor of Analytical Chemistry at the Chemistry
Department of the University of the Balearic Islands and
Dr. Rafael Forteza Coll, Professor of Analytical Chemistry at the Chemistry
Department of the University of the Balearic Islands
CERTIFY:
That the present work entitled "Exploiting novel automated analytical
methodologies for the monitoring of environmental organic pollutants, and its
potential incorporation to environmental monitoring regulations" has been
developed by Carlos Rodríguez-Navas González in the area of Analytical Chemistry at
the Chemistry Department of the University of the Balearic Islands, as a requirement to
obtain the degree of Doctor in Chemical Science and Technology, with European
mention.
Palma de Mallorca, 3 de Septiembre de 2012
Dr. Víctor Cerdà Martín Dr. Rafael Forteza Coll


A mis padres, Luis y Mercedes.
(To my Parents)

AGRADECIMIENTOS
Echando la vista atrás, sin duda un importante desafío al que me enfrento en esta
memoria corresponde a la parte de agradecimientos. Han sido años de grandes
cambios, de mucho trabajo y en los que han intervenido muchas personas en mi vida,
tanto personal como investigadora. Espero ser capaz de mostrar la gratitud que les
debo a todos de igual forma que la siento:
Al Ministerio de Ciencia e Innovación de España, por haberme otorgado una beca
pre doctoral y una ayuda para una estancia en Copenhague, sin la cual no hubiera
podido optar al título de Doctor.
Al Consell Insular de Mallorca, por la financiación a través de diversos proyectos
para el análisis de compuestos orgánicos volátiles.
A la Universidad de las Islas Baleares y la Universidad de Copenhague, por
permitirme desarrollar mi labor investigadora en sus centros.
Al Dr. Víctor Cerdà, jefe del grupo de Química Analítica, Automatización y
Medioambiente, por haber confiado en mí hace cuatro años dándome un lugar en el
que crecer como investigador.
Al Dr. Rafael Forteza, por estos cuatro años de aprendizaje, y de los cuales además
me llevo una amistad sincera que espero dure para siempre.
A todos los trabajadores de las empresas participantes en nuestros proyectos:
TIRME, EMAYA y LABAQUA, con especial aprecio a la Dra. Amalia Cerdà, Xisco
Amaya y Gonzalo del Valle de TIRME y a la Dra. Dolores Mateo de EMAYA, por sus
horas de trabajo, ayuda y asesoramiento, siempre ofreciendo su mejor versión.
A la Dra. Kristine A. Krogh y demás miembros del laboratorio de Advanced Drug
Analysis de la Facultad de Ciencias Médicas y de la Salud de la Universidad de
Copenhague: Martin, Søren, Gitte, Frederik, Bjarne, Susanne, Jesper, Keneth y
compañía. Por haberme enseñado tanto, y haber tenido la suerte formar parte de un
grupo de trabajadores y personas extraordinarias. Mi casa es vuestra casa.
Y por supuesto a mis compañeros de laboratorio, a los que espero no haber
cansado con mis canciones, bailes y chistes. No escribo el nombre de todos porque son
tantos que me perdería: cantidad de compañeros, doctores, becarios, profesores y
técnicos, sin olvidar los innumerables visitantes que han pasado por nuestro grupo a lo
largo de estos años. A pesar de haber sido durante mucho tiempo el “bicho raro de los
malos olores”, han sido años llenos de recuerdos imborrables que han dado lugar a
algunas grandes amistades y que han provocado en mí una maravillosa evolución
personal fruto de tanta buena gente conocida. Todos vosotros habéis aportado algo

positivo a mi vida. Ojalá el sentimiento sea mutuo.
A todos vosotros os doy las gracias más sinceras por todos los momentos vividos,
las enseñanzas y recuerdos que me llevo.
En la parte personal, han sido cuatro años cargados de emociones y sentimientos
enfrentados. Muchas personas nos han dejado, llenando este camino de obstáculos
que uno, por fuerza, aprender a esquivar.
Gracias a mi madre Mercedes, mis hermanos, Luis, Guillermo, Miguel y Pablo, a
Adriana y mis sobrinos Iker y Miguel, por ser parte de mí a pesar de los pesares,
levantándonos juntos las veces que hayamos podido caer. La familia no se elige, y a mí
me ha tocado una de las buenas.
Esta Tesis Doctoral ha sido el fruto de un trabajo constante y difícil, casi siempre en
solitario y sin recompensas, que no hubiera sido posible sin tres de las mejores
personas que hay en este Mundo. Quiero terminar mis agradecimientos con ellas
porque son las más especiales:
Dr. Erland Björklund, aquel que un día el destino colocó en la mesa de al lado, y sin
buscarlo se convirtió en la persona que me ha orientado, enseñado y dirigido en el
mundo de la investigación, siendo además un gran amigo en los momentos difíciles.
Muchas gracias a ti, Erland, y a Karin y al resto de “mi familia sueca”. Como siempre te
digo: “eres como el cuarto hermano mayor que nunca tuve…”.
Dr. Fernando Maya, la persona a la que más debo en este laboratorio, compañero
de tantas aventuras que uno ya pierde la cuenta y, seguramente, la persona más
preparada para la investigación que conozco. Su marcha del laboratorio para ir con la
élite dejó un hueco que no se va a llenar, así que no pierdo la esperanza de seguir
compartiendo laboratorio en el futuro. Gracias “compadre” por llenarme todos los vasos
“medio-vacíos”.
Y por último y más importante, mi mujer, Isabel, mi otro yo, la mejor persona que
pude encontrar, la que ha compartido conmigo cada momento sin esperar nada a
cambio, y con la que espero llenar de vidas nuestro futuro. Es sin duda la que mejor
conoce el esfuerzo que ha supuesto esta Tesis para mí y la que más la ha sufrido junto
a mí. Gracias. Te quiero.
Esta Tesis va dedicada a la memoria de mi Padre, Luis, quien se empeñó en
complicarme los dos últimos años y al que tanto echamos de menos.

ACKNOWLEDGEMENTS
Looking back over the years, one big challenge that I face in this PhD Thesis
certainly arises from the acknowledgments part. These have been years of great
changes, a lot of work and where many people get involved in my life, both personal and
researcher. I hope to be able to show the gratitude that I owe them all in the same way
as I feel it:
Spanish Ministry of Education and Sciences, for giving me a pre-doctoral scholarship
and the financial support that helped me to make a stay in Copenhagen, essential to go
for the PhD Degree.
Consell Insular de Mallorca for the financial support on the identification of volatile
organic compounds
Dr Victor Cerdà, head of the Analytical Chemistry, Automation and Environment
Group, for trusting me four years ago by giving me a place where to grow as a
researcher.
Dr. Rafael Forteza, for these four years of learning which took me a sincere
friendship which I hope will last for many years.
All employees of the companies participating in our projects: TIRME, LABAQUA and
EMAYA. A special appreciation goes to Dr. Amalia Cerdà, Xisco Amaya and Gonzalo
del Valle from TIRME, and Dr. Dolores Mateo from EMAYA, for their labour time, always
offering help and advice with the best of their professionalism.
Dr. Kristine A. Krogh and other members of the Advanced Drug Analysis Laboratory,
Faculty of Medical Sciences and Health, University of Copenhagen: Martin, Søren, Gitte,
Frederik, Bjarne, Susanne, Jesper, Kenneth, and so on; for having taught me so much
as part of a group of extraordinary people. My home is your home.
To my lab mates, who I hope will not be tired with my songs, dances and jokes. I do
not write the list of names of all of them since there are so many that I would get lost:
colleagues, professors and technicians, also mentioning the countless visitors who have
passed through our group over the years. Despite having been long time the "freak of
bad odours", these have been years full of unforgettable memories that have led to
some great friendships and have caused me a wonderful fruit of personal growth owing
the so many good people met along the way. I wish the feeling is reciprocal.
To all of you I thank you sincerely for all the moments experienced, knowledge and
memories that I take with me.
On the personal side, these four years have come full of emotions and mixed

feelings. Many people have left us, filling the course with obstacles that I had to learn
how to avoid.
Thanks to my mother Mercedes, my brothers, Luis, Guillermo, Miguel y Pablo,
Adriana and my nephews Iker and Miguel, for being always a part of me, raising us up
together as often as we could fall. Families cannot be chosen, and I got one of the good.
This Doctoral Thesis has been the fruit of constant and hard work, often alone and
without rewards. Ii would not have been possible without three of the most incredible
people that live in this World. I want to finish the acknowledgments with them as long as
they are the most important:
Dr. Erland Björklund, that the fate one day placed on the table next to mine and,
without trying, became the one who guided, taught and directed me, furthermore
becoming a friend in the hard times. Thank you very much to you, Erland, and Karin and
the rest of my Swedish family. As I like to say, "You are like the 4th big brother I never
had…"
Dr. Fernando Maya, the person to whom I owe the most in this laboratory, fellow of
so many stories and the person most incredibly prepared for the research that I know.
His departure left a hole in the lab that has not been filled yet, but I do not lose any hope
to keep on sharing laboratory in the future.
And finally and most importantly, my wife, Isabel, my other self, the best person I
could find, which has shared with me all this time without expecting anything in return.
She is undoubtedly the one who knows best the effort that has brought this thesis to me.
Thank you. I love you.
This Thesis goes dedicated in loving memory of my father, Luis, who tangled me the
last two years and whom we all deeply miss in our lives.

RESUMEN
Las actividades humanas llevan asociadas, en la mayoría de los casos, la emisión a
gran escala de contaminantes (muchos de ellos compuestos orgánicos) que suponen
un peligro inminente para la salud humana y el medioambiente. Alrededor de 100 000
productos químicos han sido catalogados hasta el día de hoy, siendo a priori todos ellos
potencialmente susceptibles de generar peligro a corto, medio o largo plazo. Sólo un
pequeño porcentaje de estos compuestos ha sido estudiado para la evaluación de los
daños en humanos o en el medioambiente. Se puede considerar que se desconocen
los impactos reales de la gran mayoría de estos compuestos.
El seguimiento de los niveles de concentración ambiental de los contaminantes
mediante la monitorización periódica es el método más empleado actualmente para
conocer el estado de polución (degradación) de un determinado medioambiente. En
función de los niveles de contaminación medidos se deben tomar las medidas efectivas
pertinentes para reducir dichas emisiones y restablecer el medioambiente dañado lo
más rápido posible. Estas medidas efectivas deben reflejarse en leyes de protección
ambiental que restrinjan las actividades humanas contaminantes y favorezcan las
actividades sostenibles con el medioambiente. A pesar de los avances en investigación
en el campo de la química analítica y sus aplicaciones ambientales, muy escasos
compuestos son todavía considerados contaminantes prioritarios, y por tanto, el número
de compuestos reglamentados en leyes que regulan sus emisiones (fijando valores
umbral de emisión) se limita a menos de un centenar. Los intereses económicos
actuales no permiten que los avances científicos en el campo de la protección
medioambiental sean aplicados en medidas efectivas que repercutan en el bienestar
del conjunto de la sociedad, y en general sólo se actúa en caso de catástrofes
ambientales.
Por este motivo, se han desarrollado varios métodos analíticos en nuestro grupo
para la valoración de los niveles de emisión y la concentración ambiental de una serie
de compuestos orgánicos considerados peligrosos en el medioambiente de Mallorca
que, en muchos casos, no están contemplados en ningún tipo de legislación de
protección ambiental.
La parte experimental de la Tesis doctoral se divide en dos secciones. La primera
parte, más extensa, se centra en el desarrollo de un método analítico para la
determinación de compuestos orgánicos volátiles, para una posterior evaluación de las
emisiones y concentraciones ambientales de diversas instalaciones de tratamiento de
residuos urbanos en Mallorca. La segunda parte está enfocada en la determinación de

fármacos de consumo humano en el medioambiente acuático de Mallorca, justificando
las fuentes concretas de emisión de cada compuesto detectado.
En primer lugar se desarrolló un método analítico para determinar múltiples
compuestos orgánicos volátiles en muestras gaseosas. El método estaba basado en la
cromatografía gaseosa con posterior detección por espectrometría de masas, GC-MS
según su acrónimo inglés. Para la extracción y preconcentración de los analitos de
interés se utilizaron trampas adsorbentes (dentro de las técnicas de extracción en fase
sólida) con posterior desorción térmica (TD, acrónimo inglés). Para la calibración
analítica del método se implementó y optimizó un nuevo procedimiento basado en la
volatilización de patrones líquidos previa a la interacción sobre los sólidos adsorbentes
que mejora los factores de respuesta y la reproducibilidad del método.
En segundo lugar, se aplicó el método de desorción térmica – cromatografía
gaseosa – espectrometría de masas (TD-GC-MS) para calcular las emisiones totales de
42 compuestos orgánicos volátiles en el mayor vertedero de residuos sólidos urbanos
de Mallorca. En el mismo estudio se llevó a cabo una evaluación de los niveles de olor
por olfatometría dinámica de las muestras (mediante un laboratorio externo acreditado)
para encontrar una correlación positiva entre niveles de olor y composición del aire. De
este modo se podrían identificar algunos compuestos de la muestra como marcadores
de olor
En tercer lugar, se analizaron diferentes plantas de tratamiento de residuos sólidos
urbanos aplicando el método analítico TD-GC-MS para la caracterización de 93
compuestos orgánicos volátiles emitidos en cada una de las plantas. Mediante
tratamiento estadístico de los datos, incluyendo un análisis de componentes principales
y un análisis de clústeres, se evaluaron las diferencias entre las distintas muestras,
correlacionando de manera clara cada muestra con su composición química,
asignándola a su planta de origen. Este nuevo método permite la identificación del
origen de una muestra desconocida, mostrándose especialmente útil para episodios de
olor cercanos a las plantas de tratamiento estudiadas.
En último lugar se optimizó y aplicó un método analítico de cromatografía líquida de
alta presión con detección por espectrometría de masas en tándem, HPLC-MS2 según
su acrónimo inglés, para conocer el grado de contaminación ambiental acuático en
Mallorca a causa del uso de fármacos en humanos. En este mismo estudio se
describen las vías de contaminación seguidas por este grupo de contaminantes
orgánicos polares, desde su uso como fármacos medicinales o su eliminación en
vertederos, hasta los acuíferos subterráneos, el mar o Parques Naturales. Los analitos
de interés fueron extraídos de las muestras acuosas mediante una extracción en fase
sólida convencional.
ABSTRACT
Human activities have associated, in most of cases, the large-scale emission of
pollutants (involving thousands of different organic compounds) that pose imminent
danger to environment and human health. About 100 000 chemicals have been
catalogued to date, being a priori all potentially susceptible to generate risks in the short,
medium or long-term. Only a small proportion of these compounds has been studied to
assess real damages in humans or the environment. One can consider that the current
real impact of the majority of these chemicals still remains unknown.
Tracking of environmental concentrations levels of pollutants by the periodic
monitoring evaluation is nowadays the main scheme used to determine the pollution
state (degradation level) of a specific ambient. Appropriate effective measures should be
taken, on the basis of the measured levels, to reduce contaminant emissions and
restore the damaged environment as soon as possible. These measures must be
reflected in novel environmental protection laws restricting pollutant human activities and
promoting the sustainable ones. Despite advances in analytical chemistry and
environmental research, very few compounds are still considered priority pollutants, and
therefore the number of compounds being actively regulated within environmental
legislation governing their emissions (setting threshold values) is limited to less than one
hundred in Spain and many other EU and non EU Countries. Current economic
interests do not allow scientific advances in the environmental protection field to be
implemented on the welfare of the whole society. In most cases these environmental
measures are merely adopted after environmental disaster.
For this reason, several analytical methods have been developed in our group for
assessing emission rates and environmental concentration levels of a broad variety of
organic compounds considered potentially hazardous in the environment of Mallorca,
which in many cases do not fall within any kind of environmental protection regulation.
The experimental part of this Doctoral Thesis is divided into two sections. The first
one, more extensive, focuses on the development of an analytical method for the
determination of volatile organic compounds, for further evaluation of the emissions and
environmental concentration levels in diverse municipal solid wastes’ treatment plants
and disposal landfills. The second part is focused on the determination of
pharmaceuticals for human consumption in the aquatic environment of Mallorca,
justifying particular emission sources
First of all, we developed an analytical method to determine multiple volatile organic
compounds in gaseous samples. The method was based on gas chromatography with

subsequent detection by mass spectrometry (GC-MS). For the extraction and clean-up
of the analytes of interest were used sorbent traps (included within solid phase
extraction techniques) with subsequent thermal desorption (TD). For analytical
calibration of the method it was implemented and optimized a novel procedure based on
the volatilization of liquid standards prior to the solid adsorbent interaction, which
improves the response factors and reproducibility of the method.
Secondly, we apply the method of thermal desorption - gas chromatography - mass
spectrometry (TD-GC-MS) to calculate overall emissions of 42 VOCs in the largest
municipal solid waste landfill in Mallorca. In the same study was carried out an
assessment of odour levels by dynamic olfactometry of the collected samples (by an
external ISO accredited laboratory) with the goal to find a positive correlation between
odour units and air composition. Thus certain compounds could be identified in the
sample as markers of odour.
In the third work, several industrial facilities (treating different fractions of municipal
wastes) were analysed by applying the TD-GC-MS method for the characterization of 93
volatile organic compounds emitted in each of the plants. By a statistical treatment of
data, including principal component analysis and cluster analysis, we evaluated the
differences between samples, correlating each sample clearly with their chemical
composition, enabling the assignation to the facility of origin. This new method allows
the identification of an unknown origin of one polluted ambient air, being particularly
useful when odorant episodes occur near the studied treatment plants.
Finally, it was optimized and implemented an analytical methodology based on high
pressure liquid chromatography with tandem mass spectrometry detection (HPLC-MS2),
to ascertain the extent of water pollution in Mallorca because of the use of medicines in
humans. In this study are described the contamination routes followed by this group of
polar organic pollutants, from their use as medicines or landfill disposals to groundwater
aquifers, sea or Natural Parks. The analytes of interest were extracted from the aqueous
samples by a solid phase extraction

TABLE OF CONTENTS
0BGENERAL INTRODUCTION ............................................................... 1 CHAPTER 1.
DETERMINATION OF VOLATILE ORGANIC COMPOUNDS IN THE AIR. .......... 8 1.1
1.1.1 10BPollution in the atmospheric environment .......................................................... 11
1.1.2 Emission sources of VOCs to the atmosphere .................................................. 16
21BAnthropogenic VOCs .................................................................................................. 16 1.1.2.1
22BBiogenic VOCs ............................................................................................................ 19 1.1.2.2
23BEnvironmental effects ................................................................................................. 21 1.1.2.3
24BHuman Health effects ................................................................................................. 25 1.1.2.4
1.1.3 12BOdorant Pollution ................................................................................................ 28
25BOdour as analyte......................................................................................................... 28 1.1.3.1
1.1.4 13BChromatographic techniques for the determination of VOCs in air. .................. 30
26BSampling and Extraction Techniques ........................................................................ 31 1.1.4.1
Enrichment into solid sorbents ................................................................................... 35 1.1.4.2
28BDesorption Techniques .............................................................................................. 48 1.1.4.3
On-line GC-MS methodologies .................................................................................. 52 1.1.4.4
On-line non-chromatographic methods ..................................................................... 54 1.1.4.5
1.1.5 14BEnvironmental legislation in force on atmospheric pollutants ............................ 60
31BEU Framework ............................................................................................................ 60 1.1.5.1
32BConsiderations over monitoring regulations of VOCs .............................................. 67 1.1.5.2
6BDETERMINATION OF PHARMACEUTICAL RESIDUES IN WATER ................. 68 1.2
1.2.1 Pharmaceuticals and personal care products (PPCPs) .................................... 71
1.2.2 16BPollution in the aquatic environment .................................................................. 73
33BEmission sources of PhACs into the aquatic environment ...................................... 74 1.2.2.1
34BPharmaceutical’s transformation products (TPs) ..................................................... 76 1.2.2.2
1.2.3 17BChromatographic techniques for the determination of pharmaceuticals in
water .................................................................................................................. 79
35BExtraction Techniques ................................................................................................ 80 1.2.3.1
36BGas chromatography .................................................................................................. 82 1.2.3.2
37BLiquId Chromatography .............................................................................................. 83 1.2.3.3

REFERENCES .......................................................................................................86 1.3
1BOBJECTIVES ..................................................................................... 97 CHAPTER 2.
2BEXPERIMENTAL PART AND DISCUSSION ................................. 101 CHAPTER 3.
9BDETERMINATION OF VOLATILE ORGANIC COMPOUNDS IN THE AIR ...... 105 3.1
3.1.1 18BImplementation and optimization of a high-temperature's loading strategy of
liquid standards in the quantification of volatile organic compounds using
solid sorbents .................................................................................................. 109
39BSubmitted article ...................................................................................................... 111 3.1.1.1
3.1.2 19BVolatile organic compounds in landfill odorant emissions on the island of
Mallorca ............................................................................................................. 129
Original article........................................................................................................... 131 3.1.2.1
3.1.3 20BUse of thermal desorption-gas chromatography-mass spectrometry (TD-
GC-MS) on identification of odorant emission focus by volatile organic
compounds characterisation ............................................................................. 149
Original article........................................................................................................... 151 3.1.3.1
8BDETERMINATION OF PHARMACEUTICALLY ACTIVE COMPOUNDS 3.2
(PhACS) IN THE AQUATIC ENVIRONMENT ................................................................. 165
38BSubmitted article ...................................................................................................... 169 3.2.1.1
SUMMARY OF RESULTS AND CONCLUSIONS .......................... 195 CHAPTER 4.
4BANNEX I. List of publications ................................................................................ 201
4BANNEX II. Structure of the pharmaceuticals ....................................................... 205
4BANNEX III. List of abbreviations ............................................................................ 209

1
CHAPTER 1
0BGENERAL INTRODUCTION


Chapter 1
3
GENERAL INTRODUCTION
In all likelihood, the World currently faces the worst global environmental pollution
situation ever. Human activities have had a continuous critical impact at all the
environmental levels: atmosphere, lithosphere and hydrosphere. By definition, pollutant
(or contaminant) is any substance which may harm humans, animals, vegetation or
material. Many socioeconomic factors have contributed decisively up to the present
situation. One example among many is about the contamination derived from the
constant increase of the worldwide energy production, to completely supply the
increasing necessities of the consumer society. This situation involves massive use of
fossil fuels or radioactive matter to supply energetic demands for industrial processes,
transport use, etc. Indeed, all these industrial developments have come with undesired
high prices: air pollution, massive generation of wastes, overexploitation of natural
resources, destruction of biodiversity, poisoning of fresh water reservoirs or climate
changes are some evidences, and it might continue to a nearly endless list of medium
and long-term consequences. Human health and environment are nowadays
unquestionably affected by worldwide contamination.
Natural ecosystems are dynamic environments, entangling broad biological,
chemical, and geological cycles in constant transformation (Figure I), and environment
pollutants may participate actively into changing processes. Once they reach the
environment, pollutants can transform in multitude of sub-products, spread or distribute
randomly, and/or accumulate either in specific areas or regularly along ecosystems. The
interconnection between adjoining ecosystems aggravates the global environmental
pollution problem, since specific local changes, even in a small scale, may result in
severe unexpected consequences which might lead to a situation of no return. One
worldwide known example was described in 2004 about the unexpected annihilation
over up to 95% of vulture’s population in Pakistan, due to liver failure as a consequence
of the ingestion of diclofenac residues, originally used for veterinary medicine in several
animals [1]. It evidenced that medicines may have unknown mechanisms of action, and
many similar cases might be happening worldwide concerning other chemicals, even
though there were no evidences.

General Introduction
4
Figure I. Distribution pathways of the pollutants in the environment. Pollutant’s coefficient rate: Kaw, between air and water; Ksw, between soil and water; Ksa, between soil and air
As it seems evident, to comprehensively understand the seriousness of the situation,
environmental pollution evaluations need a global long-term point of view. The real
impact of certain pollutants might not be detected in a short or medium-term, thus the
dangers might be wrongly estimated. Another critical factor arises from the difference in
the time-scale of bio-geological natural processes compared to human’s time-scale.
Frequently natural cycles are not able to amend existing environment pollution levels in
a time-scale valid for humans, looming threatening implications. In this sense, the only
way to completely remove contamination would be by stopping contaminant activities.
However, the “industrial stop” is not possible at all, so the best alternative is the
implementation of restrictive laws regulating human activities with the aim to protect
environment and human health. Only this new legal framework would lead to unpolluted
environmental situations.
Environmental protection must be accomplished working on several different areas,
covering from the local to global perspectives. Only by joining forces in all areas can be
achieved optimal environmental conditions. Improvements must be focused on
research, education, reduction and legislation.
Research. As backbone of the human development, this is assumed the most
important area of action to amend environmental pollution. Two are the main goals: stop
releasing contaminants, and remove the existing pollutants from the environment.
Hydrosphere Atmosphere
Lithosphere
Pollutant
kaw
ksa ksw
Solubility Volatility
Absorption
Adsorption
Chapter 1
5
On one hand, environmental friendly (sustainable) technologies must be developed
and implemented worldwide to substitute at all levels current contaminant industries and
technologies (e.g. transports, industrial processes, energy generation, chemicals, waste
treatments, recycling, etc.). It is necessary to investigate alternative green and
sustainable processes to substitute the current ones.
On the other hand, further comprehensive studies must be carried out to better
understand the real impacts of current pollution levels over environment and human
health. Short, medium and long-term evaluations (e.g. risk assessments, occurrence
studies, modelling of pollution paths, etc.) must be carried out to in order to develop
novel technologies which enable the elimination of pollutants to move back to the
desired clean environments (free of any contamination).
Education. Another important field of action must rely upon the raising of public
awareness about the severe damage we are causing to environment, and the threat of
long-term irremediable consequences. It is especially unavoidable in those countries in
process of development, where industrial improvements are still on time to be
environmental sustainable. It is evident that the higher the public awareness on
contamination and its consequences, the less the pollution levels, either at local or
national frameworks. Economy cannot be the top priority of any society above
environment protection. Public environmental educational programmes must be
implemented to make population aware that economy must be a tool, not the objective
itself.
Reduction. World’s global demands and consumption rates must be inexorably
reduced to reach a balanced situation between the total human consumption with the
sustainable amount the Earth can safely provide us. This is in direct relationship to the
research field, since better developed technologies would help us in saving raw
materials even though human demands were not decreased.
The other imperative need is the reduction of all kind of wastes (solid, liquid and
gaseous). Waste treatment and disposal planning in many industrialized countries
(included Spain) are currently based on three principles, namely the three ‘R’:
Reduction, Reuse and Recycle of residues. However, looking back with perspective, we
can clearly realize that this system is vulnerable and can easily fail. In practice, almost
every responsibility relies on the final users, and few if any restrictions are given to
manufacturing companies. The reduction of residues must start from the design and the
elaboration of any product, establishing beforehand feasible reuses or recycling paths.
Legislation. As long as research draws the pathways to reach efficient
environmental protection by the use of sustainable technologies, legislative frameworks
are the necessary tool forcing all the parts to follow the marked route. Legislation is the

General Introduction
6
glue that fixes every piece in the puzzle.
Governments in force must unavoidably establish appropriate laws, governing and
establishing the cooperation framework between the different mentioned areas, where
protection of environment and human health must be the top priority above all other
social factors, leaving no room for ambiguities. International collaboration is also
completely necessary
Besides the risks over human health and environment, appropriate environmental
legislations would help to save money, so important in the current global financial crisis.
Only in EU countries, the cost of the industrial air pollution has been estimated over
€169 billion in 2009 (see section 1.1.1). These costs are estimated for a specific area of
the World. What about overall costs including water and soil in the whole World?
“Environmental friendly” can also mean “economical friendly”.
Environmental monitoring
Environmental directives covering periodical monitoring of pollutants in Europe are
one of the most restrictive and comprehensive in the World. European Union adopted in
1993 the European Environmental Agency (EEA) and the European Environment
Information and Observation Network (EIONET) [2]. These two agencies are
responsible of helping the Community and Member Countries make informed decisions
about improving the environment and integrating environmental considerations into
economic policies moving towards sustainability.
Environmental protection has been notably improved since EEA and EIONET were
created, owing the unification of the different criteria governing every country. However
European environment is still too far from a “total protection” situation, and even further
from their rehabilitation. There are many lacks in the environmental laws regarding
monitoring regulations.
Nearly 100.000 chemicals have been inventoried, and 500 to 1000 are added every
year to the list [3]. The major part of these chemicals has not been evaluated for risk
assessment, neither in the environment nor in humans. Very few of them are legislated
in environmental directives to be periodically monitored to verify its concentration within
stated limit thresholds.
In the last 20 years, i.e. since EEA and EIONET were created, the improvements in
analytical instrumentation (e.g. selectivity, sensitivity, ease and speed) and sample
clean-up and extraction techniques, in parallel with the development of powerful
computers and statistical modelling tools, enabled easy and fast analysis of multiple
compounds embedded inside very complex matrices (e.g. environmental soil, air and
water). Multitude of new chemicals can be currently evaluated in the environment

Chapter 1
7
through a wide list of suitable and verified methodologies. Regretfully, these advances
have not been implemented into efficient and strict laws and novel contaminants are
continuously emerging every year.
There is a rising concern about organic chemicals in the environment. For example,
the US–EPA bibliographic database of pharmaceuticals and personal care products
(PPCPs) [4] lists over 6500 relevant studies in scientific journals and books since 1999,
however it is a double-edged sword. While this certainly shows an on-going escalation
in publishing activity, it does not tell us if these works have targeted the most pressing
needs, if they are being actively used to inform decision making, or whether they are
resulting in useful outcomes for society. The ultimate destination for organic pollutants
research might be only evident in the larger context involving a truly holistic examination
of the complete life cycles of the chemicals. Despite the wealth of published data, little
has yet proved of use of major number of organic compounds in actual implementation
of system redesigns that are more sustainable or even for informing regulatory
deliberations.
We have expounded along this general introduction about the backbone guidelines
which may lead us to a safe environment. The focus of this Doctoral Thesis
(comprehensively described in Chapter 2) is the development and application of reliable
analytical methodologies to determine a group of organic compounds in the
environment, meeting the requirements to be immediately implemented in more
restrictive environmental monitoring regulations.
Volatile organic compounds (VOCs) and human medical pharmaceuticals residues
(pharmaceutically active compounds, PhACs) were analysed in environmental samples
of relevant interest. An overview of these sub-sets of organic compounds, including
recent trends in the analytical techniques, sample extraction techniques, environmental
occurrence and fate is described along this introductory Chapter 1.

General Introduction
8
DETERMINATION OF VOLATILE ORGANIC 1.1
COMPOUNDS IN THE AIR.
Chapter 1
9
This Doctoral Thesis is firstly focused on the atmospheric pollution of volatile organic
compounds (VOCs), thus there is a comprehensive description of VOCs behaviour in
the atmospheric environment along this introduction, as well as the major recent trends
in the determination and quantification of VOCs in the air.
Volatile Organic Compounds are one of the most common organic pollutants in the
environment. They encompass a diverse group of organic chemicals with different
structure and properties such as alkanes and alkenes, aldehydes and ketones, acids,
esters and ethers or aromatic and halogenated compounds, and other natural
compounds like isoprene and terpenes. Table 1.1-1 shows several examples of VOCs
with some of their most frequent uses.
A high vapour pressure is the common characteristic to all of them. The IUPAC
(International Union of Pure and Applied Chemistry) do not provide a unique definition
for VOCs, however in some reports [5] they mention the European Union definition,
adopted by the European Environment Agency (EEA) [6]:
“Volatile organic compound (VOC) means any organic compound,
excluding methane and carbon dioxide, having at 293.15 K a vapour
pressure of 0.01 kPa or more, or having a corresponding volatility under
the particular condition of use.”
Other EU definitions [7] reported VOCs as
“Any organic compound having an initial boiling point less than or equal to
250°C measured at a standard pressure of 101,3 kPa”.
The United States Environmental Protection Agency (US-EPA or EPA) also defines
VOCs as [8]:
“Any compound of carbon, excluding carbon monoxide, carbon dioxide,
carbonic acid, metallic carbides or carbonates, and ammonium
carbonate, which participates in atmospheric photochemical reactions” .
Thousands of compounds are estimated to be included among VOCs. Their
emissions are distributed along atmosphere, water and soil and sediments.
Notwithstanding, these liquid organic compounds, according to each individual vapour
pressure value (vapour pressure of the liquid, PL, Eq. 1, page 12, are essentially in the
gaseous phase, so the atmosphere is the main receptor of the emitted VOCs. They can
also be discharged through any kind of waste water effluents upon hydrosphere and
soils (e.g. municipal wastewater, municipal or industrial solid wastes). Pollution
pathways may not be considered static; nevertheless VOCs exchanges between
reservoirs are frequent, especially for those of the most persistent compounds.

General Introduction
10
Atmospheric pollutants are transferred to soil and water through deposition, either with
or without rain.
Table 1.1-1 Examples of VOCs and main emission sources and/or applications.
Type of substance Compound Formula Emission/application
Aromatic Hydrocarbons Benzene C6H6 Traffic
Toluene C7H8 Lacquers, dyes
Xylenes C8H10 paints, traffic
Aliphatic Hydrocarbons n-Hexane Various C6H14 Lacquers, adhesives
Halogenated Hydrocarbons Dichloromethane CH2Cl2 Solvents, paints
Chlorobenzene C6H5Cl Dry cleaning, rubbers
Tetrachloroetylene C2Cl4 Plastics
Alcohols Methanol CH3OH Organic synthesis
Ethanol C2H5OH Drinks
Esters Ethyl acetate CH3COOC2H5 Lacquers, solvents
Ketones 2-Butanone CH3COC2H5 Lacquers, resins
Ethers Ethyl tert-buthyl ether CH3OC(CH3) Oxygenated fuels
Amides Dimethylformamide HCON(CH3)2 Plastics

Chapter 1
11
1.1.1 10BPOLLUTION IN THE ATMOSPHERIC ENVIRONMENT
Atmosphere is the gaseous layer around the Earth rising up to 10000 km height. Its
current chemical composition is the result of hundred millions of years of evolution on
Earth. It is structured in several stratums, divided one another according to gas density
and temperature criteria. Every stratum has different chemical compositions and so
different physicochemical processes takes place [9]. The lowest stratum, namely
troposphere, which covers up to 12 km above sea level, becomes the most important
fraction since it is the one supporting life on Earth. Its composition can be considered
rather constant (except water vapour). It is estimated that 80% of the total atmospheric
gases are comprised within the tropospheric stratum, including the major percentage of
the organic pollutants emitted to the atmosphere. The gases in the troposphere can be
listed, according to each relative contribution [9] as:
Major gases: N2 (78,08%) and O2 (20,95%)
Minor gases: Ar (0,934%) and CO2 (0.035%)
Noble gases: Ne (0,0018%), Kr (0,00114%), He (0,0052%) and Xe
(0,00009%)
Trace gases: compounds either from biogenic or anthropogenic origin, in a
much lower proportion. They may be organic like CH4 and CHCl3 or inorganic
like NOx, SO2 and CO.
Water vapour: its proportion may vary between 0,1 to 5% according to local
meteorological conditions.
Despite the relative contribution of trace gases might seem low compared to N2 and
O2, these are the main responsible of pollutant impacts, since their presence in the
atmosphere are altering the biochemical natural cycles slowly established along the
evolution progress.
Organic compounds present in the atmosphere are partitioned between gas and
particle phases [10-12] and the phase in which a chemical exists in the atmosphere can
significantly influence its dominant tropospheric removal process(es) and lifetime [11].
For partitioning proceeding by surface adsorption, gas/particle partitioning depends on
the liquid-phase (or sub-cooled liquid-phase) vapour pressure, PL, at the
ambient atmospheric temperature, the surface area of the particles per unit volume of
air, ϑ, and the nature of the particles and of the chemical being adsorbed. The fraction of
the chemical present in the particle phase, φ, depends on these parameters through an
equation of the form [10, 11]:

General Introduction
12
φ=cϑ/(cϑ+PL) (1)
where c is a parameter which depends on the chemical being adsorbed and on the
nature of the particle. To a first approximation, chemical compounds with liquid-phase
vapour pressures of PL<10−6 Pa (<10−8 torr) at the ambient atmospheric temperature are
present in the particle phase, and those with values of PL>1 Pa (>10−2 torr) at the
ambient atmospheric temperature exist essentially totally in the gas-phase [11, 13] and
are commonly named volatile organic compounds (VOCs). Chemicals with intermediate
values of PL are present in both the gas and particle phases and are often termed semi-
volatile organic compounds (SOCs or SVOCs). Because of the variation of PL with
temperature, for a given particle surface area a decrease in ambient
atmospheric temperature will increase the fraction of the SOC present in the particle
phase.
The need to improve air quality has been long recognized. In modern times the
disaster in the fluorine intoxication in Meuse Valley (Belgium) in 1930 [14] and the
London’s deadly smog in 1952 [15] killed thousands of people in Europe. Many other
environmental pollution disasters have taken place worldwide, and Bhopal Disaster in
1984 might be the worst episode ever [16]. These disasters prompted the adoption of
air quality legislations. In the last decades a variety of laws have been enacted at the
local, national and EU levels, as well as through international conventions, such as the
European Nations Convention on Long-range Transboundary Air Pollution (UNECE-
CLTRAP, see section 1.1.5.1 [17]).
In Europe, policies and actions implemented at different levels have greatly reduced
anthropogenic emissions and exposure in the last decades; however many air pollutants
have not been evaluated ever, while some other still harms environment and human
health. Emissions of acidifying pollutants have been reduced, but atmospheric nitrogen
oversupply still threatens biodiversity in sensitive terrestrial and water ecosystems.
Nowadays, the movement of atmospheric pollution between continents attracts
increasing research and political attention.
Air pollutants, such as carbon monoxide (CO), sulphur dioxide (SO2), nitrogen oxides
(NOx), volatile organic compounds (VOCs), ozone (O3), heavy metals, and respirable
particulate matter (PM2.5 and PM10), differ in their chemical composition, reaction
properties, emission, time of disintegration and ability to diffuse in long or short
distances. Air pollution has both acute and chronic effects on human health, affecting a
number of different systems and organs. It ranges from minor upper respiratory irritation
to chronic respiratory and heart disease, lung cancer, acute respiratory infections in
children and chronic bronchitis in adults, aggravating pre-existing heart and lung

Chapter 1
13
disease, or asthmatic attacks. In addition, short- and long-term exposures have also
been linked with premature mortality and reduced life expectancy. Table 1.1-2
summarizes harmful effects of some regulated air pollutants on human health, the
environment and the climate changes.
Besides this group of organic chemicals there is a vast list of other toxic organic
compounds, classified as persistent organic pollutants (POPs) [18]. They persist in the
environment for long periods of time, and their effects are magnified as they move up
through the food chain (bio-magnification). They include pesticides, polychlorinated
dibenzo-dioxins (PCDDs), polychlorinated dibenzo-furans (PCDFs), polychlorinated
biphenils (PCBs), polycyclic aromatic hidrocarbons (PAHs), chlorofluorocarbons (CFCs),
and a wide list of emerging contaminants. There is a vast bibliography available
regarding analytical methodologies, environmental occurrence and fate, toxicity, etc. for
this groups of POPs [19, 20].
Environmental pollution also generates high costs to any society. A 2011 report from
the European Environmental Agency (EEA) estimated the costs of air pollution up to
€169 billion [21]. The contaminants with the most elevated costs are (in decreasing
order): dioxins and furans, PAHs, benzene, heavy metals, particulate matter (PM),
nitrogen and sulphur oxides (NOx and SOx), ammonia, some VOCs and CO2. In the
same report is stated that half of the total damage cost was caused by just 191 facilities.
It is an extra guideline to efficiently aim the efforts to mostly reduce air pollution: “global
perspective, local actions”.

General Introduction
14
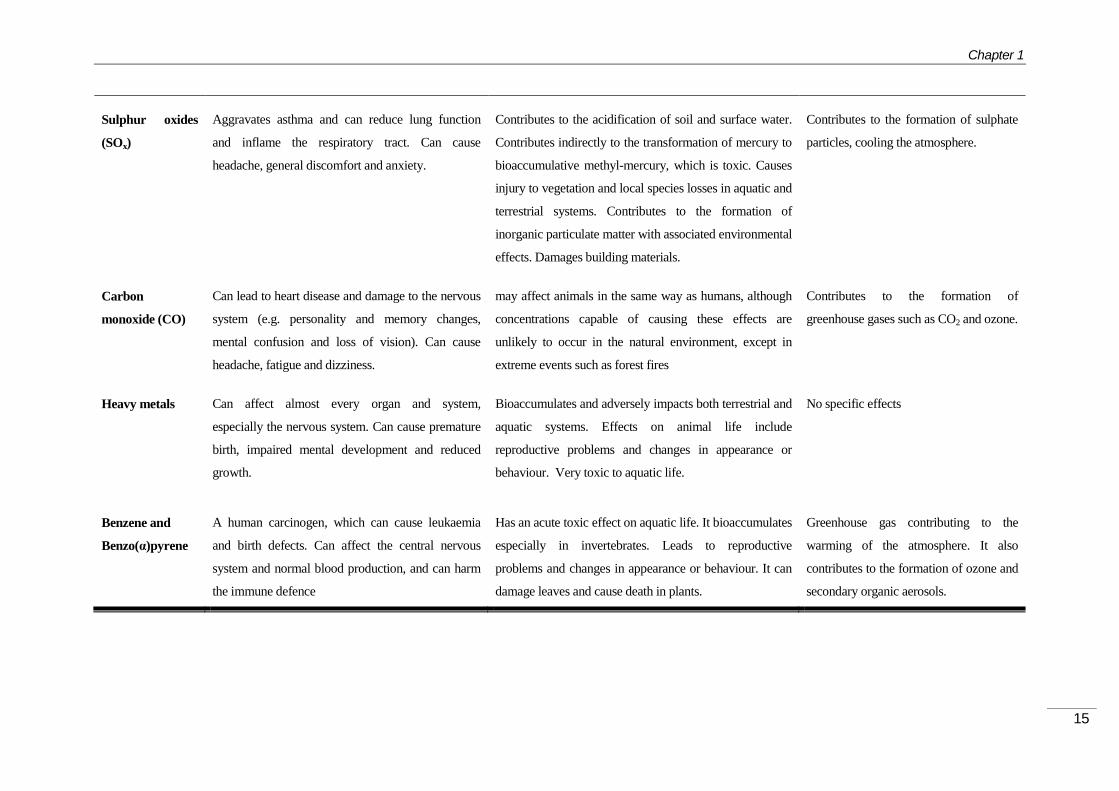
Table 1.1-2 Effects of regulated air pollutants on human health, the environment and the climate.
Pollutant Health Effects Environmental effects Climate effects
Particulate
matter (PM)
Can cause or aggravate cardiovascular and lung
diseases (e.g. reduced lung function, asthma attacks,
chronic bronchitis, susceptibility to respiratory
infections), heart attacks and arrhythmias. Can affect
the central nervous system, the reproductive system
and cause cancer. The outcome can be premature
death.
Can affect animals in the same way as humans. Affects
plant growth and ecosystem processes.
Can cause damages and soiling of buildings, including
monuments and objects of cultural heritage.
Reduced visibility
Climate effects vary depending on
particle size and composition: some are
reflective and lead no net cooling, while
other absorbs solar radiation leading to
warming. Can lead to changed rainfall
patterns. Deposition can lead to changes
in surface albedo.
Ozone (O3) Irritates eyes, nose, throat and lungs. Can destroy
throat and lung tissues, leading to decrease in lung
function; respiratory symptoms, such as coughing
and shortness of breath; aggravated asthma and
other lung diseases. Can lead to premature mortality.
Damages vegetation by injuring leaves, reducing
photosynthesis, impairing plant reproduction and growth,
and decreasing crop yields. Ozone damage to plants can
alter ecosystem structure, reduce biodiversity and
decrease plant uptake of CO2
Ozone is greenhouse gas contributing to
warming of the atmosphere
Nitrogen oxides
(NOx)
NO2 can affect the liver, lung spleen and blood. Can
aggravate lung diseases leading to respiratory
symptoms and increased susceptibility to respiratory
infection.
Contributes to the acidification and eutrophication of soil
and water, leading to changes in species diversity.
Enhances sensitivity (such as drought) on vegetation. Act
as a precursor of ozone and, particulate matter, with
associated environmental effects. Damages buildings.
Contributes to the formation of ozone
and particulate matter, with associated
climate effects
Chapter 1
15
Sulphur oxides
(SOx)
Aggravates asthma and can reduce lung function
and inflame the respiratory tract. Can cause
headache, general discomfort and anxiety.
Contributes to the acidification of soil and surface water.
Contributes indirectly to the transformation of mercury to
bioaccumulative methyl-mercury, which is toxic. Causes
injury to vegetation and local species losses in aquatic and
terrestrial systems. Contributes to the formation of
inorganic particulate matter with associated environmental
effects. Damages building materials.
Contributes to the formation of sulphate
particles, cooling the atmosphere.
Carbon
monoxide (CO)
Can lead to heart disease and damage to the nervous
system (e.g. personality and memory changes,
mental confusion and loss of vision). Can cause
headache, fatigue and dizziness.
may affect animals in the same way as humans, although
concentrations capable of causing these effects are
unlikely to occur in the natural environment, except in
extreme events such as forest fires
Contributes to the formation of
greenhouse gases such as CO2 and ozone.
Heavy metals Can affect almost every organ and system,
especially the nervous system. Can cause premature
birth, impaired mental development and reduced
growth.
Bioaccumulates and adversely impacts both terrestrial and
aquatic systems. Effects on animal life include
reproductive problems and changes in appearance or
behaviour. Very toxic to aquatic life.
No specific effects
Benzene and
Benzo(α)pyrene
A human carcinogen, which can cause leukaemia
and birth defects. Can affect the central nervous
system and normal blood production, and can harm
the immune defence
Has an acute toxic effect on aquatic life. It bioaccumulates
especially in invertebrates. Leads to reproductive
problems and changes in appearance or behaviour. It can
damage leaves and cause death in plants.
Greenhouse gas contributing to the
warming of the atmosphere. It also
contributes to the formation of ozone and
secondary organic aerosols.

General Introduction
16
1.1.2 EMISSION SOURCES OF VOCs TO THE ATMOSPHERE
In former times, the origins of VOCs emissions were biological and geological natural
processes, such as microorganism degradation products or vegetation and volcanoes
emissions. However this equilibrium started to be altered in 20th century with the
industrial revolution and the massive use of chemicals and fossil fuels. Hence, in parallel
with fast industrial developments there was the increasing emission of VOCs to the
environment.
Organic compounds in the atmosphere are in general in the trace levels, being
methane (CH4) the most abundant. The anaerobic degradation of organic matter by
means of some microorganisms is the main source of methane. Atmospheric methane
concentrations are increasing at a 1% rate annually, from 1,5ppm in the 1980s to
1,75ppm in the 1990s [22], estimated over 2 ppm in the 2010-2020 decade. Therefore,
VOCs are also known as non-methane volatile organic compounds (or NMVOCs).
According to potential emission sources, VOCs can be classified as anthropogenic
VOCs (AnVOCs), when released by human activities; and biogenic VOCs (BVOCs)
when emitted by natural bioprocesses without direct human participation. Methane
(CH4) is the most abundant primarily emitted from agriculture (from ruminants and
cultivation), whereas non-methane volatile organic compounds (or NMVOCs) are mainly
emitted from transportation industrial processes and use of organic solvents.
21BANTHROPOGENIC VOCs 1.1.2.1
Aromatic hydrocarbons are greatly released to the environment by human activities,
especially through fuel combustion processes. Benzene, toluene, ethylbenzene and
xylenes, namely BTEX, represent one of the major known threats in the present to
environment and human health owing high emission rates and great toxicity. The higher
concentrations have been measured at industrial and urban areas; however
concentrations may sensitively vary according to local atmospheric conditions.
Halogenated compounds (e.g. dichloromethane, chloroethylene) are other frequent
anthropogenic pollutants, with an increasing emission rate in the last century since they
are massively used as solvents and in the industry.
Oxygenated volatile organic compounds encompass a wide range of compounds:
ketones, aldehydes, esters, ethers, alcohols, carboxylic acids, etc. Aldehydes are one of
the most important groups since they are primary contaminants, directly emitted by
biogenic and anthropogenic sources, but also secondary contaminants as intermediate
reaction products, with a key role in the generation of oxidative compounds [23, 24].

Chapter 1
17
Anthropogenic emissions are estimated and published in European countries since
1990, according to United Nations Convention on Long-Range Transboundary Air
Pollution [17] (UNECE-CLRTAP, Section 1.1.5.1). Figure 1.1-1 shows the average
contribution made by different sectors to emissions of non-methane volatile organic
compounds (NMVOCs) for 32 European Countries in the year 2009 [25].
It is very important to remark that the computation of total emissions is, in general,
based on certain arbitrary values specified in the emission inventory guidebook [25], but
not with a real evaluation of occurrence levels. Principal emission source is the use as
solvent and products (35,8%), followed by industrial processes (15,1%) and commercial,
institutional and households uses (15,4%). Total VOC emissions in Spain are reported
every year included in the annual emission inventory [26].
Figure 1.1-1 Contribution made by different sectors to emissions of non-methane volatile organic compounds (NMVOCs) for EU-32
The total estimation of VOCs in Spain was 678,7 Gg in the last official reported year
2009. This estimative corresponds over 1000 tons of VOCs year-1 km2 in the Spanish
territory (assuming 500 000 km2 of territory). It is really disturbing the fact that such
amount of VOCs can be released to the atmospheric environment every year with the
Governmental European, National and local benevolence.
European emissions of NMVOCs have shown a significant decrease over 33% in for
the period 1990-2009 [27]. The decline in emissions has primarily been due to
Road
transport:
14,6
Other 0,0
Non-road
transport: 2,0
Industrial
processes: 15,1
Energy use in
industry: 1,6
Energy
production and
distribution:
9,6 Commercial,
institutional
and
households:
15,4
Waste: 1,1
Agriculture:
4,8
Solvent and
product use:
35,8

General Introduction
18
reductions achieved in the road transport sector due to the introduction of vehicle
catalytic converters and carbon canisters on petrol cars, for evaporative emission control
driven by tighter vehicle emission standards, combined with limits on the maximum
volatility of petrol that can be sold in EU Member States, as specified in fuel quality
directives. The reductions in NMVOC emissions have been enhanced by the switching
from petrol to diesel cars in some EU countries, and changes in the ‘Solvents and
product use' sector (a result of the introduction of legislative measures limiting for
example the use and emissions of solvents, see Section 1.1.5.1). Figure 1.1-2 shows
the contribution made by each sector to the total change in non-methane volatile organic
compounds (NMVOC) emissions between 1990 and 2009. Figure 1.1-3 shows
percentage of change in non-methane volatile organic compound (NMVOC) emissions
for each sector between 1990 and 2009.
Figure 1.1-2. Relative variation on individual contributions to total VOC emissions for the period 1990-2009

Chapter 1
19
Figure 1.1-3 Changes in non-methane volatile organic compound (NMVOC) emissions for each sector between 1990 and 2009.
22BBIOGENIC VOCs 1.1.2.2
Great amounts of non-methane organic compounds are also emitted into the
atmosphere from biogenic sources, mainly from vegetation. These organic compounds
include isoprene, C10H16 monoterpenes, C15H24 sesquiterpenes, and a number of
oxygenated compounds including methanol, hexene derivatives, 2-methyl-3-buten-2-ol,
and 6-methyl-5- hepten-2-one. Some examples are reported in Table 1.1-3.
Natural emissions have been sometimes estimated about 30% of overall VOCs
emissions [22] . Green plants emit high amounts of isoprene and terpenes (like
limonene, cymene or myrcene), which largely contribute to the concentration of VOCs in
rural areas. Guenther et al. estimated total worldwide emission in 1150 Tg year-1,
composed of 44% isoprene, 11% monoterpenes, 22.5% other reactive VOC, and 22.5%
other VOC [28]. In a more recent study, Karl et al. [29] estimated European emissions of
BVOCs in 12 Tg year-1. Tropical woodlands (rain forest, seasonal, drought-deciduous,
and savannah) are estimated to contribute with half of global biogenic VOC emissions.
Croplands, scrublands and other woodlands contribute 10–20% apiece.
Notwithstanding, the wide variety of uncontrollable factors (e.g. life stage of the plant,
weather conditions, season of the year) combined with the lengthy list of compounds
comprised among VOCs, the estimation of emissions may steer to an unaffordable
challenge [30]. Furthermore, it is a big challenge to determine the concentration of all the

General Introduction
20
VOCs in the environment since there are hundreds (even thousands) of them present in
the air. Periodic monitoring of the environmental occurrence of individual VOCs, instead
of the total sum, looms the best option to understand emissions for an efficient control.
Table 1.1-3 Calculated atmospheric lifetimes of biogenic volatile organic compounds
Biogenic VOC Lifetime for reaction with
OH O3 NO
Isoprene 1.4 h 1.3 day 1.6 h
Monoterpenes
Camphene 2.6 h 18 day 1.7 h
2-Carene 1.7 h 1.7 h 4 min
3-Carene 1.6 h 11 h 7 min
Limonene 49 min 2.0 h 5 min
Myrcene 39 min 50 min 6 min
cis-/trans-Ocimene 33 min 44 min 3 min
α-Phellandrene 27 min 8 min 0.9 min
β-Phellandrene 50 min 8.4 h 8 min
α-Pinene 2.6 h 4.6 h 11 min
β-Pinene 1.8 h 1.1 day 27 min
Sabinene 1.2 h 4.8 h 7 min
α-Terpinene 23 min 1 min 0.5 min
γ-Terpinene 47 min 2.8 h 2 min
Terpinolene 37 min 13 min 0.7 min
Sesquiterpenes
β-Caryophyllene 42 min 2 min 3 min
α-Cedrene 2.1 h 14 h 8 min
α-Copaene 1.5 h 2.5 h 4 min
α-Humulene 28 min 2 min 2 min
Longifolene 2.9 h >33 day 1.6 h
Oxygenates
Acetone 61 day >4.5 year >8 year
Camphor 2.5 day >235 day >300 day
1,8-Cineole 1.0 day >110 day 1.5 year
cis-3-Hexen-1-ol 1.3 h 6.2 h 4.1 h
cis-3-Hexenyl acetate 1.8 h 7.3 h 4.5 h
Linalool 52 min 55 min 6 min
Methanol 12 day >4.5 year 2.0 year
2-Methyl-3-buten-2-ol 2.4 h 1.7 day 7.7 day
6-Methyl-5-hepten-2-one 53 min 1.0 h 9 min

Chapter 1
21
23BENVIRONMENTAL EFFECTS 1.1.2.3
Volatile organic compounds play an important role in the atmospheric chemistry and
the climate, while being simultaneously impacted by chemical and climate changes.
VOCs contribute to the formation of fine particulate matter (PM2.5) through oxidation
reactions with hydroxyl radical, and to the formation of tropospheric ozone (O3) through
photochemical reactions in the presence of nitrogen oxides (NOx). PM2.5 and O3 are both
criteria pollutants, making VOC emissions, and the various anthropogenic factors
affecting them, an important factor in the evaluation of current and future air quality
scenarios. [24]
The mean life (or lifetime), defined as the period of time on which one compound
remains in a specific environmental reservoir, may greatly differ one another between
VOCs [22]: some can be transformed in few minutes whereas some others may have
long-term decomposition up to hundreds of years (the most persistent). The potential
removal and transformation processes for VOCs are wet and dry deposition, photolysis,
reaction with the hydroxyl (OH) radical, reaction with the nitrate (NO3) radical, and
reaction with ozone (O3). Reaction with chlorine (Cl) atoms may also be important in, for
example, coastal areas [31]. For most VOCs, dry and wet deposition is probably of
minor importance, though these physical removal processes could be important for the
chemically long-lived methanol and for certain VOC reaction products. Because of
absorption of short-wavelength solar radiation by O2 and O3 in the stratosphere,
photolysis in the troposphere requires the VOC to absorb radiation of wavelengths
⩾290 nm and is expected to be potentially important for carbonyls and organic nitrates
(and hence for many of the VOC reaction products). The processes leading to the
presence of O3, OH radicals and NO3 radicals in the troposphere are briefly discussed
below.
42BVOCs are ozone precursors. 1.1.2.3.1
The initial reactions of OH radicals, NO3 radicals and O3 with NMVOCs have been
elucidated over the past decades [24, 32, 33] and the reactions of BVOCs have been
previously reviewed by Atckinson and Arey Calogirou et al. [34, 35]. Ozone emissions
and reaction mechanisms with VOCs have been studied since long ago [36-38]. In
Table 1.1-3 are summarized atmospheric lifetimes of some BVOCs as ozone
precursors. From a global environmental point of view, photochemical reactions
involving O3 generation are the most important, since VOCs accumulation in the air
alters the natural ozone photochemical cycle.

General Introduction
22
Figure 1.1-4 Schematics of the reactions involved in NO-to-NO2 conversion and O3 formation in (A) natural NO–NO2–O3 systems in the absence of VOCs, and (B) NO–NO2–O3 systems in the
presence of VOCs.
In this natural cycle (Figure 1.1-4 A), O3 is generated and degraded in parallel to the
NO-NO2 photochemical cycle. This is a process with a null net product, summarized into
the following reactions [24]:
NO2→hv
NO + O (2)
O + O2→ O
3 (3)
NO + O3 → NO2 + O2 (4)
Atmospheric VOCs, especially hydrocarbons, enable additional oxidation steps from
NO to NO2 (Figure 1.1-4 B). The principal competitive chain reaction starts when a VOC
radical (VOC: hydrocarbon, RH) reacts with an OH* radical followed by an oxidation step
with O2:
RH + OHº→ Rº
+ H2O (5)
Rº+ O
2→ RO
2
º (6)
The new radical can continue through two different mechanisms, according to VOC
nature, to generate a NO2 molecule:
RO2
º+ NO → NO
2+ RO
º (7)
or

Chapter 1
23
RO2
º+ O
2→ HO
2
º+(carboniliccompounds) (8)
HO2
º+ NO → NO
2+ HO
º (9)
In consequence, assuming the overall mechanism of RO* radicals, each RH (VOC)
free radical in the troposphere may produce two molecules of O3:
RH + 4O2 → 2O3 + H2 O +(carbonilic compounds) (10)
Furthermore, during the ozone photolysis it is produced hydroperoxid radical (HO2*)
as secondary product, which in turn leads to regeneration of NO2 and HO*, hence being
an autocatalytic cycle on which several radical species may continue the chain reaction.
Ozone is not naturally degraded, and it accumulates in the atmosphere. There have
been reported ozone levels on polluted areas (urban and industrial areas) ranging 2-100
times higher than rural areas [39]. Notwithstanding, tropospheric ozone concentration
may depend on a wide set of factors, such as solar radiation and concentration of trace
gases, since O3 is involved in many reactive mechanisms. A global balance of O3 stated
by Peña-Creciente [40], reported an idea of all these mechanisms (Figure 1.1-5),
providing evidences over the critical importance of tropospheric photochemical
processes among the generation mechanisms, and thus the anthropogenic contribution
by massive VOCs emissions.
Figure 1.1-5 Total balance of tropospheric ozone
TROPOSPHERIC
O3
Photolysis (31%)
Photochemical (36%)
Deposition (33%)
(20%)
Stratosphere
Photochemical
(80%)
Carbon precursors
Nitrogen precursors
Biogenic
51% Anthropogenic 49%
Biogenic
10% Anthropogenic 90%
GENERATION ELIMINATION

General Introduction
24
The potential of each VOC to behave as ozone precursor may sensitively differ one
another, owing big differences in individual physicochemical properties of VOCs. The
capability to act as an O3 precursor depends on the reactivity grade with OH* radicals,
the mean life in the atmosphere, emission rates and punctual concentrations in the air.
The Photochemical Ozone Creation Potential (POCP) is the parameter used to classify
VOCs ozone creation capability according to its physicochemical properties.
POCPs are calculated on the basis of a photochemical path modelling [41].
According to this procedure (11) the increase of ozone levels for each VOC (under
controlled conditions) is rated by the increase of ozone levels for ethane (assumed as
one of the BVOCs with the highest potential as ozone precursor). A POCP value of 100
has been adopted for ethane to normalize the scale. Table 1.1-4 summarizes POCPs
estimated for some VOCs [42, 43].
POCPVOC
=O3 generatedby VOC
O3 generatedby ethene⋅100 (11)
Table 1.1-4 POCPs estimated for some VOCs
Compound POCP Compound POCP
Ethane 14,0 Ethylbenzene 80,8
Propane 41,1 o-Xylene 83,1
n-Butane 59,9 m-Xylene 108,8
n-Pentane 62,4 p-Xylene 94,8
n-Hexane 64,8 Styrene 7,7
n-Heptane 77,0 n-Propilbenzene 71,3
n-Octane 68,2 Isopropylbenzene 74,4
n-Decane 68,0 1,2,3- Trimethylbenzene 124,5
Ethene 100,0 1,2,4- Trimethylbenzene 132,4
Propene 107,9 1,3,5-Trimethylbenzene 129,9
1-Butene 113,2 o-Ethyltoluene 84,6
2-Butene 99,3 1,1,1-Tricloroethane 0,2
2-Pentene 95,3 Trichloroetene 7,5
1-Pentene 104,1 Tetrachloroethene 3,5
Isoprene 117,8 1,1-Dichloroethene 23,2
Benzene 33,4 cis-Dihcloroethene 17,2
Toluene 77,1 trans-Dichloroethene 10,1

Chapter 1
25
43BPhotochemical Smog 1.1.2.3.2
One consequence of the hazardous combination of O3, NOx, solid particles in
suspension in air and specific climatologic conditions is the phenomena commonly
named smog (smoke + fog). It was firstly described in the 1950s [36, 37], as the
combination of carbon and sulphuric particles emitted in industrial areas from the petrol
or carbon combustions. Under these conditions, the emitted sulphur oxides (SOx) turned
into small drops of sulphuric acid, were mixed with the high amounts of solid particles in
the air, produce a toxic and dense fog, with severe health effects on humans and
buildings. This is known as Industrial Smog, and was usual during certain period of
time at very industrialized Cities (e.g. London, Chicago). Nowadays, industrial facilities
and processes are developed with appropriate cleaning systems to prevent the release
into the environment of smog precursor particles. However it still may be a severe
problem in some Asian cities where environment protection is not a priority.
It is evident, however, that a wide list of cities present types of smog pollution even
though no petrol or carbon industries are present nearby. That smog is known as
photochemical smog, and it is generated by the photochemical reactions involved in
the O3 cycles already mentioned [44]. Under the presence of NOx, O3 and VOCs,
photochemical reactions produce a large list of secondary minor compounds, such as
acrolein, formaldehyde and peroxyacetyl nitrates (PAN). If sulphuric and nitrogen
compounds are also present in the atmosphere (acids, oxides, nitrates, etc.) they
condense in small particles producing a dense and toxic aerosol in the ambient air.
Photochemical smog is usual in areas with high amounts of petrol vehicles, which
emit both the necessary hydrocarbons and oxides to start photochemical reactions
under solar radiation. Hot and dry climates increases O3 photochemical reactions and
aggravate smog effects.
24BHUMAN HEALTH EFFECTS 1.1.2.4
As far as humans are concerned any pollutant may cause or contribute to an
increase in mortality or serious illness or may pose a present or potential hazard to
either human health or the environment. The determination of whether or not any
substance poses a risk to humans is based on clinical, epidemiological, and/or animal
studies which demonstrate that exposure to a substance is associated with health
effects. A group of compounds covering so wild wide range of chemical features also
presents a wide range of effects on human health, from the extremely hazardous to

General Introduction
26
those with no known effects. However it can be stated that any VOC may be harmful to
human health, either short or long term, as it may accumulate in the body over time [45,
46].
In the context of human health, “risk” is the probability that noxious health effects may
occur. The strength of such damages depends on many factors, including time and level
of exposure, individual sensitivity or pollution pathways. VOCs are generally introduced
in the body through the respiratory tract by direct exposure, attacking and/or
accumulating specially in the lungs. Diffusion of VOCs through parenteral ways may
also be an important pathway. The main parts of studies regarding risk assessment are
indoor evaluations, since VOCs concentration are in general higher than outdoors and
easier to measure [47-54]. In the year 2008 Butt et al. reviewed the fundamentals of risk
assessment evaluations of landfill disposal sites [55].
The US-EPA has compiled a list of the 188 most hazardous contaminants in the air
[56], most of them classifiable among the group of VOCs. In 2011, US-EPA published a
report of the 177 air toxics included in the 2005 national-scale assessment [57]. That risk
characterization considers the risk of both cancer and noncancerous effects from
inhalation of 139 of these air toxics (the subset of pollutants with health data based on
chronic exposure). The purpose of this national-scale assessment is to understand
these cancer risks and noncancerous health effects in order to help the EPA and others
to identify pollutants and source categories of greatest potential concern, and to set
priorities for the collection of additional information to improve future assessments. The
assessment represents a "snapshot" in time for characterizing risks from exposure to air
toxics. The national-scale assessment is not designed to characterize risks sufficiently
for it to be the sole source for regulatory action. In this study US-EPA assessed 80 of the
air toxic as carcinogenic according to carcinogen risk assessment guidelines [58]: 10
carcinogenic to humans, 53 likely carcinogenic for humans, 16 suggestive evidence of
carcinogenic potential.
Nowadays there are enough relevant available research studies regarding potential
risks, so it is necessary to appropriately aware population about the risks that entails air
pollution, including which ones are present in the air, which the concentrations and
which the severity of effects on human health. The European Environmental Agency is
working since 2003 in the HEAL project (Health and Environmental Alliance), a non-for-
profit organisation addressing to [59]: (1) strengthening and utilizing the knowledge on
environment and health links to promote and support precautionary policy-making; (2)
mobilising multidisciplinary constituencies for advocacy on environment and health
issues; and (3) ensuring the organisation’s sustainability as an effective and influential
representative of civil society.
Chapter 1
27
US-EPA is working towards the same direction through the Integrated Risk
Information System (IRIS) [59], a human health assessment program that evaluates
information on health effects that may result from exposure to environmental
contaminants. Through the IRIS Program, EPA provides high-quality science-based
human health assessments to support the Agency's regulatory activities. The IRIS
database is web accessible and contains information on more than 550 chemical
substances which are known to be harmful. Very comprehensive information about
individual VOCs can be found in both EEA-HEAL and EPA-IRIS. Furthermore, US-EPA
has developed a generic list of publications to meliorate indoor air quality and minimize
risks inside American homes [60].
In light of this evidences it looms imperative the implementation of restrictive laws in
order to: (1) reduce emissions of VOCs to the environment, and (2) control pollution
levels by periodic individual monitoring of compounds.

General Introduction
28
1.1.3 12BODORANT POLLUTION
In the last decades there has been an increasing concern regarding the “odorant
pollution”. Emission of chemicals to the environment, besides environmental and health
risks, generate annoyance to the population, up to the situation of extremely severe
levels, having a great impact in the quality of life. Living in clean and pleasant
environments is one of the basic requirements of any inhabitant; therefore emissions
must be properly controlled
Chemicals in the air are the one producing odours, either in gas phase or in
suspension. Once they reach the olfactory system, multiple reactions over the neuronal
system produce the odorant sensation. Odorant characterisation of a sampled matrix
thus might be carried out, however owing the extremely complex composition of
environmental gas samples and the unknown interactions within the olfactory system; it
is not possible to make reliable analysis of odours nowadays without the use of
subjective odorant measurements made by trained human panellists.
25BODOUR AS ANALYTE 1.1.3.1
The European standard method EN13725:2003 [61] is the reference methodology for
the determination of odorant emissions in the EU. In this report European Odour Unit
(OUE) is defined as the amount of odorant substances that, evaporated in 1 m3 of
neutral gas in normal conditions, generates a physiological response -equivalent to a
reference value- in the 50% of a set number of expert human panellists.
The reference measurement is accepted as the odour of 132 µg of n-butanol (CAS
17-36-3), which vaporized inside 1 m3 of neutral gas has a set concentration of 40 ppbv.
By means of this reference, odour measurement was thus traceable to mass and
volume international system units. Odour concentration is defined as the number of
odorant units per cubic meter of a gas under normal conditions (OUE m -3
N). The odour
intensity is a parameter that enables differentiation of chemicals, as long as different
chemicals show different odour intensities, i.e.
Odour intensity may be determined as stated in the standard report of the American
Society for Testing Materials (ASTM) E544-99 [62] within a static 8-points scale,
according to the Odour Intensity Reference Scale. However, odour perception is a
psychophysical magnitude, i.e. it describes a relationship between a physical stimulation
(one odour) with the intensity of the perception from one observer (trained human
panellists), so a static scale is not always usable to quantify OUs. For this purpose other
measurements are often used. This is the case of the Odour Threshold Values (OTVs),

Chapter 1
29
defined in the EN-13725 as the detectability of any odorant substance. By this new
definition, chemical substances are classified according to each individual
physicochemical property, where some compounds cannot be detected even at very
high concentrations and vice versa. Several different guides have evaluated odour
thresholds in water and air (see Chapter 3).
By means of this dynamic olfactometry standard method (EN 13725:2003) European
Council has established odorant limit values for a set of activities, including waste
treatments, industrial facilities, etc [61].
Some important drawbacks of this technique are the elevated expenses which
involve these measurements, the difficulty that entails and the fact of being a subjective
simulation. Because of that, with the purpose to simplify the olfactometry technique,
some studies tried to correlate odour units and chemical composition (concentrations)
with partial success. In Chapter 3 (Section 3.1.2 and 3.1.3) there is a description of the
recent trends about the correlation between odour units and the composition of VOCs.

General Introduction
30
1.1.4 13BCHROMATOGRAPHIC TECHNIQUES FOR THE
DETERMINATION OF VOCs IN AIR.
The analysis of VOCs in the environment air is challenging from various
perspectives:
(i) VOCs are, in general, embedded in complex volatile mixtures of gases, commonly
with solids and liquids in suspension;
(ii) Their concentrations may evolve rapidly with time; and,
(iii) They may be present on a wide range of concentration, usually in trace levels.
As trace compounds, VOCs concentrations in the ambient air are typically in the
order from ng m-3 to mg m-3, besides severely polluted effluents or indoor closed areas
with a heavy VOC source (i.e. industrial facilities). This important issue makes VOCs
analyses conditional on: (a) the use of very sensitive analytical techniques and (b) the
need of extraction and clean-up step prior to the analysis. Some other critical factors
determine the best analytical methodologies for VOCs quantification in the air.
Owing the extremely wide range of different compounds included among VOCs, with
different physicochemical properties and different effects on human health and
environment, it is a priority to quantify them individually. It is necessary the use of an
appropriate separation technique to characterize air chemical composition on the basis
of individual concentrations. Chromatographic techniques perform the most efficient
separation. Due to VOCs high vapour pressure, gas chromatography (GC) is the
selected analytical separation technique usually adopted by analysts. Capillary columns
(typical inner diameters ranging from 150 to 350 µm) currently provide the best
separation efficiency, enabling the detection of hundreds of different VOCs in one single
run in a relative short time. Yassa et al., for example, analysed 190 VOCs in the air in 30
minutes [63].
Different instrumentation may be coupled to GC for the analytical detection of VOCs,
depending on the chemical properties of the analytes being measured. Some detectors
enable good sensitivity but non-selectivity to VOCs. Flame Ionization Detector (FID) and
Photoionization Detector (PID) are specific for compounds with organic carbon and
hydrogen, and Electron Capture Detector (ECD) and Electrolytic Conductivity Detector
(ELCD) are specific for halogenated compounds. These detectors do not provide any
qualitative information about analytes. In this sense the most capable detection method
is the Mass Spectrometry Detection (MSD or MS) which also provides structural
information of the molecules. Due to the mentioned features, gas chromatography
separation technique coupled with mass spectrometry detection, hereafter GC-MS, is

Chapter 1
31
the recommended technique for VOCs analyses in mainly every environmental standard
report, including US-EPA compendium of methods TO 14A, TO 15 y TO 17 [8, 64, 65]
and some EEA directives , as it is further explained in section 1.1.5.1.
26BSAMPLING AND EXTRACTION TECHNIQUES 1.1.4.1
Sampling techniques are one of the key points of all environmental analyses,
regardless the compound analysed. In general, they must be selected in order to satisfy
several critical features [66]:
Sampled aliquot must be representative of the (average) matrix composition
of the sample.
Sample matrix cannot be altered during the procedure.
Ease and speed.
Capable to be performed in-situ under field conditions.
The specific case focused in this Thesis, the analyses of VOCs in air samples,
requires a extraction step owing the low concentrations in the environment. It is usually
recommended to combine sample collection and extraction into one single when it is
feasible. Given the complexity and variability of organic vapours in air, no one sampling
approach suits every monitoring scenario. As it has been stated before, it is necessary
to measure the concentration of each individual chemical. Overall or total VOC (TVOC)
data - such as that generated by direct read-out detectors– does not give sufficient
information to allow an accurate assessment of the total risks associated with a given
atmosphere.
The most usual collection techniques in the field sampling of VOCs in the air are: (1)
cryogenic techniques, (2) whole air collection techniques, (3) sample collection using
solid sorbents and (4) on-line continuous sampling. These techniques have been
extensively reviewed during the last years [67-73] and are explained in this section.
Other on-line non-chromatographic techniques are described in section 1.1.4.5. A
summary of the principal advantages and drawbacks of each technique is further
showed in Table 1.1-6.
44BCryogenic sampling techniques 1.1.4.1.1
Cryogenic extraction, passing an air flow through a cooled tube usually filled with
glass beads, remains one of the typical VOC enrichment methods for air samples. It is
not a very common technique, but some applications where this technique is combined

General Introduction
32
with canister sampling are reported in the last years for analysis of indoor environments
[74], the lower troposphere [75, 76], and (sub)urban environments [77-79] (canisters,
see Section 1.1.4.1.2.2). Removal or control of water vapour is essential for suitable
cryogenic extraction [78] to avoid water crystals.
Farrell and Pacey developed a novel technique Dispersive Vapour Extraction (DVE)
[80], on which less than 1.0 mL of a volatile solvent was vaporized inside a flask
containing gaseous mixture. The flask was then cooled under running tap water for 2–3
min to induce condensation of the vapour and co-extraction of the VOCs from the
headspace using solid-phase microextraction (SPME, see section 1.1.4.2.5.1).
Other novel in-line sampling device developed by Wang et al. [81] improves the
canister-cryogenic extraction in two main features: (1) minimizes cryogenic gas
consumption, and (2) reduces the extension of the sampling time to approximately one
hour to improve the hourly representations.
45BWhole air collection 1.1.4.1.2
Collecting air in a sampling container is the simplest way to collect atmospheric air.
The samples are usually further analysed using gas chromatography, by direct injection
or, more frequently, in combination with an extraction step. This technique presents
some advantages over sorbent methods as it allows, for example, whole-air sampling,
avoiding the breakthrough of target compounds and eliminating the need for thermal or
solvent desorption. It also provides multiple aliquots for replicate analysis and time-
integrated samples can be obtained using controlled-flow pumps with bags or metal
containers. Several types of containers can be used: gas-tight syringes, glass bulbs,
especial bags, or metal containers, although the most widely used are plastic bags and
stainless-steel containers (canisters) [82]. The U.S. Environmental Protection Agency
(US-EPA) adopted two evacuated canister methods to determine VOCs (TO-14A [64]
and TO-15 [65]). This sampling method has been widely used for air toxics monitoring
[83-85].
1.1.4.1.2.1 Sampling bags
Plastic bags are simple to use, inexpensive and commercially available in various
sizes, normally from 500 mL to 100 L. Plastic bags may be reused after cleaning by
repeatedly filling the bag with pure nitrogen or ultrahigh purity air, and evacuating them
with slight negative pressure, however it is not a frequent procedure and they normally
are for single-use purposes. Several materials are commercially available: Haral®,
Saran®, Tedlar®, Teflon®, Nalophan®, etc. Many of them are usable for dynamic

Chapter 1
33
olfactometric measurements, and recommended in the official European method for
determination of odours by dynamic olfactometry EN-13725 [61], owing the low odour
background emitted which reduces interferences in the odour sensorial detection.
As principal drawback, some bags are also permeable to certain chemicals, and
losses of significant amounts of sample have been observed when they have been
stored for prolonged periods [86, 87]. A disadvantage of using Tedlar® and Nalophan®
bags is that compounds may not remain stable for more than 24-48 hours [82].
Moreover, Tedlar® bags can allow humidity to diffuse when relative humidity levels differ
between the inside and outside. A double layer Tedlar bag has been designed with a
drying agent between the two films to limit the impact of external humidity on a low-
humidity sample [88].
The commercially available sampling bags are provided empty (vacuum), and must
be filled up by the “lung principle” procedure. (Figure 1.1-6). By this procedure the bags
are kept inside a vessel which can be hermetically closed. A pump removes the air from
the vessel, creating an overpressure which fills the bag with connected with the exterior
air by a sampling probe.
Figure 1.1-6 Schematic depiction of the “lung principle” procedure to fill up sampling bags
1.1.4.1.2.2 Canisters
Unlike the plastic bags, the principle disadvantages of using metal canisters are the
high initial cost. Wang et al. [89] have reviewed evacuated canister methodology to

General Introduction
34
determine VOCs in ambient air. A canister is a cylinder or sphere, in general made of
stainless steel, which is usually provided with a valve which controls the speed and the
filling time. Thus the canister may be filled rapidly, 5 or 10 s without restriction (direct
filling) or can be filled at a constant rate over a controlled period of time, typically 24 h to
calculate average daily concentrations (restricted passive filling). Another possibility is to
fill it using a pump, namely active or pressurized sampling, which increases the sample
volume. The canister sampling method is contained in the method TO 14A of the US-
EPA. This technique has great advantages, such as the ability to analyse compounds
with a wide range of volatilities or highly reactive compounds that degrade when working
with solid sorbents. Furthermore, it prevents the effects of other pollutants such as O3,
NOx and SO2, which can oxidize the solid adsorbents and the retained compounds. The
main disadvantage of canisters is the relative high prizes compared to other sampling
techniques, since in most cases it is necessary extra equipment for automating the
concentration of analytes prior to chromatographic separation and also remove water
and oxidizing gases which can interfere in the analysis. On the other hand we must add
the cost of the canisters and the cleaning procedure. This process is critical in this type
of techniques since a poor cleaning of the canister may cause carryover of consecutive
samples. Usual cleaning procedure is done by passing high flow of inert gas (N2) and
heating within 80 - 120°C.
In whole air sampling, an intermediate step for the VOC extraction is frequently
carried out prior to analytical detection [67]. Either sorbent or cryogenic trapping can be
used to do this [82, 87, 89]. The US-EPA TO- 14A and TO-15 methods establish the use
of a cryogenic trap. Solid phase microextraction (SPME) has also been used to
preconcentrate analytes from air collected in containers [90]. Also, Mangani et al. [91]
used “cold” solid-phase microextraction to preconcentrate compounds from air samples
collected into stainless-steel canisters using sub-ambient temperatures to enhance the
retention capability of the SPME fiber.
A big challenge is removing water from the sample, which, although is an advantage
in the case of Summa canisters, where water enhances the stability of collected VOCs,
it can also interfere with subsequent analytical techniques. Some problems resulting
from humid air streams include loss of VOCs in condensed water, blockage of cryogenic
traps through the formation of ice, variability in GC retention time by overloading and
damaging the stationary phase, and deterioration of the mass spectrometer ion source
due to ionization of H2O. Some techniques for removing water vapour include drying
using desiccants, adsorbents, cryocondensation and permeation [89]. The US-EPA TO-
14A method calls for use of a Nafion dryer upstream from the trap.
Chapter 1
35
ENRICHMENT INTO SOLID SORBENTS 1.1.4.2
This is a well-established sample preparation technique for VOCs in air [68, 92]. The
VOC fraction of the sample is collected exclusively by trapping them through the
adsorption or reaction of VOCs upon solid sorbent surfaces, either by active or passive
sampling. These procedures are included among the Solid Phase Extraction (SPE)
techniques. These SPE techniques enable:
Determination of either individual or total concentrations.
Enable non-solvent techniques, since elution may be made by controlled
thermal desorption.
Sorbent regeneration and re-use.
46BActive methods 1.1.4.2.1
Active sampling consists of pumping a defined volume of air through a bed of
sorbent(s) in a tube where analytes are retained. Active sampling with sorbents is the
most versatile option, and several official reports have been established based on this
technique, such as US-EPA TO- 17 [8], ASTM D-6196 [93] , NIOSH 2549 [94] and ISO
16017-1,2 [95, 96]. Standard tube characteristics have also been defined: 3.5 inches
long and ¼ inch external diameter, which can sample efficiently at flow-rates ranging
from 10 to 200 mL min-1. Stainless steel sorbent tubes (Figure 1.1-9, page 42) are
adapted to thermal desorption automatic units (see Section 1.1.4.3). In active sampling,
flow rates can vary from 10 to 1000 mL min-1, collecting sample volumes ranging from
0.1 to 150 L [68].
Tubes filled with solid sorbents have been the most used strategy to monitor VOCs in
ambient air. A broad list of examples is given along Chapter 3 (Section 3.1).
Even though the use of individual solid sorbent is a common procedure, if analytes in
a broad volatility range are determined, it is often useful to select more than one
adsorbent, combining different materials with complementary features, arranged in order
of increasing adsorbent strength for sampling, to achieve best results. These tubes are
commonly named sorbent traps. In this case, it is especially important that the sampling
direction starts from the weakest to strongest sorbent, to keep the less volatile
compounds from being irreversibly retained in the strongest sorbent. If desorption of
analytes is carried out by controlled thermal desorption, the carrier gas must flow
towards the opposite direction (strongest to weakest sorbents) as is indicated in Figure
1.1-9. Several of the most common sorbents with some of their main features described
in sections 1.1.4.2.3 and 1.1.4.2.4 are summarized in Table 1.1-5.

General Introduction
36
Passive methods 1.1.4.2.2
Analyte enrichment in passive samplers [97-100] results from the diffusion of
analytes from the immediate surroundings to the inside of the sampler, where they are
trapped on the surface or in the bulk of the solid sorbents. As long as the organic
compounds have affinity for the sorbent, a concentration gradient can be established to
favour diffusion of the contaminant from air to the sorbent. The layer of solid sorbent is
covered with a barrier material, whose outer surface is exposed to the contaminated air.
The barrier is a semi-permeable membrane or a layer of plastics drilled with many small
parallel holes. Fick’s law of diffusion describes the principle of passive-sampler
operation, which is detailed in the literature [97]. Briefly, Fick’s first law can be explained
by the equation [87]:
m/(tA)=D(Ca−C f )/L (12)
where m is the mass of substance that diffuses (µg), t is the sampling interval (s), A is
the cross-sectional area of the diffusion path (cm2), D is the diffusion coefficient for the
substance in air (cm2 s-1), Ca is the concentration of substance in air (µg cm-3), Cf is the
concentration of the substance above the sorbent, assumed to be 0, and L is the
diffusion path length (cm).
Assuming that adsorbents act as a perfect sink (Cf = 0), Equation (1) can be
simplified to:
m/(t⋅Ca)=D⋅A/L (13)
The term ‘‘m/t Ca’’ is uptake rate or sampling rate. Theoretically, this is constant for an
analyte and a type of sampler. Once it has been determined, it can be used to calculate
ambient concentration Ca from a measured mass of analyte. Figure 1.1-8 shows the
process of diffusion. The experimental approach involves experimental determination of
uptake-rate coefficients based on exposure of the sampler to standard gas mixtures in
exposure chambers [97]. European Committee for Standardization developed European
Standard EN 13528-1,2 [101, 102] to set the requirements in the use of passive
sampling for gases and vapours monitoring.

Chapter 1
37
Figure 1.1-7 Diffusion process [67]
Conventional passive samplers fall into two main geometrical categories ( see Figure
1.1-8):
Axial, which are characterized by a long axial diffusion path and a low
cross-sectional area; and,
Radial, which have a diffusion path parallel to the cartridge radius and a
greater cross-sectional area, allowing higher uptake rates.
Figure 1.1-8 Different passive samplers axial and radial [103]
Different types of passive samplers are commercially available and have been used
for the determination of environmental VOCs. Radial passive samplers are commercially
available as Radiello (FSM, Padova, Italy). These samplers have 100 times more area
than axial samplers, reducing sampling times. They are also compatible with TD
instrumentation. Radiello samplers have been widely evaluated for use in monitoring
benzene, toluene, ethylbenzene, and xylenes (BTEX) and VOCs by many authors [104-
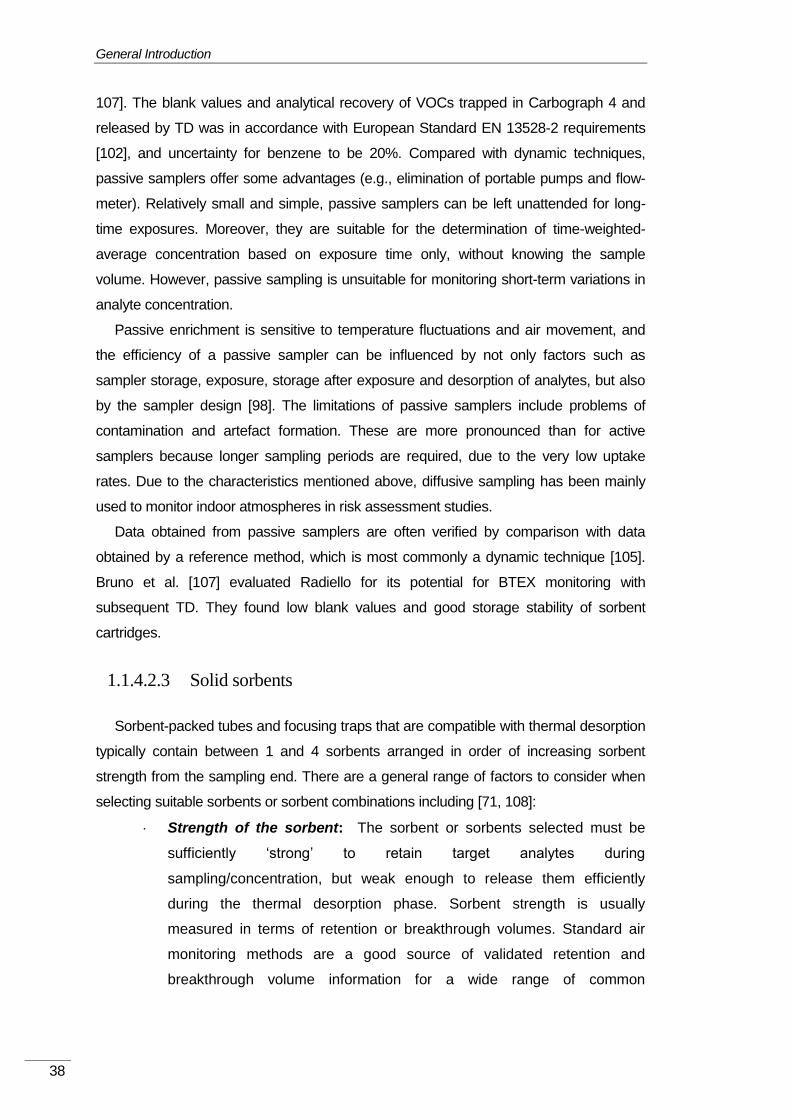
General Introduction
38
107]. The blank values and analytical recovery of VOCs trapped in Carbograph 4 and
released by TD was in accordance with European Standard EN 13528-2 requirements
[102], and uncertainty for benzene to be 20%. Compared with dynamic techniques,
passive samplers offer some advantages (e.g., elimination of portable pumps and flow-
meter). Relatively small and simple, passive samplers can be left unattended for long-
time exposures. Moreover, they are suitable for the determination of time-weighted-
average concentration based on exposure time only, without knowing the sample
volume. However, passive sampling is unsuitable for monitoring short-term variations in
analyte concentration.
Passive enrichment is sensitive to temperature fluctuations and air movement, and
the efficiency of a passive sampler can be influenced by not only factors such as
sampler storage, exposure, storage after exposure and desorption of analytes, but also
by the sampler design [98]. The limitations of passive samplers include problems of
contamination and artefact formation. These are more pronounced than for active
samplers because longer sampling periods are required, due to the very low uptake
rates. Due to the characteristics mentioned above, diffusive sampling has been mainly
used to monitor indoor atmospheres in risk assessment studies.
Data obtained from passive samplers are often verified by comparison with data
obtained by a reference method, which is most commonly a dynamic technique [105].
Bruno et al. [107] evaluated Radiello for its potential for BTEX monitoring with
subsequent TD. They found low blank values and good storage stability of sorbent
cartridges.
48BSolid sorbents 1.1.4.2.3
Sorbent-packed tubes and focusing traps that are compatible with thermal desorption
typically contain between 1 and 4 sorbents arranged in order of increasing sorbent
strength from the sampling end. There are a general range of factors to consider when
selecting suitable sorbents or sorbent combinations including [71, 108]:
Strength of the sorbent: The sorbent or sorbents selected must be
sufficiently ‘strong’ to retain target analytes during
sampling/concentration, but weak enough to release them efficiently
during the thermal desorption phase. Sorbent strength is usually
measured in terms of retention or breakthrough volumes. Standard air
monitoring methods are a good source of validated retention and
breakthrough volume information for a wide range of common

Chapter 1
39
sorbent/sorbate combinations and describe how these values can be
determined experimentally.
Selection of sorbents of appropriate strength allows quantitative retention
and release of compounds ranging from C2 hydrocarbons to semi-volatiles
such as PCBs, phthalates and PAHs without exceeding optimized tube/trap
dimensions and without requiring liquid cryogen coolant.
Hydrophobicity: If a large amount of water is retained on the tube and
not selectively eliminated prior to analysis, it can adversely affect. Most
common weak- and medium strength sorbents are very hydrophobic, thus
their sorbent strength is not compromised even when sampling at high
(>80%) relative humidity. However, most strong sorbents comprise some
form of carbonised molecular sieve and, in this case, sorbent strength
can be reduced by as much as a factor of 10 at 90% relative humidity
[70].
Inertness: some sorbents contain chemically active materials. This is
especially true of carbon blacks, many of which derive originally from
natural charcoals and contain trace metals. These sorbents are in many
cases unsuitable for labile (reactive) species like some sulphured
compounds, terpenes or amines.
Mechanical strength (friability): Graphitised carbon blacks are
extremely friable and prone to the formation of fines. Care should be
taken not to over compress these sorbents during tube packing and to
avoid sharp knocks once the tubes are packed. As the carbon packing
ages, the formation of fines may increase tube impedance (back
pressure) beyond the limit of some pumps.
Mesh size: Within the 30–80 mesh range, sorbent particle size does not
play a critical role in sorbent selection because analyte retention volumes
will remain constant as the particle size increases up to a limit of 5
particles across the internal diameter of the sorbent tube/trap.
There is nowadays a long list of commercially available sorbents, covering a wide
range of features. Table 1.1-5 shows some of the most usual adsorbents in
environmental evaluations and some their particular features.

General Introduction
40
Table 1.1-5 Most frequently used TD compatible adsorbents in the clean-up and extraction step of
VOCs in air and their main features, sorted in ascending order of sorbent strength [67, 71, 87, 108,
109].
Sorbent Strength Max. Temp. Features
Quartz wool Very weak >450°C Very inert, non-water retentive
Carbograph 2TD Weak >450°C Hydrophobic
Carbopack C Minimal artefacts (>0,1ng)
Carbotrap C Friable. 40/60 mesh recommended to minimise
back pressure
Tenax TA Weak 350°C Hydrophobic
Low inherent artefacts
Inert - suitable for labile components
Carbograph 1TD Weak/medium >450°C Hydrophobic
Carbograph B Minimal artefacts (>0,1ng)
Carbotrap Friable. 40/60 mesh recommended to minimise
back pressure
Chromosorb 102 Medium 225°C Hydrophobic
High inherent artefact levels (10-50
ng/component)
Inert - suitable for labile components
PoraPak Q Medium 250°C Hydrophobic
High inherent artefact levels (10-50
ng/component)
Inert - suitable for labile components
HayeSep D Medium 290°C Hydrophobic
High inherent artefact levels (10-50
ng/component)
Inert - suitable for labile components
Carbograph 5TD Medium/strong >450°C Hydrophobic
High inherent artefact levels (10-50
ng/component)
Friable. 40/60 mesh recommended to minimise
back pressure

Chapter 1
41
Sorbent Strength Max. Temp. Features
Carbopack X Medium/strong >450°C Hydrophobic
High inherent artefact levels (10-50
ng/component)
Friable. 40/60 mesh recommended
Carboxen 1000 Very strong >450°C Inert, not hydrophobic
Individual artefacts below 0,1 ng
Must be conditioned slowly
Significantly water retentive - do not use in
humid conditions
Carbosieve SIII Very strong >450°C Minimal (>0,1 ng) artefacts
Inert - suitable for labile components
Significantly water retentive - do not use in
humid conditions
49BMulti sorbent tubes 1.1.4.2.4
If a wide volatility range of compounds is to be monitored, it is often necessary to
pack a tube with more than one sorbent material, arranged in order of increasing
strength from the sampling end (Figure 1.1-9). Note that, in the case of multi-sorbent
tubes and traps, it is even more critical than normal to use back flush desorption – i.e.
the flow of gas through the tube/trap during desorption must be the reverse of the air/gas
flow during sampling. Higher boiling analytes are thus retained by and desorbed from
the weaker front sorbent(s) without coming into contact with the stronger sorbents
behind. These tubes can only be used in the active sampling procedure.
Key issues to consider in relation to sorbent selection for multi sorbent tubes include:
The volatility range of the target compounds for a quantitative retention
and efficient desorption of each.
Sorbent compatibility – the temperature required for conditioning the most
thermally-stable sorbent must not exceed the maximum temperature limit
of any other sorbent in the tube.
Stability during storage. Loosely bound analytes can migrate from weak
to strong sorbents within a multi-sorbent tube during storage.
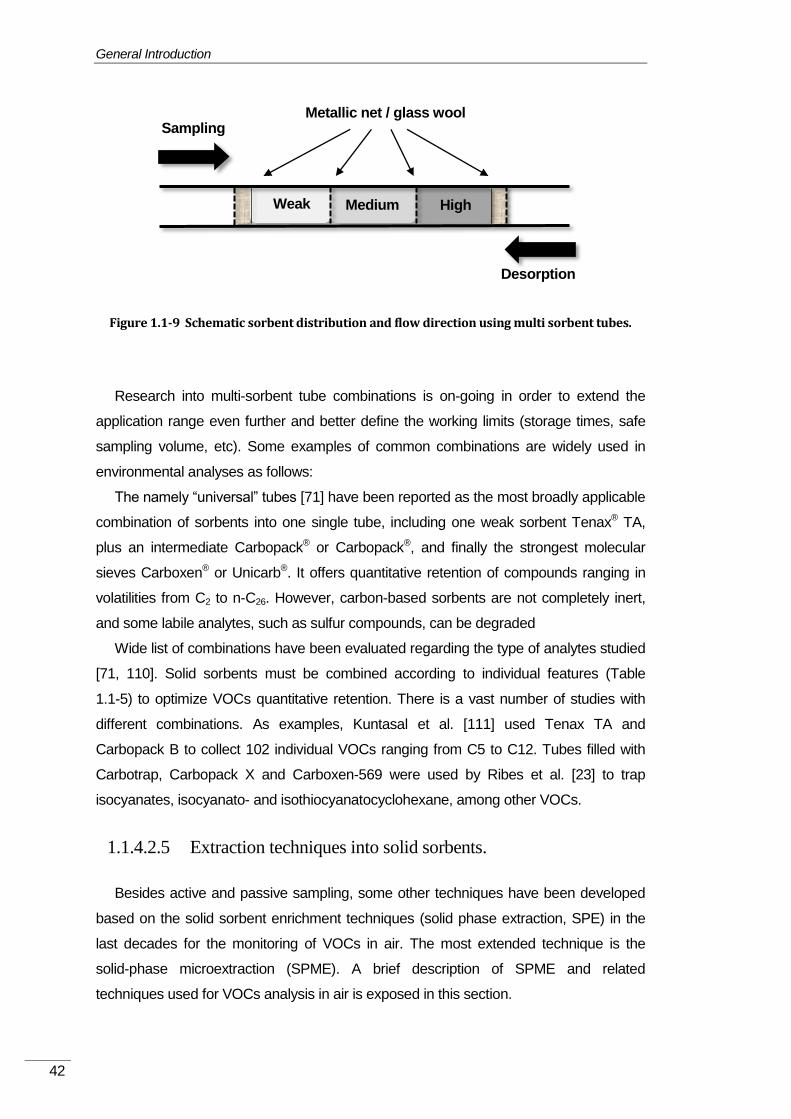
General Introduction
42
Figure 1.1-9 Schematic sorbent distribution and flow direction using multi sorbent tubes.
Research into multi-sorbent tube combinations is on-going in order to extend the
application range even further and better define the working limits (storage times, safe
sampling volume, etc). Some examples of common combinations are widely used in
environmental analyses as follows:
The namely “universal” tubes [71] have been reported as the most broadly applicable
combination of sorbents into one single tube, including one weak sorbent Tenax® TA,
plus an intermediate Carbopack® or Carbopack®, and finally the strongest molecular
sieves Carboxen® or Unicarb®. It offers quantitative retention of compounds ranging in
volatilities from C2 to n-C26. However, carbon-based sorbents are not completely inert,
and some labile analytes, such as sulfur compounds, can be degraded
Wide list of combinations have been evaluated regarding the type of analytes studied
[71, 110]. Solid sorbents must be combined according to individual features (Table
1.1-5) to optimize VOCs quantitative retention. There is a vast number of studies with
different combinations. As examples, Kuntasal et al. [111] used Tenax TA and
Carbopack B to collect 102 individual VOCs ranging from C5 to C12. Tubes filled with
Carbotrap, Carbopack X and Carboxen-569 were used by Ribes et al. [23] to trap
isocyanates, isocyanato- and isothiocyanatocyclohexane, among other VOCs.
50BExtraction techniques into solid sorbents. 1.1.4.2.5
Besides active and passive sampling, some other techniques have been developed
based on the solid sorbent enrichment techniques (solid phase extraction, SPE) in the
last decades for the monitoring of VOCs in air. The most extended technique is the
solid-phase microextraction (SPME). A brief description of SPME and related
techniques used for VOCs analysis in air is exposed in this section.
Sampling
Weak Medium High
Desorption
Metallic net / glass wool

Chapter 1
43
1.1.4.2.5.1 Solid Phase Mictroextraction (SPME)
Since its introduction in 1990ies [112], hundreds of manuscripts including some
excellent recent review articles [113-119] deal with both fundamentals and applications
of this attractive sample extraction technique. This technique has been used in the
VOCs analyses since then, and nowadays is one of the most used SPE for
environmental characterisation. As a general description, SPME (or fibre SPME) is
based on the equilibrium partitioning of target analytes between the sampled matrix and
a stationary phase, coated on a fused silica fibre. Analytes are retained upon the solid
sorbents while the SPME fibre is exposed to sample matrix (Figure 1.1-10).
Despite the wide application potential of SPME and its numerous advantages over
more conventional extraction techniques, it suffers some main limitations [139,140].
First, the small volume of sorbent coated on a SPME fibre (usually less than 1 mg)
results in a rather limited sorption capacity. Second, the fragility of the fused-silica rod
needs a careful handling during the extraction and desorption steps, and limits the
lifetime of the fibre. Third, bleeding of the SPME coating into a GC injector and sample
carry-over are sometimes difficult to avoid.
We should note that the calibration method for SPME is an important factor for on-
site application. Because of the difficulties in adding internal standards and control of
agitation of the matrix in on-site sampling, it is necessary to develop new calibration
methods. Some reviews have discussed in detail the characteristics of traditional and
novel kinetic calibration methods [114, 119].
Figure 1.1-10 Schematic depiction of SPME fibre interaction with the sample matrix

General Introduction
44
The principal advantages of this technique include [120] a solvent free technique,
fibres are reusable, small size (portable device), and do not disturb equilibrium of the
sample during the study. SPME also enables solid fibre in-situ derivatization to improve
the selectivity over the retention of analytes. SPME, in combination with GC and HPLC,
has been reported for the analysis of VOC in indoor air [121, 122], gaseous industrial
effluents [123, 124], and the lower troposphere [91, 125], with LODs typically below 1
ng L−1. Some advantages and drawbacks are summarized in Table 1.1-6.

Chapter 1
45
Table 1.1-6 General advantages and disadvantages of sample and extraction techniques for the analysis of VOCs in air matrices.
Technique Advantages Disadvantages
Whole-air techniques
(e.g.: canisters)
Easy to use
Whole-air collection
No breakthrough volume
No desorption needed
Enables use of several aliquots
Lower limits of detection
High costs of canisters
Hard to clean, possible carry-over between samples
Unstable, some plastics may not properly retain VOCs along the time
Passivation steps when using canisters
Further extraction steps are mandatory (e.g. SPME)
ozone and humidity interactions may provoke losses of VOCs
Solid sorbents A long list of sorbents commercially available
High concentration capacity
Necessity of conditioning step prior to each analysis
some sorbents may be too inert
Blank interferences and irreversible adsorptions
Need of flow-meters and pumps
Active sampling upon
solid sorbents
A wide range of VOCs may be analysed owing different sorbent combinations
Simple calibration procedure (compared to passive sampling)
Automated analysis
Humid traps may avoid water interferences
Enable the use of cryogenic traps
Simple and small
Possible analyte losses
Not usable for variations within short periods of time
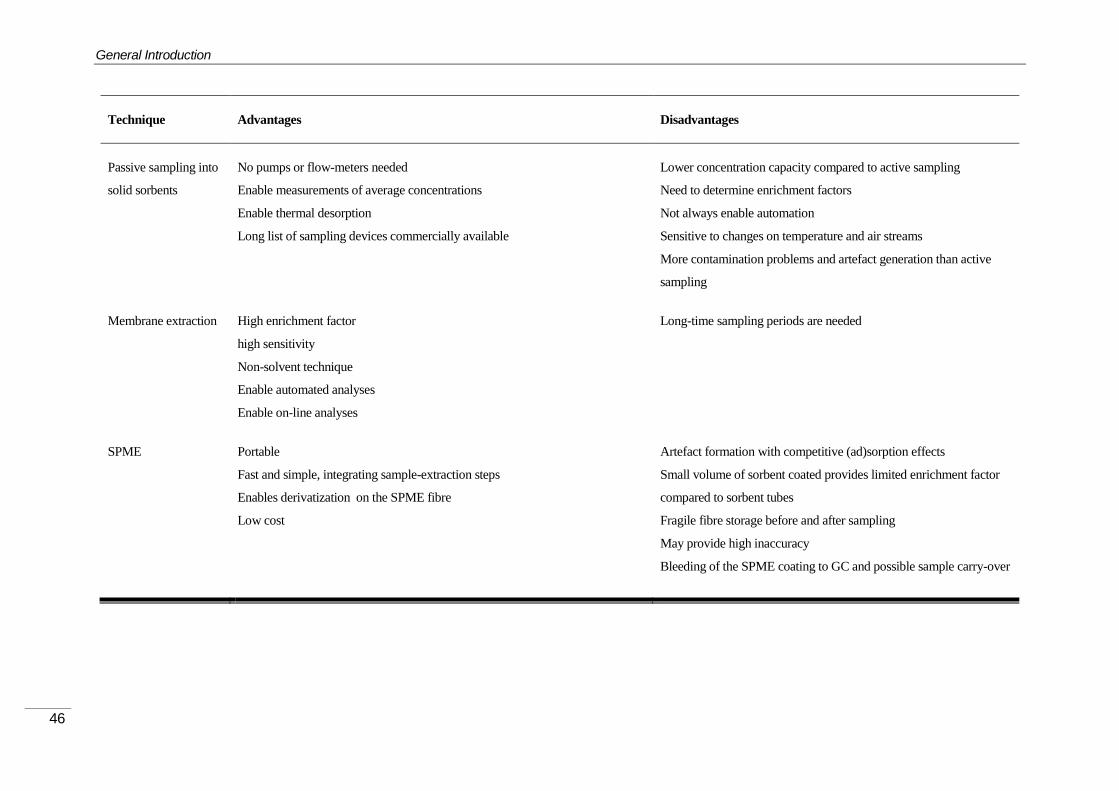
General Introduction
46
Technique Advantages Disadvantages
Passive sampling into
solid sorbents
No pumps or flow-meters needed
Enable measurements of average concentrations
Enable thermal desorption
Long list of sampling devices commercially available
Lower concentration capacity compared to active sampling
Need to determine enrichment factors
Not always enable automation
Sensitive to changes on temperature and air streams
More contamination problems and artefact generation than active
sampling
Membrane extraction High enrichment factor
high sensitivity
Non-solvent technique
Enable automated analyses
Enable on-line analyses
Long-time sampling periods are needed
SPME Portable
Fast and simple, integrating sample-extraction steps
Enables derivatization on the SPME fibre
Low cost
Artefact formation with competitive (ad)sorption effects
Small volume of sorbent coated provides limited enrichment factor
compared to sorbent tubes
Fragile fibre storage before and after sampling
May provide high inaccuracy
Bleeding of the SPME coating to GC and possible sample carry-over

Chapter 1
47
1.1.4.2.5.2 Solid Phase Microextraction based techniques
More recently, a list of innovative extraction devices has been introduced. Kataoka
[126] reviewed and classified the different techniques developed in the last decade .
Duan et al. focused on recent developments in microextraction techniques for on-site
sampling and sample preparation besides fibre SPME, including stir-bar sorptive
extraction (SBSE), thin-film microextraction (TFME) and different types of in-needle
SPME [118]. A schematic diagram of the diverse techniques is presented in Figure
1.1-11. Some of the extraction procedures are described in Figure 1.1-12.
Figure 1.1-11 Classification of SPME based techniques used in air matrix samples.
SPME Based Techniques
Sample stir
microextraction
Sample flow
microextraction
· Fibre SPME
· Stir-bar sorptive extraction (SBSE)
· Thin-film microextraction (TFME)
In-tube SPME
In-needle SPME
In-tip SPME
· Coated capillary (open tubular)
· Sorbent-packed capillary
· Fibre-packed capillary
· Solid-phase dynamic extraction (SPDE)
· Microextraction in a packed sorbent (MEPS)
· Fibre-packed needle microextraction (PNME)
· Sorbent-packed tip
· Fibre-packed tip

General Introduction
48
Figure 1.1-12 Schematic extraction procedure of some SPME based techniques. (A) Fibre SPME; (B) stir bar sorptive extraction (SBSE); (C) thin-film microextraction (TFME); (D) solid phase dynamic extraction (SPDE); (E) fibre-packed needle microextraction (PNME); and (F)
microextraction in a packed sorbent (MEPS).
28BDESORPTION TECHNIQUES 1.1.4.3
The second step of any extraction technique regards on the elution of the retained
analytes. Therefore it is also a key point on sample treatment [66], since it is necessary
to optimize any elution step to satisfy reliability and traceability of analyses. VOCs are
mainly eluted by two techniques: extraction using liquid solvents (solvent desorption,
SD) and extraction by volatilisation of the retained compounds under controlled heating
conditions (thermal desorption, TD). An overview of the most relevant features from both
desorption techniques is presented in this section.
51BSolvent Desorption 1.1.4.3.1
Solvent extraction allows longer sorbent beds, higher flow rates and larger total-
sample volumes than thermal desorption (TD). It is often used for processing passive
samplers, and is the best technique for thermally-labile compounds. Furthermore,
samples can be analysed repeatedly, and no expensive equipment is required.
However, the sample is diluted, and can be contaminated by the solvent. Trace analysis
may require solvent evaporation, which can lead to losses of the most volatile
compounds.

Chapter 1
49
Analytes are extracted from the adsorbent with a low boiling solvent -e.g.,
dichloromethane or carbon disulphide (CS2). CS2 is the most common solvent used for
solvent desorption owing good solubilisation properties for many analytes, and a very
low response on a flame ionization detectors (FID) [67]. However, it poses a serious risk
to human health (analysts) and the environment. Also, compounds with low boiling
points can evaporate due to the adsorption heat released during desorption.
Elbir et al. [127] extracted 60 VOCs trapped in activated carbon by adding 1 mL of
CS2, using a ultra-sonication bath with further centrifugation to obtain a clear phase at
the top. Martins et al. [128] desorbed BTEX from coconut shell charcoal by transferring
the sorbent bed to vials and adding 1 mL of CH2Cl2 with agitation. Pressurized liquid
extraction technique (PLE) has been applied by Campos-Candel et al. [129] to extract
BTEX from activated charcoal using acetonitrile as extraction solvent, obtaining
recoveries >90% for all the compounds. This technique furthermore allowed the use of
closed stainless-steel vessels that avoid the risk of airborne contamination, thus
eliminating worker exposure to the solvent.
52BThermal Desorption 1.1.4.3.2
Due to the low concentrations of analytes, samples taken from relatively unpolluted
environments cannot normally be analysed using solvent desorption without additional
sample concentration, and a procedure involving concentration, dilution and re-
concentration is unwieldy in practice and prone to errors [92]. Thermal desorption (TD) is
a solvent-free method that works excellently with GC separation.
TD offers the advantage of lower LODs. This is because the sample can be
completely transferred to the chromatographic column with no elution, and because it
avoids the presence of a solvent peak, which may mask analyte peaks. It also prevents
analyte losses by minimizing sample manipulation and risks of contamination due to
solvents. The main disadvantage of TD is the initial cost of the commercial equipment
[130]. Another drawback is sample consumption in a single analysis, although modern
TD equipment incorporates design modifications to allow re-collection of split samples in
a fresh tube.
This technique is commonly used for volatile chemical analysis, being the method of
choice to determine VOCs in the major part of studies of urban and industrial air, indoor
and workplace atmospheres and other atmospheres (e.g., those influenced by waste
emissions).
In some cases, analytes can be too strongly adsorbed. This occurs frequently with
polar solutes and strong adsorbents (e.g., activated carbon). The analysis of thermally-
General Introduction
50
unstable compounds is critical because of the risk of degradation. Furthermore, the
adsorbents used in TD must be thermally stable to avoid artifact formation. The most
frequent adsorbents used in TD are Tenax®, Chromosorb®, and graphitized carbons
(e.g., Carbotraps® and Carboxens®). Activated charcoal and silica gel are not
appropriate for TD, since their high surface activity can lead to sample degradation at
elevated temperatures.
Kornacki et al. [131] observed that graphitized carbons (e.g., Carbopack X,
Carbograph 5TD and Carbotrap B), used to enrich samples of C3 and C4 alcohols
produced experimental artefacts, and, after TD, recoveries were low, with the
appearance of aldehydes and ketones in the chromatograms. In another study [132] the
same authors state that preliminary experiments should be performed to determine
recovery, for example, mimicking as exactly as possible the conditions that occur during
real sampling. It is absolutely essential to use air as a matrix for standards, because
degradation of analytes results from reactions involving oxygen chemisorbed on the
activated adsorbent surface. However, polymeric adsorbents (e.g., Tenax TA and
Chromosorb 106) do not exhibit such oxidative properties. The principal adsorbents
used in the TD clean-up step of VOCs have been reviewed [71, 108], and their principal
characteristics were explained in Table 1.1-5 (section 1.1.4.2.3).
When sampling with sorbent tubes, the adsorbent may be thermally desorbed directly
into the GC. However, this is not a rapid process and it would create a broad initial band
in the capillary GC column, drastically reducing resolution. Consequently, a two-stage
TD process with a focusing step is necessary. Analytes are desorbed and re-collected
on the same kind of cooled secondary sorbent trap. This, in turn, is rapidly heated to
inject the analytes into the column in a narrow plug. Oxygen and water are also purged
from the sorbent tube before desorption, using dry carrier gas at ambient temperature.
Figure 1.1-13 shows a double-step automated TD flow manifold.
Packed and capillary traps are most commonly used as cold traps. Capillary traps
have the same characteristics as columns [130], and they are usually constructed with
fused silica with 0.2–0.53 mm i.d. and 40 cm length. Their main advantage is that the
flow required to desorb analytes is fully compatible with GC capillary-column flows.
Packed traps usually need split valves to adapt both flows, but they can take a greater
load of analytes. These traps are usually quartz tubes that are filled with a sorbent or a
mixture of them, and their common dimensions are 10 cm length and 2–3 mm i.d.

Chapter 1
51
(A)
(B)
Figure 1.1-13 Flow diagrams of the Perkin-Elmer ATD 400 automated unit. Two-steps thermal desorption system: (A) Primary in-tube desorption, and (B) secondary cold-trap fast
desorption [133].

General Introduction
52
The low-flow cold trap, which is a Perkin-Elmer (Waltham, Massachusetts, USA)
modification of packed traps, allows suitable concentration and subsequent desorption
of the compounds at flows more compatible with capillary columns. This reduces the
split ratio, and also the amount of analytes vented, which leads to improved LODs.
Fernádez-Villarrenaga et al. [130] compared the desorption of VOCs from two kinds of
cold traps: standard packed and low flow. In the low-flow trap, they observed high
significance of the desorption flow of tube and trap. The use of the low-flow cold trap
enhanced sensitivity and improved LODs by more than 50%.
Short-path TD, patented by Scientific Instrument Services, Inc. (Ringoes, N.J.,
U.S.A.), is a TD system that sits directly on top of the GC injection port. Due to the short
path of sample flow, these systems eliminate transfer lines, which are easily
contaminated by samples, and optimize delivery of samples to the GC injector via the
shortest path possible. The liquid-N2-cooled cryofocussing trap is mounted in the GC
oven, just below the injection port and around a short (5 cm) section of the capillary
column. A small outboard power supply and controller unit is mounted alongside the GC
[111, 134].
Temperature-programmed desorption (TPD) has also been applied. In this case,
organic compounds trapped in a solid adsorbent are released into the analytical
instrument by means of a controlled temperature gradient slower than other trapping
techniques. This makes the solid sorbent act as an analytical separation column. The
sorbent can be any sort of solid adsorbent used to trap organic compounds from air
samples. Ketola et al. [135] used TPD with a mixture of Tenax TA and HayeSep D to
analyse 17 polar and non-polar compounds in the same run.
Although TD is routinely used in conjunction with GC (TD-GC), this technique has
been combined with SIFT-MS (see Section 1.1.4.5.5) to quantify volatile compounds
(specifically xylene and toluene) more quickly than TD-GC and with no need for
calibration standards. Due to the robustness of SIFT-MS analysis in the presence of
water vapour and other major components of air, it is not necessary to purge the tubes
to remove these constituents during the TD cycle, so reducing TD-cycle time.
ON-LINE GC-MS METHODOLOGIES 1.1.4.4
On-line chemical analysis is becoming more important due to growing knowledge of
the toxicity of VOCs and the increase of environmental legislation driven by the rising of
public awareness from Environmental Agencies about environmental dangers. On-line
analysis is useful to study variations in the levels of atmospheric pollutants, and for real-
time detection of occasional high levels. It provides rapid results that can be beneficial

Chapter 1
53
for speedy, appropriate response to a problem when one is detected. It is therefore an
assessed analytical technique in fixed and remote air-quality-control stations.
There is a critical need for instrumentation that can be used to carry out automated
and on-line or on-site analysis rapidly and provide accurate information on a continuous
basis. In general, spectroscopic techniques are ideal for on-line process monitoring
because of their short analysis times. Currently, Fourier-transform infrared spectrometry
(FTIR), X-ray fluorescence spectrometry (XRF), and MS are used for continuous, online
monitoring [135]. Band overlap requires a separation step, and, for this purpose, GC is
an excellent technique for on-site environmental monitoring. Portable GCs have also
been developed as a simpler and less expensive alternative to laboratory models [136].
Interference from moisture that commonly exists in air samples, the presence of
interferences in complex matrixes, and the low levels of VOCs in environmental air
require extraction, whereby analytes are first separated from the environmental matrix.
In a continuous, on-line application, separation also has to be carried out continuously.
53BOn-line sorbent trapping 1.1.4.4.1
There has been much effort to develop an on-line sorbent trap system that enabling
near-real-time measurements in ambient air and gaseous samples. On-line sorbent
extraction has the advantage of reducing errors resulting from reactions that degrade
the samples during storage.
Cryogenic trapping (cryotrapping) devices have been developed to the on-line
sorbent analyses. Qin et al. developed a Perkin-Elmer system coupled to a GC with an
adapted standard TD unit [137]. A double stream FID detector was used to analyse C2-
C5 VOCs and C6-C10 VOCs separately. Cryotrapping is not suitable for very humid
samples and the use of microtraps has been evaluated [138, 139]. More recently Peng
et al. developed a extraction device [140] which enabled the analysis of five C2-C4
hydrocarbons in the air in less than 40 min with a single cryogenic step into a sorbent
microtrap.
Breakthrough of volatile compounds and quantitative desorption of large molecules
are the major issues for microtraps, which are prone to low breakthrough volume as they
contain a small quantity of adsorbent. A larger diameter trap with more adsorbent
reduces breakthrough, but generates broad injection bands that reduce
chromatographic resolution [136, 139].
Some on-line BTEX analysers are commercially available. These are special
automatic portable GCs designed to measure selected organic compounds in situ. Air is
pumped through a cold trap filled with a sorbent to trap BTEX. The trap is then heated

General Introduction
54
and the VOCs are transferred by carrier gas to the GC with flame ionisation detector
(FID) or photoionization Detector (PID) for the analytical detection [87].
54BMembrane extraction with a sorbent interface (MESI) 1.1.4.4.2
This technique, developed by Segal et al. [141], combines a hollow-fibre membrane
module, with a cryofocusing and TD sorbent interface, and a capillary GC. The
membrane is in direct contact with the sample. Analytes of interest diffuse across the
membrane and are collected in the cryogenic trap. A heat pulse desorbs analytes to the
GC column using a narrow concentration pulse.
This technique, using a sorbent microtrap of Tenax and Carboxen, was later
combined with a portable micro-GC system [142] for on-site monitoring. A PDMS non-
porous membrane was selected, providing rapid transport of analytes due to the high
rate of diffusion, and preventing water and other polar matrices from entering the
system. The sorbent trap replaced the GC injector, and the design of the trap was
modified to enhance extraction of analytes.
The system allowed semi-continuous monitoring of samples, and increased the
sensitivity of the micro-GC system by a factor of more than 100 by adding the MESI
system. In order to eliminate the inconvenience of concentrating water on the sorbent
trap, a water trap was placed in the system between the membrane module and the
sorbent interface. This system was also used to monitor acetone, benzene, toluene and
ethylbenzene in laboratory air [142].
ON-LINE NON-CHROMATOGRAPHIC METHODS 1.1.4.5
Even though very valuable and, in many cases, indispensable for environmental
monitoring, GC-MS methodologies present some limitations. GC-MS are not designed
to examine the temporal changes of VOCs in fast processes (i.e. for time resolutions of
a few seconds to sub-second time scales). Even when using high-speed gas
chromatography [143], the time resolution of GC-based methods is at best in the minute
range, and sampling and pre-treatment steps (as stated along the introduction) very
often introduce time averages of the concentration of the measured mixture. Because of
these limitations, other methods have been developed over the years to complement
GC-based methods with simplified, high sensitivity, fast and direct on-line monitoring of
VOCs, with a high (even sub-second) time resolution. These methodologies encompass
a diverse group of techniques based on Direct Injection Mass Spectrometry (DIMS)
without conventional gas chromatography.

Chapter 1
55
DIMS based methodologies (sometimes referred as direct air-sampling mass
spectrometry, DS-MS) have been greatly developed in the last years. While they all
share the fact that sample gas is directly introduced into the device, they vary
significantly in terms of sampling, inlet and ionization/detection principles. Some features
of these techniques were recently described and compared [72, 144, 145]. Even though
these are recently developed methodologies, they provide advantages in several fields
and open a plethora of new possibilities in VOCs characterization. Some fields of
application are:
Monitoring VOCs in exhaled human breath as a non-invasive technique in the
diagnosis of pathologies.
Homeland security. DIMS can be used to detect traces of explosives and
chemical-warfare agents.
In-situ control of industrial processes, quality improvement, and monitoring of
harmful emission.
Agro-industry and food science and technology. Rapid measurements on food
quality.
Possibility of rapid onsite monitoring of VOCs, at concentrations that can
negatively affect air quality or even induce health risks.
Also the need of portable, rapid and high-sensitivity techniques to assess indoor
exposure to VOCs is becoming increasingly urgent as new materials and
electronic devices are introduced into our life.
An overview of the most important DIMS based methodologies is described in this
section. There are included the most relevant methodologies, including: (1) membrane
introduction mass spectrometry, (2) differential optical absorption spectrometry, (3) low
pressure and ambient pressure chemical ionisation tandem mass spectrometry
analysers, (4) and two different ion-flow drift-tube techniques, proton transfer reaction
and selected ion flow tube mass spectrometry.
55BMembrane introduction mass spectrometry (MIMS) 1.1.4.5.1
In membrane-introduction mass spectrometry (MIMS), one side of a thin membrane,
typically polydimethylsiloxane (PDMS), is directly exposed to the vacuum of the ion
source of the MS. Exposing the other side of the membrane to the sample enable
organic compounds to permeate the membrane wall. This is followed by diffusion in the
gas phase to the ion source. Since the flow of the analyte matrix through the membrane
is proportionally smaller than the flow of the desired organic analytes, analyte
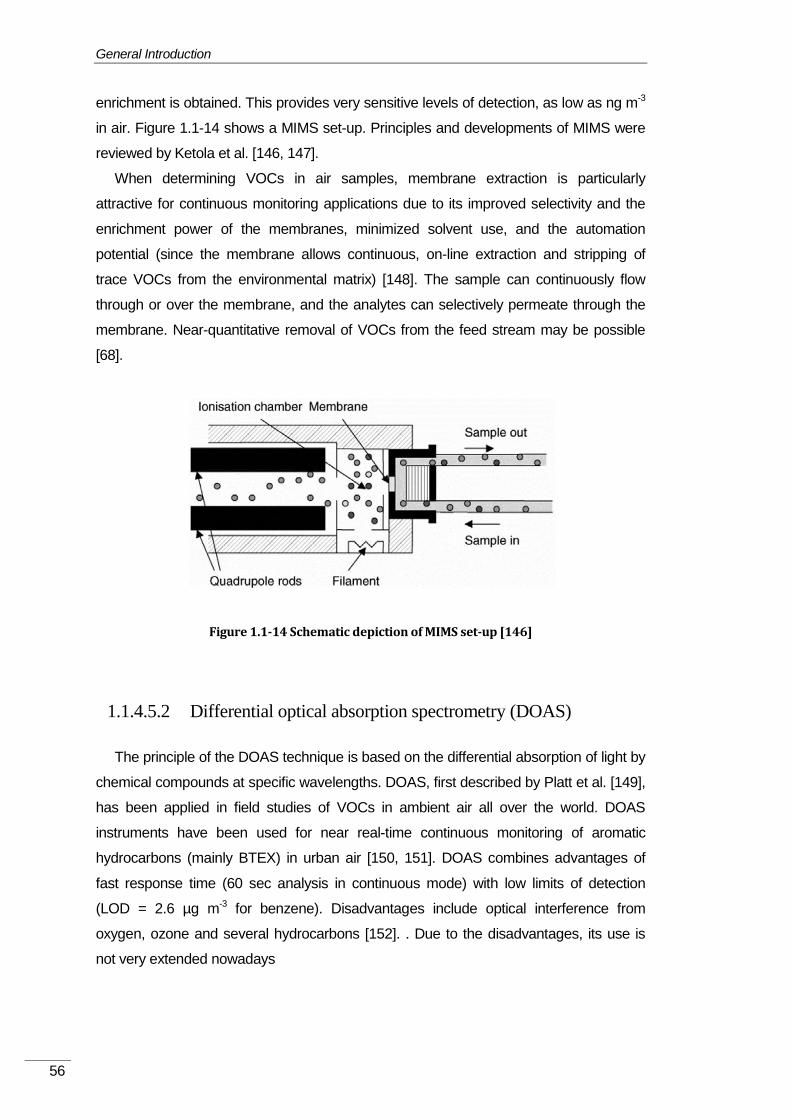
General Introduction
56
enrichment is obtained. This provides very sensitive levels of detection, as low as ng m-3
in air. Figure 1.1-14 shows a MIMS set-up. Principles and developments of MIMS were
reviewed by Ketola et al. [146, 147].
When determining VOCs in air samples, membrane extraction is particularly
attractive for continuous monitoring applications due to its improved selectivity and the
enrichment power of the membranes, minimized solvent use, and the automation
potential (since the membrane allows continuous, on-line extraction and stripping of
trace VOCs from the environmental matrix) [148]. The sample can continuously flow
through or over the membrane, and the analytes can selectively permeate through the
membrane. Near-quantitative removal of VOCs from the feed stream may be possible
[68].
Figure 1.1-14 Schematic depiction of MIMS set-up [146]
56BDifferential optical absorption spectrometry (DOAS) 1.1.4.5.2
The principle of the DOAS technique is based on the differential absorption of light by
chemical compounds at specific wavelengths. DOAS, first described by Platt et al. [149],
has been applied in field studies of VOCs in ambient air all over the world. DOAS
instruments have been used for near real-time continuous monitoring of aromatic
hydrocarbons (mainly BTEX) in urban air [150, 151]. DOAS combines advantages of
fast response time (60 sec analysis in continuous mode) with low limits of detection
(LOD = 2.6 µg m-3 for benzene). Disadvantages include optical interference from
oxygen, ozone and several hydrocarbons [152]. . Due to the disadvantages, its use is
not very extended nowadays

Chapter 1
57
57BLow-pressure and atmospheric-pressure chemical ionization 1.1.4.5.3
tandem mass spectrometry analysers (LPCI-MS2 and APCI-MS
2)
These systems have been used to determine VOCs in atmospheric air operating on
the principles of tandem mass spectrometry (MS/MS or MS2). The sample is introduced
into the mass spectrometer, where it ionizes at low pressure (in the LPCI-MS2) [153] or
atmospheric pressure (in APCI-MS2) [154]. Ionization of analytes takes place as a result
of a flow of protons between the analyte molecules and the N2+, O2
+, NO+, (H2O)n+, and
H+ ions generated during corona discharge inside the spectrometer. The high value of
the proton-activity coefficient (PA) means hydronium chlatrates (these subsequently
dissociate into H3O+ ions) are mainly responsible for the ionization of analytes:
(H2O)
nH
+
+ VOC → VOCH+
(H2O)
m+(n−m) H
2O (14)
The frequency of collisions between H3O+ ions and analyte molecules increases with
the pressure; a greater ionization efficiency is thus characteristic of APCI-MS2 [153]. The
ions produced are then separated by the MS analyser on the basis of their mass-to-
charge ratio. If ionization takes place at atmospheric pressure (APCI-MS2), data can
also be gathered with the aid of a cold ion trap (CIT).
APCI-MS2 analysers are routinely used to determine VOCs in atmospheric air. But, in
the presence of water vapour, which prevents collisions between hydronium ions and
analyte molecules during solvation (thus retarding ionization) APCI-MS2 systems are not
recommended to determine BTEX compounds in atmospheric air; gas analysers based
on atmospheric pressure photoionization (APPI), instead of chemical ionization, are
further sensitive for this particular purpose [145, 154].
58BProton transfer reaction – mass spectrometry (PTR-MS) 1.1.4.5.4
This technique, with the next SIFT-MS, belongs to the selected ion-flow drift-tube
(SIFDT) techniques, which measures ion-molecule reactions. In these techniques a kind
of ion source produces reactant ions (A+) that, in contact with the neutral reactant
species (R) in the sample, generate reaction products (with their energetic, E, and
thermodynamic, T, parameters) by a constant coefficient rate (k):
A+
+R →k
Products (E ,T ) (15)
The idea then arose to choose a reaction with a known k value, and to calculate the
concentration of a VOC from the intensities of the measured final products and the
parent ion. The original review of Lindinger [155] presents a clear description of PTR-MS

General Introduction
58
fundamentals and potential. More recent reviews are those of Blake et al. [156] and de
Gouw and Warneke [157] for atmospheric applications.
The modus operandi of PTR-MS is the chemical ionization, by proton transfer, of a
gas sample inside a drift tube. The proton source is normally H3O+. The fixed length of
the drift tube provides a fixed reaction time for the ions as they pass along the tube: the
ion residence (i.e. reaction time) time can be measured or it can be calculated from ion
transport properties. If the proton donor concentration is largely unchanged by the
addition of an analyte sample, the measurement of the ion signal ratio (proton donor)/
(protonated acceptor) allows the absolute concentration of the acceptor molecules to be
calculated from a simple kinetic analysis. Consequently, by combining reaction kinetics
with mass spectrometry, it is possible to both identify and quantify individual organic
gases on a relatively short time scale and with a sensitivity that can reach well into the
ng m-3 mixing regime.
The main constituents of a PTR-MS apparatus are the ion source, a reaction region
and a mass analyser [155]. In most apparatus, the H3O+ primary-ion beam is produced
by a hollow-cathode ion source. It presents some advantages because of the high
intensity and relatively high purity of the primary H3O+ ion that allows the injection of the
primary-ion beam directly into the reaction chamber without prior mass selection. The
reason for this is that most of the ions produced in the plasma source react in cascades
of reactions finally to produce H3O+, with the noteworthy exception of some residual O2
+
[155] . This simplifies system realization and allows for better sensitivity. Alternative
designs of the source have been tested to reduce impurities and back streaming from
the reaction chamber at the cost of sensitivity [144]. More recently, other ions have been
studied and, recently, a marketed commercial system allows for rapid switching between
different ions: H3O+, NO+ and O2
+ [158].
59BSelected-Ion-flow-tube mass spectrometry (SIFT-MS) 1.1.4.5.5
Mainly developed by Španěl and Smith, they reviewed the fundamentals and several
applications in 2005 [159]. Further applications and recent developments (e.g., compact
SIFT-MS apparatus) have been reviewed [160]. This technique, like PTR-MS, belongs
to the selected ion-flow drift-tube (SIFDT) group.
In SIFT-MS, the parent ions are generated by microwave plasma or by an electron-
impact ion source, and the primary ions are selected by a quadrupole mass filter. This
allows the selection, in principle, among many positive and negative parent ions and the
production of a pure parent-ion beam. However, in DIMS monitoring of VOCs, it is
convenient to select parent ions in such a way that they do not react with standard air
Chapter 1
59
constituents. This factor limits practical applications to the same ions than PTR-MS:
H3O+, NO+ and O2
+, however being possible, in particular cases, the use of other ions
(e.g., OH+) [161].

General Introduction
60
1.1.5 14BENVIRONMENTAL LEGISLATION IN FORCE ON
ATMOSPHERIC POLLUTANTS
This section describes the principal environmental laws and regulations in the local
framework studied in this Thesis. The importance arises in policies and measures in
force that have affected the changes, i.e. improvements, in the air quality and impact
situation during the period in the context of this research.
It is necessary to know beforehand the hierarchical order of competences over the
decision of implementing new environmental laws. Mallorca local regulations are based
on Spanish national regulations, which in turns are based on the EU directives decided
by the European Councils. Therefore EU commissions enact the guiding legal
framework for all 27 EU-Countries.
Even though many other Countries (e.g. USA, Canada or Japan) have developed
and implemented environmental protective laws for the regulation of the emissions of
VOCs in their territories, this introductory section focuses on the legal framework in
which this research: the European and the Spanish National regulations.
31BEU FRAMEWORK 1.1.5.1
The EU has developed a series of six Environment Action Programmes (EAPs)
[162], starting in 1973. The 5th EAP (1993–2000) and 6th EAP (2002–2012) are the ones
most relevant for the period addressed here, while the 6th EAP also looks ahead towards
2020. The 5th EAP, under the theme of 'air pollution' concentrated on acidification and air
quality, with particular attention given to:
A strategy to ensure that critical loads of acidifying, eutrophying and
photochemical air pollutants are not exceeded;
Establishing or amending air quality objectives for a few specific
pollutants;
Developing common procedures for assessing and monitoring of air
quality.
The 6th EAP, under the theme 'environment and health and quality of life', in particular
its Article 7 on air quality, states that: 'development and implementation of the measures
in Article 5 in the transport, industry and energy sectors should be compatible with and
contribute to improvement of quality of air'. Further measures envisaged are:

Chapter 1
61
Improving monitoring and assessment of air quality, including the
deposition of pollutants, and the providing information to the public,
including the development and use of indicators;
A thematic strategy to strengthen a coherent and integrated policy on air
pollution to cover priorities for further actions, the review and updating
where appropriate of air quality standards and national emission ceilings
with a view to reaching the long-term objective of no-exceedence of
critical loads and levels, and the development of better systems for
gathering information, modelling and forecasting;
Adopting appropriate measures concerning ground-level ozone and
particulates;
Considering indoor air quality and the impacts on health, with
recommendations for future measures where appropriate.
Thus, the 5th EAP and 6th EAP set the scene for developing specific policies and
directives to control air pollution and improve air quality in the last two decades.
During the 1990s, the EU developed and adopted a series of directives on air quality
management and assessment, setting e.g. some air quality limits and target values, and
methods to monitor and assess air quality. These directives have paved the way for the
exchange of data on air quality and station networks that has enabled the overview of
European air quality presented in this introductory chapter.
The setting of health-related air quality limit and target values specified in the air
quality directives benefited from the work and studies carried out under the Clean Air for
Europe (CAFE) Programme , in cooperation with the World Health Organization (WHO),
on the health effects of air pollutants.
The 6th EAP specified that the Commission should develop thematic strategies on a
series of themes, including air pollution. The Thematic Strategy on Air Pollution was
formulated as the final result of the CAFE Programme. It considers the complex
interaction between pollutants, impacts and pollutant receptors (both humans and
nature)
It deals with particulate matter in air, acidification, eutrophication and ground-level
ozone, and impacts on human health, nature and biodiversity, materials and crops. The
Strategy sets goals for reduced impacts on human health and the natural environment in
2020. AS it can be extracted from the 6th EAP, VOCs are not yet considered priority
pollutants in the same way as PM, O3, NOx or SOx, even though it is estimated that
every year millions of tons are emitted to the European atmospheric environment. Since
the 6th EAP draws the environmental protection path until 2020, it is loomed an
General Introduction
62
inefficient decrease over the European VOC emissions.
Hereby a summary of regulations is briefly described. The complete set of regulations
is available in the EU Council website.
60BRegulations of emissions from the road traffic sector 1.1.5.1.1
The Euro standards have regulated emissions from motor vehicles since about 1970,
through the so-called ECE R15/01-15/04 regulations for gasoline powered passenger
cars. Since roughly 1990 the work was continued under the EU umbrella, using the so-
called Euro 1–4 regulations for light-duty vehicles (gasoline and diesel powered) and the
similar Euro I–IV regulations for heavy-duty diesel engines in trucks and buses, during
the period 1992–2005. The further Euro 5/V and Euro 6/VI regulations took effect in
2009.
61BPetrol vapour recovery directives 1.1.5.1.2
The Stage I Petrol Vapour Recovery Directive (1994/63/EC) aims to prevent
emissions to the atmosphere of volatile organic compounds (VOC) during the storage of
petrol at terminals and subsequent distribution to service stations. It entered into force
on 20 December 1994. The Directive contains measures that terminals should employ
such as floating roofs and reflective coatings to reduce evaporative losses from storage
tanks. In addition when petrol is loaded onto tankers and transported to service stations
the Directive ensures that any vapours are recovered and returned to the tanker or
terminal. Directive has influenced VOC emissions since about 2000.
The Stage II Petrol Vapour Recovery Directive (2009/126/EC) aims to ensure the
recovery of petrol vapour that would otherwise be emitted to the air during the refuelling
of vehicles at service stations. The minimum level of recovery of the systems employed
should be 85 %. New service stations should comply with the directive from 2012. All
stations with a throughput greater than 3 000 m3/year must comply by end-2018 at the
latest. The Directive has not yet had any measured effect on VOC emissions in Europe.
62BDirectives on fuel quality 1.1.5.1.3
The Sulphur Contents of Liquid Fuels Directive, 1999/32/EC regulates the
sulphur limits in fuel oils, establishing the limits for sulphur in 1% by weight for heavy fuel
and 0.10% by weight in gas oil.
The Fuels Quality Directive (2003/17/EC) amends the previous fuels directive
(98/70/EC). It regulates the contents of sulphur, lead and benzene in motor fuels, as well

Chapter 1
63
as other fuel quality parameters. The limit set in this Directive for benzene and PAHs
are:
For benzene in petrol, 1 % v/v;
For PAH in diesel fuel, 11 % m/m.
The direct consequence by improving the quality of fuels is the reduction of VOC
emissions derived from the traffic and transport uses, estimated over 16% of total VOC
emissions in Europe (Figure 1.1-1, page 17).
63BRegulation of industrial emissions 1.1.5.1.4
Directive 2010/75/EU aims to recast the seven existing directives related to industrial
emissions into a single clear and coherent legislative instrument. This includes the IPPC
Directive, the LCP Directive, the Waste Incineration Directive, the Solvents Emissions
Directive and three directives on titanium dioxide. The Commission proposed that
minimum emission limit values in certain industrial sectors should be tightened
(particularly for large combustion plants where progress to reduce pollution is
considered insufficient).
The above legal instruments are briefly described below in chronological order:
The Solvents Directive (1999/13/EC) regulates the use of solvents and sets limits
on emissions of VOC due to the use of organic solvents in certain activities and
installations. The expressed objective of the Directive is to limit the formation of ozone in
air. The list of activities and uses of solvents regulated by the Directive includes
adhesive coating and other coating activities, dry cleaning, manufacturing of varnishes,
adhesives, inks, pharmaceuticals, printing, surface cleaning, vehicle refinishing, wood
impregnation and other. The Directive estimates emission limit values for waste gases
or per volume of product, and requires a solvent management scheme for each activity.
The Waste Incineration Directive (2000/76/EC) repealed former directives on the
incineration of hazardous waste (Directive 94/67/EC) and household waste (Directives
89/369/EEC and 89/429/EEC) and replaced them with a single text. The aim of the
Waste Incineration Directive is to prevent or reduce as far as possible negative effects
on the environment caused by the incineration and co-incineration of waste. In
particular, it should reduce pollution caused by emissions into the air, soil, surface water
and groundwater, and thus lessen the risks that these pose to human health. This is to
be achieved through the application of operational conditions, technical requirements,
and emission limit values for incineration and co-incineration plants within the EU.
The Waste Incineration Directive sets emission limit values and monitoring

General Introduction
64
requirements for pollutants to air such as dust, nitrogen oxides (NOX), sulphur dioxide
(SO2), hydrogen chloride (HCl), hydrogen fluoride (HF), heavy metals, dioxins and
furans and some heavy methals, but not specifically for VOCs.
Most types of waste incineration plants fall within the scope of the Waste Incineration
Directive, with some exceptions, such as those treating only biomass (e.g. vegetable
waste from agriculture and forestry).
The Waste Incineration Directive makes a distinction between:
Incineration plants, which are dedicated to the thermal treatment of waste
and may or may not recover heat generated by combustion;
Co-incineration plants, such as cement or lime kilns, steel plants or power
plants whose main purpose is energy generation or the production of
material products and in which waste is used as a fuel or is thermally
treated for the purpose of disposal.
The Large Combustion Plants (LCP) Directive (2001/80/EC) regulates emissions
of acidifying pollutants, particulate matter and ozone precursors from large combustion
plants for heat end energy production. The Directive sets emission limit values (ELVs)
for sulphur dioxide (SO2), nitrogen oxides (NOX) and dust (Total Suspended Particles,
TSP), which vary according to the age of the plant, the fuel used and the plant capacity
(see EEA Technical Report No 8/2010).
The Paints Directive (2004/42/CE) establishes limit values for the maximum VOC
contents of decorative paints and vehicle-refinishing products, to limit the emissions of
volatile organic compounds, amending also the Solvents Directive concerning vehicle-
refinishing products. It has two phases for the implementation of stricter limits on VOC
contents in products, Phase I to be implemented by 1 January 2007 and Phase II by 1
January 2010.
The original Integrated Pollution Prevention and Control (IPPC) Directive was
adopted on 24 September 1996, and has since been adapted four times, until the
present version, adopted on 21 December 2007 (2008/1/EC). It regulates basically all
industrial plants, including energy production, metals production, mineral industries,
chemical industries, waste management and other sectors. The air pollutants addressed
are SO2, NOx, CO, VOC, metals, dust, asbestos, chlorine, fluoride, arsenic, cyanides
and other carcinogenic and mutagenic compounds and some specific dioxins.
In the Directive, the concept of 'best available techniques' or BAT plays a central role.
In this context:
'techniques' include both the technology used and the way in which the
installation is designed, built, maintained, operated and decommissioned;

Chapter 1
65
'available' techniques are those developed on a scale that allows
application in the relevant industrial sector, under economically and
technically viable conditions, taking into consideration the costs and
advantages, whether or not the techniques are used or produced inside
the Member State in question, and as long as they are reasonably
accessible to the operator;
'Best' means most effective in achieving a high general level of protection
of the environment as a whole.
Authorities are also obliged to set up a system of issuing integrated permits that will
lead to the implementation of BAT in new and existing plants.
64BDirective on national total emissions 1.1.5.1.5
The National Emissions Ceiling Directive (NEC Directive), adopted on 23 October
2001, sets upper limits for each Member State for the total emissions in 2010 of the four
main pollutants responsible for acidification, eutrophication and ground-level ozone
pollution (sulphur dioxide, nitrogen oxides, volatile organic compounds and ammonia). It
leaves it largely to the Member States to decide which measures — on top of
Community legislation for specific source categories — to take in order to comply.
65BLong-range Transboundary Air Pollution (LRTAP) 1.1.5.1.6
Convention
The long-range transport of air pollution is an important factor affecting ecosystems
and the human population. The United Nations Economic Commission for Europe
(UNECE) Convention on Long-range Transboundary Air Pollution (LRTAP) [17] aims to
reduce and prevent air pollution. In addition to the EU legislation listed above the LRTAP
Convention has a number of legally binding protocols, covering specific categories of air
pollutants.
The Task Force on Emission Inventories (TFEI) was initiated in 1991 following
agreement by the Executive Body for the Convention on Long-Range Transboundary
Air Pollution. The TFEI Secretariat is currently provided by the United Kingdom and is
supported by the other signatories to the Convention including the European
Community, through the European Commission and the European Environment Agency
(EEA).
The TFEI is designed to assist in:
General Introduction
66
The evaluation of the emission inventory requirements of the Co-
operative Programme for Monitoring and Evaluation of Air Pollutants in
Europe (EMEP);
Ensuring an adequate flow of reliable information to support the work
under the Convention;
Accounting for the emission data needs of other relevant bodies under
the Executive Body.
The objectives of the TFEI are therefore:
To provide a technical forum to discuss, exchange information and
harmonise emission inventories including emission factors,
methodologies and guidelines;
Conduct in-depth evaluation of emission factors and methodologies in
current operation and
co-operate with other international organizations working on emission
inventories with the aim of harmonising methodologies and avoiding
duplication of work.
The TFEI meets these objectives through the holding of an annual meeting, the
publication of a guidebook and through the operation of a number of expert panels. The
first annual meeting of the TFEI was held in London in May 1992. In 1993 the TFEI
agreed a specification for the EMEP/EEA Emission Inventory Guidebook (the
‘Guidebook’). The first edition of the Guidebook was subsequently completed in 1996
and published and distributed by the EEA. The latest version was published in 2009
[25].
66BSpanish Framework 1.1.5.1.7
Spanish Environmental Ministry adopted in 2007 the Law 34/2007 “about Air Quality
and Atmosphere protection”. It amended existing regulations regarding air pollution
recasting them into a single and clear one.
Regretfully, and even though there have been reported clear evidences on human
and environmental hazardous effects, the Spanish government only meets the minimum
requirements set by the EU, and has not developed more restrictive laws regarding
VOCs. Only two directives set a limit value over two specific industrial processes:
Stage I Petrol Vapour Recovery Directive 94/63/EC, which amended the
Spanish Real Decreto 2102/1996.

Chapter 1
67
Solvents Directive 1999/13/EC, adapted in Spain as Real Decreto
117/2003.
32BCONSIDERATIONS ABOUT ENVIRONMENTAL 1.1.5.2
MONITORING REGULATIONS OF VOCs
VOCs emissions in Spain are reported every year (among other regulated air
pollutants) in the Spanish Inventory of Emissions [26] obeying to National Emission
Ceiling (NEC) Directives. The Guidance Document for the implementation of the
European Pollutant Release and Transfer Register (E-PRTR) is the backbone guideline
to implement the UNECE PRTR Protocol at the EU level [163]. In this guidance
document there are described the standard methodologies to measure, calculate or
estimate NMVOCs emissions. The European standard method EN 13649:2001 to
measure VOCs concentrations in air [164] is based on the use of activated carbon with
further solvent desorption and gas chromatography. Notwithstanding, European
Committee for Standardisation (CEN) nowadays also suggests other international
standard methods: EN ISO 16000:2006- parts 5, 9, 10 and 11; and EN ISO 16017:2003
parts 1 and 2.
As it was previously mentioned in section 1.1.2.1, Spanish NMVOCs emissions (and
many others in Europe) are estimated on the basis of arbitrary selected values, specified
in the TFEI emission inventory guidebook [25]. By this procedure, it is assumed a bias
between estimated and real emissions. Even though there are several suitable
techniques which enable reliable, fast and robust techniques for VOCs determination in
air (as we have shown in this chapter), legal regulations do not force to characterize real
emissions in the air, and simple estimation of VOCs are valid, thus adopted as common
procedure.
Extra efforts have to be done in this field in order to effectively reduce emissions of
VOCs to the environment. As it has been mentioned, an average of 1 ton Km -2 is
estimated to be emitted in Spain every year. This issue is not tolerable if the society
wants to ever reach a safe environment. Moreover, as long as emission focuses of
VOCs are not homogenously spread over the territory but localized in specific areas
(industries, landfills, big cities, etc.), these zones are expected to be continuously under
severe pollution levels. Updated environmental occurrence data is needed to
understand emission patterns and act in consequence to efficiently reduce emissions.

General Introduction
68
6BDETERMINATION OF PHARMACEUTICAL 1.2
RESIDUES IN WATER
Chapter 1
69
In the last years, a wide number of organic pollutants known as emerging
contaminants (ECs) are receiving increasing concern in the scientific community. ECs
encompass a broad category of chemicals currently not included in routine monitoring
programmes (EU framework) but which could pose a significant risk requiring regulation,
depending on their potential (eco)toxicological and health effects and on their levels in
the (aquatic) environment. This definition would mean that the substances:
Could have been around for a long time, or been invented quite recently;
Could be any type of chemical, not necessarily in the categories we might
tend to think of (pharmaceuticals, personal care products, nano-
compounds);
(If they pose a risk) must have slipped through the regulatory net, or not
been subject to a regulatory check when first produced or used, perhaps
because they occur naturally.
Essentially, they share the characteristic that we are only just becoming aware that
they might pose a risk. In that respect, environmental agencies sometimes suggest that
it would be more correct to name them as "contaminants of emerging concern", but
"emerging contaminants" is a convenient short form. Nevertheless, as a general
assumption, every chemical substance poses a significant effect either in humans or in
the environment. However, not all of them will produce noticeable impacts in short-term.
Richardson and Ternes review [165] has included the most well‐studied emerging
organic contaminant groups including, among others, artificial sweeteners,
nanomaterials, perfluorinated compounds (PFCs), pharmaceuticals and personal care
products (PPCPs), steroid hormones, drinking water disinfection byproducts (DBPs),
sunscreens/UV filters, brominated flame retardants (including polybrominated diphenyl
ethers), benzotriazoles, naphthenic acids, antimony, siloxanes, musk, algal toxins,
perchlorate, ionic liquids, dioxane and pesticide transformation products.
The widespread production and use of organic ECs without corresponding
occurrence evaluations and monitoring had an increasing contribution to environmental
pollution in the last decades. As stated in the beginning of this introduction, 100.000
chemicals are registered in the USA and Europe [3], therefore we can assume that the
major part of them are polluting the environment out any kind of control. Since
pharmaceuticals are the primary focus of this Thesis with the already stated VOCs, they
are discussed in this chapter in more detail. Hundreds of publications are available
regarding the rest of emerging contaminants. Some of them may be found in
Richardson and Ternes review [165], since it summarizes the most relevant reviews in
ECs analysis in water since 2009.

General Introduction
70
Human exposure is generally of key concern for these contaminants precisely
because of their widespread applications. Some of these ECs are also reported to be
endocrine disrupting compounds (EDCs) [166]. According to the US-EPA definition,
EDCs are exogenous agents that interfere with the production, release, transport,
metabolism, binding, action, or elimination of the body natural hormones, which are
responsible for the maintenance of homeostasis and the regulation of developmental
processes. EDCs can include manmade chemicals such as pesticides and plasticizers,
natural chemicals found in plants (phytoestrogens), pharmaceuticals, and hormones that
are excreted in animal or human waste [167]. EDCs are not defined by their chemical
nature, but rather by their biological effects.
In September 2009 the US-EPA published its final list (Contaminant Candidate List 3
– CCL3) of unregulated emerging organic contaminants with potential to present health
risks via drinking water exposure. The final CCL 3 includes 104 chemicals or chemical
groups and 12 microbiological contaminants [168]. Contaminant Candidate List 4
(CCL4) is under current development requesting any newly available information that
was not considered in the development of the CCL3. Much work is still needed to
understand real risks about the compounds listed amongst the 100.000 registered
chemicals.

Chapter 1
71
1.2.1 PHARMACEUTICALS AND PERSONAL CARE
PRODUCTS (PPCPs)
PPCPs are a broad group of thousands of chemicals belonging to a wide spectrum of
chemical classes, and this larger group is often sub‐divided into two more inclusive
groups, pharmaceutically active compounds (PhACs) and personal care products
(PCPs). Pharmaceuticals group (PhACs) include all of the prescription and over‐the‐
counter pharmaceuticals consumed for purposes of human and veterinary health care
as well as all other drugs, whether therapeutic or recreational. Personal care products
(PCPs) include many of the chemicals found in beauty and personal hygiene products
such as cosmetics, fragrances, etc. It is estimated that approximately 3.000 different
substances are used as pharmaceutical ingredients, including among others painkillers,
antibiotics, antidiabetics, contraceptives, antidepressants, etc. However, only a very
small subset of these compounds has been investigated in environmental studies so far.
Table 1.2-1 shows several groups of pharmaceuticals already detected in the
environment and some examples of each group.
Besides pharmaceuticals, the other important group of contaminants included in the
list of emerging organic contaminants is the group of ingredients widely known as
personal care products (PCPs). In recent years there has been growing interest in the
determination of this group. Several personal care product ingredients have been
among the most commonly detected compounds in environmental samples. It is
continuously increasing the concern about environmental fate and the potential effects
of synthetic organic chemicals used in soaps, lotions, toothpaste and other personal
care products. Of particular concern are compounds that are environmental persistent,
bioaccumulate, or have a designed bioactivity. There are different groups of PCPs such
as synthetic musk fragrances, antimicrobials, sunscreen agents, insect repellents and
preservatives, among others.
PCPs are not studied in the experimental part of this Doctoral Thesis; however they
are included in some discussion sections as well as other organic emerging
contaminants, assuming that they may have similar environmental behaviour than the
pharmaceuticals studied in this Thesis, following similar or equivalent pollution
pathways.
Since this Doctoral Thesis is focused on environmental evaluations (occurrence, fate
and pollution pathways), additional information -e.g. therapeutic use, individual
physicochemical properties and structure, mechanisms of reaction, etc. – are only
displayed if needed along this introductory section

General Introduction
72
Table 1.2-1Examples of pharmaceuticals studied in environmental samples
Group Examples
Quinolones (Antibiotic) Ciprofloxacin
Ofloxacin
Norfloxacin
Macrolides (Antibiotic) Clarithromycin
Erythromicin
Tylosin
Tetracyclines (Antibiotics) Tetracycline
Oxitetracycline
4-epitetracycline
Sulfonamides (Antibiotics) Sulfadiazine
Sulfamethoxazole
Sulfathiazole
Diuretics Furosemide
Hydrochlorthiazide
β-Blockers Atenolol
Enalapril
Metoprolol
Proton pump inhibitors Omeprazole
ranitidine
Psychoactive Carbamazepine
Diazepam
Oxazepam
Nonsteroidal anti-inflammatory Ibuprofen
Diclofenac
Naproxen
Bronchodilators Salbutamol
Terbutalin
Lipid regulators Bezafibrate
Gemfibrozil
Antitumorals Cyclophosphamide
Methotrexate
Phosphodiesterase type V inhibitors Sildenafil
Vardenafil
Tadalafil
Contrast products Iopromide
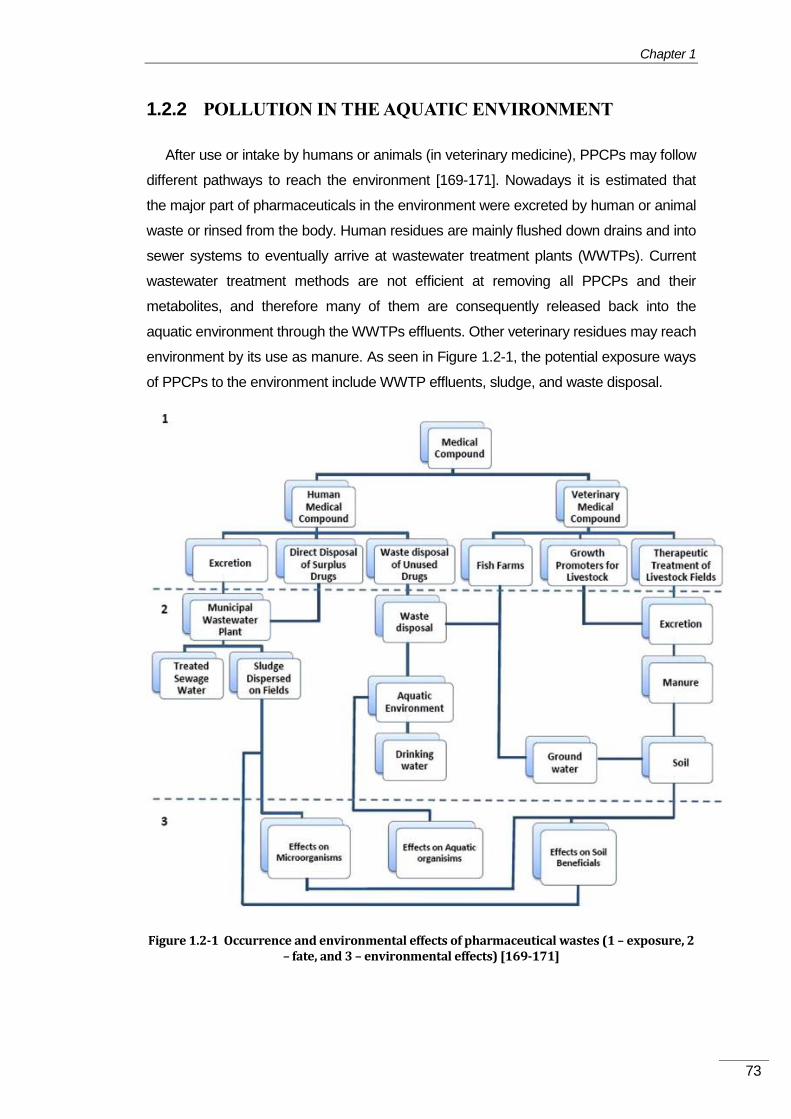
Chapter 1
73
1.2.2 16BPOLLUTION IN THE AQUATIC ENVIRONMENT
After use or intake by humans or animals (in veterinary medicine), PPCPs may follow
different pathways to reach the environment [169-171]. Nowadays it is estimated that
the major part of pharmaceuticals in the environment were excreted by human or animal
waste or rinsed from the body. Human residues are mainly flushed down drains and into
sewer systems to eventually arrive at wastewater treatment plants (WWTPs). Current
wastewater treatment methods are not efficient at removing all PPCPs and their
metabolites, and therefore many of them are consequently released back into the
aquatic environment through the WWTPs effluents. Other veterinary residues may reach
environment by its use as manure. As seen in Figure 1.2-1, the potential exposure ways
of PPCPs to the environment include WWTP effluents, sludge, and waste disposal.
Figure 1.2-1 Occurrence and environmental effects of pharmaceutical wastes (1 – exposure, 2 – fate, and 3 – environmental effects) [169-171]

General Introduction
74
Studies regarding the fate of PPCPs in sewage (both sewage water and sludge)
have been conducted in numerous countries worldwide, including EU countries, USA,
Canada, Asian countries, etc. Although the exact fate and effect of medical substances
in the water environment is not easy to predict, anticipated exposure routes are as
schematized in Figure 1.2-1.
33BEMISSION SOURCES OF PHARMACEUTICALS INTO 1.2.2.1
THE AQUATIC ENVIRONMENT
PhACs are continually released into the environment in large quantities from a wide
number of small sources, including human and animal excretion in urine and faeces,
manufacturing residues, hospital and landfill disposal and subsequent leaching or
disposal of unused pharmaceuticals. In addition, occurrence of pharmaceuticals in a
specific environment may depend on many factors, e.g. production rate, human or
animal intake dose, frequency of use, metabolic pathways or the efficiency of disposal
processes [172, 173].
As stated above, wastewater treatment has become nowadays one of the most
critical environmental issues regarding water. In Europe it has been experienced a very
significant increase in the number of WWTPs to meet the quality standards stipulated in
the European Council Directives (Directives 91/271/EEC and 98/15/EEC).
In general, re‐use of wastewater and sludge is encouraged, since it represents a
long‐term solution to fulfil increasing water demands and reduce environmental impact
of wastewaters, as long as the quality of the final re-used qualities do not represent any
threat to health or environmental protection requirements. Current EU legislation
regulates the agricultural use of sewage sludge based only on the concentration of toxic
heavy metals and nutrients. However, following measures from the European
Commission beginning in 1999 [174], although emerging organic contaminants were not
included ‐ the third draft of a future Sludge Directive contained a proposal to limit values
of several organic contaminants [175], such as dioxins, PAHs or PCBs. Specific
regulations concerning PPCPs in environmental waters are still in process of
implementation in the EU.
Studies of contaminant toxicity in public water systems, which may lead to adverse
health effects, are needed to guide actions taken by regulatory authorities. Although
many regulations are already in place to protect the public, there is a need to constantly
update these, based upon the existence of new knowledge. Similarly, water treatment
practices are designed to protect human health, but their performance also needs to be
Chapter 1
75
continually re-evaluated and optimized, based upon new research results. The levels of
these compounds found in effluents show that they may be only partially removed
during conventional treatment, before WWTP‐treated effluents are discharged into
aquatic environment. Since it is known that PPCPs are present in the environment and
might cause adverse impacts, it has been studied the efficacy of different ways to
remove pharmaceuticals from reclaimed wastewater. Consequently, while some earlier
treatments remain effective today, the elimination prerequisites have also increased
significantly in more recent times, and additional treatment objectives have been added.
Treatment processes must be closely linked with the water quality objectives and
standards established by local and National regulatory authorities.
Many of the new treatment technologies being developed are designed to address
the health and environmental concerns raised by the findings of recent research.
Although removal of PPCPs was not the initial objective of WWTPs, facilities must be
designed with the capability to be updated with new procedures in the future dealing
with new emerging contaminants. Furthermore, as long as recent developments of more
sensitive analytical techniques enable the detection of new chemicals, some previously
undetected contaminants are in the research spotlight. The elimination efficiency of any
WWTP is directly related to its design. Although new treatment techniques are in
constant development, the adoption and implementation into WWTPs facilities needs
long and costly procedures, so upgrade of WWTPs is not frequent.
WWTPs apply primary (physico-chemical separation processes), secondary
(microbial biodegradation), and usually tertiary (advanced) treatments prior to the
discharge into aquatic environment. During wastewater treatment, a redistribution of
PPCPs will occur between the dissolved fraction and the solids and soils (primary or
secondary sludge, see Figure 1.2-1). In accordance, release of PPCPs to the
environment will occur not only by final effluents but also with sludge’s disposal. As it
was already mentioned, excess sewage sludge is commonly used in the EU as a
fertilizer in agriculture. There is a wide list of available bibliography addressing this topic
[176, 177].
In general, primary treatments in WWTPs consists of physico‐chemical processes,
including filtration, sedimentation, coagulation, and flocculation. Secondary treatments
are designed to degrade organic matter through the use of microorganisms. Biological
degradation and transformation take place aerobically through biological oxidation in
activated sludge, through the use of trickling filters, or in anaerobic sludge digesters.
Tertiary treatments use physical, biological, and chemical processes as an extra step to
further reduce pollutants not degraded during the secondary treatment. Tertiary
treatment also provides better quality of effluents by reducing odours and coloration.
General Introduction
76
These treatments often include the application of chlorine and/or other chemicals to
oxidize remaining organic matter. Some advanced treatments have recently been
evaluated, including membrane processes (microfiltration, ultrafiltration, nanofiltration,
and reverse osmosis), advanced oxidation processes (AOPs) and adsorption into
granular activated solid sorbents. Some recent studies reviewed the different methods
used for the removal of pharmaceuticals and TPs from wastewater [178-181].
Wide number of studies detected PPCPs (and many other ECs) in the WWTPs
effluents, due to inefficient removal during the treatment processes. Several studies
reported bad removal rates, with the consequent release of these pollutants into the
environment [182, 183]. Therefore, the need for new directions and considerations in
wastewater treatment is evident. Regretfully, some major treatment plants are still using
only limited physico‐chemical processes, which unfortunately produce only undesired
low removal efficiencies for PPCPs. Comprehensive assessments of the resulting health
and environment effects, as well as community concerns about these effects, are
therefore becoming increasingly important in the field of wastewater management.
34BPHARMACEUTICAL’S TRANSFORMATION PRODUCTS 1.2.2.2
(TPs)
The occurrence or fate of PhACs residues in environmental waters has been
categorized in three principal transformation pathways from the active former prescribed
structure [171]: (1) ultimate mineralization; (2) partial biodegradation (i.e. partly retained
in sediment) and (3) conversion to more hydrophilic but persistent metabolites (i.e. end
up in receiving water bodies).
While most organic contaminants are entering the wastewater influent without being
metabolized, pharmaceuticals are frequently transformed in the body and a combination
of non-altered pharmaceuticals and their metabolites are excreted by humans [184].
Microbial transformation products of pharmaceuticals and hormones can also be formed
during biological treatment of wastewaters, from contact with sediment and soils, as well
as during bank filtration. Furthermore, TPs can be formed by UV irradiation in surface
waters and during oxidative treatment processes, such as ozonation and chlorine
disinfection. Figure 1.2-2 shows some schematic trends of the transformation
processes of different PhACs.
Even though TPs have gained increasing interest as water contaminants, only a few
studies have investigated the formation and fate of biological TPs of pharmaceuticals in
contact with biologically active matrices, such as activated sludge or sediments. One
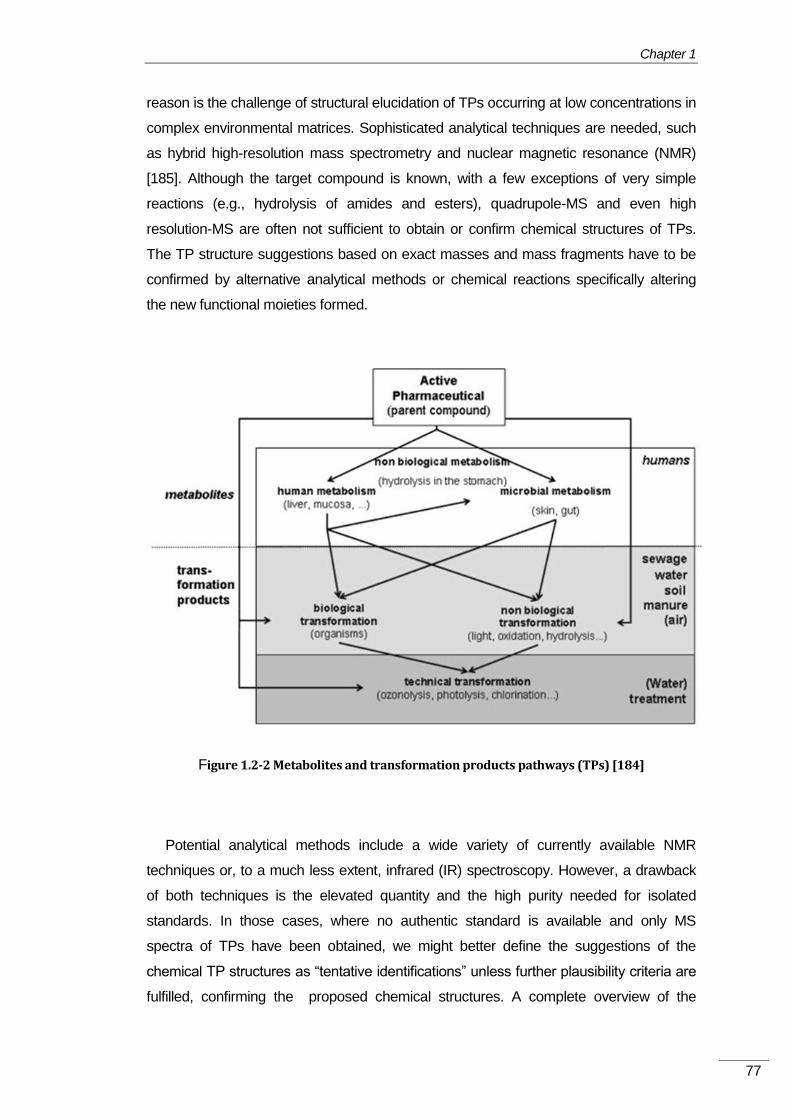
Chapter 1
77
reason is the challenge of structural elucidation of TPs occurring at low concentrations in
complex environmental matrices. Sophisticated analytical techniques are needed, such
as hybrid high-resolution mass spectrometry and nuclear magnetic resonance (NMR)
[185]. Although the target compound is known, with a few exceptions of very simple
reactions (e.g., hydrolysis of amides and esters), quadrupole-MS and even high
resolution-MS are often not sufficient to obtain or confirm chemical structures of TPs.
The TP structure suggestions based on exact masses and mass fragments have to be
confirmed by alternative analytical methods or chemical reactions specifically altering
the new functional moieties formed.
Figure 1.2-2 Metabolites and transformation products pathways (TPs) [184]
Potential analytical methods include a wide variety of currently available NMR
techniques or, to a much less extent, infrared (IR) spectroscopy. However, a drawback
of both techniques is the elevated quantity and the high purity needed for isolated
standards. In those cases, where no authentic standard is available and only MS
spectra of TPs have been obtained, we might better define the suggestions of the
chemical TP structures as “tentative identifications” unless further plausibility criteria are
fulfilled, confirming the proposed chemical structures. A complete overview of the

General Introduction
78
literature regarding the detection and identification of pharmaceutical TPs until 2008 was
provided by Celiz et al [186].
Several recent studies indicated that the majority of pharmaceutical TPs formed
under aerobic conditions have a slightly modified molecular structure featuring increased
polarity, due to the introduction of hydroxyl, carboxyl, or keto moieties [187, 188]. On the
basis of the similarity of their molecular structure to the parent compound, a significant
number of TPs are expected to possess comparable biological activity as their chemical
precursors [189]. However, the enhanced polarity improves the permeability of these
compounds for several water treatment processes such as adsorptive filtration (e.g.,
activated carbon), underground soil passage, or bank filtration. Consequently, the
likelihood increases that TPs are contaminating groundwater and drinking water [190].
Chapter 1
79
1.2.3 17BCHROMATOGRAPHIC TECHNIQUES FOR THE
DETERMINATION OF PHARMACEUTICALS IN WATER
Environmental analysis of pharmaceuticals in water matrices has a common
background with the analysis of VOCs in environmental air matrices (see Section 1.1.3).
The analysis of pharmaceuticals in the environment water is thus challenging from
similar perspectives:
(i) Are in general embedded within very complex mixtures of liquids, also with solids
and gases either in solution or suspension;
(ii) Their concentrations may evolve rapidly with time; and,
(iii) May be present on a wide range of concentrations, commonly in the trace levels
As trace compounds, pharmaceutical’s concentrations in the aquatic environment are
typically in the order from pg L-1 to µg L-1. This issue makes PhACs analyses conditional
on: (a) the use of very sensitive analytical techniques and (b) a clean-up and extraction
step prior to the analytical detection. Some other critical factors determine the best
analytical methodologies for pharmaceutical’s quantification in the water.
Owing the extremely wide range of different compounds included among PhACs,
with different physicochemical properties and different effects on human health and
environment, it is important to quantify them individually. It is necessary the use of an
appropriate separation technique to characterize water chemical composition on the
basis of individual concentrations. Chromatographic techniques do provide the most
efficient separation, becoming especially important when multiple compounds are to be
detected.
With some exceptions, PhACs tend to be polar, non‐volatile, and thermally labile. For
these compounds gas chromatography without a prior derivatization step is not a
suitable technique. liquid chromatography thus presents a great advantage here, since a
derivatization step is not required. Undoubtedly however, the main advances in
improving sensitivity and specificity in environmental analysis of pharmaceutical
residues has been due to the application of mass spectrometry (MS) and tandem mass
spectrometry (MS‐MS or MS2). Specifically, MS‐MS is today the technique of choice for
the identification of a broad range of PhACs in environmental samples.
An overview of the most relevant methods and the new trends in the determination of
PhACs in environmental waters are presented. However, facing the huge number of
studies regarding the analysis of PPCPs (up to 7000 publications listed in the US-EPA
[4]) only the most relevant articles published in the most important Scientific Journals
are overviewed.

General Introduction
80
35BEXTRACTION TECHNIQUES 1.2.3.1
Pharmaceuticals in the aquatic environment are present at trace levels, typically in
the order from pg L-1 to few µg L-1. Analysis of organic compounds at trace levels in the
environment (like PPCPs or VOCs) requires sensitive, robust and fast analytical
techniques. As it was stated in Section 1.1.4.1, and similarly to VOCs determination in
air, sampling and extraction techniques for PhACs in water must satisfy some relevant
criteria. Environmental water sampling is, in general, less challenging than
environmental air sampling, hence common sampling procedure involves the collection
of environmental water into clean glass vessels (equivalent to “whole air” collection
techniques of VOCs). However, environmental water samples, in general, involve more
complicated clean-up and extraction procedures than environmental gas samples.
In the last years a wide list of clean-up and extraction techniques have been
developed and applied for the determination of PPCPs in water samples (as well as
soils and sludge samples). The most widely used are based on solid phase extraction
(SPE), owing the wide list of solid sorbents commercially available, which simplifies
working operations –enables on-line automated methods [191]- , but may generate
elevated solvent residues. One important recent trend is the development of techniques
involving the concept “green chemistry”, reducing the amount of solvent used [192].
This section shows an overview of the most important extraction techniques, suitable
for the monitoring of organic PhACs in the environmental water samples: (1) solid-phase
extraction (SPE), (2) stir bar sorptive extraction (SBSE), (3) liquid-phase microextraction
techniques (LPME), and (4) solid-phase microextraction (SPME). These techniques
have been comprehensively reviewed in the last years [119, 165, 172, 181, 192-194].
Basic principles of SBSE and LPME and related techniques are briefly described in this
section. SPE and SPME have been previously described in this introductory Chapter
(Section 1.1.4.1).
67BStir bar sorptive extraction (SBSE) 1.2.3.1.1
Stir bar sorptive extraction (SBSE), introduced in 1999 [195], was developed with the
aim to overcome some of the limitations of the solid sorbent techniques, in particular
those involving SPME and small volumes of sorptive material [196]. The technique is
based on sorptive extraction, whereby the solutes are extracted into a polymer coating
on a magnetic stirring rod. The extraction is controlled by the partitioning coefficient of
the solutes between the polymer coating and the sample matrix, as well as by the phase
ratio between the polymer coating and the sample volume.
Chapter 1
81
In practice, the stir bar used in SBSE is introduced into the water sample to extract
the analytes into the coating polymer over a period of time. Several parameters should
be optimized, such as agitation speed, sample volume, pH, extraction time, or ionic
strength. After extraction, the stir bar is removed, and the analytes are recovered from
the sorbent by desorption, either thermal (TD) or liquid (LD). With the thermal method,
the stir bar is introduced into a glass tube, which is then placed in a thermal desorption
unit installed on a GC system [197]. When a liquid desorption approach is used, the stir
bar is used to stir the solvent, which is suitable for the target analytes, and this extract is
then injected into the LC or GC unit [198].
The main advantages are the easiness of its application and the possibility of
automations with thermal desorption. The principal drawback is that the only
commercially available fibre is the non-polar polymer polydimethylsiloxane (PDMS), and
it is sometimes needed to develop novel in-house stir bar coatings to improve
recoveries, adding extra valuable time to the analysis,
68BLiquid-phase microextraction (LPME) 1.2.3.1.2
As reviewed by Sarafraz‐Yazdi et al. [199], liquid‐phase microextraction (LPME) was
introduced in order to overcome the problems that could occur with the use of SPME
fibres. Because of its advantages in terms of high enrichment, efficient sample cleanup,
and low consumption of organic solvent, substantial interest has been devoted to LPME
in recent years. Some applications of this method for analysis of environmental waters
have been recently reviewed [200, 201]. In hollow‐fibre membrane liquid‐phase
microextraction (HF‐LPME), target analytes are extracted from aqueous samples and
transferred into a supported liquid membrane (SLM). They are then sustained in the
pores in the walls of a small porous hollow fibre. Zhang et al. [100] reported on their
pioneering use of dynamic HF‐LPME, combined with a port derivatization of the
compounds with trimethylanilinium hydroxide (TMAH), followed by GC‐MS analysis.
They applied this technique to determine four pharmaceuticals (ibuprofen, ketoprofen,
naproxen, and clofibric acid) in waste and tap waters.
Another of the main methodologies that has evolved from liquid phase
microextraction, and which has received increasing attention in recent years, is
dispersive liquid‐liquid microextraction (DLLME). The advantages it offers include ease
of operation, low cost, and a high enrichment factor. There are still few reports on
studies using DLLME to determine PhACs. However, one that can be mentioned was
published by Du et al. [82], who determined, for the first time, estrone and 17β‐ estradiol
in water samples, using DLLME and LC with a variable‐wavelength detector. Their

General Introduction
82
recovery levels in spring, tap, and river waters ranged from 90% to 94% for estrone, and
from 84% to 112% for 17β‐estradiol. Their results showed that the various matrices had
little effect on the efficiency of DLLME enrichment.
A new direction for LPME has been developed and is referred to as
electromembrane (EME). This novel system combines the technical setup used in
LPME with known principles for electroextraction, which force the extraction process
with an applied potential difference across the membrane. Fontana et al. [202]
successfully applied EME to determine trace levels of acidic and basic PhACs in waters.
Only 10 min of extraction time and 50 μL of organic solvent (octanol) were needed
under ideal conditions, making this technique very interesting for the environmental
monitoring of a few number of specific compounds
36BGAS CHROMATOGRAPHY 1.2.3.2
As mentioned above, GC may be a suitable technique for determination of volatile
pharmaceuticals in environmental waters, commonly hyphenated with MS or MS-MS
detection, which are selective enabling the use of library searching on the basis of the
m/z ions. However it presents a major drawback, since PhACs are tending to be polar,
common procedure is the introduction of a derivatization step prior to injection, in order
to adapt analytes’ polarity, volatility and thermal stability to GC features.
In Table 1.2-2 there is a list of different analytical methods developed for the analysis
of PhACs in water samples with the most relevant features in every case.
In accordance, GC techniques are not the most appropriate techniques for the
environmental analysis (with monitoring purposes) of PhACs, since there are a limited
number of compounds suitable to be determined by GC. As we state in the next section,
LC better meets the requirements to be used as analytical methods for the
environmental monitoring of PhACs.
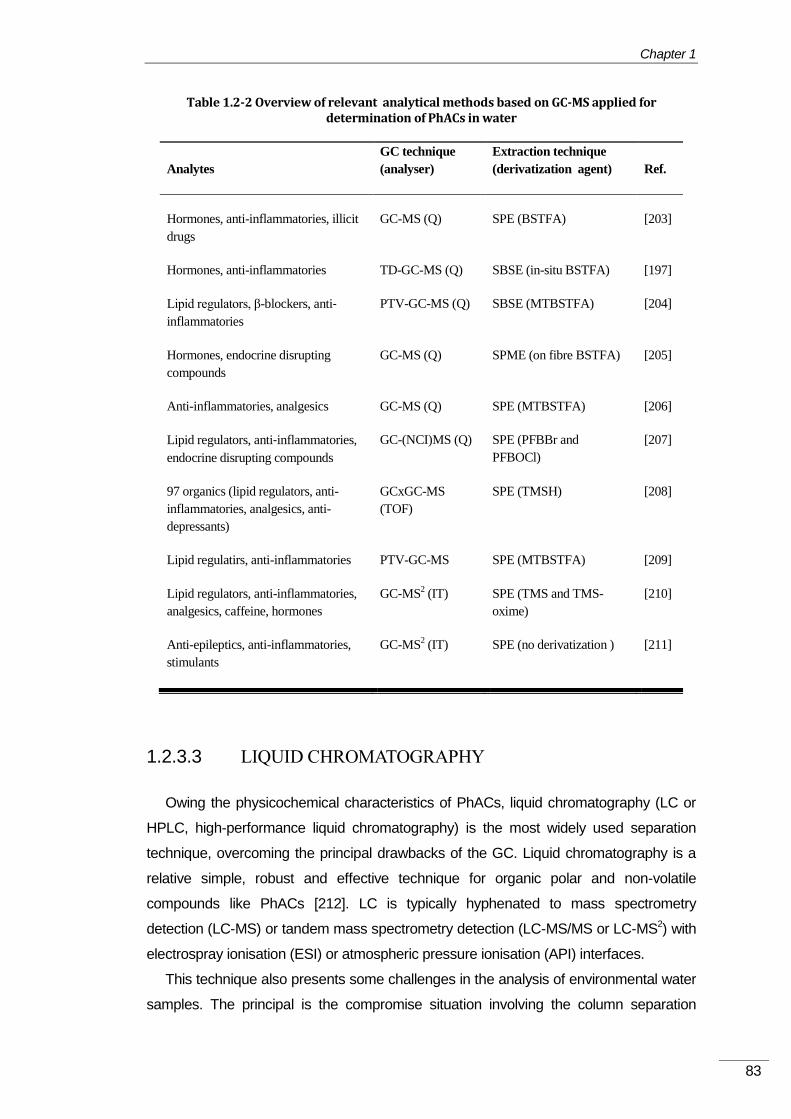
Chapter 1
83
Table 1.2-2 Overview of relevant analytical methods based on GC-MS applied for determination of PhACs in water
Analytes
GC technique
(analyser)
Extraction technique
(derivatization agent) Ref.
Hormones, anti-inflammatories, illicit
drugs
GC-MS (Q) SPE (BSTFA) [203]
Hormones, anti-inflammatories TD-GC-MS (Q) SBSE (in-situ BSTFA) [197]
Lipid regulators, β-blockers, anti‐
inflammatories
PTV-GC-MS (Q) SBSE (MTBSTFA) [204]
Hormones, endocrine disrupting
compounds
GC-MS (Q) SPME (on fibre BSTFA) [205]
Anti-inflammatories, analgesics GC-MS (Q) SPE (MTBSTFA) [206]
Lipid regulators, anti‐inflammatories,
endocrine disrupting compounds
GC-(NCI)MS (Q) SPE (PFBBr and
PFBOCl)
[207]
97 organics (lipid regulators, anti-
inflammatories, analgesics, anti-
depressants)
GCxGC-MS
(TOF)
SPE (TMSH) [208]
Lipid regulatirs, anti-inflammatories PTV-GC-MS SPE (MTBSTFA) [209]
Lipid regulators, anti-inflammatories,
analgesics, caffeine, hormones
GC-MS2 (IT) SPE (TMS and TMS-
oxime)
[210]
Anti-epileptics, anti-inflammatories,
stimulants
GC-MS2 (IT) SPE (no derivatization ) [211]
37BLIQUID CHROMATOGRAPHY 1.2.3.3
Owing the physicochemical characteristics of PhACs, liquid chromatography (LC or
HPLC, high-performance liquid chromatography) is the most widely used separation
technique, overcoming the principal drawbacks of the GC. Liquid chromatography is a
relative simple, robust and effective technique for organic polar and non-volatile
compounds like PhACs [212]. LC is typically hyphenated to mass spectrometry
detection (LC-MS) or tandem mass spectrometry detection (LC-MS/MS or LC-MS2) with
electrospray ionisation (ESI) or atmospheric pressure ionisation (API) interfaces.
This technique also presents some challenges in the analysis of environmental water
samples. The principal is the compromise situation involving the column separation

General Introduction
84
efficiency and the time of analysis. Recent trends in LC techniques are using analytical
columns packed with smaller sized particles (commonly 1.7 µm in diameter vs. 4 to 5
µm), enabling better separation efficiency due to an increase on the number of
theoretical plates, reducing the time of analysis. This technique is called Ultra high-
performance liquid chromatography (UHPLC). As a counterpoint, the smaller size of
particles generates an outstanding increase of pressure in the system, thus special
equipment is needed, capable to run under thousands of psi (up to 15000 psi).
The liquid chromatography characteristics allows the potential hyphenation with the
flow injection based techniques, e.g. flow injection analysis (FIA) or sequential injection
analysis (SIA), for the complicated clean-up and extraction step(s), enabling on-line
analytical methodologies, really adequate for the (constant) monitoring of environmental
levels of PhACs.
Table 1.2-3 shows a summary of different analytical methodologies for the
determination of PhACs based on LC-MS with the extraction technique.
Table 1.2-3 Overview of relevant analytical methods based on LC-MS for determination of PhACs in wastewater and natural waters
Analytes LC technique
(MS analyzer)
Extraction Ref.
Hormones LC-UV DLLME [213]
Hormones LC-DAD SBSE [198]
Hormones LC-UV On-line SPE [214]
Ilicit drugs and metabolites LC-MS2 (QqQ) SPE [215]
Fluoroquinolones LC-MS2 (QqQ) In-tube SPME [216]
Sulfonamides, tetracyclines, analgesics and
hormones
LC-MS2 (QqQ) SPE [217]
Carbamazepine, sulfonamides, lipid
regulators, anti‐inflammatories
LC-MS2 (QqQ) SPE [182]
Analgesics and non-steroidal anti-
inflammatories (NSAIDs), lipid regulators,
psychiatric drugs, anti-histaminics, anti-ulcer
agent, antibiotics and β-blockers
LC-MS2 (QqQ) SPE [218]
Analgesics, anti‐inflammatories, lipid
regulators, psychiatric drugs
UHPLC-MS2 (QqQ) SPE [219]
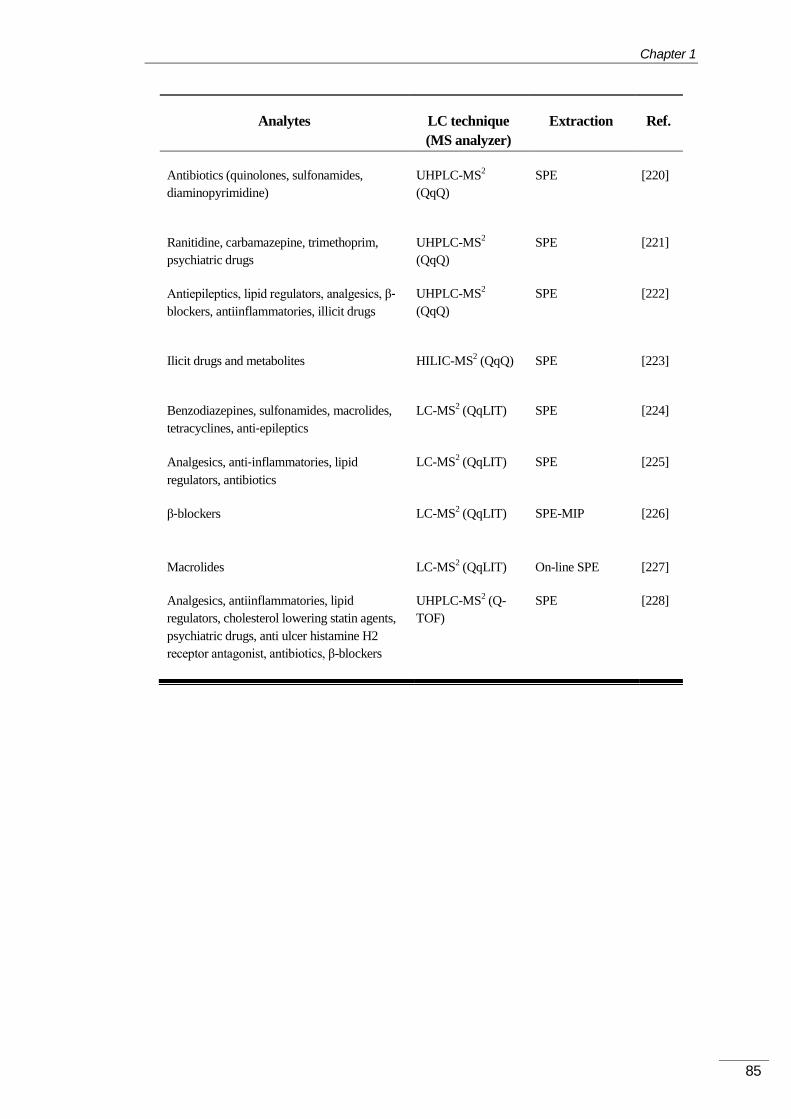
Chapter 1
85
Analytes LC technique
(MS analyzer)
Extraction Ref.
Antibiotics (quinolones, sulfonamides,
diaminopyrimidine)
UHPLC-MS2
(QqQ)
SPE [220]
Ranitidine, carbamazepine, trimethoprim,
psychiatric drugs
UHPLC-MS2
(QqQ)
SPE [221]
Antiepileptics, lipid regulators, analgesics, β‐
blockers, antiinflammatories, illicit drugs
UHPLC-MS2
(QqQ)
SPE [222]
Ilicit drugs and metabolites HILIC-MS2 (QqQ) SPE [223]
Benzodiazepines, sulfonamides, macrolides,
tetracyclines, anti‐epileptics
LC-MS2 (QqLIT) SPE [224]
Analgesics, anti‐inflammatories, lipid
regulators, antibiotics
LC-MS2 (QqLIT) SPE [225]
β‐blockers LC-MS2 (QqLIT) SPE-MIP [226]
Macrolides LC-MS2 (QqLIT) On-line SPE [227]
Analgesics, antiinflammatories, lipid
regulators, cholesterol lowering statin agents,
psychiatric drugs, anti ulcer histamine H2
receptor antagonist, antibiotics, β-blockers
UHPLC-MS2 (Q-
TOF)
SPE [228]

General Introduction
86
REFERENCES 1.3

Chapter 1
87
[1] J.L. Oaks, M. Gilbert, M.Z. Virani, R.T. Watson, C.U. Meteyer, B.A. Rideout, H.L.
Shivaprasad, S. Ahmed, M.J. Iqbal Chaudhry, M. Arshad, S. Mahmood, A. Ali, A.
Ahmed Khan, Nature, 427 (2004) 630-633.
[2] European Council. COD 2007/0235. Regulation (EC) No 401/2009 of the European
Parliament and of the Council of 23 April 2009 on the European Environment
Agency and the European Environment Information and Observation Network
(latest version), 2009.
[3] D.C.G. Muir, P.H. Howard, Environmental Science & Technology, 40 (2006) 7157-
7166.
[4] US-EPA, Pharmaceuticals and Personal Care Products (PPCPs): Relevant
Literature (a comprehensive database of literature references compiled and
maintained by CG Daughton and MST Scuderi; first implemented 19 February
2008), 2010.
[5] R. Heinrich-Ramm, M. Jakubowski, B. Heinzow, J. Molin Christensen, E. Olsen, O.
Hertel, Pure Appl. Chem., 72 (2000) 385-436.
[6] EEA, Proposal for a Council Directive on limitation of emissions of volatile organic
compounds due to the use of organic solvents in certain industrial activities.
96/0276 (SYN) Article 2, 1996.
[7] EEA, Directive 2004/42/CE of the European Parliament and of the Council of 21 April
2004 on the limitation of emissions of volatile organic compounds due to the use
of organic solvents in certain paints and varnishes and vehicle refinishing products
and amending Directive 1999/13/EC, 2004.
[8] US-EPA, Method TO-17. Determination of Volatile Organic Compounds in Ambient
Air Using Active Sampling Onto Sorbent Tubes, 1999.
[9] S.E. Manahan, Fundamentals of environmental Chemistry. , USA, 2001.
[10] J.F. Pankow, Atmospheric Environment, 21 (1987) 2275-2283.
[11] T.F. Bidleman, Environmental Science & Technology, 22 (1988) 361-367.
[12] A. Finizio, D. Mackay, T. Bidleman, T. Harner, Atmospheric Environment, 31 (1997)
2289-2296.
[13] S.J. Eisenreich, B.B. Looney, J.D. Thornton, Environmental Science & Technology,
15 (1981) 30-38.
[14] K. Roholm, The Journal of Industrial Hygiene and Toxicology, 19 (1937) 126-137.
[15] Greater London Authority, 50 years on the struggle for air quality in London since
the great smog of December 1952, Ed. Greater London Autorithy, City Hall, 2002.
[16] R. Varma, D.R. Varma, Bulletin of Science, Technology & Society, 25 (2005) 37-45.
[17] UNECE. Convention on Long-range Transboundary Air Pollution, 1979.
[18] M. Kampa, E. Castanas, Environmental Pollution, 151 (2008) 362-367.
[19] S. Harrad, Persistent Organic Pollutants, John Wiley & Sons, Ltd, 2010.
[20] A. Schecter, L. Birnbaum, J.J. Ryan, J.D. Constable, Environmental Research, 101
(2006) 419-428.
[21] EEA,Technical Report No 15/2011. Revealing the costs of air pollution from
industrial facilities in Europe, 2011.
[22] P. Ciccioli, Chemistry and analysis of volatile organic compounds in the
environment. Ed. J. Blackie Academic & Professional, UK, 1993.
[23] A. Roger, Atmospheric Oxidation, in: Handbook of Property Estimation Methods for
Chemicals, CRC Press, 2000.
[24] R. Atkinson, Atmospheric Environment, 34 (2000) 2063-2101.

General Introduction
88
[25] EEA, Co-operative Programme for Monitoring and Evaluation of Air Pollutants in
Europe (EMEP). Atmospheric emission inventory guidebook, 2009.
[26] Unidad de Información Ambiental Estratégica. Inventario de emisiones a la
atmósfera de España. Serie 1990-2009 (In spanish). 2011.
[27] EEA, Data on emissions of air pollutants submitted to the LRTAP Convention, 2011.
[28] A. Guenther, C.N. Hewitt, D. Erickson, R. Fall, C. Geron, T. Graedel, P. Harley, L.
Klinger, M. Lerdau, W.A. McKay, T. Pierce, B. Scholes, R. Steinbrecher, R.
Tallamraju, J. Taylor, P. Zimmerman, J. Geophys. Res., 100 (1995) 8873-8892.
[29] M. Karl, A. Guenther, R. Köble, A. Leip, G. Seufert, Biogeosciences, 6 (2009) 1059-
1087.
[30] J.H. Schween, R. Dlugi, C.N. Hewitt, P. Foster, Atmospheric Environment, 31,
Supplement 1 (1997) 199-215.
[31] K.W. Oum, M.J. Lakin, D.O. DeHaan, T. Brauers, B.J. Finlayson-Pitts, Science, 279
(1998) 74-76.
[32] R. Atkinson, Journal of Physical and Chemical Reference Data, 26 (1997) 215-290.
[33] J.G. Calvert, R. Atkinson, J.A. Kerr, S. Madronich, G.K. Moortgart, T.J. Yarwood,
The Mechanisms of Atmospheric Oxidation of the Alkenes. Oxford University
Press, 2000.
[34] R. Atkinson, J. Arey, Accounts of Chemical Research, 31 (1998) 574-583.
[35] A. Calogirou, N.R. Jensen, C.J. Nielsen, D. Kotzias, J. Hjorth, Environmental
Science & Technology, 33 (1998) 453-460.
[36] A.J. Haagen-Smith, M.M. Fox, Indian Enginering Chemistry, 48 (1956) 1484.
[37] A.J. Haagen-Smith, M.M. Fox, Journal of Air pollution Control Association, 4 (1954)
105-109.
[38] P.A. Leighton, Photochemistry of air pollution, New York and Loncdon Academic
Press, 1961.
[39] M. Climent Bellido, Aspectos químicos de la contaminación atmosférica (In
Spanish), Ed. University of Cordoba, 1996.
[40] R.M. Peña Creciente, Contribución al estudio de compuestos oxidantes en el
entorno de una central térmica (in spanish), PhD Dissertation in Chemistry Dpt.,
University of Santiago de Compostela. 1997.
[41] M.E. Jenkin, K.C. Clemitshaw, Atmospheric Environment, 34 (2000) 2499-2527.
[42] M.E. Jenkin, S.M. Saunders, M.J. Pilling, Atmospheric Environment, 31 (1997) 81-
104.
[43] V. Fernández-Villarrenaga Martín, Desarrollo de metodologías para el análisis de
compuestos orgánicos volátiles (COV) en matrices ambientales (in spanish), PhD
Dissertation in Chemistry Dpt., University of A Coruña, 2002.
[44] A. Whittaker, K. BéruBé, T. Jones, R. Maynard, R. Richards, Science of The Total
Environment, 334–335 (2004) 435-445.
[45] S. Sironi, L. Capelli, P. Céntola, R. Del Rosso, M. Il Grande, Atmospheric
Environment, 39 (2005) 5387-5394.
[46] L. Vilavert, M. Nadal, M. Figueras, J. Domingo, Environmental Science and
Pollution Research, 19 (2012) 96-104.
[47] M.M. Renfrew, Journal of Chemical Education, 67 (1990) A241.
[48] T. Ohura, T. Amagai, X. Shen, S. Li, P. Zhang, L. Zhu, Atmospheric Environment,
43 (2009) 6352-6359.
[49] E. Uhde, T. Salthammer, Atmospheric Environment, 41 (2007) 3111-3128.

Chapter 1
89
[50] S.-C. Lee, H. Guo, W.-M. Li, L.-Y. Chan, Atmospheric Environment, 36 (2002)
1929-1940.
[51] K.B. Hoddinott, A.P. Lee, Chemosphere, 41 (2000) 77-84.
[52] H. Guo, S.C. Lee, L.Y. Chan, W.M. Li, Environmental Research, 94 (2004) 57-66.
[53] D. Arslanbas, H. Pekey, B. Pekey, Z. Bulut Bozkurt, G. Dogan, M. Civan, Ö. Oguz
Kuntasal, G. Tuncel, in: 2nd International Conference on Air Pollution and Control
(CAPAC-II), Antalya (Turkey), 2011.
[54] C. Jia, S. Batterman, C. Godwin, Atmospheric Environment, 42 (2008) 2083-2100.
[55] T.E. Butt, E. Lockley, K.O.K. Oduyemi, Waste Management, 28 (2008) 952-964.
[56] US-EPA, Technology Transfer Network: Air toxics website, 2012,
http://www.epa.gov/ttn/atw/188polls.html..
[57] US-EPA, 2005 National-Scale Air Toxics Assessment, 2011,
http://www.epa.gov/ttn/atw/nata2005/.
[58] US-EPA, Guidelines for Carcinogen Risk Assessment, 2005. Risk Assessment
Forum Editor, Washington , DC.
[59] US-EPA, Integrated Risk Information System (IRIS), 2012, http://www.epa.gov/iris/.
[60] US-EPA, A Guide to Indoor Air Quality, http://www.epa.gov/iaq/pubs/index.html.
[61] European Committe for Standardization, EN-13725. Air quality: determination of
odour concentration by dynamic olfactometry, 2003.
[62] American Society for Testing Materials (ASTM), Standard Practice for Referencing
Suprathreshold Odour Intensity., 1999.
[63] N. Yassaa, B.Y. Meklati, E. Brancaleoni, M. Frattoni, P. Ciccioli, Atmospheric
Environment, 35 (2001) 787-801.
[64] US-EPA, Method TO 14A. Determination Of Volatile Organic Compounds (VOCs)
In Ambient Air Using Specially Prepared Canisters With Subsequent Analysis By
Gas Chromatography, 1999.
[65] US-EPA. Method TO-15. Determination of Volatile Organic Compounds (VOCs) In
Air Collected In Specially-Prepared Canisters And Analyzed By Gas
Chromatography Mass Spectrometry (GC/MS), 1999.
[66] J. Pawliszyn, H.L. Lord, Handbook of sample Preparation. Ed. Whiley-Blackwell,
2010.
[67] M.R. Ras, F. Borrull, R.M. Marcé, TrAC Trends in Analytical Chemistry, 28 (2009)
347-361.
[68] K. Demeestere, J. Dewulf, B. De Witte, H. Van Langenhove, Journal of
Chromatography A, 1153 (2007) 130-144.
[69] J. Dewulf, H. Van Langenhove, G. Wittmann, TrAC Trends in Analytical Chemistry,
21 (2002) 637-646.
[70] E. Woolfenden, Journal of Chromatography A, 1217 (2010) 2674-2684.
[71] E. Woolfenden, Journal of Chromatography A, 1217 (2010) 2685-2694.
[72] S. Król, B. Zabiegała, J. Namieśnik, TrAC Trends in Analytical Chemistry, 29 (2010)
1092-1100.
[73] S. Król, B. Zabiegała, J. Namieśnik, TrAC Trends in Analytical Chemistry, 29 (2010)
1101-1112.
[74] L.-L. Hsieh, C.-C. Chang, U. Sree, J.-G. Lo, Water, Air, & Soil Pollution, 170 (2006)
107-121.
[75] M. Gautrois, T. Brauers, R. Koppmann, F. Rohrer, O. Stein, J. Rudolph, Journal
Geophysical Research, 108 (2003) 4393.

General Introduction
90
[76] M. Das, D. Kang, V.P. Aneja, W. Lonneman, D.R. Cook, M.L. Wesely, Atmospheric
Environment, 37 (2003) 2269-2277.
[77] M. Colón, J.D. Pleil, T.A. Hartlage, M. Lucia Guardani, M. Helena Martins,
Atmospheric Environment, 35 (2001) 4017-4031.
[78] N. Ochiai, S. Daishima, D.B. Cardin, Journal of Environmental Monitoring, 5 (2003)
997-1003.
[79] C.-C. Chang, U. Sree, Y.-S. Lin, J.-G. Lo, Atmospheric Environment, 39 (2005)
3187-3190.
[80] E.S. Farrell, G.E. Pacey, Talanta, 82 (2010) 739-744.
[81] J.-L. Wang, C.-C. Chang, K.-Z. Lee, Journal of Chromatography A, (In press).
[82] D. Wang, C. Austin, Analytical and Bioanalytical Chemistry, 386 (2006) 1089-1098.
[83] C. Hung-Lung, H. Ching-Shyung, C. Shih-Yu, W. Ming-Ching, M. Sen-Yi, H. Yao-
Sheng, Science of The Total Environment, 381 (2007) 200-211.
[84] Y.L. Zhang, H. Guo, X.M. Wang, I.J. Simpson, B. Barletta, D.R. Blake, S. Meinardi,
F.S. Rowland, H.R. Cheng, S.M. Saunders, S.H.M. Lam, Journal Geophysical
Research, 115 (2010) D15309.
[85] I.J. Simpson, N.J. Blake, B. Barletta, G.S. Diskin, H.E. Fuelberg, K. Gorham, L.G.
Huey, S. Meinardi, F.S. Rowland, S. A., A.J. Weinheimer, M. Yang, D.R. Blake,
Atmospheric Chemistry and Physics., 10 (2010) 11931-11954.
[86] P. Mochalski, B. Wzorek, I. Śliwka, A. Amann, Journal of Chromatography B, 877
(2009) 189-196.
[87] A. Kumar, I. Víden, Environmental Monitoring and Assessment, 131 (2007) 301-
321.
[88] S. Cariou, J.-M. Guillot, Analytical and Bioanalytical Chemistry, 384 (2006) 468-474.
[89] D. Wang, C. Austin, Analytical and Bioanalytical Chemistry, 386 (2006) 1099-1120.
[90] M.R. Ras, R.M. Marcé, F. Borrull, Talanta, 77 (2008) 774-778.
[91] G. Mangani, A. Berloni, M. Maione, Journal of Chromatography A, 988 (2003) 167-
175.
[92] M. Harper, Journal of Chromatography A, 885 (2000) 129-151.
[93] American Society for Testing Materials (ASTM), D-6196. Standard Practice for
Selection of Sorbents, Sampling, and Thermal Desorption Analysis Procedures for
Volatile Organic Compounds in Air, 2009.
[94] National Institute for Occupational Safety and Health, NIOSH-2549. Volatile Organic
Compounds (Screening) 1996.
[95] International Standarisation Organisation, ISO 16017-1. Indoor, ambient and
workplace air -- Sampling and analysis of volatile organic compounds by sorbent
tube/thermal desorption/capillary gas chromatography -- Part 1: Pumped
sampling, 2000.
[96] International Standarisation Organisation, ISO 16017-2. Indoor, ambient and
workplace air -- Sampling and analysis of volatile organic compounds by sorbent
tube/thermal desorption/capillary gas chromatography -- Part 2: Diffusive
sampling, 2000.
[97] J. Namieśnik, B. Zabiegała, A. Kot-Wasik, M. Partyka, A. Wasik, Analytical and
Bioanalytical Chemistry, 381 (2005) 279-301.
[98] M. Partyka, B. Zabiegała, J. Namiésnik, A. Przyjazny, Critical Reviews in Analytical
Chemistry, 37 (2007) 51-78.
[99] S. Seethapathy, T. Górecki, X. Li, Journal of Chromatography A, 1184 (2008) 234-
253.

Chapter 1
91
[100] L. Tuduri, M. Millet, O. Briand, M. Montury, TrAC Trends in Analytical Chemistry,
31 (2012) 38-49.
[101] European Committee for Standarization, EN 13528-1:2002. Ambient air quality.
Diffusive samplers for the determination of concentrations of gases and vapours.
Requirements and test methods. General requirements, 2002.
[102] European Committee for Standarization, EN 13528-2:2002. Ambient air quality.
Diffusive samplers for the determination of concentrations of gases and vapours.
Requirements and test methods. Specific requirements and test methods, 2002.
[103] Sigma-Aldrich, in http://www.sigmaaldrich.com/analytical-chromatography/air-
monitoring/passive-sampling.html.
[104] H. Plaisance, P. Desmettres, T. Leonardis, A. Pennequin-Cardinal, N. Locoge,
J.C. Galloo, Journal of Environmental Monitoring, 10 (2008) 517-526.
[105] C. Cocheo, C. Boaretto, D. Pagani, F. Quaglio, P. Sacco, L. Zaratin, D. Cottica,
Journal of Environmental Monitoring, 11 (2009) 297-306.
[106] A. Pennequin-Cardinal, H. Plaisance, N. Locoge, O. Ramalho, S. Kirchner, J.-C.
Galloo, Talanta, 65 (2005) 1233-1240.
[107] P. Bruno, M. Caselli, G. de Gennaro, M. Solito, M. Tutino, Waste Management, 27
(2007) 539-544.
[108] K. Dettmer, W. Engewald, Analytical and Bioanalytical Chemistry, 373 (2002) 490-
500.
[109] K. Dettmer, W. Engewald, Chromatographia, 57 (2003) S339-S347.
[110] N.A. Martin, N.L.A.S. Barber, J.K. Black, R.P. Lipscombe, C.A. Taig, Atmospheric
Environment, 41 (2007) 7666-7671.
[111] Ö.O. Kuntasal, D. Karman, D. Wang, S.G. Tuncel, G. Tuncel, Journal of
Chromatography A, 1099 (2005) 43-54.
[112] C.L. Arthur, J. Pawliszyn, Analytical Chemistry, 62 (1990) 2145-2148.
[113] G. Vas, K. Vékey, Journal of Mass Spectrometry, 39 (2004) 233-254.
[114] G. Ouyang, J. Pawliszyn, TrAC Trends in Analytical Chemistry, 25 (2006) 692-
703.
[115] E.E. Stashenko, J.R. Mart nez, TrAC Trends in Analytical Chemistry, 23 (2004)
553-561.
[116] A. Prieto, O. Basauri, R. Rodil, A. Usobiaga, L.A. Fernández, N. Etxebarria, O.
Zuloaga, Journal of Chromatography A, 1217 (2010) 2642-2666.
[117] M.T. Tena, J.D. Carrillo, TrAC - Trends in Analytical Chemistry, 26 (2007) 206-214.
[118] C. Duan, Z. Shen, D. Wu, Y. Guan, TrAC Trends in Analytical Chemistry, 30
(2011) 1568-1574.
[119] G. Ouyang, J. Pawliszyn, Analytica Chimica Acta, 627 (2008) 184-197.
[120] J. Pawliszyn, B. Pawliszyn, M. Pawliszyn, The Chemical Educator, 2 (1997) 1-7.
[121] J. Nicolle, V. Desauziers, P. Mocho, Journal of Chromatography A, 1208 (2008)
10-15.
[122] R. Barro, J. Regueiro, M. Llompart, C. Garcia-Jares, Journal of Chromatography
A, 1216 (2009) 540-566.
[123] C. omeño, F. Mart nez-Garc a, L. Campo, C. Ner n, Analytica Chimica Acta, 524
(2004) 51-62.
[124] F.V. Parreira, C.R. de Carvalho, Z. de Lourdes Cardeal, Bulletin of Environmental
Contamination and Toxicology, 70 (2003) 0957-0963.
[125] E. Davoli, M.L. Gangai, L. Morselli, D. Tonelli, Chemosphere, 51 (2003) 357-368.
[126] H. Kataoka, Analytical and Bioanalytical Chemistry, 396 (2010) 339-364.

General Introduction
92
[127] T. Elbir, B. Cetin, E. Cetin, A. Bayram, M. Odabasi, Environmental Monitoring and
Assessment, 133 (2007) 149-160.
[128] E.M. Martins, G. Arbilla, G.F. Bauerfeldt, M.d. Paula, Chemosphere, 67 (2007)
2096-2103.
[129] A. Campos-Candel, M. Llobat-Estellés, A. Mauri-Aucejo, Talanta, 78 (2009) 1286-
1292.
[130] V. Fernández‐Villarrenaga, P. López‐Mahía, S. Muniategui‐Lorenzo, D. Prada‐
Rodríguez, E. Fernández‐Fernández, X. Tomàs, Analytical Letters, 37 (2004)
3313-3330.
[131] W. Kornacki, P. Fastyn, J. Gawlowski, T. Gierczak, J. Niedzielski, Analyst, 130
(2005) 632-636.
[132] W. Kornacki, P. Fastyn, T. Gierczak, J. Gawłowski, J. Niedzielski,
Chromatographia, 63 (2006) 67-71.
[133] Perkin-Elmer, in, Norwalk, CT, USA.
[134] C.-Y. Peng, S. Batterman, Journal of Environmental Monitoring, 2 (2000) 313-324.
[135] R.A. Ketola, J.T. Kiuru, V. Tarkiainen, J.T. Kokkonen, J. Räsänen, T. Kotiaho,
Analytica Chimica Acta, 562 (2006) 245-251.
[136] J.M. Sanchez, R.D. Sacks, Journal of Separation Science, 30 (2007) 1052-1060.
[137] Y. Qin, T. Walk, R. Gary, X. Yao, S. Elles, Atmospheric Environment, 41 (2007)
6018-6032.
[138] C. Thammakhet, P. Thavarungkul, R. Brukh, S. Mitra, P. Kanatharana, Journal of
Chromatography A, 1072 (2005) 243-248.
[139] J.M. Sanchez, R.D. Sacks, Journal of Separation Science, 28 (2005) 22-30.
[140] H. Peng, J. Wang, Z. Shen, D. Wu, Y. Guan, Analyst, 136 (2011) 586-590.
[141] A. Segal, T. Górecki, P. Mussche, J. Lips, J. Pawliszyn, Journal of
Chromatography A, 873 (2000) 13-27.
[142] X. Liu, J. Pawliszyn, International Journal of Environmental Analytical Chemistry,
85 (2005) 1189-1200.
[143] M. Qi, X. Ge, M. Liang, R. Fu, Analytica Chimica Acta, 527 (2004) 69-72.
[144] F. Biasioli, C. Yeretzian, T.D. Märk, J. Dewulf, H. Van Langenhove, TrAC Trends
in Analytical Chemistry, 30 (2011) 1003-1017.
[145] K. Badjagbo, S. Sauvé, S. Moore, TrAC Trends in Analytical Chemistry, 26 (2007)
931-940.
[146] R.A. Ketola, T. Kotiaho, M.E. Cisper, T.M. Allen, Journal of Mass Spectrometry, 37
(2002) 457-476.
[147] R.A. Ketola, J.T. Kiuru, T. Kotiaho, V. Kitunen, A. Smolander, Boreal Environment
Research, 16 (2011) 36-46.
[148] N. Srinivasan, R.C. Johnson, N. Kasthurikrishnan, P. Wong, R.G. Cooks, Analytica
Chimica Acta, 350 (1997) 257-271.
[149] U. Platt, D. Perner, H.W. Pätz, J. Geophys. Res., 84 (1979) 6329-6335.
[150] G. Barrefors, Science of The Total Environment, 189–190 (1996) 287-292.
[151] D. Brocco, R. Fratarcangeli, L. Lepore, M. Petricca, I. Ventrone, Atmospheric
Environment, 31 (1997) 557-566.
[152] H. Skov, A. Lindskog, F. Palmgren, C.S. Christensen, Atmospheric Environment,
35, Supplement 1 (2001) S141-S148.
[153] A. Guenther, C. Geron, T. Pierce, B. Lamb, P. Harley, R. Fall, Atmospheric
Environment, 34 (2000) 2205-2230.
Chapter 1
93
[154] K. Badjagbo, P. Picard, S. Moore, S. Sauvé, Journal of the American Society for
Mass Spectrometry, 20 (2009) 829-836.
[155] W. Lindinger, A. Hansel, A. Jordan, International Journal of Mass Spectrometry
and Ion Processes, 173 (1998) 191-241.
[156] R.S. Blake, P.S. Monks, A.M. Ellis, Chemical Reviews, 109 (2009) 861-896.
[157] J. de Gouw, C. Warneke, Mass Spectrometry Reviews, 26 (2007) 223-257.
[158] A. Jordan, S. Haidacher, G. Hanel, E. Hartungen, L. Märk, H. Seehauser, R.
Schottkowsky, P. Sulzer, T.D. Märk, International Journal of Mass Spectrometry,
286 (2009) 122-128.
[159] . Smith, P. Španěl, Mass Spectrometry Reviews, 24 (2005) 661-700.
[160] P. Španěl, . Smith, Mass Spectrometry Reviews, 30 (2011) 236-267.
[161] P. Španěl, M. Pavlik, . Smith, International Journal of Mass Spectrometry and Ion
Processes, 145 (1995) 177-186.
[162] EEA, 2012. http://ec.europa.eu/environment/archives/env-act5/envirpr.htm.
[163] European Comission, Guidance Document for the implementation of the European
PRTR, 2006.
[164] European Committe for Standardization, EN-13649:2001. Stationary source
emissions - Determination of the mass concentration of individual gaseous
organic compounds - Activated carbon and solvent desorption method, 2001.
[165] S.D. Richardson, T.A. Ternes, Analytical Chemistry, 83 (2011) 4614-4648.
[166] I. Robinson, G. Junqua, R. Van Coillie, O. Thomas, Analytical and Bioanalytical
Chemistry, 387 (2007) 1143-1151.
[167] M. Pedrouzo, F. Borrull, E. Pocurull, R.M. Marcé, Talanta, 78 (2009) 1327-1331.
[168] US-EPA, Contaminant Candidate List 3 (CCL-3), 2011, in
http://water.epa.gov/scitech/drinkingwater/dws/ccl/ccl3.cfm#ccl3.
[169] T. Heberer, Toxicology Letters, 131 (2002) 5-17.
[170] B. Halling-Sørensen, S. Nors Nielsen, P.F. Lanzky, F. Ingerslev, H.C. Holten
Lützhøft, S.E. Jørgensen, Chemosphere, 36 (1998) 357-393.
[171] A. Ziylan, N.H. Ince, Journal of Hazardous Materials, 187 (2011) 24-36.
[172] K.Y. Bell, M.J.M. Wells, K.A. Traexler, M.-L. Pellegrin, A. Morse, J. Bandy, Water
Environment Research, 83 (2011) 1906-1984.
[173] M.J.M. Wells, K.Y. Bell, K.A. Traexler, M.-L. Pellegrin, A. Morse, Water
Environment Research, 82 (2010) 2095-2170.
[174] Comission to the Council Directive and the European Parliament. Report 99752 on
the implementation of Community waste legislation., 2000.
[175] European Commission, (2000).
[176] A. Nieto, F. Borrull, R.M. Marcé, E. Pocurull, Journal of Chromatography A, 1216
(2009) 5619-5625.
[177] A. Kot-Wasik, J. ebska, J. Namieśnik, TrAC - Trends in Analytical Chemistry, 26
(2007) 557-568.
[178] I. Oller, S. Malato, J.A. Sánchez-Pérez, Science of The Total Environment, 409
(2011) 4141-4166.
[179] D. Fatta-Kassinos, M.I. Vasquez, K. Kümmerer, Chemosphere, 85 (2011) 693-
709.
[180] S. Judd, The MBR book. Principles and applications of membrane bioreactors in
water and wastewater treatment. Ed. Butterworth-Neinemann, Oxford, UK, 2011.
[181] F.A. Caliman, M. Gavrilescu, CLEAN – Soil, Air, Water, 37 (2009) 277-303.

General Introduction
94
[182] J.L. Zhou, Z.L. Zhang, E. Banks, D. Grover, J.Q. Jiang, Journal of Hazardous
Materials, 166 (2009) 655-661.
[183] A. Jelić, M. Petrović, . Barceló, Pharmaceuticals in rinking Water in, Springer
Berlin / Heidelberg, 2012, pp. 1-24.
[184] K. Kümmerer, Journal of Environmental Management, 90 (2009) 2354-2366.
[185] J.L. Kormos, M. Schulz, M. Wagner, T.A. Ternes, Analytical Chemistry, 81 (2009)
9216-9224.
[186] M.D. Celiz, J. Tso, D.S. Aga, Environmental Toxicology and Chemistry, 28 (2009)
2473-2484.
[187] A.H. Neilson, A.-S. Allard, Environmental degradation and transformation of
organic chemicals, Boca Raton, FL, 2008.
[188] D.E. Helbling, J. Hollender, H.-P.E. Kohler, H. Singer, K. Fenner, Environmental
Science & Technology, 44 (2010) 6621-6627.
[189] R. van Zelm, M.A.J. Huijbregts, D. van de Meent, Environmental Science &
Technology, 44 (2010) 1004-1009.
[190] J.L. Kormos, M. Schulz, H.-P.E. Kohler, T.A. Ternes, Environmental Science &
Technology, 44 (2010) 4998-5007.
[191] S. Rodriguez-Mozaz, M.J. Lopez de Alda, D. Barceló, Journal of Chromatography
A, 1152 (2007) 97-115.
[192] M. Farré, S. Pérez, C. Gonçalves, M.F. Alpendurada, D. Barceló, TrAC Trends in
Analytical Chemistry, 29 (2010) 1347-1362.
[193] E. Primel, S. Caldas, A. Escarrone, Central European Journal of Chemistry, 10
(2012) 876-899.
[194] A.S. Yazdi, TrAC Trends in Analytical Chemistry, 30 (2011) 918-929.
[195] E. Baltussen, P. Sandra, F. David, C. Cramers, Journal of Microcolumn
Separations, 11 (1999) 737-747.
[196] F. David, P. Sandra, Journal of Chromatography A, 1152 (2007) 54-69.
[197] E. Van Hoeck, F. Canale, C. Cordero, S. Compernolle, C. Bicchi, P. Sandra,
Analytical and Bioanalytical Chemistry, 393 (2009) 907-919.
[198] X. Huang, J. Lin, D. Yuan, R. Hu, Journal of Chromatography A, 1216 (2009)
3508-3511.
[199] A. Sarafraz-Yazdi, A. Amiri, TrAC Trends in Analytical Chemistry, 29 (2010) 1-14.
[200] J. Lee, H.K. Lee, K.E. Rasmussen, S. Pedersen-Bjergaard, Analytica Chimica
Acta, 624 (2008) 253-268.
[201] M.Á. Bello-López, M. Ramos-Payán, J.A. Ocaña-González, R. Fernández-Torres,
M. Callejón-Mochón, Analytical Letters, 45 (2012) 804-830.
[202] A.R. Fontana, R.G. Wuilloud, L.D. Martínez, J.C. Altamirano, Journal of
Chromatography A, 1216 (2009) 147-153.
[203] C.-P. Yu, K.-H. Chu, Chemosphere, 75 (2009) 1281-1286.
[204] J.B. Quintana, R. Rodil, S. Muniategui-Lorenzo, P. López-Mahía, D. Prada-
Rodríguez, Journal of Chromatography A, 1174 (2007) 27-39.
[205] L. Yang, T. Luan, C. Lan, Journal of Chromatography A, 1104 (2006) 23-32.
[206] A. Togola, H. Budzinski, Journal of Chromatography A, 1177 (2008) 150-158.
[207] J.-L. Zhao, G.-G. Ying, L. Wang, J.-F. Yang, X.-B. Yang, L.-H. Yang, X. Li,
Science of The Total Environment, 407 (2009) 962-974.
[208] V.C. Matamoros, E. Jover, J.M. Bayona, Analytical Chemistry, 82 (2009) 699-706.
[209] C. Guitart, J.W. Readman, Analytica Chimica Acta, 658 (2010) 32-40.
Chapter 1
95
[210] Á. Sebők, A. Vasanits-Zsigrai, A. Helenkár, G. Záray, I. Molnár-Perl, Journal of
Chromatography A, 1216 (2009) 2288-2301.
[211] M.J. Gómez, A. Agüera, M. Mezcua, J. Hurtado, F. Mocholí, A.R. Fernández-Alba,
Talanta, 73 (2007) 314-320.
[212] A.M. Comerton, R.C. Andrews, D.M. Bagley, Philosophical Transactions of the
Royal Society A: Mathematical, Physical and Engineering Sciences, 367 (2009)
3923-3939.
[213] X. Du, X. Wang, Y. Li, F. Ye, Q. Dong, C. Huang, Chromatographia, 71 (2010)
405-410.
[214] S. Wang, W. Huang, G. Fang, J. He, Y. Zhang, Analytica Chimica Acta, 606
(2008) 194-201.
[215] S. Castiglioni, E. Zuccato, E. Crisci, C. Chiabrando, R. Fanelli, R. Bagnati,
Analytical Chemistry, 78 (2006) 8421-8429.
[216] K. Mitani, H. Kataoka, Analytica Chimica Acta, 562 (2006) 16-22.
[217] J.Y. Pailler, A. Krein, L. Pfister, L. Hoffmann, C. Guignard, Science of The Total
Environment, 407 (2009) 4736-4743.
[218] M. Gros, M. Petrović, . Barceló, Talanta, 70 (2006) 678-690.
[219] E. Gracia-Lor, J.V. Sancho, F. Hernández, Journal of Chromatography A, 1217
(2010) 622-632.
[220] F. Tamtam, F. Mercier, J. Eurin, M. Chevreuil, B. Le Bot, Analytical and
Bioanalytical Chemistry, 393 (2009) 1709-1718.
[221] J.M. Conley, S.J. Symes, S.A. Kindelberger, S.M. Richards, Journal of
Chromatography A, 1185 (2008) 206-215.
[222] B. Kasprzyk-Hordern, R.M. Dinsdale, A.J. Guwy, Journal of Chromatography A,
1161 (2007) 132-145.
[223] A. van Nuijs, I. Tarcomnicu, L. Bervoets, R. Blust, P. Jorens, H. Neels, A. Covaci,
Analytical and Bioanalytical Chemistry, 395 (2009) 819-828.
[224] S. Grujić, T. Vasiljević, M. Laušević, Journal of Chromatography A, 1216 (2009)
4989-5000.
[225] M. Gros, M. Petrović, . Barceló, Analytical Chemistry, 81 (2008) 898-912.
[226] M. Gros, T.-M. Pizzolato, M. Petrović, M.J.L. de Alda, . Barceló, Journal of
Chromatography A, 1189 (2008) 374-384.
[227] J. Ding, N. Ren, L. Chen, L. Ding, Analytica Chimica Acta, 634 (2009) 215-221.
[228] M. Petrovic, M. Gros, D. Barcelo, Journal of Chromatography A, 1124 (2006) 68-
81.


97
CHAPTER 2
1BOBJECTIVES


Chapter 2
99
OBJECTIVES
A primary objective of the research discussed in this Doctoral Thesis is to evaluate
and assess the occurrence of a wide group of persistent and pseudo-persistent organic
pollutants in the environment (air and water) from the region of Mallorca (Spain). Two
different groups of analytes, concerning a wide subset of chemicals with little if any legal
regulation, have been the focus of this Thesis: (1) volatile organic compounds (VOCs)
have been evaluated in the air of several municipal solid waste treatment plants and
landfills; and (2) pharmaceutically active compounds (PhACs) have been evaluated in
wastewaters (treatment plants and landfill leachates) and the aquatic environment. For
this purpose, novel well-developed analytical methods (based on chromatographic
techniques with mass spectrometry detection) were developed and combined with
diverse solid phase extraction techniques for the analytical detection of the objective
organic compounds.
In parallel, the secondary objective of this Doctoral Thesis was to assess the need
and/or the potential benefits owing the development of more comprehensive and
restrictive (local) environmental regulations implementing the hereby assessed methods
for a continuous monitoring of these relevant organic pollutants.
Analytical methods were selected with the aim of fulfilling basic requirements to
enable its implementation as periodic monitoring techniques: maximum number of
analytes in one single run, maximal robustness, simplicity and sensitivity, minimal
consumption of reagents, waste generation, and time of analysis as well as the
automation of required sample pre-treatment and applicability to real matrices and
autonomous, stand-alone operation.
In order to achieve the principal objectives stated above, there were proposed some
lesser specific objectives:
1. Development and optimisation of a suitable analytical method (i.e. sensible,
traceable and robust over time) for the periodical (continuous) analysis of VOCs in
the air, capable to analyse multiple VOCs in environmental samples without altering
matrix composition.
2. Implementation and optimisation of a reliable calibration methodology using liquid
standards for the analysis of VOCs in air, which reduces the inequality between (a)
gaseous samples and (b) liquid standards.

Objectives
100
3. Characterisation of the composition and concentration of multiple VOCs within the
biogas emissions to the atmosphere of the principal municipal solid waste landfill in
Mallorca. Estimation of landfill total emissions.
4. Development of a statistical model correlating air composition –i.e. multiple VOCs
concentration – with odour measurements (carried out by dynamic olfactometry) as
alternative methodology to quantify odour levels to find odour markers
5. Development of a statistical pattern recognition model enabling the classification of
the air of different waste treatment facilities on the basis of their VOC composition,
for a further identification of the emitting focus in the case of pollutant episodes in
the nearby locations.
6. Development and optimisation of a valid analytical method (i.e. sensible, traceable
and robust over time) for the analysis of multiple pharmaceuticals in different water
samples (fresh water, marine water, groundwater and wastewater).
7. Evaluation of the pollution levels and the potential pollution pathways of multiple
pharmaceuticals in the aquatic environment in Mallorca.
This work was incorporated into the projects of the National Plan for Science and
Chemical Technology CTQ2007-64331 and CTQ2010-15541 entitled “ evelopment of
automated methods of analysis. Application to environmental monitoring plans”
supported by the Spanish Ministry of Science and Technology. It contributed especially
to the part of monitoring and control of organic compounds in samples of environmental
interest.
The part of this work concerning determination of VOCs in the air took part into an
agreement signed between University of the Balearic Islands (our Group), the Consell
Insular de Mallorca (Mallorca Insular Council) and the municipal solid waste (MSW)
Managing Companies in Mallorca.

101
CHAPTER 3
2BEXPERIMENTAL PART AND
DISCUSSION


Chapter 3
103
EXPERIMENTAL PART AND DISCUSSION
As we mentioned in the introduction, although the presence of organic contaminants
in the air and water have been widely reported, information on their environmental
occurrence in the Island of Mallorca is limited to three previous studies, since it does not
exist a specific regulation regarding environmental monitoring of many organic
pollutants. For this reason one of the objectives of this Thesis is to focus on the
evaluation of some organics (VOCs and pharmaceuticals) in the environment. Thermal
desorption of solid sorbents coupled to GC-MS was used to evaluate VOCs in the air,
whereas solid phase extraction coupled to HPLC-ESI-MS/MS was used to evaluate
pharmaceuticals in the Mallorca aquatic environment. We were encouraged to do the
Thesis because of the nearly inexistent knowledge concerning the environmental
pollution levels of organic compounds in Mallorca, limited to some PCBs and PAHs (see
references in Sections 3.2.1.1 and 3.1.2.1).
On one hand, VOCs are ubiquitous pollutants, and the industrial processes located in
Mallorca release important amounts of them to the environment. These emissions
should be monitored to evaluate and prevent eventual pollutant episodes both harmful
for humans and environment. Furthermore, VOCs are well known odorant compounds,
and appropriate monitoring can help to identify the origin of an odorant episode in
nearby inhabited areas.
On the other hand, owing the increasing use of reclaimed water for agriculture and
other irrigation purposes in Mallorca (over 30% of the overall consumption), we
considered the necessity to determine the concentration of pharmaceuticals in the
principal wastewater treatment plants (WWTPs) effluents discharging reclaimed water to
the environment. The potential pollution pathways followed by the pharmaceuticals to
reach the aquatic environment were also establish in order to evaluate the fate and the
potential risk of a self-contamination of natural water reservoirs due to the reuse of
reclaimed wastewater.
The results reported in this Thesis provides new data which evidences the requisite
of more restrictive environmental regulations in order to efficiently reduce local
emissions of organic contaminants to the atmospheric and aquatic environments.
This chapter includes the experimental part and the results from different studies that
have been carried out through this Doctoral Thesis. These results have been published
in different scientific journals and are presented in journal paper format. Previous to
each study or group of them, a brief introduction is included in which the main aim is

Experimental Part and Discussion
104
pointed out, as well as the novelty of the study when it was developed and some other
important considerations. Even though the most important results and discussions are
described in the articles, some other important discussions are briefly discussed in
Chapter 4. The list of publications as a result of this Thesis is included in the Annex I of
this Doctoral Thesis.
The experimental part has been divided into two sections, depending on the group of
compounds measured, either VOCs or pharmaceuticals. In the biggest first Section it is
developed an analytical method to determine a wide list of VOCs, and two
environmental applications to characterize 42 and 93 different VOCs in the air of odorant
emissions from several MSW treatment plant and MSW landfills. TD-GC-MS was the
chosen technique in all the studies.
In the second Section 3.2 we developed a method based on solid-phase extraction
and liquid chromatography coupled to tandem mass spectrometry by electrospray
interface (HPLC-ESI-MS/MS) to determine a group of pharmaceuticals in several
environmental and wastewater samples in Mallorca.

Chapter 3
105
9BDETERMINATION OF VOLATILE ORGANIC 3.1
COMPOUNDS IN THE AIR

Determination of VOCs in the Atmospheric Environment
106
We have mentioned along the introduction the principle characteristics of the VOCs,
including the major threats for environment and human health as well as different techniques
and methodologies for the determination in the atmospheric environment.
In the island of Mallorca tons of VOCs are released every year to the atmospheric
environment, primarily from multitude of individually minuscule sources (especially due to the
solvent use and the traffic transports). Each source contributes relatively insignificant
quantities, but the combined input can yield measurable overall levels. As a counterpoint, a
wide list of industrial processes located in the Island (e.g. waste management facilities,
landfills, concrete manufacturing, agriculture and livestock production) emit VOCs to a lesser
overall degree than traffic and solvent emissions, but can yield higher VOCs concentrations
in specific areas (taking as a reference the emission inventory in the EU, page 16). Hence,
VOCs emissions due to industrial processes or waste treatments in general provoke severe
social awareness and annoyance, as long as emissions are punctual and can be easily
allocated and reach extremely high concentration levels.
Even though analytical methodologies for the analysis of VOCs in the air have been
widely described and applied worldwide (as it has been mentioned along the introductory
chapter) occurrence of VOCs in the ambient of Mallorca has never been evaluated, which
evidences a lack of knowledge over environmental pollution levels. In this regard, it is not
possible to assess the sustainability of the existing industrial processes in order to assure a
clean environment, and comprehensive analyses must be carried out.
Under this situation, it was signed a two years collaboration agreement between: (1) the
Consell Insular de Mallorca (Mallorca’s Insular Council) , (2) the Automation and
Environmental Analytical Chemistry Group of the Chemistry Department of the University of
the Balearic Islands (our research group) and (3) the Waste Management Companies
TIRME SA and EMAYA SA. The general purposes of this collaboration were to: (i) develop a
reliable analytical methodology enabling the detection and characterization of the VOCs
composition of some of the potential emission focuses of VOCs located in the island due to
the treatment and disposal of municipal solid wastes; (ii) find a reliable analytical
methodology able to substitute the expensive and tedious odorant measurements based on
the EN-13725 based upon the potential correlation of odour measurements with VOCs
composition; and (iii) calculate and compare emission rates of VOCs at the different waste
treatment plants.
In this section are presented the studies of a wide number of VOCs in different
environmental samples, considered as important emission focus to the atmosphere.
Weighing up the possibilities, always trying to reach the main objectives stated in Chapter
2, the selection of the analytical methodology was based on different criteria:
Capable to analyse the major number of VOCs in one single run.

Chapter 3
107
Ease and fast.
Robust over time, suitable for monthly periodical analysis.
After an exhaustive bibliographic seek, contrasting different recommendations, a previous
work was conducted testing and evaluating the best methodology for the environmental
monitoring of VOCs with the instrumentation available in the laboratory group. GC was the
chromatographic technique of choice with MS detection, owing the excellent selectivity and
sensitivity. Different extraction methods based on the SPE and SPME techniques were
evaluated combining different solid sorbents. The analytical method of choice in the studies
presented in this Doctoral Thesis was finally the thermal desorption – gas chromatography –
mass spectrometry (namely TD-GC-MS). Sorbent traps containing Tenax® TA and
Carboxen 1000® sorbents were chosen for the preconcentration of the different compounds,
and desorbed thermally by means of an automated unit. Two different sampling techniques
were carried out (see sections 3.2.2 and 3.2.3) depending on the nature of the emission
focus studied (emission or immission air).
The results of these studies have been published in Chemosphere and International
Journal of Environmental Analytical Chemistry, while other has been submitted to the
Journal of Separation Sciences. The complete information of the articles included in this
Doctoral Thesis is detailed in Annex I.

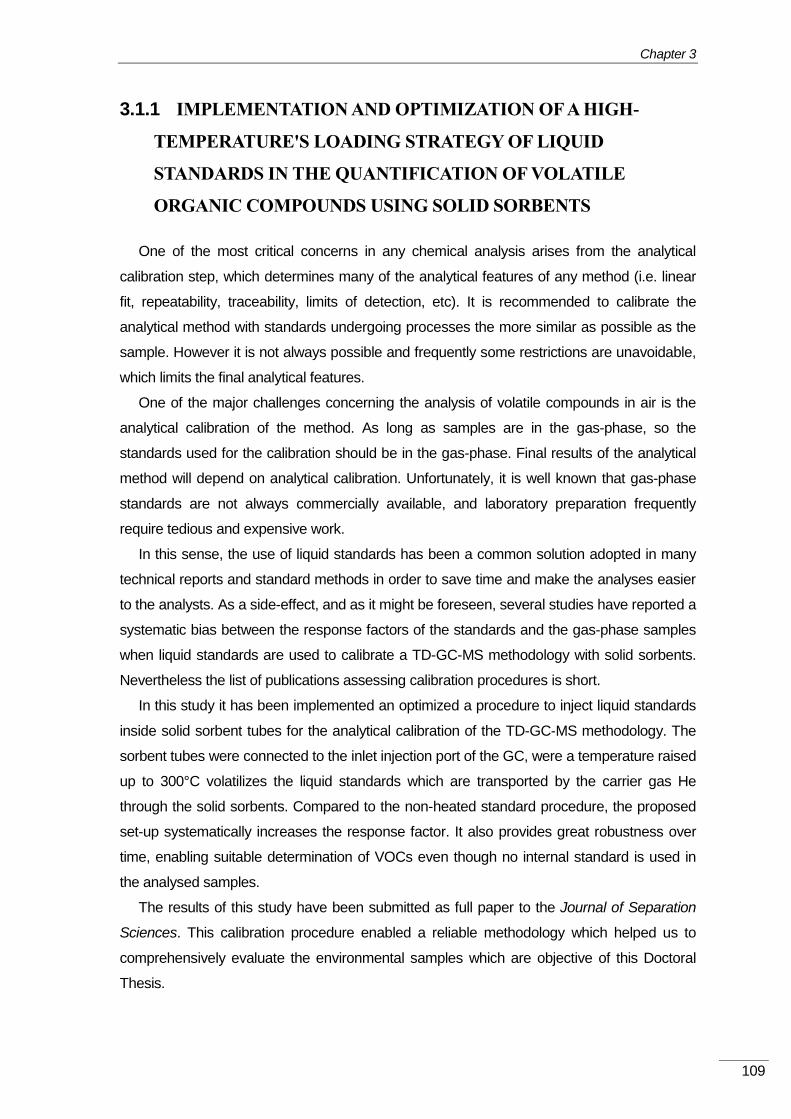
Chapter 3
109
3.1.1 18BIMPLEMENTATION AND OPTIMIZATION OF A HIGH-
TEMPERATURE'S LOADING STRATEGY OF LIQUID
STANDARDS IN THE QUANTIFICATION OF VOLATILE
ORGANIC COMPOUNDS USING SOLID SORBENTS
One of the most critical concerns in any chemical analysis arises from the analytical
calibration step, which determines many of the analytical features of any method (i.e. linear
fit, repeatability, traceability, limits of detection, etc). It is recommended to calibrate the
analytical method with standards undergoing processes the more similar as possible as the
sample. However it is not always possible and frequently some restrictions are unavoidable,
which limits the final analytical features.
One of the major challenges concerning the analysis of volatile compounds in air is the
analytical calibration of the method. As long as samples are in the gas-phase, so the
standards used for the calibration should be in the gas-phase. Final results of the analytical
method will depend on analytical calibration. Unfortunately, it is well known that gas-phase
standards are not always commercially available, and laboratory preparation frequently
require tedious and expensive work.
In this sense, the use of liquid standards has been a common solution adopted in many
technical reports and standard methods in order to save time and make the analyses easier
to the analysts. As a side-effect, and as it might be foreseen, several studies have reported a
systematic bias between the response factors of the standards and the gas-phase samples
when liquid standards are used to calibrate a TD-GC-MS methodology with solid sorbents.
Nevertheless the list of publications assessing calibration procedures is short.
In this study it has been implemented an optimized a procedure to inject liquid standards
inside solid sorbent tubes for the analytical calibration of the TD-GC-MS methodology. The
sorbent tubes were connected to the inlet injection port of the GC, were a temperature raised
up to 300°C volatilizes the liquid standards which are transported by the carrier gas He
through the solid sorbents. Compared to the non-heated standard procedure, the proposed
set-up systematically increases the response factor. It also provides great robustness over
time, enabling suitable determination of VOCs even though no internal standard is used in
the analysed samples.
The results of this study have been submitted as full paper to the Journal of Separation
Sciences. This calibration procedure enabled a reliable methodology which helped us to
comprehensively evaluate the environmental samples which are objective of this Doctoral
Thesis.


Chapter 3
111
39BSUBMITTED ARTICLE 3.1.1.1


Chapter 3
113
Implementation and optimization of high-temperature's
loading strategy of liquid standards in the
quantification of volatile organic compounds using solid
sorbents.
Carlos Rodríguez-Navas, Rafael Forteza, Víctor Cerdà*
Department of Chemistry, Faculty of Sciences, University of the Balearic Islands
Carretera de Valldemosa km 7.5, E-07122 Palma de Mallorca, Spain
[email protected], Ph.: +34 971173261, fax: +34 971173426
Keywords: VOC; Thermal desorption; solid sorbent; matrix effects, response factor.
Abstract
High temperature liquid standard loading strategy onto solid sorbent traps for calibration of
thermal desorption-gas chromatography-mass spectrometry techniques (TD-GC-MS) for the
analysis of volatile organic compounds (VOCs) is evaluated and optimized. With this proposed
set-up, volatilized liquid-loaded standards interact in gas phase with solid sorbent particles.
Response factor for 15 VOCs have been evaluated and compared with common strategies based
on liquid matrix interactions. Using gas matrix strategy improves signal output in the range 10%
to 700%. Average increase for BTEX is 480%. Reported systematic bias between liquid standards
and gas samples are reduced, enhancing TD methodologies on one of its more important issues. In
addition, the proposed system improves the average repeatability to a 3.2%, over 13 times some
reported data. The use of an ultra-thin chromatographic capillary column of 150 µm i.d. performs
better peak resolution in about 60 % the time with usual 250 µm i.d. capillary columns.
1. Introduction
Gas chromatography (GC) is the most appropriate technique to analyse volatile organic
compounds (VOCs), either from biogenic or anthropogenic sources. Coupled to mass
spectrometry detection (MS) compounds can be identified and quantified, being the most
powerful technique for this purpose. Notwithstanding, some critical issues restrain GC-MS
methodologies for quantification of VOCs in the air [1]. Typical concentrations in the ambient air
are in the range from few ng m-3
to mg m-3
, so a preconcentration step prior to GC injection seems
inevitable, especially in the analysis of multiple VOCs. Some new techniques have been

J. Sep. Sci. (Submitted)
114
developed in the recent last years based on direct-injection mass spectrometry (DIMS)
methodologies [2]. These methodologies have been applied to rapid monitoring and quantification
of VOCs, which in combination with fast instrumentation developments open a new perspective
for VOC characterization. However, these DIMS based methodologies often require a high level
of speciation, so techniques based on sorption-sampling followed by thermal-desorption strategies
(TD) are still prevalent and have been applied for the analysis of VOCs in environmental samples
during the last decade [3, 4]. TD strategies are combined with different sample treatment
methodologies, such as solid-phase microextraction (SPME) [5, 6], stir bar sorptive extraction
(SBSE) [7, 8], single drop microextraction (SDME) [9, 10], liquid-phase microextraction (LPME)
[11-13], headspace sorptive extraction (HSSE) [14, 15], or the most recent solid phase dynamic
extraction (SPDE) [16, 17] and accelerated solid-phase dynamic extraction (ASPDE) [18, 19]. All
these techniques provide good performance in terms of minimizing solvents, costs, easy-to-use,
green chemistry; but present a bottleneck regarding the quantity of sorbent breakthrough volume
and recovery rates. Therefore it may compromise the preconcentration step, either by increasing
limits of detection or by restricting the number of VOCs adsorbed at one time. In this sense the
most capable preconcentration technique is adsorption on solid sorbents followed by controlled
thermal desorption [20].
A current TD limitation exists in regard to method calibration of gaseous samples. For an
appropriate calibration procedure, standards must undergo exactly the same processes than
samples, including matrix composition and matrix effects. Hence, the best linear fit for the
quantification is expected when standards are used in gas phase. Regretfully, gaseous standards
may be either expensive or not commercially available, whereas laboratory in-situ generation
often requires tedious work comprising different techniques. One common alternative strategy is
based on the use of liquid standards, which generally provides fast and easy treatment, compared
to gas calibration standards. By this methodology, a micro drop (generally 1 to 10 µL) of liquid
solution containing selected standards is loaded with a micro-syringe onto TD sorbent tubes upon
the sorbent particles. Another common procedure may also be the use liquid standards in vapour
phase instead of direct liquid loading of standards. The vaporisation procedure is based on carrier
sweeping at lesser temperatures than compound’s boiling point. As a general procedure, the
sampling end of a packed sorbent tube is connected into a specific port, where an appropriate
carrier gas flow is set (via a valve), sweeps the injection port and passes down through the sorbent
tube to vent. The calibration solution is introduced through an injector port in the normal fashion
where it vaporises and reaches the sorbent bed in the vapour phase. It is established in some
technical reports from TD manufacturers [21] and also recommended in some TD-GC(MS)
standard methods [22-24].
During the last years, some studies proposed and compared different calibration strategies. Martin
et al. [25] concluded that gas and liquid strategies may provide same results as long as it is chosen

Chapter 3
115
a suitable combination of sorbent and solvent. Therefore selection of appropriate sorbent
combination is essential. A recent review [26] reported a comprehensive comparison of the most
common sorbents and their chemical and physical properties, that may help analysts to select the
appropriate sorbent. Demeestere et al [27] compared liquid and gaseous calibration strategies,
using Tenax TA® for a set of 69 different VOCs. They reported systematic bias in the range 40-
80 % for VOCs in gas matrix for the quantification with liquid phase standards, since the response
factor of compounds highly depends on the sample matrix. In the same study authors
recommended the use of a suitable internal standard calibration to reduce uncertainty. Kim et al.
[28] obtained similar results with Tenax TA® when analysing benzene, toluene and p-xylene.
Even though vaporisation of liquid standards for the calibration procedure has been reported as a
good alternative to gas standard calibration it may present some limitations. Owing the use of
solvent -not present in matrices of gas samples-, it should be eliminated from the sorbent bed
prior to TD, in order to simulate gaseous matrix. This step requires substantial flows of carrier in
the order of 100-500 ml min-1
[25]. It is remarkable the lack of available studies concerning
suitable sorbent-solvent combinations, currently limited to individual sorbents Tenax TA® and
Carbopack X® and methanol and cyclohexane solvents, measured for a small set of VOCs [25,
26]. So then, VOCs calibration suitability using liquid standards seems to be not yet well
established.
A high-temperature vaporisation strategy is proposed and evaluated in this study for the loading
step of liquid standards upon solid sorbent particles (Figure 1), based on the same principles than
normal GC injection. One micro drop of liquid standard solution is loaded inside the GC inlet, and
so with high-temperature (300°C) standards are automatically vaporized to gas phase. An in-
house designed stainless steel connector enables the joint of TD sorbent tubes directly at GC
injector replacing the capillary column. Working in splitless mode, gas phase standards are
carried towards TD tubes, by the inert gas, allowing the interaction standard-sorbent.
The scope of the study is to prove that our high-temperature injection method results in higher
standard response factors (RF) than liquid standard strategies, defined according to IUPAC as
detector sensitivity, being the signal output per unit of mass of a substance [27, 29, 30]. A second
objective is to provide some evidences that with the proposed set-up it is not necessary the use of
an internal standard calibration to obtain reliable quantifications. Only an appropriate instrumental
control standard (ICS) is needed to compensate for MS detector variations with time.
2. Materials and methods
2.1 Chemicals
For high-temperature vaporisation strategy, 15 individual GC-MS grade standards (>99%) were
provided by Sigma Aldrich and Fluka (Sigma Aldrich Quimica SA, Madrid, Spain):

J. Sep. Sci. (Submitted)
116
tetrachloromethane, benzene, 1,2-dichlorobenzene, 1,2-dichloroethane, 2-chlorophenol,
butylaldehyde, cyclohexanone, hexylaldehide, 2-butenal, styrene, ethylbenzene, toluene, o-
xylene, p-xylene and p-cymene. Deuteratedp-xylene-d10 was provided by Sigma Aldrich and
used as internal standard (IS). Methanol (GC residues analysis grade) was provided by Scharlau
(Barcelona, Spain). Solid sorbents Tenax™ TA and Carboxen™ 1000 (both mesh 60-80) were
provided by Supelco (Madrid, Spain).
In addition to the most common benzene, toluene, styrene and xylenes (so called BTEX), VOCs
were selected trying to cover a wide range of volatilities, chemical groups and polarities, to assess
the reliability of the procedure.
One stock solution (named A) was prepared as a mixture of the 15 individual VOCs at 1000 mg
L-1
in methanol. Another single IS stock solution (named B) of p-xylene-d10 was prepared at
1000 mg•L-1 in methanol. For the optimisation experiments, two final working standard solutions
(C1 and C2) were prepared at 20 mg L-1
and 75 mg L-1
, respectively, by direct dilution of stock
solution A in methanol. A fixed volume of stock solution B was added to both C1 and C2, in
order to obtain 50 mg L-1
of IS p-xylene-d10. Calibration curves of the 15 selected VOCs were
checked by both loading strategies. Five solutions with different concentrations were prepared
following the same procedure than solutions C1 and C2. Concentration levels were 100, 75, 50,
25 and 10 mg L-1
, all containing 50 mg L-1
of IS p-xylene-d10. All the solutions were stored at -
18°C in the dark.
Tenax TA™ and Carboxen 1000™ were adopted as sorbents since it provides a good
combination in sorbent strengths together with high hydrophobic properties [26] for volatile and
semi volatile compounds analysis. It is an excellent combination for environmental sampling,
assessed by some recent studies [31-34]. Methanol was adopted as solvent, as the recommended
for Tenax TA™ [25], whereas there is no reported data for Carboxen 1000™.
TD stainless steel sorbet tubes (Perkin-Elmer, Norwalk, USA; o.d.: 6.9 mm; i.d.: 4.9 mm; length:
88.9 mm) were prepared in the laboratory according to the US-EPA TO-17 compendium of
methods for determination of toxic organic compounds [22]. Tubes contained 150 mg Tenax™
TA and 100 mg Carboxen™ 1000, separated by 0.5 cm layer of silanized glass wool. Tenax™
was packed first in direction with respect to He flow when trapping (adsorption). Thermal
desorption was made in the opposite direction. Sorbent tubes were conditioned at 280 °C for 180
min with He stream at 80 ml min-1
prior to its first use. Tubes were checked periodically to assure
a flow rate within ± 5% using Mini-buck calibrator M5 (AP BUCK Inc., FL, USA)
2.2 Liquid standard loading strategies.

Chapter 3
117
In order to distinguish both loading strategies, response factors with the proposed high
temperature procedure is called gas strategy (gas matrix response factor, GRF), while for liquid
strategy is called liquid matrix response factor (LRF)
2.2.1 Gas matrix response factor strategy (GRF).
To establish the interaction of the liquid standards in vapour phase upon sorbent particles by
means of high temperature volatilisation, multimode GC injector (GC, Varian 3900, VARIAN
INC., Palo Alto, USA) was equipped with a homemade steel connector (Figure 1a) as the joining
point between GC inlet and sorbent tubes. Inasmuch as TD unit does the injection of the standards
into capillary column, GC inlet remains free. One µL of final working standard solution (either
C1 or C2) was loaded into the GC inlet by an automated sampler module (CP-8400, VARIAN
INC., Palo Alto, USA) equipped with 10 µL Hamilton 700N series Microliter Syringe (Alltech).
GC inlet heated at 300 ºC assured that solvent and standards were vaporized to gas phase.
Immediately next, vaporized standards were thereby carried by inert gas (He) along sorbent
particles, while GC split valve remained closed. Sorbent tubes were kept at room temperature
during the adsorption process. He stream was set at 25 mL min-1
since maximum pressure
achieved by the inlet was 0.5 psi, assuming that packed TD tubes involve low restrictions to
carrier flow. After seven minutes tubes were removed from the homemade connector,
hermetically closed with long term storage PTFE taps and placed in the thermal desorption unit
(ran at the next section 2.3 specified conditions to calibrate the analytical method). TD tubes were
stored inside a vessel hermetically closed, containing silica gel and charcoal to save sorbent
particles from external interferences.
2.2.2 Liquid matrix response factor strategy (LRF).
One µL of working solution (Figure 1b) was loaded beneath glass wool directly upon sorbent
surface (Tenax™) utilizing 10 µL Hamilton 800N series Microliter Syringe (Alltech™). He
stream at 25 mL min-1
was kept for 7 minutes (in order to adopt identical conditions on both
strategies, as described in section 3.1). A special T-shaped connector (Swagelok™) drove He
flow through sorbent particles, with the main goal to remove the solvent [25, 33]. He flow
outgoing from TD tubes was calibrated by an R-003 model rotameter (Comaquinsa, Spain).
2.2.3 Quality assurance
A second extra TD sorbent tube was connected randomly to the first sampling tube in order to
check potential losses of standards in both loading strategies. Afterwards secondary tubes were
ran at the same specified conditions. No positive identifications were detected either for the liquid
or gas strategies.

J. Sep. Sci. (Submitted)
118
Figure 1. (a) In-home injection set-up diagram. At first step (1), one µl of standard liquid solution is
dropped (loaded) into the inlet liner at 300°C.Standards are volatilized as normal GC injection. Immediately
next (2) He stream carries gas phase standards through the sorbent bed (splitless mode). (b) Diagram of
manual non-heated liquid standard loading strategy. Liquid standard drop is directly loaded inside TD tubes
upon Tenax™ particles.
(a) (b)
2.3 Chromatographic analysis.
Sorbent tubes were thermally desorbed by an automated thermal desorption unit (Turbomatrix
350, PERKIN ELMER, Norwalk, USA) coupled to a gas chromatograph (GC, Varian 3900,
VARIAN INC., Palo Alto, USA) with ion trap mass spectrometer detector (MSD, Saturn 2100,
VARIAN INC., Palo Alto, USA) and. Instrumentation was controlled with Varian Workstation
6.9 software.
Thermal desorption of sorbent tubes was carried out in a two-step mode. In the first step, VOCs
were desorbed from sorbent tubes for 5 min at 225ºC and a flow rate of 80 mL min-1
of He,
carried through a 100 mg Tenax™ TA cryogenic internal trap, cooled at -30 ºC. Thereafter, in the
second step, the trap was desorbed at 280ºC for 1 min with fast heating (900 ºC min-1
). After the
analysis, cryogenic trap was baked at 280ºC for 30 min, to assure complete desorption of the
compounds for the next run. The capillary transfer line to the GC (silica with no stationary phase,
0.32 mm i.d.) was kept at 250ºC. Prior to each use, tubes were conditioned at 280 °C for 60 min
with 80 ml•min-1 He stream to avoid interferences
No organic solvent is required in sample treatment; therefore no solvent delay is needed in the
detection step, allowing monitoring from the first moment. To perform a better peak resolution
He, 25 mL·min-1
Stainless steel
Needle
Septum
Sorbent
T connector

Chapter 3
119
one ultra-thin chromatographic capillary column (150 µm i.d.) was used. Compared to usual 250
µm i.d., chromatographic time is reduced about 40% [32].
Selected column was Varian Factor Four VF-624 (40 m x 0.15 mm x 0.84 µm), with 1 mL min-1
flow rate of He (carrier gas) and 1:1 split injection. Temperature program for VOC analysis was:
initial temperature 35 ºC hold 3 min; 35-100 at 12 ºC min-1
, hold 8 min; 100-120 at 45 ºC min-1
,
hold 7 min; 120-140 at 23 ºC min-1
, hold 5 min; 140-180 at 10 ºC min-1
, hold 0 min. Electronic
ionization (EI) at 70 EV was the ionization mode. MSD was run in full scan mode within a 25-
250 m/z range. Ion trap and GC/MSD interface temperatures were 200 and 240 ºC, respectively.
Compounds were identified on the basis of their retention times (±0.2 min), target and qualifier
ions. Three different m/z ions were selected to integrate each compound.
3. Results and discussion
3.1 Optimisation of high-temperature liquid standard loading strategy onto solid sorbent
particles.
To perform suitable adsorption-desorption process with the aim to have the best gas
chromatographic behaviour, some factors should be considered. First, it is necessary to assure
total adsorption of loaded liquid standards onto sorbet particles. Second, the loaded volume once
vaporized should not exceed inlet volume. Finally, it should be removed the solvent (methanol)
but keeping constant VOCs retention onto adsorbent surface, by means of carrier flow (He)..
Based on these premises, two parameters were optimised, to find maximum VOCs recovery in
combination with highest accuracy: loaded volume and time. Both working solutions (C1 and C2)
were evaluated. Data was acquired by absolute peak area of each standard. Unless stated,
experimental conditions were the same described in section 2.
3.1.1 Effect of loaded volume
Injected volumes over the range 1 to 5 µL were studied of both working solutions C1 (20 mg L-1
)
and C2 (75 mg L-1
). As it would have been expected, integrated area data showed an increasing
effect with volume. However poor average RSDs (15 compounds, n=10) within 20% - 42% were
observed for volumes from 2 µL onward. Many factors might cause large uncertainty in analysis,
such as incomplete retention onto sorbent owing to oversized inlet volume, or incomplete thermal
desorption step due to improper TD conditions. Split discrimination during desorption due to
temporarily increase the split flow relative to the desorb and or column flow [25] can be
considered the principal cause of uncertainty
On the other hand, excellent average RSDs were obtained when loading 1 µL of standard: 3.2%
for 20 mg L-1
and 2.4% for 75 mg L-1
(n=10). These experimental conditions provide reliable

J. Sep. Sci. (Submitted)
120
adsorption-desorption process, presenting some evidences about the complete retention of the
loaded standards. Therefore 1 µL was the volume adopted for further experiments.
3.1.2 Effect of time
As it was stated, it is important that standard-sorbent interactions do not experience significant
interferences or losses while connected to He stream during the solvent elimination step. Since He
stream cannot be set at greater flow than 25 mL min-1
, time is the only factor that can be modified.
Adsorption times from 1 to 15 minutes were examined. One µL of working solutions (C1 or C2)
was loaded. Absolute peak area resulted constant at both concentrations. All 15 VOCs showed
scarce variation below 3% (n=5) on peak area for the whole interval 1 to 15 min. As an exception,
benzene and tetrachloromethane in solution C2 (75 mg L-1
) described somehow a maximum
behaviour at seven minutes (Figure 2). Despite it is probably attributed to random variation, an
adsorption time of 7 minutes was adopted for analysis.
These good results prove that liquid standards vaporized to gas-phase are properly retained onto
sorbent particles, and so adsorption-desorption process is robust and provides reliable data. It also
demonstrates that solvent (methanol) is completely removed prior to GC analysis; therefore
elimination of solvent delay time in MS detector does not represent a risk. It is remarkable that the
strategy was optimized for a specific flow of 25 mL min-1
. Different GCs may have different
limits on flow rates which might affect to adsorption. A guideline and higher working range for
the flow setting could not be evaluated.
Figure 2. Evolution of absolute peak area obtained for four significant compounds (75 mg·L-1
) with time,
using the high-temperature gas matrix strategy.
0,0
2,0
4,0
6,0
8,0
10,0
12,0
14,0
1 3 5 7 9 10 12 15
Pe
ak a
rea
(x1
05 )
Minutes
Tetrachloromethane
Benzene
1,2-dichloroethane
2-butenal

Chapter 3
121
3.2 Effect of standard matrix
The second part of the study had the goal to compare sensitivity of method regarding to standard
matrix. Gas matrix response factor (GRF) were obtained with the proposed new strategy, ran at
optimal conditions stated in section 3.1. Liquid matrix response factors (LRF) were obtained with
the non-heated manual strategy described at section 2.2.2. One µL of working solution C1 (20 mg
L-1
) was loaded and analysed following both strategies. Response factors for 15 selected VOCs
are presented in Table 1, together with average RSD (n=10). For a more comprehensive
discussion, RFs were determined on the basis of two different procedures: first, external standard
procedure (ES), meaning response factor (GRF and LRF) as compound integrated area per ng
loaded; second by and internal standard procedure (IS), presenting relative response factor (RGRF
and RLRF) as the ration of compound integrated area to p-xylene-d10 area per ng loaded.
With our proposed strategy of high temperature vaporisation (Table 1), average GRFs
systematically increase in the range from 1.1-7.2 times response factors obtained with liquid
matrix adsorption (LRF), meaning that the sensitivity of the method is highly improved when
compounds are retained in gas matrix. As example, compounds commonly named BTEX, raised
signal output over 330%, up to 720% in the case of styrene. In addition, extremely high accuracy
is obtained (2.4%), similar to average RSD obtained using IS (2.1%). On the opposite hand, liquid
matrix strategy shows low accuracy, providing individual RSDs above 30%. Following that
procedure, standard’s drop is loaded directly upon a relative small piece of sorbent. That
important feature may cause errors, including breakthrough of the sorbent or poor thermal
desorption step. In that sense, the use of internal standard improves precision over 6 times,
achieving some good 5.2% average RSD. Summarizing results, our developed gas matrix strategy
provides overall improvement over 13 times the liquid matrix accuracy.
Quantitative analyses have been evaluated on the basis of the range of volatilities, calculated as
vapour pressure in Pa at 303 K ([35]). Figure 3 shows response factor ratio between GRF and
LRF (RFRG/L) and vapour pressures for all 15 studied VOCs. No general behaviour correlating
volatility with response factor has been found, thus proving that the increase is not depending on
volatility of VOCs
.

J. Sep. Sci. (Submitted)
122
Table 1. Studied VOCs and vapour pressure (Pa) calculated at 303K. Average sample response factors (GRF, LRF, peak area per ng compound loaded onto sorbent tubes)
and relative standard deviation (RSD (%), n=10) for15 liquid VOCs. Relative response factors ratio (RGRF, RLRF, dimensionless) with IS peak area; Response factor Ratio
(RFR, dimensionless) for GRF/LRF.
Compound
Vapour
Pressure
(Pa) a
Liquid matrix strategy Gas matrix strategy RFR
G/L
ES IS ES IS
LRF RSD (%)
RLRF RSD (%)
GRF RSD (%)
RGRF
RSD
(%)
1,2-dichlorobenzene 265 1547 32.2
0.85 3.7
5805 0.6
0.98 1.8
3.8
1,2-dichloroethane 12632 1469 33.2 0.79 3.0 5645 1.9 0.65 1.5 3.8
2-chlorophenol 415 1100 35.9 0.59 6.5 6306 6.2 1.37 3.8 5.7
Benzene 12030 2130 33.4 1.07 8.7 9542 1.7 1.09 2.0 4.5
Butylaldehyde 16148 553 32.9 0.3 3.3 1457 1.8 0.32 2.7 2.6
Cyclohexanone 806 919 31.4 0.51 3.2 2691 1.9 0.59 1.1 2.9
2-Butenal 222 43.0 0.13 13.2 691 2.6 0.15 3.2 3.1
Styrene 1251 2020 35.2 1.1 2.9 14631 0.4 1.67 1.7 7.2
Ethylbenzene 1689 3672 34.1 2.04 2.0 19569 1.0 2.24 1.4 5.3
Hexylaldehyde 713 603 33.5 0.34 2.8 652 6.8 0.14 2.0 1.1
o-Xylene 1161 3533 32.9 1.96 3.1 11546 0.2 1.95 0.9 3.3
p-Cymene 285 4316 32.5 2.39 2.8 25010 2.6 2.86 1.6 5.8
p-Xylene 1517 3540 34.3 1.98 2.9 11598 0.6 1.96 1.3 3.3
Tetrachloromethane 16353 732 29.3 0.36 15.6 1140 6.1 0.19 3.6 1.6
Toluene 4543 2948 34.2 1.64 4.3 16757 2.1 1.92 2.1 5.7
Average RSD
33.9
5.2
2.4
2.1
4.0b
a Data from [35] at 303K
b Average RFRG/L for the 15 studied compounds.

Chapter 3
123
Table 2. Slopes and determination coefficients of 15 VOCs (four calibration levels including 10, 25, 50, 75 and 100 µg·L-1
, n=4), by internal standard calibration (IS) and
external standard calibration (ES). Limit of detection (LOD) in pg, considered as the absolute standard amount spiked into sorbent tubes in 1 µL standard mixture (dissolved
in methanol).
Compound
Non-Heated liquid matrix
IS
High-temperature gas matrix
ES IS
slope r2 LOD slope r
2 LOD slope r
2 LOD
1,2-dichlorobenzene
0.012 0.995 7.6 8696 0.995 22.4 0.016 0.987 5.7
1,2-dichloroethane
0.011 0.997 1.1 8067 0.980 3.2 0.011 0.995 1.1
2-chlorophenol
0.010 0.996 3.0 864 0.980 75.2 0.020 0.991 1.5
Benzene
0.016 0.991 7.6 151147 0.979 1.7 0.020 0.993 6.1
Butylaldehyde
0.004 0.986 114.1 1640 0.981 594.5 0.005 0.980 91.3
Cyclohexanone
0.006 0.997 20.3 5829 0.980 44.6 0.010 0.993 12.2
2-Butenal
0.002 0.985 121.7 864 0.970 601.9 0.002 0.970 121.7
Styrene
0.020 0.996 4.6 20629 0.971 9.5 0.028 0.990 3.3
Ethylbenzene
0.030 0.996 10.1 29555 0.976 22.0 0.040 0.993 7.6
Hexylaldehyde
0.004 0.979 60.8 2201 0.989 236.3 0.009 0.990 27.0
o-Xylene
0.026 0.997 7.0 15915 0.997 24.5 0.029 0.992 6.3
p-Cymene
0.038 0.997 2.0 36323 0.980 4.5 0.049 0.995 1.6
p-Xylene
0.028 0.987 6.0 16065 0.997 22.3 0.030 0.992 5.6
Tetrachloromethane
0.006 0.990 10.1 1255 0.989 103.6 0.020 0.994 3.0
Toluene
0.025 0.988 1.8 25263 0.977 3.9 0.034 0.993 1.3

J. Sep. Sci. (Submitted)
124
Figure 3. Response factor ratio gas to liquid (RFRG/L, dimensionless) detailed in bars and vapour pressures
detailed in dots, for all 15 selected VOCs.
Our proposed loading strategy enhances adsorption-desorption process of liquid standards so
reinforcing the idea of introducing standards in vapour phase. This discussion goes on the same
direction than recent studies reported on the field. Demeestere et al. [27] concluded systematic
bias from 40-70% for 69 liquid matrix standards compared with gas matrices. Also Kim et al.
concluded similar results [28]. In our study we describe a strategy that systematically improves
response factors for liquid standards (over 10-700%) based on high temperature standard’s
vaporization strategy. Thus systematic bias may be reduced, enabling more reliable models for the
quantification of VOCs in gas samples. At this point some stimulating arguments may turn up,
since wide number of studies in the last years have analysed VOCs in gas samples following
liquid matrix loading strategies. Our proposed set-up offers new possibilities and helps to better
understand VOCs behaviours inside gas samples, also by providing more reliable models on
VOCs quantification.
Demeestere et al. also described average RSD up to 40% (n=5) for 69 compounds, improving a
factor of 5 when using IS calibration, similar to our data. Therefore they strongly recommend the
use of internal standard. With our proposed new set-up, however, response factor is decidedly
increased in combination with an outstanding accuracy improvement. That new feature provides
one extra advantage, since it enhances TD-GC-MS quantification by means of external standard
calibration (instead of the internal standard calibration).
3.3 Evaluation of the performance of the developed strategies
To compare strategies, calibration curves were obtained by plotting the ratios of the GC integrated
areas of each standard to IS vs. the concentrations of the standards (mg L-1
). Owing to high
0
2000
4000
6000
8000
10000
12000
14000
16000
18000
0
1
2
3
4
5
6
7
8
Va
po
r P
ress
ure
(P
a)
RF
R G
/L (
dim
enss
ion
less
)

Chapter 3
125
repeatability of the new loading procedure, extra calibration curve was also estimated following
external calibration procedure (ES) by plotting integrated areas of each standard vs.
concentrations. Five solutions containing the 15 VOCs and IS with relative concentration levels
of 100, 75, 50, 25 and 10 mg L-1
(n=4) were examined (Table 2). Obviously, slopes are sensitively
higher when no IS is used. However, it is appreciated a slight lessening on the linear fit (r2) of
nine among the 15 VOCs when the calibration model is done by external standard procedure. We
assume that a variation on MS output signal - not corrected by IS- adds extra error on the linear
model. This issue can be corrected with the use of appropriate instrument control (ICS) standards,
in order to check MS signal prior to analysis.
Detection limits of the method (LOD, pg) for all compounds (Table 2), were estimated on the
basis of the mean background signal plus three times the standard deviation (LOD = mean blank
+ 3SD) (Table 2). The blanks consisted of 10 packed and preconditioned test tubes (280 °C, 60
min). For IS calibration LOD blank tubes were spiked with 1µL of p-xylene-d10. Values for all
the compounds were within the range 1.1 – 601.9 pg as the absolute standard amount spiked into
sorbent tubes in 1 µL standard mixture (dissolved in methanol). Looking into LOD data, gas
matrix strategy achieves the lowest limits for all 15 VOCs. It is really interesting the fact that
liquid matrix strategy using IS calibration achieves lower detection limits than gas matrix strategy
using ES calibration.
Thus, based on our study where different strategies are compared, it is recommended the use of
internal standard calibration procedure owing to better linear fit together with lower detection
limits. However, external calibration using an appropriate ICS, which compensates random MS
detector deviations, has shown reliable results, and so its potential cannot be underestimated.
4. Conclusions
This paper presents a novel strategy for the calibration procedure of TD-GC-MS methods. It is a
high-temperature procedure that enables a gas matrix interaction between liquid standards and
solid sorbents. With the same principle than normal GC injection, liquid standards are easily
vaporized to gas phase and retained by the solid sorbents Tenax™ TA and Carboxen™ 1000.
This strategy enhances the adsorption-desorption step, providing reliable data owing to a robust
methodology. Two main conclusions can be drawn.
Firstly, the sensitivity of the analytical method is decidedly improved when liquid standards are
vaporized to gas phase. That is exemplified from gas matrix response factors of a set of 15
selected VOCs, rising up from 1.1 to 7 times the liquid matrix response factor. Consequently,
systematic underestimations derived from different matrix effects in the standard-sorbent
interaction are reduced. The sensitivity increase, evaluated based on the range of volatility of

J. Sep. Sci. (Submitted)
126
selected VOCs, does not show a general trend. No solvent (methanol) interferences have been
detected in the proposed methodology.
Secondly, it is not essential to quantify by means of internal standard calibration. Repeatability of
the method when liquid standards are vaporized to gas phase (2.4%-3.2%) is drastically reduced
over 13 times the repeatability of standards adsorbed in liquid phase. Even so, it has been proved
that the use of proper internal standard enables better detection limits of the method in addition
with better linear fit for the 15 selected VOCs. This study provides a plethora of new arguments
for quantification of VOC in gas samples, particularly when a vast number of VOCs wants to be
analysed or no internal standards are available.
This new strategy provides excellent improvements with no extra costs, and by means of an easy
and automated procedure. Therefore some inaccuracy added to the results, owing to analyst’s
manual sample treatment procedures, are also reduced.
Acknowledgements
Authors want to acknowledge the economic support of the Spanish Ministry of Science and
Innovation by the grant BES-2008-003354, and for financial support by the Projects CTQ 2007-
64331 and CTQ 2010-15541.
The financial support of the Consell Insular de Mallorca is also acknowledged.

Chapter 3
127
[1] Dewulf, J., Van Langenhove, H., Trac-Trends Anal. Chem. 2011, 30, 935-936.
[2] Biasioli, F., Yeretzian, C., Märk, T. D., Dewulf, J., Van Langenhove, H., TrAC Trends in
Analytical Chemistry 2011, 30, 1003-1017.
[3] Demeestere, K., Dewulf, J., De Witte, B., Van Langenhove, H., Journal of Chromatography A
2007, 1153, 130-144.
[4] Baltussen, E. B., Cramers, C. C., Sandra, P. S., Analytical and Bioanalytical Chemistry 2002,
373, 3-22.
[5] Nicolle, J., Desauziers, V., Mocho, P., Journal of Chromatography A 2008, 1208, 10-15.
[6] Davoli, E., Gangai, M. L., Morselli, L., Tonelli, D., Chemosphere 2003, 51, 357-368.
[7] Baltussen, E., Sandra, P., David, F., Cramers, C., Journal of Microcolumn Separations 1999,
11, 737-747.
[8] León, V. M., Álvarez, B., Cobollo, M. A., Muñoz, S., Valor, I., Journal of Chromatography A
2003, 999, 91-101.
[9] Chisvert, A., Román, I. P., Vidal, L., Canals, A., Journal of Chromatography A 2009, 1216,
1290-1295.
[10] Xiao, Q., Yu, C., Xing, J., Hu, B., Journal of Chromatography A 2006, 1125, 133-137.
[11] Liu, J.-f., Jiang, G.-b., Chi, Y.-g., Cai, Y.-q., et al., Analytical Chemistry 2003, 75, 5870-
5876.
[12] Chen, S., Peng, H., Wu, D., Guan, Y., Journal of Chromatography A 2010, 1217, 5883-5889.
[13] Sun, S.-H., Xie, J.-P., Xie, F.-W., Zong, Y.-L., Journal of Chromatography A 2008, 1179,
89-95.
[14] Fries, E., Püttmann, W., Analytical and Bioanalytical Chemistry 2006, 386, 1497-1503.
[15] Callejón, R. M., González, A. G., Troncoso, A. M., Morales, M. L., Journal of
Chromatography A 2008, 1204, 93-103.
[16] Lipinski, J., Fresenius' Journal of Analytical Chemistry 2001, 369, 57-62.
[17] Bicchi, C., Cordero, C., Liberto, E., Rubiolo, P., Sgorbini, B., Journal of Chromatography A
2004, 1024, 217-226.
[18] Van Durme, J., Demeestere, K., Dewulf, J., Ronsse, F., et al., Journal of Chromatography A
2007, 1175, 145-153.
[19] Pokorska, O., Dewulf, J., Van Langenhove, H., International Journal of Environmental
Analytical Chemistry 2011, 91, 1206-1217.
[20] Ras, M. R., Borrull, F., Marcé, R. M., TrAC Trends in Analytical Chemistry 2009, 28, 347-
361.
[21] Markes International, 2000.
[22] US-EPA, in: US-EPA (Ed.), Compendium Method TO-17, Washington, DC 1999.
[23] European Environmental Agency, 2006.
[24] International Standardisation Organisation, 2003.

J. Sep. Sci. (Submitted)
128
[25] Martin, N. A., Barber, N. L. A. S., Black, J. K., Lipscombe, R. P., Taig, C. A., Atmospheric
Environment 2007, 41, 7666-7671.
[26] Woolfenden, E., Journal of Chromatography A 2010, 1217, 2685-2694.
[27] Demeestere, K., Dewulf, J., De Roo, K., De Wispelaere, P., Van Langenhove, H., Journal of
Chromatography A 2008, 1186, 348-357.
[28] Kim, K.-H., Anthwal, A., Sohn, J., Heo, G.-S., Microchimica Acta 2010, 170, 83-90.
[29] Ettre, L., Chromatographia 1994, 38, 521-526.
[30] International Union of Pure and Applied Chemistry (IUPAC), 1997.
[31] Zou, S. C., Lee, S. C., Chan, C. Y., Ho, K. F., et al., Chemosphere 2003, 51, 1015-1022.
[32] Rodríguez-Navas, C., Björklund, E., Forteza, R., Cerdà, V., International Journal of
Environmental Analytical Chemistry 2012, 1-16.
[33] Dincer, F., Odabasi, M., Muezzinoglu, A., Journal of Chromatography A 2006, 1122, 222-
229.
[34] Rodriguez-Navas, C., Forteza, R., Cerdà, V., Chemosphere 2012, (accepted for publication).
[35] Weast, R. C., Handbook of data on organic compounds, 1985.

Chapter 3
129
3.1.2 19BVOLATILE ORGANIC COMPOUNDS IN LANDFILL
ODORANT EMISSIONS ON THE ISLAND OF MALLORCA
Landfilling of wastes is still one of the worldwide most frequent disposal manners of solid
wastes. By this practice, thousands of tons are dumped every year in localized areas,
entailing an extremely hazardous risk both for human and environment. Residues may leach
and reach underground water, thus contaminating the aquatic environment, but also volatile
compounds are being constantly released to the ambient air, especially by the degradation
of microorganisms. As it was mentioned in the introduction, transportation and migration of
(organic) pollutants through interconnected environments aggravates the risks.
Municipal solid wastes in Mallorca were partially dumped to open landfills until 2010,
being Son Reus the biggest one in the island. In 2008 over 200.000 tons were dumped in
the Son Reus landfill, summing an overall amount of 2.600.000 tons from 1993 to 2008. As
long as the surface was not covered with any kind of soil, great amounts of gases (landfill
gas or biogas) were systematically emitted to the atmospheric environment of Mallorca. In
this regard, only 1% of the emitted gases are VOCs, being CO2 and CH4 the predominant
components of the biogas, mainly product of microorganisms’ anaerobic degradation of
wastes.
Owing the evident risks posing the landfill upon the atmospheric environment, emission
rates were estimated for 42 different VOCs, including alkanes, aldehydes and ketones,
aromatic compounds, alcohols, chlorinated hydrocarbons, chlorinated aromatic compounds,
terpenes and reduced sulphured compounds (RSC). On the other hand, a correlation
between VOCs composition and odour units (using dynamic olfactometry standard method
EN -13725 by an external ISO certified laboratory) was calculated with the purpose to find a
correlation model enabling identification of odour markers to simplify the expensive and
tedious odour measurements procedures.
Collection of biogas inside Nalophan® bags (whole-air collection) was carried out
following thoroughly EN-13725 standard method, using the “lung procedure” to fill up the
bags. In order to exclusively collect the diffused emission of biogas but not the ambient air, a
special hood was designed in-house. This sampling procedure enabled the estimation of
emission rates both for VOCs concentration and odour units. Collected biogas was
transferred by active sampling to sorbent tubes containing Tenax® TA and Carboxen® 1000
and desorbed thermally with an automated unit. The chromatographic technique applied was
GC-MS with ion trap as analyser.
This study was the first application of a TD-GC-MS methodology in our group for the
analysis of environmental samples. This were the first results of environmental occurrence

Determination of VOCs in the Atmospheric Environment
130
and emission of a wide set of VOCs in the Island of Mallorca. The work was conducted
within the collaboration framework signed by the University of the Balearic Islands, Consell
Insular de Mallorca and the MSW Managing Companies.
The results of this study were published in the International Journal of Environmental
Analytical Chemistry.

Chapter 3
131
ORIGINAL ARTICLE 3.1.2.1


C. Rodríguez- Navas, E. Björklund, R. Forteza, V. Cerdà, Volatile organic compounds
in landfill odorant emissions on the island of Mallorca, International Journal of
Environmental Analytical Chemistry, 92, 1-16 (2012)


Chapter 3
149
3.1.3 20BUSE OF THERMAL DESORPTION-GAS
CHROMATOGRAPHY-MASS SPECTROMETRY (TD-GC-MS)
ON IDENTIFICATION OF ODORANT EMISSION FOCUS BY
VOLATILE ORGANIC COMPOUNDS CHARACTERISATION
During the last decade, the disposal manners of municipal solid wastes (MSWs) in
Mallorca, adopting EU regulations, have been progressively changed from former landfilling
to a combination of incineration, composting processes and bio-methane generation.
Therefore a new set of facilities have been built over the last years in the same industrial
area, being completely operative since 2010.
Under this new MSW processing frame, residues are classified according to its nature
(organic and inorganic wastes) in order to undergo different disposal processes. In
consequence the emission trends of VOCs has been changed, so different mixtures of
VOCs are expected to be emitted to the ambient air depending on the nature of the incoming
residues to each facility.
As it has been mentioned, VOCs are one of the principal group of chemicals regarding
odour impacts, owing their low odour threshold limits. Hence odorant episodes causing
annoyance to inhabited areas surrounding waste landfills or industrial areas are frequent.
Regretfully it is also frequent that local councils never claim responsibilities to the industries
causing the pollution, because it is difficult to identify the odorant emission focuses.
This study presents a suitable TD-GC-MS methodology followed by chemometric pattern
recognition techniques which enable the classification of several different odorant emission
focuses based on the characterisation of VOCs in the air. The five evaluated MSW treatment
plants were: incineration plant, organic fraction classification plant, solar drying plant for
wastewater sludge, and two separated premises of a composting plant for organic residues.
Immision (ambient ) air was periodically collected during seven weeks by active sampling
into sorbent tubes containing Tenax® TA and Carboxen® 1000. The chromatographic
technique was again GC-MS (ion trap analyser) with thermal desorption through an
automated unit Turbomatrix 350. Three atmospheric parameters -temperature, relative
humidity and atmospheric pressure- were recorded in-situ every sampling day.
The analytical methodology was able to identify and quantify 93 different VOCs, including
aromatic compounds, hydrocarbons, terpenes, phenols, aldehydes, ketones, halogenated
compounds (aromatics and hydrocarbons), ethers, furanes, esthers and reduced sulphured
compounds (RSCs). Three atmospheric parameters, temperature, relative humidity and
atmospheric pressure, were recorded in-situ to evaluate potential relation of emitted VOcs
with atmospheric conditions. Principal components analysis (PCA) was carried out with the

Determination of VOCs in the Atmospheric Environment
150
aim to reduce the 96 different variables (93 VOCs concentrations and the atmospheric
parameters) into a lower list of principal components, PCs, independent (orthogonal) and not
containing information owing the aleatory error. By means of the new PCA model, each
individual sample can be classified within the facility of origin. This methodology provides a
useful tool to identify emission focuses when odorant episodes are taking place.
Again, as well as the study published in section 3.2.2, this work was conducted within the
collaboration framework signed by the University of the Balearic Islands, Consell Insular de
Mallorca and the MSW Managing Companies.
The results of this study were published in Chemosphere.

Chapter 3
151
ORIGINAL ARTICLE 3.1.3.1


C. Rodríguez- Navas, R. Forteza, V. Cerdà, Use of thermal desorption – gas
chromatography – mass spectrometry (TD-GC-MS) on identification of odorant
emission focus by volatile organic compounds characterisation, Chemosphere, (2012,
In press),

Chapter 3
165
8BDETERMINATION OF PHARMACEUTICALLY 3.2
ACTIVE COMPOUNDS (PHACs) IN THE AQUATIC
ENVIRONMENT

Determination of PhACs in the Aquatic Environment of Mallorca
166
Contamination of waters resulting from the widespread use of pharmaceuticals has been
identified as a critical environmental issue. After consumption, pharmaceutical compounds
are excreted by humans and animals as parent compounds and/or metabolites and
consequently enter wastewater treatment plants (WWTPs). However, it is well established
that most compounds are not efficiently removed by conventional treatments and therefore
eventually enter the environment [1, 2]. Hundreds of studies have reported the presence of
pharmaceuticals in wastewaters, surface waters, and fresh drinking waters in USA, Australia,
Japan China or European Countries [1, 3, 4]. Few studies also have reported PhACs in
waste leachates [5-7]. In some cases, the presence of pharmaceuticals is studied through
the presence of their metabolites (transformation products, TPs).
Although the potential footprints of many pharmaceuticals on the environment remain
unclear, concerns regarding this issue continue to arise. For example, particular concern has
been raised by the fact that antibiotics released to the environment may cause the
development of increased resistance in naturally occurring bacterial populations [8-10].
Numerous methods have been developed for the determination of PhACs in waters. The
major part of them is multi‐residue analytical methods, which allow simultaneous
determination of structurally diverse classes of compounds. Various techniques use solid‐
phase microextraction (SPME) or stir bar sorptive extraction (SBSE) for extraction of target
analytes. However, solid‐phase extraction (SPE) is currently the technique of choice for the
determination of pharmaceutical compounds in waters [4, 11-14]. Regarding separation
techniques, some authors have reported on methods using derivatization followed by gas
chromatography‐mass spectrometry (GC‐MS) or gas chromatography‐tandem mass
spectrometry (GC‐MS2 or GC-MS/MS). However, due to the high polarity of most
pharmaceuticals and hormones, liquid chromatography‐mass spectrometry (LC‐MS) and
liquid chromatography‐tandem mass spectrometry (LC‐MS‐MS) tend to be the preferred
techniques applied.
In the Island of Mallorca (Mediterranean Sea, Spain), where PhACs are evaluated, one
critical concern arises from the fact that over the 30% of the overall supply of water in
Mallorca comes from treated wastewater for irrigation (not cropland) purposes. Furthermore,
since other 35% of water demand (for human consumption) comes from groundwater
resorvoirs, the re-use of treated wastewater poses the risk of ground contamination,
producing a self-contamination cycle of the natural reservoirs. As long as re-claimed
wastewater is needed to fully supply overall water demand in the Island, this risk must be
evaluated in order to foresee and prevent future dangers.
In this section is presented the study focused on determination of pharmaceutical’s
residues in several different waters samples. A group of 27 PhACs, including antibiotics,

Chapter 3
167
analgesics, anti‐inflammatories, corticosteroids, tranquilizers, anti-hypertensive, β‐blockers,
contraceptives, anxiolytics, diuretics and antiepileptics were the targeted compounds. These
particular compounds were chosen because they are all widely used and have been
reported in the literature as present in wastewaters and environmental waters. The molecular
structures of all of the compounds studied are illustrated in Appendix II.
The study presented used SPE as the extraction technique, which is the technique
adopted because of the wide number of solid sorbents commercially available. Two different
SPE procedures were carried out in the study to extract PhACs from water, according to
Pérez-Carrera et al. optimized procedure [15]. Oasis® HLB and MAX were the selected
sorbents combining their different adsorption features.
The chromatographic technique applied was LC‐MS2, using a triple quadrupole (QqQ)
analyzer. Two different transitions were monitored for each analyte, for the quantification and
corroboration of positive identifications.
The method was applied to evaluate for the first time the presence of the above listed
PhACs in effluents samples from the two principal WWTPs and three municipal solid waste
landfill leachates. One ground water and several marine waters (including natural parks)
where compared to understand environmental pollution pathways followed by the detected
PhACs around the aquatic environment in the Island of Mallorca.
The results of these studies have been submitted as full paper to the Journal Archives of
Environmental Contaminants and Toxicology.

Determination of PhACs in the Aquatic Environment of Mallorca
168
[1] C.G. Daughton, Environmental Toxicology and Chemistry, 28 (2009) 2490-2494.
[2] C.-P. Yu, K.-H. Chu, Chemosphere, 75 (2009) 1281-1286.
[3] US-EPA, in, 2010.
[4] S.D. Richardson, T.A. Ternes, Analytical Chemistry, 83 (2011) 4614-4648.
[5] K.K. Barnes, S.C. Christenson, D.W. Kolpin, M.J. Focazio, E.T. Furlong, S.D. Zaugg, M.T.
Meyer, L.B. Barber, Ground Water Monitoring & Remediation, 24 (2004) 119-126.
[6] T. Eggen, M. Moeder, A. Arukwe, Science of The Total Environment, 408 (2010) 5147-
5157.
[7] P. Buszka, D. Yeskis, D. Kolpin, E. Furlong, S. Zaugg, M. Meyer, Bulletin of
Environmental Contamination and Toxicology, 82 (2009) 653-659.
[8] B. Halling-Sørensen, H.-C.H. Lützhøft, H.R. Andersen, F. Ingerslev, Journal of
Antimicrobial Chemotherapy, 46 (2000) 53-58.
[9] K. Kümmerer, Journal of Environmental Management, 90 (2009) 2354-2366.
[10] P.A. Segura, M. François, C. Gagnon, S. Sauvé, Environ Health Perspect, 117 (2009).
[11] J.M. Conley, S.J. Symes, S.A. Kindelberger, S.M. Richards, Journal of Chromatography
A, 1185 (2008) 206-215.
[12] E. Gracia-Lor, J.V. Sancho, F. Hernández, Journal of Chromatography A, 1217 (2010)
622-632.
[13] E. Van Hoeck, F. Canale, C. Cordero, S. Compernolle, C. Bicchi, P. Sandra, Analytical
and Bioanalytical Chemistry, 393 (2009) 907-919.
[14] B. Kasprzyk-Hordern, R.M. Dinsdale, A.J. Guwy, Journal of Chromatography A, 1161
(2007) 132-145.
[15] E. Pérez-Carrera, M. Hansen, V. León, E. Björklund, K. Krogh, B. Halling-Sørensen, E.
González-Mazo, Analytical and Bioanalytical Chemistry, 398 (2010) 1173-1184.

Chapter 3
169
38BSUBMITTED ARTICLE 3.2.1.1


Chapter 3
171
Pollution pathways of pharmaceutical residues in
the aquatic environment on the island of Mallorca,
Spain
Carlos Rodríguez-Navas1,*
, Erland Björklund2, Søren A Bak
2, Martin Hansen
2, Kristine A. Krogh
2,
Fernando Maya1, Rafael Forteza
1, Víctor Cerdà
1
1Department of Chemistry, Faculty of Sciences, University of the Balearic Islands
Carretera de Valldemosa km 7.5, E-07122 Palma de Mallorca, Spain
2Section of Advanced Drug Analysis, Department of Pharmacy, Faculty of Health and
Medical Sciences, University of Copenhagen, Universitetsparken 2, DK-2100
Copenhagen, Denmark
[email protected] Ph.: +34 971173260, fax: +34 971173426
Keywords: LC-MS/MS, Pharmaceuticals, wastewater, leachate,
pollution pathways, environment.
Abstract
This work determines the principal environmental pollution pathways of pharmaceutical on the
Island of Mallorca (Spain). The evaluation was made on the basis of the quantification of
pharmaceuticals residues by liquid chromatography – tandem mass spectrometry in several
environmental water samples, including waste water treatment plant (WWTPs) effluents, municipal
solid waste (MSW) landfill leachates, ground water and marine water. An overall set of 19
pharmaceuticals has been identified in the environment of the 27 human pharmaceuticals investigated
in this study. WWTPs effluents are the main source of the pharmaceuticals into the aquatic
environment. The data indicate that re-use of treated domestic waste water for irrigation (which
supplies some 30% of the total water demand in Mallorca) contributes to contamination of
groundwater. In addition, leaching from landfills is identified as another possible source of
introduction of pharmaceuticals to ground water aquifers. Finally WWTP effluents ending in the
Mediterranean sea causes pharmaceutical resdues to occur in marine water bodies, primarily highly
urbanized areas.

Arc. Environ. Cont. Toxicol. (Submitted)
172
1. Introduction
Human and veterinary pharmaceuticals as well as personal care products (PPCPs) have been of
great concern the last decade, since they have been considered emerging contaminants (ECs) and their
ecotoxicological effect towards non-targeted organisms are largely unknown (Farré et al., 2008;
Richardson and Ternes, 2011). During this time period, the number of studies presenting data on
environmental occurrence of PPCPs has increased, (Gómez et al., 2006; Gómez et al., 2007; Kuster et
al., 2008; González Alonso et al., 2010; Gracia-Lor et al., 2010; Huerta-Fontela et al., 2010; Pérez-
Carrera et al., 2010), as has the number of reviews (Farré et al., 2008; Giger, 2009; Verlicchi et al.,
2010). Richardson and Ternes recently reviewed a very comprehensive collection of published works,
covering reviews, legislations, occurrence, fate and risk assessment for ECs (Richardson and Ternes,
2011). This has aided in better understanding their environmental behaviour, such as pollutant burden
as well as direct and indirect sources by which they are released into the environment. Several
pathways have been described of how organic compounds, and by extension PPCPs, can be released
into the aquatic environment and aquifer systems (Halling-Sørensen et al., 1998; Díaz-Cruz and
Barceló, 2008; Farré et al., 2008). Most of the published articles concerning pharmaceuticals for
human use deal with aquatic systems, where wastewater commonly are considered the principal
emission source to the environment via excretion of the pharmaceutical either in the prescribed form
or as metabolites.
In general, wastewater treatment plants (WWTPs) are not well-designed to completely remove
pharmaceuticals (Zhou et al., 2009; Murray et al., 2010; Jelić et al., 2012), thus allowing
pharmaceuticals to reach the environment by two different routes: (1) water effluents into the aquatic
environment, and (2) sewage sludge residues into the soil environment (Nieto et al., 2010; Runnqvist
et al., 2010). Pharmaceuticals for veterinary use are commonly released into the environment by
animal’s excretion, either through urine and dung from grassing animals or via manure application in
agriculture (Thiele-Bruhn, 2003; Oppel et al., 2004; Hansen et al., 2011).
Even though, many environmental occurrence studies have been published, there still lack
knowledge on critical issues, such as transformation processes, bioaccumulation, toxicity and
pathways which all strongly influences risk assessment and management. Some studies have described
different degradation processes, including photolysis (Halling-Sørensen et al., 2002; Lam et al., 2003;
Yamamoto et al., 2009), and hydrolysis (Białk-Bielińska et al., 2012) as well as biodegradation by
microorganisms (Benotti and Brownawell, 2009; Kagle et al., 2009; Musson et al., 2010). These
processes do not necessarily remove contaminants, but may transform them into new compounds with
preserved biological activity, which might possess different chemical properties, hence decreasing or
increasing the effects of pollution on the environment (Halling-Sørensen et al., 2000; Celiz et al.,
2009). Concerning bioaccumulation, the uptake of pharmaceuticals has been reported in both
earthworms in the terrestrial environment (Kinney et al., 2008) as well as in fish in the aquatic
Chapter 3
173
environment (Schultz et al., 2011) but much remains to be explored. The large number of
pharmaceuticals prescribed combined with an unknown number of degradation products exposed to
very differing types of environmental matrices, generates a multitude of interactions. Consequently,
pollution pathways might be hard to predict and can only by revealed by determining a multitude of
pollutants in a large variety of environmental compartments which are likely to be connected to one
another.
Discharge of PPCPs into the environment represents a threat for water resources, since all fresh
water sources in industrialized countries are potentially polluted by numerous contaminants (World
Health Organization: Drinking-water Quality Committee, 2011). It might be especially severe in
locations where natural fresh water sources are scarce or insufficient and reclaimed water is needed to
meet the water demands of population, agriculture and industry.
The island of Mallorca (Spain) is the largest of the four Balearic Islands, rather remotely situated in
the Western Mediterranean Sea, with a population of around one million people. Overall, from a
contamination point of view, the Balearic Islands are most likely rather uncontaminated mainly due to
lack of heavy industries and much of the islands are still comparatively pristine. The few studies
conducted reveal a relatively low contamination burden of VOCs, PAHs and chlorinated organic
compounds in air, sediment and marine invertebrates (Simó et al., 1991; Baumard et al., 1998;
Deudero et al., 2007; Rodríguez-Navas et al., 2012; Rodriguez-Navas et al., 2012). These results
indicated that the islands are far from major contamination sources, and that the air and waters of the
Balearic Islands are comparatively pristine. Despite this, there is growing concern for these islands
mainly due to a heavy tourism. Since the 1960ies, the islands have experienced considerable
urbanization and a tourist boom, and today the number of tourists are more than 14 million per year
(Balearic Islands Government. Ministry of Tourism and Sports, 2010). Consequently, there is a rising
environmental pressure in terms of, water shortages which are additionally accentuated by the climate
changes (Essex et al., 2004). Especially, in the summer period when water consumption increases
these shortages become substantial. In order to reduce these constraints on water demand, local
authorities have made substantial efforts since the 1970ies to develop efficient water treatment
processes, which enable a suitable reuse of water, according to new and more restrictive regulations
about reclaimed water quality. Consequently in 2010, 91% of all domestic and industrial wastewater
on Mallorca was treated. Thereby this island was the Spanish location with the highest percentage of
treated water, out of which 40% was reused. The three major sources of water are natural surface
water reservoirs, treated waste water and specific water aquifers corresponding to 35, 35 and 30 %,
respectively. Regarding the treated waste water, this water is only used for irrigation purposes,
including agriculture, city areas and golf courts. Consequently, the aim of the present study was to: (1)
determine the presence of human pharmaceuticals in the aquatic environment on the Island of
Mallorca, (2) identify pathways followed by the pharmaceuticals and (3) evaluate the advisability of
new directives for periodical monitoring to assess the suitability of the water quality. . For this

Arc. Environ. Cont. Toxicol. (Submitted)
174
purpose, water samples from several different locations were collected in April 2011. Locations
studied included WWTP effluents, municipal solid waste (MSW) landfill leachate pools, ground
water, water from marine areas for nature preservation and seawater affected by urban areas.
2. Materials and methods
2.1 Chemicals and standards.
Diclofenac, allopurinol, verapamil, carbamazepine, spironolactone, salbutamol, omeprazole,
atenolol, bendroflumethiazide, diltiazem, furosemide, prednisolone, erythromycin, metoprolol,
citalopram, cimetidine, and diazepam were obtained from Sigma-Aldrich (Steinheim, Germany).
Zopliclone and oxazepam were obtained from Bie and Berntsen (Rodovre, Denmark). Amoxycillin
was obtained from Duchefa (Haarlem, The Netherlands), ramipiril from Sequoia Research Products
(Pangbourne, UK). Terbutalin and penicillin G were purchased from AstraZeneca (Draco, Sweden),
and morphine from Nordisk Droge and Kemikalier (Copenhagen, Denmark). Gestodene was obtained
from Chemos (Regenstauf, Germany). Losartan potassium, amlodipine, and simvastatin were obtained
from Toronto Research Chemicals (Ontario, Canada). Stock solutions of the individual
pharmaceuticals in methanol were prepared at a concentration of 10 mg L−1
and stored at −18°C.
Deuterated internal standards (IS), d10-carbamazepine and d7-atenolol were obtained from CDN
Isotopes (Quebec, Canada).The purity of all analytical standards was above 95%, and deuterated
purity above 98%. Abbreviations, therapeutic use, and most relevant physicochemical properties of the
pharmaceuticals are listed in Table 1. Ammonium acetate (98%) was obtained from KMF (St
Augustin, Germany) and acetic acid (99–100%), aqueous ammonia solution, heptane, ethyl acetate,
methanol and acetone were purchased from Merck (Darmstadt, Germany). Ethylenediaminetriacetic
acid (EDTA) was obtained from Sigma-Aldrich. Ammonium formate, formic acid, acetonitrile, and
water were purchased from Merck. Solid-phase extraction (SPE) was performed with HLB cartridges
(hydrophilic-lipophilic balance, poly(divinylbenzene-co-N-pyrrolidone), 200 mg sorbent, 6 mL
cartridge) and MAX-cartridges (anion exchanger, N-vinylpyrrolidoneand divinylbenzene polymer,
150 mg, 6 mL), purchased from Waters Oasis (Massachusetts, USA). The Vacmastermanifold for the
SPE cartridges was obtained from IST (Glamorgan, UK).
2.2 Sampling campaign.
To better evaluate pharmaceutical transport processes in the aquatic environment, some issues are
prerequisite to know prior to the selection of sampling locations. The different usage of
pharmaceuticals and disposal practices of these, combined with Mallorca’s particular hydrogeological
features, are presumed to be the most determinant factors. A critical issue is that Mallorca’s
hydrogeological context provides the ability to produce large amounts of ground water reservoirs
owing the porous soil characteristics (Mateos-Ruiz and Lopez-Garcia, 2003). Furthermore, since no
Chapter 3
175
rivers (but torrents) are present in Mallorca, reclaimed water from WWTPs effluents is used for
irrigation of farmlands. Finally, there has historically been a tradition of dumping garbage in landfills,
to handle the large amount of waste produced during the touristic season. Based on this information, it
can be hypothesized that pharmaceuticals in Mallorca may be released into groundwater aquifers
through three different pathways: (1) use of reclaimed water for irrigation, (2) application of sewage
sludge as fertilizer (after a 14 days compost storage process) and (3) leaching waste from landfills. In
this context it should be noted that treated waste water from WWTP, which is not for irrigation
purposes, is discharged directly into the sea and may there cause contamination of marine water
bodies.
Several different locations (Figure 1 and Table 2) were sampled from 3-6 April 2011. The first
locations were effluents from the two principal WWTPs in Mallorca (named as Palma I and Palma II),
treating waste water from Palma main city and surrounding areas corresponding to a total of 400,000
inhabitants (Area 1). Two sample aliquots (named a and b) were collected the same day at different
times from each one of the two WWTPs.. The pH range of these four samples was between 7.9 and
8.1. Leachate reservoirs from three municipal solid waste (MSW) landfills were also analysed. One
sample was collected from leachate I (Area 1) while two replicates were collected from leachates II
and III, Area 1 and 2 respectively. The pH range for these five samples was from 8.7 to 9.0. One
aquifer known to be located under the MSW landfill II (and not declared for drinking water) was
sampled to corroborate the possible leach of pharmaceuticals through the soil to the ground water.
Two aliquots named GWa and GWb (Area 2) were taken, both with a pH of 7.2. Eight marine water
samples were also collected (pH ranged from 7.5 to 8.1). At the Palma de Mallorca bay, two different
locations were sampled as close as possible to two different WWTPs effluents discharge tubes (Area
1). Alcudia Bay, the northern area of the Island with the heaviest tourist impact was also sampled
(Area 2). The last marine samples were representative of two natural parks. At Albufera Natural Park
(Area 2), two different locations were sampled: the main water canal and a secondary canal, while at
Mondragó Park (Area 3), two samples were collected at the beach. Finally, two additional tap water
samples (used as quality control samples (QC)) were spiked with a mixed standard solution and an IS
solution, to yield a sample concentration of 1000 ng L-1 of standards and 500 ng L
-1 of IS. All, water
samples were collected in glass bottles thoroughly cleaned with soap, water and ethanol, and dried at
150ºC prior to sampling. Collected volumes varied from 1-3 liters.
2.3 Chemical analysis
Chemical analysis was carried out following a previously validated SPE-LC-ESI-MS/MS method
(Pérez-Carrera et al., 2010). Once in the laboratory and prior to the SPE procedure, the samples were
filtered using Empore™ 0.45 µm porous glass fibre disks, conditioned with 500 mg EDTA per litre of
sample and pH adjusted to 7.0 with acetic acid. Hereafter, the samples were fortified with 500 ng of
each of the internal standards. Samples not immediately extracted were stored in darkness at 4°C for a

Arc. Environ. Cont. Toxicol. (Submitted)
176
maximum of 12 hours prior to SPE.
2.3.1 SPE
Clean-up and pre-concentration were performed using a combination of MAX and HLB cartridges.
Briefly, both cartridges were pre-conditioned with 5 mL heptane, 5 mL ethyl acetate, 5 mL methanol,
and 2×5 mL tap water (pH 7.0 adjusted). A MAX cartridge was then placed on top of the HLB
cartridge with a PTFE adaptor and placed in the SPE manifold vacuum system. The samples were
passed through both cartridges at an approximate flow rate of 5 mL min−1
. Subsequently the HLB and
MAX cartridges were dis-assembled and air-dried for 30 min. Both SPE cartridges were washed with
5 mL heptane. Finally, the MAX cartridge was eluted with 1 mL ethyl acetate, 2 mL methanol, 2 mL
methanol containing 2 % acetic acid, and 2 mL methanol; the HLB cartridge was eluted with 3 mL
ethyl acetate and 4 mL methanol. These two aliquots from MAX and HLB were combined, divided in
two and evaporated to dryness at 60°C and under a gentle stream of nitrogen. Each of the combined
eluates was reconstituted in 200 μL mobile phases A and B from HPLC methods I and II, respectively,
and transferred into two HPLC vials with 300 µL glass inserts. Each sample extraction was analysed in
triplicate.
2.3.2 LC-MS/MS
Analysis of the resulting extracts required two slightly different LC-ESI-MS-MS methods (method
I and method II). HPLC separations in methods I and II were achieved by use of a reversed-phase
column (XTerra MS-C18, 2.1×100 mm, 3.5 μm) and a normal-phase column (Atlantis HILIC,
2.1×100 mm, 2 μm), respectively, from Waters, (Milford, MA, USA) following Pérez-Carrera et al.
procedures (Pérez-Carrera et al., 2010). For both quantification methods, the analytical system
consisted of an Agilent 1100 series HPLC system (Agilent Technologies, Palo Alto, CA, USA),
equipped with a degasser, a cooled autosampler (4°C), and a cooled column oven (13°C). Detection
was performed with a Sciex API 3000 triple-quadrupole mass spectrometer (Applied Biosystems,
Foster City, CA, USA) equipped with an ESI source (Turbo Ion spray). For MS detection, the
instrument was operated in multiple switching modes and by comparing retention times and
substance-specific mass spectra positive identifications were achieved. Precursor ions and product ions
for MS detection in methods I and II are, likewise, listed in the work by Pérez-Carrera et al. (Pérez-
Carrera et al., 2010).Collection and treatment of data were performed using Analyst 1.4 software
(Applied Biosystems) in a Windows XP platform-based data-processing system.
2.4 Quality control and quality assurance
The LC-ESI-MS/MS responses for each of the pharmaceuticals were evaluated for linearity by
means of an internal standard (IS) calibration procedure, as the ratio of the target compound output
area divided by the internal standard output area. Standard solutions of the target pharmaceuticals in
Chapter 3
177
the appropriate mobile phases (depending on method I or II) were evaluated in the range 1–1000 ng
L−1
. Internal standard concentrations were set at 500 ng L−1
(same as the samples). Linear fit for all 27
standards (n= 3) was within 0.938< r2< 0.993, except for omeprazole (OP, Method I) showing a poor
linear fit of 0.886.
Detection limits of the method (LOD, ng L−1
) for all 27 compounds were estimated on the basis of
the mean background signal plus three times the standard deviation (LOD = mean blank + 3SD). The
blanks consisted of 1L tap water run at the same specified conditions. LOD values for all the
compounds were within the range 0.8 – 29.4 ng L−1
.
Owing to the high heterogeneity and complexity of the sample matrices, especially in the case of
leachates and marine samples, and in order to evaluate SPE extraction procedure, two water samples
were spiked with 1000 ng L−1
standard mix solution (with IS): Quality control 1 (QC1), consisting of
tap water; and Quality Control 2 (QC2), consisting of sea water from the Mondragó Natural Park
(Area 3). General recoveries were in the range 25-204 % for all compounds, however, some poor
recoveries were obtained for sea water samples (QC2) by both methods I and II, due to ionic matrix
interferences with the SPE sorbents. Standards showing recovery levels below 25% or above 225%
were discarded for the environmental analysis. Final concentrations of the identified pharmaceuticals
in samples were corrected according to each specific recovery rate. Atenolol and carbamazepine the
pharmaceuticals with deuterated internal standards (d10-CB and d7-AT), achieved absolute recovery
rates within the range 75-124%.
To assess the reliability of the quantification and the SPE procedure, signal output of atenolol
(integrated on the basis of its deuterated standard d7-AT ratio) was analysed by both LC-MS/MS
methods (I and II).Variance between Methods I and II for all sampled locations, estimated as relative
standard deviation (RSD), was within the range 2-8 %.
3. Results and discussion
3.1 Pollution sources and occurrence
Measured concentrations are different for each pharmaceutical due to their varying
physicochemical properties, such as acidity, polarity and water solubility (Farré et al., 2008;
Richardson and Ternes, 2011), combined with the differing nature and complexity of environmental
matrices and the various processes acting upon the compounds such as degradation and sorption
(Luthy et al., 1997). Therefore pharmaceutical behaviour in the aquatic environment might be difficult
to generalize (2011). Yet some overall trends are outlined below.
Fresh and ground water
The concentrations obtained for each compound in the analysed fresh water samples (ng L-1) are
presented in Table 3. The results from the WWTPs effluents (Palma I and Palma II, Area 1) revealed a

Arc. Environ. Cont. Toxicol. (Submitted)
178
positive identification of 19 pharmaceuticals. Small variations in concentrations were observed for
WWTPs effluents collected at the same day at the same site (samples a and b). A total of 12 different
pharmaceuticals were identified in the three different landfill leachates (Leach I-III); 10
pharmaceuticals in leachates I and II (Area 1), and 6 in leachate III (Area 2). Finally, 7
pharmaceuticals were identified in the ground water samples (GW, Area 2).
As expected the highest levels for most pharmaceuticals were found in the WWTP effluents. Total
concentrations were estimated as the sum of all identified pharmaceuticals concentrations per sample.
On average, Palma I WWTP showed a total mass concentration of ~37000 ng L-1 which is 6 times
higher than Palma II WWTP of ~6500 ng L-1. It should be stressed though that the major part of this
difference is caused by the high concentration observed for omeprazol. This difference between the
two WWTPs might also be explained by the fact that WWTP II has an extra depuration step than
WWTP I, but also due to the different origin of incoming municipal wastewater to each WWTP.
In Palma I effluent, omeprazole was the most prominent pharmaceutical, accounting for up to 83%
of the total mass of monitored pharmaceuticals, followed by atenolol, oxazepam, erythromycin,
morphine, diclofenac, amoxicillin, furosemide, salbutamol and carbamazepine. In Palma II effluent, a
fairly similar pattern was observed with oxazepam showing the highest concentration corresponding to
79% of the total measured pharmaceutical burden. Thereafter, in order of descending concentrations,
carbamazepine, atenolol, amoxicillin, salbutamol, gestodene, diclofenac, erythromycin, diazepam and
diltiazem were determined. Individual and total levels are in fairly good agreement with WWTPs
effluent data previously reported (Murray et al., 2010).
Relatively high concentration levels were also found in leachates, ranging from c.2500 ng L-1 in
leachate II and III and up to around 27000 ng L-1 in leachate I. In leachate I, omeprazole corresponded
to over 90% of the total concentration followed by amoxicillin, gestodene, morphine, carbamazepine
and terbutalin. For leachate II and leachate III b, omeprazole was the most and the second most
abundant contaminants. The overall contamination patterns were also quite similar to leachate I.
Leachate III b deviated to some extent, since a high concentration of furosemide was identified in this
sample along with a low level of penicillin G. The reason for this observation is not obvious, but could
not be neglected since the compounds were positively identified also after repeated injections. All
together the leachate data indicates that pharmaceuticals most likely are dumped into MSW landfills
from where they might be transported to the environment. It should be pointed out that these data are
among the first analyses performed directly on landfill leachate pools, and to the best of our
knowledge we could not identify other studies (determining the same compounds) to compare with.
Only the most persistent carbamazepine was recently reported over 10 ng L-1 (Eggen et al., 2010).
Four compounds could be quantified in both ground water samples (gestodene, omeprazole,
cimetidine and carbamazepine) giving a total concentration of around 350 ng L-1. This demonstrates
that pharmaceuticals may reach ground water aquifers on Mallorca.

Chapter 3
179
Marine water
Trace levels of pharmaceuticals were found in nearly all marine samples (Table 4). The Palma Bay
I harbour sample showed the highest number of identified compounds probably because of its
closeness (~50 meters) to the Palma I WWTP effluent discharge position (Area 1). These included for
example atenolol, gestodene, allopurinol, cimetidine and diltiazem. The Palma Bay II beach sample,
on the other hand, did not contain quantifiable amounts of pharmaceuticals despite being sampled
close to the expected outlet of WWTP Palma II (Area 1). The Alcudia Bay sample taken in this
massive touristic area of Alcudia only allowed for the quantification of allopurinol (Area 2).
Interestingly the Albufera Natural Park (Area 2) also contained trace levels of a few pharmaceuticals
(gestoden, furosemid and allopurinol) might be explained by the re-use of reclaimed water for
irrigation migrating via run-off to this wet-land area. Only the samples collected in Mondragó Natural
Park (Area 3) showed no traces of pharmaceutical contamination. This is probably caused by
Mondragó being far from densely populated areas, including both inhabitants and touristic locations in
contrast to the Albufera Natural Park, Figure 1. Unfortunately, SPE procedure provided bad recoveries
for omeprazole; therefore it could not be measured in marine water.
3.2 Pollution pathways
Based on the occurrence of pharmaceutical in the aquatic environment of Mallorca, available
bibliography on pharmaceuticals reported during the last years and the starting premises stated in
section 3.1, some general conclusions on pollution pathways can be drawn.
From WWTPs to sea
The occurrence of pollutants in the marine water is most likely caused by WWTPs effluents
discharge in the sea (Area 1), since the two biggest WWTPs discharge the non-used reclaimed water
into the Palma Bay. That explains the slightly higher concentrations found in Palma Bay than in
marine waters on the rest of the Island (Area 2 and 3). A majority of the pharmaceuticals eluting from
the WWTPs could not be detected in the marine water. This could be caused by several mechanisms
such as degradation and dilution once entering the sea. In all, five pharmaceuticals could be quantified
in both Palma I WWTP effluent as well as in the Palma Bay I harbour water. The decreases in
concentration of these compounds are shown in Figure 2. On average a 50-fold reduction is seen 50 m
from the outlet source of Palma I WWTP meaning. It should however be stressed that little is known
about effects on marine organisms after long-term exposure to minute levels of pharmaceuticals,
constantly entering the sea. The low levels observed in the Alcudia Bay sample are very welcome
from a touristic point of view since this indicates clean water in Area 2. Still there is a chance that the
low levels were found because the samples were taken outside the major touristic season (April) or too
far away from emission sources, as we could not identify where waste water effluents entered the sea.
Concerning the occurrence of pharmaceuticals in the Natural Park of Albufera, there are no clear

Arc. Environ. Cont. Toxicol. (Submitted)
180
evidences on the emission source of PPCPs. It may be speculated that they enter via reclaimed water
used for irrigation or intrusion of polluted marine water.
From leachate and irrigation to ground water
The presence of pharmaceutical residues in the ground water reservoir might be connected to
downward transport to the aquifer from MSV landfill Leachate III (Area 3), which is situated right
above the sampled ground water. As seen in Figure 3, gestodene, omeprazole and amoxycilin were
present in 4-17 times higher concentrations in Leachate III than groundwater. However, the re-use of
reclaimed water might also be a potential source. Looking at the concentrations of gestodene in Palma
I and II WWTP effluents, the concentrations are a factor 10 lower though, meaning that irrigation
possibly is less important for this compound. For omeprazole the situation is quite different since the
omeprazole concentration varied greatly in Palma I and II WWTP effluents ranging from 360-38000
ng/L. Consequently, agricultural activities might have contributed to the occurrence of this compound
in ground water. Finally, amoxycilin is also present in relatively high concentrations in WWTP
effluent water (39-283 ng/L) and might therefore also cause leaking to groundwater during irrigation
with treated water. Three compounds identified in the leachate III (penicillin G, furosemide and
salbutamol), however were not detected in the groundwater. From Table 3 and 4 it is also clear that
these compounds are present in WWTP effluents, yet are not detected in marine samples at the
discharge point indicating a poor transport or survival to both ground water and sea. The situation is
somewhat different for cimetidine and carbamazepine which both were detected in groundwater, while
not in leachate (Figure 3). A plausible explanation to this situation is transport via irrigation of re-
claimed waste water. Both compounds were found in WWTP effluent water as well as in detectable
amounts at the discharge points in the sea. Carbamazepine belongs to a group of compounds that have
been reported as very persistent (Murray et al., 2010; Richardson and Ternes, 2011; Jelić et al., 2012)
and could possibly leach. Overall the results from WWTP effluents and leachate open up for various
pollution pathways in Mallorca including both the re-use of reclaimed water for irrigation and leaching
from MSW landfill sites.
3.3 Implications for the island of Mallorca
Detection of pharmaceutical residues in the ground water is especially worrying since this indicates
that other aquifers also might be polluted. Unfortunately there are no clear evidences on whether these
levels represent a risk for human health or not, according to risk assessment studies made the last few
years (Murray et al., 2010). The World Health Organisation (WHO) published a comprehensive report
regarding drinking water risk assessment in 2011 (World Health Organization: Drinking-water Quality
Committee, 2011). In the report, it was concluded that trace quantities of pharmaceuticals in drinking-
water are very unlikely to pose risks for human health; notwithstanding, the conclusions are made on
the basis of estimated acceptable daily intakes (ADI) and minimum therapeutic doses (MTD) to

Chapter 3
181
broadly assess and screen risks. These estimations may depend on many factors such as limited
occurrence data available for pharmaceuticals in drinking water, the diverse range of pharmaceuticals
in use, the wide variation in the use of individual pharmaceuticals between countries, the limited
number of data in the public domain and technical limitations relating to assessing risks from chronic
exposure to low-dose of pharmaceutical compounds.
Concerning the MSW landfill leachates, to the best of our knowledge this is one of the first
analyses made on occurrence of pharmaceuticals directly in an open pool of collected leachate water.
Landfill disposal represents a threat for the environment, since many pollutants may leach towards the
soil or ground aquifers. The presented data provides new evidences regarding the risk that entails the
disposal of pharmaceuticals into landfills, and by extension many other pollutants, which might leach
towards groundwater aquifers on Mallorca. Landfill leaching plumes have been reported during the
last decade as important emission sources of all kind of organic environmental contaminants (Holm et
al., 1995; Schwarzbauer et al., 2002; Barnes et al., 2004; Heim et al., 2004; Buszka et al., 2009), with
the identification of more than one hundred organics. Therefore efficient landfills must be constructed
in order to prevent and reduce environmental leaching. In Europe, landfills must be constructed
according to current European regulation 1999/31/EC on the landfill of waste (European
Environmental Agency, 1999). This regulation establishes the way in which leachate
drainage must be diverted towards secure and not permeable reservoirs. Landfills in Mallorca
are constructed according to this legislation, yet may not be completely sufficient to remove
all pollutants as demonstrated by our measurements.
The situation on Mallorca is quite delicate since it is demonstrated that the water environment
on Mallorca contains several pharmaceutical residues at the ppb levels, through the re-use of WWTPs
effluents and landfill’s leach. At the same time, due to insufficient natural fresh water reservoirs
combined with heavy water restrictions owing to tourism, it is unconditionally necessary to re-use
water to completely supply overall demand. In this context it should be noted that in a study by
Adrover et al. (Adrover et al., 2012) analysing soils irrigated with reclaimed water it could be
concluded that such practices did not significantly alter 20 chemical properties of Mallorca’s
soils.
Still re-using water may potentially become hazardous in the future, as the population slowly is
polluting its own drinkable water aquifers. Extra stress is also put on water resources by heavy
tourism, yet tourism is one of the main incomes for this island meaning that new sustainable solution
to water management must be provided. Environmental impact and human risk evaluations concerning
pharmaceuticals are currently scarce and far from conclusive. It seems mandatory to develop
appropriate measures to prevent contamination by means of efficient waste treatment and disposal
processes for all emerging contaminants processes in order to avoid the pollution of available
drinkable aquifers and the aquatic environment. Future activities should also include a monitoring
Arc. Environ. Cont. Toxicol. (Submitted)
182
programme of water bodies on the island of Mallorca.
4. Conclusions
Pharmaceutical residues have for the first time been determined in environmental samples on the
island of Mallorca to evaluate their environmental impact. Effluent from waste water treatment plants
showed the highest total concentration levels, up to 46,180 ng L-1, including 19 identified compounds.
This study is one of the first quantifying pharmaceuticals in landfill leaching water, revealing total
concentrations between 5,000-25,000 ng L-1. A total of 12 compounds were identified in the leachates.
Some pharmaceuticals have been identified also in a ground water aquifer, with a total concentration
of 300-400 ng L-1 levels. Additionally, some persistent pharmaceuticals were also identified in the sea
samples, at very low levels. This study gives new knowledge concerning the pollution pathways followed by
pharmaceuticals on the Island of Mallorca. Since treated domestic waste water represents one of the principal
water supplies, there is a risk on water self-contamination owing to a reintroduction of pollutants in the water
aquifers and agriculture. More comprehensive evaluations are needed in order to meliorate disposal processes
mainly through more efficient wastewater treatments, until we better understand the behaviour of
pharmaceuticals and other ECs once they reach the environment. We believe the appropriate goal of ECs
evaluations should be to demonstrate the necessity to reinforce local regulations in order to stop releasing ECs
and improve waste management systems.
Acknowledgements
The authors want to acknowledge the economic support from the Spanish Ministry of Science and
Innovation by the pre-doctoral grant BES-2008-003354 and by the Project CTQ 2010-15541, as well
as the economic support from the Balearic Islands Government.
The kind collaboration of all personnel at the Waste Management Companies involved in this work
is sincerely acknowledged.
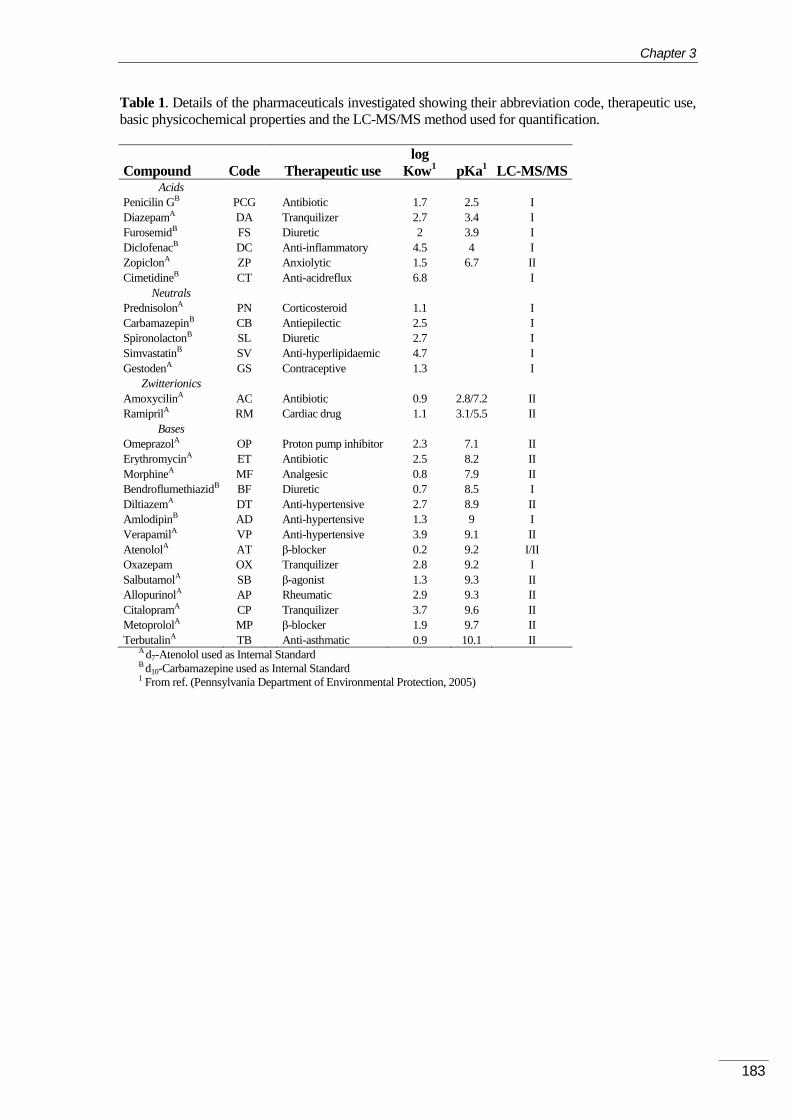
Chapter 3
183
Table 1. Details of the pharmaceuticals investigated showing their abbreviation code, therapeutic use,
basic physicochemical properties and the LC-MS/MS method used for quantification.
Compound Code Therapeutic use
log
Kow1 pKa
1 LC-MS/MS
Acids
Penicilin GB PCG
Antibiotic 1.7 2.5 I
DiazepamA DA
Tranquilizer 2.7 3.4 I
FurosemidB FS
Diuretic 2 3.9 I
DiclofenacB DC
Anti-inflammatory 4.5 4 I
ZopiclonA ZP
Anxiolytic 1.5 6.7 II
CimetidineB CT
Anti-acidreflux 6.8
I
Neutrals
PrednisolonA PN
Corticosteroid 1.1
I
CarbamazepinB CB
Antiepilectic 2.5
I
SpironolactonB SL
Diuretic 2.7
I
SimvastatinB SV
Anti-hyperlipidaemic 4.7
I
GestodenA GS
Contraceptive 1.3
I
Zwitterionics
AmoxycilinA AC
Antibiotic 0.9 2.8/7.2 II
RamiprilA RM
Cardiac drug 1.1 3.1/5.5 II
Bases
OmeprazolA OP
Proton pump inhibitor 2.3 7.1 II
ErythromycinA ET
Antibiotic 2.5 8.2 II
MorphineA MF
Analgesic 0.8 7.9 II
BendroflumethiazidB BF
Diuretic 0.7 8.5 I
DiltiazemA DT
Anti-hypertensive 2.7 8.9 II
AmlodipinB AD
Anti-hypertensive 1.3 9 I
VerapamilA VP
Anti-hypertensive 3.9 9.1 II
AtenololA AT
β-blocker 0.2 9.2 I/II
Oxazepam OX
Tranquilizer 2.8 9.2 I
SalbutamolA SB
β-agonist 1.3 9.3 II
AllopurinolA AP
Rheumatic 2.9 9.3 II
CitalopramA CP
Tranquilizer 3.7 9.6 II
MetoprololA MP
β-blocker 1.9 9.7 II
TerbutalinA TB
Anti-asthmatic 0.9 10.1 II A d7-Atenolol used as Internal Standard B d10-Carbamazepine used as Internal Standard
1 From ref. (Pennsylvania Department of Environmental Protection, 2005)

Arc. Environ. Cont. Toxicol. (Submitted)
184
Table 2. Description of sample type, sampling area and pH. Detailed information of sampling
areas is given in Figure 1.
Sample Origin Sampling area pH
Fresh water
Blank Tap water, University 1 6.6
QC1 Tap water, University 1 6.6
Palma I a WWTP effluent 1 7.9
Palma I b WWTP effluent 1 7.9
Palma II a WWTP effluent 1 8.0
Palma II b WWTP effluent 1 8.1
Leachate I MSW landfill leachate 1 9.0
Leachate II a MSW landfill leachate 1 8.7
Leachate II b MSW landfill leachate 1 8.7
Leachate III a MSW landfill leachate 2 8.9
Leachate III b MSW landfill leachate 2 8.8
Groundwater a Non potable aquifer 2 7.2
Groundwater b Non potable aquifer 2 7.2
Marine water
QC2 Mondragó beach 3 8.1
Palma Bay I Harbour 1 7.5
Palma Bay II Beach 1 8.0
Alcudia Bay Beach 2 8.1
Albufera Park I Main canal 2 8.0
Albufera Park II Secondary canal 2 8.1
Mondragó a Beach 3 8.0
Mondragó b Beach 3 7.9

Chapter 3
185
Table 3. Average pharmaceuticals concentrations, in ng L-1
for each compound in water. Waste water treatment plants I and II (Palma I and Palma II),
municipal solid waste landfill leachates I, II and III (Leach I, Leach II and Leach III), and ground water (GW). Total concentration is estimated as the sum of all
identified pharmaceuticals in the same sample. Compounds not identified are indicated by a dash line. Identified compounds with concentrations below the limit
of quantification are described by <LOQ.
Compound Palma I a Palma I b Palma II a Palma II b Leach I Leach II a Leach II b Leach III a Leach III b GW a GW b
Atenolol 2048 2030 224 225 - - - - - - -
Cimetidine 55 115 7 9 - - - - - 44 64
Penicillin G <LOQ <LOQ - - - - - 160 - - -
Furosemide 266 220 - - - - - 3840 - - -
Prednisolone - - - - - - - - - - -
Carbamazepine 185 180 249 247 52 123 122 - - 19 21
Amlodipine - - - - - - - - - - -
Oxazepam 1365 858 3817 5617 - - - - - - -
Bendroflumethiazide - - - - - - - - - - -
Gestodene 32 37 82 54 490 1020 1037 581 871 180 169
Diazepam <LOQ <LOQ 19 18 - - - - - - -
Diclofenac 271 298 79 52 - 22 40 - - - -
Spironolactone - - - - - - - - - - -
Simvastatine 12 19 - - - - - - - - -
Omeprazole 38514 19398 515 360 25126 998 2597 479 1403 65 138
Ramipril - - - - - - - - - <LOQ <LOQ
Diltiazem 164 115 14 18 - - - - - - -
Metoprolol - - - - - - - - - - -
Terbutaline 63 39 - 4 49 <LOQ - - - - -
Zopiclone <LOQ <LOQ <LOQ - 13 - - - - <LOQ -
Salbutamol 234 152 93 58 <LOQ 25 38 - 91 - -
Erytromicin 57 1202 - 49 - - - - - - -
Atenolol 2157 2269 240 219 - 234 237 - - - -
Morphine 522 418 4 4 70 - - <LOQ - - -
Amoxyciline 237 283 39 147 1519 <LOQ 92 <LOQ 89 <LOQ 5
TOTAL 46180 27631 5381 7082 27319 2422 4162 5060 2455 307 397
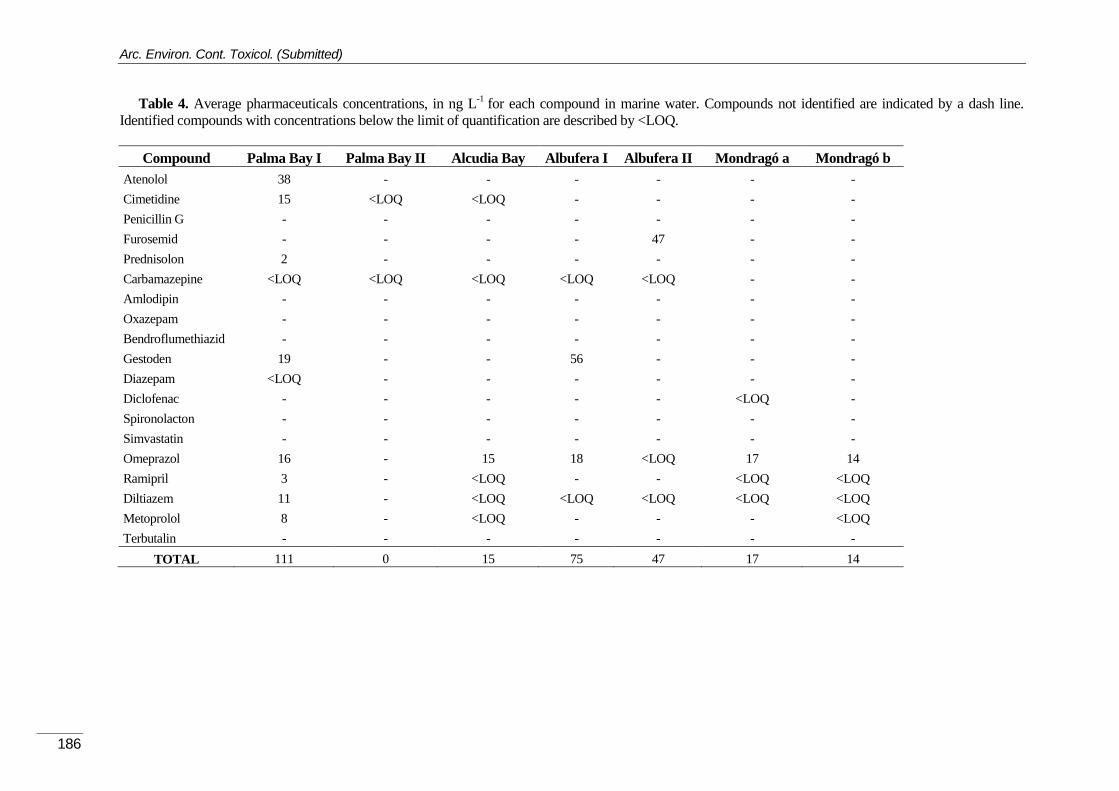
Arc. Environ. Cont. Toxicol. (Submitted)
186
Table 4. Average pharmaceuticals concentrations, in ng L-1
for each compound in marine water. Compounds not identified are indicated by a dash line.
Identified compounds with concentrations below the limit of quantification are described by <LOQ.
Compound Palma Bay I Palma Bay II Alcudia Bay Albufera I Albufera II Mondragó a Mondragó b
Atenolol 38 - - - - - -
Cimetidine 15 <LOQ <LOQ - - - -
Penicillin G - - - - - - -
Furosemid - - - - 47 - -
Prednisolon 2 - - - - - -
Carbamazepine <LOQ <LOQ <LOQ <LOQ <LOQ - -
Amlodipin - - - - - - -
Oxazepam - - - - - - -
Bendroflumethiazid - - - - - - -
Gestoden 19 - - 56 - - -
Diazepam <LOQ - - - - - -
Diclofenac - - - - - <LOQ -
Spironolacton - - - - - - -
Simvastatin - - - - - - -
Omeprazol 16 - 15 18 <LOQ 17 14
Ramipril 3 - <LOQ - - <LOQ <LOQ
Diltiazem 11 - <LOQ <LOQ <LOQ <LOQ <LOQ
Metoprolol 8 - <LOQ - - - <LOQ
Terbutalin - - - - - - -
TOTAL 111 0 15 75 47 17 14
Chapter 3
187
List of Captions:
Figure 1. Geophysical map of the island of Mallorca Island, Spain, Western Mediterranean Sea.
Sampled areas are shown in the map inside dashed circles.
Figure 2. Concentration of pharmaceuticals measured both in the Palma I WWTP effluent samples
and the Palma Bay I harbour samples located 50 m from the effluent discharge point in the harbour
(Area 1).
Figure 3. Concentration of pharmaceuticals measured in the Leachate III and the Groundwater
(Area 3).
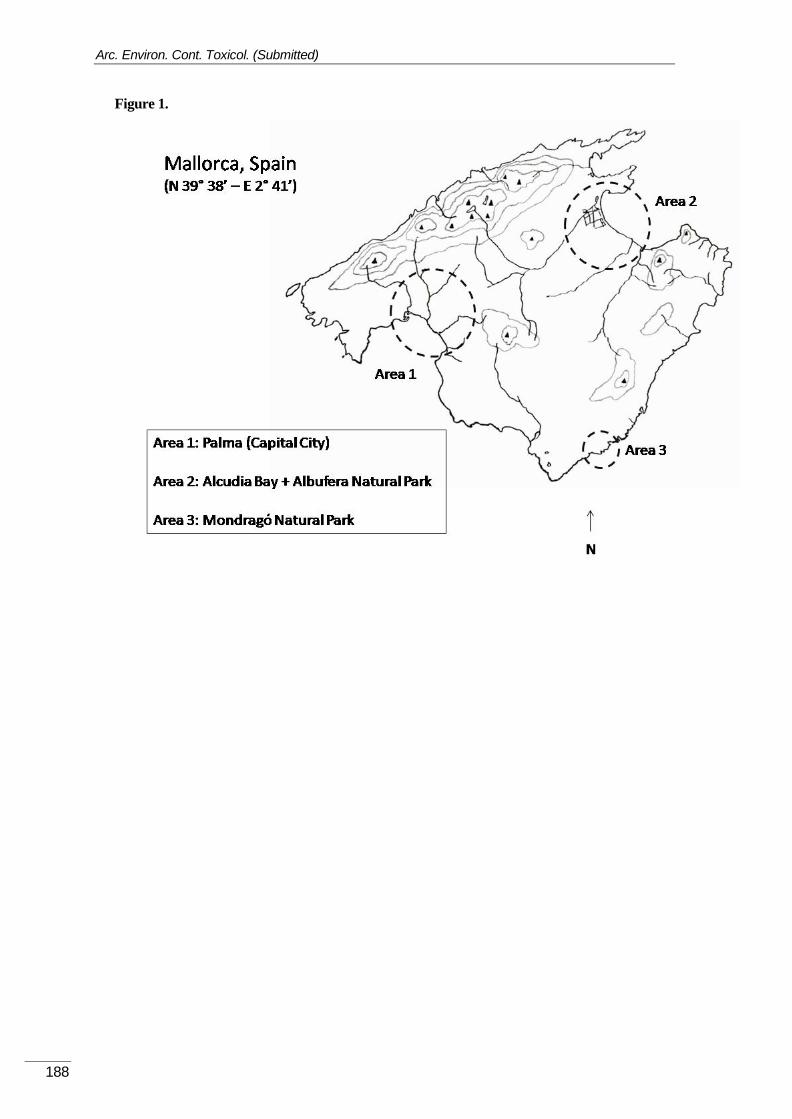
Arc. Environ. Cont. Toxicol. (Submitted)
188
Figure 1.

Chapter 3
189
Figure 2.
Figure 3.
0
1
10
100
1000
10000
Co
nce
ntr
atio
n (n
g/L
)Palma I - WWTP
Palma Bay I - Harbour
0,1
1
10
100
1000
10000
Co
nce
ntr
atio
n (n
g/L
)
Leachate III
Ground water

Arc. Environ. Cont. Toxicol. (Submitted)
190
REFERENCES
Adrover, M., Farrús, E., Moyà, G., Vadell, J., (2012). Chemical properties and biological activity in soils of
Mallorca following twenty years of treated wastewater irrigation. Journal of Environmental Management 95,
Supplement, S188-S192.
Balearic Islands Government. Ministry of Tourism and Sports, 2010. Tourism in the Balearic Islands. Annual
Report.
Barnes, K.K., Christenson, S.C., Kolpin, D.W., Focazio, M.J., Furlong, E.T., Zaugg, S.D., Meyer, M.T.,
Barber, L.B., (2004). Pharmaceuticals and Other Organic Waste Water Contaminants Within a Leachate Plume
Downgradient of a Municipal Landfill. Ground Water Monitoring & Remediation 24, 119-126.
Baumard, P., Budzinski, H., Garrigues, P., (1998). Polycyclic aromatic hydrocarbons in sediments and
mussels of the western Mediterranean sea. Environmental Toxicology and Chemistry 17, 765-776.
Benotti, M.J., Brownawell, B.J., (2009). Microbial degradation of pharmaceuticals in estuarine and coastal
seawater. Environmental Pollution 157, 994-1002.
Białk-Bielińska, A., Stolte, S., Matzke, M., Fabiańska, A., Maszkowska, J., Kołodziejska, M., Liberek, B.,
Stepnowski, P., Kumirska, J., (2012). Hydrolysis of sulphonamides in aqueous solutions. Journal of Hazardous
Materials 221–222, 264-274.
Buszka, P., Yeskis, D., Kolpin, D., Furlong, E., Zaugg, S., Meyer, M., (2009). Waste-Indicator and
Pharmaceutical Compounds in Landfill-Leachate-Affected Ground Water near Elkhart, Indiana, 2000–2002.
Bulletin of Environmental Contamination and Toxicology 82, 653-659.
Celiz, M.D., Tso, J., Aga, D.S., (2009). Pharmaceutical metabolites in the environment: Analytical challenges
and ecological risks. Environmental Toxicology and Chemistry 28, 2473-2484.
Deudero, S., Box, A., March, D., Valencia, J.M., Grau, A.M., Tintore, J., Calvo, M., Caixach, J., (2007).
Organic compounds temporal trends at some invertebrate species from the Balearics, Western Mediterranean.
Chemosphere 68, 1650-1659.
Díaz-Cruz, M.S., Barceló, D., (2008). Trace organic chemicals contamination in ground water recharge.
Chemosphere 72, 333-342.
Eggen, T., Moeder, M., Arukwe, A., (2010). Municipal landfill leachates: A significant source for new and
emerging pollutants. Science of The Total Environment 408, 5147-5157.
Essex, S., Kent, M., Newnham, R., (2004). Tourism Development in Mallorca: Is Water Supply a Constraint?
Journal of Sustainable Tourism 12, 4-28.
European Environmental Agency, 1999. Council Directive 1999/31/EC of 26 April 1999 on the landfill of
waste.
Farré, M.l., Pérez, S., Kantiani, L., Barceló, D., (2008). Fate and toxicity of emerging pollutants, their
metabolites and transformation products in the aquatic environment. Trends in Analytical Chemistry 27, 991-
1007.
Giger, W., (2009). Hydrophilic and amphiphilic water pollutants: using advanced analytical methods for
classic and emerging contaminants. Analytical and Bioanalytical Chemistry 393, 37-44.
Gómez, M.J., Martínez Bueno, M.J., Lacorte, S., Fernández-Alba, A.R., Agüera, A., (2007). Pilot survey
monitoring pharmaceuticals and related compounds in a sewage treatment plant located on the Mediterranean
coast. Chemosphere 66, 993-1002.
Gómez, M.J., Petrović, M., Fernández-Alba, A.R., Barceló, D., (2006). Determination of pharmaceuticals of
various therapeutic classes by solid-phase extraction and liquid chromatography–tandem mass spectrometry
analysis in hospital effluent wastewaters. Journal of Chromatography A 1114, 224-233.

Chapter 3
191
González Alonso, S., Catalá, M., Maroto, R.R., Gil, J.L.R., de Miguel, Á.G., Valcárcel, Y., (2010). Pollution
by psychoactive pharmaceuticals in the Rivers of Madrid metropolitan area (Spain). Environment International
36, 195-201.
Gracia-Lor, E., Sancho, J.V., Hernández, F., (2010). Simultaneous determination of acidic, neutral and basic
pharmaceuticals in urban wastewater by ultra high-pressure liquid chromatography-tandem mass spectrometry.
Journal of Chromatography A 1217, 622-632.
Halling-Sørensen, B., Lützhøft, H.-C.H., Andersen, H.R., Ingerslev, F., (2000). Environmental risk
assessment of antibiotics: comparison of mecillinam, trimethoprim and ciprofloxacin. Journal of Antimicrobial
Chemotherapy 46, 53-58.
Halling-Sørensen, B., Nors Nielsen, S., Lanzky, P.F., Ingerslev, F., Holten Lützhøft, H.C., Jørgensen, S.E.,
(1998). Occurrence, fate and effects of pharmaceutical substances in the environment- A review. Chemosphere
36, 357-393.
Halling-Sørensen, B., Sengeløv, G., Tjørnelund, J., (2002). Toxicity of Tetracyclines and Tetracycline
Degradation Products to Environmentally Relevant Bacteria, Including Selected Tetracycline-Resistant Bacteria.
Archives of Environmental Contamination and Toxicology 42, 263-271.
Hansen, M., Krogh, K.A., Halling-Sorensen, B., Bjorklund, E., (2011). Determination of ten steroid
hormones in animal waste manure and agricultural soil using inverse and integrated clean-up pressurized liquid
extraction and gas chromatography-tandem mass spectrometry. Analytical Methods 3, 1087-1095.
Heim, S., Schwarzbauer, J., Littke, R., (2004). Monitoring of waste deposit derived groundwater
contamination with organic tracers. Environmental Chemistry Letters 2, 21-25.
Holm, J.V., Ruegge, K., Bjerg, P.L., Christensen, T.H., (1995). Occurrence and Distribution of
Pharmaceutical Organic Compounds in the Groundwater Downgradient of a Landfill (Grindsted, Denmark).
Environmental Science & Technology 29, 1415-1420.
Huerta-Fontela, M., Galceran, M.T., Ventura, F., (2010). Fast liquid chromatography–quadrupole-linear ion
trap mass spectrometry for the analysis of pharmaceuticals and hormones in water resources. Journal of
Chromatography A 1217, 4212-4222.
Jelić, A., Petrović, M., Barceló, D., 2012. Pharmaceuticals in Drinking Water Springer Berlin / Heidelberg,
pp. 1-24.
Kagle, J., Porter, A.W., Murdoch, R.W., Rivera-Cancel, G., Hay, A.G., 2009. Biodegradation of
Pharmaceutical and Personal Care Products. in: Laskin, A.I. (Ed.). Advances in Applied Mircobiology, Vol 67.
Elsevier Academic Press Inc, San Diego, pp. 65-108.
Kinney, C.A., Furlong, E.T., Kolpin, D.W., Burkhardt, M.R., Zaugg, S.D., Werner, S.L., Bossio, J.P., Benotti,
M.J., (2008). Bioaccumulation of Pharmaceuticals and Other Anthropogenic Waste Indicators in Earthworms
from Agricultural Soil Amended With Biosolid or Swine Manure. Environmental Science & Technology 42,
1863-1870.
Kuster, M., López de Alda, M.J., Hernando, M.D., Petrovic, M., Martín-Alonso, J., Barceló, D., (2008).
Analysis and occurrence of pharmaceuticals, estrogens, progestogens and polar pesticides in sewage treatment
plant effluents, river water and drinking water in the Llobregat river basin (Barcelona, Spain). Journal of
Hydrology 358, 112-123.
Lam, M.W., Tantuco, K., Mabury, S.A., (2003). PhotoFate: A New Approach in Accounting for the
Contribution of Indirect Photolysis of Pesticides and Pharmaceuticals in Surface Waters. Environmental Science
& Technology 37, 899-907.
Luthy, R.G., Aiken, G.R., Brusseau, M.L., Cunningham, S.D., Gschwend, P.M., Pignatello, J.J., Reinhard,
M., Traina, S.J., Weber, W.J., Westall, J.C., (1997). Sequestration of Hydrophobic Organic Contaminants by
Geosorbents. Environmental Science & Technology 31, 3341-3347.

Arc. Environ. Cont. Toxicol. (Submitted)
192
Mateos-Ruiz, R.M., Lopez-Garcia, J.M., (2003). Retroceso de la intrusión marina debido a la substitución de
aguas subterráneas por aguas residuales tratadas para el regadío de una zona agrícola. El Pla de Sant Jordi.
Tecnología de la intrusión de agua de mar en los acuíferos costeros: Países mediterráneos, IGME, Madrid.
Murray, K.E., Thomas, S.M., Bodour, A.A., (2010). Prioritizing research for trace pollutants and emerging
contaminants in the freshwater environment. Environmental Pollution 158, 3462-3471.
Musson, S.E., Campo, P., Tolaymat, T., Suidan, M., Townsend, T.G., (2010). Assessment of the anaerobic
degradation of six active pharmaceutical ingredients. Science of The Total Environment 408, 2068-2074.
Nieto, A., Borrull, F., Pocurull, E., Marcé, R.M., (2010). Pressurized liquid extraction: A useful technique to
extract pharmaceuticals and personal-care products from sewage sludge. TrAC Trends in Analytical Chemistry
29, 752-764.
Oppel, J., Broll, G., Löffler, D., Meller, M., Römbke, J., Ternes, T., (2004). Leaching behaviour of
pharmaceuticals in soil-testing-systems: a part of an environmental risk assessment for groundwater protection.
Science of The Total Environment 328, 265-273.
Pennsylvania Department of Environmental Protection, 2005. Environmental Science DatabaseSRC (2005)
PhysProp. Organic regulated substances physical and toxicological properties.
Pérez-Carrera, E., Hansen, M., León, V., Björklund, E., Krogh, K., Halling-Sørensen, B., González-Mazo, E.,
(2010). Multiresidue method for the determination of 32 human and veterinary pharmaceuticals in soil and
sediment by pressurized-liquid extraction and LC-MS/MS. Analytical and Bioanalytical Chemistry 398, 1173-
1184.
Richardson, S.D., Ternes, T.A., (2011). Water Analysis: Emerging Contaminants and Current Issues.
Analytical Chemistry 83, 4614-4648.
Rodríguez-Navas, C., Björklund, E., Forteza, R., Cerdà, V., (2012). Volatile organic compounds in landfill
odorant emissions on the island of Mallorca. International Journal of Environmental Analytical Chemistry 92, 1-
16.
Rodriguez-Navas, C., Forteza, R., Cerdà, V., (2012). Use of thermal desorption – gas chromatography – mass
spectrometry (TD-GC-MS) on identification of odorant emission focus by volatile organic compounds
characterisation. Chemosphere (In press).
Runnqvist, H., Bak, S.A., Hansen, M., Styrishave, B., Halling-Sørensen, B., Björklund, E., (2010).
Determination of pharmaceuticals in environmental and biological matrices using pressurised liquid extraction—
Are we developing sound extraction methods? Journal of Chromatography A 1217, 2447-2470.
Schultz, M.M., Painter, M.M., Bartell, S.E., Logue, A., Furlong, E.T., Werner, S.L., Schoenfuss, H.L., (2011).
Selective uptake and biological consequences of environmentally relevant antidepressant pharmaceutical
exposures on male fathead minnows. Aquatic Toxicology 104, 38-47.
Schwarzbauer, J., Heim, S., Brinker, S., Littke, R., (2002). Occurrence and alteration of organic contaminants
in seepage and leakage water from a waste deposit landfill. Water Research 36, 2275-2287.
Simó, R., Colom-Altés, M., Grimalt, J.O., Albaigés, J., (1991). Background levels of atmospheric
hydrocarbons, sulphate and nitrate over the western Mediterranean. Atmospheric Environment. Part A. General
Topics 25, 1463-1471.
Thiele-Bruhn, S., (2003). Pharmaceutical antibiotic compounds in soils – a review. Journal of Plant Nutrition
and Soil Science 166, 145-167.
Verlicchi, P., Galletti, A., Petrovic, M., Barceló, D., (2010). Hospital effluents as a source of emerging
pollutants: An overview of micropollutants and sustainable treatment options. Journal of Hydrology 389, 416-
428.
World Health Organization: Drinking-water Quality Committee, 2011. Pharmaceuticals in drinking water.

Chapter 3
193
Yamamoto, H., Nakamura, Y., Moriguchi, S., Nakamura, Y., Honda, Y., Tamura, I., Hirata, Y., Hayashi, A.,
Sekizawa, J., (2009). Persistence and partitioning of eight selected pharmaceuticals in the aquatic environment:
Laboratory photolysis, biodegradation, and sorption experiments. Water Research 43, 351-362.
Zhou, J.L., Zhang, Z.L., Banks, E., Grover, D., Jiang, J.Q., (2009). Pharmaceutical residues in wastewater
treatment works effluents and their impact on receiving river water. Journal of Hazardous Materials 166, 655-
661.


195
CHAPTER 4
3BSUMMARSUMMARY OF RESULTS AND
CONCLUSIONS

Chapter 4
197
SUMMARY OF RESULTS AND CONCLUSIONS
In this dissertation, two different analytical methodologies have been developed,
optimized and applied for the determination of different groups of organic pollutants with
limited regulations if any: pharmaceutical residues and volatile organic compounds, in the
aquatic and atmospheric environments of the Island of Mallorca (Spain, Mediterranean Sea).
Analytical methods based on solid phase extraction and clean-up approaches,
chromatographic separation techniques and selective mass spectrometry detection are
presented and applied as suitable methodologies for the periodical environmental monitoring
of organic compounds. Its immediate implementation within specific environmental
regulations is assumed as urgent to control and amend current environmental pollution
levels.
Besides every study described in Chapter 3 include its own individual conclusions, the
most significant highlights and merits of the research compiled in this Doctoral Thesis are
summarized below:
1. The use of SPE-LC-(ESI)-MS2 and SPE-TD-GC-MS, for the environmental monitoring
of pharmaceutical’s residues and volatile organic compounds, by means of a solid
phase extraction and clean-up steps ascertain excellent analytical features for
environmental monitoring purposes, including low limits of detection and quantification,
good extraction recoveries, linear fits, robustness over time, reproducibility and sample
frequency.
2. To achieve the aimed analytical characteristics for the determination of volatile organic
compounds by the use of commercially available solid sorbents Tenax® TA and
Carboxen® 1000 followed by TD-GC-MS, a high-temperature loading strategy has been
developed and optimized for the injection of liquid standards. This procedure
guarantees high reproducibility and robustness over time, providing a high response
factor and enabling the quantification by means of external standard calibration. Two
comprehensive environmental occurrence studies to determine VOCs have been
performed by means of the proposed high-temperature loading strategy, assuring the
suitability of the system.
3. Commercially available solid sorbents Tenax® TA and Carboxen® 1000 were found
useful for the extraction of a wide number of volatile organic compounds (up to 93
different compounds) with different physicochemical characteristics such as polarity,

Summary of Results and Conclusions
198
vapour pressure and molecular weight. However the methodology was not suitable for
the determination of other polar compounds like organic aliphatic acids, or gases such
as H2S or NH3, thus commercially available colorimetric tubes (Dräger®) were applied
for in-situ determination of the NH3 and H2S.
4. Commercial sorbents Oasis® HLB and Oasis® MAX were found to be useful techniques
for the extraction of different organic pharmaceuticals from complicated environmental
aquatic matrices, including landfill’s leachates and marine waters. However it showed
some limitations regarding extraction and clean-up of some polar organic chemicals in
marine waters, owing the salinity of the matrix.
5. Medicinal pharmaceuticals and volatile organic compounds have been detected, for the
first time, as critical environment pollutants in Mallorca. It ascertains the necessity of
restrictive regulations, with the goal to (i) reduce current emissions and (ii) continuously
monitor environmental occurrence levels by periodic assessment analyses. Municipal
solid waste landfills are found massive emitters of VOCs to specific atmospheric
environments, which pose a constant risk for surrounding population, as well as flora
and fauna, through e.g. photochemical smog generation. Assuming that waste
processes produce over 1-2% of the total emissions of VOCs in Europe, there is still
much work to do to reach the desired clean environments.
6. Pollution pathways described from the pharmaceutical’s residues released by
wastewater treatment plants and landfills have shown the problematic of the aquatic
contamination of Natural Areas and groundwater, which might pose unknown severe
risks. Current knowledge over pharmaceutical’s risk assessment is still short to clearly
understand the real impact of organic pollutants. Since wastewater treatments
technologies are not efficiently removing organic pharmaceuticals (and by extension
many other emerging contaminants), the re-use of reclaimed water for whatever
purposes can be considered a pollution source for the rest of the aquatic environment in
Mallorca, therefore, emissions must be immediately reduced as much as possible.
7. A novel methodology has been developed and applied for the identification of odorant
emission focuses, based on the characterisation of volatile organic compounds in the
air. A pattern recognition technique on the basis of a Principal Components Analysis
(PCA) enables the correlation of a specific ambient air with the emission source. This
procedure offers an alternative tool to the local Governments in order to spread over
sanctions to emitting facilities/industries/processes. Collaboration between local
Chapter 4
199
Governments, research centres and industrial companies (VOC emitters) has shown a
necessary requirement and the most productive way to reach the proposed objectives.
8. No positive correlation was found between odour units, measured by dynamic
olfactometry, with the concentration of 42 different VOCs. These evaluations involve
multiple factors generating big bias: (1) landfills are extremely heterogeneous samples
with different microorganisms’ processes beneath the sampled surface, thus VOCs
composition might be completely different even at similar spots; (2) odorant
measurements involve subjective determination by human panellists which may
produce bias on the reliability of the measurements; (3) the nearly unaffordable number
of VOCs presented in landfill matrices makes extremely difficult to find a suitable
methodology capable to quantify all of them; (4) the correlation probably do not fit a
linear interaction owing to possible interactions between odorant compounds, e.g.
causing synergic effects.
Future work along the lines of research conducted in the framework of this Doctoral
Thesis is devoted to:
Development and application of a suitable TD-GC-MS methodology for the
environmental analysis of polycyclic aromatic hydrocarbons (PAHs) in air and
determination of the partition coefficient between air – solids in suspension
(particulate matter, PMx)
Development of an on-line dispersive liquid-liquid microextraction (DLLME)
procedure for the analysis of PAHs in water by exploiting multisyringe flow
injection analysis (MSFIA) techniques hyphenated to GC-MS detection.


Annex I
201
4BANNEX I
List of publications obtained in this doctoral thesis, included in the introduction
and the experimental part, which are published or submitted for publication in
different scientific journals.
I. Volatile organic compounds in landfill odorant emissions on the island of Mallorca.
Authors: Carlos Rodríguez-Navas, Erland Björklund, Rafel Forteza, Víctor Cerdà.
Journal: International Journal of Environmental Analytical Chemistry.
Year: 2012. Volume: 92. Pages: 1-16
II. Use of thermal desorption–gas chromatography–mass spectrometry (TD–GC–MS)
on identification of odorant emission focus by volatile organic compounds
characterization.
Authors: Carlos Rodríguez-Navas, Rafel Forteza, Víctor Cerdà.
Journal: Chemosphere. Year: 2012. (In press).
III. Implementation and optimization of a high-temperature loading strategy of liquid
standards in the quantification of volatile organic compounds using solid sorbents.
Authors: Carlos Rodríguez-Navas, Rafel Forteza, Víctor Cerdà.
Journal: Journal of Separation Sciences. (Submitted)
IV. Pollution pathways of pharmaceutical residues in the aquatic environment on the
island of Mallorca, Spain.
Authors: Carlos Rodríguez-Navas, Erland Björklund, Søren A Bak, Martin Hanse,
Kristine A. Krogh, Fernando Maya, Rafel Forteza, Víctor Cerdà.
Journal: Archives of Environmental Contamination and Toxicology. (Submitted)

Publications and Contributions on Conferences
202
List of conference contributions obtained in this doctoral thesis.
I. Optimization of thermal-desorption experimental conditions in GC-MS analysis of
environmental samples.
Authors: Carlos Rodríguez-Navas, Gabriel Vivó-Truyols, Rafel Forteza, Víctor
Cerdà.
Conference: 5th EuroAnalysis.
Year: 2009. Location: Innsbruck, Austria. Type of communication: Poster
II. Characterization of odorant emissions from environmental technologic center by TD-
GC-MS.
Authors: Carlos Rodríguez-Navas.
Conference: Les Doctoriales Transfrontalieres.
Year: 2009. Location: Pollensa, Spain. Type of communication: Poster
III. Study of the volatile organic compounds (VOCs) emission from an urban solid waste
landfill in Mallorca (Spain) by TD-GC-MS.
Authors: Carlos Rodríguez-Navas, Rafel Forteza, Víctor Cerdà.
Conference: 28th International Symposium on Chromatography.
Year: 2010. Location: Valencia, Spain. Type of communication: Poster
IV. Occurrence of PPCPs in the environment on a Mediterranean Sea Island.
Authors: Carlos Rodríguez-navas, Martin Hansen, Fernando Maya, Søren Bak,
Rafel Forteza, Victor Cerdà, Kristine A. Krogh, Erland Björklund.
Conference: 3rd International Conference on Occurrence, Fate, Effects and Analysis
of Emerging Contaminants in the Environment (EMCON).
Year: 2011. Location: Copenhagen, Denmark. Type of communication: Lecture
V. Study of VOCs in the Ambient Air of a Waste Treatment and Disposal Zone in
Mallorca (Spain) by TD-GC/MS.
Authors: Carlos Rodríguez-navas, Rafel Forteza, Victor Cerdà.
Conference: 13as Jornadas de Análisis Instrumental
Year: 2011. Location: Barcelona, Spain. Type of communication: Lecture

Annex I
203
VI. Study of the volatile organic compounds (VOCs) in the ambient air of a waste
treatment technologies zone in South-East Mediterranean Island (Mallorca, Spain)
by TD-GC-MS.
Authors: Carlos Rodríguez-Navas, Rafel Forteza, Víctor Cerdà.
Conference: IUPAC International Congress on Analytical Sciences (ICAS).
Year: 2011. Location: Kyoto, Japan. Type of communication: Poster
Other contributions on conferences not included in this Thesis:
VII. Multisyringe flow injection technique allows fast and sensitive ion chromatographic
separations based on the use of surfactant coated short monolithic columns and
post-column chemiluminiscence detection.
Authors: Fernando Maya, Carlos Rodríguez-Navas, José Manuel Estela, Víctor
Cerdà.
Conference: 5th EuroAnalysis .
Year: 2009. Location: Innsbruck, Austria. Type of communication: Poster
VIII. A study of the use of optical fibers with MSFIA to spectrophotometrycal
determination of sulfides in environmental samples..
Authors: Carlos Rodríguez-Navas, Rafel Forteza, Víctor Cerdà.
Conference: 16th International Conference on Flow Injection Analysis (ICFIA).
Year: 2010. Location: Pattaya, Thailand. Type of communication: Poster
IX. Conference: Flow Analysis XI
Year: 2009. Location: Pollensa, Spain. Type of communication: Attendee/Staff
X. Conference: 1st International Conference on Analytical Proteomics (ICAP)
Year: 2009. Location: Lisbon, Portugal. Type of communication: Attendee/Staff
XI. Conference: II International Workshop on Analytical Miniaturisation (“lab on a chip”)
Year: 2010. Location: Oviedo, Spain. Type of communication: Attendee

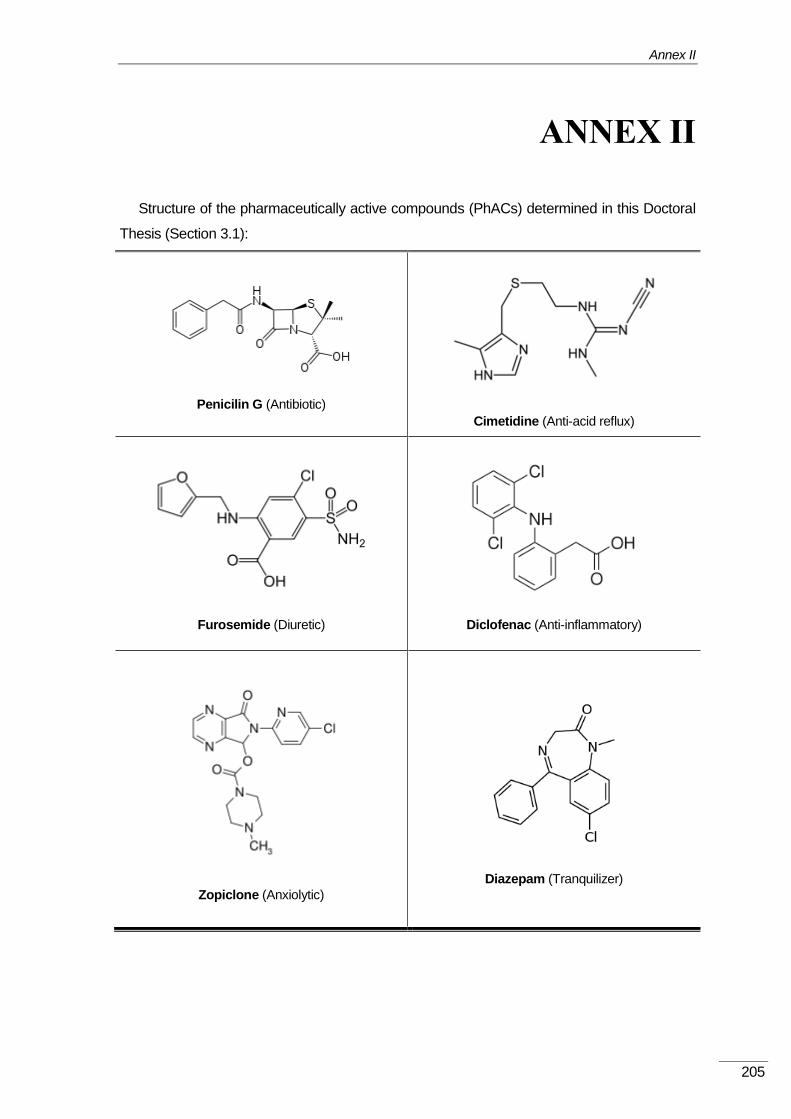
Annex II
205
4BANNEX II
Structure of the pharmaceutically active compounds (PhACs) determined in this Doctoral
Thesis (Section 3.1):
Penicilin G (Antibiotic)
Cimetidine (Anti-acid reflux)
Furosemide (Diuretic)
Diclofenac (Anti-inflammatory)
Zopiclone (Anxiolytic)
Diazepam (Tranquilizer)

Structure of the studied PhACs
206
Prednisolone (Corticosteroid)
Carbamazepine (Antiepileptic)
Spironolactone (Diuretic)
Simvastatin (Anti-hyperlipidaemic)
Gestodene (Contraceptive)
Amoxicillin (Antibiotic)

Annex II
207
Ramipril (Cardiac Drug)
Omeprazole (Proton pump inhibitor)
Bendroflumethiazide (Diuretic)
Morphine (Analgesic)
Erythromycin (Antibiotic)
Diltiazem (Anti-hypertensive)
Amlodipine (Anti-hypertensive)

Structure of the studied PhACs
208
Verapamil (Anti-hypertensive)
Terbutaline (Anti-asthmatic)
Oxazepam (Tranquilizer)
Citalopram (Tranquilizer)
Allopurinol (Rheumatic)
Salbutamol (β-Agonist)
Metoprolol (β-Blocker)
Atenolol (β-Blocker)

Annex III
209
4BANNEX III
List of Abbreviations
AnVOC Anthropogenic Volatile Organic Compound
AOP Advanced Oxidation Processes
APCI Atmospheric-Pressure Chemical Ionisation
API Atmospheric Pressure Interface
APPI Atmospheric-Pressure Photoionization
ASPDE Accelerated Solid Phase Dynamic Extraction
ASTM American Society for Testing Materials
BAT Best Available Techniques
BSTFA N,O-Bis(trimethylsilyl)trifluoroacetamide
BTEX Benzene, Toluene, Ethylbenzene and Xylenes
BVOC Biogenic Volatile Organic Compound
CAFE Clean Air for Europe
CAS Chemical Abstract Service
CCL Candidate Contaminant List
CE Capillary Electrophoresis
CEN European Committee for Standardization
CFC Chlorofluorocarbon
CIT Cold Ion Trap
CLTRAP Convention on Long-Range Transboundary Air Pollution
DAD Diode Array Detector
DBP Disinfection By-products
DIMS Direct Injection Mass Spectrometry
DLLME Dispersive Liquid-Liquid Microextraction
DOAS Differential Optical Absorption Spectrometry
DS-MS Direct air-sampling Mass Spectrometry
DVE Dispersive Vapour Extraction
EAP Environmental Action Programmes
EC Emerging Contaminant
EC (in laws) European Council
ECD Electron Capture Detector
EDC Endocrine Disrupting Compounds

List of Abbreviations
210
EEA European Environmental Agency
EI Electronic Ionisation
EIONET European Environmental Information and Observation Network
ELV Emission Limit Values
EME Electro membrane
EMEP European Monitoring Evaluation Programme
EN European Standard
EPA Environmental Protection Agency
E-PRTR European Pollutant Release and Transfer Register
ESI Electrospray Interface
EU European Union
FIA Flow Injection Analysis
FID Flame Ionisation Detector
FTIR Fourier Transform Infrared Spectrometry
GC Gas Chromatography
HEAL Health and Environmental Alliance
HF Hollow Fibre
HILIC Hydrophilic Interaction Chromatography
HPLC High Performance Liquid Chromatography
HSSE Headspace Sorptive Extraction
hƲ Radiation
i.d. Inner Diameter
IPPC (Directive) Integrated Pollution Prevention and Control (European Directive)
IR Infrared
IRIS Integrated Risk and Information System
ISO International Standardization Organisation
IT Ion Trap Analyser
IUPAC International Union of Pure and Applied Chemistry
LC Liquid Chromatography
LCP (Directive) Large combustion Plants (European Directive)
LOD Limit of Detection
LOQ Limit of Quantification
LPCI Low-Pressure Chemical Ionisation
LPME Liquid Phase Microextraction
MEPS Microextraction Packed Syringe
MESI Membrane Extraction with a Sorbent Interface

Annex III
211
MIMS Membrane Introduction Mass Spectrometry
MIP Molecular Imprinted Polymer
MS Mass spectrometry
MS2 or MS/MS Tandem Mass Spectrometry
MSD Mass spectrometry Detection
MSFIA Multisyringe Flow Injection Analysis
MSW Municipal Solid Waste
MTBSTFA N-(tert-butyldimethylsilyl)-N-methyltrifluoroacetamide
NCI Negative Chemical Ionisation
NEC Directive National Emission Ceiling Directive
NIOSH US National Institute for Occupational Safety and Health
NMR Nuclear Magnetic Resonance
NMVOC Non-Methane Volatile Organic Compound
o.d. Outer Diameter
OTV Odour Threshold Value
OUE European Odour Units
PA Proton Activity Coefficient
PAH Polycyclic Aromatic Hydrocarbon
PAN Peroxiacetyl Nitrates
PC Principal Component
PCA Principal Components Analysis
PCB Polychlorinated Biphenil
PCDD Polychlorinated Dibenzo-Dioxin
PCDF Polychlorinated Dibenzo-Furane
PCP Personal and Care Products
PDMS Polydimethylsiloxane
PFBBr Pentafluorobenzoyl Bromide
PFBOCl Pentafluorobenzoyl Chloride
PFC Polyfluorinated Compounds
PhAC Pharmaceutically active compound
PID Photochemical Ionisation Detector
PLE Pressurized Liquid Extraction
PMx Respirable Particulate Matter
PNME Fibre-Packed Needle Microextraction
POCP Photochemical Ozone Creation Potential
POP Persistent Organic Pollutants
List of Abbreviations
212
ppb Parts per Billion
PPCP Pharmaceuticals and Personal Care Products
ppm Parts per Million
PTR Proton Transfer Reaction
PTV Programmable Temperature Valve
Q Quadrupole Analyser
QqLIT Quadrupole-Quadrupole-Linear Ion Trap Analyser
QqQ Triple Quadrupole Analyser
Q-TOF Quadrupole-Time of Flight Analyser
SBSE Stir Bar Sorptive Extraction
SD Solvent Desorption
SIA Sequential Injection Analysis
SIFDT Selected Ion-flow Drift-Tube
SIFT Selected Ion-Flow-Tube
SLM Supported Liquid Membrane
SOC or SVOC Semi Volatile Organic Compound
SPDE Solid Phase Dynamic Extraction
SPE Solid Phase Extraction
SPME Solid Phase Microextraction
STP Sewage Treatment Plant
TD Thermal Desorption
TFEI Task Force Emission Inventory
TFME Thin Film Microextraction
TMAH Trimethylaniline Hydroxide
TMS Trimethylsilyl
TMSH Trimethylsulfonium Hydroxide
TMS-Oxime Trimethylsilyl-Oxime
TOF Time of Flight Analyser
TP Transformation products
TPD Temperature Programmable Desorption
TSP Total Suspended Particles
WWTP Wastewater Treatment Plant