università di pisa facoltà di economia - core · università di pisa facoltà di economia ......
TRANSCRIPT

Università di Pisa
Facoltà di Economia
Corso di Laurea Specialistica in Management & Controllo
Tesi di Laurea in Etica e Valori Aziendali
Corporate Sustainability and Balanced Scorecard:
Integrated Management of Economic, Environmental and
Social Performances in the Airline Industry
Candidato Relatore
Gaspare Zambito Prof. Luca Nannini
Anno Accademico 2010-2011

II
Corporate Sustainability and Balanced Scorecard:
Integrated Management of Economic, Environmental and
Social Performances in the Airline Industry

III
Introductive Note
This work is the result of a research traineeship accomplished at the Institute of Public
Administration and Law in the Faculty of Economics and Administration of the University
of Pardubice in Czech Republic. The six months-traineeship is been carried out through the
Erasmus Placement Program. The Thesis abroad is been developed with the support of the
scholarship “contributo di mobilità per tesi all’estero” granted by the University of Pisa
Acknowledgments
I want to say thanks to my Erasmus Placement Tutor Eng. Ticiano Costa Jordao from the
Institute of Public Administration and Law (Faculty of Economics and Administration -
University of Pardubice). For the whole semester and even beyond the internship period,
he supported me with high capability, professional attitude and always interested on my
work, giving me the right motivation and willing to attain all the purposes assigned.
Thanks also to my Thesis Supervisor Prof. Luca Nannini that gave me the chance to go and
develop my thesis project abroad. During the period spent in Czech Republic, he followed
my work from distance with interest. Afterwards he helped me to complete the work in Italy
with patience and dedication.

IV
Contents
- Introduction 6
Chapter 1
Corporate Sustainability and Business Management
1.1 Corporate Sustainability 10
1.1.1 The Evolution of Corporate Sustainability 12
1.1.2 Business, Societal and Natural Cases of Sustainability 15
1.2 Sustainability and Competitiveness 20
1.3 Steps towards Sustainability Management 25
1.3.1 Stakeholders and Exposures 27
1.3.2 Leadership and Strategy 28
1.3.3 Actions 30
1.3.4 Organizational Structure and Management Systems 31
1.3.5 Measurement and Communication 34
1.3.6 Stakeholder Reaction, Financial Performance and Feedback 40
Chapter 2
Sustainability Balanced Scorecard
2.1 Traditional Balanced Scorecard 44
2.2 Integrating Environmental and Social Aspects: Towards Sustainability
Balanced Scorecard 48
2.3 The Process of Implementing a SBSC 53
2.3.1 The Practical-Technical Process 53
2.3.2 The Cultural-Strategic Process 60

V
Chapter 3
Corporate Sustainability in the Airline Sector: Simulation of SBSC in Lufthansa
3.1 Airline Sector and Sustainable Development 64
3.2 The Case of Corporate Sustainability in Lufthansa 70
3.2.1 Lufthansa Overview and General Strategies 71
3.3 The Implementation of Sustainability Balanced Scorecard within the
Business Segment “Lufthansa Passenger Airline” 74
3.3.1 Environmental and Social exposures 74
3.3.2 Developing Sustainability Guidelines 77
3.3.3 Perspectives Objectives and Related Indicators 86
3.3.4 Strategy Map 95
3.4 Sustainability Performance Data, Comparison with Competitors, some
Criticisms and Suggestions 98
3.4.1 Transport Performances and related Economic-Financial Results 100
3.4.2 Environmental Performances 104
3.4.3 Social Performances 107
3.4.4 Community Performance 110
3.4.5 Sustainability Reporting and Stakeholder Dialogue 111
- Conclusions 115
- References 119

6
Introduction
Global climate change, water, air and soil pollution, resources overuse, social inequalities,
human rights, workers rights, child labor, consumers and employees safety constitute
ethical concerns that world society must increasingly tackle. Many subjects are responsible
for the mentioned troubles and several kind and levels of responsibilities can be associated
to these subjects. Corporations can be considered the main responsible actors in the world
for affecting natural environment and social constructs. There is no doubt that companies
must consider their social responsibility and specifically the environmental, social and
economic impacts of their activities on all stakeholder categories. The reasons why firms
try to behave ethically are switching from the legal field to the competitive one. Many
companies adapt their activities and processes in compliance with laws and rules of the
markets in order to avoid charges of taxes, penalties and fees. But many other businesses
are moving towards a responsible business in order to be more efficient, reduce cost,
differentiate products, satisfy customers, motivate employees, access to ethical funds and
acquire image and reputation. In this way, the social responsibility of a company is seen as
matter of competitive advantage. The task of corporate managers regards the integrated
management of environmental, social and financial issues towards better sustainable
performances. Business practices known as Corporate Social Responsibility (CSR) or
Corporate Sustainability are increasingly utilized through the development of strategies
oriented to sustainable development in parallel with profitability. The development of
sustainability strategies is certainly a big task for top management but the larger challenge
is the implementation of these strategies. In other words, the matter is “how” to integrate
the environmental, social and economic impacts into daily management decisions and
operations.
The Balanced Scorecard (BSC) is the appropriate managerial instrument useful for the
purpose of translating strategies into actions. This can be true for sustainability guidelines
as well. The multidimensional conception of the tool can help to integrate the
environmental and social aspects of the business activity with the four traditional
perspectives of management (financial, customer, processes, learning and growth). With the
support of balanced scorecard, many companies have been able to connect business

7
strategy with daily operations. The emerging concept of Sustainability Balanced Scorecard
(SBSC) is referred to the same managerial tool but with the additional feature of
considering the environmental and social issues connected directly or indirectly with the
execution of the business processes. Objectives and indicators are not regarding only
economic and financial goals but they are developed with contents of social and
environmental purposes. Finally, cause and effect chains among strategic objectives in the
SBSC show the relations between better environmental-social performances and increasing
competitiveness and profitability.
Airlines belong to one of those industrial sectors increasingly becoming more sensible with
respect to sustainability performances. The case developed about the German carrier
Lufthansa will help to better understand which dynamics are behind the corporate
sustainability approach in a real company. More important, it will be demonstrated how
sustainability strategy is translated into operative targets easier to measure, monitor and
manage. The work is addressed to deepen the process for making sustainability real work.
The implementation of a Sustainability Balanced Scorecard in the business segment
Lufthansa Passenger Airline is a simulation based on real strategies of the carrier. The
outcome is a process that goes from the establishment of long term sustainability strategy to
the definition of short term targets to monitor through the key performance indicators
developed. Taking as starting point the needs of stakeholders and the related environmental
and social impacts generated, sustainability strategies are developed. The function of the
balanced scorecard is to formalize these strategies as several strategic objectives belonging
to the different perspectives of SBSC. Afterwards, for each sustainability objective,
numerous key performance indicators are developed in order to monitor single operative
aspects related to the achievement of objectives. Causal linkages among objectives show
how responsible and sustainable performances are linked with competitive advantages and
thus financial results.
The case is developed basing on strategies declared by the company in the web site,
specifically for the “Passenger Airline” segment. The simulation is based on many
contributions in the literature. Internal as well as external sources have been utilized for
carrying out the work. Economic and sustainability data about the sector are taken from
significant reports of the industry such as disclosures from IATA (International Air

8
Transport Association) ICAO (International Civil Aviation Organization) and ATAG (Air
Transport Action Group). The process of implementation of SBSC is based manly on the
general framework of Figge et al. (2002) and adapted with the real data of Lufthansa. The
strategy map is drawn following the framework of Kaplan and Norton (2004), and the
causal relationships are the results of intuitions based on the logical connections between
the sustainability aspects identified. Most of the indicators utilized come from Lufthansa
Balance (sustainability reporting), the Annual Report (financial statement) and other
additional support information available in the web page of Lufthansa Responsibility.
Among the other indicators utilized, some represent own source, others are based on
external sources, adapted from sustainability reports of competitors, or taken from the
Global Reporting Initiative sustainability reporting guidelines G3. Furthermore, the
assessment of economic, environmental and social performances, through a comparison
with competitors, is based on data disclosed in the corporate responsibility and
sustainability reporting of the carriers analyzed.
The work is structured as follow.
The first chapter introduces the concept of Corporate Sustainability, the evolution and
disciplines from where it comes from and the explanation of the major aspects of a
sustainable business activity. Afterwards, the relationships between corporate sustainability
and competitive advantages are described for better focusing on the matter. The chapter
ends with the introduction of the steps for managing sustainability. The process contains
the following phases: identification of stakeholders and exposures, development of
sustainability strategies, leadership and commitment, organizational structure and culture,
performance measurement systems, reporting and feedback.
The second chapter starts with a brief explanation of the concept of Balanced Scorecard
with his traditional meaning. Then, environmental and social issues are implemented within
the BSC in order to give rise to the concept of Sustainability Balanced Scorecard (SBSC).
Finally, two complementary processes of developing the SBSC are presented. The first is
more focused on the practical and measurement aspects of the tool; the other emphasizes
the strategic function and the cultural change needed in the whole organization.
The third chapter is dedicated to the development of the case of Lufthansa. First of all, the
airline industry is introduced and the problems regarding sustainable development in this

9
sector are observed. Some meaningful data are presented about the sector and sustainability
performances. Then, the case of Lufthansa is introduced. The process to implement the
Sustainability Balanced Scorecard in the business segment Passenger Airline can be
considered the core issue of the work. Detailed objectives, based on real strategies of the
airline, with respective key performance indicators are developed and listed. The
establishment of targets and initiatives makes feasible the translation of Lufthansa
sustainability strategies into actions of the daily management. The strategy map, finally,
illustrates the cause and effect connections among the various objectives, emphasizing the
relations between sustainability performances and financial results. The case ends with the
assessment of sustainability performances (economic, environmental and social) achieved
by the German carrier through the comparison with the results obtained by the direct
European competitor, Air France KLM, and other minor competitors.

10
Chapter 1
Corporate Sustainability and Business Management
1.1 Corporate Sustainability
One of the most important challenges that world is facing in 21ts century concerns
sustainability development. The matter of a development towards a fair and wealthy
society, pointing to preservation of natural environment and cultural improvements for
future generations, is increasing importance day by day. The goal of reaching
simultaneously economic growth, environmental protection and social equity is affecting
more and more the business environment and not only Governments, special Authorities
and Organizations. The issue of incorporating sustainable and responsible practices into
daily business operations is increasingly becoming one of the major interests of
corporations.
Companies are paying more attention to sustainable development for many reasons:
compliance of Government regulations and industry codes of conduct; relations with
community represented by general public and activist NGOs; cost and revenue imperatives
related to the financial value achievable through sustainability performances; societal and
moral obligations1. In particular, ten market forces that drive organizations to corporate
sustainability have been identified by Bob Williard2. Five of these forces (mega-issues)
represent the up coming problems for the companies:
- Climate Change
- Pollution/health
- Globalization backlash
- Energy crunch
1 Epstein M J. 2008. Making Sustainability Work. Best Practices in Managing and Measuring Corporate
Social, Environmental, and Economic Impacts. Berrett-Koehler Publisher, San Francisco 2 Williard B. 2005. The Next Sustainability Wave: Building Boardroom Buy-In. Gabriola Island, British
Columbia. New Society Publisher

11
- Erosion of trust
The other five forces concern the main stakeholder categories demanding a change towards
more ethical and responsible behaviour:
- Green consumers
- Activist shareholders
- Civil society and NGOs
- Governments and regulators
- Financial community
Because of the mentioned reasons, corporations have become more sensitive to social
issues and stakeholder concerns, trying to be more responsible and accountable. Business
managers have been facing the need of being sustainable by implementing environmental
management systems (EMAS, ISO 14000), executing environmental and social audits and
developing environmental and social accounting and reporting systems. But the emerging
challenge concerns the incorporation of sustainability issues into business strategy, with the
purpose to manage the integrated economic, social and environmental aspects as daily
operations. The development of strategies based on sustainability development and
responsibility is going beyond the purpose of the mere compliance of legislation and
regulations. The emerging goal of corporate sustainability is about acquiring further
distinctiveness for competition. But what is exactly corporate sustainability? Where does it
come from?
The term “corporate sustainability” has gained, in recent years, substantial interest among
business managers, academic researchers and popular press. Actually there is not a
commonly accepted definition and it is still a broad approach that embraces several
characteristics concerning the integration of economic, environmental as well as social
aspects of a business. Even the term “sustainable” has become a buzzword that everybody
interprets in a different way such as “green, eco-efficient, ethical, socially responsible etc”.

12
It becomes more complicated when the term is associated to corporate dimension3. In some
cases the term “corporate sustainability” is used in combination or in replacement with
other terms such as “corporate social responsibility” or “sustainable development”4. Next
two paragraphs, based on two interesting articles, will explain the concept of corporate
sustainability; afterwards it will be showed the connections between corporate
sustainability and competitiveness.
1.1.1 The Evolution of “Corporate Sustainability”
One interesting contribution about the concept of “Corporate Sustainability” is given by
Mel Wilson in his article “Corporate sustainability: what is it and where does it come
from?”. It deepens the evolution of corporate sustainability, showing the different
disciplines from where it comes.
“A review of the literature suggests that the concept of corporate sustainability borrows
elements from four more established concepts: 1) sustainable development, 2) corporate
social responsibility, 3) stakeholder theory, and 4) corporate accountability theory”5.
The concept of “sustainable development” is been introduced in 1987 by the World
Commission for Environment and Development (WCED) through the publication of a book
entitled “Our Common Future”6. It defines sustainable development as: “meeting the needs
of the present without compromising the ability of future generations to meet their own
needs”. In this book it is underlined that companies have caused most of pollution,
damaged and wasted natural resources. At the same time they have the possibility to access
to the resources required to solve these problems, thus they acquire a crucial role in
growing towards sustainable development. It is matter of balancing economic growth with
3 Hockerts K. 2001. Corporate Sustainability Management. Toward controlling corporate ecological and
social sustainability. Ninth International Conference of Greening of Industry Network, January 21-25, 2001,
Bangkok 4 Wilson M. 2003. Corporate sustainability: What is it and where does it come from? Ivey Business Journal
March/April 5 Wilson M. 2003. Corporate sustainability: What is it and where does it come from?. Ivey Business Journal
March/April 6 WCED (World Commission for Environment and Development). 1987. Our Common Future. Oxford
University Press

13
social equity and environmental protection. But this concept alone does not provide the
sufficient explanation of why companies should move towards corporate sustainability.
Another concept that brings elements of sustainability within businesses is “corporate
social responsibility” (CSR). It regards the role, and precisely the ethical obligations and
responsibilities, of companies in respect to the needs of society. CSR concerns moral
philosophy in managing business. It comes from four philosophical theories7.
- Social contract theory: “according to this theory, corporations, as organizations,
enter into contracts with other members of society, and receive resources, goods,
and societal approval to operate in exchange for good behavior”.
- Social justice theory: “a fair society is one in which the needs of all members of
society are considered, not just those with power and wealth. As a result, corporate
managers need to consider how these goods can be most appropriately distributed in
society”.
- Rights theory: “while shareholders of a corporation have certain property rights, this
does not give them license to override the basic human rights of employees, local
community members, and other stakeholders”.
- Deontological theory: “everyone, including corporate managers, has a moral duty to
treat everyone else with respect, including listening and considering their needs”.
The third concept, coming from the discipline of strategic management, is “stakeholder
theory”. “Stakeholders are any group or individual who can affect or is affected by the
achievement of the organization’s objectives”8. From this definition it could be deducted
that stronger relationship with stakeholders are fundamental to reach company’s objectives
and gain competitive advantage. The relation should focus on mutual respect, trust and long
term cooperation. Hence, once the main stakeholders have been identified (shareholders,
investors, customers, suppliers, employees, communities, NGO, governments, authorities
etc.), corporate strategies should be developed for interacting with them9.
7 Wilson M. 2003 p.3
8 Freeman R E. 1984. Strategic Management: a Stakeholder Approach. Pitman Books, Boston, Mass
9 Wilson M. 2003

14
Finally corporate sustainability comes from “corporate accountability” theory. This concept
concerns the moral duty of companies to report about sustainability performances. It
consists in providing to the society information, explanations and reasons of the actions
taken, thus showing the good behavior and motivating the bad one. The relation between
the firms and its stakeholders should be supported by a report that should focus on
environmental and social performances not only on economic ones10
.
The following illustration (figure 1) summarizes the evolution of corporate sustainability. It
comes from several concepts (on the center) deriving from different disciplines (on the
left). The concept of corporate sustainability can be considered as the “sum” of the various
contributions (on the right) belonging to the disciplines.
10
Wilson M. 2003
Figure 1: The Evolution of Corporate Sustainability (source: Wilson M. 2003 p.2)

15
1.1.2 Business, Societal and Natural cases of Sustainability
Another important contribution in the literature that helps to understand the practical
meaning of corporate sustainability is: “Beyond the business case for corporate
sustainability” by Thomas Dyllick and Kai Hockerts (2002). Taking as starting point the
definition of “sustainable development”: “meeting the needs of the present without
compromising the ability of future generations to meet their own needs”11
, they defined
corporate sustainability as: “meeting the needs of a firm’s direct and indirect stakeholders
(such as shareholders, employees, clients, pressure groups, communities etc), without
compromising its ability to meet the needs of future stakeholders as well”12
. Dyllick and
Hockerts based their work on the “triple bottom line” concept13
(see figure 2). Firms
should be able to manage economic, social and environmental performances (people, planet
and profit) in an integrated way. Each dimension of sustainability represents already a big
challenge to manage, but Elkington noticed that: "some of the most interesting challenges,
however, are found not within but between the areas covered by the economic, social, and
environmental bottom lines”. They are what Elkington defines the “shear zones”14
.
11
WCED (World Commission for Environment and Development). 1987. Our Common Future. Oxford
University Press 12
Dyllick T, Hokerts K. 2002. Beyond the business case for corporate sustainability. Business Strategy and
the Environment 11, 130-141 13
Elkington J. 1997. Cannibals with Forks: the Triple Bottom Line of 21st Century Business. Capstone,
Oxford 14
Elkington J. 1997 p.70
Figure 2: The three Dimensions of Sustainability (from
“Triple Bottom Line” concept by Elkington 1997,
source: Dyllick T, Hokerts K. 2002 p.132)

16
In conjunction with the Triple Bottom Line concept of corporate sustainability and the
“shear zones”, Dyllick and Hockerts developed their framework. After having identified the
three kind of capital: economic, environmental and social, they recognized different
properties and thus different approach and purposes of management towards sustainability.
Economic capital is still far to be very well understood and there are many approximations
and estimations in defining financial, tangible and intangible capital. Despite this problem,
managing it in a sustainable way is not a new challenge of the businesses. “Economically
sustainable companies guarantee at any time cash-flow sufficient to ensure liquidity while
producing a persistent above average return to their shareholders”15
.
Regarding the natural capital they classified two main types: natural resources and
ecosystem services. The firsts, used in the production processes, could be renewable (wood,
food, wind etc.) or non-renewable (fossil fuel, soil quality etc.). The second kind of natural
capital (climate stabilization, water purification soil remediation, reproduction of plant and
animals) has very big importance and value for the whole society. Despite this fact, it is bad
understood and very difficult to account. “Ecologically sustainable companies use only
natural resources that are consumed at a rate below the natural reproduction, or at a rate
below the development of substitutes. They do not cause emissions that accumulate in the
environment at a rate beyond the capacity of the natural system to absorb and assimilate
these emissions. Finally they do not engage in activity that degrades eco-system
services”16
.
The social capital is also divided in two main types: human capital and societal capital. The
first is about skills, motivation and loyalty of employees and partners. The second concerns
the quality of public services given as education, culture, infrastructures etc. “Socially
sustainable companies add value to the communities within which they operate by
increasing the human capital of individual partners as well as furthering the societal
capital of these communities. They manage social capital in such a way that stakeholders
can understand its motivations and can broadly agree with the company’s value system”17
.
Dyllick and Hockerts noticed also some characteristics of natural and social capital that
create problems of managing them in a sustainable way. The non-substitutability of capital
15
Dyllick T, Hokerts K. 2002 p.133 16
Dyllick T, Hokerts K. 2002 p.133 17
Dyllick T, Hokerts K. 2002 p.134

17
is one of them. The economic capital cannot substitute all kind of environmental capital
(see ecosystem services for example). The same is true for social capital (societal capital
more difficult than human capital); it can be substituted until certain thresholds. Another
feature that generates troubles in managing sustainability is the irreversibility of
environmental and social capital. Some kind of environmental (biodiversity, soil erosion
etc) and social impacts (cultural diversity) are definite and thus cannot be reversed. Last but
not least is the non-linearity of capital depletion. Usually the consumption of natural and
social capital has no impact until some limits are reached.
Based on the above classification and according to the “shear zones” of the “triple bottom
line” concept, Dyllick and Hockerts identified three cases of sustainability. They concern
the integrated management of sustainability challenges by linking the three dimensions of
sustainability, overcoming the conviction to manage them separately18
. In other words, the
three cases of sustainability regard the management of the “shear zones” defined by
Elkington.
The first case of sustainability is the “business case”. It regards the management and
improvement of economic sustainability by focusing, and hence increasing, the
environmental and social efficiency. Eco-efficiency is the main criteria followed by many
companies to manage sustainability. The WBCSD (World Business Council for Sustainable
Development) specifies some indicators of eco-efficiency19
. They are about reducing
material, energy and water intensity, reducing waste and toxic emissions, improving
recyclable policy. More in particular “eco-efficiency is calculated as the economic value
added by a firm in relation to its aggregated ecological impact”. On the other hand, “socio-
efficiency describes the relation between a firm’s value added and its social impact”. It has
to be noticed that, differently than environmental impacts, social impacts can not be only
negative but positive as well20
.
Improving eco- and socio-efficiency is important but it does not solve the overall problem
of sustainability. Due to the non-substitutability, non linearity and irreversibility of natural
and social capital, it should be taken into account not only relative improvements but also
18
Elkington J. 1997 19
WBCSD (World Business Council for Sustainable Development). 1992. Changing Course. United Nation
Conference on Environment and Development (UNCED), Rio de Janeiro 20
Dyllick T, Hokerts K. 2002

18
absolutes values of the impacts. The “natural case” regards ecological sustainability. It can
be achieved by two paths: eco-effectiveness and sufficiency. The first consists in focusing
and thus reducing absolute amount of emissions, materials, waste, etc. The second is a
criterion that sees companies responsible of customer choices towed by brand and
marketing policies adopted.
Finally there is the “societal case”. The first principle to reach social sustainability is socio-
effectiveness. From this perspective “business conduct should be judged not on a relative
scale but rather in relation to the absolute positive social impact a firm could reasonably
have achieved”21
. Food or pharmaceutical industries, for example, should strive in
providing its products to poor countries as well. The other guiding principle is ecological
equity. The current generation that is consuming the world’s natural capital, should take
care about the consequences that future generations will receive. A problem related to this
criterion is the total lack of indicators that can drive companies to this kind of
sustainability.
The following picture (figure 3) shows the three different cases of sustainability with the
specifics challenges that occur within the “shear zones”.
21
Dyllick T, Hokerts K. 2002 p.138
Figure 3: Business, Natural and Societal Cases of
Sustainability (source: Dyllick T, Hokerts K. 2002 p.138)

19
Although the three cases of sustainability represent the foundations of sustainability
performance, a deeper explanation could help to understand which aspects are important in
managing practically sustainability within a business reality. Epstein and Roy22
classified
nine principles of sustainability:
- ethical standards and practices in dealing with all stakeholders
- governance based on trust, consciousness and effectiveness
- transparency of information disclosures
- fair business relationships
- financial return to investor and lenders
- community involvement and economic development
- value of products and services (respect needs, desires and rights of customers)
- employment practices (development, diversity and work conditions of employees)
- protection of the environment
From these values, corporate sustainability can be seen more as a practical matter of
management; discussions, analysis, measurements and reports about sustainability issues,
in the business reality, are related mainly to the above cited principles23
.
This section provided the theoretical and practical definition of corporate sustainability, and
identified the disciplines that embrace the evolution of the concept. Corporate sustainability
is an evolutionary concept coming from different disciplines and concerning the integrated
management of economic, environmental and social aspects of an Organization. The
interest of companies for achieving environmental protection and social equity
simultaneously with profit, is acquiring a growing importance nowadays. The reasons go
beyond the compliance with legislation and embrace the field of competition. Next section
will try to find the connections between sustainability and competitive advantage.
22
Epstein M J, Roy M J. 2003. Improving Sustainability Performance: Specifying, Implementing, and
Measuring Key Principles. Journal of General Management 29,I: 15-31 23
Epstein M J. 2008

20
1.2 Sustainability and Competitiveness
Many people from the academic world as well as the business environment have been
interested in finding the relations between corporate sustainability and competitive
advantages. The KPMG International Survey of Corporate Responsibility Reporting 200824
documented that there are eleven motivations why companies take the path of sustainability
for competitive reasons:
- Ethical considerations
- Economic considerations
- Reputation or brand
- Innovation and learning
- Employee motivation
- Risk management or risk reduction
- Strengthened supplier relationship
- Access to capital or increased shareholder value
- Market position (market share) improvement
- Improved relationships with governmental authorities
- Cost savings
Depends on the level of commitment and formalization of practices towards environmental
protection and social equity simultaneously with profitability, sustainability becomes
increasingly a strategic success factor. In order to achieve satisfactory performances in the
aspects above mentioned, companies must consider corporate sustainability as part of their
business strategy. In the “path to corporate responsibility” of Zadek25
five stages of
organizational learning represent the level of commitment and formalization of
sustainability practices. The stages are classified as follow:
- defensive, denying every kind of responsibility on the actions taken;
24
KPMG International Survey of Corporate Responsibility Reporting 2008 P.18 25
Zadek S. 2004. The path to corporate responsibility. Harvard Business Review

21
- compliance, adapting responsibility policies as a cost of business;
- managerial, integrating sustainability with daily business operations;
- strategic, implementing sustainability into business strategy;
- civil, promoting and collaborating with competitors towards responsible business.
The strategic stage is strongly related to the acquisition of competitive advantages of the
first movers. Many industrial sectors such as automobile, food and pharmaceutical are
becoming more sensitive to responsible practices. Evidently, in the future, sustainability
will increasingly represent a main critical success factor. The strategic relevance of
sustainability is emphasized by many other authors. The “strategic frontier” of “the virtue
matrix” of Roger Martin26
is defined as those intrinsic responsible behaviors that bring
benefits to shareholders and society simultaneously. Companies that first move to this
frontier will get the advantage to be unique, dragging the behavior of competitors. The
“logic of social and ecological transformation” represented by Hockerts27
shows three
levels of transformation towards corporate sustainability. The cognitive level is based on
the sole measurement of ecological and social impacts; the normative level takes into
account stakeholder perceptions and claims voiced via the market, politics and public;
finally, in the competitive level, these claims are turned into fields of competitive advantage
through cost and differentiation strategies. But how do firms acquire distinctiveness
through the responsible behavior? What are specifically the aspects on which the
competition is based?
Many contributions in the literature are treating the relations between corporate
sustainability and competitive advantages. Mario Minoja28
identified three types of positive
impacts from corporate social responsibility (CSR here is meant as the large conception of
corporate sustainability) to competitiveness. Firstly, CSR is considered as an integrative
value proposition to customers. They can acquire both, tangible advantages directly
deriving from socially responsible attributes of the products or intangible advantages based
26
Martin R L. 2002. The Virtue Matrix: Calculating the return on Corporate Responsibility. Harvard
Business Review 27
Hockerts K. 2001 based on Dyllick et al. 1997 28
Minoja M. 2008. Responsabilità sociale e strategia: alla ricerca di un’integrazione. Chapter 4: Le
relazioni fra vantaggio competitivo, profitto e “socialità” nelle imprese che integrano la RSI nella strategia.
Egea, Milano
22
on ethical values. In both of cases the positive effect is that more customers will be willing
to buy the product or pay a premium price for it.
Secondly, CSR could facilitate the access to resources valuable, rare and difficult to imitate
that can help to improve the positioning of the firms in the competitive contest in which it
operates. These resources are classified as follow.
- Human resources and professionals skills. Socially responsible organizations are more
able to attract, keep and motivate the best employees.
- Capital. Reduction of legal, reputation and enterprise risks together with ethical
preferences of some investors, aid the access to financial capital.
- Agreement with society. By developing policies of corporate citizenship, organizations
will increase relations with local communities, governments and other authorities in
order to acquire legitimacy to act.
- Trust and reputation. They cannot be acquired in the market of strategic factors but
depend on past good actions and future perspectives.
Finally, the social cohesion is the third type of positive impact coming from CSR. Good
social performances will increase stakeholder relationships. In some cases, such as change
in the strategy, is required a common sacrifice from stakeholders. Social cohesion regards
the unity of strengths coming from all stakeholders for a structural change within the
organization.
Another contribution that emphasizes the positive synergy between social strategies with
economic and competitive results is from Chirieleison29
. The investment for improving
social performances contributes to create the strategic positioning, differentiating the
company with the other competitors in terms of social legitimacy, reputation, visibility and
image. These differences will generate positive effects in the economic and financial
performances. Similarly to Minoja contribution, the main ambits on which the synergies
occur are:
29
Chirieleison C. 2002. Le strategie sociali nel governo dell'azienda. Chapter 3: Strategie Sociali e
Performance Economico-Competitive. Giuffrè, Milano

23
- investment decisions of capital market;
- attraction, management and motivation of human resources;
- customer choices.
Then, another deserving work is the Hockerts’ classification30
of competitive advantages
deriving from sustainability transformation. He classified the advantages as follow:
- Relative cost advantages. A transformation in the competitive field that imposes higher
costs to all firms can be faced by sustainability strategy that allows to meet the new
requirements at relatively lower costs than competitors. One example is a tax on CO2
emissions. Companies that have already developed concrete plans to reduce carbon
emissions will be less hurt by the tax than competitors.
- Relative differentiation advantages. Companies can differentiate their products through
sustainability-related criteria. A good example is the “Fair Trade” label for those
products characterized from a growing anxiety among consumers about unfair
suppliers in the Third world. Some companies acquire relative advantages by offering
“fair products”, to ethical consumers, at higher prices than normal ones.
- Absolute cost advantages. A sustainability-related investment could generate positive
return even in an unchanged competitive field. For instance the purpose of decreasing
the disposal costs can prompt companies to optimize the material flows. Procurement,
inventory and handling costs could be also reduced. In this case the rising disposal cost
has had a discovery function for decreasing other costs.
- Absolute differentiation advantages. Some sustainable innovations can help to
discover new market niches. One example is the Smart car, introduced originally to be
sold to young people who did not want big, environmentally unsustainable cars. But
after it was bought also by elderly people willing to avoid the traffic problems in the
city.
Other authors who have connected positively sustainability with competitive performances
are Kaplan and Norton31
. In the strategy map of the regulatory and social processes, the
30
Hockerts K. 2001

24
aspects of financial perspective affected by sustainability practices (environment, safety
and health, employment, and community) concern the reduction of business risks and the
attraction of socially conscious customers and investors. In particular, based on Forest
Reinhardt’s book32
“down to earth”, they identified five ways for achieving competitive
advantage simultaneously with the improvement of environmental performances: cost
reduction through total quality management and activity-based costing systems; product
differentiation for “green customers” disposed to pay a premium price for “green products”;
management of competitors by establishing new ecological standards for the sector;
redefinition of markets through innovative product policies, and finally, the reduction of
environmental risk (compensation and legal costs, boycotts, loss of reputation and image
etc) related to potential environmental incidents.
Finally, another aspect of competitiveness acquirable through a responsible behavior
regards the investment in the community and social projects in order to be a good corporate
citizen. Cooperation with Non Government Organizations (NGO) seems to acquire notable
importance. The article “Turning gadflies into allies” by Michael Yaziji33
emphasizes the
role of NGOs in the society and the importance of partnering with them. Specifically, he
identified four strengths of NGOs that represent, for corporations, threats and opportunities
at the same time. These strengths consist in: legitimacy, awareness of social forces, distinct
networks and specialized technical expertise. Because of this social power, companies that
will collaborate and cooperate with NGOs can acquire many benefits. Yaziji recognized the
following five benefits:
- Head off troubles by avoiding boycotts, loss of image and reputation, legal costs, etc.
- Accelerate innovation. NGOs are requiring more than the mere economic results,
therefore companies will be motivated to improve societal and environmental aspects
simultaneously with profits.
- Foresee shifts in demand. Since NGOs often leads social movements, consumers’
tastes can be influenced by awareness champagne about the “ethical content” of some
31
Kaplan R S, Norton D P. 2004. Strategy Maps: converting intangible assets into tangible outcomes. Chapter
6: Regulatory and Social Processes. Harvard Business School Press 32
Reinhardt F. 2000 33
Yaziji M. 2004. Turning Gadflies into Allies. Harvard Business Review

25
products or services. In this way companies that collaborate can predict the demand of
alternative ethical products or services.
- Shape legislation. NGOs can influence the Governments’ legislation about tax
policies, regulations of competition, labor and environmental standard, etc.
- Set industry standards by the advantages of the first movers in being ethical business.
The interest in managing sustainability among firms is increasing constantly for reasons
that goes beyond legislation and embrace the competitive sphere. The driving forces
towards more responsible business are: legitimacy, freedom to act, proactive compliance,
good image and reputation, process or product innovations, reduction of waste, eco-
efficiency etc. These are some of the reasons why different businesses are moving towards
sustainability. But how companies should face the implementation of sustainability in the
business strategies? How do they should link them to daily operations? How do they should
manage, account and report sustainability performances? Next section will try to give
answers to these questions.
1.3 Steps towards Sustainability Management
Once the Top Management has decided to undertake the path of sustainability, general
mission, strategies and operative activities must be aligned through the development,
incorporation and communication of general objectives, principles, values, programs,
methodologies and tools within all levels of business activity. In recent years many
business realities have been facing with sustainable management by implementing
Environmental Management Systems (EMS), acquiring certifications ISO 14000 or
SA8000, developing variety of environmental and social accounting and reporting systems,
etc. Nevertheless a common problem is been encountered: sustainability matters have been
left out from the general management of the businesses by the development of separated
and parallels management systems. The outcome of these choices has been the lack of
priority in struggling environmental and social issues, whereas economic and financial

26
aspects were more important and imminent. However, in some cases, companies have
linked sustainability guidelines with corporate strategies, making feasible the daily
integrated management of economic, environmental and social aspects through the business
operations. This latter approach is of course harder but ensures a real connection between
the purposes of be responsible and the concrete actions to undertake.
There are many contributions in the literature concerning the implementation of
sustainability issues into strategies and the related management of sustainability
performances. In the book “Making Sustainability Work” by Epstein (2008) it is presented
a well structured framework of the process for implementing sustainability. From the same
author, in collaboration with Roy34
, a further contribution is “Sustainability in Action:
Identifying and Measuring the Key Performance Drivers”. It focuses on the process to
make sustainability issues and goals concrete actions to take. Another interesting article is
“Integrative Management of Sustainability Performance, Measurement and Reporting” by
Stefan Schaltegger and Marcus Wagner35
. The main point of this latter work concerns the
integration of management tools utilized to make the above mentioned process (Epstein and
Roy’s framework) feasible with the focus on the linkages between performance
measurement and management system with sustainability reporting. With the main support
of these contributions, below it is explained the process or better the steps that a company
must make to move towards sustainability, from the main strategies and objectives, through
the operative targets, to accounting and reporting of environmental, social and financial
facts. The phases identified are the following36
:
- Identification of stakeholders and related environmental and social exposures
- Leadership and implementation of sustainability strategy
- Definition of concrete actions to take
- Design of organizational structure and management systems
- Measurement and communication through sustainability accounting and reporting
34
Epstein M J, Roy M J. 2001. Sustainability in Action: Identifying and Measuring the Key Performance
Drivers. Long Range Planning 34: 585-604 35
Schaltegger S, Wagner M. 2006. Integrative management of sustainability performance, measurement and
reporting. Int. J. Accounting, Auditing and Performance Evaluation, Vol. 3, No. 1 36
The phases are based mainly on: Epstein M J, Roy M J. 2001; and considering also: Epstein M J. 2008;
Figge et al. 2002a, 2002b; Schaltegger S, Wagner M. 2006; Hinna L. 2005; The Copenhagen Charter 1999

27
- Stakeholders’ reaction, financial performance and feedback
1.3.1 Stakeholders and Exposures
A preliminary step that must be made concerns the analysis of current strategies with the
purpose to understand if and how they could impact with sustainability issues like
environmental pollution and damage, energy consumption, human rights, employee
satisfaction, product responsibility, etc. This phase regards the identification of the key
stakeholders and the measurement of the potential environmental and social impacts
(exposures) that could represent critical success factors for the business success37
.
Stakeholders are all the subjects that primarily affect business performances and, at the
same time, are largely affected from company's actions38
; specifically, in the context of
sustainable development, they are impacted by company's social and ecological policies
and actions. Therefore it becomes crucial to understand which stakeholders are the most
relevant and what kind of social or financial pressure they exercise to the company. The
identification of key stakeholders could be done with the support of the matrix
interest/influence39
. The tool, advised in “The Copenhagen Charter”, can be useful to
recognize which stakeholder category exercises high or low influence to the business
activity and, at the same time, what kind of interest, significant or insignificant, the
company detains for each category. Numerous classifications of stakeholders exist in both
business and academic worlds: level of importance, strategic relevance, type of influence,
kind of relation, etc. The following is my own general classification that includes all those
actors which are affected and can affect somehow the firm existence.
- Shareholders
- Financial community
- Employees
37
Epstein M J, Roy M J. 2001, Figge et al. 2002a, Schaltegger S, Wagner M. 2006, Hinna L. 2005 38
Freeman R E. 1984 39
The Copenhagen Charter. A Management Guide to Stakeholder Reporting. 1999. Ernst & Young, KPMG,
PricewaterhouseCoopers, House of Mandag Morgen

28
- Customers
- Suppliers and parteners
- Governments
- Non Government Organizations (NGO)
- Science and Education
- Community
- Society (largely conceived)
After having classified the main stakeholder categories, the identification of the particular
impact exercised for each category is easier. In order to be aware of how the firm actions
are impacting stakeholders, it is necessary to identify the particular environmental and
social exposures related to the company's industry, market, geographical location, process
technology, labor policy and practices, etc. “Different types of tools and techniques can be
used to measure potential social and environmental impacts of a company’s business
activities” [….]. “Life Cycle Assessment (potential environmental impact through R&D,
sourcing, manufacturing, packaging, marketing, sales, distribution, consumer use, and
disposal) and social audits are powerful tools to help companies to better understand the
environmental and social characteristics of their business activities”40
. Stakeholders and
exposures identified constitute the field of action for developing the sustainability
strategies, the organizational structure, plans, programs and actions.
1.3.2 Leadership and Strategy
The starting point of the process towards corporate sustainability is a clear and strong
commitment of top management to implement and communicate strategy. Board of
directors, CEO and management must focus on the best ways of communicating vision,
mission and strategy to all levels of organization. Corporate leaders must align business
goals with environmentally and socially responsive activities, providing internal credibility
to promote the improvement of social and environmental management within the whole
40
Epstein M J, Roy M J. 2001 pp.590-591

29
organization. The commitment of top management encourages the employees to behave in
ways that are acquiescent and reliable with company strategy41
.
Business strategy must be the starting point for sustainability. Corporate and business unit
strategies regard the choices, the guidelines and the philosophies of a company's
management to reach certain objectives established by a general mission. Formulating a
strategy entails the examination of the kind of industry the company is operating, in which
market it is competing, the ways how it is organizing the resources and utilizing the
competencies42
. Strategy defines the identity of a company in the relations with the
environment (here refers to stakeholders), underlining what, why and how it does or it
wants to make the business activity43
. Since managerial behavior and operative actions are
affected by general strategy, internal and external drivers that can really address company's
actions to integrated social, ecological and financial goals must be embodied into business
strategies. In this sense, moving towards sustainability gives rise to the necessity of
following a process to implement these new ecological and social philosophies and values
inside the general guidelines of the business management.
Once stakeholders and relative impacts have been identified, next step consists in
formulating the sustainability strategy. It should contain the main goals, the guidelines, the
values and the obligations related to ecological and social issues such as emissions in the
air and water, energy consumption, labor practices, employees diversity, etc. Epstein
classified three stages of sustainability strategies that reflect the commitment towards full
corporate sustainability44
. Stage 1 is the simple management of regulatory compliance;
stage 2 regards the achievement of competitive advantage; and stage 3 consist in the
completion of social, economic and environmental integration. This latter stage is about
managing sustainability as a routine in all the levels of the organization. In this sense,
strategy must be made feasible, in other words, it should be adapted to the business unit
41
Epstein M J. 2008 42
For deepening the concept of “Strategy” see Coda V. 1995. L'orientamento strategico dell'impresa. Utet
Università, Milano 43
Coda V. 1995 p.24 44
Epstein M J. 2008. p.64-67

30
level and the local daily operations. For this purpose it can be useful to deepen the concept
of Balanced Scorecard45
.
BSC is a management tool that translates strategies into actions. The major feature of this
instrument is the multidimensional conception of business performances. For this
characteristic it can efficiently face the main challenges of corporate sustainability
management46
; sustainability issues can be easily incorporated in the several management
perspectives of balanced scorecard and the related performances can be monitored through
adequate key performance indicators (KPI). KPIs are linked in cause and effect “chains”
(strategy map) that focus on the relations between different objectives and perspectives,
clarifying how environmental and social performances affect the financial ones47
.
When the connection between sustainability strategy and operations is clear, next step is
about planning the right actions in line with the general guidelines.
1.3.3 Actions
Based on the main objectives established, the third step is about planning concrete actions
to carry out in order to be responsible and sustainable. Epstein and Roy, in their framework,
have treated the development of plans and programs. They distinguished two ways of
developing plans and programs. One regards the improvement of environmental and social
performances. It could be made by improving the existing routines or facing radical
changes. “They may include capital investments in new technologies, product or process
redesign, or R&D spending, [...] programs to promote ethical sourcing, work force
diversity, or more stringent codes of conducts in terms of labor practices”48
. Further actions
concern investments in social communities, training programs, ISO certifications,
preventions and safety programs. The second way to develop plans and programs concerns
the promotion of sustainability performance to the stakeholders. It provides at the same
time responsibility as well as communication to stakeholders. “These initiatives may
45
Kaplan R S, Norton D P. 1996. The Balanced Scorecard: Translating Strategies into action. Harvard
Business School Press: Boston 46
SBSC will be treated next chapter 47
Schaltegger S, Wagner M. 2006 48
Epstein M J, Roy M J. 2001 p.592

31
include marketing efforts to promote social and environmental product features, lobbying
efforts to governmental agencies related to social and environmental issues, [...] community
surveys to assess public opinion on the company’s social and environmental performance
and community advisory panels”49
. In addition, external reports should be provided to
stakeholders. They should contain information about sustainability policies, actions taken
and results reached50
. The actions mentioned regard only some of the possible ways for
translating the strategies in terms of plans a programs.
Once leadership commitment is been addressed to the development and communication of
sustainability strategies, and plans and programs have been established, companies need to
implement them through appropriate organizational structures and management systems51
.
They will be presented in the next paragraph.
1.3.4 Organizational Structure and Management Systems
This phase could be considered as the hardest. Based in a change of corporate culture, it
requires the alignment of strategy, organizational structure and management systems
towards the coordination of activities and the motivation of employees.
The first step that must be made, in order to align organizational structure with
sustainability strategy, is the involvement of the whole organization in the sustainability
practices. By making a deep assessment of all the value chain activities, it is possible to
identify the particular impacts that each functional area is exercising, the responsibilities
and the potential ways to reduce these impacts. Both primary and support activities of the
value chain are fundamental for reaching financial, ecological and social goals. Hence, each
functional department must be involved in promoting sustainability52
.
Afterward, the development of several management systems is crucial for supporting
corporate sustainability. “To drive a sustainability strategy through an organization, various
management systems such as product costing, capital budgeting, information, and
49
Epstein M J, Roy M J. 2001 p.592 50
Hinna L. 2005 51
Epstein M J. 2008 52
Epstein M J. 2008

32
performance evaluation must be designed and aligned”53
. Performance evaluation systems
should be built and developed in order to monitor sustainability facts. Therefore,
sustainability measures must be developed. Incentives and rewards should be established to
drive managers and employees behavior to excellence in sustainability outcomes. In order
to monitor and assess the actions taken, key performance indicators (KPI) should be
elaborated. The strategies must be translated to measurable targets and other measures
should be developed for monitoring the level of achievement of plans and programs.
One really interesting framework, given by Schaltegger and Wagner, concerns the
integration of several management tools for supporting sustainability management. They
have built a framework that links at first “business strategy with sustainability performance
measurement and management” and consequently “performance measurement and
management with reporting and communication”54
. This link can be characterized by two
perspectives: “outside-inward perspective” and “inside-outward-perspective”. The first,
based on external considerations, “will screen publicly discussed issues, communicate the
corporate contribution to these issues and thus define measurement and management
activities on basis of these issues”. The latter approach “is based on the business strategy
and the analysis of what issues are relevant for an effective implementation of the strategy
and to succeed with this strategy”. They have focused their framework more on the “inside-
outward-perspective”. It regards the strategic management of the crucial aspects of
stakeholder relationship and thus which ones should be measured and managed in a
communicative interaction. Is matter of selecting those sustainability performance
indicators that are important for stakeholders and the business success55
. “The management
task is to identify strategy-related sustainability issues, to account for them and finally, to
report them”56
. The result is an integrated framework for sustainability performance
measurement and management that links several management tools: sustainability balanced
scorecard, sustainability accounting and sustainability reporting (see figure 4).
53
Epstein M J, Roy M J. 2001 p.594 54
Schaltegger S, Wagner M. 2006. Integrative management of sustainability performance, measurement and
reporting. Int. J. Accounting, Auditing and Performance Evaluation, Vol. 3, No. 1 p.3 55
Hinna L. 2005. Come gestitre la reponsabilità sociale dell’impresa. Chapter 6 Le fasi del processo di
relazione con gli stakeholder nell’ambito dell’orientamento alla Rsi (The Copenhagen Charter). Il sole 24 ore 56
Schaltegger S, Wagner M. 2006. p.4

33
As showed in the figure 4, the main steps to reach this integration are:
- identification of environmental and social exposure of the business
- analysis of strategic relevance of environmental and social aspects
- development of causal chains and the strategy map
- definition of key performance indicators and development of the measurement
methods to create the respective performance information
- consideration of the identified key sustainability performance indicators in the
company internal and external communication and reporting activities
- BSC implementation, revision and reporting on sustainability indicators.
Figure 4: An integrated framework for sustainability performance
measurement and management linking the SBSC, sustainability accounting
and sustainability reporting (source: Schaltegger S, Wagner M. 2006 p.5)

34
These steps made clear the linkages between SBSC, accounting and reporting system.
General standard indicators based on the industry, sector etc, are taken into consideration
(outside-inward-perspective) but the choices about key performance indicators (KPI) used
in the overall performance system are mainly driven by strategic considerations and
stakeholders relevance (inside-outward-perspective). Sustainability accounting system,
then, provides the right elaborated data useful to feed reporting requirements as well as
strategically relevant information. Sustainability performance management could be seen,
in this way, “strategy-focused”. This means that operational activities are based on KPIs
identified. For this purpose, accounting system needs a considerable change pointing to the
implementation of environmental and social issues with their economic and financial
impacts. The accounting system must be oriented towards the provision of the needed data
for developing KPIs. The outcome is an accounting system characterized by a mix of
several indicators: strategic and operational, monetary and non-monetary, quantitative and
qualitative. Through such as accounting system, SBSC is linked to sustainability reporting.
Next paragraph will be dedicated to the accounting and reporting systems.
1.3.5 Measurement and Communication
Sustainability accounting and reporting can be described as the system of activities and
techniques to collect, processing and disclose information about environmental and social
impacts, induced economic and financial outcomes, links and interactions between the three
dimension of sustainability, social, environmental and economic. Therefore sustainability
accounting can be considered as a new information management system while
sustainability reporting concerns new way of communication based on the provision of
information about corporate sustainability. Connection between accounting and reporting is
fundamental; sustainability issues accounted must be communicated and information has to
be trustworthy in order to create a feedback process of continuous development of
accounting and communication practices towards the improvement of sustainability

35
performances57
. This relation is reinforced by the strategic character of sustainability
accounting; KPIs identified in SBSC approach have to be properly calculated and
accounted in order to increase the quality of disclosure. Reliable and strategy-related
reporting, by contrast, influence stakeholder reactions and feedback towards better
accounting and performances58
.
Among the major motivations for firms to make public sustainability reports there are: the
communication with stakeholder about non-market issues, the motivation of employees to
deal with sustainability, the scope to increase legitimacy, credibility and reputation among
the society59
. Recently it is increasing the necessity to standardize accounting, performance
measurement and reporting procedures. The need of systematic measurement about social
and environmental issues conducted to some initiatives (Global Reporting Initiative is the
most important) pointing to the utilization of sector specific performance indicators. The
trend towards the standardization will facilitate comparability and transparency of
information between different firms. Standards will also help the development of a unique
integrated accounting and reporting system. The existence of these reporting guidelines
arises the problem of which way should be used to manage sustainability performances60
:
strategy and accounting-driven sustainability reporting (inside-out perspective) or
reporting-driven sustainability accounting (outside-in perspective)? “Both the inside-out
and the outside-in approaches are related to each other. On one hand, a good corporate
strategy has to consider external stakeholder expectations and requirements and thus is not
isolated from reporting requirements. On the other hand, good corporate reporting requires
substantive performance results which can be demonstrated only on the basis of relevant,
reliable, comparable and understandable information about corporate sustainability”61
. But
how are structured corporate sustainability accounting and reporting? Which are the main
challenges that drive the accounting process? How is organized the “new sustainability
information system”?
57
Schaltegger S, Bennett M, Burritt R. 2006. Sustainability Accounting and Reporting. Chapter 1:
Sustainability Accounting and Reporting: Development, Linkages and Reflection. Berlin, Springer 1-33 58
Hinna L. 2005. The strategic relevance of the KPI and the functioning of sustainability accounting is better
deepened in: The Prince’s Accounting for Sustainability Project 2007. Connected Reporting: a practical
guide with worked examples. accountingforsustainability.org London 59
Hinna L. 2005 60
Schaltegger S, Bennett M, Burritt R. 2006 61
Schaltegger S, Bennett M, Burritt R. 2006 p.17

36
Based on the triple bottom line concept, Shaltegger, Bennet and Burritt developed a
framework concerning the challenges of sustainability and the related accounting
dimensions. They based their work on the “sustainability triangle” (see figure 5). Similarly
to figure 3, it shows the three dimensions of sustainability and the relative challenges of
managing them with their relations.
It could be noticed that in the corners of the triangle is shown the effectiveness while in the
lines the efficiency. Effectiveness, measurable through absolute indicators, represents a
goal of a single dimension (ecological, social and economic) of the triangle. Efficiency
expresses the relation between different dimensions and is thus measured with relative
indicators such as eco-efficiency. On the top of the triangle there is the economic
effectiveness. Concerning the most classic business management goal, it consists in the
achievement of the best possible economic result. Hence it is not particularly aimed as a
corporate sustainability objective that usually is focused on ecological, social, economic
and integration challenges.
The ecological challenge is to increase Eco-effectiveness. “Ecological effectiveness
measures the absolute environmental performance and is a general description of the extent
Figure 5: Sustainability Triangle (source Schaltegger S,
Bennett M, Burritt R. 2006 p.8)

37
to which the targeted objective of minimizing environmental impacts has actually been
achieved”62
. The main problems related to the environment embrace greenhouse effect,
destruction of ozone stratum, acidification and over-nitrification of soil and water,
declining biodiversity, toxic emissions harmful to humans and the environment,
desertification etc. To deal with ecological challenge, companies should aim to absolute
reductions in the above mentioned environmental impacts of production processes,
products etc. The provision of information is made by physical environmental accounting
tools such as product life cycle assessment (LCA) that contains aggregated indicators of
eco-effectiveness. Examples of absolute indicators are: CO2 emissions, quantity of
materials utilized, amounts of energy and/or water consumed and wasted, other toxic
emissions etc.
The social challenge is to increase the social effectiveness. The main challenge of social
sustainability is to take care about the diversity of social, cultural and individual demand
while managing the business success. In other words, ensuring a stable profitability,
companies should acquire, at the same time, social acceptance and legitimacy to act. Socio-
effectiveness is a sustainability measure aiming to reduce the absolute amount of negative
social impacts while increasing positive impacts and benefits relative to expectations of
society. Due to the different cultural contexts (equality of rights, fairness, equity of needs,
etc.) where firms operate, these expectations differ from a reality to another one. It means
that is difficult to satisfy completely different and unlimited human needs. Encountering
these problems, it gets difficult to establish a general accepted concept of absolute social
impact; thus it becomes complicated to account and report socio-effectiveness. Some social
indicators are the ones related to the employees’ work conditions, development and
diversity such as wages, working hours, percentage of women, people with disabilities,
training hours, health and safety programs/investments, etc. Others indicators are related to
product safety, respect of essential human rights, “healthy” relationships and partnerships,
social programs (donations, funds to NGO etc.).
Then there is the economic challenge. “The economic challenge to environmental and
social management aims to improve eco-efficiency and socio-efficiency”63
. Economic
62
Schaltegger S, Bennett M, Burritt R. 2006 p.9 63
Schaltegger S, Bennett M, Burritt R. 2006 p.10
38
sustainability challenge regards the improvement of environmental and social performances
while increasing company’s value and profitability. Social equity and environmental
protection can be achieved in parallel with increase of revenue and reduction of costs. The
criteria to measure economic success are based on the efficiency.
Eco-efficiency can be measured with the ratio of an economic value to a physical
environmental impact measure. “It can be defined as the ratio of value added to
environmental impact added per unit, where environmental impact added is equivalent to
the sum of all environmental impacts which are generated directly or indirectly by a
product or activity”64
. The WBCSD (1992) has identified seven elements that businesses
can use to improve their eco-efficiency: reduce material intensity, reduce energy intensity,
reduce dispersion of toxic substances, enhance recycling, maximize use of renewable
energy, extend product durability, increase service intensity65
. Examples of indicators are:
value added or contribution margin per tons of CO2 emitted, revenues per liter of fuel or
watt of energy consumed and so on.
Socio-efficiency like eco-efficiency can be measured with the ratio of an economic value to
a quantified social impact measure. It “can be defined as the ratio of value added to social
impact added, where social impact added represents the sum of all negative social impacts
originating from a company, product, process or activity”66
. Socio-efficiency measures,
similarly to socio-effectiveness ones, rely on social impacts or value created. Hence
weakness in measuring socio-effectiveness makes also difficult and troublesome the
development of accounting for socio-efficiency. Examples of indicators are: value added
per number of employees’ accidents, value added or revenue per investment in healthy and
safety, etc.
Finally, the integration challenge concerns the integration of the three challenges over
mentioned. It must be reached by combining and simultaneously satisfying the goals of the
other challenges. Integration challenge is the hardest one and thus critical for corporate
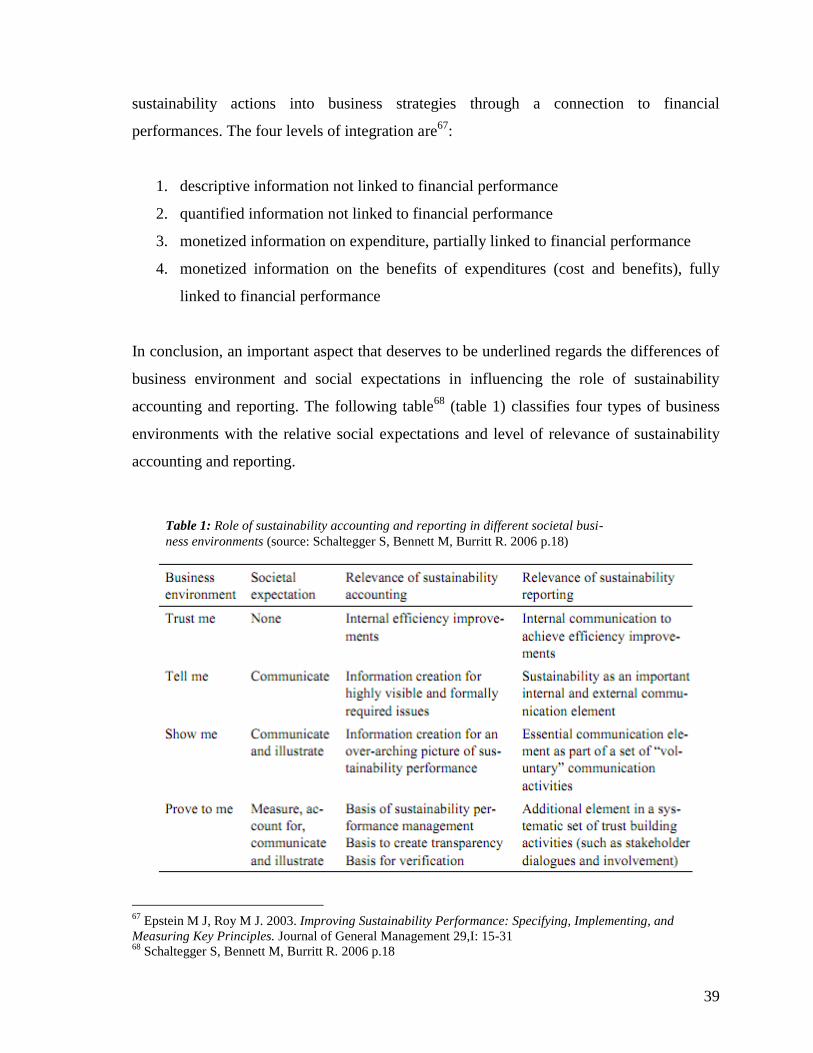
sustainability accounting and reporting. Epstein and Roy classified four possible levels of
integration of sustainability reporting. These levels represent the progressive integration of
64
Schaltegger S, Bennett M, Burritt R. 2006 p.11 65
WBCSD (World Business Council for Sustainable Development). 1992. Changing Course. United Nation
Conference on Environment and Development (UNCED), Rio de Janeiro 66
Schaltegger S, Bennett M, Burritt R. 2006 p.11
39
sustainability actions into business strategies through a connection to financial
performances. The four levels of integration are67
:
1. descriptive information not linked to financial performance
2. quantified information not linked to financial performance
3. monetized information on expenditure, partially linked to financial performance
4. monetized information on the benefits of expenditures (cost and benefits), fully
linked to financial performance
In conclusion, an important aspect that deserves to be underlined regards the differences of
business environment and social expectations in influencing the role of sustainability
accounting and reporting. The following table68
(table 1) classifies four types of business
environments with the relative social expectations and level of relevance of sustainability
accounting and reporting.
67
Epstein M J, Roy M J. 2003. Improving Sustainability Performance: Specifying, Implementing, and
Measuring Key Principles. Journal of General Management 29,I: 15-31 68
Schaltegger S, Bennett M, Burritt R. 2006 p.18
Table 1: Role of sustainability accounting and reporting in different societal busi-
ness environments (source: Schaltegger S, Bennett M, Burritt R. 2006 p.18)

40
Measurement and communication regard crucial aspects in managing sustainability. The
awareness of environmental, social and financial integrated performances is essential in
order to know the real advantages of the responsible business. Well structured information
systems can help to answer promptly to existing problems, for example improving the
management system or planning new sustainability strategic objectives. The
communication is also important; information collected and elaborated must be properly
communicated, internally, for continuous improvements and externally for building a stable
dialogue with stakeholders.
1.3.6 Stakeholder Reaction, Financial Performance and Feedback
Short and long term economic and financial performances are all influenced by stakeholder
reactions from sustainability performances from which they are affected. Sustainability
performances, concerning for instance employee diversity, human rights, environmental
impacts, product safety and ethical sourcing influence stakeholders’ reactions and thus
financial performances. Customer loyalty, for example, ensures long term revenues;
reliability of work environment increases employees’ satisfaction and productivity; aware
and pleased community about ecological and social protection gives legitimacy to act and
good image; the part of financial community based on social criteria would react positively,
facilitating the access to further funds; finally, satisfied shareholders will keep long term
capital within the business activity69
.
Short term (costs and benefits) and long term financial performances are influenced from
all the elements discussed. Typical cost reductions and benefits are energy optimization,
waste reduction, material substitution, avoidance of fines and legal conflicts with NGO and
local communities. Long term financial performances are the ones related to the durable
profitability and growth depending on customer loyalty, employees’ satisfaction, and good
relations with neighbors, NGO, regulators and ethical financial communities.
69
Epstein M J, Roy M J. 2001. Sustainability in Action: Identifying and Measuring the Key Performance
Drivers. Long Range Planning 34: p.588

41
An important aspect of the framework is the feedback process that should be undertaken to
improve the sustainability management system. It must rely on continuous review of the
system and the development of a learning organization toward the optimization of the
company’s environmental, social and financial performances and the related reporting.
Hinna70
emphasized the importance of consulting the stakeholders in order to receive a
feedback on:
- performance achieved;
- comprehensibility of information disclosed and the Key Performance Indicators;
- ways and channels of communications;
- quality of relationship;
- connection between mission and values with the facts attained.
In order to understand better the functioning of the process over mentioned is helpful to
rely on the graphic illustrations of the general framework by Epstein and Roy (see figures 6
and 7).
70
Hinna L. 2005 p.226
Figure 6: Drivers of sustainability and financial performance (source: Epstein M J, Roy M
J. 2001 p.588)

42
Figure 6 shows the process of sustainability management. Everything starts from the
development of strategies aimed to improve sustainability performances. What they called
“sustainability actions” represent the support of the elaborated strategies. They concern the
investments addressed to improve sustainability performances. Then, stakeholders’
reactions will influence long term corporate financial performance. This latter will be
influenced as well by the sustainability actions, thus, both costs (investments) and benefits
of actions will affect the financial results. Finally, the feedback process will be the support
for developing new strategies or modifying the existing ones. Figure 7 takes as starting
point the same components of the framework in figure 6 and gives the metrics, both
financial and non-financial, that need to be monitored to evaluate the sustainability actions.
Summarizing, in this section it is been showed the process to implement sustainability
practices within the general management of the business. Incorporating environmental,
social and related economic objectives into strategy is the challenge of corporate
sustainability. Once sustainability enters in the strategy level of the organization, the other
challenge is to make it action. First of all, organizational structure must be involved in the
Figure 7: Metrics of sustainability and financial drivers (source: : Epstein M J, Roy M J. 2001
p.601)

43
process and then, sustainability management systems have to be developed. Targets,
initiatives and measures must be elaborated and information has to be reported to the
stakeholders. In order to make real this process several management tools must be utilized
and integrated. At first sustainability balanced scorecard should translate strategy into
operative targets and measures. Then accounting system should work for collecting data
and elaborating them for the reporting disclosure. Reliability of information will stimulate
interactive communication with stakeholders and feedback process towards the
improvement of sustainability performance outcomes as well as the sustainability
management system.
Next chapter will be dedicated to the deepening of the concept of Sustainability Balanced
Scorecard and the process of implementation of the managerial instrument.

44
Chapter 2
Sustainability Balanced Scorecard
2.1 Traditional Balanced Scorecard
The concept of Balanced Scorecard (BSC) has been developed by Robert S. Kaplan and
David P. Norton in the early 1990s. It was firstly conceived as a management tool aimed to
improve the existing traditional performance measurement systems, which were addressed
to measure and monitor manly economic and financial performances with the relative
evaluation of only tangible assets71
. “Since the efficient use of investment capital cannot be
longer the sole decisive aspect of competitive advantage, traditional financial measures are
not sufficient to explain business performances. Many companies have lack of techniques
to manage, quantify and improve intangible capital. Performance measurement systems
should evaluate also company’s intangible and intellectual assets, such as high quality
products and services, motivated and skilled employees, responsive and predictable internal
processes, and satisfied and loyal customers”72
.
Originally Kaplan and Norton developed BSC concept as a measurement tool that links
financial perspective with customer, internal process and learning & growth, emphasizing
the importance of operational measures that drive future financial performance73
. Therefore
it was seen only as a balanced set of key performance indicators. But balanced scorecard is
more than a performance measurement tool. Subsequently they addressed and focused their
framework on the relevance of linking business strategy with activities and operations
strategically relevant for the achievement of objectives established. Strategy should be
translated and causally linked in terms of operative planning. In this perspective, BSC can
be seen as a strategic management tool that translates strategies into actions. This new
71
Kaplan R S, Norton D P. 1992. The Balanced Scorecard. Measures that Drive Performance. Harvard
Business Review 72
Kaplan R S, Norton D P. 1996. The Balanced Scorecard: Translating Strategies into action. Harvard
Business School Press: Boston 73
Kaplan R S, Norton D P. 1992

45
approach of the framework was driven by the emerging concept, at that moment, of
“strategy map”74
. Strategy maps refer to the causal relations between domains of
management and elements of the strategy in the key perspectives of BSC (financial,
customers, processes, learning and growth). Cause and effect chains indicate the relations
between operations, activities and results within the four perspectives of BSC. In order to
better understand the functioning of the BSC, it is useful to deepen the features and
linkages among these perspectives. They are characterized as follows75
.
The financial perspective concerns the traditional financial objectives of conventional
management and accounting systems utilized for the measurement of economic success.
Focusing on the importance of so-called value drivers for future profitability, the purpose
of this perspective is to define and measure the financial performances a strategy is
expected to achieve. At the same time it is the endpoint of cause and effect relationship
with the other perspectives.
The customer perspective identifies the relevant customers and market segments in which
the business competes and that contribute to the financial goals. Customer value is
established through the identification of the necessities of current and future markets.
Products, services and processes are aligned to these needs for the achievement of
competitive advantage.
The internal processes perspective identifies those value-driving processes that permit the
company to meet the expectations of customer and shareholders. This perspective regards
the internal operations that must be done in order to satisfy customer needs.
The learning and growth perspective concerns the intangible infrastructure required for the
attainment of the goals of all the other perspectives. Due to the increasing importance of
human resources as critical factor of success, this perspective emphasizes the qualification,
motivation and goal orientation of employees. Considerable importance is given also to the
development of information systems.
The main function of the BSC is to develop a hierarchical system of strategic goals in the
four perspectives. For each perspective appropriate strategic objectives, measures, targets
74
Kaplan R S, Norton D P. 1996, 2003, 2004 75
Kaplan R S, Norton D P. 1992, 1996

46
and initiatives are established and aligned with the business strategy towards the financial
goals (figure 8). The causal system of interaction between and within the different
perspectives, thus, is based on measures formulated for each perspective and linked through
cause and effect relations. These measures, better known as key performance indicators
(KPI), are distinguished by Kaplan and Norton in lagging and leading indicators.
Lagging indicators, expressing the strategic core issues of each perspective, specify
whether a strategic goal of a perspective is been achieved. Leading indicators represent the
key performance drivers that have the influence on the attainment of strategic core goals
measured by lagging indicators. They express how the results (lagging indicators) should
be achieved. These drivers (leading indicators) are integrated in the four perspectives and
aligned to the business strategy by the translation of the main strategic objectives in
measures and targets. Therefore, for each perspective, strategic core issues are defined and
Figure 8: The Balanced Scorecard and its Perspectives (source: adaptation of Kaplan R
S, Norton D P. 1996)

47
key performance drivers are identified. Measures and targets are hierarchically linked
towards the financial perspective containing the final objective of long term economic
success. The result is a cascade system, or better a strategy map, where one perspective is
causally linked to another one from the learning and growth perspective to the financial
one. Hence, lagging indicators of a lower level in the strategy map could act as leading
indicators of the higher level perspective (see figure 9).
The balanced scorecard then must be systematically integrated into the management system
of the organization by establishing strategy oriented operative budgets and continuous
feedback loop of the system. Another focal point emphasized by Kaplan and Norton is the
need of a regular training, internal communication of strategies, incentives and rewards
system to involve the employees in the accomplishment of strategic objectives.
After having analyzed functions and features of BSC, one question arises: what is the
relation between Balanced Scorecard and corporate sustainability? The idea to utilize BSC
as an environmental and social management tool was already been suggested by Kaplan
Figure 9: The Strategy Map (source: Kaplan R S, Norton D P. 2004)

48
and Norton in the late 1990s. As it can be seen in the image about strategic map above, the
internal process perspective comprises regulatory and social processes that include
environment, community, employment, safety and health76
. The function of BSC, to
translate strategy into operative targets monitored by physical KPIs, is decisive in order to
incorporate environmental and social strategies and manage them through daily operations.
Sustainability management with BSC tries to integrate the problems of improving
simultaneously corporate performances in all the three dimension of sustainability:
economic, environmental and social77
. Ecological and social issues must be managed
within the perspectives through the establishment of operative targets. Then, the
hierarchical structure of BSC will allow to link ecological and social goals within the
perspectives with the endpoint perspective of economic success (financial perspective).
Next section will explain better the implementation of sustainability issues in the BSC
through the introduction of the concept of Sustainability Balanced Scorecard.
2.2 Implementing Environmental and Social Aspects: Towards Sustainability
Balanced Scorecard
The growing interest for a development that takes care about environmental protection and
social equity simultaneously with the evolution of the studies about strategic and
performance management have driven the idea to implement social and ecological issues
within the Balanced Scorecard (BSC). Many contributions in the literature78
as well as
companies' attempts faced and are still facing the challenge to manage sustainability as a
strategic objective, integrating it with economical and financial long term performance
management. Before to show the different possible ways to incorporate sustainability in the
BSC, is useful to keep in mind some important principles for developing the tool.
76
Kaplan R S, Norton D P. 2004. Strategy Maps: converting intangible assets into tangible outcomes.
Chapter 6: Regulatory and Social Processes. Harvard Business School Press 77
Figge F, Hahn T, Schaltegger S, Wagner M. 2002a. The Sustainability Balanced Scorecard. Linking
Sustainability Management to Business Strategy. Business Strategy and the Environment 11, 269–284 78
Zingales et al. 2002, Figge et al. 2002a,b, Hockerts K. 2001, Bieker et al. 2001, Hamner 2005

49
“When defining and implementing a Sustainability Balanced Scorecard, strategic, cultural,
structural as well as methodological aspects seem to be most relevant”79
. First of all
sustainability strategies must be elaborated within a strategic planning process that define
goals, indicators and measures to address the employees. Then, cultural factors play
important role. Introducing a new management tool implies changes in corporate culture;
the new instrument, with the related new way of management, should be internally
accepted. Hence commitment of top management and involvement of departments and
employees are crucial. Another aspect that deserves to be emphasized is the corporate
structure. It is important to integrate SBSC in the general management of the business in
order to avoid the development of separate management systems (one example is when the
environmental management system is independent than the core one). Environmental and
social issues should be managed as core aspects, in combination with long term financial
performances, within a single management system. Finally, process-related and
methodological factors are significant. A management calendar of work and sufficient
resources must be provided. Then, internal resistances should be overcome by building a
system of indicators approved by employees. In order to do this, the process to develop the
SBSC must rely on a combination of top down as well as bottom up decision making80
.
After having showed the fundaments of SBSC, it is opportune to give a definition.
Sustainability Balanced Scorecard is a “strategic approach targeted to improve the
integration of environmental, social and economic aspects of corporate sustainability
measurement and management”81
. Therefore, SBSC is a strategic approach because of the
main function, consisting in translating strategies into operative targets through the
development of KPIs in each perspective. In addition, SBSC aims to improve the
integration of environmental, social and economic aspects because of the cause and effect
relations among the different indicators, objectives and thus perspectives. Finally, the
purpose of SBSC is to measure sustainability performances in order to better manage the
environmental, social and economic dimensions in line with the strategy.
79
Bieker T. 2005 p.3 80
Bieker T. 2005. Sustainability management with the Balanced Scorecard. Institute for Economy and the
Environment, University of St. Gallen (IWOe-HS) 81
Schaltegger S, Wagner M. 2006 p.6

50
From this definition of SBSC, it could be deducted that many features are the same than
traditional BSC conception. The main difference regards the introduction and emphasis of
the social and ecological aspects. Thus it is matter of implementing the new sustainability
aspects, exploiting the multidimensional nature of BSC. In the literature, several
approaches of implementing environmental and social issues within BSC can be identified.
The first contribution taken into consideration is the implementation of the most relevant
sustainability aspects inside the four perspectives of BSC. Here, environmental and social
aspects are integrated in the four perspectives by building selected bridges between
environmental and social accounting system and the existing BSC. Such approach would
look only to few sustainability impacts with a specific strategic relevance in some BSC
dimensions, and will translate them in lagging and leading indicators82
. In this way the
logic behind the BSC remain almost the same; the economic sphere is the one to be more
emphasized and sustainability aspects that are outside the market mechanism are not
considered83
.
Another approach that deserves to be mentioned is the one of Kaplan and Norton. In their
book, “Strategy Maps: converting intangible assets into tangible outcomes” (2004), they
have deepened the management of sustainability aspects through the introduction of the
“regulatory and social processes”. They are meant as those internal processes of
management addressed to optimize the performances related to environment, safety and
health, employment and community84
. In this approach, despite the integration of
sustainability aspects remains inside the four perspectives of BSC, Kaplan and Norton take
into consideration also environmental and social aspects that are not integrated in the
market exchange process (investment in community, foundations, NGO partnerships, etc),
trying to highlight the possible competitive advantages related to the market as well as non-
market processes.
One further contribution is given by Figge, Hahn, Shaltegger and Wagner through their
article: “The Sustainability Balanced Scorecard – linking sustainability management to
business strategy” (2002). This approach regards the introduction of an additional non-
market perspective. Since environmental and social facts come from non-market system
82
Hockerts K. 2001 83
Figge et al. 2002a 84
Kaplan R S, Norton D P. 2004

51
and social constructs, often they represent externalities and thus not considered as
important factors for the competitiveness. “Environmental and social aspects as social
constructs can emerge in all spheres and can become strategically relevant for firms
through other mechanisms than the market exchange process”85
. Given these features of
some sustainability issues, an additional perspective is needed86
. It should integrate
strategically relevant but non-market related environmental and social aspects. These
aspects can impact economic performances both, directly to the financial perspective, or
indirectly, through the other perspectives. The development of strategic objectives, targets,
measures and causal relations, follows the same process as the traditional BSC.
One extension of the mentioned approaches is given by the same authors. It regards the
deduction of a derived environmental and social scorecard. It cannot be developed as a
single independent tool but, as said above, is just an extension of the main BSC that relies
on the general strategies of the business. This specific sustainability oriented BSC could be
useful to clarify, and thus better coordinate, the cause and effect relations between
ecological, social and economic integrated aspects.
The following illustration (figure 10) shows the structure of the SBSC and subsequently
there is an example of the SBSC of Hamburg Airport. Environmental and social aspects
that depend directly from the market exchange process are contained in the traditional
perspectives (learning and growth, process and customers). Other sustainability aspects
which not belong to the “market perspectives”, but strategically relevant, are inserted in the
non-market perspective. The example of Hamburg Airport (see figure 11) is the practical
case of a strategy map with the real causal connections among the several strategic
objectives within the perspectives. Cause and effect relations between the several
sustainability objectives are showed through the arrows. In addition to the traditional
perspectives of the BSC, it can be seen the non-market perspective, represented in the
image by the “location perspective”. This perspective is in connection with all the other
perspectives and influence, directly or indirectly, the financial goals. A better explanation
of the strategy map with the non-market perspective and the deepening of causal relations
85
Figge et al. 2002a. p.274 86
Figge F, Hahn T, Schaltegger S, Wagner M. 2001. The Sustainability Balanced Scorecard – a tool for
value-oriented sustainability management in strategy-focused organizations. Conference Proceedings of the
2001 Eco-Management and Auditing Conference.ERP Environment: Shipley; 83–90

52
among sustainability objectives will be given at the end of chapter 3 through the case
developed about Lufthansa Passenger Airline.
Non-market
perspective
Financial Perspective
Process Perspective Learning and Growth
Perspective
Customer Perspective
Business and sustainability strategies
Figure 10: The Sustainability Balanced Scorecard (source: adaptation of Kaplan R S,
Norton D P. 1992, adaptation of Figge et al. 2001)
Figure 11: Sustainability Balanced Scorecard of Hamburg Airport (source:
Schaltegger S, Wagner M. 2006 p.8 based on Diaz Guerrero et al. 2002)
53
Next section will deepen the process of developing a Sustainability Balanced Scorecard
through some technical as well as strategic phases.
2.3 The Process of Implementing a SBSC
Every process of implementation and development of a new management instrument within
an organization is usually characterized from some practical-technical steps, as well as
some cultural-strategic crucial phases. From the numerous studies about the utilization of
balanced scorecard for managing sustainability development within a company, I have
identified two main contributions regarding the process for developing a SBSC. One is
focusing more on the measurement aspects of the tool, trying to highlight the cause and
effect relations among the several ecological, social and financial indicators and the
connections with strategic guidelines. This contribution, given by Figge et al. (2002), is
developed in two articles: “The Sustainability Balanced Scorecard – Linking Sustainability
Management to Business Strategy” and “The Sustainability Balanced Scorecard – Theory
and Application of a Tool for Value-Based Sustainability Management”.
The other approach, really new in the literature, is one article written by Caroline Cheng,
Annik Fet and Elsebeth Holmen (2010), “Using a Hexagonal Balanced Scorecard
approach to integrate Corporate Sustainability into Strategy”. This work takes as starting
point the criticism of the reliability of cause and effect relations in the SBSC. It emphasizes
more the strategic-cultural process for developing a SBSC, shifting the emphasis from
causal measurement aspects to the learning ones. The practical-technical process is the first
to be dealt.
2.3.1 The Practical-Technical Process
Figge87
distinguished three steps for formulating a SBSC (see figure 12): the choice of
strategic business unit, the identification of environmental and social exposures and the
87
Figge et al. 2002 a,b.

54
determination of strategic relevance of environmental and social aspects. Big companies
usually act through several business units that have different products/services, serve
different customers and are organized in different profit center. Therefore they implement
different business strategies. Small companies have usually one business unit with one
corresponding strategy while big companies have many business unites with different
corresponding strategies. The importance to identify the single organizational unit of
business is crucial in order to mange the relative strategy.
Next step developed by the authors is the identification of environmental and social
exposures of the business. Many types of activities carried out in a company generate
several kinds of impacts in the environment as well as in the society. Therefore all the
potential and strategically relevant impacts arisen from the business activity must be listed
by category. For this purpose two generic frameworks can be used88
. The first framework
concerns the identification of environmental exposures. Business unites, with their
activities, are responsible for causing problems in the environment in term of emissions,
pollution, waste etc. The ecological impacts originated from the business operations,
processes and products should be traced in terms of physical and/or chemical impacts
generated. The purpose is to build a table that emphasizes the business unit specific
88
Figge et al. 2002a
Figure 12: Process of formulating a SBSC (source: Figge et al. 2002a
p.277)

55
environmental exposures by type of emission, waste or damage (see table 2). In the
following table the column on the left shows the generic types of impacts in the
environment; the one on the right describes the specific kind of emission, waste, energy,
etc.
Similarly to the environmental aspects, social exposures of a business unit can be identified
and classified by categories. Nevertheless, the big differences within the society, the variety
of cultures, laws, religions, traditions among different geographical locations and the lack
in common accepted social performance standards, generate problem for classifying social
exposures. Social aspects, differently than ecological ones, are more difficult to identify
and quantify. They depend on the values and choices of the different actors involved in the
company’s activities. Hence, Figge, relying on stakeholder theory89
, developed an approach
that classifies social claims according to the different actors involved and thus affected by
business activity. The framework distinguishes among several kinds of relevant stakeholder
groups: internal, along the value chain, in the local community and societal. Furthermore
these are clustered in direct (direct material resource exchange flow) and indirect (no direct
exchange flow). The first step of the framework regards the identification of particular
89
Figge et al. 2002, Freeman R E. 1984
Table 2: Environmental Exposures (source:
Figge et al. 2002a p.277)
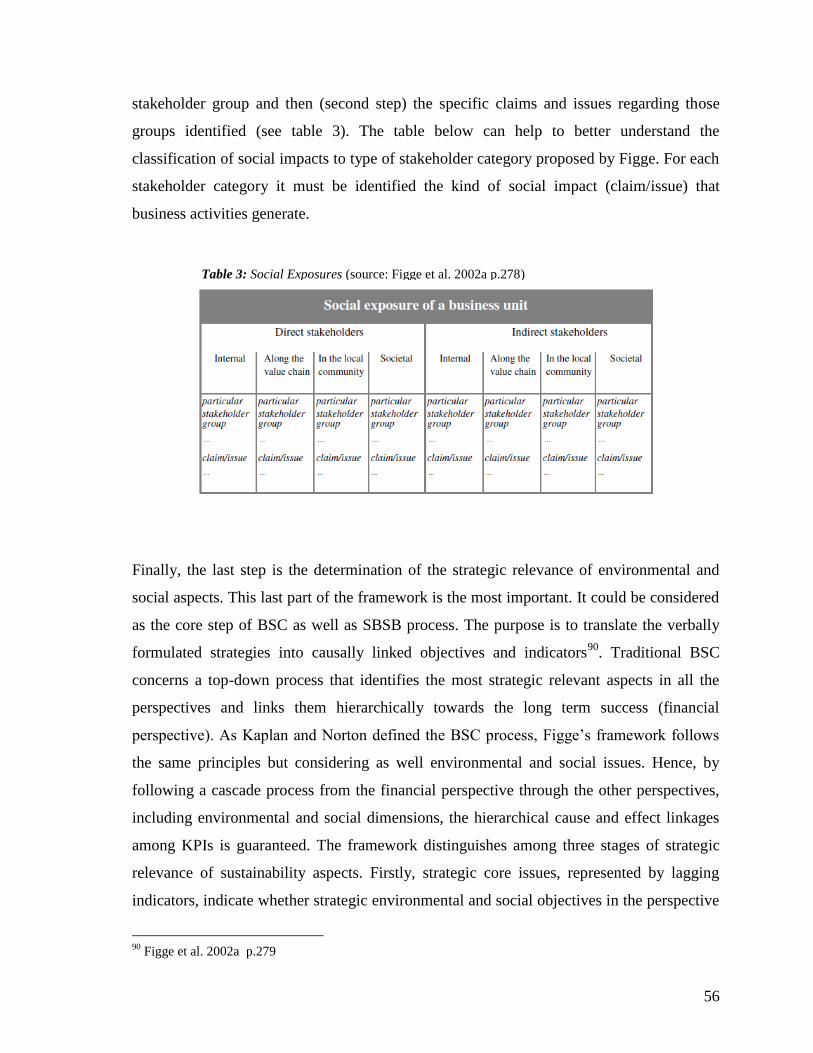
56
stakeholder group and then (second step) the specific claims and issues regarding those
groups identified (see table 3). The table below can help to better understand the
classification of social impacts to type of stakeholder category proposed by Figge. For each
stakeholder category it must be identified the kind of social impact (claim/issue) that
business activities generate.
Finally, the last step is the determination of the strategic relevance of environmental and
social aspects. This last part of the framework is the most important. It could be considered
as the core step of BSC as well as SBSB process. The purpose is to translate the verbally
formulated strategies into causally linked objectives and indicators90
. Traditional BSC
concerns a top-down process that identifies the most strategic relevant aspects in all the
perspectives and links them hierarchically towards the long term success (financial
perspective). As Kaplan and Norton defined the BSC process, Figge’s framework follows
the same principles but considering as well environmental and social issues. Hence, by
following a cascade process from the financial perspective through the other perspectives,
including environmental and social dimensions, the hierarchical cause and effect linkages
among KPIs is guaranteed. The framework distinguishes among three stages of strategic
relevance of sustainability aspects. Firstly, strategic core issues, represented by lagging
indicators, indicate whether strategic environmental and social objectives in the perspective
90
Figge et al. 2002a p.279
Table 3: Social Exposures (source: Figge et al. 2002a p.278)
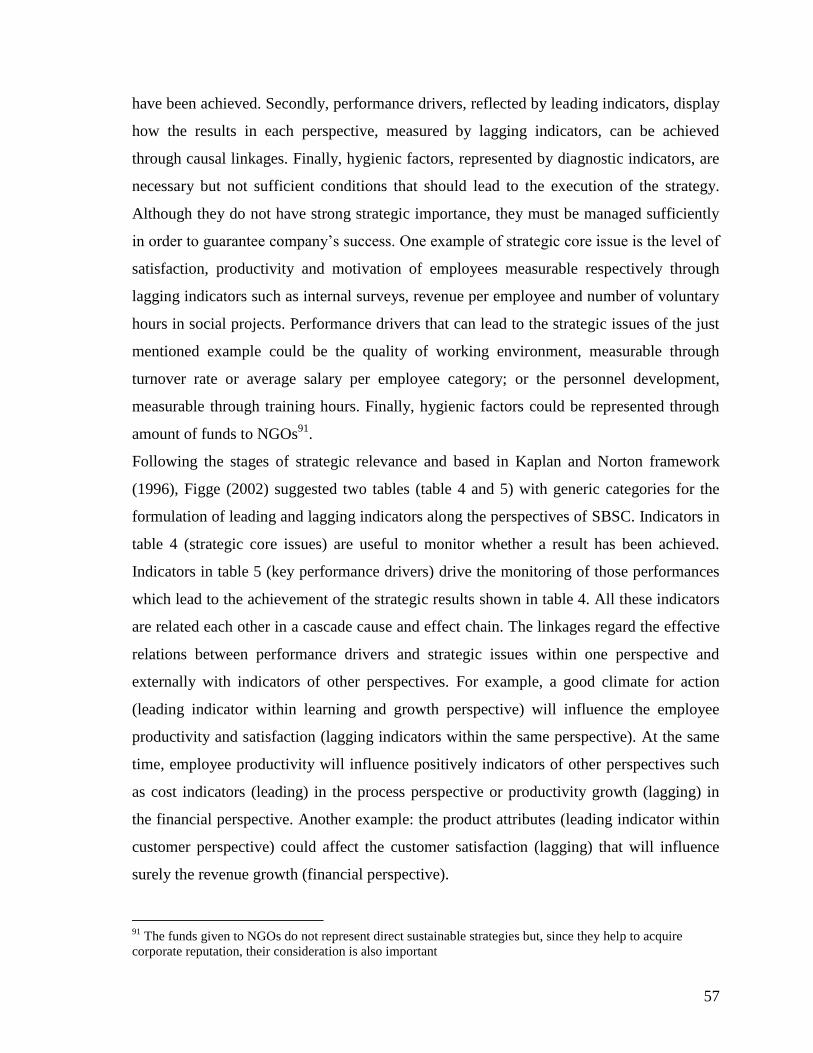
57
have been achieved. Secondly, performance drivers, reflected by leading indicators, display
how the results in each perspective, measured by lagging indicators, can be achieved
through causal linkages. Finally, hygienic factors, represented by diagnostic indicators, are
necessary but not sufficient conditions that should lead to the execution of the strategy.
Although they do not have strong strategic importance, they must be managed sufficiently
in order to guarantee company’s success. One example of strategic core issue is the level of
satisfaction, productivity and motivation of employees measurable respectively through
lagging indicators such as internal surveys, revenue per employee and number of voluntary
hours in social projects. Performance drivers that can lead to the strategic issues of the just
mentioned example could be the quality of working environment, measurable through
turnover rate or average salary per employee category; or the personnel development,
measurable through training hours. Finally, hygienic factors could be represented through
amount of funds to NGOs91
.
Following the stages of strategic relevance and based in Kaplan and Norton framework
(1996), Figge (2002) suggested two tables (table 4 and 5) with generic categories for the
formulation of leading and lagging indicators along the perspectives of SBSC. Indicators in
table 4 (strategic core issues) are useful to monitor whether a result has been achieved.
Indicators in table 5 (key performance drivers) drive the monitoring of those performances
which lead to the achievement of the strategic results shown in table 4. All these indicators
are related each other in a cascade cause and effect chain. The linkages regard the effective
relations between performance drivers and strategic issues within one perspective and
externally with indicators of other perspectives. For example, a good climate for action
(leading indicator within learning and growth perspective) will influence the employee
productivity and satisfaction (lagging indicators within the same perspective). At the same
time, employee productivity will influence positively indicators of other perspectives such
as cost indicators (leading) in the process perspective or productivity growth (lagging) in
the financial perspective. Another example: the product attributes (leading indicator within
customer perspective) could affect the customer satisfaction (lagging) that will influence
surely the revenue growth (financial perspective).
91
The funds given to NGOs do not represent direct sustainable strategies but, since they help to acquire
corporate reputation, their consideration is also important

58
The result of such process could be represented by a strategy map92
. The strategy map
shows graphically the hierarchical network of cause and effect chains between strategically
relevant economic, environmental and social aspects. Once sustainability aspects have been
identified and linked in the strategy map model and indicators have been defined, next step
is to establish targets and initiatives in order to drive corporate performances towards
sustainability. One interesting contribution in the literature about the development of a
SBSC strategy map is given by Kay Hockerts93
in which he provides an illustrative
example of SBSC for eco-efficiency. Despite the example is limited on the consideration of
the sole ecological aspects related to the business, this illustration provides very important
issues of environmental performance management along the perspectives of balanced
scorecard, implications, targets, indicators and causal linkages that address them to the long
term financial goals (see figure 13).
92
Kaplan R S, Norton D P. 2004 93
Hockerts K. 2001 and adaptation in Bieker T, Dyllick T, Gminder C U, Hockerts K. 2001. Towards a
sustainability balanced scoreard: linking environmental and social sustainability to business strategy.
Institute for Economy and the Environment, University of St. Gallen (IWOe-HS), INSEAD Center for the
management of Environmental Resources, Fontainebleau, France
Table 4: Generic categories for the formulation of lagging indicators (source: Figge et al.
2002a p.279)
Table 5: Generic categories for the formulation of leading indicators (source: Figge et al.
2002a p.280)
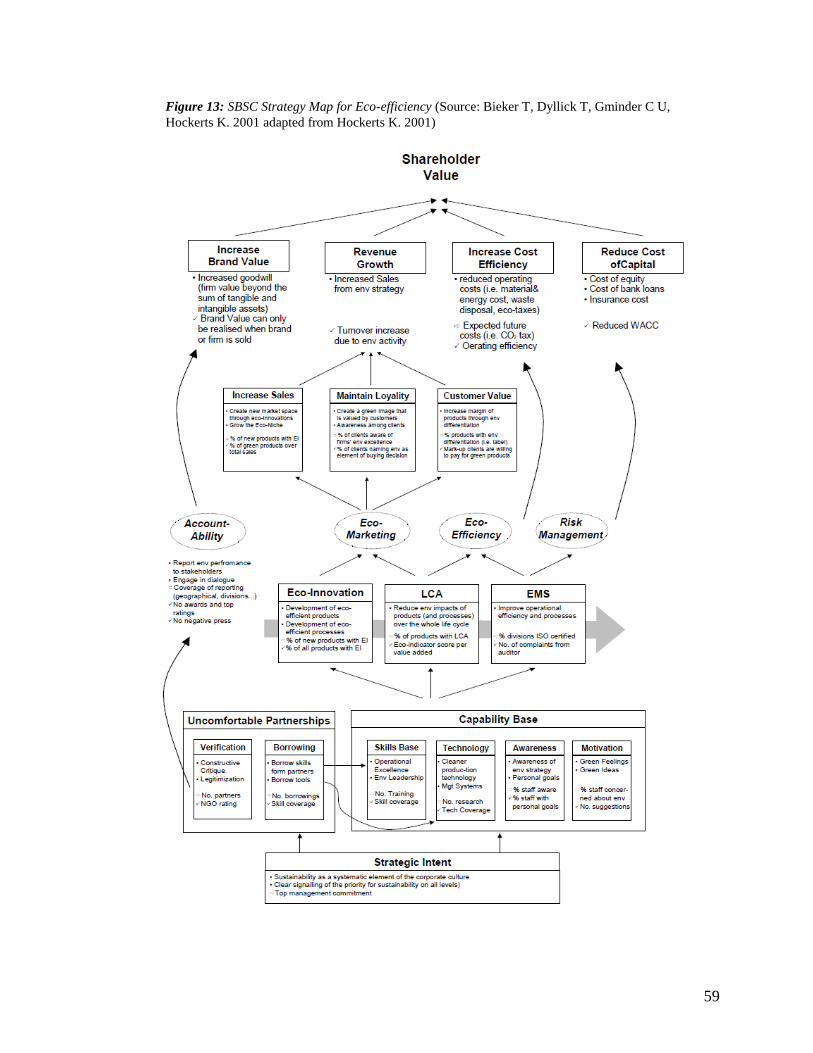
59
Figure 13: SBSC Strategy Map for Eco-efficiency (Source: Bieker T, Dyllick T, Gminder C U,
Hockerts K. 2001 adapted from Hockerts K. 2001)

60
The above mentioned contributions establish an exhaustive framework that strictly relies on
the practical phases for internalizing sustainability issues into general management of the
company by the implementation of SBSC. Nevertheless, it has to be noticed that the
introduction of a new management tool requires a change in the organization’s culture,
achievable through the diffusion of the awareness among the people about the new
practices and objectives, and a well structured communication process. In order to do so, a
strategic approach is required to better implement and continuously improve the
effectiveness of such management tool. Next approach emphasizes such a strategic process
to implement SBSC.
2.3.2 The Cultural-Strategic Process
The other framework could be considered as an evolution of the just cited, from the
conventional measurement focus to a mechanism that facilitates bottom-up strategy
planning and learning within the daily operations94
. In their article, Cheng, Fet and Holmen
(2010), introduced the concept of Hexagonal Balanced Scorecard, where environmental and
social perspectives are added to the four traditional ones. Hexagonal BSC “links these six
perspectives in logical flow rather than in a cause and effect relationship. “The six
perspectives also represent key stakeholder categories”95
.
This “new” Balanced Scorecard approach is graphically represented as a hexagon (see
figure 14) where the bottom half (learning and growth, internal process and customer
perspective) constitutes the intangible assets of the company while the top half
(environmental, societal and financial) represents the “triple bottom line”96
dimension. The
logical relations of this model start from the learning and growth perspective which focus
on employees, skills and knowledge. Like the former approach (see strategy map), after
general sustainability strategy is formulated, this perspective is taken as starting point.
94
Cheng C Y, Fet A M, Holmen E. 2010. Using Hexagonal Balanced Scorecard approach to integrate
Corporate Sustainability into Strategy. Department of Industrial Economics and Technology Management,
Norwegian University of Science and Technology, Trondheim 95
Cheng C Y, Fet A M, Holmen E. 2010 p.8 96
Elkington J. 1997. Cannibals with Forks: the Triple Bottom Line of 21st Century Business. Capstone,
Oxford

61
Spreading awareness and knowledge about sustainability issues among the people in the
company increases the sensitivity and proactive behavior of human resources towards
environmental and social objectives. The difference of this new approach is that it does not
pretend to build causal relations with the other perspectives but just logical ones and thus,
specific strategy is formulated for each perspective and relative stakeholder group. Strategic
objectives could be summarized as follow:
- developing higher order capabilities for sustainable development (learning and
growth)
- quality and productivity of internal processes within and outside the value chain
(internal process)
- unique value proposition (customer)
- environmentally sustainable economic activity (environmental)
- transforming social problems into business opportunities (societal)
- long term sustainable profitability
Similarly to the practical process, indicators are also established for monitoring the
performances of each perspective but, differently than the previous approach, the emphasis
Figure 14: Hexagonal Balanced Scorecard (source: Cheng C Y,
Fet A M, Holmen E. 2010 p.8)
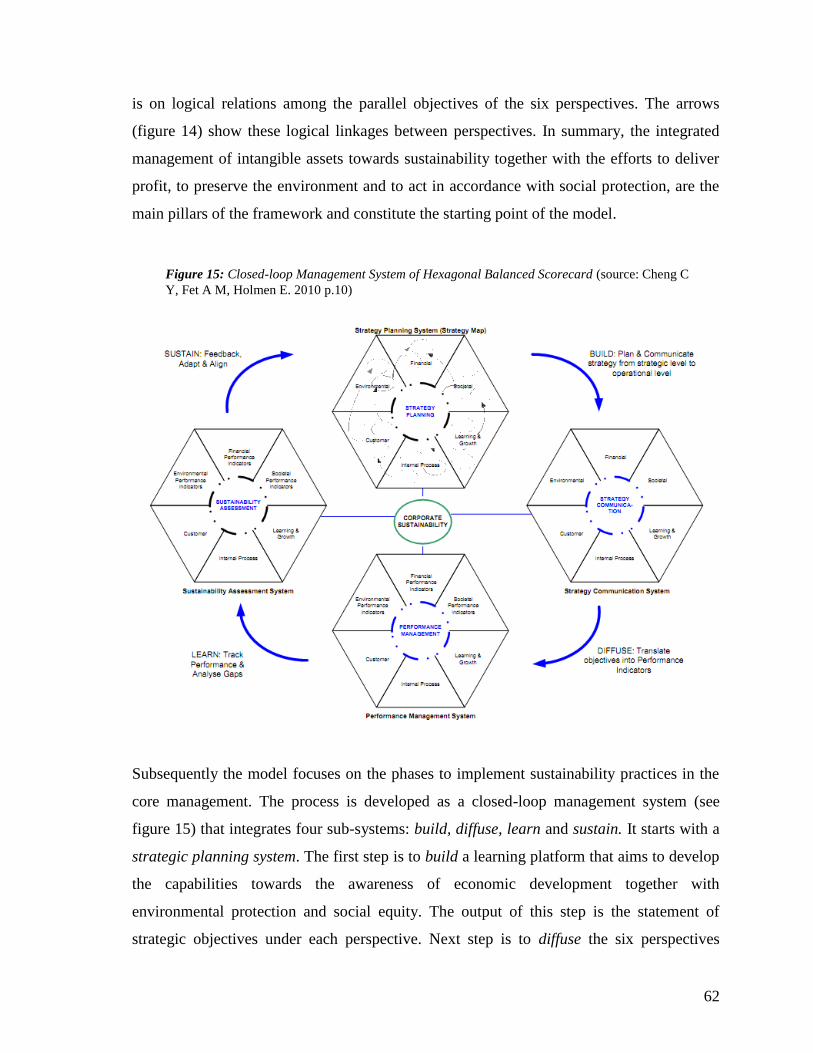
62
is on logical relations among the parallel objectives of the six perspectives. The arrows
(figure 14) show these logical linkages between perspectives. In summary, the integrated
management of intangible assets towards sustainability together with the efforts to deliver
profit, to preserve the environment and to act in accordance with social protection, are the
main pillars of the framework and constitute the starting point of the model.
Subsequently the model focuses on the phases to implement sustainability practices in the
core management. The process is developed as a closed-loop management system (see
figure 15) that integrates four sub-systems: build, diffuse, learn and sustain. It starts with a
strategic planning system. The first step is to build a learning platform that aims to develop
the capabilities towards the awareness of economic development together with
environmental protection and social equity. The output of this step is the statement of
strategic objectives under each perspective. Next step is to diffuse the six perspectives
Figure 15: Closed-loop Management System of Hexagonal Balanced Scorecard (source: Cheng C
Y, Fet A M, Holmen E. 2010 p.10)

63
objectives through a specific top-down communication process (strategic communication
system) to business unit, operational and individual level. Then, objectives will be
translated into specific performance indicators for each perspective in the performance
management system. The output is a selective set of KPIs to monitor in order to learn and
improve sustainability performances. The last sub-system of the cycle is the sustainability
assessment system. This final step consists in a bottom-up mechanism, based on the
occurrences and problems faced at the operational level, which aggregates the knowledge
acquired for the feed-back process. Performances and gaps reported in internal and external
reports must be the starting point of such feed-back. Then, strategy should be readapted and
realigned to the organization’s needs in order to sustain sustainability performances.
In this section it is been dealt the topic of implementation of SBSC. Both the technical and
the cultural processes are crucial in order to change the general management approach
towards sustainability. Practical steps for translating environmental and social strategies
into actions are very important. Strategically relevant sustainability exposures, related
indicators and causal relations are fundamental elements for managing sustainability. At the
same time, a cultural process is needed with focus on continuous learning and feedback, in
order to build and extend the human capital attitudes towards better environmental, social
and economic integrated management. The optimal management of these aspects is
required in order to be successful in terms of sustainability performance.
Next chapter will be dedicated to a practical case of the real world. The aviation is one of
industrial sectors with a growing interest for corporate sustainability. For this reason, next
chapter will be dedicated to sustainable development in the airline industry with the
deepening of the particular case about the German carrier Lufthansa.
64
Chapter 3
Corporate Sustainability in the Airline Sector: Simulation of
SBSC in Lufthansa
3.1 Airline Sector and Sustainable Development
In the context of sustainable development the aviation sector plays an important role for
two main reasons: in one hand, it brings many social and economic benefits; in the other
hand, it is environmentally and socially responsible for many reasons. Air transport
industry could be considered as one of the major contributors to global economy prosperity
and, at the same time, it plays an important role in acting towards sustainable development.
Before to describe social benefits created and responsibility of airline companies, is
necessary to introduce some important recent facts that have regarded the sector.
In the last ten years, the airline sector has been facing a plenty of turbulence due to
important internal and external factors that affected the industry. Global events destabilized
the world's economy in the past decade. Terrorist attacks in 2001, SARS epidemic in 2003,
financial crisis in 2008 and continuous significant increase in fuel prices contributed to a
slowdown and the biggest historic loss of the airlines in 200897
. Furthermore, internal
factors affected the sector with the change of the competitive scenario. The deregulation
and the restructuring of the industry contributed to the establishment of private low cost
companies and the switching of the big national carriers from public to private sector with
management systems focusing on quality of services, continuous efficiency and more
competitiveness. Cost cutting, diversification of services and continuous efficiency
97
Jordao T C. 2009. A sustainability overview of the best practices in the Airport Sector. Faculty of
Economics and Administration, Institute of Public Administration and Law, Pardubice, Czech Republic
For better deepening the historical data of the aviation sector see:
- ATAG (Air Transport Action Group). The Economic And Social Benefits of Air Transport 2008
- ICAO (International Civil Aviation Organization). ICAO Environmental Report 2010
- IATA (International Air Transport Association). Fact sheet 2010

65
characterized the new competitive environment; new management challenges have arisen
from the new scenario98
.
Despite these negative influences from external as well as internal factors, airline sector
(here I refer to passenger transportation segment) experienced an historical strong growth in
traffic volumes and revenues. Since 1970, when the 383 million of passengers flown, the
annual average rate of growth is been a bit more than 6% per year with a peak of 14,9% in
2004, when the revenues were about 295 billion $ (+17,7% from 2003). Traffic volume and
revenues registered a drop caused by the global financial crisis in 2008 and 2009.
Nowadays the sector is again growing. The number of passenger carried is nearly 2.3
billion with about 430 billion $ of revenues and passenger traffic is expected to grow at an
average rate of 4.8% per year through the year 203699
.
Economic and social benefits generated from aviation sector are many. Air transport makes
possible the existence of a global network that links people, countries, cultures and arises
opportunities for more integration and development. In the world operate about 2000
airlines with a total fleet of 23.000 aircrafts. They serve nearly 3.750 airports through a big
network of several million kilometers managed by about 160 air navigation service
providers. Air transport generates economic growth by facilitating tourism (40% of tourist
worldwide travel by air), trade (35% of total value of international trade), improving
productivity by encouraging investment and innovation, and opening up new market
opportunities. Considering direct, indirect, induced and catalytic impacts, the industry
generates a total of 32 million jobs globally (5,5 million direct jobs, 6,3 million indirect
jobs, 2,9 million induced jobs and 17,1 million catalytic jobs) and an economic impact
estimated in 3.560 billion $ (408 billion $ direct, 2.500 billion $ catalytic), equivalent to
7,5% of world Gross Domestic Product. In addition, other social benefits are generated.
They concern the strong commitment towards sustainable development, the access to
remote areas, the delivery of humanitarian aids and the contribution to consumer welfare100
.
The sector is still expanding and the future growth depends strictly on economic growth
and technical innovations that allow decreasing the costs. According to economic forecasts,
98
Lynes J K, Andrachuk M. 2008, Yilmaz A K. 2008 based on Stanford University
http://adg.stanford.edu/aa241/intro/airlineindustry.html 99
IATA. Fact sheet 2010, ICAO. ICAO Environmental Report 2010 100
ATAG (Air Transport Action Group). The Economic And Social Benefits of Air Transport 2008

66
the annual economic growth between 2010 and 2030, expressed as GDP world average,
will be 4% per year. Furthermore technical innovations in aviation sector are continuously
improving towards better efficiency. These factors are making positive growth expectations
in air passenger traffic, estimated at an average rate of 4,8% per year for the same period.
The optimistic forecast generates the problem of sustainable growth especially related to
environmental issues. ICAO Environmental Report 2010 identifies three main aspects of
sustainability in the air transport: noise generation, local air quality and climate change.
With regard to noise generation, aircraft entering today’s fleet are 20 decibels quieter than
50 years ago (75% reduction in noise generation). Nevertheless, in 2006 the world
population exposed to more than 55 DNL (55 decibels day night average sound level)101
was 21,2 million. In 2036 the people worldwide exposed to this level of noise will range
from 26,6 to 34,1 million. This means that despite the improvements in noise generation,
the noise impact is expected to increase, arising new challenges in terms of noise
reduction102
.
Regarding the local air quality, airlines affect the environment through the generation of
two main emissions: Nitrogen Oxides and Particular Matters. The emissions of Nitrogen
Oxides (NOx) below 3.000 feet were 0,25 million metric tons (Mt) in 2006. NOx emissions
are expected to increase between 0,52 Mt (+ 2,4% per year) and 0,72 Mt (+ 3,5% per year)
in 2036. Moreover the Particular Matter (PM) release below 3.000 feet is estimated to rise
from 2.200 metric tons in 2006 to 5.800 metric tons in 2036 (+3,3% per year)103
. Therefore,
local air quality is also expected to get worse by airlines’ emissions in the future.
Finally, the most important issue regards the climate change. It is influenced mainly from
the emissions of Carbon Dioxide, better known as CO2. Air transport’s contribution to
climate change represents 2% of CO2 emissions by human activities worldwide and this
impact could reach 3% by 2050. The release of CO2 in the air is caused by fuel
consumption. In 2006 aircraft worldwide consumed approximately 187 Mt of fuel and this
is expected to increase at a rate between 3% and 4% per year. Despite today’s aircraft fleet
are 70% more fuel-efficient than 40 years ago (the datum of consumption is 3,5 liters per
passenger per 100 Km and 25 Million tons of CO2 have been saved in 2006-2007), an
101
For better understand the noise measures and limits within the airline industry see ICAO 2010 page 23 102
ICAO 2010, ATAG 2008 103
ICAO 2010, ATAG 2008

67
additional fuel efficiency gain is targeted to face the continuous growing impact of fuel
consumption. The ICAO Program of Action on International Aviation and Climate Change,
agreed in 2009, set a goal of 2% annual fuel efficiency improvement until the year 2050104
.
Although the improvements towards more efficient technologies to reach better fuel
efficiency, the utilization of bio-fuels, important improvements for decreasing noise and
reducing NOx and PM emissions, the environmental and social challenges towards more
sustainable airlines remain important for the sector. Furthermore, it must be taken into
consideration also the social responsibility. It regards work conditions, employment
policies, safety and health standards for employees and customers, selection and relations
with suppliers, compliance and so on. Many motivations are driving airlines and other
companies in general to move in the direction of sustainability. They can be summarized as
follow105
:
- Long-term financial strategy (e.g. investing in efficient and low-emission
technologies);
- Eco-efficiency (e.g. reduction in expenses as a result of savings achieved through
waste reduction);
- Competitive advantage;
- Good corporate citizenship;
- Image enhancement;
- Stakeholder pressures;
- Desire to avoid or delay regulation action.
Due to these several factors, airlines are trying to better manage their businesses in a
sustainable way, trying to achieve exhaustive integrated performance in all the dimensions
of sustainability. But which is the real commitment of the sector towards better
management of ecological and social issues? How are the different airlines facing the
challenge of sustainable development?
104
ICAO 2010, ATAG 2008 105
Lynes J K, Andrachuk M. 2008. Motivation for corporate social and environmental responsibility: a case
of Scandinavian Airlines. Journal of International Management 14, 377-390 p.380

68
An interesting contribution in the literature is given by Jordao and Ben Rhouma with the
article “An Assessment of the Attitude of World’s Largest Airlines towards Sustainability”
(2010). With the intend to provide a meaningful contribution for Global Reporting
Initiative (GRI), the article concerns the development of a grid of sustainability indicators
specifically designed for the airline sector with the related performance evaluation. The
study regards the assessment of 48 passenger airlines with two different perspectives of
sustainability management: the Triple Bottom Line and the Stakeholders’ Engagement.
They noticed that between 1999 and 2009 only five airlines adopted GRI guidelines and
indicators: British Airways (1999), Air France-KLM (2004), Iberia (2004), Asian Airlines
(2006) and SAS (2009). Also Lufthansa has released comprehensive and well elaborated
sustainability reports using their own framework of indicators different than GRI.
Furthermore, there are only three airlines listed in the DJSI (Down Jones Sustainability
Index) and FTSE4Good index: Lufthansa, Air France-KLM and Iberia106
.
As mentioned above, the assessment has been developed considering two different
perspectives. Regarding the TBL perspective, indicators were classified in relation to the
three dimensions of sustainability; concerning the Stakeholders engagement, indicators
were classified in relation to the different categories of stakeholders identified (see table 6).
The results of the assessment reflect how airlines worldwide are moving towards corporate
sustainability. Among the more sustainable European carriers they identified Air France-
KLM, Lufthansa, SAS, Iberia and British Airways. Considering also worldwide airlines the
best practices are Singapore Airlines, Korean Air, Qantas Airways, Cathay Pacific and
Asiana Airlines107
. It should be noticed that the cited assessment was influenced partially
by the quality and completeness of the sustainability reports disclosed by the carriers.
Hence it represents more a report-driven assessment.
106
Jordao T C, Rhouma A B. 2010. An Assessment of the Attitude of World's Largest Airlines towards
Sustainability. Faculty of Economics and Administration, Institute of Public Administration and Law,
Pardubice, Czech Republic 107
Jordao T C, Rhouma A B. 2010

69
The above presented illustration shows just some of the possible indicators utilizable for
monitoring corporate sustainability performances. In the next section a more detailed list of
indicators is developed from a corporate sustainability case of the real world. The case is
about the German carrier Lufthansa, its sustainability strategic guidelines and the utilization
of balanced scorecard for translating strategy into operative targets through the
development of performance indicators related to the identified sustainability objectives.
Indicators Stakeholders Triple Bottom Line
Dividend payouts Shareholders
Economic
Consistent codes of conducts Shareholders
Fines and sanctions for incidents of non-compliance Shareholders
Policies and Initiatives against Corruption and Bribery Shareholders
Economic growth and job creation Government
Taxes and other charges Government
Punctuality and management of flight Customers
Social
Baggage handling Customers
Compliance to laws and regulations Government
Procurement system adopted by airlines Suppliers
Cabin Staff Service Customers
Supplier relationship Suppliers
Supplier training Suppliers
Sponsorship and community investment Society
Diversity in the workplace Employees
Personnel Development Employees
Safety in the workplace Employees
Airlines salaries, benefits and pension plans Employees
Climate change policy and action plan Government Environmental
Improvement on environmental performance Society
Table 6: Some of the indicators utilized in the assessment (Source: adaptation of Jordao T C,
Rhouma A B. 2010)

70
3.2 The Case of Corporate Sustainability in Lufthansa
The case developed in this chapter regards a simulation for developing and implement the
SBSC within an airline of the real world. The European airline company Lufthansa seems
to be a suitable example of big carrier fully moving towards sustainability for many
reasons. First of all, the company has been developing and well defining continuously a
long term sustainability/responsibility strategy regarding several matters: climate change
policies, environmental care, social responsibility to employees and society. At the same
time sustainable long-term profitability is pursued through optimal relations with
stakeholders and well structured risk management, corporate governance and compliance
systems. Secondly, a corporate citizenship detailed program is followed and constantly
developed in order to contribute to variegated social interests. Thirdly, sustainability
reporting is very well developed. Full and qualitative disclosure about environmental,
social and economic sustainability is provided and available with other additional
information in the well structured web site. Finally a real commitment towards better
environmental and social performances could be seen from the results achieved.
The case is developed basing on strategies declared by the company in the web site,
specifically for the “Passenger Airline” segment. The simulation is based on many
contributions in the literature. Internal as well as external sources have been utilized for
carrying out the work. Economic and sustainability data about the sector are taken from
significant reports of the industry such as disclosures from IATA (International Air
Transport Association) ICAO (International Civil Aviation Organization) and ATAG (Air
Transport Action Group). The process of implementation of SBSC is based manly on the
general framework of Figge et al. (2002 a, b) and adapted with the real data of Lufthansa.
The strategy map is drawn following the framework of Kaplan and Norton (2004), and the
causal relations are the results of intuitions based on the logical connections between the
sustainability aspects identified. Most of the indicators utilized come from Lufthansa
Balance (sustainability reporting), the Annual Report (financial statement) and other
additional support information available in the web page of Lufthansa Responsibility.
Among the other indicators utilized, some represent own source, others are based on
external sources, adapted from sustainability reports of competitors, or taken from the

71
Global Reporting Initiative sustainability reporting guidelines G3. Furthermore, the
assessment of economic, environmental and social performances, through a comparison
with competitors, is based on data disclosed in the corporate responsibility and
sustainability reporting of the carriers analyzed.
3.2.1 Lufthansa Overview and General Strategies
Deutsche Lufthansa AG is a global aviation group that operates worldwide through five
business segments, each of which has a leading role in its industry. Altogether, the Group
includes over 400 subsidiaries and associated companies. The core business is the
passenger transportation managed within the Passenger Airline business segment. With
more than 76 million passengers, the objective in this business segment is to strengthen the
position as a leading European premium carrier offering services in a global network
serving all major traffic flows inside, outside and across Europe. To realize its goal,
Lufthansa rests its growth strategy on three pillars108
.
- Expand short and long-haul network in the medium term through organic growth and cost
efficiency.
- Increase cooperation with partners. Star Alliance, above all, is playing a major role in
opening up new markets.
- Participate in the ongoing consolidation of the airline business in Europe by acquiring
stakes of others airlines, accordingly evolving into a multi-hub-/multi-brand-airline system.
Additionally, long term responsible and sustainable development is pursued in all the
business segments of the Group. For several years sustainability and social responsibility
have been anchored in the principles of Lufthansa's strategies. Many efforts are addressed
to improve climate and environmental protection, employee satisfaction, training and
continuing education in all the levels of the Organization. Moreover, sustainable
development is aimed to increase the company’s value long-term.
108
Lufthansa Corporate (web): http://konzern.lufthansa.com/en/

72
The general frameworks of Sustainability and Social Responsibility belongs to the
corporate level and are addressed to the different businesses unites. The organizational
structure for managing and controlling the processes related to sustainability issues, is
developed by an interdisciplinary cross-departmental body called Sustainability Board. It
belongs to the Top Management level of the Organization, strongly committed in a
leadership role. It means that sustainability is truly and robustly incorporated into general
management. Then, the implementation of sustainable goals, strategies and measures is the
task of Environmental Management and Human Resources Management109
.
Corporate strategy guidelines include several principles of long term sustainable
development and social responsibility. The strategic guidelines could be summarized as
follow110
.
Long-term profitability
Lufthansa's efforts are focused on positioning the airline as the leading network carrier in
Europe. In order to achieve this goal, the main objectives consist in getting long-term value
creation and profitable growth. The parameter for measuring these efforts is the cash value
added (CVA) metric defined in value-based management.
Focus on customer benefits
The customer is central in the business activity and thus Lufthansa tries to satisfy customer
requirements, providing products and services to meet their needs. Punctuality, reliability,
high security and safety standards are crucial elements in winning the trust of customers.
Emphasis on core competencies and system integration
Lufthansa core competences include managing flight networks, partnerships and operating
processes on the ground and in the air as well as the provision and maintenance of
infrastructure and production factors.
Close cooperation with major partners, suppliers and infrastructure providers is aimed in
order to integrate and optimize the core processes. Star Alliance is a decisive reason for
109
Lufthansa Responsibility (web): http://verantwortung.lufthansa.com/en/ 110
Adaptation of Lufthansa Investor Relations Web Site

73
Lufthansa’s success. The cooperation allows easier access to markets and limits, at the
same time, market entry risks. This is the reason why Lufthansa is willing to invest more in
profound partnerships.
Sustainability in the operating processes is pursued by optimizing the core processes, taking
care simultaneously of environmental, transport and cost efficiency.
Attractive working environment
The guiding principle for the personnel functions is to build a working environment with
focus on quality, competence and motivation of staff, combined with corporate culture.
These aspects are key success factors for the Lufthansa Group in order to enable it to thrive
on competition.
Environmental and Social responsibility
Lufthansa is responding to new challenges in environmental policy, with the focus on
further reducing greenhouse gas emissions, noise pollution, and energy consumption.
Striking a balance between economic interests and environmental responsibility is a
guiding principle in the company’s policy. In order to acquire good image and reputation
Lufthansa is involved in several social and environmental projects not related with his core
business.
General vision and mission of the German airline can be deducted from general goals and
core business strategies cited.
Vision: “be the first network carrier in Europe and one of the majors worldwide”
Mission: “achieve long term profitability with a sustainable development”
Relying on the vision, mission and the above mentioned strategic guidelines, the simulation
for implementing the Sustainability Balanced Scorecard in the business segment Passenger
Airline will be developed during next section.

74
3.3 The Implementation of Sustainability Balanced Scorecard within the Business
Segment “Lufthansa Passenger Airline”
This section represents the “heart” of the work. The simulation for developing the
sustainability scorecard is structured in several steps based on the model introduced in the
paragraph 2.3.1. In fact, as anticipated before, the process for the implementation of the
Balanced Scorecard for sustainability is adapted from the framework of Figge, Hahn,
Shaltegger and Wagner (2002), “The Sustainability Balanced Scorecard – Theory and
Application of a Tool for Value-Based Management”. The model111
takes as starting point
the choice of the strategic business unit to analyze. In the case of Lufthansa Group the core
business is the passenger transportation and thus, due to the size of the network worldwide
and the amount of activity, the business segment that faces more with sustainability issues
is the “Passenger Airline”. Based on the type of business activities, stakeholders'
expectations and previsions of growth, environmental and social exposures are identified.
Sustainability strategy then is developed considering the exposures identified and specific
targets are established for each kind of environmental and social impacts. The objectives of
sustainability, including also economic sustainability, then are inserted in the perspectives
of BSC and appropriate KPIs are established for monitoring the achievement of the targets.
Cause and effect chains then are developed between the several objectives giving rise to the
strategy map. The map emphasizes how ecological and social objectives influence financial
results. In this way, sustainability strategy takes part of the general strategy of the business
and is linked to the operative performance management.
3.3.1 Environmental and Social Exposures
Once the business unit is been chosen (in this case the business unit analyzed is the
Lufthansa’s business segment “Passenger Airline”), next step consists in identifying those
111
See paragraph 2.3.1
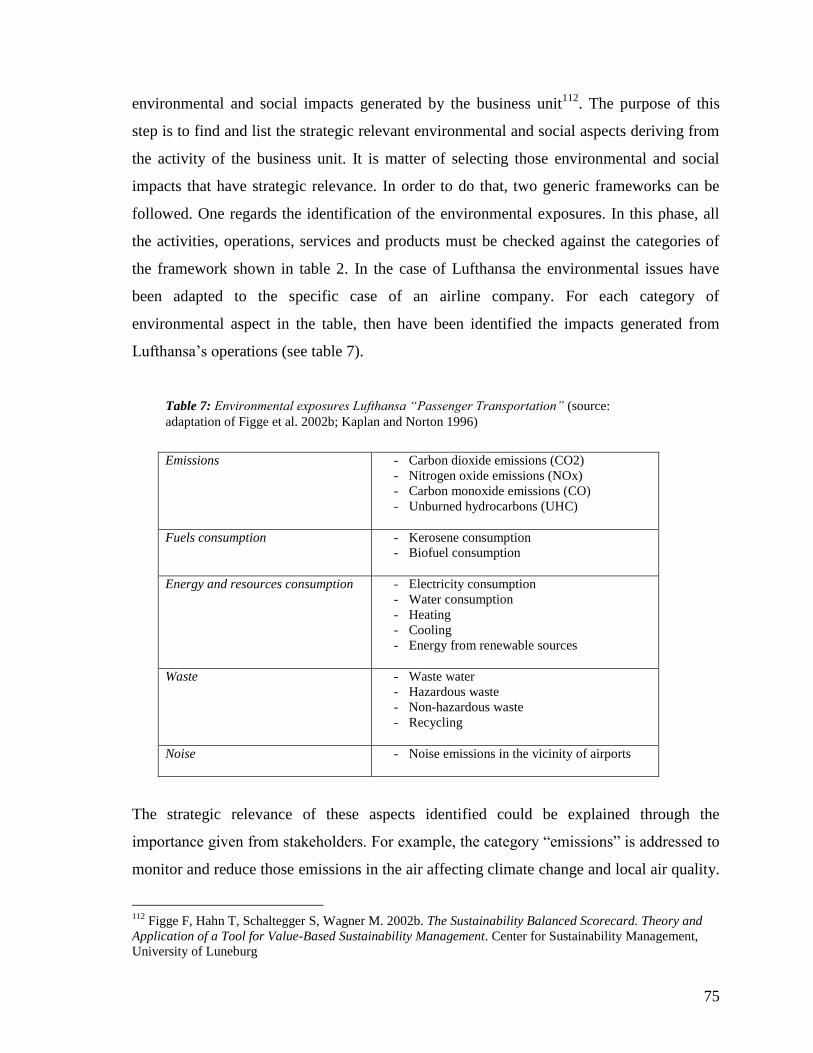
75
environmental and social impacts generated by the business unit112
. The purpose of this
step is to find and list the strategic relevant environmental and social aspects deriving from
the activity of the business unit. It is matter of selecting those environmental and social
impacts that have strategic relevance. In order to do that, two generic frameworks can be
followed. One regards the identification of the environmental exposures. In this phase, all
the activities, operations, services and products must be checked against the categories of
the framework shown in table 2. In the case of Lufthansa the environmental issues have
been adapted to the specific case of an airline company. For each category of
environmental aspect in the table, then have been identified the impacts generated from
Lufthansa’s operations (see table 7).
Emissions - Carbon dioxide emissions (CO2)
- Nitrogen oxide emissions (NOx)
- Carbon monoxide emissions (CO)
- Unburned hydrocarbons (UHC)
Fuels consumption - Kerosene consumption
- Biofuel consumption
Energy and resources consumption - Electricity consumption
- Water consumption
- Heating
- Cooling
- Energy from renewable sources
Waste - Waste water
- Hazardous waste
- Non-hazardous waste
- Recycling
Noise - Noise emissions in the vicinity of airports
The strategic relevance of these aspects identified could be explained through the
importance given from stakeholders. For example, the category “emissions” is addressed to
monitor and reduce those emissions in the air affecting climate change and local air quality.
112
Figge F, Hahn T, Schaltegger S, Wagner M. 2002b. The Sustainability Balanced Scorecard. Theory and
Application of a Tool for Value-Based Sustainability Management. Center for Sustainability Management,
University of Luneburg
Table 7: Environmental exposures Lufthansa “Passenger Transportation” (source:
adaptation of Figge et al. 2002b; Kaplan and Norton 1996)

76
Relevant stakeholders interested in these issues are: society, local communities, NGOs and
Governments. The monitoring of “energy and resource consumption” is addressed to
resource efficiency that interests mainly shareholders for the reduction of operative costs.
Noise emissions, instead, affects the neighborhood of airports in which Lufthansa operates.
Social acceptance and good reputation gives to a company the legitimacy to act and avoids
problems of possible contrasts with some stakeholder categories such as Governments,
society, NGOs.
Stakeholders Social claims and issues
All stakeholders categories
- Communication and awareness diffusion of
ecological and social issues
Shareholders
- Long term profitability
Financial community
- Reduction of environmental and social risk
Employees - Diversity
- Working conditions
- Personal development
- Salaries, benefits and pension plans
- Job healthy and safety
Customers - Prices
- Quality of services
- Network
- Flight punctuality
- Baggage handling
- Security and safety
- Average age of fleet
Suppliers
- Stable relations
- Fairness in contractual agreements
Governments and Regulators
- Proactive behavior beyond compliance
Non Government Organizations (NGO)
Local Communities
Neighbors of airports
- Climate change policy
- Local Air Protection
- Hazardous waste
- Noise generation
Society - Employment
- Economic growth and job creation
- Environmental and social projects trough
Corporate Citizenship Programs
- All environmental exposures
Table 8: Social exposures Lufthansa “Passenger Transportation” (source: adaptation of Figge et al.
2002b; Kaplan and Norton 1996 ; Jordao T C, Rhouma A B. 2010)

77
The second framework concerns the identification of social exposures. Due to the various
and different social issues and realities, is difficult to find a universally accepted
classification of social aspects113
. Since social claims depend on the preferences of actors
involved they should be classified according to the potentially relevant stakeholder
groups114
. Therefore after having selected the strategically relevant stakeholders, several
types of social claims and issues have been identified for each category (see table 8). It
should be noticed that many environmental impacts are related to the social exposures. The
strategic relevance of the social claims and issues identified can be easily caught from the
direct connection with the relative interest of each stakeholder category.
3.3.2 Developing Sustainability Guidelines
After having identified the particular types of environmental and social impacts generated
from the business activity and identified the categories of stakeholders potentially affected,
sustainability policies and strategic guidelines must be developed in order to make a plan of
actions. In other words, next phase must be the development of the sustainability strategies
based on the environmental and social issues emerged from the past analysis115
. In
particular, four different dimensions of social responsibility and sustainability can be
identified in Lufthansa's commitment: economic, which is related to the sustainable long
term profitability; environmental, regarding the protection and care of ecosystem through
the cut of emissions and consumptions; social, concerning the responsibility towards all
employees; and corporate citizenship, which is based on the dedication to local community
and society in general. Sustainability objectives and specific targets are then developed and
pursued in each dimension above cited. For the construction of the Balanced Scorecard and
the Strategy Map, sustainability strategic guidelines will be afterward formalized into
various strategic objectives which represent the main components of the perspectives
(financial, customer, process, learning and growth, non-market). The following dimensions
of sustainability at Lufthansa with the related guidelines are exclusively based on the web
113
Clarkson M. 1995 p.102 114
Freeman R E. 1984, Liebl F. 1996, Zadek S. 1999 115
Epstein M J, Roy M J. 2001

78
page of Lufthansa Responsibility. Hence they represent the real plan of actions developed
in the German carrier.
a. Economic Sustainability116
The principles of sustainability are applied firstly in the economic sphere. Without
economic sustainability the company cannot survive for generating the social benefits to
redistribute. Lufthansa's business development is pursued through a strategy of profound
partnerships and the development of a global network in order to offer better services to
customers and reduce market entry risks. The main commitment of Lufthansa is to create a
long term sustainable value by concentrating in the core business passenger transportation.
The sustainable enhancement of corporate value in the long term is achieved by a value-
based management approach through a system of remuneration and incentives variable and
related to the Cash Value Added (CVA) generated. In order to overcome the threats of the
global financial crisis, Lufthansa strategy is to continue expanding the network worldwide,
offering high quality of services with lower prices and pointing at the same time to
operative efficiency. Optimal management of liquidity is pursued as well.
Many factors must be managed adequately for reaching the long term value creation. In
Lufthansa this is pursue through the optimal management of corporate risks, by establishing
good relations with customers, suppliers and other stakeholders, and also implementing
corporate governance and compliance systems in order to obtain clear, legal and fair
management.
Risk management system should facilitate the sustainable creation of value. Corporate risks
concern capacity and load factor, strategic, political, operational, procurement, collective
bargaining, information technologies and financial treasury. Risks and opportunities are
identified in the early stages and managed in a way that risks must be appropriate and
acceptable in relation to the value created.
Then, an important factor that needs to be optimally managed and translated in long term
value is the customer. The trust and loyalty of customers should be acquired by better
116
Based on:
- Lufthansa Responsibility (web): http://verantwortung.lufthansa.com/en/
- Lufthansa Investor Relations (web): http://investor-relations.lufthansa.com/de.html
- Lufthansa Annual Report 2009

79
performances in terms of punctuality, reliability, high security and safety standards.
Customer satisfaction and loyalty is measured in Lufthansa through an appropriate internal
indicator specifically made for the purpose: the Customer Profile Index. Another factor
concerns the relationship with suppliers. In the area of procurement the main objective is to
optimize long-term value through a fair relationship. For this purpose, Lufthansa follows a
three-pillar model in the purchasing processes. It is composed of some internal guidelines,
transparent decision making and tender systems, as well as sustainability provisions in all
contracts with suppliers.
Additionally, with the motto “trust as the basis of success” Lufthansa wants to emphasize
the importance of a trustworthy and well structured stakeholder dialogue and relationship.
A critical and constructive exchange of information is needed with all the subjects that are
ready and potentially can jointly move towards a sustainable future. Stakeholders must be
included in the decision making processes. One very important tool for communicating
sustainability performances and strategies is the sustainability report “Balance”. It is aimed
to provide information about ecology, economy, society and social engagement, forming
the basis for a constructive dialogue with a number of stakeholders. In addition, Lufthansa
uses other media and is constantly developing its communication tools.
Finally, corporate governance and compliance systems should ensure a stable economic
sustainability. Corporate governance regards the efficient structures and clear processes that
guarantee responsible corporate leadership, administration and monitoring, with the target
of sustainable value creation and respects of the rights, the interests of shareholders and
other parties. The Compliance guidelines should prevent conflicts with the law and help
employees to apply statutory regulations correctly. Lufthansa Compliance Program
includes the following elements: Competition, Capital Markets, Integrity and Corporate
Compliance.
b. Environmental Sustainability
The growing demand of air mobility is posing many challenges in terms of environmental
policy towards climate and ecological care. In order to balance ecological issues and
economic interests, the commitment of Lufthansa must be addressed to the reduction of
greenhouse gas emissions, noise pollution, and energy consumption while increasing

80
profitability. Based on the internationally acclaimed Four-Pillar Strategy for air
transport117
, in 2008 Lufthansa implemented new strategies for environmental and climate
protection. In detail the Four-Pillar Strategy includes technological progress, improved
infrastructure, operational measures and economic instruments. Based on these four pillars,
Lufthansa developed an environmental strategy that establishes 15 guiding principles
pointing to the drastic improvement of ecological performances by 2020. The guidelines
are:
- Reduce carbon emissions
- Cut nitrous oxide emissions
- Modernize fleet
- Promote alternative fuels
- Increase efficiency in the operational sphere
- Improve infrastructure
- Implement emissions trading on a global scale
- Continue offsetting carbon footprint
- Develop further incentive systems
- Reduce aircraft noise
- Improve aircraft
- Optimize flight procedures
- Develop comprehensive traffic concepts
- Build green
- Expand environment management
Many of these objectives are pointing to the same goals simultaneously. For example, the
promotion of alternative fuels or the improvements of infrastructures have the final goal of
reducing carbon emissions; the general guideline “improvement of aircraft” is also pointing
to the reduction of noise emissions. This means that the major objectives of environmental
sustainability are less than the guidelines above mentioned; in other words, Lufthansa’s
environmental strategy is based, like most of the carriers moving towards sustainability, on
117
IATA (web): http://www.iata.org/Pages/default.aspx

81
three main commitments: reduction of greenhouse gas emissions (CO2, N2O) and local air
emissions (NOx), reduction of noise, optimization of energy and resource consumption.
Reduction of carbon and nitrous oxide emissions are both pursued by diminution of fuel
consumption. By supporting IATA climate protection targets for the aviation industry,
Lufthansa will try to achieve carbon-neutral growth by 2020 as well as a 50 % reduction in
CO2 emissions from fossil fuels by 2050 compared to 2005 levels. Additionally, through
the project “Fuel Efficiency Leadership” recently launched, a further 25% (compared to
2006) reduction of CO2 emissions is pursued by 2020. Another objective concerns the bio-
fuels. By 2020, an amount of 5 to 10 % share of synthetic fuels produced from renewable
raw materials must partially replace the traditional kerosene. The ways how the efficiency
can be continuously enhanced are many: kerosene can mainly be saved by lowering aircraft
weight, implementing more efficient processes on the ground, developing technical
improvements and optimizing flight procedures and air space management118
.
Another central problem of emissions for the aviation sector regards the noise generation in
the areas close to the airports. In order to reduce noise emissions, Lufthansa should
continuously invest in modern fleet with quieter aircraft and also working together with
partners in the industry, administrations, universities and large-scale research institutions to
promote the development of noise reduction measures. The objective of noise reduction
consists in acquiring acceptance by the neighborhood of the airports through the generation
of noise below the limit of “minus 10 EPNdB” criterion (Effective Perceived Noise
decibel) formulated by the International Civil Aviation Organization (ICAO).
Finally, another pillar of the environmental strategy of Lufthansa regards the resource
management. The Principles of sustainable business operations cannot be limited merely on
flight operations. Also the operational process on the ground should be optimized in terms
of efficient resources consumption. Lufthansa aims to attain successful performances
related to the saving of energy and freshwater and the diminution of waste and wastewater.
Energy and Resource Management projects of Lufthansa regard energy management, green
118
Based on:
- Lufthansa Responsibility (web): http://verantwortung.lufthansa.com/en/
- “Environmental Performance data 2009”, “Fuel Efficiency Leadership” from Lufthansa additional
reports from Lufthansa Responsibility (web)
- Lufthansa Sustainability Report BALANCE 2010

82
buildings, renewable sources, energy savings, recycling policies, instruction and awareness
about energy and resources matters.
Despite the historical relative improvements achieved in environmental performances,
expectations of continuous traffic growth give rise to the problem of absolute emissions
always increasing. For example, although eco-efficiency can be constantly improved, total
fuel consumption or number of people exposed to noise generation will increase
continually because of the rise in traffic volume and world population. Furthermore, other
reasons such as political, compliance, economic, competitive advantage, image and
reputation, contribute to pose more challenges in terms of environmental sustainability.
Therefore, commitment in environmental protection must be continually reinforced.
c. Social Sustainability
The other dimension of sustainability regards the social responsibility. For social
responsibility is meant the commitment towards long term sustainable personnel
management, from the selection to the retention and development. With the main goal of
enhancing the attractiveness and reliability of the working environment, Lufthansa
concentrates the efforts in four aspects of responsibility to employees for improving the
related performances. Personnel development, employment politics, diversity, safety and
health protection are the four pillars of responsible personnel management in Lufthansa.
Since human resources are critical success factors, many efforts must be spent for
promoting training and continuing education of employees. Traditional apprenticeships,
operations-stipulated qualifications, continuing education and also own courses for Service
Professionals represent the pillars in the area of personnel development in Lufthansa.
The second aspect of social responsibility concerns the employment policy. The traditional
core personnel policy rely on strong corporate identity and secure position but nowadays
flexibility policies are acquiring increasing importance. Selection philosophy is based on
openness, efficiency and transparency in order to acquire competent and committed
employees. The promotion of leadership, based on short decision-making channels and
decentralized responsibilities, is another characteristic of the policy. In particular Lufthansa
employment policy is organized in many points. Firstly, the cultural pluralism based on the
diversity of personnel is promoted. Secondly, the flexible working hours based on various

83
part-time variations, shift and duty roster models with the purpose to balance the
employees' professional and private lives. Thirdly, the replacement of those employees that
lost their positions, for organizational reasons, is pursued through the “JobChange” internal
agency. In addition, continuous personnel valuation and dialogue is carried out in order to
asses the previous targets achievement and establish new objectives. Then, incentives and
remuneration systems are aligned to individual performances. Finally, an important support
regards the special leave of employees from job in order to take care of children, parents or
life partners beyond legally granted nursing care times.
Another aspect of social responsibility is the promotion of diversity among the employees.
In Lufthansa, people are working from all over the world with differences of age, gender,
religion, ideology, nationality, ethnicity, sexual orientation and also disability. An
additional diversity factor consists in the employees' own biography curriculum based such
as specific skills and knowledge, past studies, specific work and life experiences, etc.
Diversity is seen as an opportunity in Lufthansa because it helps cultural interchange,
expansion of creativity and consequently increasing in innovation capability.
Finally, employees’ safety and health protection are playing an important role in the contest
of social sustainability. Healthy and safe working conditions constitute important pillars in
the company's organization. Lufthansa health and safety program is articulated in five main
points. Firstly, an own medical service, divided in industrial and aviation medicine, is
active within the Group. Representatives of employees are involved in decision making
related to health and safety issues. Secondly, hazard analysis is performed in order to assess
job activities, work conditions and situations. The risks identified are evaluated and
reduced or avoided by frequent medical checkups of the personnel. Thirdly, up-to-date
safety technical equipment is kept in all the buildings and work stations. Then, emergency
procedure plans are carried out in all the companies of the Group. Furthermore, in every
work area there is at least one safety commissioner or employee expert in first aid. Finally,
regular training courses regarding health and safety prevention and application of
protection procedures, are addressed to employees. The promotion of health and safety, in
Lufthansa, does not regard only the present and immediate work. It points to long term
preservation of the staff through preventive and reintegration measures. Workability is

84
ensured in advance by the company's social and medical preventive support. In addition,
reintegration policies are addressed to those employees with recurrent or longer illnesses.
Social sustainability is intended in Lufthansa as the responsible treatment of the employees,
from their selection and training, through development and management, until the after job.
This treatment must be continually improved in terms of quality, ethic, safety and
motivation.
d. Corporate Citizenship
Since companies belong to society, Lufthansa feels the responsibility to contribute to social
sustainable development. Lufthansa tries to take an active part in the society through
several civic projects belonging to five different areas of social responsibility: culture,
social issues, education, sports, and environmental sponsorship.
Lufthansa is involved in several important social projects. The most important is “Help
Alliance”, an association founded by many staff members of the Group, with the goal of
supporting worldwide business startups, projects for street kids, educational institutions,
orphanages and bush hospitals.
The Environmental Sponsorship Program constitutes another important social commitment
of Lufthansa with the aim at preserving biological diversity. The several projects concern
reforestation (so called “Rainforestation Farming”), establishment of sustainable
agricultural systems in areas of western China, preservation of natural resources through a
network to protect freshwater lakes and others minor ecologically related projects. Among
these environmental projects it must be mentioned the Lufthansa strong support to the
crane-protection through financial, logistical and communications resources to several
organizations operating for this purpose.
Additional social commitments regard culture, education and sport. All the supports of
culture are addressed to musical projects. Lufthansa is the first global partner of the
German orchestra “Gürzenich-Orchester Köln” and further commitments regard the
Lufthansa Festival of Baroque Music in London and the New Year's concert in Berlin. The
educational projects are: Lufthansa Experience Knowledge that introduce young people to
working and professional aviation worlds; business@school that introduces to students
some business topics in a practice-oriented manner; Girl's Day involvement for showing

85
girls between the ages of 12 and 16 the work opportunities in Lufthansa. Finally, Lufthansa
supports sport activities through the German Sports Aid Foundation and sponsoring many
athletes119
.
Corporate Citizenship programs cannot be considered as strategic core issues but they
represent very important commitments useful for the development of local community and
society in general. Increasing investments in social projects can bring direct as well as
indirect benefits to business performances. Good social performances contribute to lead the
growth of corporate image and reputation useful to acquire political and social legitimacy.
The just mentioned four dimensions of sustainability in Lufthansa are summarized in the
following illustration available in the web page Lufthansa Responsibility (figure 16).
119
Lufthansa Responsibility (web), additional report “Environmental Sponsorship Program”, BALANCE
2010
Figure 16: Lufthansa Responsibility (source: Lufthansa Responsibility (web), Annual Report
2009)

86
3.3.3 Perspectives, Objectives and Related Indicators
In this paragraph the “heart” of balanced scorecard will be developed. Perspectives,
objectives and key performance indicators represent the “bridges” that connect strategies
with daily management. This paragraph is dedicated to the translation of the general
strategies into several perspectives of the Sustainability Balanced Scorecard. Afterwards,
sustainability strategic guidelines above listed will be formalized into several practical
objectives belonging to the perspectives of the scorecard. Subsequent to the insertion of the
objectives identified in each perspective, key performance indicators, targets and initiatives
will be defined for each objective.
Following the framework of Kaplan and Norton (1996) and considering at the same time
the general guidelines of Lufthansa’s corporate strategy, some similarities and points of
connections can be found. The financial perspective is represented by the guideline “long-
term profitability”; the “focus on customer benefits” is clearly associated with the customer
perspective; the process perspective includes mainly the “emphasis on core competencies
and system integration”; the guideline of “attractive working environment” could be easily
related to the learning and growth perspective; finally, the guideline “environmental and
social responsibility” is related to all the perspectives market as well as non-market
perspective120
. The latter observation needs some examples in order to be better
understood. Environmental responsibility can be associated to the process perspective
aiming to reduce emissions from core activities. At the same time environmental
responsibility regards the non-market perspective when is referred to non-core
environmental projects aiming, in the case of Lufthansa, to the safeguard of forests and the
crane protection. The same is true for social responsibility. When it is referred to employee
diversity, it regards the learning and growth perspective. In the other hand, social
responsibility such as humanitarian aids sent to poor countries belongs to the non-market
perspective.
Relying on what said above, the general structure of Lufthansa balanced scorecard could be
represented with the following illustration (figure 17).
120
Kaplan R S, Norton D P. 1996, Lufthansa Responsibility (web), Figge et al. 2002b

87
After having defined the five perspectives of the scorecard, next step is the definition of
objectives for each perspective. The necessity of simplification in management requires not
so many objectives and indicators to control, therefore, for each perspective have been
defined few objectives reflecting the sustainability and responsibility guidelines and the
relative stakeholders interests (identified in the analysis of exposures). Afterward many
indicators have been chosen for properly monitoring the achievement of the listed
objectives. Most of the indicators are real information disclosed regularly by Lufthansa in
the Annual Reports, Sustainability Reports Balance and additional information available in
the web site Lufthansa Responsibility. Other KPI are suggested by authors121
, represent
own sources, are adapted from reports of competitors, or are based on Global Reporting
121
For a detailed list of sustainability indicators about the air transport sector see: Jordao T C, Rhouma A B.
2010. An Assessment of the Attitude of World's Largest Airlines towards Sustainability. Faculty of Economics
and Administration, Institute of Public Administration and Law, Pardubice, Czech Republic
Market and Non-Market Perspectives
Environmental and social responsibility
Lufthansa Strategy
Vision: be the first network
carrier in Europe and one of
the majors worldwide
Mission: achieve long term
profitability with a sustainable
development
Financial Perspective
Sustainable long-term profitability
Customer Perspective
Focus on customer benefits
Process Perspective
Emphasis on core competencies
and system integration
Learning and Growth Perspective
Attractive working environment
Figure 17: Sustainability Balanced Scorecard Lufthansa Passenger Transportation (source: adaptation
of Kaplan and Norton 1996, adaptation of Figge et al. 2002, Web Lufthansa Responsibility)

88
Initiative (GRI) guidelines122
. The following list123
contains the several objectives (in
italics) for each perspective (underlined) of the scorecard and the related appropriate key
performance indicators (bullet points).
Learning and Growth Perspective Attractive working environment
Development of employee skills and competences
- GRI - LA10 - Average hours of training per year per employee by employee category
- GRI - LA11 - Programs for skills management and lifelong learning that support the
continued employability of employees and assist them in managing career endings
- GRI - LA12 - Percentage of employees receiving regular performance and career
development reviews
- Percentage of trainers and trainees among employees124
- Ratio investments in training and continuing education/capital expenditure*
Pursue quality and flexibility
- Average salaries and wages per employee category (% comparison with average sector
EU)*
- Percentage of employees with permanent contract125
(stability)
- Employee turnover (stability)
- % part-time employees (flexibility)
- % female part-time employees (targeted flexibility)
- Social security contributions (average per employee category)**
- Pension and other employee’s benefits (average per employee category)**
- GRI - LA4 - Percentage of employees covered by collective bargaining agreements
122
Crawford D, Scaletta T. 2005. The Balanced Scorecard and Corporate Responsibility: Aligning Values for
Profit. CMA Management, 79(6), p 20-27 123
The indicators without * (except the GRI ones) are taken exactly from Lufthansa Reports (Annual,
Sustainability and additional); the indicators with * are advised by myself (own source); the indicators with
** are developed by Jordao T C, Rhouma A B. 2010; the GRI indicators derive from Global Reporting
Initiative (GRI) 2000-2006. Sustainability Reporting Guidelines G3 (version 3.0) 124
Adapted from Air France KLM Corporate Social Responsibility Report 2010 125
Air France KLM Corporate Social Responsibility Report 2010

89
Promote diversity among employees
- % employees in Germany (of which % not German citizenship)
- % female employees (of which % in management positions)
- Average age
- % people over 50 years old
- % people with disabilities (in Germany)
Promote health and safety in working environment
- GRI - LA7 - Rates of injury, occupational diseases, lost days, and absenteeism, and
total number of work-related fatalities by region
- GRI - LA7 - by employee category*
- Maternity leave126
- Expenditure in the internal medical service*
- Expenditure in health and safety programs (technologies, prevention, hazard analysis,
protection, employee awareness etc.)*
- Training hours in health and safety matters*
Improve satisfaction, motivation and productivity of socially and ecologically capable
employees
- Employee feedback management
- Amount of hours for volunteer work*
- Revenue per employee
Process Perspective Emphasis on core competencies and system integration
Optimization of flight networks
- Ratio between flights served by Lufthansa and flights served by partners*
- Investments in partnerships and new alliances*
- Size of fleet
126
Air France KLM Corporate Social Responsibility Report 2010

90
- Passenger load factor
- Freight ton kilometer (FTK)
Improvement in ground and flight operations
- Flight punctuality: % flight on time (15 minutes tolerance)**
- Baggage handling: ratio of mishandled or delayed baggage upon total number of
baggage handled**
- Health and safety: GRI - PR2 - Total number of incidents of non-compliance with
regulations and voluntary codes concerning health and safety impacts of products and
services, by type of outcomes
- Incidents of non-compliance with regulations resulting in a fine or penalty
- Incidents of non-compliance with regulations resulting in a warning
- Incidents of non-compliance with voluntary codes
- Average lifetime fleet (age, flight-hours and n° flights)**
- Average boarding time*
Improvement on environmental performances
- Fuel consumption (tons)
- Biofuel ratio (% of total fuel utilized)
- Fuel efficiency l/100 pkm
- CO2 absolute emissions (tons)
- CO2 emissions kg/100 pkm
- NOx emissions g/100 pkm
- UHC emissions g/100 pkm
- % average fleet reduction in noise emissions (“minus 10 EPNdB” ICAO criterion)
- Electricity consumption (MWh)
- Gas (MWh)
- Heating/Cooling (MWh)
- Water consumption (m3)
- Waste water (m3)
- Non-Hazardous waste (tons)

91
- Hazardous waste (tons)
- Recycling (% of waste)127
Improvement of management systems related to environmental and social exposures
- Expenditure in internal plans and programs addressed to environmental and social
issues related to core business activities*
- Level of formalization of environmental and social management systems
(certifications, audits, surveys among employees)*
Customer Perspective Focus on customer benefits
Increase satisfaction and loyalty
- Customer Profile Index
- N° customer complaints*
- N° frequent flyer program (FFP) (miles program)
- Ratio n° FFP/total n° passengers*
Develop continuously brand image and reputation
- Reputation quotient (survey among several stakeholder categories)128
Increase the market share and customer acquisition
- % of market share (revenues)*
- % of market share (number of customers)*
- % change in number of customers*
- N° frequent flyer program (FFP) (miles program)
Increase the customer profitability
- Average prices*
127
Adapted from United Airlines Corporate Responsibility Report 2009-2010 128
Fombrun C J, Gardberg N A, Sever J M. 2000. The Reputation Quotient: A Multi-stakeholder Measure of
Corporate Reputation. Journal of Brand Management 7,4: 241-255

92
- EBTDA/n° of customers*
- Operative income/n° customers*
Financial Perspective Sustainable long-term profitability
Achieve and maintain high and long-term profitability
- Equity ratio (Shareholders’ equity/ total assets)
- Return on Equity (Net profit/shareholders’ equity)
- Return on Assets (Operating result/total assets)
- Return on Sales (Operating result/total revenues)
- Cash Value Added (EBITDA/cost of capital)
Long-term sustainable development
- Sustainability indices performances and trends:
- DJSI
- FTSE4Good
- ASPI
- ESI
Non-market Perspective Environmental and social responsibility
Improve image and reputation in order to acquire political and societal legitimacy
- Reputation quotient (survey among several stakeholder categories)129
- Surveys among all stakeholder categories (% of stakeholders contacted of which % of
responses obtained, assessment by stakeholders)*
- New Awards
Improvement in communication on sustainability issues with stakeholders
129
Fombrun C J, Gardberg N A, Sever J M. 2000

93
- Expenditure in communication tools*
- Reliability, quality and completeness of information disclosures (surveys among
stakeholders categories, external audit valuation, comparison with competitors and
GRI standards)*
Provide economic growth and job creation
- Direct and indirect employment (Germany, worldwide)*
- Economic value distributed (Germany, worldwide)*
- Social investments (corporate citizenship)
- Salaries and employees’ benefits
- Taxes
Development of Corporate Citizenship
- Ratio sponsorships and community investments/capital expenditure*
- Social projects
- Environmental sponsorship
- Culture, education and sport
- % of employees involved in volunteer social projects*
- Number of volunteer hours
Promote proactive behavior towards the compliance with legislation and regulations
(legality)
- Level of commitment in corporate governance and compliance systems (investment,
training hours and people involved)*
- Monetary value of fines and total number of non-monetary sanctions for non-
compliance with laws and regulations (with respect to GRI – SO8, PR9, EN28)
- Level of attainment of environmental objectives with respect to IATA guidelines and
other authorities*
- % of socially responsible (with respect to environment, labor practices, human rights,
society) certified suppliers and partners*

94
The purpose of developing the above-mentioned indicators is the establishment of targets to
achieve in the short and long term through concrete actions to take. These actions are called
by Kaplan and Norton, initiatives130
. The managerial function of the balanced scorecard is
emphasized from this aspect. The linkage between strategy and operations occurs with the
establishment of initiatives and thus the commitment to undertake real actions. In order to
simplify the work, targets and initiatives have not been fully developed for all the
objectives; only some examples have been taken into consideration. The following table
(table 9) is giving instances of targets and initiatives undertaken in Lufthansa in order to
reach better performances in the future.
Perspective Objective Indicator Actual data
(2009)
Target Initiative
Learning and
Growth
Promote
diversity
among
employees
% female
employees
% women in
management
position
45,1 % female
employees
14,7 % women in
management
position
Continuous
increasing of
female
employment
especially in
management
positions
Selection process
based
exclusively on
professional and
social aptitudes
Learning and
Growth
Development
of employee
skills and
competences
Investments in
development
and continuing
education
185 million €
Keep high
annual
investment in
training and
continuing
education
Increasing
traditional
training and
service
professionals;
Lufthansa
School of
Business
Process
Improvement
on
environmental
performances
Fuel
Efficiency
liters/100 pkm
liters/100 pkm
4,30
Reduction of
25% by 2020
compared to
2006
Project Fuel
Efficiency
Leadership (see
paragraph 3.3.2
b)
Process
Improvement
on
environmental
performances
CO2 emissions
kg/100 pkm
kg/100 pkm
10,84
Reduction 50%
by 2050
compared to
2005
Supporting
IATA’s Carbon
Neutral Growth
goal; utilization
of 5 to 10% of
biofuel by 2020
130
Kaplan R S, Norton D P. 1996
Table 9: Detailed scorecard with targets and initiatives (source: adaptation of Kaplan and Norton 1996,
data Lufthansa Annual and Sustainability Reports 2009, 2010, own source)
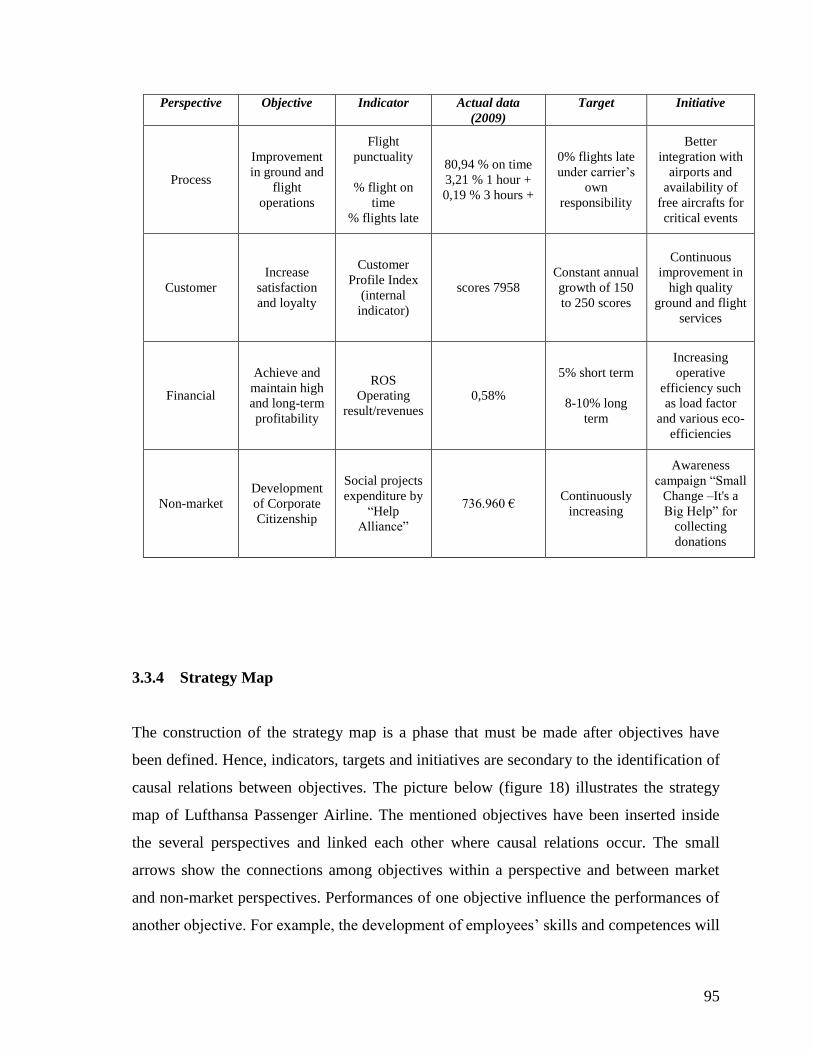
95
Perspective Objective Indicator Actual data
(2009)
Target Initiative
Process
Improvement
in ground and
flight
operations
Flight
punctuality
% flight on
time
% flights late
80,94 % on time
3,21 % 1 hour +
0,19 % 3 hours +
0% flights late
under carrier’s
own
responsibility
Better
integration with
airports and
availability of
free aircrafts for
critical events
Customer
Increase
satisfaction
and loyalty
Customer
Profile Index
(internal
indicator)
scores 7958
Constant annual
growth of 150
to 250 scores
Continuous
improvement in
high quality
ground and flight
services
Financial
Achieve and
maintain high
and long-term
profitability
ROS
Operating
result/revenues
0,58%
5% short term
8-10% long
term
Increasing
operative
efficiency such
as load factor
and various eco-
efficiencies
Non-market
Development
of Corporate
Citizenship
Social projects
expenditure by
“Help
Alliance”
736.960 € Continuously
increasing
Awareness
campaign “Small
Change –It's a
Big Help” for
collecting
donations
3.3.4 Strategy Map
The construction of the strategy map is a phase that must be made after objectives have
been defined. Hence, indicators, targets and initiatives are secondary to the identification of
causal relations between objectives. The picture below (figure 18) illustrates the strategy
map of Lufthansa Passenger Airline. The mentioned objectives have been inserted inside
the several perspectives and linked each other where causal relations occur. The small
arrows show the connections among objectives within a perspective and between market
and non-market perspectives. Performances of one objective influence the performances of
another objective. For example, the development of employees’ skills and competences will

96
influence positively the improvement of motivation and capabilities; the rise of customer
satisfaction and loyalty will affect the growth of customer profitability and market share; an
effective corporate citizenship program with well developed communication and dialogue
tools on sustainability issues, will increase good relations with all stakeholder categories
making easier the acquisition of political and societal legitimacy.
The big arrows show the cascade process of the balanced scorecard; performances of a
previous level perspective, measurable as leading indicators, influence the performances of
the following perspective (lagging indicators). For example, an attractive working
environment with capable, motivated and satisfied employees will allow better execution of
the core processes respecting the principles of efficiency, quality and sustainable
development; focusing on customer benefits and simultaneously taking care about
environmental and social responsibility will permit to achieve a sustainable long-term
profitability.
Some other things must be noticed. First, in some cases the illustration of some direct
connections (between objectives of different perspectives) has been omitted. For instance,
employees’ productivity, eco-efficiency, access to ethical capital and avoidance of fines for
non-compliance (legality) are directly connected to the financial perspective. Second, the
three boxes on the top level of the process perspective represent the core goals related to the
main objectives below and thus they do not have relative indicators (for this reason they
have been drawn in a different way). Another important aspect is represented by the two
objectives of the financial perspective. They fully reflect the mission of Lufthansa’s
strategy: “achieve long term profitability with a sustainable development”.

97
Market and non-market
perspectives Environmental and social
responsibility
Cu
sto
mer
Pers
pec
tive
F
ocu
s on
cu
sto
mer
ben
efit
s
Pro
cess
Pers
pec
tive
E
mp
ha
sis
on c
ore
co
mpet
enci
es a
nd
syst
em i
nte
gra
tio
n
Lea
rnin
g a
nd
Gro
wth
Pers
pect
ive
A
ttra
ctiv
e w
ork
ing
envi
ron
men
t
Non-market perspective
Development of employee skills
and competences
Promote diversity among
employees
Pursue quality
and flexibility
Improvement of satisfaction motivation and productivity of
socially and ecologically capable employees
Ensure health and safety in
working
environment
Improvement of environmental performances
Optimization of flight networks
Improvement in ground and flight
operations
Develop continuously
brand image and
reputation
Increase market share
and customer
acquisition Increase satisfaction and
loyalty
Legitimacy
Increase image and
reputation in order to acquire political
and societal
legitimacy
Legality
Promotion of
proactive behavior towards
the compliance
with legislation and regulations
Provide
economic
growth and
job creation
Achieve and maintain high and long-term
profitability
Increase the customer
profitability
Development of Corporate
Citizenship
Eco-efficiency – resources cost reduction – risk reduction –
access to ethical capital
Accountability – stakeholder awareness – ecological and
social marketing
Enhancement of quality and
innovation
Fin
an
cia
l P
ers
pect
ive
S
ust
ain
ab
le l
ong
-ter
m
pro
fita
bil
ity
Improvement in communication
on sustainability issues with
stakeholders
Improvement of management
systems related
to environmental and social
exposures
Maintain a long-term sustainable
development
Figure 18: Strategy Map Lufthansa Passenger Airline (source: adaptation of Kaplan and Norton 1996, 2004 adaptation
of Hockerts 2001, adaptation of Figge et al. 2002, adaptation of Shaltegger and Wagner 2006, Lufthansa Responsibility
(web), own source)

98
3.4 Sustainability Performance Data, Comparison with Competitors, some
Criticisms and Suggestions
The simulation of sustainability balanced scorecard in Lufthansa is been useful to
understand how sustainability strategies of the carrier have been translated into actions. It
has been seen how Lufthansa’s commitment to corporate sustainability is articulated into
several strategic guidelines, objectives and indicators. The willingness by Lufthansa to
move towards an environmentally, socially and economically sustainable business is
without discussion. Now, the question that arises is whether the Airline’s commitment
brought satisfactory environmental and social performances and if financial results have
been ensuring a stable profitability in the short as well as in long term. In order to make this
assessment, some criteria of analysis must be followed.
Firstly, real sustainability performances data are needed in order to make the valuation of
actual results reached by the carrier. Then, the data and further sustainability aspects of
other airlines, preferably real competitors of Lufthansa for dimension, network and
business strategies, are required for making a comparison and creating a base for the
assessment. Lastly, opinions, criticisms and suggestions have to be carried out from the
assessment.
Regarding sustainability performances, some dimensions of assessment have been chosen.
They are articulated as follow.
- Transport performances, which contain data about passenger carried, load factor, fleet
size and age.
- Economic and financial results, regarding the traditional measures of income, cash
flow, equity and assets, with the additional elaboration of financial indicators such as
ROE, ROA, ROS
- Environmental performances, which contain all the data about the emissions in the air,
fuel consumption, energy and resource consumption, recycling, and noise emissions.
- Social performances, including all the data about personnel selection, training,
development, policies, safety and health.

99
- Community performances, which are related to those actions, such as social projects,
funds to NGO, humanitarian aids, voluntary work and other social commitments, that
do not belong to the core processes but bring benefits in terms of image and reputation.
- Sustainability reporting and stakeholders dialogue, concerning the quality and
completeness of disclosures for building a structured relationship with all stakeholders.
Afterwards, at least one competitor was needed for the comparison. Selection criteria have
been based on the similarity of dimensions, network, business strategy and commitment
towards sustainability. Airlines similar to Lufthansa are big international carriers with large
network worldwide, strategies aiming to have high quality of services simultaneously with
efficiency, pointing to have good and stable profitability, taking care at the same time of
environmental and social sustainability. The European company Air France KLM possesses
the features above mentioned, thus, it was chosen for the comparison purposes. It must be
noticed that right now Air France KLM represents the first European competitor of
Lufthansa; therefore the comparison acquires more importance. Furthermore other global
carriers have been taken into consideration for the scope of showing additional good
practices of performing and reporting in a sustainable way. The main goal of the analysis is
to build an unbiased opinion, with opportune criticisms and acknowledgements, of
Lufthansa environmental, social and economic performances, and stakeholders'
engagement as well.
Before introducing the dimensions of analysis, it could be opportune to clarify some
peculiarities of the valuation. For reasons about the availability of sustainability reports
disclosed by the two carriers, years taken into consideration for environmental and social
performances are 2008 and 2009 (there are not more recent data available). Regarding the
economic and financial performances, three fiscal years have been analyzed (2007, 2008,
2009) for showing better the trends of income and capital. It is important to observe that
Lufthansa fiscal year ends the 31st of December of each year (data refer to years 2007, 2008
and 2009) while Air France KLM fiscal year term is the 31st of march of each year (data
refer to 2007-2008, 2008-2009 and 2009-2010). Additionally, it must be noticed that the
period taken into consideration for the analysis coincides with the global financial crisis

100
between 2008 and 2009, thus, performances of profitability and growth are heavily
influenced by the world markets situation in that period.
3.4.1 Transport Performances and Related Economic-Financial Results131
The starting point for the assessment will be the introduction of some important key
transport and economic related performances achieved by the two carriers taken into
consideration: Lufthansa (LH) and Air France KLM (AFKL). Afterwards, an economic and
financial comparison analysis will be made in order to understand the “health” of the
companies. All these data will be illustrated through the following two tables. Table n° 10
shows the most meaningful transport figures of LH and AFKL in the years 2007, 2008 and
2009. Tables n° 11 and 12 illustrate economic and financial results of the two airlines with
the addition of some significant analysis indexes.
Lufthansa Air France KLM
2007 % 2008 % 2009 2007/08 % 2008/09 % 2009/10
Passengers 62.894 12,16% 70.543 8,51% 76.543 74.795 -1,27% 73.844 -3,32% 71.394
Load Factor 79,80% 78,90% 77,90% 80,80% 79,70% 80,70%
Size of Active Fleet 514 1,36% 521 32,05% 688 607 2,31% 621 -4,35% 594
Average age of Active Fleet 10,7 11,1 10,7 10,13 10,39 9,83
First important traffic fact that must be observed is the big rise in LH passengers in the
years 2008 (+12,16% than 2007) and 2009 (+8,51% than 2008). The increasing demand of
131
All date treated in this paragraph are taken or elaborated from: ATW World Airline Report 2007, 2008,
2009; Lufthansa BALANCE 2008, 2009, 2010; Lufthansa Annual Reports 2007, 2008, 2009; Air France
KLM Corporate Social Responsibility Report 2008, 2009, 2010; Air France KLM Annual Reports and
Financial Statements 2007-08, 2008-09, 2009-10)
Table 10: Transport figures Lufthansa and Air France KLM (Sources: ATW World Airline Report 2007, 2008,
2009; Lufthansa BALANCE 2008, 2009, 2010; Air France KLM Corporate Social Responsibility Report 2008,
2009, 2010)

101
passenger transport drove LH to a coherent drastic growth of the fleet size in 2009 (+32%).
With an opposite trend, AFKL lost passengers in those years. Until 2008 the French-Dutch
carrier was the first airline in Europe for number of passengers carried but, since 2009, LH
has overtaken AFKL, becoming the leading European carrier for passenger transported.
Related to transport data, revenues registered similar trends. Nevertheless, LH revenues in
2009 had a drop of 10% despite the rise in passengers transported. This fact can be justified
by lower prices practiced by the German carrier in order to contrast the effects of the crisis
and the big growth of low cost airlines.
unit Lufthansa
12/31/2007 % 12/31/2008 % 12/31/2009
Revenues € million 22.420 10,80% 24.842 -10,30% 22.283
Operating Result € million 1.378 -7,11% 1.280 -89,84% 130
EBTDA € million 3.023 -22,36% 2.347 -25,73% 1.743
Net Profit/Loss € million 1.655 -67,25% 542 -120,66% -112
Earning per Share € 3,61 -67,31% 1,18 -120,34% -0,24
Total Assets € million 22.320 0,39% 22.408 17,78% 26.392
Shareholders' Equity € million 6.900 0,28% 6.919 -10,36% 6.202
Operative Cash Flow € million 2.862 -13,59% 2.473 -19,49% 1.991
Return on Equity % 23,99% 7,83% -1,81%
Return on Assets % 6,17% 5,71% 0,49%
Return on Sales % 6,15% 5,15% 0,58%
Table 11: Economic and Financial Performances Lufthansa (Source: Lufthansa Annual
Reports 2007, 2008, 2009)

102
unit Air France KLM
3/31/2008 % 3/31/2009 % 3/31/2010
Revenues € million 24.127 -0,63% 23.975 -12,41% 20.999
Operating Result € million 1.281 -115,07% -193 -1.632
EBTDA € million 3.700 -40,54% 2.200 -50,00% 1.100
Net Profit/Loss € million 756 -207,67% -814 -1.559
Earning per Share € 2,66 -203,76% -2,76 -5,30
Total Assets € million 30.690 -6,25% 28.773 -3,47% 27.775
Shareholders' Equity € million 9.975 -43,10% 5.676 -4,55% 5.418
Operative Cash Flow € million 2.594 -69,24% 798 -200,00% -798
Return on Equity % 7,58% -14,34% -28,77%
Return on Assets % 4,17% -0,67% -5,88%
Return on Sales % 5,31% -0,81% -7,77%
Through a deeper analysis of the income statements, it is easy to observe the continuous
decline of profitability in both companies. The effects of the global financial crisis
influenced a lot the incomes of many big industrial groups, airlines as well. However,
differently than AFKL, LH has been able to sustain profitability in the best possible way.
With a strategy of permanent expansion of the flight network worldwide, LH was attracting
more customers, increasing and renewing the fleet, keeping, at the same time, the operative
result positive. Nevertheless, the rise in fleet size drove the fall in the passenger load factor
in 2009 (-1%), signifying a lost of operative efficiency. On the other side, AFKL lost
customers and cut the fleet size in 2009, registering negative operative results. The drop of
profitability in AFKL can be justified also by the investments in new fleet in 2008.
Actually, with an average age of 9,83 years for each aircraft, AFKL has the newest fleet in
Table 12: Economic and Financial Performances Air France KLM (Source: Air France
KLM Annual Reports and Financial Statements 2007-08, 2008-09, 2009-10)
103
Europe. Another good aspect that must be observed is the high load factor (almost 81% in
2007 and 2009), which means an efficient management of the flight network.
Bad operative results have been reflected in the net profits and losses, affecting
consequently the earnings or losses per share. Shareholders in LH were more satisfied than
the ones in AFKL, in facts, LH share earned more than AFKL in 2007-2008, and lost only
0,24 € in 2009. AFKL earning per share was positive only in 2007 while it lost 2,76 € in
2008 and 5,30 € in 2009. Financial crisis effects can be deducted also from the amount of
shareholders equity, decreasing in both airlines, and the operative cash flow. The latter have
an important meaning in terms of liquidity coming from current operations. Since LH
system of remuneration and incentives is based on Cash Value Added (CVA) generated,
optimal management of cash flow is pursued in order to obtain a sustainable growth.
In conclusion, the elaboration of some economic-financial indexes of profitability can help
to explain better the situation within the two companies. The three indicators analyzed are
the profitability of shareholders’ equity (ROE = net profit/shareholders’ equity), the
productivity of investments (ROA = operating result/total assets) and the operative
efficiency (ROS = operating result/revenues). In the year 2007, LH return on equity,
investments and sales can be considered satisfactory enough for ensuring a stable growth.
In 2008, although profitability of sales and investments is still adequate, equity is not
remunerated enough. Operative costs are adequately covered by revenues but the weight of
financial area influences negatively the net profit. In 2009 the drop of profitability is
evidently demonstrated by all the three indicators (ROE is even negative). AFKL ROE,
ROA and ROS in 2007 can be considered acceptable. However, it must be observed the
better performance of LH in both operative and financial areas. In fact even if AFKL
revenues are higher than LH, the German carrier obtains better operative result and more
than the double of net profit. Negative operative results in 2008 and 2009, demonstrated by
the negative indexes of return on sales and assets, confirm the critical situation in AFKL
Group after the global financial crisis. The bad general economic performance in AFKL is
verified by the highly negative return on shareholders’ equity in those years.
Summarizing, global financial crisis has threatened economic sustainability in LH as well
as AFKL. The French-Dutch carrier tried to face the problem by cutting and renewing the
fleet, increasing simultaneously the efficiency by raising the load factor. Results have been

104
inadequate to satisfy shareholders. The German airline, differently, pushed for the
expansion of the flight network by raising the fleet, the number of passengers and, limitedly
for the year 2008, the revenues, obtaining better performances in the operative area.
Furthermore, a suitable management of the cash flow, ensured the sufficient liquidity to
face the crisis. Considering the global economic context, the satisfactory operative and
financial performances, made more certain the economic sustainability within LH Group.
3.4.2 Environmental Performances132
The first step for the assessment of environmental performances is the construction of a
table that contains the data of results reached, from the two airlines (Lufthansa and Air
France KLM), by type of emission, consumption of resources and energy intensity. As seen
before, the major objectives of environmental sustainability for the airline sector are based
on some main commitments: reduction of greenhouse gas emissions (CO, CO2), local air
emissions (NOx, SO2, HC, UHC), noise generation, and optimization of energy and
resource consumption. Considering that emissions in the air are all related to fuel
consumption, the diminution of absolute and relative utilization of kerosene simultaneously
with increasing use of biofuels, represents a main objective of the commitment towards
better environmental results.
Lufthansa Air France KLM
unit 2008 2009 % unit 2008 2009 %
Emissions
CO2 tons 24.170.394 24.194.229 0,10% tons 27.506.000 25.269.000 -8,13%
CO2 efficiency kg/100 pkm 10,93 10,84 -0,82% kg/100 pkm 9,50 9,50 0,00%
NOx tons 112.820 112.645 -0,16% tons 143.500 130.800 -8,85%
MO tons 17.095 17.376 1,64% tons na na
SO2 na 14.925.000 12.902.000 -13,55%
HC na tons 3.400 4.200 23,53%
UHC tons 2.066 1.982 -4,07% na na
132
Based on: Lufthansa BALANCE 2009, 2010; Lufthansa Environmental data 2010 additional report; Air
France KLM Corporate Social Responsibility Report 2009, 2010
Table 13: Environmental Performances Lufthansa and Air France KLM (Sources: Lufthansa BALANCE 2009, 2010;
Lufthansa Environmental data 2010 additional report; Air France KLM Corporate Social Responsibility Report 2009,
2010)

105
Fuel Consumption
Fuel Total tons 7.673.141 7.680.708 0,10% tons 8.731.000 8.021.000 -8,13%
Fuel Efficiency l/100 pkm 4,34 4,30 -0,92% l/100 pkm 3,80 3,80 0,00%
Noise
Noise Emissions * 10^12 kJ 1,93 1,79 -7,25%
Energy and Resources
Electricity MWh 538.465 627.685 16,57% MWh 417.990 421.581 0,86%
Gas MWh 111.628 128.603 15,21% MWh 157.975 164.189 3,93%
Heating/Cooling MWh 120.532 183.047 51,87% MWh 177.057 161.091 -9,02%
Water m3 3.674.822 3.915.036 6,54% m3 1.145.000 979.000 -14,50%
Waste water m3 445.635 438.037 -1,70% na
Rainwater use m3 7.449 8.716 17,01% na
Waste Total tons 109.646 193.921 76,86% 67.138 67.028 -0,16%
Hazardous Waste tons 5.566 4.105 -26,25% 6.084 5.961 -2,02% Non Hazardous Waste tons 104.080 189.816 82,38% 61.054 61.067 0,02%
of wich Recycling na % of hw 48% 58% 10,00%
of wich Landfil na na
Table n° 13 compares the most meaningful environmental impact data of Lufthansa and Air
France KLM. In 2009 LH burned 7.680.708 tons of kerosene releasing in the air
24.194.229 tons of carbon dioxide (CO2), 112.645 tons of nitric oxide (NOx), 17.376 tons
of carbon monoxide (CO) and 1.982 tons of unburned hydrocarbons (UHC). These absolute
data alone do not clarify the environmental impact of the carrier. The comparison with
absolute impacts of AFKL corresponds to a first stage of contextualization of the data. Fuel
used by AFKL in 2009 (8.021.000 tons) was more than LH but it should be noticed the
decrease of AFKL fuel absolute amount in the years (-8,13% than 2008) that is partially
justified by the reduction of passenger carried (-3,32%). In the other side, LH was able to
maintain the same consumption of kerosene despite the big growth of passenger transported
(+8,51%) and size of active fleet (+32,05%). In fact Fuel efficiency policies are strongly
followed in Lufthansa. Transport performance (passengers per kilometers) trend compared
na: datum not available because not disclosed by the airline
* Lufthansa does not disclose an average datum of noise generation but the single emissions for each aircraft (for
noise disclosures see Lufthansa Balance)

106
with fuel consumption trend133
shows the continuous improvements achieved. Since 1991
to 2008, transport performance increased by 257 % while fuel consumption and CO2
emission rose by 145 %. Therefore important efficiency was gained in the consumption of
kerosene. Nowadays (data of 2009) the consumption is 4,30 liters/100 passenger
kilometers, equivalent to 10,84 kg/100 pkm of CO2 (the lowest level in Lufthansa’s
history), while in 2001 was 4,65 l/100 pkm. Nevertheless the direct competitor AFKL has
been much more efficient than LH; in both years (2008 and 2009) the consumption was
3,80 l/100 pkm corresponding to 9,50 kg/100 pkm of CO2. LH must be more eco-efficient
in this area. In addition, since fuel represents a big amount of LH operating expenses, the
commitment towards increasing fuel efficiency acquires stronger importance not only in the
ecological sphere but also for competitive and economic motivations.
Reduction of CO2 absolute amount emissions is pursued also by introducing the utilization
of alternative fuels. LH is the first carrier in the world to utilize biofuel in a scheduled
commercial flight. Actually, since April 2011 until October of the same year, the Airbus
321 in the route Hamburg-Frankfurt-Hamburg will utilize 50% of bio-synthetic fuel.
During these six months trial, the German airline will safe around 1.500 tons of CO2
emissions134
. The goal in LH is to reach, by 2020, the utilization of 5 to 10 percent share
(with respect to the amount of conventional kerosene) of synthetic fuels produced from
renewable raw materials.
Another central problem of emissions for the aviation sector regards the noise generation in
the areas close to the airports. Almost the overall LH group fleet is performing very well in
terms of noise emissions. Actually only three kinds of aircraft are over the “minus 10
EPNdB” criterion (Effective Perceived Noise dB), formulated by the International Civil
Aviation Organization (ICAO). These performances should be well accepted by the
neighborhood of airports. The investments in a quieter fleet is also bringing economic
benefits since many airports base their charges in part on the noise measured of landings
and take-offs. Furthermore, operational advantages are acquired: quieter aircraft are more
often allowed to take off earlier in the mornings or land later in the nights135
. Same
133
Lufthansa Responsibility (web): http://verantwortung.lufthansa.com/en/ 134
http://www.airlinereporter.com/2010/11/lufthansa-first-airline-to-use-biofuel-on-passenger-flights/ 135
IATA (web): http://www.iata.org/Pages/default.aspx

107
advantages is acquiring AFKL whom noise impact is constantly reducing (-7,25% in 2008-
2009).
Finally, another pillar of the environmental strategy of LH and AFKL regards energy and
resource management. In this area AFKL performed better than LH. Reduction of energy
use for heating/cooling (-9,02%), water consumption (-14,50%) and a considerable amount
(58%) of hazardous waste recycled, are the most meaningful results reached by AFKL.
Lufthansa Group achieved altogether unsatisfactory performances in all the types of energy
and resource consumptions. Nevertheless, important results have been achieved between
the years 2008 and 2009 by the business segment LH Passenger Airlines. 6,2% of
electricity have been saved (41.815 MWh in 2009 against 44.592 MWh in 2008);
freshwater consumption (m3) decreased by 10,5% and the waste of water even dropped by
38,2% (92.206 m3 in 2009 against 149.187 m3 in 2008); another successful performance
regards the hazardous waste declined by 43,6% (23 tons in 2009 against 40 tons in 2008).
Despite the improvements in ecological efficiency reached, absolute environmental
performances achieved are still disappointing. The path towards environmental
sustainability is thus presenting more challenges for several reasons such as political and
NGOs pressures, compliance, efficiency, image, reputation, and in general, competition.
3.4.3 Social Performances136
The other dimension of sustainability regards the social performances intended, in this
context, as all the conditions and situations regarding the relationships with employees.
Quality and attractiveness of working environment rely on the proper and fair management
of personnel selection, training and development, right trade-off between stability and
flexibility, diversity in the workplace, health and safety of all worker categories. The
following table (table 14) compares the social performance data, listed by area of personnel
management, of LH with the ones of AFKL. Immediately, it can be seen that AFKL is
reporting better than LH in these aspects of sustainability.
136
Based on: Lufthansa BALANCE 2009, 2010; Air France KLM Corporate Social Responsibility Report
2009, 2010

108
First of all it is useful to mention some general data of employees. LH workers have
increased in 2009 by 9% from 2008 while AFKL cut some personnel (-2,26%), increasing
the leavings of 27,51% decreasing simultaneously the new recruitments of 63,50%.
Important aspect is the stability of the workplace in AFKL; in 2009, 96% of employees in
Lufthansa Air France KLM
unit 2008 2009 % unit 2008 2009 %
Employees
Number of employees n° 107.800 117.521 9,02% 110.878 108.367 -2,26%
of which permanent contract na 104.601 104.425 -0,17%
Recruitments na 4.280 1.562 -63,50%
Leavings na 6.206 7.913 27,51%
Workforce Diversity
Ethnic minority n° 42.105 52.780 25,35% na
Women % 43,40 45,10 3,92% % 42,90 42,60 -0,70%
Women in Top Management % 14,60 14,70 0,68% % 14,90 14,90 0,00%
Average age years % 40,40 40,30 -0,25% na
People over 50 years old % 19,40 19,20 -1,03% na
People with Disabilities % 3,40 3,40 0,00% % 3,14 3,58 14,01%
Stability/Flexibility
Turnover Rate 6,80 7,10 0,30
Part-time ratio % 26,50 26,90 1,51% % 22,90 23,90 4,37%
Part-time ratio Men % 14,00 14,00 0,00% % 10,10 10,30 1,98%
Part-time ratio Women % 42,70 42,70 0,00% % 39,90 42,20 5,76%
Health and Safety
Industrial Injury Frequency na IF* 4,50 4,27 -5,11%
Total Workplace Accidents na n°
AF+KL 3.653 2.640 -27,73%
Absenteeism na *
Maternity Leave na *
Personnel Development
Percentage of payroll trainers na % 10,4 8,7 -16,35%
Training hours per employee na hours 45 34 -24,44%
Percentage of payroll trainees na % 94 92 -2,13%
Labor Relations
Collective Agreements na 23 19 -17,39%
Table 14: Social Performances Lufthansa and Air France KLM (Sources: Lufthansa BALANCE 2009, 2010; Air
France KLM Corporate Social Responsibility Report 2009, 2010)
na: datum not available because not disclosed by the airline
* Air France KLM discloses these data and many others by employee category.

109
AFKL were under permanent contract. At the same time, LH workplace loses a bit of
stability in the years; turnover rate registers a continuous increase (6,30 in 2007, 6,80 in
2008 and 7,10 in 2009).
Second aspect to be analyzed is personnel development. In 2009 (data from descriptive
reports) LH Group counted 1.227 classic apprenticeships and 307 students in the own
bachelor program. Furthermore, 4.089 Service Professionals, such as cabin crews and
passenger handling, were trained in the same year. At the end of 2009, 1.248 young past
trainees were been employed. Even after the apprentice course has been run, LH offers to
the new employees several ways to obtain additional qualifications, combining work and
university studies137
. It must be noticed that the lack of data disclosed by LH in this area
makes impossible the comparison with AFKL. In fact the French-Dutch carrier is
disclosing more meaningful data regarding percentage of trainers and trainees among
employee categories and average training hours. By the way, it is opportune to observe the
reduction of training activities in AFKL associable to many reasons: diminution of
employees, financial crisis, negative growth and profitability.
Workforce diversity constitutes another important aspect of social responsibility. In this
dimension LH is reporting more complete data of AFKL and obtaining at the same time
good performances. Nationality of employees is the first issue to be analyzed. Employees
without German citizenship in LH are 42.105 in 2008 (40% of total personnel), and 52.780
in 2009 (45% of total personnel). AFKL does not publish these data. Afterwards, the
percentage of female employees is constantly increasing in LH. In 2009, 45.10% of
workers were women while in AFKL this percentage is 42,60%. Then, women in
management position are almost 15% in both airlines. Another important aspect is the
percentage of employees with disabilities: around 3,50 % equally for the two carriers. Since
selection process is based exclusively on professional and social aptitudes, the globalization
and change in demographic development are causing and continuously increasing the
diversity among Lufthansa's employees.
Flexibility of working hours plays an important role within a society more dynamic than
ever before. Therefore some part-time jobs can be helpful to ensure many people to balance
137
Lufthansa Sustainability Reports BALANCE 2010, additional report from Lufthansa Responsibility (web)
“Apprenticeships at Lufthansa”

110
work and private lives. In 2009, percentage of total part time workers within LH is around
27% while in AFKL this is almost 24%. Part-time ratio is very different considering the
gender of employees. Part-time men within LH were 14% in 2009 while in AFKL they
were 10,30%. This percentage is much bigger for women in LH as well as in AFKL.
Considering the female employees of each company, about 42% of them have part-time
contracts in both airlines. This phenomenon could be due to maternity reasons or maybe
cultural causes.
Health and safety in the workplace represents the last dimension of personnel related
performances. LH is not reporting at all any data about accidents, injuries and absenteeism
hence it is impossible make a comparison with performances achieved by AFKL. This
latter carrier is very well reporting and performing data about accidents (-28% in 2008-
2009), industrial injury frequency (-5% in 2008-2009), absenteeism due to sickness or
accidents, and maternity leave for each employee category.
The social aspects of personnel management in LH are very well explained in the present
and future commitment towards better performances in this field. Nevertheless there is a
significant lack of information disclosed about results achieved in the areas of safety in the
workplace and personnel development. This fact makes partial the valuation of social
performances achieved by the German airline.
3.4.4 Community Performance
This dimension of sustainability performance is not analytically reported by the airlines
assessed. Considering the several social projects in which LH and AFKL are committed, it
can be observed a strong commitment by both companies in the field of corporate
citizenship. Main social purposes regard humanitarian aids, funds to NGOs caring about
ecological and social issues, development of local communities through science and
education projects and other minor commitments addressed to the society care.
Important social projects are carried out in LH through the association “Help Alliance”. It
is been founded by many staff members of the Group LH, with the goal of supporting
worldwide business startups, projects for street kids, educational institutions, orphanages
111
and bush hospitals. In 2009, Help Alliance expenditures for social projects were 736.960 €;
the highest social investment since the association was founded. Considerable support is
given by the customers' donations, through the campaign “Small Change –It's a Big Help”,
amounting to 224.053 €. This amount corresponds to 30,3 % of total association
revenues138
. Another important social project is “Cargo Human Care”, consisting in
humanitarian aids, principally medical equipments, for the people in Nairobi and other poor
countries. Corporate citizenship programs are many in LH group but, as said before, they
are not well reported in terms of right amount of funds given, voluntary work by employees
or customer contributions. This problem embraces AFKL and most of the airlines socially
committed as well. Hence, it is difficult to compare results in order to make impartial
valuations.
3.4.5 Sustainability Reporting and Stakeholder Dialogue139
Stakeholders’ dialogue constitutes another important pillar of corporate sustainability.
Making aware all stakeholder categories, especially the relevant ones, about sustainability
performances is an essential mode for building an accurate relationship. After having
identified relevant stakeholders, for example through the matrix interest/influence140
,
quality, completeness and reliability of reporting disclosures are the preconditions for
developing the structured dialogue on which the relationship is based141
. The sustainability
reporting disclosed by Lufthansa, called “Balance”, contains very useful information on
social responsibility, environment, and corporate citizenship. Furthermore, the additional
reports on sustainability issues available in the web site, are increasing the quantity and
quality of information. Nevertheless, looking at sustainability reports from other airlines,
some weakness can be identified in LH Balance.
138
Help Alliance. HelpAlliance Annual Report 2009 139
Based on: Global Reporting Initiative (GRI) 2000-2006. Sustainability Reporting Guidelines G3 (version
3.0); Air France KLM Corporate Social Responsibility Report 2010; Asiana Airlines Sustainability Report
2010; United Airlines Corporate Responsibility Report 2009-2010 140
For deepening the matrix interest/influence see paragraph 1.3.1 and The Copenhagen Charter. A
Management Guide to Stakeholder Reporting. 1999. Ernst & Young, KPMG, PricewaterhouseCoopers,
House of Mandag Morgen 141
Hinna L. 2005

112
First aspect that has to be observed is the utilization of Global Reporting Initiative
guidelines for sustainability reporting142
. In fact, a lot of airlines such as Air France KLM,
Asiana Airlines, United Airlines and many others are reporting sustainability facts in line
with the GRI guidelines G3. The utilization of the guidelines among the airlines, and in
general among other industrial sectors, can be very helpful in order to standardize the
disclosures for making easy comparisons about performances achieved. However, despite
LH Balance contains detailed data about environmental and social performances, it does
not contain references to GRI guidelines. Fortunately, the variety and completeness of LH
data make possible some comparisons with competitors but, in the future, a higher level of
standardization will be needed.
Then, other aspects regard the issues of disclosure in the report. Areas which will be
analyzed concern the disclosures about: environmental performance, social responsibility
and corporate citizenship. The section containing information about the environmental
impacts in LH is very well structured and detailed. All types of impacts below mentioned
are disclosed by overall performance of the group and detailed single performances of each
business segment. Greenhouse gas emissions and fuel consumption are published in
absolute as well as relative amounts. The most important local air emissions are listed and
quantified in absolute amounts. Then, among the data of energy and resource consumption,
very well reported, it has to be signaled that, differently than other competitors, there are
not indicators of waste recycling in LH. For example, Air France is reporting the
percentage of industrial hazardous waste recycled143
; Asiana Airlines is reporting total and
relative amounts of waste recycled144
; United Airlines is reporting recycle and landfill
equivalents of direct as well as indirect waste145
.
Finally, relying on the “minus 10 EPdB” ICAO criterion, noise emissions are reported in
LH by type of aircraft. There is not an average indicator of the overall noise performance of
the Group. In fact, some competitors are giving this general data. Air France KLM reports
142
Global Reporting Initiative (GRI) 2000-2006. Sustainability Reporting Guidelines G3 (version 3.0) 143
Air France KLM Corporate Social Responsibility Report 2010 144
Asiana Airlines Sustainability Report 2010 145
United Airlines Corporate Responsibility Report 2009-2010

113
the average noise emission in 1012
kJ; Scandinavian Airlines discloses the average noise
generation by km2/85dB(A) at takeoff146
.
Regarding social responsibility, the aspects very well treated in LH Balance concern the
workforce diversity and the trade-off stability-flexibility. Then, there is an important lack
of information disclosed about performance related to personnel development and health
and safety at the workplace. Concerning personnel development, competitors' disclosures
can be taken as examples. Air France KLM is reporting, for each employee category, the
percentage of total payroll devoted to training, the number of training hours by employee
type and the participation rate (number of agent trained/total workforce); Asiana Airlines is
publishing data about total and per person education expenses and the education hours per
person; United Airlines report contains data about on-line training courses available,
training activities completed, leadership/management training courses completed. LH
information about employees training and education is contained only in the descriptive
section of the Balance; in this way, important data, not published through visible tables or
graphics, are not enough emphasized.
Performance related to safety and health in the workplace is not reported at all in LH. Some
suggestions of indicators in this field can be taken again from competitors. Air France
KLM is disclosing data, for each employee category, regarding absenteeism due to illness,
absenteeism due to work accidents, maternity leave, workplace accidents, number of fatal
accidents, frequency rate of workplace accidents and severity rate of workplace accidents;
Asiana Airlines is providing data about the number of flight crews receiving specialized
healthcare services divided in health check-ups, primary care, follow-up care, health
education, incapacitated passenger care; additionally, the Asiatic carrier provides data about
accident rate, work-related diseases, injuries and deaths; Scandinavian Airlines publishes
data about percentage of total sick leave, classified per long term leave, gender and age; in
addition, SAS safety disclosure contains data about total number of occupational injuries
with more than one day’s sick leave and occupational injury frequency (number of
occupational injuries per million work hours).
Corporate citizenship commitment in LH is without discussion. The “Help Alliance” (LH
foundation) annual report provides some meaningful data about funds received from LH
146
Scandinavian Airlines Group Sustainability Report 2010

114
workers or customer contributions but it represents still a partial commitment towards
community. Since LH corporate citizenship program goes beyond the own foundation, the
problem in this area is again the lack of structured information, such as comparable
indicators, regarding the overall real-practical commitment towards society. Many
companies, airlines included, in their sustainability reporting are providing data about
investments in the community, funds to NGOs, volunteer workers and volunteer working
hours for social projects, etc. For example, United Airlines Corporate Responsibility Report
dedicates a section to the community performances; disclosures regard the amount of
contributions to united partners and causes divided per category, customer contributions to
Charity Miles Program, total volunteer hours and total number of volunteers.
Summarizing, Lufthansa sustainability report Balance needs some improvements in the
areas of social performances (employees and community). Firstly, the area of responsibility
towards human resources requires the integration of some meaningful performance
indicators, especially in the fields of personnel development and health and safety; then, the
area regarding the commitment for the society needs to contain more detailed indicators
about all actions undertaken. In addition, the emerging needs of standardization and
comparisons within and among industrial sectors lead the necessity to report indicators in
line with GRI guidelines. The increasing quality, completeness and reliability of
sustainability report will enhance the dialogue with all stakeholder categories, focal point of
a structured relationship.

115
Conclusions
The integrated management of economic, social and environmental performances is the
emerging challenge of a growing number of companies willing to move towards a
sustainable business. Among the numerous reasons, competitive pressures have been
driving many corporations to develop strategies aimed to improve environmental and social
performances together with long term financial results. Making strategies feasible is a
difficult task of corporate managers; it is true also for those strategies aiming to improve
profitability reducing simultaneously social and environmental impacts generated from the
business activity. Since Balanced Scorecard is a tool that works like a managerial approach
aimed to translate strategies into actions, many authors in the literature have already given
the suggestion of implementing environmental and social issues in the instrument. In this
way sustainability strategic guidelines could be translated into operative targets to monitor
through some performance indicators. Furthermore, some organizations in the business
world have already practiced this approach towards sustainability management.
Many industrial sectors are becoming increasingly sensible with respect to ethical concerns
which go beyond the compliance with law and regard the field of competitive advantage as
well. The airline sector represents one of those experiencing more challenges towards a
responsible business. Global climate change, local air quality, noise emissions and
employee policies are the main critical issues emerging in the sustainability sphere of the
aviation industry. For these reasons, the development of the case about Lufthansa’ s
business segment “Passenger Airline” could be an appropriate way for better understanding
the dynamics behind the implementation of sustainability strategies in a real company. The
case of the Sustainability Balanced Scorecard developed in Lufthansa is a simulation based
mainly on some theoretical frameworks about the process to make sustainability
operatively and daily manageable. Since the case is been developed externally (all data
utilized are publicly disclosed), the simulation certainly differs than the real dynamics of
management happening inside Lufthansa. Despite this fact, it can be considered very close
to the reality for many other reasons following listed.
First of all, the general strategic guidelines of Lufthansa (long-term profitability, focus on
customer benefits, emphasis on core competencies and system integration, attractive
116
working environment, environmental and social responsibility) fit perfectly with the five
perspectives of the Sustainability Balanced Scorecard. Then, it can be noticed a strong
connection between the strategic objectives within the SBSC and the sustainability strategic
guidelines identified in Lufthansa which are classified as economic, environmental, social
and corporate citizenship. The case is been developed basing on real sustainability and
responsibility strategies of the carrier. Strategic objectives within the perspectives have
been deducted directly from the existent sustainability strategic guidelines introduced in the
web pages about the responsibility at Lufthansa. It can be noticed that perspectives contain
between two and five objectives which have strategic relevance. Few objectives helped to
simplify the formalization of the strategy within the perspectives.
Secondly, many meaningful data and peculiarities of the carrier and the airline sector derive
both from reliable and significant sources: annual and sustainability reports of Lufthansa
and competitors, GRI guidelines, contributions of researchers in the field, ATAG, IATA
and ICAO reports are only some of the informative supports utilized for the research. These
sources have been employed for identifying the key stakeholders, listing environmental and
social exposures with the particular kind of impact generated, developing the key
performance indicators, and making the assessment of performances attained. By the way,
the assessment based on the comparison with competitors opened new ways for enhancing
the management of sustainability aspects and the stakeholder reporting. For example,
despite Lufthansa eco-efficiency increased a lot in the years, the comparison with the better
results reached by Air France KLM made impartial the valuation and laid the basis for
future improvements. Then, differently than some good competitors, the lack of indicators
disclosed by Lufthansa regarding some dimensions of employee policies emphasizes the
need to enhance some aspects of sustainability report published by the German carrier.
Furthermore, even if the whole list of key performance indicators derives only partially
from the reports disclosed by Lufthansa, many other indicators have been developed basing
on suggestions of researchers in the field of corporate sustainability in the aviation sector,
adapted from sustainability reports of competitors, or taken directly from Global Reporting
Initiative sustainability reporting guidelines G3. It must be noticed that some objectives
contain an excessive number of indicators. In fact, despite the BSC framework by Kaplan
and Norton provides between 15 and 25 indicators for all the perspectives, the list of

117
indicators developed in the case of Lufthansa is much bigger. The reason is that it aims to
be purposeful and helpful in order to better realize the connection between strategy and
operations.
Finally, strategy map is been drawn connecting the strategic objectives through causal
linkages based on logical relations that much probably occur in the reality of a business
activity.
The above mentioned features make the work more credible and thus consultable by both
business as well as academic world. For its vicinity to the reality, the case is aimed to be a
sort of consultancy on corporate sustainability in the airline sector. Furthermore, the
detailed process to implement the Sustainability Balanced Scorecard can be adapted to all
types of business activities and not only to the airlines. In fact, the identification of the field
of action (stakeholders and exposures), the development of strategies and its translation to
objectives and indicators, finally, the construction of the strategy map, are all compulsory
steps that every company must make in order to develop a balanced scorecard for corporate
sustainability.
In addition, further research can be made in the field of corporate sustainability
management in the aviation sector. Other indicators, which could be more meaningful for
the purpose of monitoring the integrated sustainability performances, can be identified.
Then, deeper analysis about the historical trends of indicators identified and their
connections can be useful for confirming or rejecting the assumptions about the causal
relations among objectives. New relations between indicators, and thus objectives, could
even be discovered. For these purposes, mathematic tools and statistical analysis, such as
multiple regressions, are needed.
In conclusion, the work was expected to introduce and clarify the process to translate
sustainability strategies into actions trough the implementation of the SBSC. This tool can
be considered a good starting point for incorporating environmental and social aspects into
business management decisions. Nevertheless, the support of the scorecard for moving
towards corporate sustainability represents only a partial step. The full commitment in the
direction of a sustainable business must be characterized by many other changes affecting
culture, structure and management of the organization. First of all, leadership and strategy
represent the key factors. Commitment of top management towards social and

118
environmental concerns must be communicated to all levels of the organization. The whole
organization has to be practically and culturally involved in the process towards corporate
sustainability. Then, management systems should support the successful implementation of
the sustainability practices. Costing, capital investment and risk management systems must
contain parameters for the evaluation of the integrated environmental, social and economic
performances. Connected to the performance evaluation system, incentives and rewards
should address the employees to social and environmental improvements. In addition,
payoffs of sustainability actions have to be measured and assessed. New measurement
systems, based on collection and processing of integrated environmental, social and
economic data, should provide information useful for improving both sustainability and
financial performances. Finally, external sustainability reporting must be disclosed in order
to share information with all stakeholders.
Despite it remains only a phase for moving towards a responsible business, Sustainability
Balanced Scorecard represents an important starting point for the integrated management of
economic, environmental and social performances.

119
References
Air France KLM Annual Report 2007-08, 2008-09, 2009-10
Air France KLM Corporate Social Responsibility Report 2008, 2009, 2010
Airlinereporter Web. http://www.airlinereporter.com/2010/11/lufthansa-first-airline-to-use-
biofuel-on-passenger-flights/
Asiana Airlines Sustainability Report 2010
ATAG (Air Transport Action Group). The Economic and Social Benefits of Air Transport
2008
ATW World Airline Report 2007, 2008, 2009
Bieker T, Dyllick T, Gminder C U, Hockerts K. 2001. Towards a sustainability balanced
scoreard: linking environmental and social sustainability to business strategy. Institute for
Economy and the Environment, University of St. Gallen (IWOe-HS), INSEAD Center for
the management of Environmental Resources, Fontainebleau
Bieker T. 2005. Sustainability management with the Balanced Scorecard. Institute for
Economy and the Environment, University of St. Gallen (IWOe-HS)
Cheng C Y, Fet A M, Holmen E. 2010. Using Hexagonal Balanced Scorecard approach to
integrate Corporate Sustainability into Strategy. Department of Industrial Economics and
Technology Management, Norwegian University of Science and Technology, Trondheim
Chirieleison C. 2002. Le strategie sociali nel governo dell'azienda. Giuffrè, Milano
Clarkson M. 1995. A stakeholder framework for analyzing and evaluating corporate social
performance. The Academy of Management Review 20(1): 92–117
Coda V. 1995. L'orientamento strategico dell'impresa. Utet Università, Milano
Crawford D, Scaletta T. 2005. The Balanced Scorecard and Corporate Responsibility:
Aligning Values for Profit. CMA Management, 79(6), p 20-27
Diaz Guerrero, A., Möller, D. and Wagner, M. 2002. Sustainability balanced scorecard in
der Flughafen Hamburg GmbH. In Schaltegger, S. and Dyllick, T. (Eds.): Nachhaltig
managen mit der Balanced Scorecard, Gabler, Wiesbaden, German, pp.229–258.
Dyllick T, Hokerts K. 2002. Beyond the business case for corporate sustainability.
Business Strategy and the Environment 11, 130-141

120
Dyllick T, Belz F, Schneidewind U. 1997. Okologie und Wettbewerbsfa higkeit. Munich:
Hanser
Elkington J. 1997. Cannibals with Forks: the Triple Bottom Line of 21st Century Business.
Capstone, Oxford
Epstein M J, Roy M J. 2001. Sustainability in Action: Identifying and Measuring the Key
Performance Drivers. Long Range Planning 34: 585-604
Epstein M J, Roy M J. 2003. Improving Sustainability Performance: Specifying,
Implementing, and Measuring Key Principles. Journal of General Management 29,I: 15-31
Epstein M J, Roy M J. 2003. Making the Business Case for Sustainability. Linking Social
and Environmental Actions to Financial Performance. The Journal of Corporate
Citizenship, issue 9, spring, 79-96
Epstein M J. 2008. Making Sustainability Work. Best Practices in Managing and
Measuring Corporate Social, Environmental, and Economic Impacts. Berrett-Koehler
Publisher, San Francisco
Figge F, Hahn T, Schaltegger S, Wagner M. 2001. The Sustainability Balanced Scorecard
– a tool for value-oriented sustainability management in strategy-focused organizations.
Conference Proceedings of the 2001 Eco-Management and Auditing Conference.ERP
Environment: Shipley; 83–90.
Figge F, Hahn T, Schaltegger S, Wagner M. 2002a. The Sustainability Balanced Scorecard.
Linking Sustainability Management to Business Strategy. Business Strategy and the
Environment 11, 269–284
Figge F, Hahn T, Schaltegger S, Wagner M. 2002b. The Sustainability Balanced
Scorecard. Theory and Application of a Tool for Value-Based Sustainability Management.
Center for Sustainability Management, University of Luneburg
Fombrun C J, Gardberg N A, Sever J M. 2000. The Reputation Quotient: A Multi-
stakeholder Measure of Corporate Reputation. Journal of Brand Management 7,4: 241-255
Freeman R E. 1984. Strategic Management: a Stakeholder Approach. Pitman Books,
Boston, Mass
Global Reporting Initiative (GRI) 2000-2006. Sustainability Reporting Guidelines G3
(version 3.0)
Hamner B. 2005. Integrating Market Based Sustainability Indicators and Performance
Management Systems. Hamner and Associates LLC, Seattle
Help Alliance. HelpAlliance Annual Report 2009

121
Hinna L. 2005. Come gestitre la reponsabilità sociale dell’impresa. Il sole 24 ore
Hockerts K. 2001. Corporate Sustainability Management. Toward controlling corporate
ecological and social sustainability. Ninth International Conference of Greening of
Industry Network, January 21-25, 2001, Bangkok
IATA (International Air Transport Association). Fact sheet 2010
IATA (web): http://www.iata.org/Pages/default.aspx
ICAO (International Civil Aviation Organization). ICAO Environmental Report 2010
ICAO (web): http://www.icao.int/
Jordao T C, Rhouma A B. 2010. An Assessment of the Attitude of World's Largest Airlines
towards Sustainability. Faculty of Economics and Administration, Institute of Public
Administration and Law, Pardubice, Czech Republic
Jordao T C. 2009. A sustainability overview of the best practices in the Airport Sector.
Faculty of Economics and Administration, Institute of Public Administration and Law,
Pardubice, Czech Republic
Kaplan R S, Norton D P. 1992. The Balanced Scorecard. Measures that Drive
Performance. Harvard Business Review
Kaplan R S, Norton D P. 1996. The Balanced Scorecard: Translating Strategies into
action. Harvard Business School Press: Boston
Kaplan R S, Norton D P. 2003. Building a Strategy-focused Organization. Ivey Business
Journal
Kaplan R S, Norton D P. 2004. Strategy Maps: converting intangible assets into tangible
outcomes. Harvard Business School Press
Liebl F. 1996. Strategische Fruhaufklarung: Trends, Issues, Stakeholders. Oldenbourg:
Munchen.
Lufthansa additional reports on: Lufthansa Responsibility (web)
Lufthansa Annual Reports 2006, 2007, 2008, 2009, 2010
Lufthansa Corporate (web): http://konzern.lufthansa.com/en/
Lufthansa Investor Relations (web): http://investor-relations.lufthansa.com/de.html
Lufthansa Responsibility (web): http://verantwortung.lufthansa.com/en/

122
Lufthansa Sustainability Reports BALANCE 2006, 2007, 2008, 2009, 2010
Lynes J K, Andrachuk M. 2008. Motivation for corporate social and environmental
responsibility: a case of Scandinavian Airlines. Journal of International Management 14,
377-390
Martin R L. 2002. The Virtue Matrix: Calculating the return on Corporate Responsibility.
Harvard Business Review
Minoja M. 2008. Responsabilità sociale e strategia: alla ricerca di un’integrazione. Egea,
Milano
Moller A, Schaltegger S. 2005. The Sustainability Balanced Scorecard as a Framework for
Eco-efficiency Analysis. Journal of Industrial Ecology - Volume 9, Number 4
Reinhardt F. 2000. Down to Earth. Applying business principles to environmental
management. Harvard Business School Press
Scandinavian Airlines Group Sustainability Report 2010
Schaltegger S, Bennett M, Burritt R. 2006. Sustainability Accounting and Reporting.
Berlin, Springer 1-33
Schaltegger S, Wagner M. 2006. Integrative management of sustainability performance,
measurement and reporting. Int. J. Accounting, Auditing and Performance Evaluation, Vol.
3, No. 1
Stanford University, The Airline Industry.
http://adg.stanford.edu/aa241/intro/airlineindustry.html
The Copenhagen Charter. A Management Guide to Stakeholder Reporting. 1999. Ernst &
Young, KPMG, PricewaterhouseCoopers, House of Mandag Morgen
The Prince’s Accounting for Sustainability Project 2007. Connected Reporting: a practical
guide with worked examples. Accountingforsustainability.org London
United Airlines Corporate Responsibility Report 2009-2010
WBCSD (World Business Council for Sustainable Development). 1992. Changing Course.
United Nation Conference on Environment and Development (UNCED), Rio de Janeiro
WCED (World Commission for Environment and Development). 1987. Our Common
Future. Oxford University Press
Williard B. 2005. The Next Sustainability Wave: Building Boardroom Buy-In. Gabriola
Island, British Columbia. New Society Publisher

123
Wilson M. 2003. Corporate Sustainability: What is it and where does it come from? Ivey
Business Journal March/April
Yaziji M. 2004. Turning Gadflies into Allies. Harvard Business Review
Yilmaz A K, Flouris T. 2010. Managing corporate sustainability: Risk management
process based perspective. African Journal of Business Management, Vol.4 (2), pp. 162-
171
Yilmaz A K. 2008. The Corporate Sustainability Model for Airline Business. European
Journal of Scientific Research, Vol.22, No.3, pp. 304-317
Zadek S. 1999. Stalking Sustainability. Greener Management International 26: 1–11.
Zadek S. 2004. The path to Corporate Responsibility. Harvard Business Review
Zingales F, O’Rourke A, Hockerts K. 2002. Balanced Scorecard and Sustainability: State
of the Art Review. INSEAD Working Paper, Fontainebleau, France
Zoeeman B, Reisen O, Kaashoek B. 2007. Do global critical events impact organizational
sustainability attitudes? The case of airline industry. Aerlines Magazine, e-zine edition 35,
1-7