trx investor presentation - iis windows...
TRANSCRIPT

TRX Investor PresentationSunTrust Robinson Humphrey Business Services Conference
November 8, 2005

Safe Harbor
Certain statements in this presentation may constitute “forward-looking” statements as defined in Section 27A of the Securities Act of 1933 (the “Securities Act”), Section 21E of the Securities Exchange Act of 1934 (the “Exchange Act”), the Private Securities Litigation Reform Act of 1995 (the “PSLRA”), or in releases made by the Securities and Exchange Commission, all as may be amended from time to time.
Statements contained in this presentation that are not historical facts may be forward-looking statements within the meaning of the PSLRA. Any such forward-looking statements reflect our beliefs and assumptions and are based on information currently available to us and are subject to risks and uncertainties that could cause actual results to differ materially, including but not limited to, the loss of key clients, volatility in the number of transactions we service, failure or interruptions of our software, hardware and other systems, industry declines, competitive pressures and other risks.
Forward-looking statements are predictions and involve known and unknown risks, uncertainties and other factors that may cause our actual results, performance or achievements, or industry results, to be materially different from any future results, performance or achievements expressed or implied by such forward-looking statements. We undertake no obligation to publicly update any forward-looking statements, whether as a result of new information, future events or otherwise. These cautionary statements are being made pursuant to the Securities Act, the Exchange Act and the PSLRA with the intention of obtaining the benefits of the “safe harbor” provisions of such laws. TRX, Inc. cautions investors that any forward-looking statements we make are not guarantees or indicative of future performance.

TRX Business Model: Transaction Processing & Data Integration
World’s largest transaction markets – travel and financial services
Rapid and fundamental market changes working in our favor
Significant transaction volume and scale for multiple clients
1
Multiple touches with TRX hosted technology solutions

TRX Investment Highlights: Powering Travel Distribution Transformation
Leading market position in transaction processing and data integration
Established relationships with global travel industry leaders
Independent, objective and unbiased technology provider
Core end-to-end travel processing infrastructure
Strong financial model with revenue and margin growth opportunity
Disciplined management team
2

Source: TRX Estimates
Global Growth of 4% CAGR
US $200 Billion
Rest of the World$615 Billion
2004 Global Gross Travel Sales
Source: PhoCusWright
Total U.S. Travel and Online PenetrationIn Billions
Online Growth Driving Change
75%
25%
2 0 0 2 2 0 0 3 2 0 0 4 2 0 0 5 2 0 0 6
Total TravelOnline Penetration
$186.0 $189.8$195.4
$203.6$213.8
23%31%
39%
48%54%
2002 2003 2004 2005 20062 0 0 2 2 0 0 3 2 0 0 4 2 0 0 5 2 0 0 6
Total TravelOnline Penetration
$186.0 $189.8$195.4
$203.6$213.8
23%31%
39%
48%54%
2002 2003 2004 2005 20062 0 0 2 2 0 0 3 2 0 0 4 2 0 0 5 2 0 0 6
Total TravelOnline Penetration
$186.0 $189.8$195.4
$203.6$213.8
23%31%
39%
48%54%
2002 2003 2004 2005 2006
Travel: Growing, Massive Industry & Largest eCommerce Category
3

% o
f Mar
ket
0%
5%
10%
15%
20%
25%
30%
35%
40%
45%
2001 2002 2003 2004 2005 2006
29%
CAGR
11%
5%
(16)%
% o
f Mar
ket
0%
5%
10%
15%
20%
25%
30%
35%
40%
45%
2001 2002 2003 2004 2005 2006
29%
CAGR
11%
5%
(16)%
0%
5%
10%
15%
20%
25%
30%
35%
40%
45%
2001 2002 2003 2004 2005 2006
29%
CAGR
11%
5%
(16)%
Trends Favor Low-Cost Providers
Declining Agency Commissions
Declining Average Air Fares
Source: Airlines Reporting Corporation, TRX
Dramatic Concentration
Source: Runzheimer International
Travel: Concentrating Distribution & Changing Economics
Source: TRX Estimates Based on PhoCusWright and Forrester Research
Travel Segments - CAGR (2001-2006)
Top 15 Sellers of Travel2001 = 50%2006 = 75%
$400
$420
$440
$460
$480
$500
2001 2002 2003 2004 2005
$500
$458$448
$440
$411
Q1$400
$420
$440
$460
$480
$500
2001 2002 2003 2004 2005
$500
$458$448
$440
$411
Q1
0.0%
2.0%
4.0%
6.0%
8.0%
10.0%
12.0%
1994 1995 1996 1997 1998 1999 2000 2001 2002+
10.1%9.1% 8.7%
8.0%
6.8%5.8%
4.0% 3.5%
0.0%0.0%
2.0%
4.0%
6.0%
8.0%
10.0%
12.0%
1994 1995 1996 1997 1998 1999 2000 2001 2002+
10.1%9.1% 8.7%
8.0%
6.8%5.8%
4.0% 3.5%
0.0%
Online Agencies
Suppliers
Large Agencies
Other Agencies
4

CFO Mandates & Growth of Credit Card Usage
Changing Procurement of T&E
Source: “Expense Management: Driving Savings Through Better Information and Spending Policies,” American Express, 2005
“59% of CFOs report their companies use a
corporate card system, but many want more readily
available and easily accessedspending data…”
Source: The Nilson Report, December 2004
Growth of Electronic Payment
US Payment Transactions (1998-2008)
1 9 9 8 2 0 0 3 2 0 0 8
Electronic& Card
Check& Cash
24% 50%36%
1 9 9 8 2 0 0 3 2 0 0 8
Electronic& Card
Check& Cash
1 9 9 8 2 0 0 3 2 0 0 8
Electronic& Card
Check& Cash
24% 50%36%
5
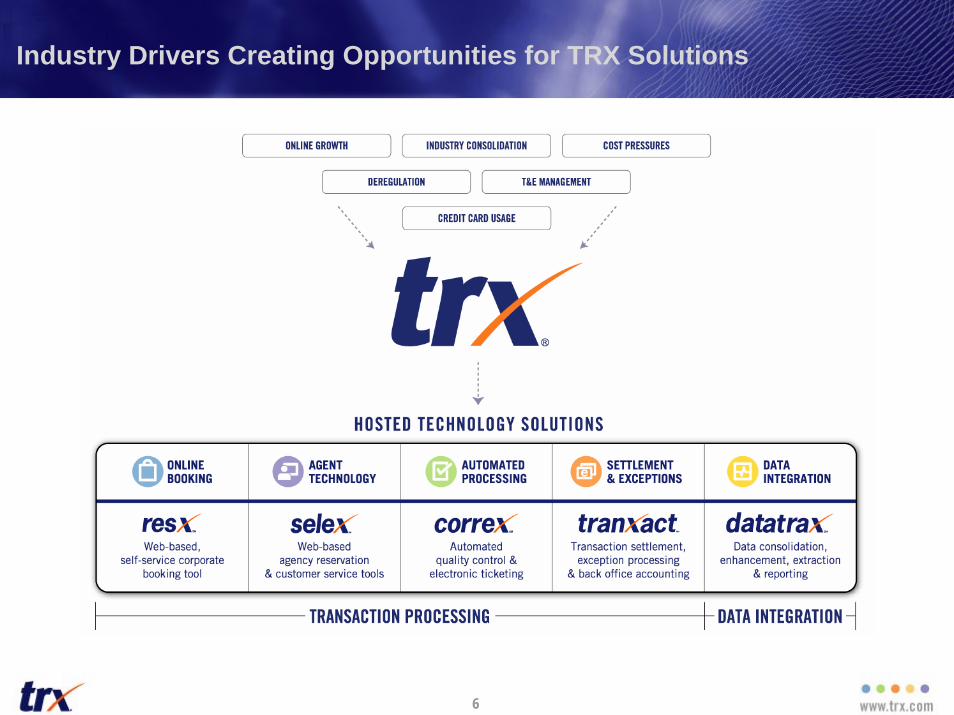
Industry Drivers Creating Opportunities for TRX Solutions
6

Covering the Transaction Lifecycle
Refunds, Voids, & Exchanges Paper Tickets Settlement
Global Data Feeds Normalization Enhancement Actionable Information
Reservation Improvement & Auto-Ticketing
Self-Service
Agent-Assisted Workflow Management Ticket Tracking Audit & Research
7

Automation & Process Re-Engineering Reduce Costs
Labor
Downtime
Processing
Errors
Training
$$$$
Development
Processing Infrastructure
Redundancy
Data Security
$
Traditional Agency Processing & Ticketing Model vs. TRX Model
12-24 months
8
85% Cost Reduction

Powering Travel Distribution Transformation & Global Market Leaders
9

Competitive Advantages
Switching Costs
Transaction Scale
Strategic Relationships
Industry Expertise
10

Disciplined Strategy with Multiple Sources of Growth
Capitalize on the migration to online travel
Grow revenues from traditional travel agencies
Continue to enhance our technology offerings
Expand use of our data integration capabilities
Pursue strategic relationships and acquisition opportunities
11

Management Team with Experience & Discipline
Shane HammondExecutive Vice President, Sales & Client Services,
North America
Peter GroverExecutive Vice President, Sales & Client Services,
Europe
Charlie CrissmanExecutive Vice President,
StrategicPlanning
David CathcartVice President,
Finance &Controller
Helen PorterVice President,
Solutions Management & Application Development
Tim SevertExecutive
Vice President,Administration
Vic PynnChief
OperatingOfficer
Lindsey SykesChief
Financial Officer
12

2005 Revenue Sources
Growth with Expanding Margins
Transaction-Based Revenue Model
4%Project
95%Transaction
1%Implementation
& Other
Strong Financial Model
• Attractive growth rates
• Improving revenue mix
• Cost structure leverage
• Shared scale
• Strong cash generation
13

2000 2001 2002 2003 2004
Rapid Growth in Core Service Offerings
58% CAGR
(15)% U.S. CAGR
Transaction Processing Revenue Data Integration Revenue
Customer Care Revenue
US
Europe
In Millions
In Millions
(1) CAGR excludes impact of 2004 European joint ventures acquisitions.
26% CAGR
US
Europe
In Millions
(1)
2000 2001 2002 2003 2004
2000 2001 2002 2003 2004
2000 2001 2002 2003 2004$0 -
$2 -
$4 -
$6 -
$8 -
$10 -
$12 -
$0
$5
$10
$15
$20
$25
$30
$35
$0 -
$10 -
$20 -
$30 -
$40 -
$50 -
$60 -
$70 -
14
Revenue Mix
2000
TransactionProcessing (63%)
CustomerCare (24%)
DataIntegration (13%)
2001 2002 2003 2004 2005YTD
100%
80%
60%
40%
20%
0%

Adjusted EBITDA excl. non-cash stock comp
Summary Financial Performance
2005 YTD
Adjusted EBITDAAdd: Non-cash stock compensation
($ in millions)2002 2003 2004 '02 - '04 CAGR
Revenue (1)
Transaction Processing $40.1 $49.1 $66.4 $55.7 28.7%Data Integration 3.2 6.0 10.5 11.9 82.5Customer Care 22.0 17.7 32.5 21.7 21.4
Total Revenue 65.3 72.8 109.4 89.3 29.5
Recurring Cash ExpensesOperating 41.3 43.7 73.2 57.2 33.2Selling, General & Administrative 16.2 16.0 19.9 14.7 11.5Technology Development 5.1 6.4 13.5 8.9 63.2
Total Recurring Cash Expenses 62.5 66.1 106.6 80.8 30.81.9 5.7 2.8 8.5
Operating Income (EBIT) (5.2) (1.6) (7.1) 0.6Net Income ($9.4) ($4.4) ($11.2) ($7.0)
(1) Excludes client reimbursements(2) Excludes IPO incentive payments of $0.5 million in 2005(3) Excludes non-recurring IPO and restructuring costs
3.9% 8.8% 2.9% 9.6%Margin
0.7 0.7 0.4 0.12.6 6.4 3.2 8.6
Other DataCash provided by operations $5.4 $13.1 $2.6 $6.5Capital expenditures 4.9 7.5 9.4 6.7
(2)
(3)
15

Proven Operating Leverage
2000 2001 2002 2003 2004 2005YTD
0%
20%
40%
60%
80%
Margin Expansion Scaleable Cost Structure
Expenses
Customer Care Mix
Adjusted EBITDA (Excludes non-cash stock compensation)
(1) Includes equity method losses 2000-2003
(2) Excludes non-cash stock compensation
59%
64%
72%
(1)Operating %
SG&A%
Tech Dev %
26%
21% 17%
10%11% 10%
(2)
16
-8%
-6%
-4%
-2%
0%
2%
4%
6%
8%
10%
(8%)
(2%)
4%
9%
3%
9%
2000 2001 2002 2003 2004 2005YTD
-8%
-6%
-4%
-2%
0%
2%
4%
6%
8%
10%
(8%)
(2%)
4%
9%
3%
9%
-8%
-6%
-4%
-2%
0%
2%
4%
6%
8%
10%
(8%)
(2%)
4%
9%
3%
9%
2000 2001 2002 2003 2004 2005YTD

Cash and Cash Equivalents $29.7
($ in millions)September 30, 2005 September 30, 2005
Assets Liabilities
Current Assets Current LiabilitiesAccounts Payable and Accrued Liabilities $28.0
Trade Accounts Receivable, net 9.0 Customer Deposits and Deferred Revenue 13.8Prepaids and Other 2.3 Current Portion of Long-Term Debt 3.4
Total Current Assets 41.1 Total Current Liabilities 45.2
Property and Equipment 18.2 Long-Term Debt, less current portion 1.9
Other Noncurrent Assets
Convertible Notes 1.4
Goodwill 21.5Other Assets 0.6
Shareholders’ Equity
Total Noncurrent Assets 22.1
Common Stock & APIC 90.1Treasury Stock (2.3)Deferred Compensation (0.1)Cumulative Translation Adjustment 0.5Accumulated Deficit (56.1)
Total Stockholders’ Equity 32.2
Total Assets $81.4 Total Liabilities and Stockholders’ Equity $81.4
Clean Balance Sheet
Other long-term liabilities 0.7
17
6.7

Long-Term Growth Targets
CATEGORY FY 2004 2005 YTD TARGET
35%768350
3%
(7)%
(9)%
10%81
(16)7
9%
1%
(2)%
Revenue Growth (Y-o-Y)Transaction ProcessingData IntegrationCustomer Care
Total
20 – 25%25 – 35%
$10 – 20 million base20 – 30%
Adjusted EBITDA Margin 18 – 23%
Operating Income Margin 12 – 18%
Net Income Margin 7 – 11%
(1) Impacted by U.S. Airways termination in May 2004 and long-term extensions of European contracts.
(2) Excludes stock compensation associated with the adoption of SFAS 123R.
(3) Excludes non-recurring IPO and restructuring costs.
(2)
(1)
(3)
(3)
18

TRX Investment Highlights: Powering Travel Distribution Transformation
Leading market position in transaction processing and data integration
Established relationships with global travel industry leaders
Independent, objective and unbiased technology provider
Core end-to-end travel processing infrastructure
Strong financial model with revenue and margin growth opportunity
Disciplined management team
19
