endurance specialty holdings ltd. - iis windows...
TRANSCRIPT

Endurance Specialty Holdings Ltd.
INVESTOR FINANCIAL SUPPLEMENT
FIRST QUARTER 2005

Endurance Specialty Holdings Ltd.Wellesley House, 90 Pitts Bay Rd.Pembroke HM 08, Bermuda
Massa B. CressallAssistant VP, Strategy and PlanningPhone: (441) 278-0988Fax: (441) 278-0493email: [email protected]
This report is for information purposes only. It should be read in conjunctionwith other documents filed by Endurance Specialty Holdings Ltd. pursuant tothe Securities Act of 1933 and the Securities Exchange Act of 1934.

Financial Supplement Table of Contents
Pagei. Basis of Presentation iii. Organizational Chart of Executive Management iiiii. Organizational Chart of Corporate Structure iii
I. Financial Highlights 1
II. Consolidated Financial Statementsa. Consolidated Statements of Income 2b. Consolidated Balance Sheets 3c. Segment Distribution 4d. Consolidated Segment Data 5e. Deposit Accounting Adjustment Impacts on Segment Data 6
III. Other Financial Informationa. Unrealized Gains and Operating Cash Flow 7b. Return on Equity Analysis 8c. ROE Component Analysis - Operating and Investment Leverage 9d. Investment Portfolio Information 10
IV. Loss Reserve Analysisa. Activity in Reserve for Losses and Loss Expenses 11b. Analysis of Unpaid Losses and Loss Expense 12
V. Share Analysisa. Dilutive Shares Outstanding 13b. Operating Income Reconciliation 14c. Dilutive Shares Sensitivity Analysis 15d. Book Value Per Share Analysis 16e. Growth in Book Value Per Share Analysis 17
VI. Regulation G 18
Application of the Safe Harbor of the Private Securities Litigation Reform Act of 1995:Some of the statements in this financial supplement may include forward-looking statements which reflect our current views with respect to future events and financial performance. Such statements may include forward-looking statements both with respect to us in general and the insurance and reinsurance sectors specifically, both as to underwriting and investment matters. Statements which include the words “expect,” “intend,” “plan,” “believe,” “project,” “anticipate,” “seek,” “will,” and similar statements of a future or forward-looking nature identify forward-looking statements in this financial supplement for purposes of the U.S. federal securities laws or otherwise. We intend these forward-looking statements to be covered by the safe harbor provisions for forward-looking statements in the Private Securities Litigation Reform Act of 1995. Readers are cautioned not to place undue reliance on these forward-looking statements, which speak only to the date on which they are made. We undertake no obligation to publicly update or review any forward looking statement, when as a result of new information, future developments or otherwise.
All forward-looking statements address matters that involve risks and uncertainties. Accordingly, there are or may be important factors that could cause actual results to differ from those indicated in the forward-looking statements. These factors include, but are not limited to, competition, possible terrorism or the outbreak of war, the frequency or severity of unpredictable catastrophic events, changes in demand for insurance or reinsurance, rating agency actions, uncertainties in our reserving process, a change in our tax status, acceptance of our products, the availability of reinsurance or retrocessional coverage, retention of key personnel, political conditions, changes in accounting policies, changes in general economic conditions and other factors described in our Annual Report on Form 10-K for the year ended December 31, 2004.

ENDURANCE SPECIALTY HOLDINGS LTD.BASIS OF PRESENTATION
DEFINITIONS AND PRESENTATIONAll financial information contained herein is unaudited, except the balance sheet and income statement data for the years ended December 31, 2004 and December 31, 2003, which was derived from the Company's audited financial statements.
Unless otherwise noted, all data is in thousands, except for per share, percentage and ratio information.
As used in this financial supplement, "common shares" refers to our ordinary shares and class A shares, collectively.
Endurance Specialty Holdings Ltd., along with others in the industry, uses underwriting ratios as measures of performance. The loss ratio is the ratio of claims and claims adjustment expense to earned premiums. The acquisition expense ratio is the ratio of underwriting expenses (commissions, taxes, licenses and fees, as well as other underwriting expenses) to earned premiums.The general and administrative expense ratio is the ratio of general and administrative expenses to earned premiums. The combined ratio is the sum of the loss ratio, the acquisition expense ratioand the general and administrative expense ratio. These ratios are relative measurements that describe for every $100 of net premiums earned or written, the cost of losses and expenses, respectively.The combined ratio presents the total cost per $100 of earned premium. A combined ratio below 100% demonstrates underwriting profit; a combined ratio above 100% demonstrates underwriting loss.
GAAP combined ratios differ from statutory combined ratios primarily due to the deferral of certain third party acquisition expenses for GAAP reporting purposes and the use of net premiums earned rather than net premiums written in the denominator when calculating the acquisition expense and the general & administrative expense ratios.
NM - Not meaningful; NA - Not Applicable; LTM - Latest twelve months.
i

ENDURANCE SPECIALTY HOLDINGS LTD. ORGANIZATION CHART
Endurance Specialty Holdings Ltd.
Chairman, President and Chief Executive Officer - Kenneth LeStrange
Chief Financial Officer - James Kroner Chief Actuary and Chief Risk Officer - David Cash General Counsel - John Del Col
Endurance Reinsurance Corporation of America
(Principal Operation - New York)
President - William Jewett
Endurance Specialty Insurance Ltd.
(Principal Operation - Bermuda)
President - David Cash
Endurance Services Limited
(Principal Operation - New York)
Chairman, Underwriting Committee -
Steven Carlsen
President - John O'Connor
Endurance Worldwide Insurance Limited
(Principal Operation - London)
Chief Executive Officer - Mark Boucher
Endurance Insurance Operations
President - Michael Fujii
ii

ENDURANCE SPECIALTY HOLDINGS LTD.CORPORATE ORGANIZATION CHART
Endurance U.S. Holdings Corp.
(U.S.)
Endurance Services Limited(U.K.)
Endurance Specialty Holdings Ltd.(Bermuda)
Endurance Worldwide Holdings Limited (U.K.)
Endurance Worldwide Insurance
Limited(U.K.)
Endurance Specialty
Insurance Ltd.(Bermuda)
Endurance Specialty Insurance Marketing
Corp.(U.S.)
Endurance Elite
Assurance Company(Bermuda)
Endurance Reinsurance
Corporation of America(U.S.)
iii

PreviousMARCH 31, Quarter
2005 2004 Change
HIGHLIGHTS Net income $96,259 $100,872 (4.6)%Operating income [a] 102,673 98,685 4.0%Gross premiums written 702,491 720,631 (2.5)%Net premiums earned 437,598 415,826 5.2%Total assets 5,695,088 4,127,517 38.0%Total shareholders' equity 1,882,640 # 1,763,103 # 6.8%
PER SHARE Basic earnings per shareAND SHARES DATA Net income (as reported) $1.57 $1.57 (0.2)%
Operating income (as reported) [a] $1.68 $1.54 8.8%Diluted earnings per share
Net income (as reported) $1.45 $1.47 (1.1)%Operating income (as reported) [a] $1.55 $1.44 7.8%
As Reported Weighted average common shares outstanding 61,292 64,084 (4.4)%Weighted average common shares outstanding and dilutive potential common shares 66,166 68,555 (3.5)%
Book Value Book value [b] $30.94 $27.48 12.6%Per Share Diluted book value (treasury stock method) [b] $28.23 $25.51 10.7%
FINANCIAL RATIOS Return on average equity (ROAE), net income [c] 5.1% 5.9% (0.8)%ROAE, operating income [a] [c] 5.5% 5.8% (0.3)%Return on beginning equity (ROBE), net income 5.2% 6.1% (1.0)%ROBE, operating income [a] 5.5% 6.0% (0.5)%
Annualized ROAE, net income [c] 20.6% 23.7% (3.1)%Annualized ROAE, operating income [a] [c] 21.9% 23.2% (1.2)%Annualized ROBE, net income 20.7% 24.5% (3.9)%Annualized ROBE, operating income [a] 22.1% 24.0% (1.9)%Annualized investment yield 4.0% 3.6% 0.4%
Loss ratio 57.4% 53.4% 4.0%GAAP Acquisition expense ratio 19.8% 20.6% (0.8)%
General and administrative expense ratio 7.7% 7.6% 0.1%Combined ratio 84.9% 81.6% 3.3%
STAT Acquisition expense ratio 18.5% 20.0% (1.5)%General and administrative expense ratio 4.8% 4.4% 0.4%
Combined ratio 80.7% 77.8% 2.9%
[a] Operating income represents after-tax operational results excluding, as applicable, after-tax net realized capital gains or losses and after-tax net foreign exchange gains or losses. Please see page 14 for a reconciliation to net income.[b] For detailed calculations please refer to page 16.[c] Average equity is calculated as the arithmetic average of the beginning and ending equity balances for the stated periods.
QUARTER ENDED
ENDURANCE SPECIALTY HOLDINGS LTD.CONSOLIDATED FINANCIAL HIGHLIGHTS
1

ENDURANCE SPECIALTY HOLDINGS LTD.CONSOLIDATED STATEMENTS OF INCOME
QUARTER ENDEDMARCH 31, YEAR ENDED
2005 2004 DEC. 31, 2004UNDERWRITING REVENUESGross premiums written $702,491 $720,631 $1,711,357Premiums ceded (3,313) (3,624) (14,337)
Net premiums written 699,178 717,007 1,697,020Change in unearned premiums (261,580) (301,181) (64,420)Net premiums earned $437,598 $415,826 $1,632,600Other underwriting income 171 --- ---
Total underwriting revenues 437,769 415,826 1,632,600UNDERWRITING EXPENSESLosses and loss expenses $251,059 $222,009 $937,330Acquisition expenses 86,775 85,518 329,784General and administrative expenses 33,546 31,767 133,725
Total underwriting expenses 371,380 339,294 1,400,839Underwriting income $66,389 $76,532 $231,761
OTHER OPERATING REVENUE/EXPENSESNet investment income $40,011 $24,675 $122,059Interest expense (5,471) (828) (9,959)Amortization of intangibles (1,220) (944) (3,990)
Total other operating revenue/expenses $33,320 $22,903 $108,110INCOME BEFORE OTHER ITEMS 99,709 99,435 339,871OTHERNet foreign exchange (losses) gains ($2,421) ($3,159) ($214)Net realized (losses) gains on investments (4,453) 5,176 6,130Income tax benefit (expense) 3,424 (580) 9,797NET INCOME $96,259 $100,872 $355,584
KEY RATIOS/PER SHARE DATA
Loss ratio 57.4% 53.4% 57.4%Acquisition expense ratio 19.8% 20.6% 20.2%General and administrative expense ratio 7.7% 7.6% 8.2%Combined ratio 84.9% 81.6% 85.8%
Weighted average basic shares outstanding 61,292 64,084 62,781Weighted average dilutive shares outstanding 66,166 68,555 67,283
Basic EPS $1.57 $1.57 $5.66Diluted EPS $1.45 $1.47 $5.28
ROAE [a] 5.1% 5.9% 20.3%
[a] Average equity is calculated as the arithmetic average of the beginning and ending equity balances for the stated periods.
2

ENDURANCE SPECIALTY HOLDINGS LTD.CONSOLIDATED BALANCE SHEETS
MAR. 31, 2005 DEC. 31, 2004ASSETSCash and cash equivalents $273,785 $271,143Fixed maturity investments available for sale, at fair value 3,673,191 3,578,174Investments in other ventures, under equity method 108,536 91,036Premiums receivable, net 847,327 545,352Deferred acquisition costs 238,182 195,419Securities lending collateral 404,673 407,527Prepaid reinsurance premiums 5,990 5,248Losses recoverable 12,434 12,203Accrued investment income 32,166 28,378Intangible assets 42,364 47,107Other assets 56,440 44,251TOTAL ASSETS $5,695,088 $5,225,838
LIABILITIESReserve for losses and loss expenses $1,706,957 $1,549,661Reserve for unearned premiums 1,157,973 897,605Deposit liabilities 56,108 ---Reinsurance balances payable 67,319 70,507Securities lending payable 404,673 407,527Debt 391,286 391,280Other liabilities 28,132 46,803TOTAL LIABILITIES $3,812,448 $3,363,383SHAREHOLDERS' EQUITYCommon shares
60,579 issued and outstanding (2004 - 61,255) $60,579 $61,255Additional paid-in capital 1,091,722 1,111,633Accumulated other comprehensive (loss) income (662) 39,473Retained earnings 731,001 650,094TOTAL SHAREHOLDERS' EQUITY $1,882,640 $1,862,455TOTAL LIABILITIES AND SHAREHOLDERS' EQUITY $5,695,088 $5,225,838checkBook value per share $30.94 $30.30Diluted book value per share (treasury stock method) $28.23 $27.91
RATIOS Debt-to-capital 17.2% 17.4%
3

ENDURANCE SPECIALTY HOLDINGS LTD.SEGMENT DISTRIBUTION
FOR THE QUARTER ENDED MARCH 31, 2005
Gross Premiums Written = $788 million [a]
[a] Prior to deposit accounting adjustments.
Source of Business
Casualty44%
Property48%
Other Specialty8%
Type of BusinessInsurance
15%
Reinsurance85%
Broker Distribution
Benfield13%
Other26%
Aon27%
Marsh24%
Willis10%
4

ENDURANCE SPECIALTY HOLDINGS LTD.CONSOLIDATED SEGMENT DATAFOR THE QUARTER ENDED MARCH 31, 2005
Property Per Property Casualty Property Casualty Aerospace and Total DepositRisk Treaty Catastrophe Treaty Individual Individual Other Specialty Company Accounting Reported
Reinsurance Reinsurance Reinsurance Risk Risk Lines Sub-total Adjustment [a] TotalsUNDERWRITING REVENUESGross premiums written $171,290 $110,690 $251,543 $23,374 $47,690 $183,526 $788,113 ($85,622) $702,491Net premiums written $171,290 $110,690 $249,783 $23,149 $47,781 $182,107 $784,800 ($85,622) $699,178Net premiums earned $118,585 $58,899 $118,044 $27,197 $60,464 $65,065 $448,254 ($10,656) $437,598Other underwriting income --- --- --- --- --- --- --- 171 171Total underwriting revenues $118,585 $58,899 $118,044 $27,197 $60,464 $65,065 $448,254 ($10,485) $437,769
UNDERWRITING EXPENSES Losses and loss expenses $44,531 $10,770 $79,138 $39,332 $37,450 $45,715 $256,936 ($5,877) $251,059Acquisition expenses 32,423 7,296 29,753 3,470 4,625 12,920 90,487 (3,712) 86,775General and administrative expenses 6,616 4,806 9,304 2,224 3,093 7,503 33,546 --- 33,546Total expenses 83,570 22,872 118,195 45,026 45,168 66,138 380,969 (9,589) 371,380
UNDERWRITING INCOME (LOSS) $35,015 $36,027 ($151) ($17,829) $15,296 ($1,073) $67,285 ($896) $66,389
GAAP RATIOSLoss ratio 37.6% 18.3% 67.0% 144.6% 61.9% 70.3% 57.3% 55.2% 57.4%Acquisition expense ratio 27.3% 12.4% 25.2% 12.8% 7.6% 19.9% 20.2% 34.8% 19.8%General and administrative expense ratio 5.6% 8.2% 7.9% 8.2% 5.1% 11.5% 7.5% --- 7.7%Combined ratio 70.5% 38.9% 100.1% 165.6% 74.6% 101.7% 85.0% 90.0% 84.9%
STATUTORY RATIOSLoss ratio 37.6% 18.3% 67.0% 144.6% 61.9% 70.3% 57.3% 55.2% 57.4%Acquisition expense ratio 24.4% 11.2% 26.2% 11.5% 1.7% 19.1% 20.1% 33.0% 18.5%General and administrative expense ratio 3.9% 4.3% 3.7% 9.6% 6.5% 4.1% 4.3% --- 4.8%Combined ratio 65.9% 33.8% 96.9% 165.7% 70.1% 93.5% 81.7% 88.2% 80.7%
[a] For internal management reporting purposes, underwriting results by segment are presented on the basis of applying reinsurance accounting to all reinsurance contracts written. However for financial statement presentation purposes, management determined that certain reinsurance contracts written during the period were more appropriately accounted for under the deposit method of accounting specified by AICPA SOP 98-7 whereby net premiums due on such contracts were recorded as deposit liabilities. The adjustment herein reconciles the Company's underwriting results by segment to the Company's financial statement presentation.
5

ENDURANCE SPECIALTY HOLDINGS LTD.DEPOSIT ACCOUNTING ADJUSTMENT IMPACTS ON SEGMENT DATA
FOR THE QUARTER ENDED MARCH 31, 2005
INCLUDING DEPOSIT ACCOUNTING ADJUSTMENTS
Property Per Property Casualty Property Casualty Aerospace andRisk Treaty Catastrophe Treaty Individual Individual Other Specialty Total
Reinsurance Reinsurance Reinsurance Risk Risk Lines Company
UNDERWRITING REVENUESGross premiums written $136,432 $110,690 $204,462 $23,374 $47,690 $179,843 $702,491Net premiums written $136,432 $110,690 $202,702 $23,149 $47,781 $178,424 $699,178Net premiums earned $110,762 $58,899 $115,364 $27,197 $60,464 $64,912 $437,598Other underwriting income 140 --- 19 --- --- 12 171Total underwriting revenues 110,902 58,899 115,383 27,197 60,464 64,924 437,769
UNDERWRITING EXPENSES Losses and loss expenses $40,220 $10,770 $77,640 $39,332 $37,450 $45,647 $251,059Acquisition expenses 29,971 7,296 28,552 3,470 4,625 12,861 86,775General and administrative expenses 6,616 4,806 9,304 2,224 3,093 7,503 33,546Total expenses 76,807 22,872 115,496 45,026 45,168 66,011 371,380
UNDERWRITING INCOME (LOSS) $34,095 $36,027 ($113) ($17,829) $15,296 ($1,087) $66,389
GAAP RATIOSLoss ratio 36.3% 18.3% 67.3% 144.6% 61.9% 70.3% 57.4%Acquisition expense ratio 27.1% 12.4% 24.7% 12.8% 7.6% 19.8% 19.8%General and administrative expense ratio 6.0% 8.2% 8.1% 8.2% 5.1% 11.6% 7.7%Combined ratio 69.4% 38.9% 100.1% 165.6% 74.6% 101.7% 84.9%
EXCLUDING DEPOSIT ACCOUNTING ADJUSTMENTS
Property Per Property Casualty Property Casualty Aerospace andRisk Treaty Catastrophe Treaty Individual Individual Other Specialty Total
Reinsurance Reinsurance Reinsurance Risk Risk Lines Company
UNDERWRITING REVENUESGross premiums written $171,290 $110,690 $251,543 $23,374 $47,690 $183,526 $788,113Net premiums written $171,290 $110,690 $249,783 $23,149 $47,781 $182,107 $784,800Net premiums earned $118,585 $58,899 $118,044 $27,197 $60,464 $65,065 $448,254
UNDERWRITING EXPENSES Losses and loss expenses $44,531 $10,770 $79,138 $39,332 $37,450 $45,715 $256,936Acquisition expenses 32,423 7,296 29,753 3,470 4,625 12,920 90,487General and administrative expenses 6,616 4,806 9,304 2,224 3,093 7,503 33,546Total expenses 83,570 22,872 118,195 45,026 45,168 66,138 380,969
UNDERWRITING INCOME (LOSS) $35,015 $36,027 ($151) ($17,829) $15,296 ($1,073) $67,285
GAAP RATIOSLoss ratio 37.6% 18.3% 67.0% 144.6% 61.9% 70.3% 57.3%Acquisition expense ratio 27.3% 12.4% 25.2% 12.8% 7.6% 19.9% 20.2%General and administrative expense ratio 5.6% 8.2% 7.9% 8.2% 5.1% 11.5% 7.5%Combined ratio 70.5% 38.9% 100.1% 165.6% 74.6% 101.7% 85.0%
6

ENDURANCE SPECIALTY HOLDINGS LTD.PERIOD END UNREALIZED GAINS AND QUARTERLY OPERATING CASH FLOW
2Q 2004 3Q 2004 4Q 2004 1Q 2005
Unrealized holding gains (losses) on investments, period end ($25,058) $16,091 $7,687 ($31,797)
Operating cash flow $319,167 $306,683 $263,020 $220,080
1Q 2002YTD 2Q2002YTD 3Q2002
7

ENDURANCE SPECIALTY HOLDINGS LTD.RETURN ON EQUITY ANALYSIS
THREE MONTHS ENDEDMAR. 31, 2005
Average equity [a] $1,872,548
Net premiums earned $437,598Combined ratio 84.9%Operating margin 15.1%Premium leverage 0.23x
Implied ROAE from underwriting activity 3.5%
Average invested assets at amortized cost $4,009,987Investment leverage 2.14xYear to date investment income yield, pretax 1.0%
Implied ROAE from investment activity 2.1%
Implied Pre-tax Operating ROAE, for period 5.6%
Implied Pre-tax Operating ROAE, annualized 22.5%
[a] Average equity is calculated as the arithmetic average of the beginning and ending equity balances for the stated periods.
8

ENDURANCE SPECIALTY HOLDINGS LTD.ANNUALIZED OPERATING & INVESTMENT LEVERAGE
1Q 2004 2Q 2004 3Q 2004 4Q 2004 1Q 2005 2004 2003
Average equity $1,703,959 $1,747,187 $1,751,048 $1,816,640 $1,872,548 $1,753,635 $1,431,158
Net premiums earned $415,826 $395,987 $409,487 $411,300 $437,598 $1,632,600 $1,173,947
Operating leverage 0.24x 0.23x 0.23x 0.23x 0.23x 0.93x 0.82x
Annualized operating leverage 0.98x 0.91x 0.94x 0.91x 0.93x 0.93x 0.82x
Avg. invested assets at amortized cost $2,781,759 $3,010,450 $3,343,785 $3,744,102 $4,009,987 $3,277,276 $2,124,518
Investment leverage 1.63x 1.72x 1.91x 2.06x 2.14x 1.87x 1.48x
Year Ended December 31,
9

ENDURANCE SPECIALTY HOLDINGS LTD.INVESTMENT PORTFOLIO
AS OF MARCH 31, 2005
Type of Investment Fair Value PercentageCash and equivalents $273,785 6.8%U.S. government and agencies 1,158,818 28.6%Corporate securities 651,333 16.1%Foreign government 207,266 5.1%Municipals 161,312 4.0%Asset-backed securities 398,096 9.8%Mortgage-backed securities 1,096,366 27.0%Investments in other ventures 108,536 2.7%
Total $4,055,512 100.0%
Ratings Fair Value PercentageU.S. Government and agencies $1,158,818 28.6%AAA/Aaa 2,171,538 53.5%AA/Aa 206,448 5.1%A/A 410,172 10.1%BBB and below --- ---Investments in other ventures/Not rated 108,536 2.7%
Total $4,055,512 100.0%
Performance Mar. 31, 2005Annualized yield, year to date [a] 4.0%Duration [b] 2.91
Year Ended Quarter EndedInvestment Income Dec. 31, 2004 Mar. 31, 2005
Total net investment income $122,059 $40,011
Note: Cash, cash equivalents and short terms are shown net of investments pending settlement.[a] Annualized yield excludes realized and unrealized gains and losses on fixed maturity investments[b] Duration excludes investments in other ventures
10

ENDURANCE SPECIALTY HOLDINGS LTD.ACTIVITY IN RESERVE FOR LOSSES AND LOSS EXPENSES
QUARTER QUARTER QUARTER QUARTER QUARTERENDED ENDED ENDED ENDED ENDED
MARCH 31, 2004 JUNE 30, 2004 SEPT. 30, 2004 DEC. 31, 2004 MARCH 31, 2005
Incurred related to:Current year $241,381 $229,900 $359,187 $243,542 $297,060Prior years (19,372) (40,692) (50,932) (25,684) (46,001)
Total incurred 222,009 189,208 308,255 217,858 251,059
Paid related to:Current year (2,752) (11,027) (28,056) (76,606) ($3,021)Prior years (32,819) (27,076) (21,801) (36,557) (86,769)
Total paid (35,571) (38,103) (49,857) (113,163) (89,790)
11

ENDURANCE SPECIALTY HOLDINGS LTD.ANALYSIS OF UNPAID LOSSES AND LOSS EXPENSE
Property Per Property Casualty Property Casualty Aerospace andRisk Treaty Catastrophe Treaty Individual Individual Other Specialty Total
Reinsurance Reinsurance Reinsurance Risk Risk Lines CompanyAT MARCH 31, 2005Case reserves [a] $166,599 $41,414 $90,638 $56,368 $5,002 $87,815 $447,836Total reserves [a] 378,154 69,922 536,538 100,458 337,547 284,338 1,706,957
Case reserves / Total reserves 44.1% 59.2% 16.9% 56.1% 1.5% 30.9% 26.2%
[a] Net of deposit accounting adjustments
12

ENDURANCE SPECIALTY HOLDINGS LTD.DILUTIVE SHARES FOR EPS CALCULATION
QUARTER ENDEDMARCH 31,
2005 2004
DILUTIVE SHARES Average market price per share $34.23 $34.20OUTSTANDING:AS REPORTED Basic weighted average common shares outstanding 61,292 64,084
Add: weighted ave. unvested restricted share units 587 74Weighted average exercise price per share --- ---Proceeds from unrecognized restricted share unit expense $13,335 $5,762
Less: restricted share units bought back via treasury method (390) (74)
Add: weighted ave. dilutive warrants outstanding 7,202 7,243Weighted average exercise price per share $18.62 $19.50
Less: warrants bought back via treasury method (3,917) (4,130)
Add: weighted ave. dilutive options outstanding 3,239 3,423Weighted average exercise price per share $19.18 $19.79Proceeds from unrecognized option expense $1,107 $2,882
Less: options bought back via treasury method (1,847) (2,065)Weighted average dilutive shares outstanding 66,166 68,555
Note: Warrants and options that are anti-dilutive are not included in the calculation of diluted shares outstanding. Restricted share units are included in the calculation of basic and dilutedweighted shares outstanding. The treasury stock method assumes that the proceeds received from the exercise of options or warrants will be used to repurchase the Company's common shares at the average market price during the period of calculation. SFAS No. 123 also requires that any unrecognized stock based compensation expense that will be recorded in future periods be included as proceeds for purposes of the treasury stock repurchases.
13

ENDURANCE SPECIALTY HOLDINGS LTD.OPERATING INCOME RECONCILIATION
EARNINGS PER SHARE INFORMATION - AS REPORTED, GAAP
QUARTER ENDEDMARCH 31,
2005 2004
Net income $96,259 $100,872Add (Less) after-tax items:
Net foreign exchange losses (gains) 2,292 2,415Net realized losses (gains) on investments 4,122 (4,602)
Operating income $102,673 $98,685
Weighted average common shares outstandingBasic 61,292 64,084Dilutive 66,166 68,555
Basic per share dataNet income $1.57 $1.57Add (Less) after-tax items:
Net foreign exchange (gains) losses 0.04 0.04Net realized (gains) losses on investments 0.07 (0.07)
Operating income $1.68 $1.54
Diluted per share dataNet income $1.45 $1.47Add (Less) after-tax items:
Net foreign exchange (gains) losses 0.03 0.04Net realized (gains) losses on investments 0.06 (0.07)
Operating income $1.55 $1.44
14

ENDURANCE SPECIALTY HOLDINGS LTD.DILUTIVE SHARES SENSITIVITY ANALYSIS
DILUTIVE SHARES OUSTANDINGMarket Price per Share
$35.00 $36.00 $37.00 $38.00 $39.00 $40.00 $41.00 $42.00 $43.00 $44.00 $45.0066,261 66,416 66,563 66,703 66,835 66,960 67,080 67,194 67,302 67,406 67,505
15

ENDURANCE SPECIALTY HOLDINGS LTD.BOOK VALUE PER SHARE
MARCH 31,2005 2004 DEC. 31, 2004
DILUTIVE SHARES Price per share at period end $37.84 $35.54 $34.20OUTSTANDING: AS-IF CONVERTED [a] Basic common shares outstanding [b] 60,858 64,159 61,473
Add: unvested restricted share units 576 196 596Add: dilutive warrants outstanding 7,202 7,243 7,202
Weighted average exercise price per share $18.62 $19.50 $18.87Add: dilutive options outstanding 3,222 3,372 3,204
Weighted average exercise price per share $19.18 $19.76 $18.91
Book Value $1,882,640 $1,763,103 $1,862,455Add: proceeds from converted warrants 134,108 141,236 135,908Add: proceeds from converted options 61,822 66,629 60,582
Pro forma book value $2,078,569 $1,970,969 $2,058,945Dilutive shares outstanding 71,859 74,970 72,475Basic book value per share $30.94 $27.48 $30.30Diluted book value per share $28.93 $26.29 $28.41
DILUTIVE SHARES Price per share at period end $37.84 $35.54 $34.20OUTSTANDING: TREASURY STOCK Basic common shares outstanding [b] 60,858 64,159 61,473METHOD
Add: unvested restricted share units 576 196 596Add: dilutive warrants outstanding 7,202 7,243 7,202
Weighted average exercise price per share $18.62 $19.50 $18.87Less: warrants bought back via treasury method (3,544) (3,974) (3,974)Add: dilutive options outstanding 3,222 3,372 3,204
Weighted average exercise price per share $19.18 $19.76 $18.91Less: options bought back via treasury method (1,634) (1,875) (1,771)Dilutive shares outstanding 66,681 69,121 66,729Basic book value per share $30.94 $27.48 $30.30Diluted book value per share $28.23 $25.51 $27.91
[a] The as-if converted method assumes that the proceeds received upon exercise of options and warrants will be retained by the Company and the resulting common shares from exercise will remain outstanding.[b] Basic common shares include vested restricted share units.
16
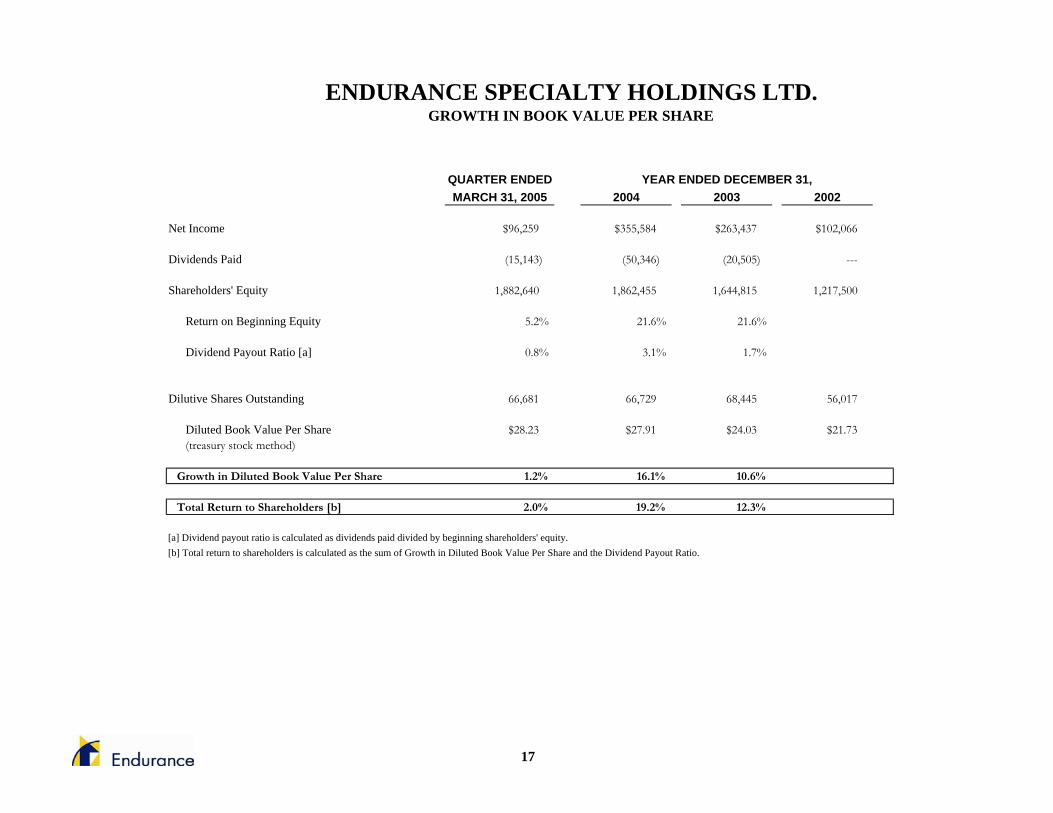
QUARTER ENDEDMARCH 31, 2005 2004 2003 2002
Net Income $96,259 $355,584 $263,437 $102,066
Dividends Paid (15,143) (50,346) (20,505) ---
Shareholders' Equity 1,882,640 1,862,455 1,644,815 1,217,500
Return on Beginning Equity 5.2% 21.6% 21.6%
Dividend Payout Ratio [a] 0.8% 3.1% 1.7%
Dilutive Shares Outstanding 66,681 66,729 68,445 56,017
Diluted Book Value Per Share $28.23 $27.91 $24.03 $21.73(treasury stock method)
Growth in Diluted Book Value Per Share 1.2% 16.1% 10.6%
Total Return to Shareholders [b] 2.0% 19.2% 12.3%
[a] Dividend payout ratio is calculated as dividends paid divided by beginning shareholders' equity.[b] Total return to shareholders is calculated as the sum of Growth in Diluted Book Value Per Share and the Dividend Payout Ratio.
YEAR ENDED DECEMBER 31,
ENDURANCE SPECIALTY HOLDINGS LTD.GROWTH IN BOOK VALUE PER SHARE
17

ENDURANCE SPECIALTY HOLDINGS LTD.REGULATION G
In presenting the Company’s results, management has included and discussed certain non-GAAP measures. Management believes that these non-GAAP measures, which may be defined differently by other companies, better explain the Company's results of operations in a manner that allows for a more complete understanding of the underlying trends in the Company's business. However, these measures should not be viewed as a substitute for those determined in accordance with GAAP.
Operating income is an internal performance measure used by the Company in the management of its operations. Operating income represents after-tax operational results excluding, as applicable, after-tax net realized capital gains or losses and after-tax net foreign exchange gains or losses because the amount of these gains or losses is heavily influenced by, and fluctuates in part, according to the availability of market opportunities. The Company believes these amounts are largely independent of its business and underwriting process and including them distorts the analysis of trends in its operations. In addition to presenting net income determined in accordance with GAAP, the Company believes that showing operating income enables investors, analysts, rating agencies and other users of its financial information to more easily analyze the Company’s results of operations in a manner similar to how management analyzes the Company’s underlying business performance. Operating income should not be viewed as a substitute for GAAP net income. Please see page 14 for a reconciliation of operating income to net income.
Investment yield is provided by the Company’s investment managers and is calculated by dividing net investment income by average invested assets at amortized cost. The Company utilizes and presents the investment yield in order to better disclose the performance of the Company’s investments and to show the components of the Company’s ROE.The Company has included diluted book value per share because it takes into account the effect of dilutive securities; therefore, the Company believes it is a better measure of calculating shareholder returns than book value per share. Please see page 16 for a reconciliation of diluted book value per share to basic book value per share.
Return on Equity (ROE) is comprised using the average equity calculated as the arithmetic average of the beginning and ending equity balances for stated periods. The Company presents ROE as a measure that it is commonly recognized as a standard of performance by investors, analysts, rating agencies and other users of its financial information.
18