revcon template and macros - iis windows...
TRANSCRIPT

UNITED STATES SECURITIES AND EXCHANGE COMMISSIONWashington, D.C. 20549
_______________
Form 10-KANNUAL REPORT PURSUANT TO SECTION 13 OR 15(d) OF
THE SECURITIES EXCHANGE ACT of 1934
For the fiscal year ended December 31, 2007
Commission file number: 000-50784_______________
Blackboard Inc.(Exact Name of Registrant as Specified in Its Charter)
Delaware 52-2081178(State or Other Jurisdiction of
Incorporation or Organization)(I.R.S. Employer
Identification No.)
1899 L Street N.W. 20036Washington D.C. (Zip Code)
(Address of Principal Executive Offices)
Registrant’s telephone number, including area code:(202) 463-4860
Securities registered pursuant to Section 12(g) of the Act:None
Securities registered pursuant to Section 12(b) of the Act:Common Stock, $0.01 par value per share
Indicate by check mark if the registrant is a well-known seasoned issuer, as defined in Rule 405 of the Securities Act. Yes No
Indicate by check mark if the registrant is not required to file reports pursuant to Section 13 or Section 15(d) of the Act. Yes No
Indicate by check mark whether the registrant (1) has filed all reports required to be filed by Section 13 or 15(d) of the Securities Exchange Act of 1934 during the preceding 12 months (or for such shorter period that the registrant was required to file such reports), and (2) has been subject to such filing requirements for the past 90 days. Yes No
Indicate by check mark if disclosure of delinquent filers pursuant to Item 405 of Regulation S-K is not contained herein, and will not be contained, to the best of registrant’s knowledge, in definitive proxy or information statements incorporated by reference in Part III of this Form 10-K or any amendment to this Form 10-K.
Indicate by check mark whether the registrant is a large accelerated filer, an accelerated filer, a non-accelerated filer, or a smaller reporting company. See the definitions of “large accelerated filer,” “accelerated filer” and “smaller reporting company” in Rule 12b-2 of the Exchange Act. (Check one):
Large accelerated filer Accelerated filer Non-accelerated filer Smaller reporting company (Do not check if a smaller reporting company)
Indicate by check mark whether the registrant is a shell company (as defined in Rule 12b-2 of the Act). Yes No
The aggregate market value of outstanding voting stock held by non-affiliates of the registrant as of June 30, 2007 was approximately $953.7 million based on the last reported sale price of the registrant’s common stock on The NASDAQ Global Market as of the close of business on that day.
There were 29,247,903 shares of the registrant’s common stock outstanding as of January 31, 2008.
DOCUMENTS INCORPORATED BY REFERENCE
Portions of the registrant’s definitive proxy statement for its 2008 annual meeting of stockholders to be filed pursuant to Regulation 14A with the Securities and Exchange Commission not later than 120 days after the registrant’s fiscal year end of December 31, 2007, are incorporated by reference into Part III of this Form 10-K.
Bowne Conversion document.doc

BLACKBOARD INC.
Form 10-K
TABLE OF CONTENTS
PageNumber
PART IItem 1. Business.....................................................................................................................................................................Item 1A. Risk Factors...............................................................................................................................................................Item 1B. Unresolved Staff Comments.....................................................................................................................................Item 2. Properties...................................................................................................................................................................Item 3. Legal Proceedings.....................................................................................................................................................Item 4. Submission of Matters to a Vote of Security Holders...............................................................................................PART IIItem 5. Market for Registrant’s Common Equity and Related Stockholder Matters and Issuer Purchases of Equity
Securities...................................................................................................................................................................Item 6. Selected Financial Data.............................................................................................................................................Item 7. Management’s Discussion and Analysis of Financial Condition and Results of Operations...................................Item 7A. Quantitative and Qualitative Disclosures About Market Risk..................................................................................Item 8. Financial Statements and Supplementary Data.........................................................................................................Item 9. Changes in and Disagreements with Accountants on Accounting and Financial Disclosure...................................Item 9A. Controls and Procedures...........................................................................................................................................Item 9B. Other Information......................................................................................................................................................PART IIIItem 10. Directors and Executive Officers of the Registrant..................................................................................................Item 11. Executive Compensation...........................................................................................................................................Item 12. Security Ownership of Certain Beneficial Owners and Management......................................................................Item 13. Certain Relationships and Related Transactions.......................................................................................................Item 14. Principal Accounting Fees and Services...................................................................................................................PART IVItem 15. Exhibits, Financial Statement Schedules..................................................................................................................
Bowne Conversion 2

This report contains forward-looking statements that involve risks and uncertainties that could cause our actual results to differ materially from those expressed or implied by such statements. Factors that might cause or contribute to such differences include, but are not limited to, those discussed in the section entitled “Risk Factors” under Item 1A. When used in this report, the words “expects,” “anticipates,” “intends,” “plans,” “believes,” “seeks,” “estimates” and similar expressions are generally intended to identify forward-looking statements within the meaning of The Private Securities Litigation Reform Act of 1995. You should not place undue reliance on these forward-looking statements, which reflect our opinions only as of the date of this report. Blackboard assumes no obligation and does not intend to update these forward-looking statements.
PART I
Item 1. Business.
General
We are a leading provider of enterprise software applications and related services to the education industry. Our product line consists of various software applications delivered in three suites, the Blackboard Academic SuiteTM, the Blackboard Commerce SuiteTM, and Blackboard ConnectTM. Our suites of products include the following products: Blackboard Learning SystemTM, Blackboard Community SystemTM, Blackboard Content SystemTM, Blackboard Outcomes SystemTM, Blackboard Portfolio SystemTM, Blackboard Transaction SystemTM, Blackboard OneTM and Blackboard ConnectTM. We license these products on a renewable basis, typically for annual terms.
Our clients include colleges, universities, schools and other education providers, textbook publishers and student-focused merchants who serve these education providers and their students, and corporate and government clients. These clients use our software to integrate technology into the education experience and campus life, and to support activities such as a professor assigning digital materials on a class website; a student collaborating with peers or completing research online; an administrator managing a departmental website; a principal sending mass communications via voice, email and text messages to parents and students; or a merchant conducting cash-free transactions with students and faculty through pre-funded debit accounts.
We began operations in 1997 as a limited liability company organized under the laws of the state of Delaware and served as a primary contractor to an education industry technical standards organization. In 1998, we incorporated under the laws of the state of Delaware and acquired CourseInfo LLC, which had developed an internal online learning system used by faculty at Cornell University, and had begun marketing its technology to universities and school districts in the United States and Canada. Since the time of our acquisition of CourseInfo, we have grown from approximately 26 licenses of one software application as of December 31, 1998 to more than 4,800 licenses of our software applications as of December 31, 2007.
In June 2007, we issued and sold $165.0 million aggregate principal amount of 3.25% convertible senior notes due 2027 (the “Notes”) in a public offering.
On January 31, 2008, we completed the acquisition of The NTI Group, Inc. for a purchase price of $132.0 million in cash and $50.0 million in our common stock, which equated to approximately 1.5 million shares of our common stock, with up to an additional 0.5 million shares of our common stock contingent on the achievement of certain performance milestones. In connection with the transaction, we paid a portion of the purchase price using proceeds from the issuance of the Notes. This acquisition will give us the opportunity to offer clients the ability to send mass communications via voice, email and text messages. We acquired the technology underlying Blackboard Connect, which we began offering in February 2008, through the acquisition of The NTI Group, Inc.
Customer Overview
Our customer base consists primarily of U.S. postsecondary education clients, which accounted for approximately 61% of our total revenues for 2007. We also sell to international postsecondary clients; U.S. K-12 education clients; and others, including primarily education publishers, commercial education providers and United States government organizations, which accounted for approximately 19%, 7% and 13% of our total revenues for 2007, respectively.
Products and Services
Blackboard offers a complete line of enterprise software applications focused on the education industry. Clients can license our software individually or in one of three suites:
Bowne Conversion 3

• Blackboard Academic Suite,
• Blackboard Commerce Suite, and
• Blackboard Connect.
We offer the Blackboard Academic Suite in all of our markets, the Blackboard Commerce Suite primarily to U.S. and Canadian postsecondary clients and Blackboard Connect to U.S. K-12, postsecondary and government clients. We also offer application hosting for clients who prefer to outsource the management of their Blackboard Academic Suite systems. In addition to our products, we offer a variety of professional services, including project management, training and custom application development, that increase our clients’ success.
The Blackboard Academic Suite
The Blackboard Academic Suite provides a scalable and easy-to-use technology platform for delivering education online, managing digital content and aggregating access to tools, information and content through an integrated Web portal environment that grows as our clients grow. It enables institutions to:
• Increase faculty adoption of technology for teaching,
• Drive student engagement through personalized experiences and active learning tools,
• Securely share and collaborate around content across the institution, and
• Meet diverse assessment needs of institutions.
The Blackboard Academic Suite includes:
• the Blackboard Learning SystemTM;
• the Blackboard Community SystemTM;
• the Blackboard Content SystemTM;
• the Blackboard Portfolio SystemTM; and
• the Blackboard Outcomes SystemTM.
The Blackboard Academic Suite includes the products formerly known as WebCT Campus EditionTM and WebCT Vistatm, which were acquired in our merger with WebCT, Inc (“WebCT”) in 2006.
The Blackboard Learning System
The Blackboard Learning System allows educational institutions to support a feature-rich online teaching and learning environment that can be used to augment a classroom-based program or for distance learning. The major capabilities of the Blackboard Learning System include:
• Teaching and Learning. Instructors can post syllabi and course materials, including documents, graphics, audio, video and multimedia; create, deliver and automatically score online assignments and tests; and report grades and grading analysis along with other information to students.
• Advanced features. The Blackboard Learning System also provides integrated email, discussion forums and live virtual classrooms. It also provides tools to facilitate group collaboration, communication, file-sharing, self-evaluation and peer review. Additionally, we offer Blackboard ScholarTM, a service which allows users to build a network of peers who share similar educational interests, and SafeAssignTM, a plagiarism prevention service.
Bowne Conversion 4

• Extending the learning environment. Our products can be integrated with existing campus student information systems and campus registrar’s systems to access user, course and enrollment information stored throughout the institution. Additional capabilities are available through the integration of third-party Blackboard Building Blocks(R) or Blackboard PowerLinksTM
tools developed by our clients or independent parties. These extensions allow institutions to download, install and manage third-party enhancements. These third-party applications add functionality to our products, and several client-managed online communities exist to foster open source development of enhancements to our products as well.
• System administration. Our products allow clients to configure our applications to the specific needs of their institutions. The appearance and configuration of our products are customizable by each client for multiple independent user populations within their institution on the same system hardware and database. In addition, clients have the ability to define multiple user roles and set access policies for guest accounts and observers, such as parents, advisors, mentors and supervisors.
We offer the Blackboard Learning System through basic licenses or enterprise licenses to appeal to all sizes and types of clients. The Blackboard Learning System basic licenses provide stand-alone, entry-level versions of the Blackboard Learning System suitable for small-scale implementations, while the Blackboard Learning System enterprise licenses provide functionality to support larger or more advanced implementations and various language configurations, including English, Spanish, Italian, Dutch, German, French, Japanese, Arabic and Chinese.
Blackboard Community System
The Blackboard Community System is an enterprise information portal application designed specifically for the education industry and is currently available to customers with the Blackboard Learning System enterprise license products. The Blackboard Community System allows institutions to extend their learning environments and to further engage students by connecting them with each other, with campus services, and with faculty beyond the classroom. As part of the Blackboard Academic Suite, the Blackboard Community System extends the Blackboard Learning System to include functionality for student organizations, faculty and staff, departmental collaboration, information distribution and single sign-on access to existing administrative systems. The major academic capabilities of the Blackboard Community System include:
• Configurable portal environment enabling one-stop access to services. Through a customizable Web portal, the Blackboard Community System enables institutions to provide their users access to multiple content sources, campus services, administrative systems and personal information management tools, such as email and calendar. The Blackboard Community System can provide single sign-on access to a variety of campus systems, eliminating the need for multiple access points and identification verifications. Institutions and independent software vendors can create custom portal applications that provide views into content and data from other systems or integrate other applications.
• Facilitating academic and co-curricular collaboration using community and communication tools. The Blackboard Community System facilitates the creation of meaningful campus connections by allowing institutions to define dedicated online environments for departments, clubs and other groups. Members of organizations can manage their own operations, as well as upload and share documents, and use their own communication tools, conserving the resources of campus information technology departments.
• Maintaining distinct campus identities. An institution can configure the Blackboard Community System to support multiple identities or brands within the institution (such as multiple campuses, a law school, medical school or continuing education program) and deliver content to targeted, institution-defined roles. In addition, users can customize the Blackboard Community System interface according to their needs and preferences.
• e-Commerce capabilities. This functionality enables campus business units and student organizations to sell products, which may be paid for with a student’s credit card or debit account (via the Blackboard Transaction System). Uses include campus bookstore online purchases, athletics and event tickets, library fees and parking fees.
Blackboard Content System
The Blackboard Content System provides enterprise content management capabilities and is currently available to customers with the Blackboard Learning System enterprise license products. The Blackboard Content System supports activities which require enterprise management of electronic files, such as teaching, learning, research, archival and library needs, and extracurricular and
Bowne Conversion 5

departmental pursuits. All of these activities require the central management, tagging, sharing and re-use of electronic files, such as lecture notes for multiple sections of a course, learning resources, test banks and library electronic reserve materials. In addition, the Blackboard Content System supports advanced workflow capabilities across the institution and provides a secure way to share sensitive institutional content. The major capabilities of the Blackboard Content System include:
• Storing and accessing learning materials. Institutions can make secure, web-based, drag-and-drop file storage space available to all users, who can then use a configurable permissions structure to share files with individuals or groups, track versions, and add comments. To assure appropriate usage of the file space, administrators can manage disk space quotas and set bandwidth controls.
• Learning content management. Instructors can manage versions of documents and other course material and can re-use content across courses. Institutions can create content repositories administered at the departmental, school or institutional levels to facilitate the sharing and searching of digital content.
• Integrating library resources into the learning environment. Librarians can create and manage collections of digital assets for use by specific courses, disciplines or the entire institution.
• Collecting and sharing materials within electronic portfolios. Users can collect and organize their academic work as electronic portfolios to showcase their accomplishments, which can be shared with other users on the system, as well as published externally. These portfolios can be used for personal reflection, academic assignments, program completion, alignment with educational standards, or for professional development, such as résumés and job applications.
The Blackboard Content System family of products also includes the Blackboard Portfolio System and the Xythos Software, Inc. (“Xythos”) enterprise document management applications we acquired in 2007. The Blackboard Portfolio System is a personal portfolio application that enables users to collect and organize their academic work and is currently available to customers with the Blackboard Learning System — CE and Vista enterprise licenses. The Xythos enterprise document management applications enable clients to securely manage and share data across the entire enterprise.
Blackboard Outcomes System
The Blackboard Outcomes SystemTM was released in December 2006 and is currently available to customers with the Blackboard Learning System - enterprise license. Supplemented by strategic and technical professional services, the Blackboard Outcomes System supports and coordinates the academic and administrative assessment processes taking place across an institution’s many departments. The Blackboard Outcomes System enables the planning and measuring of student, teaching and institutional outcomes and provides a comprehensive set of instruments for student and program assessment. The major capabilities of the Blackboard Outcomes System include:
• Planning outcomes. The “Standards, Goals and Student Learning Objectives” feature enables institutions to document intended outcomes of courses, programs, departments, colleges, universities and standards bodies. Rubrics, or standard evaluation criteria, facilitate shared and consistent evaluation of outcomes, while curriculum maps highlight the connection between program goals and courses and co-curricular educational experiences.
• Measuring learning and administrative outcomes. Various assessment tools simplify the collection of student work and its evaluation against shared rubrics. Surveys and course evaluations enable users to collect useful indirect assessment data, soliciting attitudes and opinions from constituents on-campus and off-campus.
• Improving learning and institutional effectiveness. Operational and analytic reports provide insight into assessment plans, activities, data, follow-up actions and correlations to all levels of an institution.
The Blackboard Commerce Suite
The Blackboard Commerce Suite can be used for on- and off-campus commerce, online e-commerce, meal plan administration, vending, laundry services, copy and print management and student and staff identification. The applications that make up the Blackboard Commerce Suite are:
• the Blackboard Transaction SystemTM;
Bowne Conversion 6

• the Blackboard Community System; and
• Blackboard OneTM.
Blackboard Transaction System
The Blackboard Transaction System is an enterprise software application that we license along with various hardware to allow clients to establish an integrated student debit account program for charging incidental expenses such as meals and academic materials, typically using the campus ID card. The hardware that we sell as part of the Blackboard Transaction System includes servers, cards, card readers and point-of-sale devices. The Blackboard Transaction System also supports activities such as facilities access and identity verification. The principal features of the Blackboard Transaction System include:
• Commerce. Transaction processing capabilities of the Blackboard Transaction System support the creation and management of student debit accounts, as well as the processing of payments against those accounts using student ID cards on campus, such as in dining facilities, vending machines, copy machines and bookstores, off-campus and online. Our clients use the Blackboard Transaction System to manage point-of-sale transactions, such as prepaid debit cards, meal plan administration, cash equivalency, privilege verification and discounts, and self-service or unattended transactions, such as vending, laundry, printing and copying and parking.
• Activities management and security. The access-rights capabilities of the Blackboard Transaction System enable a variety of applications using the client’s investment in a single-card environment for commerce. These include event admission, student government voting, wireless verification on buses, library authorization and computer lab access and tracking. In addition, the system interfaces directly with door access points to manage identification and secure access control to facilities using the same student ID card.
Blackboard Community System
In addition to the functionalities it provides as part of the Blackboard Academic Suite, the Blackboard Community System enables additional transaction capabilities when licensed as part of the Blackboard Commerce Suite, including:
• eMarketplace. The Blackboard Community System enables campus business units and student organizations to sell products, which may be paid with the student debit account. Users can activate template-driven tools that allow them to describe, price, display and charge for an item all within the campus portal environment. Uses include campus bookstore online purchases, athletics and event tickets, library fees and parking fees.
• Web account management. Through an online account, end users can manage a variety of activities, including online deposits, guest and parent deposits, balance inquiries, transaction history statements and lost and stolen card reports.
Blackboard One
Blackboard One is bundled with the Blackboard Commerce Suite and enables students and faculty to use their university ID cards as a form of payment off-campus. We recruit local merchants to accept student debit accounts as a form of payment and facilitate the processing of transactions by third-party merchants that use the Blackboard Transaction System. By utilizing the existing Blackboard Transaction System debit account at the university, Blackboard One provides students with a secure, cashless and convenient way to make purchases while assuring parents that their funds will be spent within a university-approved merchant network. We develop the off-campus merchant network on behalf of each university and manage the program, from merchant acquisition and funds settlement to transaction terminal support. We also provide customized marketing campaigns designed to build the card program brand and increase deposits into the accounts.
Blackboard Connect
Blackboard Connect provides comprehensive communication systems that enable rapid dissemination of critical information via voice and text devices. The Blackboard Connect family includes the Connect-ED, Connect-CTY, Connect-GOV and Connect-MIL offerings specifically designed for education, municipal, government and military clients respectively. Blackboard Connect is a fully hosted, web-based application that enables clients to record, schedule, send, and track personalized voice messages, e-mail, SMS or text messages to tens of thousands of constituents in minutes. Blackboard Connect provides a bundled set of mass notification, survey, and community outreach tools through a service which eliminates the need for equipment, hardware, software, or long distance phone charges.
Bowne Conversion 7

Professional Services
Our professional services support the implementation and maintenance of the educational environment in order to help clients maximize the value of our various enterprise software applications. Our services group offers:
• project management;
• integration of our applications with existing campus systems;
• user interface customization;
• installation and configuration;
• training and instructional design;
• course and content migration; and
• custom Blackboard Building Blocks and Blackboard PowerLinks application development.
Competition
The market for education enterprise software is highly fragmented and rapidly evolving, and we expect competition in this market to persist and intensify. Our primary competitors for the Blackboard Academic Suite are companies and open source solutions that provide course management systems, such as ANGEL Learning, Inc., Desire2Learn Inc., eCollege.com, Moodle, Jenzabar, Inc., The Sakai Project, VCampus Educator, and WebTycho; learning content management systems, such as HarvestRoad Ltd. and Concord USA, Inc.; and education enterprise information portal technologies, such as SunGard SCT Inc., an operating unit of SunGard Data Systems Inc. We also face competition from clients and potential clients who develop their own applications internally, large diversified software vendors who offer products in numerous markets including the education market and other open source software applications. Our competitors for the Blackboard Commerce Suite include companies that provide transaction systems, security systems and off-campus merchant relationship programs. We face a variety of competitors which provide mass notification technologies including voice, email and/or text messaging communications.
We may also face competition from potential competitors that are substantially larger than we are and have significantly greater financial, technical and marketing resources, and established, extensive direct and indirect channels of distribution. As a result, they may be able to respond more quickly to new or emerging technologies and changes in client requirements, or to devote greater resources to the development, promotion and sale of their products than we can. In addition, current and potential competitors have established or may establish cooperative relationships among themselves or prospective clients. Accordingly, it is possible that new competitors or alliances among competitors may emerge and rapidly acquire significant market share to our detriment.
We believe that the primary competitive factors in our markets are:
• base of reference clients;
• functional breadth and depth of solution offered;
• ease of use;
• complexity of installation and upgrade;
• scalability of solution to meet growing needs;
• client service;
• availability of third-party application and content add-ons;
• total cost of ownership;
Bowne Conversion 8

• financial stability; and
• company reputation.
We believe that we compete favorably on the basis of these factors.
Our Growth Strategy
We seek to capitalize on our position as a leader in our market to grow our business by supporting several significant aspects of education, including teaching, learning, commerce and campus life. Key elements of our growth strategy include:
• Growing annual license revenues. We intend to increase annual license revenues with existing clients through upgrades to current products, cross-selling of complementary applications and increased total license value commensurate with the value of our offerings.
• Increasing penetration with U.S. postsecondary and K-12 clients. We intend to capitalize on our experience in U.S. postsecondary and K-12 education to further enhance our leadership position.
• Offering new products to our target markets. Using feedback gathered from our clients and our sales and technical support groups, we intend to continue to develop and offer new upgrades, applications and application suites to increase our presence on campuses and expand the value provided to our clients.
• Increasing sales to international postsecondary and U.S. K-12 clients. We intend to continue to expand sales and marketing efforts to increase sales of our applications to international postsecondary institutions as well as U.S. K-12 schools.
• Pursuing strategic relationships and acquisition opportunities. We intend to continue to pursue strategic relationships with, acquisitions of, and investments in, companies that enhance the technological features of our products, offer complementary products, services and technologies, or broaden the scope of our product offerings into other areas.
Research and Development
Each of the individual applications in our product suites is developed and maintained by a dedicated team of software engineers, product managers and documentation specialists. In addition, we maintain three cross-product groups: an engineering services team, which focuses on highly technical product support issues that have been escalated by our telephone support operation; a quality control team, which tests our applications to identify and correct software errors and usability issues before a new product or update is released; and a research and development engineering team which works on special development projects that involve third parties, including software tools for integrating our products with other campus systems. Our research and development group receives feedback on product improvement suggestions and new products from clients, either directly or through our sales and client support organizations. We periodically release maintenance updates to and new versions of our existing products. In addition, our research and development group works on new product initiatives as appropriate. Our products are primarily developed internally and, in support of the development of our products, we have acquired or licensed specialized products and technologies from other software firms. Our research and development expenses were $13.9 million, $27.2 million and $28.3 million in the years ended December 31, 2005, 2006 and 2007, respectively.
Marketing and Sales
Marketing
We engage in a variety of traditional and online marketing activities designed to provide sales lead generation, sales support and increasing market awareness. Our specific marketing activities include print advertising in trade publications, direct mail campaigns, speaking engagements and industry trade-shows and seminars, which help create awareness of our brand and products and services. Examples of specific marketing events include the Blackboard Summit, which is our annual meeting of educational and technology leaders from the United States and abroad; the Blackboard Users’ Conference, which is our annual conference dedicated to all users of Blackboard products as well as prospective clients; and Blackboard Days, which provide information sessions at current client sites for current and prospective clients.
Bowne Conversion 9

Sales
We sell our products through a direct sales force and, in some emerging international markets, through re-sellers. Regional sales managers are responsible for sales of our products in their territories and supervise account managers who are responsible for maintaining software and service renewal rates among our clients. Account managers are typically compensated in part based upon their achievement of renewal rate quotas, and pursue a variety of client relations activities aimed at maintaining and improving renewal rates. In addition, our sales organization includes technical sales engineers, who are experts in the technical aspects of our products and client implementations.
In our experience, colleges, universities and schools frequently rely on references from peer institutions when selecting a vendor and often involve a variety of internal constituencies, such as instructors and students, when evaluating a product. In addition, most public education institutions and many private institutions utilize request for proposal, or RFP, processes, by which they announce their interest in purchasing an application and detail their requirements so that vendors may bid accordingly. As a result, we generate sales leads from sources such as interacting with attendees at conferences, visiting potential clients’ sites to provide briefings on the industry and our products, responding to inbound calls based on client recommendations and monitoring and responding to RFPs. We often structure our licenses in a manner that anticipates expansion from one product in a suite to multiple products in a suite, and we engage in state or regional agreements when appropriate to provide umbrella pricing and contractual terms for a group of institutions. We have U.S. sales offices in Washington, D.C.; Phoenix, Arizona; Los Angeles, California and San Francisco, California. We have international sales offices in Amsterdam and Sydney.
Executive Officers
The following table lists our executive officers and their ages as of January 31, 2008.
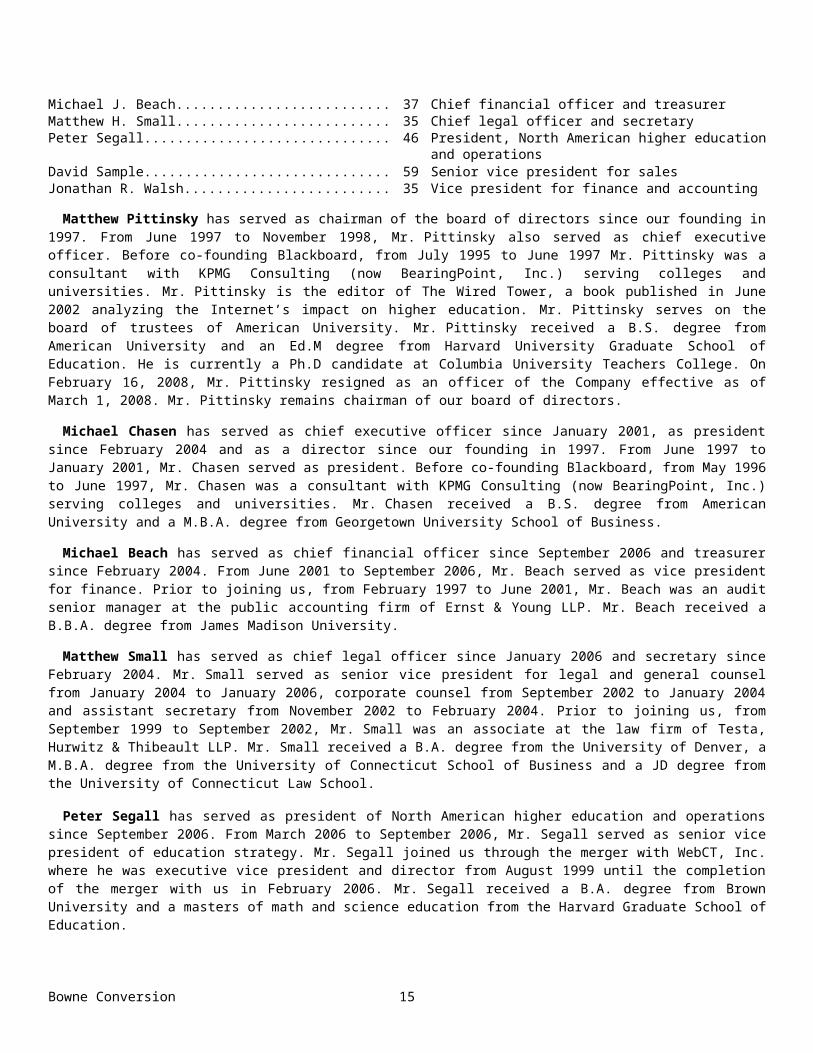
Name Age Position Michael L. Chasen........................................................................ 36 Chief executive officer, president, directorMatthew L. Pittinsky..................................................................... 35 Chairman, directorMichael J. Beach........................................................................... 37 Chief financial officer and treasurerMatthew H. Small......................................................................... 35 Chief legal officer and secretaryPeter Segall................................................................................... 46 President, North American higher education and operationsDavid Sample................................................................................ 59 Senior vice president for salesJonathan R. Walsh......................................................................... 35 Vice president for finance and accounting
Matthew Pittinsky has served as chairman of the board of directors since our founding in 1997. From June 1997 to November 1998, Mr. Pittinsky also served as chief executive officer. Before co-founding Blackboard, from July 1995 to June 1997 Mr. Pittinsky was a consultant with KPMG Consulting (now BearingPoint, Inc.) serving colleges and universities. Mr. Pittinsky is the editor of The Wired Tower, a book published in June 2002 analyzing the Internet’s impact on higher education. Mr. Pittinsky serves on the board of trustees of American University. Mr. Pittinsky received a B.S. degree from American University and an Ed.M degree from Harvard University Graduate School of Education. He is currently a Ph.D candidate at Columbia University Teachers College. On February 16, 2008, Mr. Pittinsky resigned as an officer of the Company effective as of March 1, 2008. Mr. Pittinsky remains chairman of our board of directors.
Michael Chasen has served as chief executive officer since January 2001, as president since February 2004 and as a director since our founding in 1997. From June 1997 to January 2001, Mr. Chasen served as president. Before co-founding Blackboard, from May 1996 to June 1997, Mr. Chasen was a consultant with KPMG Consulting (now BearingPoint, Inc.) serving colleges and universities. Mr. Chasen received a B.S. degree from American University and a M.B.A. degree from Georgetown University School of Business.
Michael Beach has served as chief financial officer since September 2006 and treasurer since February 2004. From June 2001 to September 2006, Mr. Beach served as vice president for finance. Prior to joining us, from February 1997 to June 2001, Mr. Beach was an audit senior manager at the public accounting firm of Ernst & Young LLP. Mr. Beach received a B.B.A. degree from James Madison University.
Matthew Small has served as chief legal officer since January 2006 and secretary since February 2004. Mr. Small served as senior vice president for legal and general counsel from January 2004 to January 2006, corporate counsel from September 2002 to January 2004 and assistant secretary from November 2002 to February 2004. Prior to joining us, from September 1999 to September 2002, Mr. Small was an associate at the law firm of Testa, Hurwitz & Thibeault LLP. Mr. Small received a B.A. degree from the University of Denver, a M.B.A. degree from the University of Connecticut School of Business and a JD degree from the University of Connecticut Law School.
Bowne Conversion 10

Peter Segall has served as president of North American higher education and operations since September 2006. From March 2006 to September 2006, Mr. Segall served as senior vice president of education strategy. Mr. Segall joined us through the merger with WebCT, Inc. where he was executive vice president and director from August 1999 until the completion of the merger with us in February 2006. Mr. Segall received a B.A. degree from Brown University and a masters of math and science education from the Harvard Graduate School of Education.
David Sample has served as senior vice president of sales since July 2005. Prior to joining us, from September 2002 to November 2003, Mr. Sample served as executive vice president for global sales at Princeton Softech, from November 2000 to September 2001, as president and CEO at Davox Corporation, from September 1998 to November 2000, as president and chief operating officer at ABT Corporation and, from July 1986 to March 1997, as senior vice president for sales at Hyperion Solutions Corporation. Mr. Sample received a B.A. degree from Trinity College.
Jonathan Walsh has served as vice president for finance and accounting since September 2006. From July 2001 to August 2006, he served as controller. Prior to joining us, from July 1998 to June 2001, Mr. Walsh held financial reporting and financial planning positions at Sunrise Assisted Living, Inc., AppNet, Inc. and CommerceOne, Inc. and from January 1995 to July 1998 Mr. Walsh was an audit senior at the public accounting firm of Ernst & Young LLP. Mr. Walsh received a B.B.A. degree from James Madison University.
Employees
As of December 31, 2007, we had 890 employees, including approximately 189 in sales; 77 in marketing and business development; 157 in support, ASP hosting and production; 186 in research and development; 130 in professional services; and 151 in general administration. None of our employees are represented by a labor union. We have never experienced a work stoppage and believe our relationship with our employees is good.
International Operations
We currently operate predominately in the United States. Our revenues derived from operations in foreign countries for fiscal years 2005, 2006 and 2007 were $21.9 million, $34.7 million and $53.6 million, respectively. Substantially all of our material identifiable assets are located in the United States.
Website Access to U.S. Securities and Exchange Commission Reports
Our Internet address is http://www.blackboard.com. Through our website, we make available, free of charge, access to all reports filed with the U.S. Securities and Exchange Commission including our Annual Reports on Form 10-K, our Quarterly Reports on Form 10-Q, our Current Reports on Form 8-K and amendments to these reports, as filed with or furnished to the SEC pursuant to Section 13(a) or 15(d) of the Securities Exchange Act of 1934, as amended, as soon as reasonably practicable after we electronically file such material with, or furnish it to, the SEC. Copies of any materials we file with, or furnish to, the SEC can also be obtained free of charge through the SEC’s website at http://www.sec.gov or at the SEC’s Public Reference Room at 450 Fifth St., N.W., Washington, DC 20549. You may obtain information on the operation of the Public Reference Room by calling the SEC at 1-800-SEC-0330.
Item 1A. Risk Factors.
Our merger with The NTI Group, Inc. presents many risks, and we may not realize the financial and strategic goals that were contemplated at the time of the transaction.
We completed the merger with The NTI Group, Inc. on January 31, 2008. We entered into this transaction with the expectation that it would result in various long-term benefits including enhanced revenue and profits, and enhancements to our product portfolio and customer base. Risks that we may encounter in seeking to realize these benefits include:
• we may not realize the anticipated financial benefits if we are unable to sell the Blackboard Connect products to our customer base, if a larger than predicted number of customers decline to renew their contracts, or if the acquired contracts do not allow us to recognize revenues on a timely basis;
• we may have difficulty incorporating The NTI Group’s technologies or products with our existing product lines and maintaining uniform standards, controls, procedures and policies;
Bowne Conversion 11

• we may face contingencies related to product liability, intellectual property, financial disclosures, and accounting practices or internal controls;
• we may have higher than anticipated costs in supporting and continuing development of the Blackboard Connect products and in servicing new and existing Blackboard Connect clients;
• we may not be able to retain key employees from The NTI Group;
• we may be unable to manage effectively the increased size and complexity of the combined company, and our management’s attention may be diverted from our ongoing business by transition or integration issues;
• we may lose anticipated tax benefits or have additional legal or tax exposures; and
• we will not be able to determine whether all or any of the 0.5 million shares of stock consideration in the merger that is contingent on the achievement of certain performance milestones will be issued until the completion of the financial results for fiscal year 2008 and 2009.
Our business strategy contemplates future business combinations and acquisitions which may be difficult to integrate, disrupt our business, dilute stockholder value or divert management attention.
During the course of our history, we have acquired several businesses, and a key element of our growth strategy is to pursue additional acquisitions in the future. Any acquisition could be expensive, disrupt our ongoing business and distract our management and employees. We may not be able to identify suitable acquisition candidates, and if we do identify suitable candidates, we may not be able to make these acquisitions on acceptable terms or at all. If we make an acquisition, we could have difficulty integrating the acquired technology, employees or operations. In addition, the key personnel of the acquired company may decide not to work for us. Acquisitions also involve the risk of potential unknown liabilities associated with the acquired business.
As a result of these risks, we may not be able to achieve the expected benefits of any acquisition. If we are unsuccessful in completing or integrating acquisitions that we may pursue in the future, we would be required to reevaluate our growth strategy, and we may have incurred substantial expenses and devoted significant management time and resources in seeking to complete and integrate the acquisitions.
Future business combinations could involve the acquisition of significant tangible and intangible assets, which could require us to record in our statements of operations ongoing amortization of intangible assets acquired in connection with acquisitions, which we currently do with respect to our historic acquisitions, including the NTI Group merger. In addition, we may need to record write-downs from future impairments of identified tangible and intangible assets and goodwill. These accounting charges would reduce any future reported earnings, or increase a reported loss. In future acquisitions, we could also incur debt to pay for acquisitions, or issue additional equity securities as consideration, which could cause our stockholders to suffer significant dilution.
Our ability to utilize, if any, net operating loss carryforwards, if any, acquired in any acquisitions may be significantly limited or unusable by us under Section 382 or other sections of the Internal Revenue Code.
Our indebtedness could adversely affect our financial condition and prevent us from fulfilling our debt obligations, including the 3.25% Convertible Senior Notes due 2027 (the “Notes”).
Our outstanding debt poses the following risks:
• we will use a significant portion of our cash flow to pay interest on our outstanding debt and to pay principal when required, limiting the amount available for working capital, capital expenditures and other general corporate purposes;
• lenders may be unwilling to lend additional amounts to us for future working capital needs, additional acquisitions or other purposes or may only be willing to provide funding on terms we would consider unacceptable;
• if our cash flow were inadequate to make interest and principal payments on our debt, we might have to refinance our indebtedness and may not be successful in those efforts; and
Bowne Conversion 12

• our ability to finance working capital needs and general corporate purposes for the public and private markets, as well as the associated cost of funding, is dependent, in part, on our credit ratings, which may be adversely affected if we experience declining revenues.
We may be more vulnerable to adverse economic conditions than less leveraged competitors and thus, less able to withstand competitive pressures. Any of these events could reduce our ability to generate cash available for investment or debt repayment or to make improvements or respond to events that would enhance profitability. We may incur significantly more debt in the future, which will increase each of the foregoing risks related to our indebtedness.
We may not be able to repurchase the Notes when required by the holders, including upon a fundamental change or other specified dates at the option of the holder, or pay cash upon conversion of the Notes.
Upon the occurrence of a fundamental change, holders of the Notes will have the right to require us to repurchase the Notes at a price in cash equal to 100% of the principal amount of the Notes plus accrued and unpaid interest. Any future credit agreement or other agreements relating to indebtedness to which we become a party may contain similar provisions. Holders will also have the right to require us to repurchase the Notes for cash or a combination of cash and our common stock on July 1, 2011, July 1, 2017 or July 1, 2022. Moreover, upon conversion of the Notes, we are required to settle a portion of the conversion obligation in cash. In the event that we are required to repurchase the Notes or upon conversion of the Notes, we may not have sufficient financial resources to satisfy all of our obligations under the Notes and our other debt instruments. Our failure to make the fundamental change offer, to pay the repurchase price when due, or to pay cash upon conversion of Notes, would result in a default under the indenture governing the Notes. Any default under our indebtedness could have a material adverse effect on our business, results of operations and financial condition.
Conversion of the Notes may affect the market price of our common stock and may dilute the ownership of existing stockholders.
The conversion of some or all of the Notes and any sales in the public market of our common stock issued upon such conversion could adversely affect the market price of our common stock. The existence of the Notes may encourage short selling by market participants because the conversion of the Notes could depress our common stock price. In addition, the conversion of some or all of the Notes could dilute the ownership interests of existing stockholders to the extent that shares of our common stock are issued upon conversion.
Our reported earnings per share may be more volatile because of the contingent conversion provision of the Notes.
The Notes may have a dilutive effect on earnings per share in any period in which the market price of our common stock exceeds the conversion price for the Notes as a result of the inclusion of the underlying shares in the fully diluted earnings per share calculation. Volatility in our stock price could cause this condition or other conversion conditions to be met in one quarter and not in a subsequent quarter, increasing the volatility of fully diluted earnings per share.
The accounting method for convertible debt securities with net share settlement, like the Notes, may be subject to change.
The FASB is considering changes to the treatment of convertible debt securities for the purpose of calculating diluted earnings per share, which may adversely affect income available to common stockholders. We cannot determine the outcome of the FASB deliberations or when any change would be implemented or whether it would be implemented retroactively or prospectively. We also cannot determine any other changes in GAAP that may be made affecting accounting for convertible debt securities. Any change in the accounting method for convertible debt securities could have an adverse impact on our future financial results.
Bowne Conversion 13

Providing enterprise software applications to the education industry is an emerging and uncertain business; if the market for our products fails to develop, we will not be able to grow our business.
Our success will depend on our ability to generate revenues by providing enterprise software applications and services to colleges, universities, schools and other education providers. This market for some of our products has only recently developed, and the viability and profitability of this market is unproven. Our ability to grow our business will be compromised if we do not develop and market products and services that achieve broad market acceptance with our current and potential clients and their students and employees. If our newest products, the Blackboard Outcomes System and Blackboard Connect, do not gain widespread market acceptance, our financial results could suffer. We introduced our newest software application, the Blackboard Outcomes System, in December 2006 and acquired the technology underlying Blackboard Connect through our merger with The NTI Group, Inc. in January 2008. Our ability to grow our business will depend, in part, on client acceptance of these products. If we are not successful in gaining market acceptance of these products, our revenues may fall below our expectations.
We face intense and growing competition, which could result in price reductions, reduced operating margins and loss of market share.
We operate in highly competitive markets and generally encounter intense competition to win contracts. If we are unable to successfully compete for new business and license renewals, our revenue growth and operating margins may decline. The markets for online education, transactional, portal, content management, transaction systems and mass notification products are intensely competitive and rapidly changing, and barriers to entry in these markets are relatively low. With the introduction of new technologies and market entrants, we expect competition to intensify in the future. Some of our principal competitors offer their products at a lower price, which has resulted in pricing pressures. Such pricing pressures and increased competition generally could result in reduced sales, reduced margins or the failure of our product and service offerings to achieve or maintain more widespread market acceptance.
Our primary competitors for the Blackboard Academic Suite are companies and open source solutions that provide course management systems, such as ANGEL Learning, Inc., Desire2Learn Inc., eCollege.com, Jenzabar, Inc., Moodle, The Sakai Project, VCampus Educator and WebTycho; learning content management systems, such as HarvestRoad Ltd. and Concord USA, Inc.; and education enterprise information portal technologies, such as SunGard SCT Inc., an operating unit of SunGard Data Systems Inc. We also face competition from clients and potential clients who develop their own applications internally, large diversified software vendors who offer products in numerous markets including the education market and open source software applications. Our competitors for the Blackboard Commerce Suite include companies that provide transaction systems, security and access systems and off-campus merchant relationship programs. Our competitors for Blackboard Connect include a variety of competitors which provide mass notification technologies including voice, email and/or text messaging communications.
We may also face competition from potential competitors that are substantially larger than we are and have significantly greater financial, technical and marketing resources, and established, extensive direct and indirect channels of distribution. Similarly, our competitors may also be acquired by larger and more well-funded companies which have more resources than our current competitors. These larger companies may be able to respond more quickly to new or emerging technologies and changes in client requirements, or to devote greater resources to the development, promotion and sale of their products than we can. In addition, current and potential competitors have established or may establish cooperative relationships among themselves or prospective clients. Accordingly, it is possible that new competitors or alliances among competitors may emerge and rapidly acquire significant market share to our detriment.
If potential clients or competitors use open source software to develop products that are competitive with our products and services, we may face decreased demand and pressure to reduce the prices for our products.
The growing acceptance and prevalence of open source software may make it easier for competitors or potential competitors to develop software applications that compete with our products, or for clients and potential clients to internally develop software applications that they would otherwise have licensed from us. One of the aspects of open source software is that it can be modified or used to develop new software that competes with proprietary software applications, such as ours. Such competition can develop without the degree of overhead and lead time required by traditional proprietary software companies. As open source offerings become more prevalent, customers may defer or forego purchases of our products, in particular our Blackboard Academic Suite products, which could reduce our sales and lengthen the sales cycle for our products or result in the loss of current clients to open source solutions. If we are unable to differentiate our products from competitive products based on open source software, demand for our products and services may decline, and we may face pressure to reduce the prices of our products.
Bowne Conversion 14
Because most of our licenses are renewable on an annual basis, a reduction in our license renewal rate could significantly reduce our revenues.
Our clients have no obligation to renew their licenses for our products after the expiration of the initial license period, which is typically one year, and some clients have elected not to do so. A decline in license renewal rates could cause our revenues to decline. We have limited historical data with respect to rates of renewals, so we cannot accurately predict future renewal rates. Our license renewal rates may decline or fluctuate as a result of a number of factors, including client dissatisfaction with our products and services, our failure to update our products to maintain their attractiveness in the market or budgetary constraints or changes in budget priorities faced by our clients.
We may experience difficulties that could delay or prevent the successful development, introduction and sale of new products under development. If introduced for sale, the new products may not adequately meet the requirements of the marketplace and may not achieve any significant degree of market acceptance, which could cause our financial results to suffer. In addition, during the development period for the new products, our customers may defer or forego purchases of our products and services. Following acquisitions in which clients are contracted under renewable licenses, such as WebCT and The NTI Group, for several years after such acquisitions we may experience a decrease in the renewal rate from historical levels which could reduce revenues below our expectations.
Because we generally recognize revenues ratably over the term of our contract with a client, downturns or upturns in sales will not be fully reflected in our operating results until future periods.
We recognize most of our revenues from clients monthly over the terms of their agreements, which are typically 12 months, although terms can range from one month to over 60 months. As a result, much of the revenue we report in each quarter is attributable to agreements entered into during previous quarters. Consequently, a decline in sales, client renewals, or market acceptance of our products in any one quarter will not necessarily be fully reflected in the revenues in that quarter, and will negatively affect our revenues and profitability in future quarters. This ratable revenue recognition also makes it difficult for us to rapidly increase our revenues through additional sales in any period, as revenues from new clients must be recognized over the applicable agreement term.
Our operating margins may suffer if our professional services revenues increase in proportion to total revenues because our professional services revenues have lower gross margins.
Because our professional services revenues typically have lower gross margins than our product revenues, an increase in the percentage of total revenues represented by professional services revenues could have a detrimental impact on our overall gross margins, and could adversely affect our operating results. In addition, we sometimes subcontract professional services to third parties, which further reduce our gross margins on these professional services. As a result, an increase in the percentage of professional services provided by third-party consultants could lower our overall gross margins.
If our products contain errors, new product releases are delayed or our services are disrupted, we could lose new sales and be subject to significant liability claims.
Because our software products are complex, they may contain undetected errors or defects, known as bugs. Bugs can be detected at any point in a product’s life cycle, but are more common when a new product is introduced or when new versions are released. In the past, we have encountered product development delays and defects in our products. We expect that, despite our testing, errors will be found in new products and product enhancements in the future. In addition, service offerings which we provide may be disrupted causing delays or interruptions in the services provided to our clients. Significant errors in our products or disruptions in the provision of our services could lead to:
• delays in or loss of market acceptance of our products;
• diversion of our resources;
• a lower rate of license renewals or upgrades;
• injury to our reputation; and
• increased service expenses or payment of damages.
Bowne Conversion 15

Because our clients use our products to store, retrieve and utilize critical information, we may be subject to significant liability claims if our products do not work properly or if the provision of our services is disrupted. Such an event could result in significant expenses, disrupt sales and affect our reputation and that of our products. We cannot be certain that the limitations of liability set forth in our licenses and agreements would be enforceable or would otherwise protect us from liability for damages and our insurance may not cover all or any of the claims. A material liability claim against us, regardless of its merit or its outcome, could result in substantial costs, significantly harm our business reputation and divert management’s attention from our operations.
The length and unpredictability of the sales cycle for our software could delay new sales and cause our revenues and cash flows for any given quarter to fail to meet our projections or market expectations.
The sales cycle between our initial contact with a potential client and the signing of a license with that client typically ranges from 6 to 15 months. As a result of this lengthy sales cycle, we have only a limited ability to forecast the timing of sales. A delay in or failure to complete license transactions could harm our business and financial results, and could cause our financial results to vary significantly from quarter to quarter. Our sales cycle varies widely, reflecting differences in our potential clients’ decision-making processes, procurement requirements and budget cycles, and is subject to significant risks over which we have little or no control, including:
• clients’ budgetary constraints and priorities;
• the timing of our clients’ budget cycles;
• the need by some clients for lengthy evaluations that often include both their administrators and faculties; and
• the length and timing of clients’ approval processes.
Potential clients typically conduct extensive and lengthy evaluations before committing to our products and services and generally require us to expend substantial time, effort and money educating them as to the value of our offerings.
Our sales cycle with international postsecondary education providers and U.S. K-12 schools may be longer than our historic U.S. postsecondary sales cycle, which could cause us to incur greater costs and could reduce our operating margins.
As we target more of our sales efforts at international postsecondary education providers and U.S. K-12 schools, we could face greater costs, longer sales cycles and less predictability in completing some of our sales, which may harm our business. A potential client’s decision to use our products and services may be a decision involving multiple institutions and, if so, these types of sales would require us to provide greater levels of education to prospective clients regarding the use and benefits of our products and services. In addition, we expect that potential international postsecondary and U.S. K-12 clients may demand more customization, integration services and features. As a result of these factors, these sales opportunities may require us to devote greater sales support and professional services resources to individual sales, thereby increasing the costs and time required to complete sales and diverting sales and professional services resources to a smaller number of international and U.S. K-12 transactions.
We may have exposure to greater than anticipated tax liabilities.
We are subject to income taxes and other taxes in a variety of jurisdictions and are subject to review by both domestic and foreign taxation authorities. The determination of our provision for income taxes and other tax liabilities requires significant judgment and the ultimate tax outcome may differ from the amounts recorded in our consolidated financial statements, which may materially affect our financial results in the period or periods for which such determination is made.
Our ability to utilize our net operating loss carryforwards may be limited.
Our federal net operating loss carryforwards are subject to limitations on how much may be utilized on an annual basis. The use of the net operating loss carryforwards may have additional limitations resulting from certain future ownership changes or other factors under Section 382 of the Internal Revenue Code.
Bowne Conversion 16

If our net operating loss carryforwards are further limited, and we have taxable income which exceeds the available net operating loss carryforwards for that period, we would incur an income tax liability even though net operating loss carryforwards may be available in future years prior to their expiration, which may adversely affect our future cash flow, financial position and financial results.
The investment of our cash balance and our investments in marketable debt securities are subject to risks which may cause losses and affect the liquidity of these investments.
We hold our cash in a variety of marketable investments which are generally investment grade, liquid, short-term fixed-income securities and money market instruments denominated in U.S. dollars. If the carrying value of our investments exceeds the fair value, and the decline in fair value is deemed to be other-than-temporary, we will be required to further write down the value of our investments, which could materially harm our results of operations and financial condition. With the current unstable credit environment, we might incur significant realized, unrealized or impairment losses associated with these investments.
Our future success depends on our ability to continue to retain and attract qualified employees.
Our future success depends upon the continued service of our key management, technical, sales and other critical personnel, including employees who joined Blackboard in connection with our acquisitions of WebCT and The NTI Group. Whether we are able to execute effectively on our business strategy will depend in large part on how well key management and other personnel perform in their positions and are integrated within our company. Key personnel have left our company over the years, and there may be additional departures of key personnel from time to time. In addition, as we seek to expand our global organization, the hiring of qualified sales, technical and support personnel has been difficult due to the limited number of qualified professionals. Failure to attract, integrate and retain key personnel would result in disruptions to our operations, including adversely affecting the timeliness of product releases, the successful implementation and completion of company initiatives and the results of our operations.
If we do not maintain the compatibility of our products with third-party applications that our clients use in conjunction with our products, demand for our products could decline.
Our software applications can be used with a variety of third-party applications used by our clients to extend the functionality of our products, which we believe contributes to the attractiveness of our products in the market. If we are not able to maintain the compatibility of our products with third-party applications, demand for our products could decline, and we could lose sales. We may desire in the future to make our products compatible with new or existing third-party applications that achieve popularity within the education marketplace, and these third-party applications may not be compatible with our designs. Any failure on our part to modify our applications to ensure compatibility with such third-party applications would reduce demand for our products and services.
If we are unable to protect our proprietary technology and other rights, it will reduce our ability to compete for business.
If we are unable to protect our intellectual property, our competitors could use our intellectual property to market products similar to our products, which could decrease demand for our products. In addition, we may be unable to prevent the use of our products by persons who have not paid the required license fee, which could reduce our revenues. We rely on a combination of copyright, patent, trademark and trade secret laws, as well as licensing agreements, third-party nondisclosure agreements and other contractual provisions and technical measures, to protect our intellectual property rights. These protections may not be adequate to prevent our competitors from copying or reverse-engineering our products and these protections may be costly and difficult to enforce. Our competitors may independently develop technologies that are substantially equivalent or superior to our technology. To protect our trade secrets and other proprietary information, we require employees, consultants, advisors and collaborators to enter into confidentiality agreements. These agreements may not provide meaningful protection for our trade secrets, know-how or other proprietary information in the event of any unauthorized use, misappropriation or disclosure of such trade secrets, know-how or other proprietary information. The protective mechanisms we include in our products may not be sufficient to prevent unauthorized copying. Existing copyright laws afford only limited protection for our intellectual property rights and may not protect such rights in the event competitors independently develop products similar to ours. In addition, the laws of some countries in which our products are or may be licensed do not protect our products and intellectual property rights to the same extent as do the laws of the United States.
Bowne Conversion 17

If we are found to infringe the proprietary rights of others, we could be required to redesign our products, pay significant royalties or enter into license agreements with third parties.
A third party may assert that our technology violates its intellectual property rights. As the number of products in our markets increases and the functionality of these products further overlaps, we believe that infringement claims may become more common. Any claims, regardless of their merit, could:
• be expensive and time consuming to defend;
• force us to stop licensing our products that incorporate the challenged intellectual property;
• require us to redesign our products and reimburse certain costs to our clients;
• divert management’s attention and other company resources; and
• require us to enter into royalty or licensing agreements in order to obtain the right to use necessary technologies, which may not be available on terms acceptable to us, or at all.
Expansion of our business internationally will subject our business to additional economic and operational risks that could increase our costs and make it difficult for us to operate profitably.
One of our key growth strategies is to pursue international expansion. Expansion of our international operations may require significant expenditure of financial and management resources and result in increased administrative and compliance costs. As a result of such expansion, we will be increasingly subject to the risks inherent in conducting business internationally, including:
• foreign currency fluctuations, which could result in reduced revenues and increased operating expenses;
• potentially longer payment and sales cycles;
• difficulty in collecting accounts receivable;
• the effect of applicable foreign tax structures, including tax rates that may be higher than tax rates in the United States or taxes that may be duplicative of those imposed in the United States;
• tariffs and trade barriers;
• general economic and political conditions in each country;
• inadequate intellectual property protection in foreign countries;
• uncertainty regarding liability for information retrieved and replicated in foreign countries;
• the difficulties and increased expenses in complying with a variety of foreign laws, regulations and trade standards; and
• unexpected changes in regulatory requirements.
Unauthorized disclosure of data, whether through breach of our computer systems or otherwise, could expose us to protracted and costly litigation or cause us to lose clients.
Maintaining the security of online education and transaction networks is of critical importance for our clients because these activities involve the storage and transmission of proprietary and confidential client and student information, including personal student information and consumer financial data, such as credit card numbers, and this area is heavily regulated in many countries in which we operate, including the United States. Individuals and groups may develop and deploy viruses, worms and other malicious software programs that attack or attempt to infiltrate our products. If our security measures are breached as a result of third-party action, employee error, malfeasance or otherwise, we could be subject to liability or our business could be interrupted. Penetration of our network security could have a negative impact on our reputation and could lead our present and potential clients to choose competing offerings and result in regulatory action against us. Even if we do not encounter a security breach ourselves, a well-publicized breach of the consumer data security of any major consumer Web site could lead to a general public loss of confidence in the use of the Internet, which could significantly diminish the attractiveness of our products and services.
Bowne Conversion 18

Operational failures in our network infrastructure could disrupt our remote hosting services, could cause us to lose clients and sales to potential clients and could result in increased expenses and reduced revenues.
Unanticipated problems affecting our network systems could cause interruptions or delays in the delivery of the hosting services we provide to some of our clients. We provide remote hosting through computer hardware that is currently located in third-party co-location facilities in various locations in the United States, The Netherlands and Australia. We do not control the operation of these co-location facilities. Lengthy interruptions in our hosting service could be caused by the occurrence of a natural disaster, power loss, vandalism or other telecommunications problems at the co-location facilities or if these co-location facilities were to close without adequate notice. Although we have multiple transmission lines into the co-location facilities through two telecommunications service providers, we have experienced problems of this nature from time to time in the past, and we will continue to be exposed to the risk of network failures in the future. We currently do not have adequate computer hardware and systems to provide alternative service for most of our hosted clients in the event of an extended loss of service at the co-location facilities. Certain of our co-location facilities are served by data backup redundancy at other facilities. However, they are not equipped to provide full disaster recovery to all of our hosted clients. If there are operational failures in our network infrastructure that cause interruptions, slower response times, loss of data or extended loss of service for our remotely hosted clients, we may be required to issue credits or pay penalties, current clients may terminate their contracts or elect not to renew them, and we may lose sales to potential clients. If we determine that we need additional hardware and systems, we may be required to make further investments in our network infrastructure.
We could lose revenues if there are changes in the spending policies or budget priorities for government funding of colleges, universities, schools and other education providers.
Most of our clients and potential clients are colleges, universities, schools and other education providers who depend substantially on government funding. Accordingly, any general decrease, delay or change in federal, state or local funding for colleges, universities, schools and other education providers could cause our current and potential clients to reduce their purchases of our products and services, to exercise their right to terminate licenses, or to decide not to renew licenses, any of which could cause us to lose revenues. In addition, a specific reduction in governmental funding support for products such as ours would also cause us to lose revenues.
U.S. and foreign government regulation of the Internet could cause us to incur significant expenses, and failure to comply with applicable regulations could make our business less efficient or even impossible.
The application of existing laws and regulations potentially applicable to the Internet, including regulations relating to issues such as privacy, defamation, pricing, advertising, taxation, consumer protection, content regulation, quality of products and services and intellectual property ownership and infringement, can be unclear. It is possible that U.S., state and foreign governments might attempt to regulate Internet transmissions or prosecute us for violations of their laws. In addition, these laws may be modified and new laws may be enacted in the future, which could increase the costs of regulatory compliance for us or force us to change our business practices. Any existing or new legislation applicable to us could expose us to substantial liability, including significant expenses necessary to comply with such laws and regulations, and dampen the growth in use of the Internet.
Specific federal laws that could also have an impact on our business include the following:
• The Children’s Online Protection Act and the Children’s Online Privacy Protection Act restrict the distribution of certain materials deemed harmful to children and impose additional restrictions on the ability of online services to collect personal information from children under the age of 13; and
• The Family Educational Rights and Privacy Act imposes parental or student consent requirements for specified disclosures of student information, including online information.
Our clients’ use of our software as their central platform for online education initiatives may make us subject to any such laws or regulations, which could impose significant additional costs on our business or subject us to additional liabilities.
Bowne Conversion 19

We may be subject to state and federal financial services regulation, and any violation of any present or future regulation could expose us to liability, force us to change our business practices or force us to stop selling or modify our products and services.
Our transaction processing product and service offering could be subject to state and federal financial services regulation. The Blackboard Transaction System supports the creation and management of student debit accounts and the processing of payments against those accounts for both on-campus vendors and off-campus merchants. For example, one or more federal or state governmental agencies that regulate or monitor banks or other types of providers of electronic commerce services may conclude that we are engaged in banking or other financial services activities that are regulated by the Federal Reserve under the U.S. Federal Electronic Funds Transfer Act or Regulation E thereunder or by state agencies under similar state statutes or regulations. Regulatory requirements may include, for example:
• disclosure of consumer rights and our business policies and practices;
• restrictions on uses and disclosures of customer information;
• error resolution procedures;
• limitations on consumers’ liability for unauthorized account activity;
• data security requirements;
• government registration; and
• reporting and documentation requirements.
A number of states have enacted legislation regulating check sellers, money transmitters or transaction settlement service providers as banks. If we were deemed to be in violation of any current or future regulations, we could be exposed to financial liability and adverse publicity or forced to change our business practices or stop selling some of our products and services. As a result, we could face significant legal fees, delays in extending our product and services offerings, and damage to our reputation that could harm our business and reduce demand for our products and services. Even if we are not required to change our business practices, we could be required to obtain licenses or regulatory approvals that could cause us to incur substantial costs.
Item 1B. Unresolved Staff Comments.
None.
Item 2. Properties.
Our corporate headquarters office is located in Washington, D.C., where we lease approximately 63,000 square feet of space under a lease expiring in June 2008, and approximately 11,000 square feet of space under a lease expiring November 2009. We have leased approximately 112,000 square feet of space in Washington, D.C. to which we plan to relocate our corporate headquarters during mid-2008. We also lease offices in Phoenix, Arizona; Lynnfield, Massachusetts; Los Angeles, California; San Francisco, California; Amsterdam, Netherlands; Vancouver, Canada; and Sydney, Australia.
Item 3. Legal Proceedings.
We are involved in various legal proceedings from time to time incidental to the ordinary conduct of our business. We are not currently involved in any legal proceeding the ultimate outcome of which, in our judgment based on information currently available, would have a material adverse effect on our business, financial condition or results of operations.
Item 4. Submission of Matters to a Vote of Security Holders.
No matters were submitted to a vote of security holders during the fourth quarter of the fiscal year covered by this report.
Bowne Conversion 20

PART II
Item 5. Market for Registrant’s Common Equity, Related Stockholder Matters and Issuer Purchases of Equity Securities.
Our common stock trades on the NASDAQ Global Market under the symbol “BBBB.” The following table sets forth, for the period indicated, the range of high and low closing sales prices for our common stock by quarter.
High Low Year Ended December 31, 2006:First Quarter........................................................................................................................................................................... 32.24 25.75Second Quarter...................................................................................................................................................................... 32.98 23.46Third Quarter......................................................................................................................................................................... 29.49 25.23Fourth Quarter....................................................................................................................................................................... 30.12 25.98Year Ended December 31, 2007:First Quarter........................................................................................................................................................................... 35.52 28.50Second Quarter...................................................................................................................................................................... 42.94 32.76Third Quarter......................................................................................................................................................................... 46.45 38.08Fourth Quarter....................................................................................................................................................................... 49.90 37.52
As of January 31, 2008 there were approximately 143 holders of record of our outstanding common stock.
We have not paid or declared any cash dividends on our common stock. We currently expect to retain all of our earnings for use in developing our business and do not anticipate paying any cash dividends in the foreseeable future. Future cash dividends, if any, will be paid at the discretion of our board of directors and will depend, among other things, upon our future operations and earnings, capital requirements and surplus, general financial condition, contractual restrictions and such other factors as our board of directors may deem relevant.
We did not repurchase any of our equity securities in 2007.
The equity compensation plan information required under this Item is incorporated by reference to the information provided under the heading “Equity Compensation Plan Information” in our proxy statement to be filed within 120 days after the fiscal year end of December 31, 2007.
Bowne Conversion 21

STOCK PERFORMANCE GRAPH
The following graph compares the yearly change in the cumulative total stockholder return on our common stock during the period from June 18, 2004 (the date of our initial public offering) through December 31, 2007, with the cumulative total return on a SIC Index that includes all organizations in the Standard Industrial Classification (SIC) Code 7372-Prepackaged Software (the “SIC Code Index”) and a NASDAQ Market Index. The comparison assumes that $100 was invested on June 18, 2004 in our common stock and in each of the foregoing indices and assumes reinvestment of dividends, if any.
COMPARE CUMULATIVE TOTAL RETURNAMONG BLACKBOARD INC.
NASDAQ MARKET INDEX AND SIC CODE INDEX
(LINE GRAPH)
Assumes $100 invested on June 18, 2004Assumes dividends reinvested
Fiscal year ending December 31, 2007
6/18/2004 12/31/2004 12/31/2005 12/31/2006 12/31/2007 Blackboard Inc. $ 100.00 $ 74.01 $ 144.83 $ 150.12 $ 201.15SIC Code Index 100.00 107.82 106.14 121.83 143.09NASDAQ Market Index 100.00 106.69 109.04 120.23 132.17____________
(1) This graph is not “soliciting material,” is not deemed filed with the SEC and is not to be incorporated by reference in any filing by us under the Securities Act of 1933, as amended (the “Securities Act”), or the Exchange Act, whether made before or after the date hereof and irrespective of any general incorporation language in any such filing.
(2) The stock price performance shown on the graph is not necessarily indicative of future price performance. Information used in the graph was obtained from Hemscott Inc., a source believed to be reliable, but we are not responsible for any errors or omissions in such information.
(3) The hypothetical investment in our common stock presented in the stock performance graph above is based on an assumed initial price of $20.01 per share, the closing price on June 18, 2004, the date of our initial public offering. The stock sold in our initial public offering was issued at a price to the public of $14.00 per share.
Bowne Conversion 22

Item 6. Selected Financial Data.
The following selected consolidated financial data should be read in conjunction with our consolidated financial statements and the related notes, and with “Management’s Discussion and Analysis of Financial Condition and Results of Operations,” included elsewhere in this annual report. The statement of operations data for the years ended December 31, 2003, 2004, 2005, 2006 and 2007, and the balance sheet data as of December 31, 2003, 2004, 2005, 2006 and 2007, are derived from, and are qualified by reference to, our audited consolidated financial statements that have been audited by Ernst & Young, LLP, our independent registered public accounting firm.
Year Ended December 31, 2003 2004 2005 2006 2007
(In thousands, except per share amounts)Statements of operations data:Revenues:Product................................................................................................ $ 83,331 $ 98,632 $ 120,389 $ 160,392 $ 213,631Professional services........................................................................... 9,147 12,771 15,275 22,671 25,817 Total revenues.................................................................................... 92,478 111,403 135,664 183,063 239,448
Operating expenses:Cost of product revenues, excludes $3,467, $1,567, $0, $9,333 and $11,564, respectively, of amortization of acquired technology included in amortization of intangibles resulting from acquisitions shown below(1)................................................................................. 23,079 25,897 29,607 39,594 47,444
Cost of professional services revenues(1)........................................... 6,628 7,962 10,220 16,001 16,941Research and development(1)............................................................. 11,397 13,749 13,945 27,162 28,278Sales and marketing(1)....................................................................... 30,908 35,176 37,873 58,340 66,033General and administrative(1)............................................................ 15,050 15,069 19,306 35,823 38,667Amortization of intangibles resulting from acquisitions.................... 5,757 3,517 266 17,969 22,122 Total operating expenses.................................................................... 92,819 101,370 111,217 194,889 219,485
(Loss) income from operations............................................................ (341) 10,033 24,447 (11,826) 19,963Interest (expense) income, net............................................................. (470) 315 3,097 (2,974) (93)Other (expense) income....................................................................... — — — (519 ) 575 (Loss) income before provision (benefit) for income taxes................. (811) 10,348 27,544 (15,319) 20,445Provision (benefit) for income taxes.................................................... 614 299 (14,309 ) (4,582 ) 7,580 Net (loss) income................................................................................. (1,425) 10,049 41,853 (10,737) 12,865Dividends on and accretion of convertible preferred stock................. (10,077 ) (6,344 ) — — — Net (loss) income attributable to common stockholders...................... $ (11,502 ) $ 3,705 $ 41,853 $ (10,737 ) $ 12,865 Net (loss) income attributable to common stockholders per common
share:Basic..................................................................................................... $ (2 .09 ) $ 0 .23 $ 1 .57 $ (0 .39 ) $ 0 .45 Diluted................................................................................................. $ (2 .09 ) $ 0 .21 $ 1 .47 $ (0 .39 ) $ 0 .43 Weighted average number of common shares:Basic..................................................................................................... 5,516 16,072 26,715 27,858 28,789 Diluted................................................................................................. 5,516 17,864 28,510 27,858 30,114 (1) Includes the following amounts related to stock-based compensation:Cost of product revenues.................................................................... $ — $ — $ — $ 386 $ 672Cost of professional services revenues............................................... — — — 524 631Research and development................................................................. — — — 733 467Sales and marketing............................................................................ — — — 2,951 4,359General and administrative................................................................. 319 174 75 3,462 5,914
Bowne Conversion 23

The following table sets forth a summary of our balance sheet data:
December 31, 2003 2004 2005 2006 2007
(In thousands)Balance sheet data:Cash and cash equivalents...................................................................... $ 30,456 $ 78,149 $ 75,895 $ 30,776 $ 206,558Short-term investments.......................................................................... — 20,000 62,602 — —Working capital (deficit)........................................................................ (13,001) 53,026 93,388 (36,976) 125,401Total assets............................................................................................. 83,054 148,398 224,188 307,299 505,276Deferred revenues, current portion........................................................ 51,215 63,901 74,975 117,972 126,600Total debt............................................................................................... 11,564 762 — 23,623 161,519Mandatorily redeemable convertible preferred stock and Series E
warrants................................................................................................ 130,297 — — — —Total stockholders’ (deficit) equity........................................................ (124,617) 69,107 130,325 140,121 184,674
Item 7. Management’s Discussion and Analysis of Financial Condition and Results of Operations.
You should read the following discussion together with our consolidated financial statements and the related notes included elsewhere in this annual report. This discussion contains forward-looking statements that are based on our current expectations, estimates and projections about our business and operations. Our actual results may differ materially from those currently anticipated and expressed in such forward-looking statements as a result of a number of factors, including those we discuss under “Risks Related to Our Business” and elsewhere in this annual report.
General
We are a leading provider of enterprise software applications and related services to the education industry. Our clients use our software to integrate technology into the education experience and campus life, and to support activities such as a professor assigning digital materials on a class website; a student collaborating with peers or completing research online; an administrator managing a departmental website; a principal sending mass communications via voice, email and text messages to parents and students; or a merchant conducting cash-free transactions with students and faculty through pre-funded debit accounts. Our clients include colleges, universities, schools and other education providers, textbook publishers, student-focused merchants, and corporate and government clients.
On January 31, 2008, we completed the acquisition of The NTI Group, Inc. for a purchase price of $132.0 million in cash and $50.0 million in our common stock, which equated to approximately 1.5 million shares of our common stock, with up to an additional 0.5 million shares of our common stock contingent on the achievement of certain performance milestones. In connection with the transaction, we paid a portion of the purchase price using proceeds from the issuance of $165.0 million aggregate principal amount of 3.25% Convertible Senior Notes due 2027 (the “Notes”). This acquisition will give us the opportunity to offer clients the ability to send mass communications via voice, email and text messages. We acquired the technology underlying Blackboard Connect, which we began offering in February 2008, through the acquisition of The NTI Group, Inc.
We generate revenues from sales and licensing of products and from professional services. Our product revenues consist principally of revenues from annual software licenses, client hosting engagements and the sale of bundled software-hardware systems. We typically sell our licenses and hosting services under annually renewable agreements, and our clients generally pay the annual fees at the beginning of the contract term. We recognize revenues from these agreements, as well as revenues from bundled software-hardware systems, which do not recur, ratably over the contractual term, which is typically 12 months. Billings associated with licenses and hosting services are recorded initially as deferred revenues and then recognized ratably into revenues over the contract term. We also generate product revenues from the sale and licensing of third party software and hardware that is not bundled with our software. These revenues are generally recognized upon shipment of the products to our clients.
We derive professional services revenues primarily from training, implementation, installation and other consulting services. Substantially all of our professional services are performed on a time-and-materials basis. We recognize these revenues as the services are performed.
Bowne Conversion 24

We typically license our individual applications either on a stand-alone basis or bundled as part of our product suites, the Blackboard Academic SuiteTM, the Blackboard Commerce SuiteTM and Blackboard ConnectTM. The Blackboard Academic Suite includes the products formerly known as WebCT Campus EditionTM and WebCT VistaTM, which were acquired in our merger with WebCT, Inc (“WebCT”).
We generally price our software licenses on the basis of full-time equivalent students or users. Accordingly, annual license fees are generally greater for larger institutions.
Our operating expenses consist of cost of product revenues, cost of professional services revenues, research and development expenses, sales and marketing expenses, general and administrative expenses and amortization of intangibles resulting from acquisitions.
Major components of our cost of product revenues include license and other fees that we owe to third parties upon licensing software, and the cost of hardware that we bundle with our software. We initially defer these costs and recognize them into expense over the period in which the related revenue is recognized. Cost of product revenues also includes amortization of internally developed technology available for sale, employee compensation, stock-based compensation and benefits for personnel supporting our hosting, support and production functions, as well as related facility rent, communication costs, utilities, depreciation expense and cost of external professional services used in these functions. All of these costs are expensed as incurred. The costs of third-party software and hardware that is not bundled with software are also expensed when incurred, normally upon delivery to our client. Cost of product revenues excludes amortization of acquired technology intangibles resulting from acquisitions, which is included as amortization of intangibles resulting from acquisitions.
Cost of professional services revenues primarily includes the costs of compensation, stock-based compensation and benefits for employees and external consultants who are involved in the performance of professional services engagements for our clients, as well as travel and related costs, facility rent, communication costs, utilities and depreciation expense used in these functions. All of these costs are expensed as incurred.
Research and development expenses include the costs of compensation, stock-based compensation and benefits for employees who are associated with the creation and testing of the products we offer, as well as the costs of external professional services, travel and related costs attributable to the creation and testing of our products, related facility rent, communication costs, utilities and depreciation expense. All of these costs are expensed as incurred.
Sales and marketing expenses include the costs of compensation, including bonuses and commissions, stock-based compensation and benefits for employees who are associated with the generation of revenues, as well as marketing expenses, costs of external marketing-related professional services, investor relations, facility rent, utilities, communications, travel attributable to those sales and marketing employees in the generation of revenues and bad debt expense. All of these costs are expensed as incurred.
General and administrative expenses include the costs of compensation, stock-based compensation and benefits for employees in the human resources, legal, finance and accounting, management information systems, facilities management, executive management and other administrative functions that are not directly associated with the generation of revenues or the creation and testing of products. In addition, general and administrative expenses include the costs of external professional services and insurance, as well as related facility rent, communication costs, utilities and depreciation expense used in these functions.
Amortization of intangibles includes the amortization of costs associated with products, acquired technology, customer lists, non-compete agreements and other identifiable intangible assets. These intangible assets were recorded at the time of our acquisitions and relate to contractual agreements, technology and products that we continue to utilize in our business.
Critical Accounting Policies and Estimates
The discussion of our financial condition and results of operations is based upon our consolidated financial statements, which have been prepared in accordance with U.S. generally accepted accounting principles. During the preparation of these consolidated financial statements, we are required to make estimates and assumptions that affect the reported amounts of assets, liabilities, revenues and expenses, and related disclosures of contingent assets and liabilities. On an ongoing basis, we evaluate our estimates and assumptions, including those related to revenue recognition, bad debts, fixed assets, long-lived assets, including purchase accounting and goodwill, and income taxes. We base our estimates on historical experience and on various other assumptions that we believe are reasonable under the circumstances. The results of our analysis form the basis for making assumptions about the carrying values of assets and liabilities that are not readily apparent from other sources. Actual results may differ from these estimates under different assumptions or conditions, and the impact of such differences may be material to our consolidated financial statements. Our critical accounting policies have been discussed with the audit committee of our board of directors.
Bowne Conversion 25

We believe that the following critical accounting policies affect the more significant judgments and estimates used in the preparation of our consolidated financial statements:
Revenue recognition. Our revenues are derived from two sources: product sales and professional services sales. Product revenues include software license, hardware, premium support and maintenance, and hosting revenues. Professional services revenues include training and consulting services. We recognize software license and maintenance revenues in accordance with the American Institute of Certified Public Accountants’ Statement of Position (“SOP”) 97-2, “Software Revenue Recognition,” as modified by SOP 98-9, “Modification of SOP 97-2, Software Revenue Recognition, with Respect to Certain Transactions.” Our software does not require significant modification and customization services. Where services are not essential to the functionality of the software, we begin to recognize software licensing revenues when all of the following criteria are met: (1) persuasive evidence of an arrangement exists; (2) delivery has occurred; (3) the fee is fixed and determinable; and (4) collectibility is probable.
We do not have vendor-specific objective evidence (“VSOE”) of fair value for our support and maintenance separate from our software for the majority of our products. Accordingly, when licenses are sold in conjunction with our support and maintenance, we recognize the license revenue over the term of the maintenance service period. We do have VSOE of fair value for our support and maintenance separate from our software for certain offerings . Accordingly, when licenses of these products are sold in conjunction with our support and maintenance, we recognize the license revenue upon delivery of the license and recognize the support and maintenance revenue over the term of the maintenance service period.
We sell hardware in two types of transactions: sales of hardware in conjunction with our software licenses, which we refer to as bundled hardware-software systems, and sales of hardware without software, which generally involve the resale of third-party hardware. After any necessary installation services are performed, hardware revenues are recognized when all of the following criteria are met: (1) persuasive evidence of an arrangement exists; (2) delivery has occurred; (3) the fee is fixed and determinable; and (4) collectibility is probable. We have not determined VSOE of the fair value for the separate components of bundled hardware-software systems. Accordingly, when a bundled hardware-software system is sold, all revenue is recognized over the term of the maintenance service period. Hardware sales without software are recognized upon delivery of the hardware to our client.
Hosting revenues are recorded in accordance with Emerging Issues Task Force (“EITF”) 00-3, “Application of AICPA SOP 97-2 to Arrangements That Include the Right to Use Software Stored on Another Entity’s Hardware.” Accordingly, we recognize hosting fees and set-up fees ratably over the term of the hosting agreement.
Our sales arrangements may include professional services sold separately under professional services agreements that include training and consulting services. Revenues from these arrangements are accounted for separately from the license revenue because they meet the criteria for separate accounting, as defined in SOP 97-2. The more significant factors considered in determining whether revenue should be accounted for separately include the nature of the professional services, such as consideration of whether the professional services are essential to the functionality of the licensed product, degree of risk, availability of professional services from other vendors and timing of payments. Professional services that are sold separately from license revenue are recognized as the professional services are performed on a time-and-materials basis.
We do not offer specified upgrades or incrementally significant discounts. Advance payments are recorded as deferred revenues until the product is shipped, services are delivered or obligations are met and the revenue can be recognized. Deferred revenues represent the excess of amounts invoiced over amounts recognized as revenues. We provide non-specified upgrades of our product only on a when-and-if-available basis. Any contingencies, such as rights of return, conditions of acceptance, warranties and price protection, are accounted for under SOP 97-2. The effect of accounting for these contingencies included in revenue arrangements has not been material.
Allowance for doubtful accounts. We maintain an allowance for doubtful accounts for estimated losses resulting from the inability, failure or refusal of our clients to make required payments. We analyze accounts receivable, historical percentages of uncollectible accounts and changes in payment history when evaluating the adequacy of the allowance for doubtful accounts. We use an internal collection effort, which may include our sales and services groups as we deem appropriate, in our collection efforts. Although we believe that our reserves are adequate, if the financial condition of our clients deteriorates, resulting in an impairment of their ability to make payments, or if we underestimate the allowances required, additional allowances may be necessary, which will result in increased expense in the period in which such determination is made.
Bowne Conversion 26

Short-term investments. All investments with original maturities of greater than 90 days are accounted for in accordance with Statement of Financial Accounting Standards (“SFAS”) No. 115, “Accounting for Certain Investments in Debt and Equity Securities.” We determine the appropriate classification at the time of purchase and reevaluate such designation as of each balance sheet date. Held-to-maturity securities are stated at amortized cost, adjusted for amortization of premiums and accretion of discounts to maturity under the effective interest method. Such amortization is recorded as interest income. Interest on held-to-maturity securities is recorded as interest income. Available-for-sale securities are carried at fair value, with unrealized holding gains and losses, if any, reported in other comprehensive income. Realized gains and losses and declines in value judged to be other-than-temporary on available-for-sale securities are recorded as other income (expense) in the consolidated statements of operations.
Long-lived assets. We record our long-lived assets, such as property and equipment, at cost. We review the carrying value of our long-lived assets for possible impairment whenever events or changes in circumstances indicate that the carrying amount of assets may not be recoverable in accordance with the provisions of SFAS No. 144, “Accounting for the Impairment or Disposal of Long-Lived Assets.” We evaluate these assets by examining estimated future cash flows to determine if their current recorded value is impaired. We evaluate these cash flows by using weighted probability techniques as well as comparisons of past performance against projections. Assets may also be evaluated by identifying independent market values. If we determine that an asset’s carrying value is impaired, we will record a write-down of the carrying value of the identified asset and charge the impairment as an operating expense in the period in which the determination is made. Although we believe that the carrying values of our long-lived assets are appropriately stated, changes in strategy or market conditions or significant technological developments could significantly impact these judgments and require adjustments to recorded asset balances.
Goodwill and intangible assets. As the result of acquisitions, any excess purchase price over the net tangible and identifiable intangible assets acquired is recorded as goodwill. A preliminary allocation of the purchase price to tangible and intangible net assets acquired is based upon a preliminary valuation and our estimates and assumptions may be subject to change. We assess the impairment of goodwill in accordance with SFAS No. 142, “Goodwill and Other Intangible Assets.” Accordingly, we test our goodwill for impairment annually on October 1, or whenever events or changes in circumstances indicate an impairment may have occurred, by comparing its fair value to its carrying value. Impairment may result from, among other things, deterioration in the performance of the acquired business, adverse market conditions, adverse changes in applicable laws or regulations, including changes that restrict the activities of the acquired business, and a variety of other circumstances. If we determine that an impairment has occurred, we are required to record a write-down of the carrying value and charge the impairment as an operating expense in the period the determination is made. Although we believe goodwill is appropriately stated in our consolidated financial statements, changes in strategy or market conditions could significantly impact these judgments and require an adjustment to the recorded balance.
The costs of defending and protecting patents are capitalized. All costs incurred to the point when a patent application is to be filed are expensed as incurred.
Intangible assets are amortized using the straight-line method over the following estimated useful lives of the assets:
Acquired technology.................................................................................................................................................. 3 yearsContracts and customer lists...................................................................................................................................... 3 to 5 yearsNon-compete agreements.......................................................................................................................................... Term of agreementTrademarks and domain names................................................................................................................................. 3 yearsPatents and related costs............................................................................................................................................ Life of patent
As of December 31, 2006 and 2007, we had capitalized $0.9 million and $5.2 million, respectively, in costs of defending and protecting patents, due to expenses incurred in a suit against Desire2Learn, Inc. in which we have alleged infringement of one of our patents. Any change in our estimates based on ongoing litigation could materially reduce the valuation of these assets.
On February 28, 2006, we completed our merger with WebCT pursuant to the Agreement and Plan of Merger dated as of October 12, 2005. Pursuant to the Agreement and Plan of Merger, we acquired all the outstanding common stock of WebCT in a cash transaction for approximately $178.3 million. The effective cash purchase price of WebCT before transaction costs was approximately $150.4 million, net of WebCT’s February 28, 2006 cash balance of approximately $27.9 million. We have included the financial results of WebCT in our consolidated financial statements beginning February 28, 2006.
The merger was accounted for under the purchase method of accounting in accordance with SFAS No. 141, “Business Combinations” (“SFAS 141”). Assets acquired and liabilities assumed were recorded at their fair values as of February 28, 2006. The total purchase price was $187.5 million, including the acquisition-related transaction costs of approximately $9.2 million. Acquisition-related transaction costs include investment banking, legal and accounting fees, and other external costs directly related to the merger.
Bowne Conversion 27

Of the total purchase price, $29.2 million has been allocated to net tangible assets and $73.3 million has been allocated to definite-lived intangible assets acquired. Definite-lived intangible assets of $73.3 million consist of the value assigned to WebCT’s customer relationships of $39.6 million and developed and core technology of $33.7 million. Goodwill represents the excess of the purchase price of an acquired business over the fair value of the net tangible and intangible assets acquired. We allocated $85.0 million to goodwill which is not deductible for tax purposes.
During 2007, we reduced goodwill by approximately $6.4 million primarily related to the recognition of deferred tax assets related to certain acquisition-related transaction costs that were deductible for income tax purposes by WebCT. Consequently, after this adjustment, the net deferred tax asset acquired as a result of the WebCT merger was $7.8 million.
During 2007, we purchased technology for $1.5 million which will provide future functionality in our products. The technology is classified as acquired technology and recorded as intangible assets on the consolidated balance sheets at December 31, 2007.
On November 30, 2007, we completed our merger with Xythos Software, Inc. (“Xythos”) pursuant to the Agreement and Plan of Merger dated as of November 12, 2007. Xythos owns the underlying technology embedded in the Blackboard Content System. This merger will give us the ability to further augment the underlying technology of the Blackboard Content System and is a technology that we intend to incorporate into the broader Academic Suite. Pursuant to the Agreement and Plan of Merger, we acquired all the outstanding common stock of Xythos in a cash transaction for approximately $36.2 million, including acquisition-related transaction costs and purchase accounting adjustments of $10.7 million, which included a $5.0 million reduction of deferred cost of revenues associated with the remaining value of the preexisting agreement with Xythos. We determined that their was no settlement gain or loss on the settlement of the preexisting agreement with Xythos as the preexisting agreement was considered cancelable on its existing terms. The $5.0 million adjustment was recorded as an increase to goodwill. The effective cash purchase price of Xythos before transaction costs was approximately $25.5 million, net of Xythos’s November 30, 2007 cash balance of approximately $5.5 million. We have included the financial results of Xythos in our consolidated financial statements beginning November 30, 2007.
The merger was accounted for under the purchase method of accounting in accordance with SFAS 141. Assets acquired and liabilities assumed were recorded at their fair values as of November 30, 2007. Of the total purchase price, $4.3 million has been allocated to net tangible assets and $9.9 million has been allocated to definite-lived intangible assets acquired. Definite-lived intangible assets of $9.9 million consist of the value assigned to Xythos’s customer relationships of $7.6 million and developed and core technology of $2.3 million. We allocated $22.0 million to goodwill which is not deductible for tax purposes.
Income Taxes. Deferred tax assets and liabilities are determined based on temporary differences between the financial reporting bases and the tax bases of assets and liabilities. Deferred tax assets are also recognized for tax net operating loss carryforwards. These deferred tax assets and liabilities are measured using the enacted tax rates and laws that will be in effect when such amounts are expected to reverse or be utilized. The realization of total deferred tax assets is contingent upon the generation of future taxable income. Valuation allowances are provided to reduce such deferred tax assets to amounts more likely than not to be ultimately realized.
Income tax provision includes U.S. federal, state and local and foreign income taxes and is based on pre-tax income or loss. The provision or benefit for income taxes is based upon our estimate of our annual effective income tax rate. In determining the estimated annual effective income tax rate, we analyze various factors, including projections of our annual earnings and taxing jurisdictions in which the earnings will be generated, the impact of state and local and foreign income taxes and our ability to use tax credits and net operating loss carryforwards. All tax years since 1998 are subject to examination.
We adopted the provisions of FASB Interpretation No. 48, “Accounting for Uncertainty in Income Taxes — an interpretation of FASB Statement No. 109” (“FIN 48”), on January 1, 2007. FIN 48 clarifies the accounting for uncertainty in income taxes recognized in an enterprise’s financial statements in accordance with SFAS No. 109, “Accounting for Income Taxes”. It prescribes that a company should use a more-likely-than-not recognition threshold based on the technical merits of the tax position taken. Tax positions that meet the more-likely-than-not recognition threshold should be measured as the largest amount of the tax benefits, determined on a cumulative probability basis, which is more likely than not to be realized upon ultimate settlement in the financial statements. We recognize interest and penalties related to income tax matters in income tax expense. As a result of the implementation of FIN 48, we recognized an increase of $0.6 million in the unrecognized tax benefit liability, which was accounted for as an increase to the January 1, 2007 accumulated deficit balance. Prior to adoption of FIN 48, accruals for tax contingencies were provided for in accordance with the requirements of SFAS No. 5, “Accounting for Contingencies.” Although we believe we had appropriate support for the positions taken on our tax returns for those years, we had recorded a liability for its best estimate of the probable loss on certain
Bowne Conversion 28

of those positions.
Stock-Based Compensation. We adopted the fair value recognition provisions of SFAS No. 123 (revised 2005), “Share-Based Payment” (“SFAS 123R”), using the modified prospective transition method on January 1, 2006. Under the modified prospective transition method, compensation cost recognized includes: (a) compensation cost for all equity-based payments granted prior to but not yet vested as of January 1, 2006, based on the grant date fair value estimated in accordance with the original provisions of SFAS 123 and (b) compensation cost for all equity-based payments granted subsequent to January 1, 2006, based on the grant date fair value estimated in accordance with the provisions of SFAS 123R. Results for prior periods have not been restated.
As a result of adopting SFAS 123R on January 1, 2006, our loss before (benefit) for income taxes and net loss for the year ended December 31, 2006 were approximately $8.1 million and $5.7 million more, respectively, than if we had not adopted SFAS 123R. Our income before provision for income taxes and net income for the year ended December 31, 2007 were approximately $12.0 million and $7.6 million less, respectively, than if we had not adopted SFAS 123R. Basic and diluted net loss per common share for the year ended December 31, 2006 were each approximately $0.20 more than if we had not adopted SFAS 123R. Basic and diluted net income per common share for the year ended December 31, 2007 were approximately $0.26 and $0.25 less, respectively, than if we had not adopted SFAS 123R. The related total income tax benefits recognized in the consolidated statements of operations were approximately $3.3 million and $6.8 million for the years ended December 31, 2006 and 2007, respectively, and are classified as a financing cash inflow with a corresponding operating cash outflow.
As of December 31, 2007, there was approximately $29.7 million of total unrecognized compensation expense related to unvested stock options granted under our option plans. The cost is expected to be recognized through February 2013 with a weighted average recognition period of approximately 1.4 years.
Recent Accounting Pronouncements. In September 2006, the FASB issued SFAS No. 157, “Fair Value Measurements” (“SFAS 157”). SFAS 157 provides enhanced guidance for using fair value to measure assets and liabilities. It clarifies the principle that fair value should be based on the assumptions market participants would use when pricing an asset or liability and establishes a fair value hierarchy that prioritizes the information used to develop those assumptions. SFAS 157 is effective for fiscal years beginning after November 15, 2007. In February 2008, the FASB agreed to delay the effective date of SFAS 157 for all nonfinancial assets and nonfinancial liabilities, except those that are recognized or disclosed at fair value in the financial statements on a recurring basis, to fiscal years beginning after November 15, 2008. We are currently evaluating the impact of SFAS 157 on our consolidated results of operations and financial condition.
In February 2007, the FASB issued SFAS No. 159, “The Fair Value Option for Financial Assets and Financial Liabilities” (“SFAS 159”). SFAS 159 permits all entities to choose to elect, at specified election dates, to measure eligible financial instruments at fair value. An entity shall report unrealized gains and losses on items for which the fair value option has been elected in earnings at each subsequent reporting date, and recognize upfront costs and fees related to those items in earnings as incurred and not deferred. SFAS 159 applies to fiscal years beginning after November 15, 2007, with early adoption permitted for an entity that has also elected to apply the provisions of SFAS 157. An entity is prohibited from retrospectively applying SFAS 159, unless it chooses early adoption. We are currently evaluating the impact of the provisions of SFAS 159 on our consolidated results of operations and financial condition.
In December 2007, the FASB issued SFAS No. 160, “Noncontrolling Interests in Consolidated Financial Statements — an amendment of ARB No. 51” (“SFAS 160”). SFAS No. 160 requires all entities to report noncontrolling (minority) interests in subsidiaries as equity in the consolidated financial statements. Its intention is to eliminate the diversity in practice regarding the accounting for transactions between an entity and noncontrolling interests. This Statement is effective for fiscal years, and interim periods within those fiscal years, beginning on or after December 15, 2008. Earlier adoption is prohibited. We are currently evaluating the impact of the provisions of SFAS 160 on our consolidated results of operations and financial condition.
In December 2007, the FASB issued SFAS No. 141(R), a revised version of SFAS No. 141, “Business Combinations.” The revision is intended to simplify existing guidance and converge rulemaking under U.S. generally accepted accounting principles with international accounting standards. This statement applies prospectively to business combinations where the acquisition date is on or after the beginning of the first annual reporting period beginning on or after December 15, 2008, and may affect the release of our valuation allowance against prior acquisition intangibles. An entity may not apply it before that date. We are currently evaluating the impact of the provisions of the revision on our consolidated results of operations and financial condition.
Bowne Conversion 29

In December 2007, the SEC staff issued Staff Accounting Bulletin No. 110 (“SAB 110”), which expresses the views of the SEC staff regarding the use of a “simplified” method in developing an estimate of expected term of “plain vanilla” stock options in accordance with SFAS 123R. The use of the “simplified” method, which was first described in Staff Accounting Bulletin No. 107, was scheduled to expire on December 31, 2007. SAB 110 extends the use of the “simplified” method for “plain vanilla” awards in certain situations. The SEC staff does not expect the “simplified” method to be used when sufficient information regarding exercise behavior, such as historical exercise data or exercise information from external sources, becomes available. SAB 110 is effective January 1, 2008. We are currently evaluating the impact of the provisions of SAB 110 on our consolidated results of operations and financial condition.
Important Factors Considered by Management
We consider several factors in evaluating both our financial position and our operating performance. These factors, while primarily focused on relevant financial information, also include other measures such as general market and economic conditions, competitor information and the status of the regulatory environment.
To understand our financial results, it is important to understand our business model and its impact on our consolidated financial statements. The accounting for the majority of our contracts requires us to initially record deferred revenues on our consolidated balance sheet upon invoicing the sale and then to recognize revenue in subsequent periods ratably over the term of the contract in our consolidated statements of operations. Therefore, to better understand our operations, one must look at both revenues and deferred revenues.
In evaluating our revenues, we analyze them in three categories: recurring ratable revenues, non-recurring ratable revenues and other revenues.
• Recurring ratable revenues include those product revenues that are recognized ratably over the contract term, which is typically one year, and that recur each year assuming clients renew their contracts. These revenues include revenues from the licensing of all of our software products, hosting arrangements and enhanced support and maintenance contracts related to our software products, including certain professional services performed by our professional services groups.
• Non-recurring ratable revenues include those product revenues that are recognized ratably over the term of the contract, which is typically one year, but that do not contractually recur. These revenues include certain hardware components of our Blackboard Transaction System products and certain third-party hardware and software sold to our clients in conjunction with our software licenses.
• Other revenues include those revenues that are recognized as earned and are not deferred to future periods. These revenues include professional services, the sales of Blackboard One, certain sales of licenses, as well as the supplies and commissions we earn from publishers related to digital course supplement downloads.
In the case of both recurring ratable revenues and non-recurring ratable revenues, an increase or decrease in the revenues in one period would be attributable primarily to increases or decreases in sales in prior periods. Unlike recurring ratable revenues, which benefit both from new license sales and from the renewal of previously existing licenses, non-recurring ratable revenues primarily reflect one-time sales that do not contractually renew.
Other factors that we consider in making strategic cash flow and operating decisions include cash flows from operations, capital expenditures, total operating expenses and earnings.
Bowne Conversion 30

Results of Operations
The following table sets forth selected statements of operations data expressed as a percentage of total revenues for each of the periods indicated.
Year Ended December 31,
2005 2006 2007 Revenues:Product.................................................................................................................................................................... 89% 88% 89%Professional services............................................................................................................................................... 11 12 11 Total revenues........................................................................................................................................................ 100 100 100
Operating expenses:Cost of product revenues........................................................................................................................................ 22 22 20Cost of professional services revenues................................................................................................................... 8 9 7Research and development..................................................................................................................................... 10 15 12Sales and marketing................................................................................................................................................ 28 32 28General and administrative..................................................................................................................................... 14 19 16Amortization of intangibles resulting from acquisitions........................................................................................ 0 9 9 Total operating expenses........................................................................................................................................ 82 106 92
Operating margin..................................................................................................................................................... 18 % (6 )% 8 %
The following table sets forth, for each component of revenues, the cost of these revenues expressed as a percentage of the related revenues for each of the periods indicated.
Year Ended December 31,
2005 2006 2007 Cost of product revenues.............................................................................................................................................. 25% 25% 22%Cost of professional services revenues......................................................................................................................... 67% 71% 66%
Year Ended December 31, 2007 Compared to Year Ended December 31, 2006
Revenues. Our total revenues for the year ended December 31, 2007 were $239.4 million, representing an increase of $56.4 million, or 30.8%, as compared to total revenues of $183.1 million for the year ended December 31, 2006.
A detail of our total revenues by classification is as follows:
2006 2007
ProductRevenues
ProfessionalServices Revenues
Total
ProductRevenues
ProfessionalServices Revenues
Total
(In millions)(Unaudited)
Recurring ratable revenues.................................................... $ 130.4 $ 2.3 $ 132.7 $ 179.6 $ 3.3 $ 182.9Non-recurring ratable revenues............................................. 20.0 — 20.0 21.7 — 21.7Other revenues....................................................................... 10 .0 20 .4 30 .4 12 .3 22 .5 34 .8 Total revenues....................................................................... $ 160 .4 $ 22 .7 $ 183 .1 $ 213 .6 $ 25 .8 $ 239 .4
Product revenues. Product revenues, including domestic and international, for the year ended December 31, 2007 were $213.6 million, representing an increase of $53.2 million, or 33.2%, as compared to $160.4 million for the year ended December 31, 2006. Recurring ratable product revenues increased by $49.2 million, or 37.7%, for the year ended December 31, 2007 as compared to the year ended December 31, 2006. This increase was primarily due to a $35.9 million increase in revenues from Blackboard Academic Suite enterprise products which was attributable to current and prior period sales to new and existing clients, the continued shift of our existing clients from the Blackboard Learning System basic products to the Blackboard Learning System enterprise products and the cross-selling of other enterprise products to existing clients. The Blackboard Learning System enterprise products have additional functionality that is not available in the Blackboard Learning System basic products and consequently some Blackboard Learning System basic product clients upgrade to the Blackboard Learning System enterprise products. Licenses of the enterprise version of the Blackboard Learning System enterprise products have higher average pricing, which normally results in at least twice the contractual value as compared to Blackboard Learning System basic product licenses. The further increase in recurring ratable product revenues was due to a $9.0 million increase in hosting revenues and a $1.8 million increase in revenues from the
Bowne Conversion 31

Blackboard Commerce Suite related to an increase in revenues from Blackboard Transaction System licenses. The remaining increase in recurring ratable product revenues resulted from increases in revenues from our other software products. The 2006 revenues were reduced due to the fair value adjustment to the acquired WebCT deferred revenue balances in purchase accounting subsequent to the closing of the WebCT merger.
The increase in non-recurring ratable product revenues was primarily due to an increase in sales of Blackboard Commerce Suite hardware products.
The increase in other product revenues was primarily due to a $0.9 million increase in sales related to certain product offerings of our content management software products, a $0.6 million increase in third party hardware and software revenues, a $0.3 million increase in Blackboard One revenues due to an increase in current period sales and the remaining increase in other product revenues resulted primarily from increases in revenues from publisher relationships.
Of our total revenues, our total international revenues for the year ended December 31, 2007 were $53.6 million, representing an increase of $18.9 million, or 54.6%, as compared to $34.7 million for the year ended December 31, 2006. International product revenues, which consist primarily of recurring ratable product revenues, were $48.1 million for the year ended December 31, 2007, representing an increase of $17.3 million, or 56.3%, as compared to $30.8 million for the year ended December 31, 2006. The increase in international recurring ratable product revenues was primarily due to an increase in international revenues from Blackboard Academic Suite enterprise products resulting from prior period sales to new and existing clients. In addition, the increase in international revenues also reflects our investment in increasing the size of our international sales force and international marketing efforts during prior periods, which expanded our international presence and enabled us to sell more of our products to new and existing clients in our international markets.
Professional services revenues. Professional services revenues for the year ended December 31, 2007, were $25.8 million, representing an increase of $3.1 million, or 13.9%, as compared to $22.7 million for the year ended December 31, 2006. The increase in professional services was primarily attributable to an increase in the number and size of service engagements, which was directly related to the increase in the number of enterprise product licensees, which generally purchase greater volumes of our service offerings. As a percentage of total revenues, professional services revenues for the year ended December 31, 2007 were 10.8% as compared to 12.4% for the year ended December 31, 2006. This decrease was due primarily to the impact of purchase accounting adjustments to WebCT’s beginning deferred revenue balances subsequent to the closing of the WebCT merger during 2006.
Cost of product revenues. Our cost of product revenues for the year ended December 31, 2007 was $47.4 million, representing an increase of $7.8 million, or 19.8%, as compared to $39.6 million for the year ended December 31, 2006. The increase in cost of product revenues was primarily due to a $3.8 million increase in expenses related to hosting services due to the increase in the number of clients contracting for new hosting services or existing clients expanding their existing hosting arrangements. Further, the increase was due to a $2.4 million increase in our technical support expenses primarily due to increased personnel costs related to increased headcount related to new hires during 2007 and higher average salaries due to annual salary increases in 2007. The results for the year ended December 31, 2007 included twelve months of expenses related to the acquired WebCT operations as compared to the year ended December 31, 2006 which only included ten months of expenses related to the acquired WebCT operations following the completion of the merger on February 28, 2006. The further increase in cost of product revenues was due to a $1.1 million increase in hardware and software costs primarily associated with third party products sold with the Blackboard Transaction System. Cost of product revenues as a percentage of product revenues decreased to 22.2% for the year ended December 31, 2007 from 24.7% for the year ended December 31, 2006. This increase in product revenues margin was due primarily to the impact of purchase accounting adjustments to WebCT’s beginning deferred revenue balances subsequent to the closing of the WebCT merger during 2006.
Cost of product revenues excludes amortization of acquired technology resulting from acquisitions, which is included as amortization of intangibles resulting from acquisitions. Amortization expense related to acquired technology was $9.3 million and $11.7 million for the year ended December 31, 2006 and 2007, respectively. Cost of product revenues, including amortization of acquired technology, as a percentage of product revenues was 27.7% for the year ended December 31, 2007 as compared to 30.5% for the year ended December 31, 2006. The results for the year ended December 31, 2007 included twelve months of amortization expense related to amortization of acquired technology resulting from the WebCT merger as compared to the year ended December 31, 2006, which only included ten months of amortization expense following the completion of the merger on February 28, 2006.
Bowne Conversion 32
Cost of professional services revenues. Our cost of professional services revenues for the year ended December 31, 2007 was $16.9 million, representing an increase of $0.9 million, or 5.9%, from $16.0 million for the year ended December 31, 2006. The results for the year ended December 31, 2007 included twelve months of expenses related to the acquired WebCT operations as compared to the year ended December 31, 2006, which only included ten months of expenses related to the acquired WebCT operations following the completion of the merger on February 28, 2006. Cost of professional services revenues as a percentage of professional services revenues decreased to 65.6% for the year ended December 31, 2007 from 70.6% for the year ended December 31, 2006. The increase in professional services revenues margin was due to the increase in revenues from higher margin service offerings during the year ended December 31, 2007.
Research and development expenses. Our research and development expenses for the year ended December 31, 2007 were $28.3 million, representing an increase of $1.1 million, or 4.1%, as compared to $27.2 million for the year ended December 31, 2006. This increase was primarily attributable to a $1.5 million increase in professional services costs resulting from our continued efforts to increase the functionality of our products. This increase was partially offset by decreased personnel-related costs of $0.4 million due to higher average headcount during the year ended December 31, 2006 as compared to the year ended December 31, 2007.
Sales and marketing expenses. Our sales and marketing expenses for the year ended December 31, 2007 were $66.0 million, representing an increase of $7.7 million or 13.2%, as compared to sales and marketing expense of $58.3 million for the year ended December 31, 2006. This increase was primarily attributable to increased personnel-related costs of $5.9 million due to increased average headcount, increased average salaries and increased stock-based compensation expense for sales and marketing employees during 2007 as compared to 2006 and increased general marketing activities of $1.3 million primarily associated with an increasing number and size of our marketing events domestically and abroad. The results for the year ended December 31, 2007 included twelve months of expenses related to the acquired WebCT operations as compared to the year ended December 31, 2006, which only included ten months of expenses related to the acquired WebCT operations following the completion of the merger on February 28, 2006. Further, bad debt expense of $0.6 million was recorded during the year ended December 31, 2007, an increase of $0.4 million as compared to bad debt expense of $0.2 million for the year ended December 31, 2006.
General and administrative expenses. Our general and administrative expenses for the year ended December 31, 2007 were $38.7 million, representing an increase of $2.8 million, or 7.9%, as compared to general and administrative expenses of $35.8 million for the year ended December 31, 2006. This increase was primarily attributable to increased stock-based compensation expense of $2.5 million for general and administrative function employees during the year ended December 31, 2007. Recruiting expense also increased $0.6 million during the year ended December 31, 2007 due to the hiring of employees across all functional areas to support our growth. These increases were partially offset by a decrease of $0.3 million in personnel-related costs due to approximately $2.1 million in retention bonuses and severance costs primarily for WebCT employees recognized during the year ended December 31, 2006 offset, in part, by increased personnel-related costs due to increased average headcount and increased average salaries for general and administrative employees during the year ended December 31, 2007.
Net interest expense. Our net interest expense for the year ended December 31, 2007 was $0.1 million, representing a decrease of $2.9 million or 96.9%, as compared to $3.0 million for the year ended December 31, 2006. This decrease was primarily attributable to interest income earned on higher average cash and cash equivalents balances during 2007 as compared to 2006 resulting from proceeds received in connection with the Notes issued during 2007. Interest income was partially offset by interest expense incurred in connection with the Notes and the credit facilities agreement we entered into with Credit Suisse to fund a portion of the acquisition of WebCT during 2006 (the “Credit Agreement”). During the year ended December 31, 2007, we recorded total debt discount amortization expense, including amortization related to the Notes and the Credit Agreement, of approximately $1.8 million as interest expense.
Other (expense) income. Our other income for the year ended December 31, 2007 was $0.6 million and pertains to the remeasurement of our foreign subsidiaries ledgers, which are maintained in the respective subsidiary’s local foreign currency, into the United States dollar. Specifically, we recognized a translation gain related to the valuing of intercompany debt with our wholly-owned Canadian subsidiary as a result of the change in the exchange rate of the Canadian Dollar into the US Dollar during 2007.
(Benefit) provision for income taxes. Our provision for income taxes for the year ended December 31, 2007 was $7.6 million as compared to a benefit of $4.6 million for the year ended December 31, 2006. The increase in income taxes was due to our income before provision for income taxes during the year ended December 31, 2007 as compared to our loss before (benefit) for income taxes for the year ended December 31, 2006.
Bowne Conversion 33

As of December 31, 2007, we had net operating loss carryforwards for state, federal and international income tax purposes of approximately $112.1 million. Approximately $67.9 million of this amount is restricted under Section 382 of the Internal Revenue Code. Section 382 of the Internal Revenue Code limits the utilization of net operating losses when ownership changes, as defined by that section, occur. We have performed an analysis of our Section 382 ownership changes and have determined that the utilization of certain of our net operating loss carryforwards may be limited. Utilization of the net operating loss carryforwards subject to Section 382 will be limited to approximately $17.7 million per year. Net operating loss carryforwards will expire, if unused, between 2008 and 2026. Due to the length of time available to fully utilize the net operating loss carryforwards and the likelihood of having sufficient taxable income in those periods, we believe it is more likely than not that $2.2 million of these assets will not be realized.
Net income (loss). As a result of the foregoing, we reported net income of $12.9 million for the year ended December 31, 2007 as compared to a net loss of $10.7 million for the year ended December 31, 2006.
Year Ended December 31, 2006 Compared to Year Ended December 31, 2005
Revenues. Our total revenues for the year ended December 31, 2006 were $183.1 million, representing an increase of $47.4 million, or 34.9%, as compared to total revenues of $135.7 million for the year ended December 31, 2005.
A detail of our total revenues by classification is as follows:
2005 2006
ProductRevenues
ProfessionalServices Revenues
Total
ProductRevenues
ProfessionalServices Revenues
Total
(In millions)(Unaudited)
Recurring ratable revenues.................................................... $ 95.7 $ 0.9 $ 96.6 $ 130.4 $ 2.3 $ 132.7Non-recurring ratable revenues............................................. 18.1 — 18.1 20.0 — 20.0Other revenues....................................................................... 6 .6 14 .4 21 .0 10 .0 20 .4 30 .4 Total revenues....................................................................... $ 120 .4 $ 15 .3 $ 135 .7 $ 160 .4 $ 22 .7 $ 183 .1
Product revenues. Product revenues, including domestic and international, for the year ended December 31, 2006 were $160.4 million, representing an increase of $40.0 million, or 33.2%, as compared to $120.4 million for the year ended December 31, 2005. Recurring ratable product revenues increased by $34.8 million, or 36.3%, for the year ended December 31, 2006 as compared to the year ended December 31, 2005. Product revenues from the Blackboard Academic Suite increased $27.4 million, or 43.4%, for the year ended December 31, 2006 as compared to the year ended December 31, 2005. This increase in Blackboard Academic Suite revenues was primarily due to a $21.7 million increase in revenues from Blackboard Learning System enterprise products, a $3.4 million increase in revenue from Blackboard Content System licenses and a $2.0 million increase in revenue from Blackboard Community System licenses. Product revenues from the Blackboard Commerce Suite increased by $1.6 million due to an increase in revenues from Blackboard Transaction System licenses. The further increase in recurring ratable product revenues was due to a $4.5 million increase in hosting revenues and a $1.2 million increase in revenues from enhanced support and maintenance revenues related to our software products. These increases in recurring ratable product revenues were attributable to current and prior period sales to new and existing clients, including clients resulting from the WebCT merger. As of December 31, 2006, we had a 53% increase in the number of clients as compared to December 31, 2005, primarily as a result of the WebCT acquisition.
The increase in Blackboard Learning System enterprise product revenue was also attributable to the continued shift from the Blackboard Learning System basic products to the Blackboard Learning System enterprise products and cross-selling other enterprise products to existing clients. The Blackboard Learning System enterprise products have additional functionality that is not available in the Blackboard Learning System basic products and consequently some Blackboard Learning System basic product clients upgrade to the Blackboard Learning System enterprise products. Licenses of the enterprise version of the Blackboard Learning System enterprise products have higher average pricing, which normally results in at least twice the contractual value as compared to Blackboard Learning System basic product licenses.
The increase in non-recurring ratable product revenues was primarily due to an increase in non-recurring third party hardware and software revenues.
The increase in other product revenues was primarily due to a $1.8 million increase in publisher revenues attributable to WebCT publisher relationships, a $0.7 million increase in non-ratable, non-recurring third party hardware and software revenues and a $0.5 million increase in Blackboard One revenues due to an increase in current period sales.
Bowne Conversion 34

Of our total revenues, our total international revenues for the year ended December 31, 2006 were $34.7 million, representing an increase of $12.8 million, or 58.4%, as compared to $21.9 million for the year ended December 31, 2005. International product revenues, which consist primarily of recurring ratable product revenues, were $30.8 million, representing an increase of $10.8 million, or 54.0%, as compared to $20.0 million for the year ended December 31, 2005. The increase in international revenues was driven primarily by an increase in recurring ratable product revenues. This increase was primarily due to an increase in international revenues from Blackboard Academic Suite products resulting from prior period sales to new and existing clients. The increase in international Blackboard Academic Suite revenues was primarily attributable to the same factors that contributed to the increase in overall Blackboard Academic Suite revenues. The further increase in total international revenues was attributable to an increase in professional services revenues due to the increase in the number of international licensees of our Blackboard Academic Suite products, which generally purchase greater volumes of our service offerings. In addition, the increase in international revenues also reflects our investment in increasing the size of our international sales force and international marketing efforts during prior periods, which expanded our international presence and enabled us to sell more of our products to new and existing clients in our international markets.
Professional services revenues. Professional services revenues for the year ended December 31, 2006, were $22.7 million, representing an increase of $7.4 million, or 48.4%, as compared to $15.3 million for the year ended December 31, 2005. The increase in professional services revenues was primarily attributable to an increase in the number and size of service engagements, which was directly related to the increase in the number of licensees primarily associated with the WebCT merger, particularly in the number of enterprise product licensees, which generally purchase greater volumes of our service offerings and increased sales of certain enhanced support and maintenance services. As a percentage of total revenues, professional services revenues for the year ended December 31, 2006 were 12.4%, as compared to 11.3% for the year ended December 31, 2005. As a result of the fair value adjustment to the acquired WebCT deferred revenue balances, the percentage of professional services revenues was higher than in prior periods.
Cost of product revenues. Our cost of product revenues for the year ended December 31, 2006 was $39.6 million, representing an increase of $10.0 million, or 33.7%, as compared to $29.6 million for the year ended December 31, 2005. The increase in cost of product revenue was primarily due to a $4.7 million increase in our technical support expense primarily due to increased personnel costs related to increased headcount during 2005 and 2006, higher average salaries due to annual salary increases in 2006 and the inclusion of WebCT’s technical support groups. In addition, there was a $3.6 million increase in expenses for our hosting services due to the increase in the number of clients, including WebCT clients, contracting for our hosting services. Further, the increase was due to a $1.3 million increase in third party hardware and software costs primarily associated with third party products sold with the Blackboard Transaction System and $0.4 million in stock-based compensation included in cost of product revenues for the year ended December 31, 2006. Cost of product revenues as a percentage of product revenues increased to 24.7% for the year ended December 31, 2006 from 24.6% for the year ended December 31, 2005. As a result of the fair value adjustment to the acquired WebCT deferred revenue balances, the percentage of cost of product revenues was higher than in prior periods.
Cost of product revenues excludes amortization of acquired technology intangibles resulting from acquisitions, which is included as amortization of intangibles resulting from acquisitions. Amortization expense related to acquired technology for the year ended December 31, 2006 was $9.3 million. There was no amortization expense related to acquired technology for the year ended December 31, 2005. Cost of product revenues, including amortization of acquired technology, as a percentage of product revenues was 30.5% for the year ended December 31, 2006 as compared to 24.6% for the year ended December 31, 2005.
Cost of professional services revenues. Our cost of professional services revenues for the year ended December 31, 2006 was $16.0 million, representing an increase of $5.8 million, or 56.6%, from $10.2 million for the year ended December 31, 2005. The increase in cost of professional services revenues was directly related to the increase in professional services revenues. Cost of professional services revenues as a percentage of professional services revenues increased to 70.6% for the year ended December 31, 2006 from 66.9% for the year ended December 31, 2005. The decrease in professional services revenues margin was primarily due to $0.5 million in stock-based compensation included in cost of professional services revenues for the year ended December 31, 2006.
Research and development expenses. Our research and development expenses for the year ended December 31, 2006 were $27.2 million, representing an increase of $13.2 million, or 94.8%, as compared to $13.9 million for the year ended December 31, 2005. This increase was primarily attributable to an $11.0 million increase in personnel-related costs due to increased headcount related to new hires during 2005 and 2006, higher average salaries due to annual salary increases in 2006 and the inclusion of WebCT’s research and development groups, including approximately $1.2 million in severance costs. In addition, there was a $1.5 million increase in professional services costs resulting from our continued efforts to increase the functionality of our products. Further, for the year ended December 31, 2006 there was $0.7 million in stock-based compensation included in research and development expenses.
Bowne Conversion 35

Bowne Conversion 36

Sales and marketing expenses. Our sales and marketing expenses for the year ended December 31, 2006 were $58.3 million, representing an increase of $20.5 million or 54.0%, as compared to sales and marketing expense of $37.9 million for the year ended December 31, 2005. This increase was primarily attributable to a $11.9 million increase in personnel costs primarily due to increased headcount related to new hires during 2005 and 2006, higher average salaries due to annual salary increases in 2006 and the inclusion of WebCT’s sales and marketing groups. Further, there was a $2.1 million increase in general marketing activities primarily associated with a larger annual Blackboard users conference in February 2006 and WebCT users conference in July 2006. In addition, there was a $1.4 million change in bad debt expense for the year ended December 31, 2006 as compared to the year ended December 31, 2005 due to a $1.2 million reduction in bad debt expense recorded during the year ended December 31, 2005 as compared to $0.2 million of bad debt expense recorded during the year ended December 31, 2006. Further, there was $3.0 million in stock-based compensation included in sales and marketing expenses for the year ended December 31, 2006.
General and administrative expenses. Our general and administrative expenses for the year ended December 31, 2006 were $35.8 million, representing an increase of $16.5 million, or 85.6%, as compared to general and administrative expenses of $19.3 million for the year ended December 31, 2005. This increase was primarily attributable to a $7.5 million increase in personnel costs due to increased headcount during 2005 and 2006, higher average salaries across all general and administrative functional departments due to annual salary increases in 2006 and the inclusion of WebCT general and administrative functional departments, including approximately $2.2 million in retention bonuses and severance costs primarily for WebCT employees. Further, there was an increase of approximately $2.8 million in facility expenses, including rent, utilities, repairs and maintenance expenses, related to an increase in office space at our Washington, D.C. headquarters and international locations during 2005 and 2006, as well as the inclusion of WebCT office space in Lynnfield, Massachusetts and Canada. There was an increase of approximately $2.5 million in professional service expenses during the year ended December 31, 2006 primarily associated with increased legal, accounting and integration costs resulting from the acquisition of WebCT. For the year ended December 31, 2006, there was $3.5 million in stock-based compensation included in general and administrative expenses.
Net interest income (expense). Our net interest expense for the year ended December 31, 2006 was $3.0 million as compared to net interest income of $3.1 million for the year ended December 31, 2005. This change was attributable primarily to our interest expense associated with the credit facilities agreement we entered into with Credit Suisse to fund a portion of the acquisition of WebCT. In addition, we recognized approximately $1.3 million in additional interest expense associated with the acceleration in the amortization of debt issuance costs due to the prepayments of debt principal during 2006 totaling $35.0 million. Further, this change was due in part to lower cash and cash equivalent and short-term investment balances during the year ended December 31, 2006 as compared to the year ended December 31, 2005 resulting from the use of cash for the acquisition of WebCT.
Other (expense). Our other expense for the year ended December 31, 2006 was $0.5 million and pertains to the remeasurement of our foreign subsidiaries ledgers, which are maintained in the local foreign currency, into the United States dollar. In particular, this expense was primarily the result of the negative impact of the month-end change in the Canadian dollar exchange rate to the United States dollar from February 2006 to December 2006 on intercompany debt with our Canadian subsidiary.
(Benefit) for income taxes. Our benefit for income taxes for the year ended December 31, 2006 was $4.6 million as compared to $14.3 million for the year ended December 31, 2005. The benefit for income taxes for the year ended December 31, 2006 was due to our loss for the period and includes $5.1 million in deferred income tax benefits, offset by $0.5 million of current income tax expense, which primarily relates to state and international tax expense. As of December 31, 2006, we had net operating loss carryforwards for federal and international income tax purposes of approximately $118.0 million.
Net income (loss). As a result of the foregoing, we reported a net loss of $10.7 million for the year ended December 31, 2006 as compared to net income of $41.9 million for the year ended December 31, 2005.
Quarterly Results
Our quarterly operating results and operating cash flows normally fluctuate as a result of seasonal variations in our business, principally due to the timing of client budget cycles and student attendance at client facilities. Historically, we have had lower new sales in our first and fourth quarters than in the remainder of the year. Our expenses, however, do not vary significantly with these changes and, as a result, such expenses do not fluctuate significantly on a quarterly basis. Historically, we have performed a disproportionate amount of our professional services, which are recognized as incurred, in our second and third quarters each year. We expect quarterly fluctuations in operating results and operating cash flows to continue as a result of the uneven seasonal demand for our licenses and services offerings.
Bowne Conversion 37
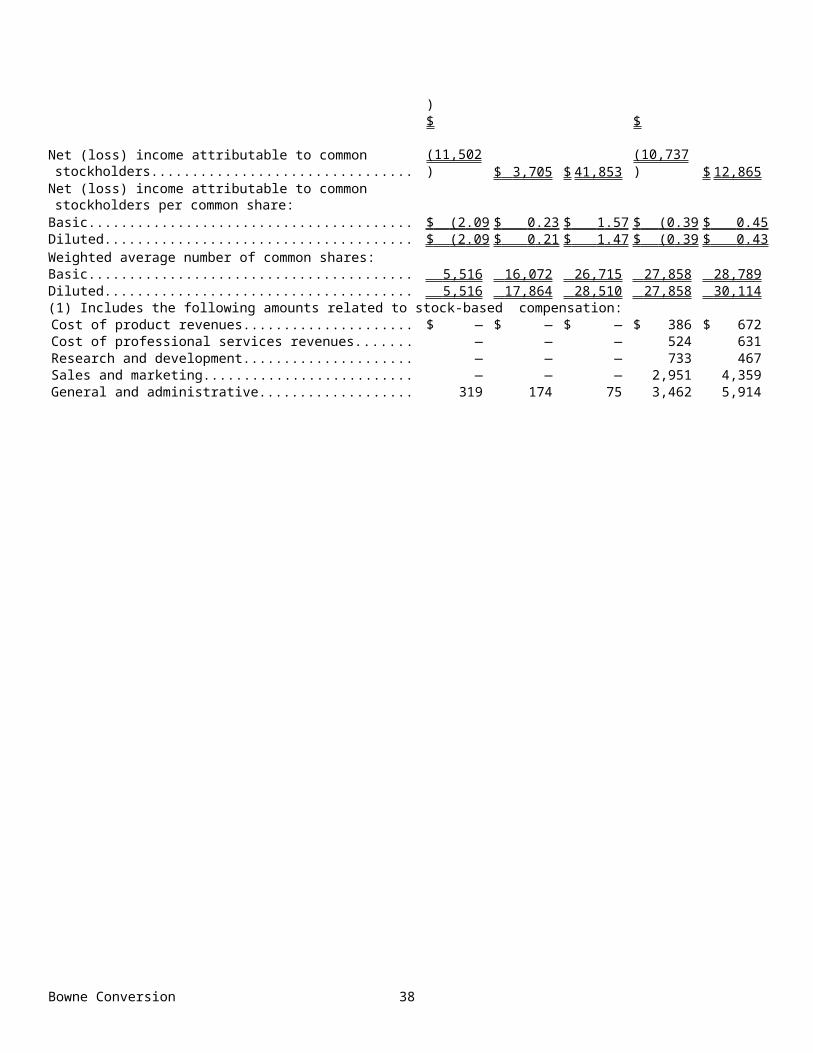
The following table sets forth selected statements of operations and cash flow data for each of the quarters in the years ended December 31, 2006 and 2007.
Quarter Ended
March 31, 2006
June 30, 2006
September 30, 2006
December 31, 2006
(In thousands)Total revenues........................................................................................... $ 37,708 $ 43,580 $ 50,354 $ 51,421Total operating expenses(1)...................................................................... 37,827 51,856 55,455 49,751(Loss) Income from operations................................................................. (119) (8,276) (5,101) 1,670Net income (loss)...................................................................................... 148 (6,311) (4,775) 201Net cash (used in) provided by operating activities.................................. (10,023) (3,848) 24,455 12,302____________
(1) During the three months ended December 31, 2006, we adjusted our estimated forfeiture rate from approximately 10.0% to approximately 15.0% which resulted in a reduction of previously recorded compensation expense of approximately $0.5 million.
Quarter Ended
March 31, 2007
June 30, 2007
September 30, 2007
December 31, 2007
(In thousands)Total revenues........................................................................................... $ 55,280 $ 59,404 $ 61,562 $ 63,202Total operating expenses........................................................................... 51,676 53,751 57,413 56,645Income from operations............................................................................ 3,604 5,653 4,149 6,557Net income................................................................................................ 1,944 3,439 3,279 4,203Net cash provided by operating activities................................................. 891 484 38,415 29,567
Liquidity and Capital Resources
Our cash and cash equivalents were $206.6 million at December 31, 2007 compared to $30.8 million at December 31, 2006. The increase in cash and cash equivalents was primarily due to our convertible debt offering in June 2007 in which we issued and sold $165.0 million aggregate principle amount of the 3.25% Convertible Senior Notes due 2027.
We deposit our cash with financial institutions that we consider to be of high credit quality. Cash and cash equivalents consist of highly liquid investments, which are readily convertible into cash and have original maturities of three months or less.
Net cash provided by operating activities was $69.4 million during the year ended December 31, 2007 as compared to $22.9 million during the year ended December 31, 2006. This change for the year ended December 31, 2007 compared to the year ended December 31, 2006 was primarily due to net income of $12.9 million for the year ended December 31, 2007, which was an increase of $23.6 million from the net loss of $10.7 million for the year ended December 31, 2006. Amortization of intangibles increased to $22.1 million during the year ended December 31, 2007, as the results for 2007 included twelve months of amortization expense related to amortization of acquired technology intangibles resulting from the WebCT merger as compared to the year ended December 31, 2006, which only included ten months of amortization expense following the completion of the merger on February 28, 2006. We recognize revenues on annually renewable agreements ratably over the term, which results in deferred revenues. Deferred revenues as of December 31, 2007 were $129.5 million, representing an increase of $9.2 million, or 7.7%, from $120.3 million as of December 31, 2006. This increase was associated with increased sales to new and existing clients during 2007 as compared to 2006.
Net cash used in investing activities was $47.9 million during the year ended December 31, 2007 as compared to $102.4 million during the year ended December 31, 2006. During the year ended December 31, 2006, we paid $154.6 million in net cash related to the acquisition of WebCT. During the year ended December 31, 2007, cash expenditures for purchase of property and equipment were $16.0 million, which represents approximately 6.7% of total revenues. During the year ended December 31, 2007, we acquired Xythos Software, Inc. and certain other technology during 2007 for a total of $27.7 million and we made $4.2 million in payments related to patent enforcement costs.
Net cash provided by financing activities was $154.3 million during the year ended December 31, 2007 as compared to $34.4 million during the year ended December 31, 2006. During the year ended December 31, 2007, we received $13.4 million in proceeds from exercise of stock options as compared to $9.2 million during the year ended December 31, 2006.
Bowne Conversion 38

In connection with the acquisition of WebCT, we paid a portion of the purchase price using borrowings under a $70.0 million senior secured credit facilities agreement with Credit Suisse (the “Credit Agreement”). The Credit Agreement provided for a $60.0 million senior secured term loan facility repayable over six years and a $10.0 million senior secured revolving credit facility due and payable in full at the end of five years. We repaid $10.0 million on the revolving credit facility on March 28, 2006. The Credit Agreement allowed for voluntary prepayments of principal with no penalty.
In June 2007, we issued and sold $165.0 million aggregate principal amount of 3.25% Convertible Senior Notes due 2027 (the “Notes”) in a public offering. We used a portion of the proceeds to terminate and satisfy in full our existing indebtedness outstanding pursuant to the Credit Agreement of $19.4 million and to pay all fees and expenses incurred in connection with the termination. Additionally, during 2007, we repaid an additional $5.0 million in indebtedness outstanding pursuant to the Credit Agreement. We were not required to pay any prepayment premium or penalties in connection with the early termination of the Credit Agreement.
In connection with obtaining the Notes, we incurred $4.5 million in debt issuance costs. These costs were recorded as a debt discount and netted against the remaining principal amount outstanding. The debt discount is being amortized as interest expense using the effective interest method over the term of the Notes. During the year ended December 31, 2007, we recorded total amortization expense, including amortization related to the Credit Agreement, of approximately $1.8 million as interest expense.
The Notes bear interest at a rate of 3.25% per year on the principal amount, accruing from June 20, 2007. Interest is payable semi-annually on January 1 and July 1, commencing on January 1, 2008. The Notes will mature on July 1, 2027, subject to earlier conversion, redemption or repurchase. On December 31, 2007, we made an interest payment of $2.8 million.
The Notes will be convertible, under certain circumstances, into cash or a combination of cash and our common stock at an initial base conversion rate of 15.4202 shares of common stock per $1,000 principal amount of Notes. The base conversion rate represents an initial base conversion price of approximately $64.85. If at the time of conversion the applicable price of our common stock exceeds the base conversion price, the conversion rate will be increased by up to an additional 9.5605 shares of our common stock per $1,000 principal amount of Notes, as determined pursuant to a specified formula. In general, upon conversion of a Note, the holder of such Note will receive cash equal to the principal amount of the Note and our common stock for the Note’s conversion value in excess of such principal amount. In accordance with the earnings per share method outlined in EITF 04-8, “The Effect of Contingently Convertible Instruments on Diluted Earnings per Share”, the diluted earnings per share effect of the shares that would be issued will be accounted for only if the average market price of our common stock price during the period is greater than the Notes’ conversion price.
Because the Notes contain an adjusting conversion rate provision based on our common stock price and anti-dilution adjustment provisions, at each reporting period, we will evaluate whether any adjustments to the conversion price that would alter the effective conversion rate from the stated conversion rate and result in an “in-the-money” conversion. Whenever an adjustment to the conversion rate results in a number of shares of common stock in excess of approximately 4.1 million shares under the Notes, we would recognize a beneficial conversion feature in that period and amortize it over the remaining life of the Notes. As of December 31, 2007, a beneficial conversion feature under the Notes does not exist.
Holders may surrender their Notes for conversion at any time prior to the close of business on the business day immediately preceding the maturity date for the Notes only under the following circumstances: (1) prior to January 1, 2027, with respect to any calendar quarter beginning after June 30, 2007, if the closing price of the Company’s common stock for at least 20 trading days in the 30 consecutive trading days ending on the last trading day of the immediately preceding calendar quarter is more than 130% of the base conversion price per share of the Notes on such last trading day; (2) on or after January 1, 2027, until the close of business on the business day preceding maturity; or (3) during the five business days after any five consecutive trading day period in which the trading price per $1,000 principal amount of Notes for each day of that period was less than 95% of the product of the closing price of the Company’s common stock and the then applicable conversion rate of the Notes; or (4) other events or circumstances as specifically defined in the Notes.
If a make-whole fundamental change, as defined in the Notes, occurs prior to July 1, 2011, we may be required in certain circumstances to increase the applicable conversion rate for any Notes converted in connection with such fundamental change by a specified number of shares of our common stock. The Notes may not be redeemed by us prior to July 1, 2011, after which they may be redeemed at 100% of the principal amount plus accrued interest. Holders of the Notes may require us to repurchase some or all of the Notes on July 1, 2011, July 1, 2017 or July 1, 2022, or in the event of certain fundamental change transactions, at 100% of the principal amount plus accrued interest.
Bowne Conversion 39

The Notes are unsecured senior obligations and are effectively subordinated to all of our existing and future senior indebtedness to the extent of the assets securing such debt, and are effectively subordinated to all indebtedness and liabilities of our subsidiaries, including trade payables.
On January 31, 2008, we completed the acquisition of The NTI Group, Inc. for a purchase price of $132.0 million in cash and $50.0 million in our common stock, which equated to approximately 1.5 million shares of our common stock, with up to an additional 0.5 million shares of our common stock contingent on the achievement of certain performance milestones. In connection with the transaction, we paid a portion of the purchase price using proceeds from the issuance of the Notes. This acquisition will give us the opportunity to offer clients the ability to send mass communications via voice, email and text messages. We acquired the technology underlying Blackboard Connect, which we began offering in February 2008, through the acquisition of The NTI Group, Inc.
We believe that our existing cash and cash equivalents and future cash provided by operating activities will be sufficient to meet our working capital and capital expenditure needs over the next 12 months. Our future capital requirements will depend on many factors, including our rate of revenue growth, the expansion of our marketing and sales activities, the timing and extent of spending to support product development efforts and expansion into new territories, the timing of introductions of new products or services, the timing of enhancements to existing products and services and the timing of capital expenditures. Also, we may make investments in, or acquisitions of, complementary businesses, services or technologies, which could also require us to seek additional equity or debt financing. To the extent that available funds are insufficient to fund our future activities, we may need to raise additional funds through public or private equity or debt financing. Additional funds may not be available on terms favorable to us, or at all.
We do not have any off-balance sheet arrangements with unconsolidated entities or related parties, and, accordingly, there are no off-balance sheet risks to our liquidity and capital resources from unconsolidated entities.
Obligations and Commitments
As of December 31, 2007, minimum future payments under existing notes payable and noncancelable operating leases are as follows for the years below:
Notes Payable
Operating Leases
(In thousands)2008......................................................................................................................................................................... $ — $ 10,5332009......................................................................................................................................................................... — 9,7102010......................................................................................................................................................................... — 10,3312011......................................................................................................................................................................... 165,000 7,8072012......................................................................................................................................................................... — 7,5122013 and beyond..................................................................................................................................................... — 33,888 Total........................................................................................................................................................................ $ 165,000 $ 79,781
The Notes may not be redeemed by us prior to July 1, 2011, after which they may be redeemed at 100% of the principal amount plus accrued interest. Holders of the Notes may require us to repurchase some or all of the Notes on July 1, 2011, July 1, 2017 or July 1, 2022, or in the event of certain fundamental change transactions, at 100% of the principal amount plus accrued interest. Accordingly, we have categorized the Notes above assuming the first redemption date by the Holders of the Notes on July 1, 2011.
On December 15, 2006, we entered into an agreement with Washington Television Center, LLC pursuant to which we will lease approximately 112,000 square feet of office space in the building known as 650 Massachusetts Avenue, Washington, D.C. We will be relocating our corporate headquarters to the leased premises. The lease term commences on the earlier of (i) five months and 15 days from the date on which the landlord delivers the leased premises to us and (ii) the date on which we occupy the leased premises. We anticipate that we will occupy the leased premises during 2008.
The base annual rent will initially be $45.75 per rentable square foot and will increase on each anniversary by 2%, except on the fifth anniversary on which it will increase by $1.50 per square foot. The rent for the first four months of the first lease year and the first two months of the second lease year will be abated.
Bowne Conversion 40

Seasonality
Our operating results and operating cash flows normally fluctuate as a result of seasonal variations in our business, principally due to the timing of client budget cycles and student attendance at client facilities. Historically, we have had lower new sales in our first and fourth quarters than in the remainder of the year. Our expenses, however, do not vary significantly with these changes and, as a result, such expenses do not fluctuate significantly on a quarterly basis. Historically, we have performed a disproportionate amount of our professional services, which are recognized as incurred, in our second and third quarters each year. In addition, deferred revenues can vary on a seasonal basis for the same reasons. We expect quarterly fluctuations in operating results and operating cash flows to continue as a result of the uneven seasonal demand for our licenses and services offerings. Historically, we have generated more of our operating cash flow in the second half of the calendar year. This pattern may change, however, as a result of acquisitions, new market opportunities or new product introductions.
Item 7A. Quantitative and Qualitative Disclosures about Market Risk
Interest income on our cash and cash equivalents is subject to interest rate fluctuations. We deposit our cash with financial institutions that we consider to be of high credit quality and purchase investments which are generally investment grade, liquid, short-term fixed-income securities and money market instruments denominated in U.S. dollars. For the year ended December 31, 2007, a one percentage point decrease in interest rates would have reduced our interest income by approximately $1.2 million.
We have accounts on our foreign subsidiaries’ ledgers which are maintained in the respective subsidiary’s local foreign currency and remeasured into the United States dollar. As a result, we are exposed to movements in the exchange rates of various currencies against the United States dollar. In particular, we have accounts recorded in Canadian dollars. Therefore, when the Canadian dollar strengthens or weakens against the United States dollar, net income is increased or decreased, respectively. Because of such fluctuations, other income of $0.6 million was recorded during the year ended December 31, 2007. For the year ended December 31, 2007, a one percentage point adverse change in the exchange rate of the Canadian dollar into the United States dollar as of December 31, 2007 would have decreased other income by approximately $0.5 million. In addition to Canada, we have subsidiaries and operations in Australia, The Netherlands, the United Kingdom and various other countries, none of which have experienced hyperinflation in the recent past. Our product and service sales are substantially contracted for in the United States dollar and therefore we do not have significant exposure against the currencies of other countries in which we sell products and services.
Bowne Conversion 41

Item 8. Financial Statements and Supplementary Data
INDEX TO CONSOLIDATED FINANCIAL STATEMENTS
Page Report of Independent Registered Public Accounting Firm...............................................................................................................Consolidated Balance Sheets as of December 31, 2006 and 2007......................................................................................................Consolidated Statements of Operations for the years ended December 31, 2005, 2006 and 2007.....................................................Consolidated Statements of Stockholders’ Equity for the years ended December 31, 2005, 2006 and 2007....................................Consolidated Statements of Cash Flows for the years ended December 31, 2005, 2006 and 2007...................................................Notes to Consolidated Financial Statements.......................................................................................................................................
Bowne Conversion 42

REPORT OF INDEPENDENT REGISTERED PUBLIC ACCOUNTING FIRM
The Board of Directors and StockholdersBlackboard Inc.
We have audited the accompanying consolidated balance sheets of Blackboard Inc. as of December 31, 2006 and 2007, and the related consolidated statements of operations, stockholders’ equity, and cash flows for each of the three years in the period ended December 31, 2007. These financial statements are the responsibility of the Company’s management. Our responsibility is to express an opinion on these financial statements based on our audits.
We conducted our audits in accordance with the standards of the Public Company Accounting Oversight Board (United States). Those standards require that we plan and perform the audit to obtain reasonable assurance about whether the financial statements are free of material misstatement. An audit includes examining, on a test basis, evidence supporting the amounts and disclosures in the financial statements. An audit also includes assessing the accounting principles used and significant estimates made by management, as well as evaluating the overall financial statement presentation. We believe that our audits provide a reasonable basis for our opinion.
In our opinion, the financial statements referred to above present fairly, in all material respects, the consolidated financial position of Blackboard Inc. at December 31, 2006 and 2007, and the consolidated results of its operations and its cash flows for each of the three years in the period ended December 31, 2007, in conformity with U.S. generally accepted accounting principles.
We also have audited, in accordance with the standards of the Public Company Accounting Oversight Board (United States), the effectiveness of Blackboard Inc.’s internal control over financial reporting as of December 31, 2007, based on criteria established in Internal Control-Integrated Framework issued by the Committee of Sponsoring Organizations of the Treadway Commission, and our report dated February 19, 2008 expressed an unqualified opinion thereon.
As discussed in Note 2 to the consolidated financial statements, the Company has adopted FASB Interpretation No. 48, Accounting for Uncertainty in Income Taxes, an interpretation of SFAS No. 109. As discussed in Note 2 to the consolidated financial statements, in 2006, the Company changed its method of accounting for stock-based compensation plans in accordance with Statement of Financial Accounting Standards No. 123(R), Share-Based Payment.
/s/ Ernst & Young LLP
McLean, VAFebruary 19, 2008
Bowne Conversion 43

BLACKBOARD INC.
CONSOLIDATED BALANCE SHEETS
December 31, 2006 2007
(In thousands, except per share data)Current assets:Cash and cash equivalents............................................................................................................... $ 30,776 $ 206,558Accounts receivable, net of allowance for doubtful accounts of $767 and $765, respectively....... 52,394 52,846Inventories........................................................................................................................................ 2,377 2,089Prepaid expenses and other current assets....................................................................................... 3,514 5,255Deferred tax asset, current portion................................................................................................... 7,326 6,549Deferred cost of revenues, current portion...................................................................................... 7,983 6,793 Total current assets.......................................................................................................................... 104,370 280,090
Deferred tax asset, noncurrent portion............................................................................................... 25,431 34,154Deferred cost of revenues, noncurrent portion.................................................................................. 4,253 84Restricted cash................................................................................................................................... 1,999 4,015Property and equipment, net.............................................................................................................. 12,761 18,584Goodwill............................................................................................................................................ 101,644 117,502Intangible assets, net.......................................................................................................................... 56,841 50,847 Total assets......................................................................................................................................... $ 307,299 $ 505,276 Current liabilities:Accounts payable............................................................................................................................. $ 2,238 $ 3,747Accrued expenses............................................................................................................................. 20,519 24,182Term loan, current portion............................................................................................................... 246 —Deferred rent, current portion.......................................................................................................... 371 160Deferred revenues, current portion.................................................................................................. 117,972 126,600 Total current liabilities.................................................................................................................... 141,346 154,689
Term loan, noncurrent portion, net of debt discount of $777............................................................ 23,377 —Convertible senior notes, net of debt discount of $3,481.................................................................. — 161,519Deferred rent, noncurrent portion...................................................................................................... 157 1,469Deferred revenues, noncurrent portion.............................................................................................. 2,298 2,925 Total liabilities................................................................................................................................... 167,178 320,602 Commitments and contingenciesStockholders’ equity:Preferred stock, $0.01 par value; 5,000,000 shares authorized, and no shares issued or outstanding...................................................................................................................................... — —
Common stock, $0.01 par value; 200,000,000 shares authorized; 28,248,214 and 29,196,807 shares issued and outstanding, respectively................................................................. 282 292
Additional paid-in capital................................................................................................................. 231,331 263,582Accumulated deficit.......................................................................................................................... (91,492 ) (79,200 )Total stockholders’ equity................................................................................................................. 140,121 184,674 Total liabilities and stockholders’ equity........................................................................................... $ 307,299 $ 505,276
See accompanying notes.
Bowne Conversion 44

BLACKBOARD INC.
CONSOLIDATED STATEMENTS OF OPERATIONS
Year Ended December 31, 2005 2006 2007
(In thousands, except share and per share data)Revenues:Product........................................................................................................................ $ 120,389 $ 160,392 $ 213,631Professional services................................................................................................... 15,275 22,671 25,817 Total revenues............................................................................................................. 135,664 183,063 239,448Operating expenses:Cost of product revenues, excludes $0, $9,333 and $11,654, respectively, in amortization of acquired technology included in amortization of intangibles resulting from acquisitions shown below(1)............................................................. 29,607 39,594 47,444
Cost of professional services revenues(1)................................................................... 10,220 16,001 16,941Research and development(1)..................................................................................... 13,945 27,162 28,278Sales and marketing(1)................................................................................................ 37,873 58,340 66,033General and administrative(1)..................................................................................... 19,306 35,823 38,667Amortization of intangibles resulting from acquisitions............................................. 266 17,969 22,122 Total operating expenses.............................................................................................. 111,217 194,889 219,485 Income (loss) from operations..................................................................................... 24,447 (11,826) 19,963Other income (expense), net:Interest expense........................................................................................................... (49) (5,354) (5,766)Interest income............................................................................................................ 3,146 2,380 5,673Other (expense) income.............................................................................................. — (519 ) 575 Income (loss) before (benefit) provision for income taxes.......................................... 27,544 (15,319) 20,445(Benefit) provision for income taxes........................................................................... (14,309 ) (4,582 ) 7,580 Net income (loss)......................................................................................................... $ 41,853 $ (10,737 ) $ 12,865 Net income (loss) per common share:Basic............................................................................................................................ $ 1 .57 $ (0 .39 ) $ 0 .45 Diluted......................................................................................................................... $ 1 .47 $ (0 .39 ) $ 0 .43 Weighted average number of common shares:Basic............................................................................................................................ 26,714,748 27,857,576 28,789,083 Diluted......................................................................................................................... 28,509,777 27,857,576 30,113,621 (1) Includes the following amounts related to stock-based compensation:Cost of product revenues............................................................................................. $ — $ 386 $ 672Cost of professional services revenues....................................................................... — 524 631Research and development.......................................................................................... — 733 467Sales and marketing.................................................................................................... — 2,951 4,359General and administrative......................................................................................... 75 3,462 5,914
See accompanying notes.
Bowne Conversion 45

BLACKBOARD INC.
CONSOLIDATED STATEMENTS OF STOCKHOLDERS’ EQUITY
Additional Deferred Total Common Stock Paid-In Stock Accumulated Stockholders’ Shares Amount Capital Compensation Deficit Equity
(In thousands, except share amounts)Balance at December 31, 2004................................... 25,977,822 260 191,664 (209) (122,608) 69,107Issuance of common stock upon exercise of options 1,320,728 13 11,779 — — 11,792Issuance of common stock upon cashless exercise of warrants............................................................... 180,801 2 (2) — — —
Amortization of deferred stock compensation.......... — — (20) 95 — 75Tax benefit for exercise of disqualified stock options..................................................................... — — 7,498 — — 7,498
Net income................................................................ — — — — 41,853 41,853 Balance at December 31, 2005................................... 27,479,351 275 210,919 (114) (80,755) 130,325Issuance of common stock upon exercise of options 768,863 7 9,153 — — 9,160Reclassification of deferred stock compensation upon adoption of SFAS 123R................................. — — (114) 114 — —
Tax benefit for exercise of disqualified stock options..................................................................... — — 3,317 — — 3,317
Stock-based compensation expense.......................... — — 8,056 — — 8,056Net loss...................................................................... — — — — (10,737 ) (10,737 )Balance at December 31, 2006................................... 28,248,214 $ 282 $ 231,331 $ — $ (91,492) $ 140,121Impact of adoption of FIN 48.................................... — — — — (573) (573)Issuance of common stock upon exercise of options 948,593 10 13,363 — — 13,373Tax benefit for exercise of disqualified stock options..................................................................... — — 6,845 — — 6,845
Stock-based compensation expense.......................... — — 12,043 — — 12,043Net income................................................................ — — — — 12,865 12,865 Balance at December 31, 2007................................... 29,196,807 $ 292 $ 263,582 $ — $ (79,200 ) $ 184,674
See accompanying notes.
Bowne Conversion 46

BLACKBOARD INC.
CONSOLIDATED STATEMENTS OF CASH FLOWS
Year Ended December 31, 2005 2006 2007
(In thousands)Cash flows from operating activitiesNet income (loss).......................................................................................................................... $ 41,853 $ (10,737) $ 12,865Adjustments to reconcile net income (loss) to net cash provided by operating activities:Deferred tax benefit..................................................................................................................... (14,799) (5,075) (2,830)Excess tax benefits from stock-based compensation................................................................... — (3,317) (6,845)Amortization of debt discount..................................................................................................... — 1,701 1,840Depreciation and amortization.................................................................................................... 6,867 8,980 10,681Amortization of intangibles resulting from acquisitions............................................................. 266 17,969 22,122Change in allowance for doubtful accounts................................................................................ (253) (109) (2)Noncash stock compensation...................................................................................................... 75 8,056 12,043Changes in operating assets and liabilities, net of effect of acquisitions:Accounts receivable.................................................................................................................... (4,197) (21,780) (225)Inventories.................................................................................................................................. 188 (571) 288Prepaid expenses and other current assets.................................................................................. (910) (42) (1,233)Deferred cost of revenues........................................................................................................... (2,191) (5,129) 372Accounts payable........................................................................................................................ 719 133 952Accrued expenses....................................................................................................................... 2,373 (5,588) 9,394Deferred rent............................................................................................................................... (294) (245) 1,101Deferred revenues....................................................................................................................... 10,116 38,640 8,834
Net cash provided by operating activities.................................................................................... 39,813 22,886 69,357Cash flows from investing activitiesPurchases of property and equipment.......................................................................................... (7,959) (10,081) (16,023)Payments for capitalized patent enforcement costs...................................................................... — (276) (4,186)Purchases of held-to-maturity securities...................................................................................... (33,296) — —Sales of held-to-maturity securities.............................................................................................. 9,750 23,546 —Purchases of available-for-sale securities..................................................................................... (55,306) — (94,250)Sales of available-for-sale securities............................................................................................ 36,250 39,056 94,250Acquisitions, net of cash acquired................................................................................................ (2,536 ) (154,628 ) (27,664 )Net cash used in investing activities............................................................................................. (53,097) (102,383) (47,873)Cash flows from financing activitiesProceeds from revolving credit facility........................................................................................ — 10,000 —Payments on revolving credit facility........................................................................................... — (10,000) —Proceeds from term loan............................................................................................................... — 57,522 —Payments on term loan................................................................................................................. — (35,600) (24,400)Payments on equipment notes...................................................................................................... (762) — —Proceeds from convertible senior notes........................................................................................ — — 160,456Releases of letters of credit.......................................................................................................... — 1,777 —Payments on letters of credit........................................................................................................ — (1,798) (1,976)Excess tax benefits from stock-based compensation................................................................... — 3,317 6,845Proceeds from exercise of stock options...................................................................................... 11,792 9,160 13,373 Net cash provided by financing activities.................................................................................... 11,030 34,378 154,298Net (decrease) increase in cash and cash equivalents.................................................................. (2,254) (45,119) 175,782Cash and cash equivalents at beginning of year........................................................................... 78,149 75,895 30,776 Cash and cash equivalents at end of year..................................................................................... $ 75,895 $ 30,776 $ 206,558 Supplemental cash flow informationCash paid for interest.................................................................................................................... $ 49 $ 3,539 $ 3,824Cash paid for income taxes.......................................................................................................... 687 344 415
See accompanying notes.
Bowne Conversion 47

BLACKBOARD INC.
NOTES TO CONSOLIDATED FINANCIAL STATEMENTSDecember 31, 2007
1. Nature of Business and Organization
Blackboard Inc. (the “Company”) is a leading provider of enterprise software applications and related services to the education industry. The Company’s suites of products include the following products: Blackboard Learning SystemTM, Blackboard Community SystemTM, Blackboard Content SystemTM, Blackboard Outcomes SystemTM, Blackboard Portfolio SystemTM Blackboard Transaction SystemTM, Blackboard OneTM, and Blackboard ConnectTM.
The Company began operations in 1997 as a limited liability company in Delaware. In 1998, the Company was incorporated in Delaware, merged with the limited liability corporation and is now a C corporation for tax purposes.
2. Significant Accounting Policies
Basis of Presentation and Consolidation
The consolidated financial statements include the accounts of the Company and its wholly owned subsidiaries. All material intercompany transactions and accounts have been eliminated in consolidation. The Company consolidates investments where it has a controlling financial interest as defined by Accounting Research Bulletin (“ARB”) No. 51, “Consolidated Financial Statements,” as amended by Statement of Financial Accounting Standards (“SFAS”) No. 94, “Consolidation of all Majority-Owned Subsidiaries.” The usual condition for controlling financial interest is ownership of a majority of the voting interest and therefore, as a general rule, ownership, directly or indirectly, of more than fifty percent of the outstanding voting shares is a condition pointing towards consolidation. For investments in variable interest entities, as defined by Financial Statement Accounting Board (“FASB”) Interpretation No. 46, “Consolidation of Variable Interest Entities,” the Company would consolidate when it is determined to be the primary beneficiary. For those investments in entities where the Company has significant influence over operations, but where the Company neither has a controlling financial interest nor is the primary beneficiary of a variable interest entity, the Company follows the equity method of accounting pursuant to Accounting Principles Bulletin (“APB”) Opinion No. 18, “The Equity Method of Accounting for Investments in Common Stock.” The Company is not the primary beneficiary of any variable interest entities nor does the Company have any investments accounted for under the equity method of accounting.
Use of Estimates
The preparation of financial statements in conformity with U.S. generally accepted accounting principles requires management to make estimates and assumptions that affect the reported amounts of assets and liabilities, the disclosure of contingent assets and liabilities at the date of the financial statements and the reported amounts of revenues and expenses during the reporting period. Actual results could differ from those estimates.
Fair Value of Financial Instruments
SFAS No. 107, “Disclosures about Fair Value of Financial Instruments,” requires disclosures of fair value information about financial instruments, whether or not recognized in the balance sheet, for which it is practicable to estimate that value. Due to their short-term nature, the carrying amounts reported in the consolidated financial statements approximate the fair value for cash and cash equivalents, short-term investments, accounts receivable, accounts payable and accrued expenses. As of December 31, 2007, the fair value of the Company’s long-term debt was $171.6 million based on the quoted market price.
Cash and Cash Equivalents
Cash equivalents consist of highly liquid investments, which are readily convertible into cash and have original maturities of three months or less.
Bowne Conversion 48

Short-term Investments
All investments with original maturities of greater than 90 days are accounted for in accordance with SFAS No. 115, “Accounting for Certain Investments in Debt and Equity Securities.” The Company determines the appropriate classification at the time of purchase and reevaluates such designation as of each balance sheet date. Held-to-maturity securities are stated at amortized cost, adjusted for amortization of premiums and accretion of discounts to maturity under the effective interest method. Such amortization is recorded as interest income. Interest on held-to-maturity securities is recorded as interest income. Available-for-sale securities are carried at fair value, with unrealized holding gains and losses, if any, reported in other comprehensive income. Realized gains and losses and declines in value judged to be other-than-temporary on available-for-sale securities are recorded as other income (expense) in the consolidated statements of operations.
Restricted Cash
As of December 31, 2006 and 2007, $2.0 million and $4.0 million, respectively, of cash was pledged as collateral on outstanding letters of credit related to office space lease obligations. Generally, the restrictions lapse at the termination of the lease obligations.
Foreign Currency Translation
The functional currency of the Company’s foreign subsidiaries is the U.S. dollar. The Company remeasures the monetary assets and liabilities of its foreign subsidiaries, which are maintained in the local currency ledgers, at the rates of exchange in effect at month end. Revenues and expenses recorded in the local currency during the period are translated using average exchange rates for each month. Non-monetary assets and liabilities are translated using historical rates. Resulting adjustments from the remeasurement process are included in other income (expense) in the accompanying consolidated statements of operations.
Concentration of Credit Risk
Financial instruments that potentially subject the Company to significant concentrations of credit risk consist principally of cash and cash equivalents and accounts receivable. The Company deposits its cash with financial institutions that the Company considers to be of high credit quality.
With respect to accounts receivable, the Company performs ongoing evaluations of its customers, generally grants uncollateralized credit terms to its customers, and maintains an allowance for doubtful accounts based on historical experience and management’s expectations of future losses. As of and for the years ended December 31, 2005, 2006 and 2007, there were no significant concentrations with respect to the Company’s consolidated revenues or accounts receivable.
Allowance for Doubtful Accounts
The Company maintains an allowance for doubtful accounts for estimated losses resulting from the inability, failure or refusal of our clients to make required payments. The Company analyzes accounts receivable, historical percentages of uncollectible accounts and changes in payment history when evaluating the adequacy of the allowance for doubtful accounts. The Company uses an internal collection effort, which may include its sales and services groups as it deems appropriate, in its collection efforts. Although the Company believes that its reserves are adequate, if the financial condition of its clients deteriorates, resulting in an impairment of their ability to make payments, or if it underestimates the allowances required, additional allowances may be necessary, which will result in increased expense in the period in which such determination is made.
The following activity occurred in the allowance for doubtful accounts during the years ended December 31, 2005, 2006 and 2007:
2005 2006 2007 (In thousands)
Beginning Balance....................................................................................................................................... $ 954 $ 701 $ 767Additions..................................................................................................................................................... (1,250) 198 554Reductions................................................................................................................................................... (318) (132) (556)Other(1)....................................................................................................................................................... 1,315 — — Ending Balance............................................................................................................................................ $ 701 $ 767 $ 765 __________
(1) The year ended December 31, 2005 includes the reinstatement and subsequent collections on accounts receivable that were deemed uncollectible in prior periods.
Bowne Conversion 49

Income Taxes
Deferred tax assets and liabilities are determined based on temporary differences between the financial reporting bases and the tax bases of assets and liabilities. Deferred tax assets are also recognized for tax net operating loss carryforwards. These deferred tax assets and liabilities are measured using the enacted tax rates and laws that will be in effect when such amounts are expected to reverse or be utilized. The realization of total deferred tax assets is contingent upon the generation of future taxable income. Valuation allowances are provided to reduce such deferred tax assets to amounts more likely than not to be ultimately realized.
Income tax provision includes U.S. federal, state and local and foreign income taxes and is based on pre-tax income or loss. In determining the estimated annual effective income tax rate, the Company analyzes various factors, including projections of the Company’s annual earnings and taxing jurisdictions in which the earnings will be generated, the impact of state and local and foreign income taxes and the ability of the Company to use tax credits and net operating loss carryforwards.
The Company adopted the provisions of FASB Interpretation No. 48, “Accounting for Uncertainty in Income Taxes — an interpretation of FASB Statement No. 109” (“FIN 48”), on January 1, 2007. FIN 48 clarifies the accounting for uncertainty in income taxes recognized in an enterprise’s financial statements in accordance with SFAS No. 109, “Accounting for Income Taxes”. It prescribes that a company should use a more-likely-than-not recognition threshold based on the technical merits of the tax position taken. Tax positions that meet the more-likely-than-not recognition threshold should be measured as the largest amount of the tax benefits, determined on a cumulative probability basis, which is more likely than not to be realized upon ultimate settlement in the financial statements. As a result of the implementation of FIN 48, the Company recognized an increase of $0.6 million in the unrecognized tax benefit liability, which was accounted for as an increase to the January 1, 2007 accumulated deficit balance. The Company recognizes interest and penalties related to income tax matters in income tax expense. Prior to adoption of FIN 48, accruals for tax contingencies were provided for in accordance with the requirements of SFAS No. 5, “Accounting for Contingencies.” Although the Company believes it had appropriate support for the positions taken on its tax returns for those years, the Company had recorded a liability for its best estimate of the probable loss on certain of those positions.
Inventories
Inventories are stated at the lower of cost or market using the first-in, first-out method.
Property and Equipment
Property and equipment are recorded at cost. Depreciation and amortization are calculated on the straight-line method over the following estimated useful lives of the assets:
Computer and office equipment..................................................................................................... 3 yearsSoftware.......................................................................................................................................... 2 to 5 yearsFurniture and fixtures...................................................................................................................... 3 to 5 yearsLeasehold improvements................................................................................................................ Shorter of lease term or useful life
Goodwill and Intangible Assets
The impairment of goodwill is assessed in accordance with SFAS No. 142, “Goodwill and Other Intangible Assets.” Accordingly, the Company tests goodwill for impairment annually on October 1, or whenever events or changes in circumstances indicate an impairment may have occurred, by comparing its fair value to its carrying value. Impairment may result from, among other things, deterioration in the performance of the acquired business, adverse market conditions, adverse changes in applicable laws or regulations, including changes that restrict the activities of the acquired business, and a variety of other circumstances. If it is determined that an impairment has occurred, the Company records a write-down of the carrying value and charges the impairment as an operating expense in the period the determination is made. Although the Company believes goodwill is appropriately stated in its consolidated financial statements, changes in strategy or market conditions could significantly impact these judgments and require an adjustment to the recorded balance.
The costs of defending and protecting patents are capitalized. All costs incurred to the point when a patent application is to be filed are expensed as incurred.
Intangible assets are amortized using the straight-line method over the following estimated useful lives of the assets:
Bowne Conversion 50

Acquired technology.................................................................................................................................................. 3 yearsContracts and customer lists...................................................................................................................................... 3 to 5 yearsNon-compete agreements.......................................................................................................................................... Term of agreementTrademarks and domain names................................................................................................................................. 3 yearsPatents and related costs............................................................................................................................................ Life of patent
Impairment of Long-Lived Assets
The Company evaluates the recoverability of its long-lived assets for impairment whenever events or changes in circumstances indicate that the carrying amount of such assets may not be recoverable. Recoverability of assets to be held and used is measured by a comparison of the carrying amount of any asset to future net undiscounted cash flows expected to be generated by the asset. If such assets are considered to be impaired, the impairment to be recognized is measured as the difference between the future discounted cash flows compared to the carrying amount of the asset.
Revenue Recognition and Deferred Revenue
The Company’s revenues are derived from two sources: product sales and professional services sales. Product revenues include software license, hardware, premium support and maintenance, and hosting revenues. Professional services revenues include training and consulting services. Revenues from software licenses and maintenance is recorded in accordance with the American Institute of Certified Public Accountants’ Statement of Position (“SOP”) 97-2, “Software Revenue Recognition,” as modified by SOP 98-9, “Modification of SOP 97-2, Software Revenue Recognition, with Respect to Certain Transactions.” The Company’s software does not require significant modification and customization services. Where services are not essential to the functionality of the software, the Company begins to recognize software licensing revenues when all of the following criteria are met: (1) persuasive evidence of an arrangement exists; (2) delivery has occurred; (3) the fee is fixed and determinable; and (4) collectibility is probable.
The Company does not have vendor-specific objective evidence (“VSOE”) of fair value for support and maintenance separate from software for the majority of its products. Accordingly, when licenses are sold in conjunction with the Company’s support and maintenance, license revenue is recognized over the term of the maintenance service period. The Company does have VSOE of fair value for its support and maintenance separate from its software for certain offerings. Accordingly, when licenses of these products are sold in conjunction with its support and maintenance, the Company’s recognizes the license revenue upon delivery of the license and recognizes the support and maintenance revenue over the term of the maintenance service period.
The Company’s hardware revenues are derived from two types of transactions: sales of hardware in conjunction with the Company’s software licenses, which are referred to as bundled hardware-software systems, and sales of hardware without software, which generally involve the resale of third-party hardware. After any necessary installation services are performed, hardware revenues are recognized when all of the following criteria are met: (1) persuasive evidence of an arrangement exists; (2) delivery has occurred; (3) the fee is fixed and determinable; and (4) collectibility is probable. VSOE of the fair value for the separate components of bundled hardware-software systems has not been determined. Accordingly, when a bundled hardware-software system is sold, all revenue is recognized over the term of the maintenance service period. Hardware sales without software are recognized upon delivery of the hardware to the Company’s client.
Hosting revenues are recorded in accordance with Emerging Issues Task Force (“EITF”) 00-3, “Application of AICPA SOP 97-2 to Arrangements That Include the Right to Use Software Stored on Another Entity’s Hardware.” Accordingly, hosting fees and set-up fees are recognized ratably over the term of the hosting agreement.
The Company’s sales arrangements may include professional services sold separately under professional services agreements that include training and consulting services. Revenues from these arrangements are accounted for separately from the license revenue because they meet the criteria for separate accounting, as defined in SOP 97-2. The more significant factors considered in determining whether revenues should be accounted for separately include the nature of the professional services, such as consideration of whether the professional services are essential to the functionality of the licensed product, degree of risk, availability of professional services from other vendors and timing of payments. Professional services that are sold separately from license revenue are recognized as the professional services are performed on a time-and-materials basis.
The Company does not offer specified upgrades or incrementally significant discounts. Advance payments are recorded as deferred revenues until the product is shipped, services are delivered or obligations are met and the revenues can be recognized. Deferred
Bowne Conversion 51

revenues represent the excess of amounts invoiced over amounts recognized as revenues. Non-specified upgrades of the Company’s product are provided only on a when-and-if-available basis. Any contingencies, such as rights of return, conditions of acceptance, warranties and price protection, are accounted for under SOP 97-2. The effect of accounting for these contingencies included in revenue arrangements has not been material.
Cost of Revenues and Deferred Cost of Revenues
Cost of revenues includes all direct materials, direct labor, and those indirect costs related to revenue such as indirect labor, materials and supplies, equipment rent, and amortization of software developed internally and software license rights. Cost of product revenues excludes amortization of acquired technology intangibles resulting from acquisitions, which is included as amortization of intangibles acquired in acquisitions. Amortization expense related to acquired technology for the years ended December 31, 2006 and 2007 was $9.3 million and $11.7 million, respectively. There was no amortization expense related to acquired technology for the year ended December 31, 2005. The Company does not have transactions in which the deferred costs of revenues exceed deferred revenues.
Deferred cost of revenues represent the cost of hardware (if sold as part of a complete system) and software that is purchased and has been sold in conjunction with the Company’s products. These costs are recognized as costs of revenues proportionally and over the same period that deferred revenue is recognized as revenues in accordance with SAB Topic 13.
Software Development Costs
The Company accounts for software development costs in accordance with SFAS No. 86, “Accounting for the Costs of Computer Software to be Sold, Leased, or Otherwise Marketed.” Software development costs are expensed as incurred until technological feasibility has been established, at which time such costs are capitalized to the extent that the capitalizable costs do not exceed the realizable value of such costs, until the product is available for general release to customers. The Company defines the establishment of technological feasibility as the completion of all planning, designing, coding and testing activities that are necessary to establish products that meet design specifications including functions, features and technical performance requirements. Under the Company’s definition, establishing technological feasibility is considered complete only after the majority of client testing and feedback has been incorporated into product functionality. As of December 31, 2006 and 2007, the Company has capitalized software of $2.7 million and $3.3 million, respectively, which is amortized over two years. The Company amortized $0.4 million, $0.6 million and $0.4 million for the years ended December 31, 2005, 2006 and 2007, respectively. Capitalized software is included in property and equipment in the accompanying consolidated balance sheets.
Advertising
The Company expenses advertising as incurred. Advertising expense was $0.8 million, $1.2 million and $1.8 million for the years ended December 31, 2005, 2006 and 2007, respectively.
Accounting for Stock-Based Compensation
The Company adopted the fair value recognition provisions of SFAS No. 123 (revised 2005), “Share-Based Payment” (“SFAS 123R”), using the modified prospective transition method on January 1, 2006. Under the modified prospective transition method, compensation cost recognized includes: (a) compensation cost for all equity-based payments granted prior to but not yet vested as of January 1, 2006, based on the grant date fair value estimated in accordance with the original provisions of SFAS 123 and (b) compensation cost for all equity-based payments granted subsequent to January 1, 2006, based on the grant date fair value estimated in accordance with the provisions of SFAS 123R. Results for prior periods have not been restated.
As a result of adopting SFAS 123R on January 1, 2006, the Company’s loss before (benefit) for income taxes and net loss for the year ended December 31, 2006 were approximately $8.1 million and $5.7 million more, respectively, than if the Company had not adopted SFAS 123R. The Company’s income before provision for income taxes and net income for the year ended December 31, 2007 were approximately $12.0 million and $7.6 million less, respectively, than if the Company had not adopted SFAS 123R. Basic and diluted net loss per common share for the year ended December 31, 2006 were each approximately $0.20 more than if the Company had not adopted SFAS 123R. Basic and diluted net income per common share for the year ended December 31, 2007 were approximately $0.26 and $0.25 less, respectively, than if the Company had not adopted SFAS 123R. The related total income tax benefits recognized in the consolidated statements of operations was approximately $3.3 million and $6.8 million for the years ended December 31, 2006 and 2007, respectively, and are classified as a financing cash inflow with a corresponding operating cash outflow.
Bowne Conversion 52

The following table illustrates the effect on net income and net income per common share if the Company had applied the fair value recognition provisions of SFAS 123R to stock-based compensation for the year ended December 31, 2005. The reported and pro forma net income (loss) and net income (loss) per common share for the year ended December 31, 2006 and 2007 are the same as reported because stock-based compensation was calculated under the provisions of SFAS 123R. The pro forma disclosure for the year ended December 31, 2005 utilized the Black-Scholes option-pricing formula to estimate the value of the respective options with such value recognized as expense over the options’ vesting periods.
Pro forma net income for the year ended December 31, 2005 (in thousands except per share data):As reported............................................................................................................................................................................... $ 41,853Add: Stock-based compensation included in reported net income.......................................................................................... 75Deduct: Stock-based compensation expense determined under fair value-based method for all awards................................ (6,031 )Pro forma net income................................................................................................................................................................ $ 35,897 Net income per common share:Basic as reported...................................................................................................................................................................... $ 1 .57 Diluted as reported................................................................................................................................................................... $ 1 .47 Basic — pro forma................................................................................................................................................................... $ 1 .34 Diluted — pro forma................................................................................................................................................................ $ 1 .26
The weighted average fair value of the options at the date of grant during 2005, 2006 and 2007 was $8.95, $11.44 and $15.97, respectively. The fair value of each option is estimated on the date of grant using the Black-Scholes option-pricing model with the following weighted-average assumptions for stock options granted during the years ended December 31, 2005, 2006 and 2007:
Year Ended December 31, 2005 2006 2007 Dividend yield........................................................................................................... 0% 0% 0%Expected volatility.................................................................................................... 47.4% 42.4% 44.0%Average risk-free interest rate................................................................................... 4.00% 4.75% 4.53%Expected term........................................................................................................... 5.0 years 4.9 years 5.1 yearsForfeiture rate........................................................................................................... 10.0% 15.0% 15.0%
Dividend yield — The Company has never declared or paid dividends on its common stock and does not anticipate paying dividends in the foreseeable future.
Expected volatility — Volatility is a measure of the amount by which a financial variable such as a share price has fluctuated (“historical volatility”) or is expected to fluctuate (“expected volatility”) during a period. Given the Company’s limited historical stock data following its initial public offering in June 2004, the Company has used a blended volatility to estimate its expected volatility. The blended volatility includes the weighted-average of the Company’s representative weekly historical volatility for the period since January 1, 2006 and the Company’s peer group weekly historical volatility for the period that approximates the expected life of the options. The Company’s peer group historical volatility includes the historical volatility of companies that are similar in revenue size, in the same industry or are competitors.
Risk-free interest rate — This is the average U.S. Treasury rate (having a term that most closely approximates the expected life of the option) for the period in which the option was granted.
Expected life of the options — This is the period of time that the options granted are expected to remain outstanding. The Company uses the short-cut method to determine the expected life of the options as prescribed under the provisions of Staff Accounting Bulletin No. 107, “Share-Based Payment.” Options granted during the year ended December 31, 2007 have a maximum term of eight years.
Forfeiture rate — This is the estimated percentage of options granted that are expected to be forfeited or cancelled on an annual basis before becoming fully vested. The Company estimates the forfeiture rate based on past turnover data and revises the rate if subsequent information, such as the passage of time, indicates that the actual number of instruments that will vest is likely to differ from previous estimates. The cumulative effect on current and prior periods of a change in the estimated number of instruments likely to vest is recognized in compensation expense in the period of the change. During the three months ended December 31, 2006, the Company adjusted its estimated forfeiture rate from approximately 10.0% to approximately 15.0% which resulted in a reduction of previously recorded compensation expense of approximately $0.5 million.
Bowne Conversion 53

The compensation expense that has been recognized in the consolidated statements of operations for the Company’s stock option plans for the years ended December 31, 2006 and 2007 was approximately $8.1 million and $12.0 million, respectively. The related total income tax benefits recognized in the consolidated statements of operations for the years ended December 31, 2006 and 2007 were approximately $3.3 million and $6.8 million, respectively and are classified as a financing cash inflow with a corresponding operating cash outflow. For stock subject to graded vesting, the Company has utilized the “straight-line” method for allocating compensation expense by period.
As of December 31, 2007, there was approximately $29.7 million of total unrecognized compensation expense related to unvested stock options granted under our option plans. The cost is expected to be recognized through February 2013 with a weighted average recognition period of approximately 1.4 years.
Basic and Diluted Net Income (loss) per Common Share
Basic net income (loss) per common share excludes dilution for potential common stock issuances and is computed by dividing net income (loss) by the weighted-average number of common shares outstanding for the period. Diluted net income (loss) per common share reflects the potential dilution that could occur if securities or other contracts to issue common stock were exercised or converted into common stock.
The following table provides a reconciliation of the numerators and denominators used in computing basic and diluted net income (loss) per common share:
Year Ended December 31, 2005 2006 2007
(In thousands, except share and per share amounts)Basic net income (loss) per common share:Net income (loss)........................................................................................................ $ 41,853 $ (10,737 ) $ 12,865 Weighted average shares outstanding........................................................................ 26,714,748 27,857,576 28,789,083 Basic net income (loss) per common share................................................................ $ 1 .57 $ (0 .39 ) $ 0 .45 Diluted net income (loss) per common share:Net income (loss)........................................................................................................ $ 41,853 $ (10,737 ) $ 12,865 Weighted average basic shares outstanding............................................................... 26,714,748 27,857,576 28,789,083Dilutive effect of:Stock options related to the purchase of common stock............................................ 1,697,566 — 1,324,538Warrants related to the purchase of common stock................................................... 97,463 — — Weighted average diluted shares outstanding............................................................ 28,509,777 27,857,576 30,113,621 Diluted net income (loss) per common share............................................................. $ 1 .47 $ (0 .39 ) $ 0 .43
The dilutive effect of 86,000, 1,131,263 and 1,377,508 options were not included in the computation of diluted net income (loss) per share for the years ended December 31, 2005, 2006 and 2007, respectively, as their effect would be anti-dilutive.
Segment Information
The Company currently operates in one business segment; namely the development, commercialization and implementation of software products and related services. The Company evaluates its market opportunities by referring to the U.S. postsecondary education market, U.S. elementary and secondary market, or K-12, education market, and the international postsecondary education market. The Company is not organized by market and is managed and operated as one business. A single management team that reports to the chief operating decision maker comprehensively manages the entire business. The Company does not operate any material separate lines of business or separate business entities with respect to its products or product development. Accordingly, the Company does not accumulate discrete financial information with respect to separate product lines and does not have separately reportable segments as defined by SFAS No. 131, “Disclosure about Segments of an Enterprise and Related Information.”
Substantially all of the Company’s material identifiable assets are located in the United States. Revenues derived from international sales were $21.9 million, $34.7 million and $53.6 million for the years ended December 31, 2005, 2006 and 2007, respectively. Substantially all international sales are denominated in U.S. dollars.
Bowne Conversion 54

Recent Accounting Pronouncements
In September 2006, the FASB issued SFAS No. 157, “Fair Value Measurements” (“SFAS 157”). SFAS 157 provides enhanced guidance for using fair value to measure assets and liabilities. It clarifies the principle that fair value should be based on the assumptions market participants would use when pricing an asset or liability and establishes a fair value hierarchy that prioritizes the information used to develop those assumptions. SFAS 157 is effective for fiscal years beginning after November 15, 2007. In February 2008, the FASB agreed to delay the effective date of SFAS 157 for all nonfinancial assets and nonfinancial liabilities, except those that are recognized or disclosed at fair value in the financial statements on a recurring basis, to fiscal years beginning after November 15, 2008. The Company is currently evaluating the impact of SFAS 157 on its consolidated results of operations and financial condition.
In February 2007, the FASB issued SFAS No. 159, “The Fair Value Option for Financial Assets and Financial Liabilities” (“SFAS 159”). SFAS 159 permits all entities to choose to elect, at specified election dates, to measure eligible financial instruments at fair value. An entity shall report unrealized gains and losses on items for which the fair value option has been elected in earnings at each subsequent reporting date, and recognize upfront costs and fees related to those items in earnings as incurred and not deferred. SFAS 159 applies to fiscal years beginning after November 15, 2007, with early adoption permitted for an entity that has also elected to apply the provisions of SFAS 157. An entity is prohibited from retrospectively applying SFAS 159, unless it chooses early adoption. The Company is currently evaluating the impact of the provisions of SFAS 159 on its consolidated results of operations and financial condition.
In December 2007, the FASB issued SFAS No. 160, “Noncontrolling Interests in Consolidated Financial Statements — an amendment of ARB No. 51” (“SFAS 160”). SFAS No. 160 requires all entities to report noncontrolling (minority) interests in subsidiaries as equity in the consolidated financial statements. Its intention is to eliminate the diversity in practice regarding the accounting for transactions between an entity and noncontrolling interests. This Statement is effective for fiscal years, and interim periods within those fiscal years, beginning on or after December 15, 2008. Earlier adoption is prohibited. The Company is currently evaluating the impact of the provisions of SFAS 160 on its consolidated results of operations and financial condition.
In December 2007, the FASB issued SFAS No. 141(R), a revised version of SFAS No. 141, “Business Combinations.” The revision is intended to simplify existing guidance and converge rulemaking under U.S. generally accepted accounting principles with international accounting rules. This statement applies prospectively to business combinations where the acquisition date is on or after the beginning of the first annual reporting period beginning on or after December 15, 2008, and may affect the release of our valuation allowance against prior acquisition intangibles. An entity may not apply it before that date. The Company is currently evaluating the impact of the provisions of the revision on its consolidated results of operations and financial condition.
In December 2007, the SEC staff issued Staff Accounting Bulletin No. 110 (“SAB 110”), which expresses the views of the SEC staff regarding the use of a “simplified” method in developing an estimate of expected term of “plain vanilla” share options in accordance with SFAS 123R. The use of the “simplified” method, which was first described in Staff Accounting Bulletin No. 107, was scheduled to expire on December 31, 2007. SAB 110 extends the use of the “simplified” method for “plain vanilla” awards in certain situations. The SEC staff does not expect the “simplified” method to be used when sufficient information regarding exercise behavior, such as historical exercise data or exercise information from external sources, becomes available. SAB 110 is effective January 1, 2008. The Company is currently evaluating the impact of the provisions of SAB 110 on its consolidated results of operations and financial condition.
Comprehensive Net Income (loss)
Comprehensive net income (loss) includes net income (loss), combined with unrealized gains and losses not included in earnings and reflected as a separate component of stockholders’ equity. There were no differences between net income (loss) and comprehensive net income (loss) for the years ended December 31, 2005, 2006 and 2007.
3. Acquisitions
On February 28, 2006, the Company completed its merger with WebCT, Inc. (“WebCT”) pursuant to the Agreement and Plan of Merger dated as of October 12, 2005. Pursuant to the Agreement and Plan of Merger, the Company acquired all the outstanding common stock of WebCT in a cash transaction for approximately $178.3 million. The effective cash purchase price of WebCT before transaction costs was approximately $150.4 million, net of WebCT’s February 28, 2006 cash balance of approximately $27.9 million. The Company has included the financial results of WebCT in its consolidated financial statements beginning February 28, 2006.
Bowne Conversion 55
The merger was accounted for under the purchase method of accounting in accordance with SFAS No. 141, “Business Combinations” (“SFAS 141”). Assets acquired and liabilities assumed were recorded at their fair values as of February 28, 2006. The total purchase price was $187.5 million, including the acquisition-related transaction costs of approximately $9.2 million. Acquisition-related transaction costs include investment banking, legal and accounting fees, and other external costs directly related to the merger.
Of the total purchase price, $29.2 million has been allocated to net tangible assets and $73.3 million has been allocated to definite-lived intangible assets acquired. Definite-lived intangible assets of $73.3 million consist of the value assigned to WebCT’s customer relationships of $39.6 million and developed and core technology of $33.7 million. Goodwill represents the excess of the purchase price of an acquired business over the fair value of the net tangible and intangible assets acquired. The Company allocated $85.0 million to goodwill which is not deductible for tax purposes.
During 2007, the Company reduced goodwill by approximately $6.4 million primarily related to the recognition of deferred tax assets related to certain acquisition-related transaction costs that were deductible for income tax purposes by WebCT. Consequently, after this adjustment, the net deferred tax asset acquired as a result of the WebCT merger was $7.8 million.
During 2007, the Company purchased technology for $1.5 million which will provide future functionality in the Company’s products. The technology is classified as acquired technology and recorded as intangible assets on the consolidated balance sheets at December 31, 2007.
On November 30, 2007, the Company completed its merger with Xythos Software, Inc. (“Xythos”) pursuant to the Agreement and Plan of Merger dated as of November 12, 2007. Xythos owns the underlying technology embedded in the Blackboard Content System. This merger will give the Company the ability to further augment the underlying technology of the Blackboard Content System and is a technology that the Company intends to incorporate into the broader Academic Suite. Pursuant to the Agreement and Plan of Merger, the Company acquired all the outstanding common stock of Xythos in a cash transaction for approximately $36.2 million, including acquisition-related transaction costs and purchase accounting adjustments of $10.7 million, which included a $5.0 million reduction of deferred cost of revenues associated with the remaining value of the preexisting agreement with Xythos. The Company determined that their was no settlement gain or loss on the settlement of the preexisting agreement with Xythos as the preexisting agreement was considered cancelable on its existing terms. The $5.0 million adjustment was recorded as an increase to goodwill. The effective cash purchase price of Xythos before transaction costs was approximately $25.5 million, net of Xythos’s November 30, 2007 cash balance of approximately $5.5 million. The Company has included the financial results of Xythos in its consolidated financial statements beginning November 30, 2007.
The merger was accounted for under the purchase method of accounting in accordance with SFAS 141. Assets acquired and liabilities assumed were recorded at their fair values as of November 30, 2007. Of the total purchase price, $4.3 million has been allocated to net tangible assets and $9.9 million has been allocated to definite-lived intangible assets acquired. Definite-lived intangible assets of $9.9 million consist of the value assigned to Xythos’s customer relationships of $7.6 million and developed and core technology of $2.3 million. The Company allocated $22.0 million to goodwill which is not deductible for tax purposes.
4. Inventories
Inventories consist of the following:
December 31, 2006 2007
(In thousands)Raw materials................................................................................................................................................................ $ 799 $ 551Work-in-process............................................................................................................................................................ 658 602Finished goods.............................................................................................................................................................. 920 936 Total inventories............................................................................................................................................................ $ 2,377 $ 2,089
Bowne Conversion 56

5. Property and Equipment
Property and equipment consists of the following:
December 31, 2006 2007
(In thousands)Computer and office equipment.......................................................................................................................... $ 32,108 $ 41,511Software............................................................................................................................................................... 14,914 20,830Furniture and fixtures.......................................................................................................................................... 681 713Leasehold improvements..................................................................................................................................... 2,304 3,252
50,007 66,306Less accumulated depreciation and amortization................................................................................................ (37,246 ) (47,722 )Total property and equipment, net...................................................................................................................... $ 12,761 $ 18,584
Depreciation and amortization expense for the years ended December 31, 2005, 2006 and 2007 was $6.9 million, $9.0 million and $10.5 million, respectively.
6. Goodwill and Intangible Assets
Goodwill and intangible assets consist of the following:
December 31, 2006 2007
(In thousands)Goodwill............................................................................................................................................................. $ 101,644 $ 117,502 Acquired technology.......................................................................................................................................... $ 44,107 $ 48,462Contracts and customer lists............................................................................................................................... 45,042 52,632Non-compete agreements................................................................................................................................... 2,043 2,043Trademarks and domain names.......................................................................................................................... 71 191Patents and related costs..................................................................................................................................... 944 5,212 Subtotal.............................................................................................................................................................. 92,207 108,540 Less accumulated amortization.......................................................................................................................... (35,366 ) (57,693 )Intangible assets, net.......................................................................................................................................... $ 56,841 $ 50,847
Intangible assets from acquisitions are amortized over three to five years. Amortization expense related to intangible assets was approximately $0.3 million, $18.0 million and $22.3 million for the years ended December 31, 2005, 2006 and 2007, respectively. Amortization expense for the years ended December 31, 2008, 2009, 2010, 2011 and 2012 is expected to be approximately $23.3 million, $11.5 million, $7.5 million, $2.1 million and $0.9 million, respectively. This does not include amortization expense associated with the acquisition of The NTI Group, Inc. (see Subsequent Event Footnote No. 13).
As of December 31, 2006 and 2007, the Company had capitalized $0.9 million and $5.2 million, respectively, in costs of defending and protecting patents, due to expenses incurred in a suit against Desire2Learn, Inc. in which the Company has alleged infringement of one of its patents. Any change in the Company’s estimates based on ongoing litigation could materially reduce the valuation of these assets.
7. Credit Facilities and Notes Payable
In connection with the acquisition of WebCT, the Company paid a portion of the purchase price using borrowings under a $70.0 million senior secured credit facilities agreement with Credit Suisse (the “Credit Agreement”). The Credit Agreement provided for a $60.0 million senior secured term loan facility repayable over six years and a $10.0 million senior secured revolving credit facility due and payable in full at the end of five years. The Company repaid $10.0 million on the revolving credit facility on March 28, 2006. The Credit Agreement allowed for voluntary prepayments of principal with no penalty.
In connection with obtaining the Credit Agreement, the Company incurred $2.5 million in debt issuance costs which were recorded as a debt discount and netted against the remaining principal outstanding. These costs were being amortized as interest expense using the effective interest method over the term of the Credit Agreement and such amortization was adjusted for any prepayments on the term loan facility. During the year ended December 31, 2006 and 2007, the Company recognized approximately $1.2 million and $0.7 million, respectively, in additional interest expense associated with the acceleration in the amortization of the debt discount due to the prepayment of debt principal.
Bowne Conversion 57

In June 2007, the Company issued and sold $165.0 million aggregate principal amount of 3.25% Convertible Senior Notes due 2027 (the “Notes”) in a public offering. The Company used a portion of the proceeds to terminate and satisfy in full the Company’s existing indebtedness outstanding pursuant to the Credit Agreement of $19.4 million and to pay all fees and expenses incurred in connection with the termination. The Company was not required to pay any prepayment premium or penalties in connection with the early termination of the Credit Agreement.
In connection with obtaining the Notes, the Company incurred $4.5 million in debt issuance costs. These costs were recorded as a debt discount and netted against the principal amount outstanding. The debt discount is being amortized as interest expense using the effective interest method over the earliest redemption period of the Notes. During the year ended December 31, 2006 and 2007, the Company recorded total amortization expense, including amortization related to the Credit Agreement, of approximately $1.7 million and $1.8 million, respectively, as interest expense.
The Notes bear interest at a rate of 3.25% per year on the principal amount, accruing from June 20, 2007. Interest is payable semi-annually on January 1 and July 1, commencing on January 1, 2008. The Notes will mature on July 1, 2027, subject to earlier conversion, redemption or repurchase. On December 31, 2007, the Company made an interest payment of $2.8 million.
The Notes will be convertible, under certain circumstances, into cash or a combination of cash and the Company’s common stock at an initial base conversion rate of 15.4202 shares of common stock per $1,000 principal amount of Notes. The base conversion rate represents an initial base conversion price of approximately $64.85. If at the time of conversion the applicable price of the Company’s common stock exceeds the base conversion price, the conversion rate will be increased by up to an additional 9.5605 shares of the Company’s common stock per $1,000 principal amount of Notes, as determined pursuant to a specified formula. In general, upon conversion of a Note, the holder of such Note will receive cash equal to the principal amount of the Note and the Company’s common stock for the Note’s conversion value in excess of such principal amount. In accordance with the earnings per share method outlined in EITF 04-8, “The Effect of Contingently Convertible Instruments on Diluted Earnings per Share”, the diluted earnings per share effect of the shares that would be issued will be accounted for only if the average market price of the Company’s common stock price during the period is greater than the Notes’ conversion price.
Because the Notes contain an adjusting conversion rate provision based on the Company’s common stock price and anti-dilution adjustment provisions, at each reporting period, the Company will evaluate whether any adjustments to the conversion price that would alter the effective conversion rate from the stated conversion rate and result in an “in-the-money” conversion. Whenever an adjustment to the conversion rate results in a number of shares of common stock in excess of approximately 4.1 million shares under the Notes, the Company would recognize a beneficial conversion feature in that period and amortize it over the remaining life of the Notes. As of December 31, 2007, a beneficial conversion feature under the Notes does not exist.
Holders may surrender their Notes for conversion at any time prior to the close of business on the business day immediately preceding the maturity date for the Notes only under the following circumstances: (1) prior to January 1, 2027, with respect to any calendar quarter beginning after June 30, 2007, if the closing price of the Company’s common stock for at least 20 trading days in the 30 consecutive trading days ending on the last trading day of the immediately preceding calendar quarter is more than 130% of the base conversion price per share of the Notes on such last trading day; (2) on or after January 1, 2027, until the close of business on the business day preceding maturity; (3) during the five business days after any five consecutive trading day period in which the trading price per $1,000 principal amount of Notes for each day of that period was less than 95% of the product of the closing price of the Company’s common stock and the then applicable conversion rate of the Notes; or (4) other events or circumstances as specifically defined in the Notes.
If a make-whole fundamental change, as defined in the Notes, occurs prior to July 1, 2011, the Company may be required in certain circumstances to increase the applicable conversion rate for any Notes converted in connection with such fundamental change by a specified number of shares of the Company’s common stock. The Notes may not be redeemed by the Company prior to July 1, 2011, after which they may be redeemed at 100% of the principal amount plus accrued interest. Holders of the Notes may require the Company to repurchase some or all of the Notes on July 1, 2011, July 1, 2017 or July 1, 2022, or in the event of certain fundamental change transactions, at 100% of the principal amount plus accrued interest.
The Notes are unsecured senior obligations and are effectively subordinated to all of the Company’s existing and future senior indebtedness to the extent of the assets securing such debt, and are effectively subordinated to all indebtedness and liabilities of the Company’s subsidiaries, including trade payables.
Bowne Conversion 58

8. Stock Option Plan
In January 1998, the Company adopted a stock option plan in order to provide an incentive to eligible employees, consultants, directors and officers of the Company. As of December 31, 2007, 1,366,277 shares of common stock were reserved under the 1998 stock option plan. Shares of common stock available for distribution pursuant to stock options outstanding under the 1998 stock option plan were 960,410 as of December 31, 2007. Stock options granted under the stock option plan generally vest over a four-year period and have a ten year expiration period. Shares available for future grant as of December 31, 2007 were 405,867, however no future grants will be made under this plan.
In March 2004, the Company adopted the 2004 Stock Incentive Plan in which the Company’s officers, employees, directors, outside consultants and advisors are eligible to receive grants under the plan. The plan expires February 2014. In June 2006, the Company’s stockholders approved an amendment to the Company’s Amended and Restated 2004 Stock Incentive Plan to increase the number of shares authorized for issuance under the 2004 Plan from 2,350,000 to 4,600,000. In June 2007, the Company’s stockholders approved an amendment to the Company’s Amended and Restated 2004 Stock Incentive Plan to increase the number of shares authorized for issuance under the 2004 Plan from 4,600,00 to 5,800,000. As of December 31, 2007, 5,236,549 shares of common stock were reserved under the stock option plan. Shares of common stock available for distribution pursuant to stock options outstanding under the stock option plan were 3,285,327 as of December 31, 2007. Stock options granted under the stock option plan generally vest over a three-year period and have a eight year expiration period. Shares available for future grant as of December 31, 2007 were 1,951,222.
A summary of the status of the Company’s stock option plans is presented below for the years ended December 31, 2005, 2006 and 2007:
Shares
Weighted-Average Price/Share
Options outstanding at December 31, 2004............................................................................................... 3,937,593 $ 10.37Options granted......................................................................................................................................... 944,629 19.10Options exercised...................................................................................................................................... (1,320,728) 8.99Options forfeited....................................................................................................................................... (218,182 ) 14.92Options outstanding at December 31, 2005............................................................................................... 3,343,312 13.06Options granted......................................................................................................................................... 1,858,250 27.65Options exercised...................................................................................................................................... (768,863) 11.99Options forfeited....................................................................................................................................... (510,654 ) 24.16Options outstanding at December 31, 2006............................................................................................... 3,922,045 18.76Options granted......................................................................................................................................... 1,527,750 35.02Options exercised...................................................................................................................................... (948,593) 14.07Options forfeited....................................................................................................................................... (255,465 ) 26.27Options outstanding at December 31, 2007............................................................................................... 4,245,737 25.21Options exercisable at December 31, 2007................................................................................................ 1,825,306 16.92Options unvested at December 31, 2007.................................................................................................... 2,420,431 31.46Options vested and expected to vest at December 31, 2007...................................................................... 3,882,469 24.62
For various price ranges, weighted average characteristics of outstanding and exercisable options as of December 31, 2007 were as follows:
Outstanding Options Exercisable Options Range of Exercise Prices
Shares
Weighted AverageRemaining Life
(Years)
WeightedAverage
Price
Shares
WeightedAverage
Price $0.02-$9.66.............................................................................................. 714,591 3.93 $ 9.07 714,591 $ 9.07$9.67-$16.99............................................................................................ 298,476 6.49 13.61 221,510 13.15$17.00-$26.84.......................................................................................... 773,322 5.79 22.13 486,954 20.60$26.85-$28.41.......................................................................................... 847,449 6.30 28.01 302,731 28.05$28.42-$46.89.......................................................................................... 1,611,899 7.22 34.51 99,520 29.73
4,245,737 6.17 25.21 1,825,306 16.92
The aggregate intrinsic value of stock options outstanding as of December 31, 2007 was approximately $64.2 million. The aggregate intrinsic value of stock options exercisable as of December 31, 2007 was approximately $42.6 million. The aggregate intrinsic value of stock options exercised during the year ended December 31, 2007 was approximately $23.2 million. The aggregate intrinsic value of stock options vested and expected to vest as of December 31, 2007 was approximately $61.0 million. The weighted average remaining life of stock options vested and expected to vest as of December 31, 2007 was 6.1 years.
Bowne Conversion 59

9. Income Taxes
For the year ended December 31, 2007, the Company recognized income tax expense totaling $7.6 million and an increase in additional paid-in-capital of $6.8 million related to tax deductions resulting from the exercise of stock options. For the year ended December 31, 2007, income before provision for income taxes included approximately $8.9 million of foreign income. The Company has elected to follow tax law in ordering of tax benefits to determine whether an excess tax benefit was realized under SFAS 123R. The Company does not have an established history of earnings related to its international net operating loss carryforwards and therefore international net operating loss carryforwards, including those acquired in the acquisition of WebCT, are fully reserved through a valuation allowance as of December 31, 2007. In addition, the Company has fully reserved the state net operating loss carryforwards related to one of its wholly-owned domestic subsidiaries because it has determined that it is not more likely than not that it would be able to generate sufficient taxable income to utilize those net operating loss carryforwards before they expire. Approximately $1.3 million of the Company’s valuation allowances as of December 31, 2007 would reduce goodwill associated with acquired entities when and if the related tax benefits would be subsequently recognized. Of the total income tax expense recognized, approximately $5.7 million related to U.S. federal and state income tax expense and approximately $1.9 million related to international income tax expense.
The (benefit) provision for income taxes is comprised of the following:
Year Ended December 31, 2005 2006 2007
(In thousands)Current expense.................................................................................................................................... $ 490 $ 493 $ 2,660Deferred (benefit) expense................................................................................................................... (14,799 ) (5,075 ) 4,920 (Benefit) provision for income taxes.................................................................................................... $ (14,309 ) $ (4,582 ) $ 7,580
Deferred income taxes (benefits) reflect the net tax effects of temporary differences between the carrying amount of assets and liabilities for financial reporting purposes and the amounts used for income tax purposes. Significant components of the Company’s net deferred income taxes are as follows:
December 31, 2006 2007
(In thousands)Deferred tax assets (liabilities):Stock-based compensation expense................................................................................................................... $ 1,813 $ 4,958Net operating loss carryforwards........................................................................................................................ 34,996 23,290International net operating loss carryforwards................................................................................................... 1,542 714Alternative minimum tax and other tax credits.................................................................................................. 2,749 4,723Net operating loss attributable to stock option exercises................................................................................... 9,663 17,629Depreciation....................................................................................................................................................... 1,328 2,876Amortization....................................................................................................................................................... (13,136) (10,909)Bad debts............................................................................................................................................................ 305 305Deferred rent....................................................................................................................................................... 140 596Deferred revenues............................................................................................................................................... 1,350 1,441Deferred cost of revenues................................................................................................................................... (2,388) (2,669)Other accruals and prepaids................................................................................................................................ (458) (507)Valuation allowance........................................................................................................................................... (5,147 ) (1,744 )Net deferred tax assets......................................................................................................................................... $ 32,757 $ 40,703
As of December 31, 2007, the Company had net operating loss carryforwards for state, federal and international income tax purposes of approximately $112.1 million. Approximately $67.9 million of this amount is restricted under Section 382 of the Internal Revenue Code. Section 382 of the Internal Revenue Code limits the utilization of net operating losses when ownership changes, as defined by that section, occur. The Company has performed an analysis of its Section 382 ownership changes and has determined that the utilization of certain of its net operating loss carryforwards may be limited. Utilization of the net operating loss carryforwards subject to Section 382 will be limited to approximately $17.7 million per year. Net operating loss carryforwards will expire, if unused, between 2008 and 2026. Due to the length of time available to fully utilize the net operating loss carryforwards and the likelihood of having sufficient taxable income in those periods, the Company believes it is more likely than not that $2.2 million of these assets will not be realized.
Bowne Conversion 60

The (benefit) provision for income taxes differs from the amount of taxes determined by applying the U.S. federal statutory rate to income (loss) before (benefit ) provision for income taxes as a result of the following for the years ended December 31:
2005 2006 2007 Federal tax at statutory rates............................................................................................................................. 35.0% 35.0% 35.0%State taxes, net of federal benefit..................................................................................................................... 4.5 4.5 4.8Change in valuation allowance......................................................................................................................... (87.7) 4.6 (1.2)Permanent differences...................................................................................................................................... (3.7) (9.1) 3.6Difference in international tax rates................................................................................................................. — (1.3) (8.0)Other................................................................................................................................................................. — (3 .8 ) 2 .9 (Benefit) provision for income taxes................................................................................................................ (51 .9 )% (29 .9 )% 37 .1 %
The Company is subject to income taxes in the United States and numerous foreign jurisdictions. Significant judgment is required in determining the Company’s worldwide provision for income taxes and recording the related assets and liabilities. In the ordinary course of the Company’s business, there are transactions and calculations where the ultimate tax determination is uncertain.
The Company believes that its accruals for tax liabilities, which result primarily from intercompany transfer pricing and the amount of research and experimentation tax credits claimed, are adequate, based on its assessment of many factors including past experience and interpretations of tax law applied to the facts of each matter. Although the Company believes its recorded assets and liabilities are reasonable, tax regulations are subject to interpretation and tax litigation is inherently uncertain; therefore the Company’s assessments can involve both a series of complex judgments about future events and rely heavily on estimates and assumptions. Although the Company believes that the estimates and assumptions supporting its assessments are reasonable, the final determination of tax audits and any related litigation could be materially different than that which is reflected in historical income tax provisions and recorded assets and liabilities. Based on the results of an audit or litigation, there could be a material effect on the Company’s income tax provision, net income (loss) or cash flows in the period or periods for which that determination is made.
As a result of the adoption of FIN 48, the Company recognized an increase of $0.6 million in the unrecognized tax benefit liability, which was accounted for as an increase to the January 1, 2007 accumulated deficit balance. Also, upon adoption of FIN 48, the Company reclassified $1.0 million of previously accrued tax contingencies which were included in accrued expenses and recorded an offsetting valuation allowance against certain deferred tax assets that were recorded on the consolidated balance sheets at December 31, 2006.
The following table summarizes the activity related to the Company’s unrecognized tax benefit liability (in thousands):
Balance at January 1, 2007.............................................................................................................................................................. $ 573Increases related to current year tax positions................................................................................................................................. —Expiration of the statute of limitations for the assessment of taxes................................................................................................ — Balance at December 31, 2007........................................................................................................................................................ $ 573
All of the Company’s unrecognized tax benefit liability would affect the Company’s effective tax rate if recognized. Because of the existence of net operating loss carryforwards, the resultant unfavorable resolution of any of the Company’s uncertain tax positions would not result in the imposition of interest or penalties. Accordingly, the Company did not record any interest or penalties related to the unrecognized tax benefit liability. The Company does not expect its unrecognized tax benefit liability to change significantly over the next 12 months.
All tax years since 1998 are subject to examination.
10. Commitments and Contingencies
Total rent expense recorded for the years ended December 31, 2005, 2006 and 2007 was $3.5 million, $4.7 million and $5.4 million, respectively. Total sublease income recorded for the years ended December 31, 2005, 2006 and 2007 was $0.2 million, $0.3 million and $0.1 million, respectively.
As of December 31, 2007, minimum future payments under existing notes payable and noncancelable operating leases are as follows for the years below:
Bowne Conversion 61

Notes Payable
Operating Leases
(In thousands)2008......................................................................................................................................................................... $ — $ 10,5332009......................................................................................................................................................................... — 9,7102010......................................................................................................................................................................... — 10,3312011......................................................................................................................................................................... 165,000 7,8072012......................................................................................................................................................................... — 7,5122013 and beyond..................................................................................................................................................... — 33,888 Total........................................................................................................................................................................ $ 165,000 $ 79,781
The Notes may not be redeemed by the Company prior to July 1, 2011, after which they may be redeemed at 100% of the principal amount plus accrued interest. Holders of the Notes may require the Company to repurchase some or all of the Notes on July 1, 2011, July 1, 2017 or July 1, 2022, or in the event of certain fundamental change transactions, at 100% of the principal amount plus accrued interest. Accordingly, the Company has categorized the Notes above assuming the first redemption date by the Holders of the Notes on July 1, 2011.
On December 15, 2006, the Company entered into an agreement with Washington Television Center, LLC pursuant to which the Company will lease approximately 112,000 square feet of office space in the building known as 650 Massachusetts Avenue, Washington, D.C. The Company will be relocating its corporate headquarters to the leased premises. The lease term commences on the earlier of (i) five months and 15 days from the date on which the landlord delivers the leased premises to the Company and (ii) the date on which the Company occupies the leased premises. The Company anticipates that it will occupy the leased premises in mid-2008.
The base annual rent will initially be $45.75 per rentable square foot and will increase on each anniversary by 2%, except on the fifth anniversary on which it will increase by $1.50 per square foot. The rent for the first four months of the first lease year and the first two months of the second lease year will be abated.
The Company, from time to time, is subject to litigation relating to matters in the ordinary course of business. The Company believes that any ultimate liability resulting from these contingencies will not have a material adverse effect on the Company’s results of operations, financial position or cash flows.
11. Employee Benefit Plans
In 1999, the Company adopted a 401(k) plan covering all employees of the Company who have met certain eligibility requirements. Under the terms of the 401(k) plan, the employees may elect to make tax-deferred contributions to the 401(k) plan. In addition, the Company may match employee contributions, as determined by the Board of Directors and may make discretionary contributions to the 401(k) plan. No matching or discretionary contributions were made to the 401(k) plan prior to 2007.
In February 2007, the Board of Directors approved a matching contribution to the 401(k) plan to be paid in a lump-sum to those participating employee accounts for the 2006 and 2007 plan years. The 2006 matching contribution of approximately $0.8 million was paid in March 2007. The 2007 matching contribution of approximately $0.8 million will be paid in March 2008. The matching contributions are equal to 33% of a participant’s plan year contributions, up to 6% of the participant’s salary and IRS limits. Only those participants that have one year of service and are employed by the Company as of December 31 of the plan year are eligible for the matching contribution. The matching contributions will vest over a three year graded vesting schedule. All contributions made by employees under the 401(k) plan vest immediately in the participant’s account.
12. Quarterly Financial Information (Unaudited)
The Company’s quarterly operating results normally fluctuate as a result of seasonal variations in its business, principally due to the timing of client budget cycles and student attendance at client facilities. Historically, the Company has had lower new sales in its first and fourth quarters than in the remainder of the year. The Company’s expenses, however, do not vary significantly with these changes and, as a result, such expenses do not fluctuate significantly on a quarterly basis. Historically, the Company has performed a disproportionate amount of its professional services, which are recognized as incurred, in its second and third quarters each year. The Company expects quarterly fluctuations in operating results to continue as a result of the uneven seasonal demand for its licenses and services offerings.
Bowne Conversion 62

Quarter Ended
March 31, 2006
June 30, 2006
September 30, 2006
December 31, 2006
(In thousands, except per share amounts)Summary consolidated statement of operations:Total revenues......................................................................................... $ 37,708 $ 43,580 $ 50,354 $ 51,421Costs of revenues.................................................................................... 11,357 14,312 15,739 14,187Net income (loss).................................................................................... 148 (6,311) (4,775) 201Net income (loss) per common share:Basic....................................................................................................... $ 0.01 $ (0.23) $ (0.17) $ 0.01Diluted.................................................................................................... $ 0.01 $ (0.23) $ (0.17) $ 0.01
During the three months ended December 31, 2006, the Company adjusted its estimated forfeiture rate from approximately 10.0% to approximately 15.0% which resulted in a reduction of previously recorded compensation expense of approximately $0.5 million.
Quarter Ended
March 31, 2007
June 30, 2007
September 30, 2007
December 31, 2007
(In thousands, except per share amounts)Summary consolidated statement of operations:Total revenues......................................................................................... $ 55,280 $ 59,404 $ 61,562 $ 63,202Costs of revenues.................................................................................... 15,461 16,097 16,392 16,435Net income.............................................................................................. 1,944 3,439 3,279 4,203Net income per common share:Basic....................................................................................................... $ 0.07 $ 0.12 $ 0.11 $ 0.14Diluted.................................................................................................... $ 0.07 $ 0.12 $ 0.11 $ 0.14
13. Subsequent Event
On January 31, 2008, the Company completed the acquisition of The NTI Group, Inc. (“NTI”) for a purchase price of $132.0 million in cash and $50.0 million in the Company’s common stock, which equated to approximately 1.5 million shares of the Company’s common stock, with up to an additional 0.5 million shares of the Company’s common stock contingent on the achievement of certain performance milestones. In connection with the transaction, the Company paid a portion of the purchase price using proceeds from the issuance of the Notes. This acquisition will give the Company the opportunity to offer clients the ability to send mass communications via voice, email and text messages. The Company acquired the technology underlying Blackboard Connect, which it began offering in February 2008, through the acquisition of NTI.
Bowne Conversion 63

Item 9. Changes in and Disagreements with Accountants on Accounting and Financial Disclosure.
None.
Item 9A. Controls and Procedures.
(a) Evaluation of Disclosure Controls and Procedures.
Our management, with the participation of our chief executive officer and chief financial officer, evaluated the effectiveness of our disclosure controls and procedures as of December 31, 2007. The term “disclosure controls and procedures,” as defined in Rules 13a-15(e) and 15d-15(e) under the Exchange Act, means controls and other procedures of a company that are designed to ensure that information required to be disclosed by a company in the reports that it files or submits under the Exchange Act is recorded, processed, summarized and reported, within the time periods specified in the SEC’s rules and forms. Disclosure controls and procedures include, without limitation, controls and procedures designed to ensure that information required to be disclosed by a company in the reports that it files or submits under the Exchange Act is accumulated and communicated to the company’s management, including its principal executive and principal financial officers, as appropriate to allow timely decisions regarding required disclosure. Management recognizes that any controls and procedures, no matter how well designed and operated, can provide only reasonable assurance of achieving their objectives and management necessarily applies its judgment in evaluating the cost-benefit relationship of possible controls and procedures. Based on the evaluation of our disclosure controls and procedures as of December 31, 2007, our chief executive officer and chief financial officer concluded that, as of such date, our disclosure controls and procedures were effective at the reasonable assurance level.
(b) Changes in Internal Control over Financial Reporting.
No change in our internal control over financial reporting (as defined in Rules 13a-15(f) and 15d-15(f) under the Exchange Act) occurred during the fiscal quarter ended December 31, 2007 that has materially affected, or is reasonably likely to materially affect, our internal control over financial reporting.
Bowne Conversion 64

MANAGEMENT’S REPORT ON INTERNAL CONTROL OVER FINANCIAL REPORTING
Our management is responsible for establishing and maintaining adequate internal control over financial reporting, as such term is defined in Securities Exchange Act Rule 13a-15(f). There are inherent limitations in the effectiveness of any internal control over financial reporting, including the possibility of human error and the circumvention or overriding of controls. Accordingly, even effective internal control over financial reporting can provide only reasonable assurance with respect to financial statement preparation. Our internal control system was designed to provide reasonable assurance regarding the reliability of financial reporting and the preparation of financial statements for external purposes in accordance with U.S. generally accepted accounting principles.
Under the supervision and with the participation of our management, including our principal executive officer and principal financial officer, we conducted an evaluation of the effectiveness of our internal control over financial reporting based on the framework in Internal Control — Integrated Framework issued by the Committee of Sponsoring Organizations of the Treadway Commission. Based on our evaluation under the framework in Internal Control — Integrated Framework, our management concluded that our internal control over financial reporting was effective as of December 31, 2007 to provide reasonable assurance regarding the reliability of financial reporting and the preparation of financial statements for external purposes in accordance with U.S. generally accepted accounting principles.
Our management’s assessment of the effectiveness of our internal control over financial reporting as of December 31, 2007 has been audited by Ernst & Young LLP, independent registered public accounting firm, as stated in their report which is included herein.
Signature Title Date /s/ Michael L. Chasen
Michael L. ChasenChief Executive Officer and Director
(Principal Executive Officer)February 19, 2008
/s/ Michael J. Beach Michael J. Beach
Chief Financial Officer(Principal Financial Officer)
February 19, 2008
Bowne Conversion 65

REPORT OF INDEPENDENT REGISTERED PUBLIC ACCOUNTING FIRM
The Board of Directors and StockholdersBlackboard Inc.
We have audited Blackboard Inc.’s internal control over financial reporting as of December 31, 2007, based on criteria established in Internal Control — Integrated Framework issued by the Committee of Sponsoring Organizations of the Treadway Commission (the COSO criteria). Blackboard Inc.’s management is responsible for maintaining effective internal control over financial reporting, and for its assessment of the effectiveness of internal control over financial reporting included in the accompanying Management’s Report on Internal Control Over Financial Reporting. Our responsibility is to express an opinion on the company’s internal control over financial reporting based on our audit.
We conducted our audit in accordance with the standards of the Public Company Accounting Oversight Board (United States). Those standards require that we plan and perform the audit to obtain reasonable assurance about whether effective internal control over financial reporting was maintained in all material respects. Our audit included obtaining an understanding of internal control over financial reporting, assessing the risk that a material weakness exists, testing and evaluating the design and operating effectiveness of internal control based on the assessed risk, and performing such other procedures as we considered necessary in the circumstances. We believe that our audit provides a reasonable basis for our opinion.
A company’s internal control over financial reporting is a process designed to provide reasonable assurance regarding the reliability of financial reporting and the preparation of financial statements for external purposes in accordance with generally accepted accounting principles. A company’s internal control over financial reporting includes those policies and procedures that (1) pertain to the maintenance of records that, in reasonable detail, accurately and fairly reflect the transactions and dispositions of the assets of the company; (2) provide reasonable assurance that transactions are recorded as necessary to permit preparation of financial statements in accordance with generally accepted accounting principles, and that receipts and expenditures of the company are being made only in accordance with authorizations of management and directors of the company; and (3) provide reasonable assurance regarding prevention or timely detection of unauthorized acquisition, use, or disposition of the company’s assets that could have a material effect on the financial statements.
Because of its inherent limitations, internal control over financial reporting may not prevent or detect misstatements. Also, projections of any evaluation of effectiveness to future periods are subject to the risk that controls may become inadequate because of changes in conditions, or that the degree of compliance with the policies or procedures may deteriorate.
In our opinion, Blackboard Inc. maintained, in all material respects, effective internal control over financial reporting as of December 31, 2007, based on the COSO criteria.
We also have audited, in accordance with the standards of the Public Company Accounting Oversight Board (United States), the consolidated balance sheets of Blackboard Inc. as of December 31, 2006 and 2007, and the related consolidated statements of operations, stockholders’ equity, and cash flows for each of the three years in the period ended December 31, 2007, and our report dated February 19, 2008 expressed an unqualified opinion thereon.
/s/ Ernst & Young LLP
McLean, VAFebruary 19, 2008
Bowne Conversion 66

Item 9B. Other Information.
None.
PART III
Item 10. Directors and Executive Officers of the Registrant.
The information regarding our executive officers required by this Item is set forth under Item 1 to this annual report.
The following information will be included in our Proxy Statement to be filed within 120 days after the fiscal year end of December 31, 2007, and is incorporated herein by reference:
• Information regarding our directors required by this Item is set forth under the heading “Election of Directors”
• Information regarding our audit committee and designated “audit committee financial experts” is set forth under the heading “Corporate Governance Principles and Board Matters, Board Structure and Committee Composition — Audit Committee”
• Information regarding Section 16(a) beneficial ownership reporting compliance is set forth under the heading “Section 16(a) Beneficial Ownership Reporting Compliance”
Code of Ethics
We have adopted a code of ethics and business conduct that applies to our employees including our principal executive officer, principal financial officer, principal accounting officer, and persons performing similar functions. Our code of ethics and business conduct can be found posted in the investor relations section on our website at http://investor.blackboard.com.
Item 11. Executive Compensation.
The information required by this Item is incorporated by reference to the information provided under the heading “Executive Compensation” of the Proxy Statement.
Item 12. Security Ownership of Certain Beneficial Owners and Management.
The information required by this Item is incorporated by reference to the information provided under the heading “Security Ownership of Certain Beneficial Owners and Management” and “Equity Compensation Plan Information” of the Proxy Statement.
Item 13. Certain Relationships and Related Transactions.
The information required by this Item is incorporated by reference to the information provided under the heading “Certain Relationships and Related Transactions” of the Proxy Statement.
Item 14. Principal Accounting Fees and Services.
The information required by this Item is incorporated by reference to the information provided under the heading “Principal Accounting Fees and Services” of the Proxy Statement.
Bowne Conversion 67

PART IV
Item 15. Exhibits, Financial Statement Schedules.
(a) 1. Financial Statements. The consolidated financial statements are listed under Item 8 of this report.
2. Financial Statement Schedules.
Financial statement schedules as of December 31, 2006 and 2007, and for each of the three years in the period ended December 31, 2007 have been omitted since they are either not required, not applicable or the information is otherwise included in the consolidated financial statements or the notes to consolidated financial statements.
3. Exhibits. The Exhibits filed as part of this Annual Report on Form 10-K are listed on the Exhibit Index immediately preceding such Exhibits, which Exhibit Index is incorporated herein by reference.
(b) Exhibits — see Item 15(a)(3) above.
(c) Financial Statement Schedules — see Item 15(a)(2) above.
Bowne Conversion 68

SIGNATURES
Pursuant to the requirements of Section 13 or 15(d) of the Securities Exchange Act of 1934, as amended, the registrant has duly caused this report to be signed on its behalf by the undersigned, thereunto duly authorized on the 19th day of February 2008.
BLACKBOARD INC.
By: /s/ Michael J. Beach Michael J. Beach
Chief Financial Officer
Pursuant to the requirements of the Securities Exchange Act of 1934, this report has been signed below by the following persons on behalf of the registrant and in the capacities and on the dates indicated.
Signature Title Date /s/ Michael L. Chasen
Michael L. ChasenChief Executive Officer and Director
(Principal Executive Officer)February 19, 2008
/s/ Michael J. Beach Michael J. Beach
Chief Financial Officer(Principal Financial Officer)
February 19, 2008
/s/ Jonathan R. Walsh Jonathan R. Walsh
Vice President, Finance and Accounting(Principal Accounting Officer)
February 19, 2008
/s/ Matthew Pittinsky Matthew Pittinsky
Chairman of the Board of Directors February 19, 2008
/s/ Joseph L. Cowan Joseph L. Cowan
Director February 19, 2008
/s/ Frank R. Gatti Frank R. Gatti
Director February 19, 2008
/s/ Beth Kaplan Beth Kaplan
Director February 19, 2008
/s/ Thomas Kalinske Thomas Kalinske
Director February 19, 2008
/s/ E. Rogers Novak, Jr. E. Rogers Novak, Jr.
Director February 19, 2008
/s/ William Raduchel William Raduchel
Director February 19, 2008
Bowne Conversion 69

EXHIBIT INDEX
Exhibit Number
1.1 Underwriting Agreement dated June 14, 2007(15)2.1 Agreement and Plan of Merger, dated as of January 11, 2008, by and among Blackboard Inc., Bookstore Merger Sub, Inc.,
The NTI Group, Inc. and Pace Holdings, LLC(8)3.1 Fourth Restated Certificate of Incorporation of the Registrant(3)3.2 Amended and Restated By-Laws of the Registrant(3)4.1 Form of certificate representing the shares of the Registrant’s common stock(2)4.2 Indenture, dated as of June 20, 2007, between Blackboard Inc. and U.S. Bank National Association, as trustee(15)
10.1 Amended and Restated Stock Incentive Plan, as amended(1)10.2 Amended and Restated 2004 Stock Incentive Plan(11)10.3 Employment Agreement between the Registrant and Michael Chasen dated November 14, 2005(9)10.4 Employment Agreement between the Registrant and Matthew Pittinsky dated November 14, 2005(9)10.5 Employment Agreement between the Registrant and Michael Beach, dated September 1, 2006(12)10.6 Employment Agreement between the Registrant and Matthew H. Small, dated January 26, 2004(6)10.7 Employment Agreement between the Registrant and David Sample, dated June 3, 2006(16)10.8 Outside Director Compensation Plan(13)10.9 Office lease between the Registrant and 1899 L Street LLC, dated November 22, 1999, as amended(1)
10.10 Fifth Amendment to Lease Agreement between the Registrant and 1899 L Street Tower LLC, dated August 31, 2005(10)10.11 Lease Commencement Agreement between the Registrant and 1899 L Street Tower LLC, dated August 31, 2005(10)10.12 Sixth Amendment to Lease Agreement between the Registrant and 1899 L Street Tower LLC, dated January 27, 2006(10)10.13 Seventh Amendment to Lease Agreement between the Registrant and 1899 L Street Tower LLC, dated
November 3, 2006(16)10.14 Eighth Amendment to Lease Agreement between the Registrant and L Street Tower LLC dated February 21, 2007(16)10.15 Office Lease Agreement between the Registrant and Washington Television Center, dated December 15, 2006(16)10.16 Third Amended and Restated Registration Rights Agreement, between the Registrant and certain stockholders of the
Registrant dated as of April 6, 2001(1)10.17 Registration Rights Agreement, between the Registrant and The George Washington University, dated January 11, 2002(2)10.18 Form of Incentive Stock Option Agreement(4)10.19 Form of Nonstatutory Stock Option Agreement(4)10.20 Form of Restricted Stock Agreement(4)10.21 Form of Executive Incentive Stock Option Agreement(5)10.22 Form of Executive Nonstatutory Stock Option Agreement(5)10.23 Form of Executive Nonstatutory Stock Option Agreement(13)10.24 Form of Executive Nonstatutory Stock Option Agreement(13)10.25 Summary of Approved 2007 and 2008 Compensation(17)
21.1 Subsidiaries of the Company ‡23.1 Consent of Ernst & Young LLP, independent registered public accounting firm ‡31.1 Certification Pursuant to Section 302 of the Sarbanes-Oxley Act of 2002 ‡31.2 Certification Pursuant to Section 302 of the Sarbanes-Oxley Act of 2002 ‡32.1 Section 906 Principal Executive Officer Certification †
Bowne Conversion 70

32.2 Section 906 Principal Financial Officer Certification †__________
‡ Filed herewith.
† Furnished herewith.
(1) Previously filed on March 5, 2004 as an exhibit to the Registrant’s Registration Statement on Form S-1 (File No. 333-113332), and incorporated by reference herein.
(2) Previously filed on May 4, 2004 as an exhibit to Amendment No. 2 to the Registrant’s Registration Statement on Form S-1 (File No. 333-113332), and incorporated by reference herein.
(3) Previously filed on August 8, 2004 as an exhibit to the Registrant’s Report on Form 10-Q, and incorporated by reference herein.
(4) Previously filed on December 3, 2004 as an exhibit to the Registrant’s Report on Form 8-K, and incorporated by reference herein.
(5) Previously filed on March 1, 2005 as an exhibit to the Registrant’s Report on Form 10-K, and incorporated by reference herein.
(6) Previously filed on May 13, 2005 as an exhibit to the Registrant’s Report on Form 10-Q, and incorporated by reference herein.
(7) Previously filed on May 25, 2005 as an exhibit to the Registrant’s Report on Form 8-K, and incorporated by reference herein.
(8) Previously filed on January 11, 2008 as an exhibit to the Registrant’s Report on Form 8-K, and incorporated by reference herein.
(9) Previously filed on November 18, 2005 as an exhibit to the Registrant’s Report on Form 8-K, and incorporated by reference herein.
(10) Previously filed on February 15, 2006 as an exhibit to the Registrant’s Report on Form 10-K, and incorporated by reference herein.
(11) Previously filed on August 7, 2007 as an exhibit to the Registrant’s Report on Form 10-Q, and incorporated by reference herein.
(12) Previously filed on November 9, 2006 as an exhibit to the Registrant’s Report on Form 10-Q, and incorporated by reference herein.
(13) Previously filed on February 6, 2007 as an exhibit to the Registrant’s Report on Form 8-K, and incorporated by reference herein.
(14) Previously filed on June 20, 2007 as an exhibit to the Registrant’s Report on Form 8-K, and incorporated by reference herein.
(15) Previously filed on June 15, 2007 as an exhibit to the Registrant’s Report on Form 8-K, and incorporated by reference herein.
(16) Previously filed on February 23, 2007 as an exhibit to the Registrant’s Report on Form 10-K, and incorporated by reference herein.
(17) Previously filed on February 5, 2008 as an exhibit to the Registrant’s Report on Form 8-K, and incorporated by reference herein.
Bowne Conversion 71