2006 annual report - iis windows...
TRANSCRIPT
2006 Annual Report
ATG has proven itself
as the choice for many
of the world’s largest,
most recognized brands.
Our continued success
further allows us to
devote the resources and
vision necessary to
offer the most complete
and powerful tools in
the e-Commerce market.
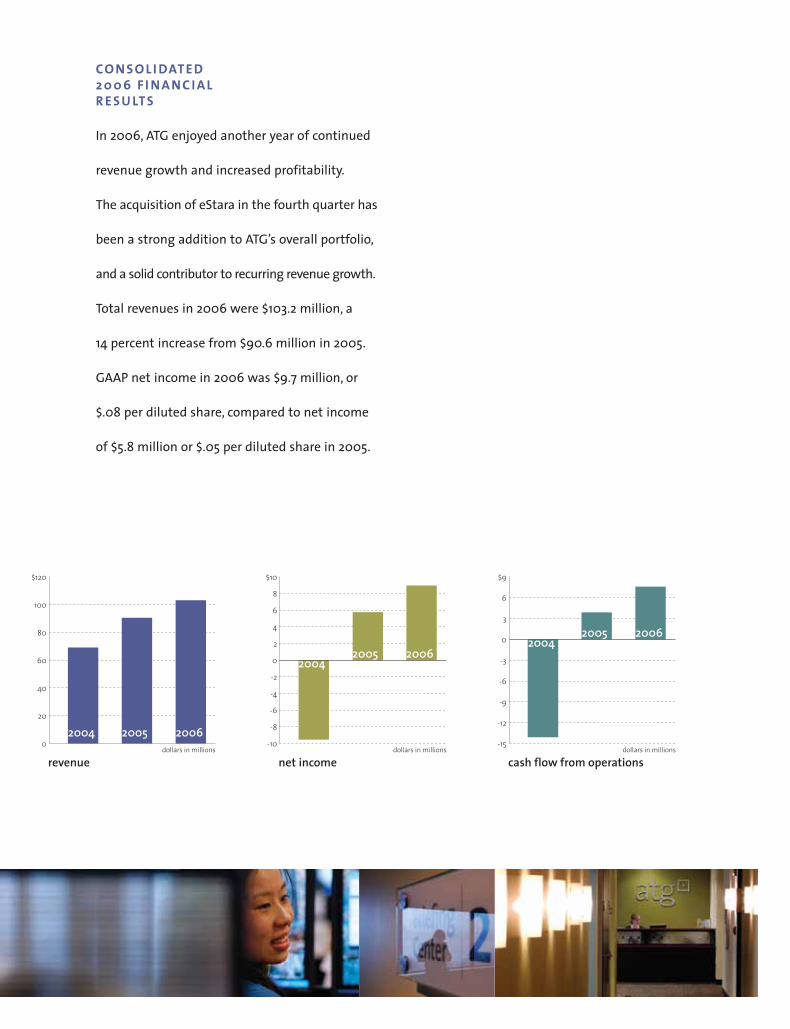
CO N S O L I DAT E D 2 0 0 6 F I N A N C I A L R E S U LT S
In 2006, ATG enjoyed another year of continued
revenue growth and increased profitability.
The acquisition of eStara in the fourth quarter has
been a strong addition to ATG’s overall portfolio,
and a solid contributor to recurring revenue growth.
Total revenues in 2006 were $103.2 million, a
14 percent increase from $90.6 million in 2005.
GAAP net income in 2006 was $9.7 million, or
$.08 per diluted share, compared to net income
of $5.8 million or $.05 per diluted share in 2005.
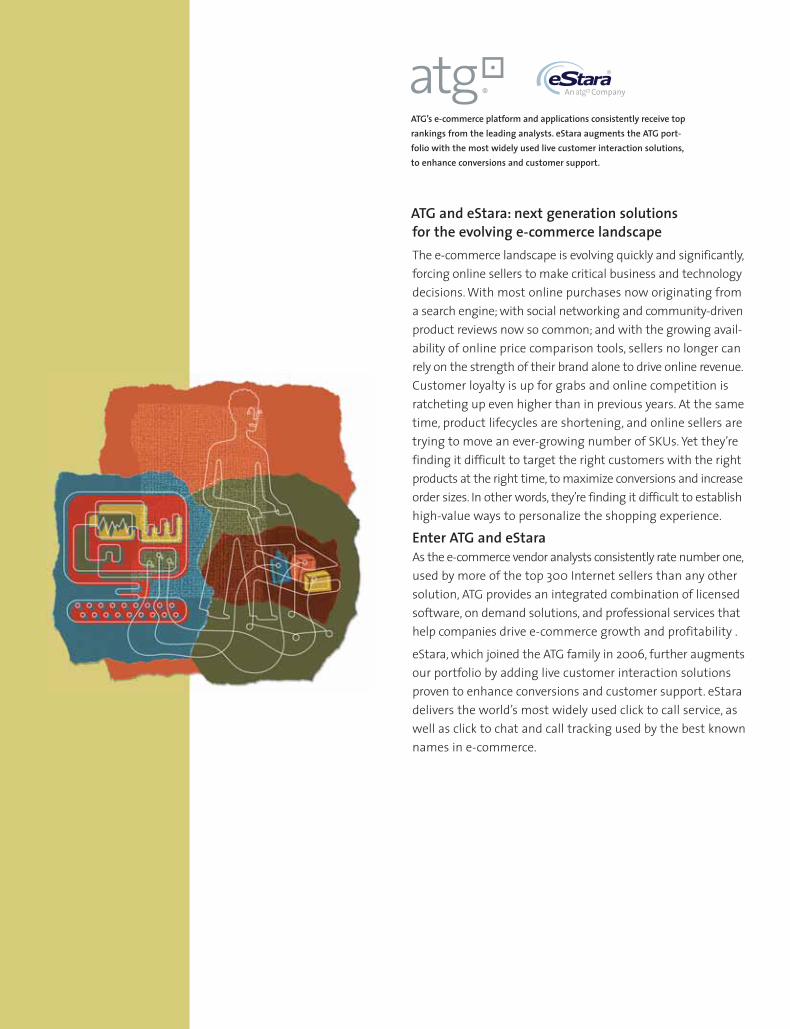
ATG and eStara: next generation solutions for the evolving e-commerce landscapeThe e-commerce landscape is evolving quickly and significantly,forcing online sellers to make critical business and technologydecisions. With most online purchases now originating froma search engine; with social networking and community-drivenproduct reviews now so common; and with the growing avail-ability of online price comparison tools, sellers no longer canrely on the strength of their brand alone to drive online revenue.Customer loyalty is up for grabs and online competition isratcheting up even higher than in previous years. At the sametime, product lifecycles are shortening, and online sellers aretrying to move an ever-growing number of SKUs. Yet they’refinding it difficult to target the right customers with the rightproducts at the right time, to maximize conversions and increaseorder sizes. In other words, they’re finding it difficult to establishhigh-value ways to personalize the shopping experience.
Enter ATG and eStara As the e-commerce vendor analysts consistently rate number one,used by more of the top 300 Internet sellers than any othersolution, ATG provides an integrated combination of licensedsoftware, on demand solutions, and professional services thathelp companies drive e-commerce growth and profitability .
eStara, which joined the ATG family in 2006, further augmentsour portfolio by adding live customer interaction solutionsproven to enhance conversions and customer support. eStaradelivers the world’s most widely used click to call service, aswell as click to chat and call tracking used by the best knownnames in e-commerce.
ATG’s e-commerce platform and applications consistently receive toprankings from the leading analysts. eStara augments the ATG port-folio with the most widely used live customer interaction solutions,to enhance conversions and customer support.
Advanced personalization is the core strength that differentiatesboth ATG and eStara. The ability to make the right offer to theright person at exactly the right time separates next-generationsolutions that captivate customers from the simple and tiredgimmick of putting a consumer’s name at the top of a Webpage. To do it right is critical to securing loyalty and increasedprofits in the new environment of the fickle consumer. It requires
sellers to gain the ability to watch and learn from customers’online activity and purchase history, then use that informationto reach out to customers with the message, promotion, oroffer of live help – whatever best suits both the customer’scurrent context and the seller’s profitability goals.
It also requires marketers and merchandisers to have directcontrol of Web store management and merchandising tools.Business users must now be able to react quickly to rapidlychanging inventory and customer dynamics, without having torely on IT for every update. ATG gives them the business user-friendly tools to deliver a highly personalized and consistentcustomer experience – treating interactions over the Web,e-mail, chat, and phone as one continuous, ongoing relationship,rather than disconnected conversations.
The need for advanced personalization begins with attractingprospects and converting them into buyers, and extends intoproviding satisfying customer service that inspires ongoingloyalty, especially in this era when the competition is just an easyclick away. ATG’s application suite supports every phase of thecustomer lifecycle, and can be delivered as both licensed soft-ware or on demand services.
ATG’s and eStara’s solutions power over 900 major brands inindustries including retail, consumer products manufacturing,media/entertainment, high tech, telecommunications, financialservices, travel/leisure, government, and more. Some of thosecompanies include Amazon, American Eagle Outfitters, AOL,AT&T/Cingular Wireless, Best Buy, B&Q, Cabela’s, Carrefour,Coca-Cola, CVS, Dell, El Corte Ingles, Expedia, France Telecom,Harvard Business School Publishing, Hewlett-Packard, Hilton,HSBC, Intuit, J. Crew, Microsoft, Neiman Marcus, Nike, Nokia,OfficeMax, PayPal, Philips, Procter & Gamble, Sears, Sony, Target,T-Mobile, Urban Outfitters, Verizon, Vodafone and Walgreens.
advancedpersonalization
I n d e p e n d e n t A n a lys i s :ATG Commerce received the highest score in the Current Offeringcategory of the Forrester WaveTM: Commerce Platforms, Q3 2006
to o u r s h a r e h o l d e r s
Customer winsATG generated business from new and repeat customerssuch as Allstate, AT&T/Cingular Wireless, American HeartAssociation, Bluefly, Boeing, BT, CapGemini, Carrefour, CasualMale, CCH, Cellular South, Coca-Cola, The Container Store,CVS, Deutsche Post, Dell, El Corte Ingles, GE/Genpact,Groupama, Harvard Business School Publishing, HiltonHotels, Hewlett-Packard, Irwin Financial, Jenny Craig,Jeppesen Sanderson (division of Boeing), Josten’s, Leaseplan,Loyalty Management Group, Motricity, Neiman Marcus, Nike,Orange, Oriflame Cosmetics, PayPal, Scott’s, Simply Health,Symantec, Smith & Hawken, Sony, Team Athletic, The BodyShop, Upromise, US Bancorp, USDA, Urban Outfitters, VikingRange, and Woolworths.
eStara acquisitionOver the last two years, ATG has consistently expanded ourend-to-end commerce solutions to make it easier for companiesto create more relevant interactions across the entire customerlife cycle, in order to increase online sales and customer loyalty.To that end, in the fourth quarter of 2006, ATG acquired eStara,which had been a privately held company, in a stock and cashmerger transaction. Based in Reston, VA, eStara’s market-leadingClick to Call and Click to Chat solutions allow an online seller toproactively invite consumers into a live dialogue to request animmediate call with a salesperson or customer care agent, viathe telephone or computer. Their Call Tracking solution makestelephone-based lead generation relevant and cost effective.
eStara’s solutions provide an increasingly vital new channel forhelping consumers move from browsing to buying. Furthermore,the combination of ATG’s on demand initiative with eStara’s pureon demand business accelerates ATG’s recurring revenue model.
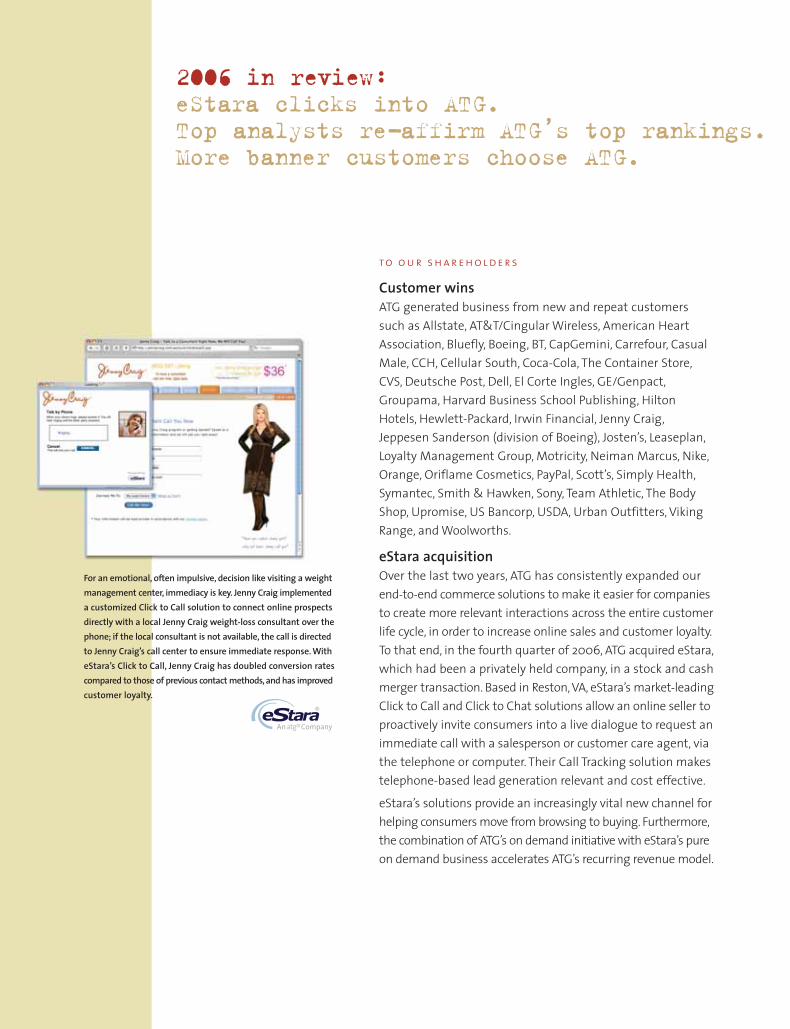
For an emotional, often impulsive, decision like visiting a weightmanagement center, immediacy is key. Jenny Craig implementeda customized Click to Call solution to connect online prospectsdirectly with a local Jenny Craig weight-loss consultant over thephone; if the local consultant is not available, the call is directedto Jenny Craig’s call center to ensure immediate response. WitheStara’s Click to Call, Jenny Craig has doubled conversion ratescompared to those of previous contact methods, and has improvedcustomer loyalty.
2006 in review:eStara clicks into ATG.Top analysts re-affirm ATG’s top rankings.More banner customers choose ATG.
ATG also introduced a new Web analytics and customer intel-ligence solution. ATG Customer Intelligence is an integrated setof datamart and reporting capabilities to monitor and analyzecommerce and customer care performance. It is designed tocombine key data from the ATG product suite, such as purchases,searches, escalations, and click-throughs, with behavioral datafrom Web traffic analysis and demographic data, such as age,gender, and geography.
Management teamIn July, Lou Frio joined ATG as Senior Vice President, Services,adding significant depth to the Services management team.Running ATG’s OnDemand, Professional Services, CustomerSupport Services, and Education teams, Lou brings to ATG morethan 20 years of experience in managing worldwide servicesorganizations, business consulting groups, and managed servicesofferings at companies such as Unisys,ePresence,and Data General.
John Federman, eStara’s CEO prior to the acquisition, continuesto drive eStara’s post-merger strategic direction, growth, andcorporate vision in his role as ATG General Manager. With morethan 20 years of experience in innovative information technologyand media companies, John was previously co-founder, presi-dent, and CEO of Dotomi, an Internet advertising company, andwas president and CEO of AdSmart, a CMGI company. John’scareer began at Ziff Davis Publishing, where his tenure culmi-nated in being Publisher of PC Week.
eStara provides technology for more than 350 of the world’s mostrecognizable brands including Starwood Hotels, DaimlerChrysler,Dell, Apple Computer, and Continental Airlines. Many have seeneStara’s technology increase online sales conversions by up to50 percent, reduce Web site and shopping cart abandonmentrates by 10-45 percent, and reduce call handling time by up to60 seconds.
New customers won by eStara in the fourth quarter includeAutobytel, Fonecta, and Ziff Davis.
Product and service announcementsIn February, ATG introduced ATG OnDemand, a suite of software-as-a-service e-commerce solutions.The hosted solution suite wasdeveloped for companies with limited resources and time todedicate to running commerce and customer service applicationson premise. ATG OnDemand allows companies to concentratetheir resources on the business side of their e-commerce initiatives, not the technology side, while enjoying all therichness of ATG’s personalization and e-commerce capabilities.ATG OnDemand solutions include a feature-rich, transactionalWeb store, combined with customer self-service and agent-assisted service. In addition, ATG enhanced its e-mail responsemanagement product and made it available as part of ourOnDemand suite, and eStara’s Click to Call, Click to Chat, andCall Tracking solutions are all delivered on demand.
In July, ATG announced a significant advance in “searchandising.”ATG offers the only solution that integrates catalog search andWeb store merchandising capabilities to ensure that onlineshoppers easily find the merchandise they are most likely to buy,while merchandisers increase the visibility of items they mostwant to sell and successfully carry out their business strategies.
Analyst recognitionAs in previous years, ATG again earned substantial analyst recog-nition in 2006. ATG Commerce received the highest score in theCurrent Offering category of the Forrester WaveTM: CommercePlatforms, Q3 2006. Forrester also placed ATG in the Leader waveof its customer service vendor ranking, The Forrester WaveTM:eService Suites, Q2 2006. Gartner placed ATG in the Leadersquadrant in its Magic Quadrant for e-Commerce, 4Q06.
2007 Outlook:In the coming year we intend to further our e-commerce lead-ership, nurture both our licensed and on demand businesses,grow organically, and look for complementary acquisitions.
As we look to the future, we are focusing our presence in thegeographic markets where ATG can best extend its leadershipand where steady growth opportunities are evident. Withinthose markets, we are targeting our ATG branded solutions atcompanies with more than $50 million in online revenue inindustries that are most likely to benefit from a full e-commercesolution (where there would be a need for a product catalog;shopping cart; pricing engine; Web marketing, and online cus-tomer service solutions; and customer service agent solutions).With those criteria in mind, the ATG branded products arefocused on the retail, consumer products manufacturing,media/entertainment, high tech, and telecommunicationsindustries. The target market for eStara solutions includesany companies that do a significant amount of Web-based
business and have very high online traffic volumes. Thosecompanies tend to be large retailers, travel and hospitality sites,financial services Web sites, and directory sites such as Internetyellow pages.
There are three major goals driving our business in the coming year:Strengthen our leadership in e-commerce. As consumersbecome more and more comfortable shopping online, theirexpectations of the e-commerce experience continue to getmore sophisticated, and their tolerance for bad experience getsshorter, with their easy ability to comparison shop and switchonline loyalties.Thus, sellers’ demand for better technology withmore sophisticated capabilities, delivered faster, continues togrow. ATG is intent on maintaining our e-commerce leadership,and we will continue to use R&D wisely to maintain our posi-tion. We will also look to develop more business relationshipswith partners that have deep expertise in e-commerce and whocan expand our capacity to deliver and implement solutionsfor our customers.
Further develop our hybrid (license/on demand) business model.ATG will continue to put a focus on our licensed softwarebusiness as we grow our on demand business. We’ve seen theimportance of this strategy as prospective customers want theassurance that if they outsource, they can bring their solutionin-house in the future.We’re also seeing a significant number ofcompanies wanting to operate some aspects of their e-com-merce initiative on premise, while outsourcing other parts.Therefore, our growth projections show expansion of bothour on demand and licensed businesses.
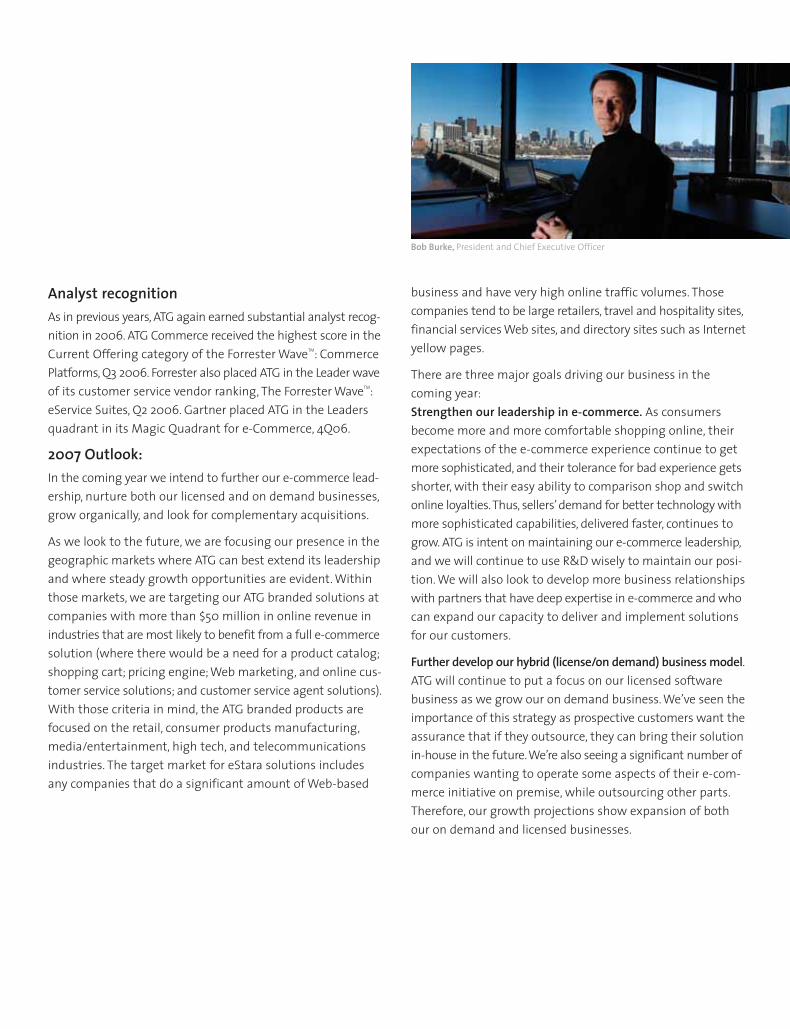
Bob Burke, President and Chief Executive Officer
Grow both organically and through acquisition. While wecontinue to strive for significant organic growth, we believeacquisitions like eStara will accelerate the growth of recurringrevenue and will also help increase cash flow.
In 2007, we intend to continue to enhance our product setand evolve our existing ATG Wisdom platform to further ourcompetitive advantage, especially in the area of advanced person-alization as it applies to search, merchandising, affinity selling,and the continued evolution of our licensed and on demandbusinesses. We believe this, combined with our geographic andindustry targets, our readiness to grow by acquisition andorganically, and our tenured, dedicated leadership team willmake the coming year successful for ATG, our customers, andyou, our shareholders. Thank you for your continued supportof ATG. We look forward to updating you on our progress.
Sincerely,
Bob BurkePresident and Chief Executive Officer
April 12, 2007
I n d e p e n d e n t A n a lys i s :The Gartner E-Commerce Magic Quadrant, 4Q2006 positioned ATG in the Leaders quadrant.Gartner Research “E-Commerce Magic Quadrant, 4Q2006” by Adam Sarner, Eugenio M. Alvarez, January, 2007.See back cover for disclaimer information
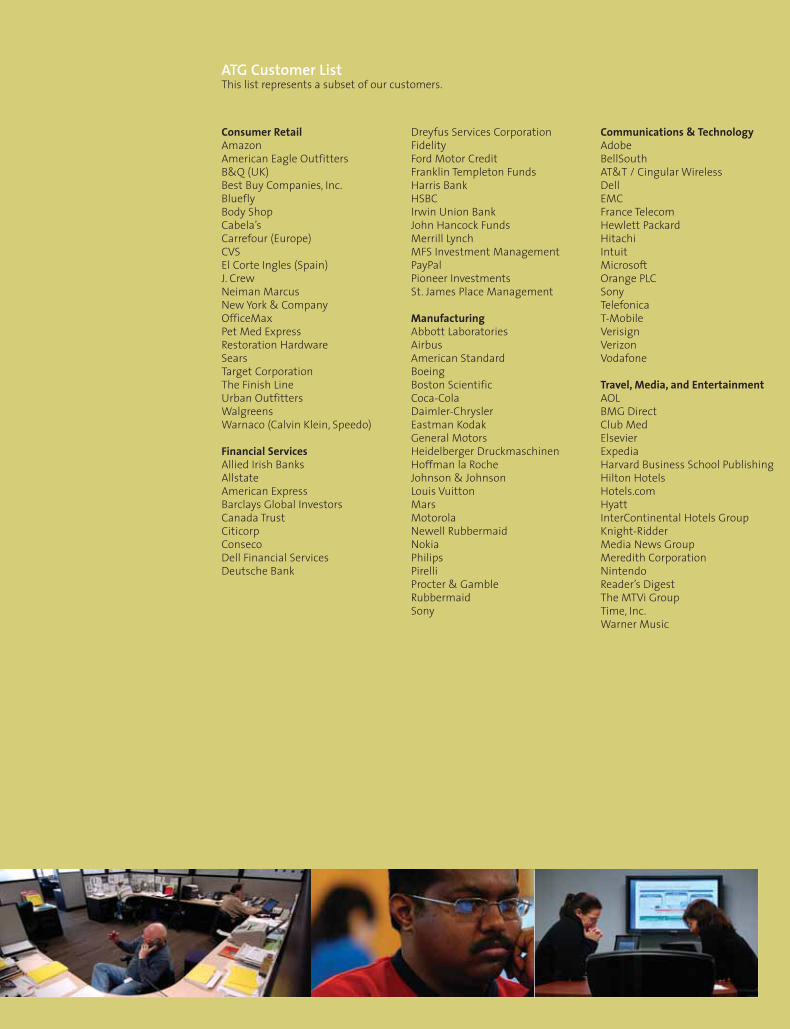
Consumer RetailAmazonAmerican Eagle OutfittersB&Q (UK)Best Buy Companies, Inc.BlueflyBody ShopCabela’sCarrefour (Europe)CVSEl Corte Ingles (Spain)J. CrewNeiman MarcusNew York & CompanyOfficeMaxPet Med ExpressRestoration HardwareSearsTarget CorporationThe Finish LineUrban OutfittersWalgreensWarnaco (Calvin Klein, Speedo)
Financial ServicesAllied Irish BanksAllstateAmerican ExpressBarclays Global InvestorsCanada TrustCiticorpConsecoDell Financial ServicesDeutsche Bank
Dreyfus Services CorporationFidelityFord Motor CreditFranklin Templeton FundsHarris BankHSBCIrwin Union BankJohn Hancock FundsMerrill LynchMFS Investment ManagementPayPalPioneer InvestmentsSt. James Place Management
ManufacturingAbbott LaboratoriesAirbusAmerican StandardBoeingBoston ScientificCoca-ColaDaimler-ChryslerEastman KodakGeneral MotorsHeidelberger DruckmaschinenHoffman la RocheJohnson & JohnsonLouis VuittonMarsMotorolaNewell RubbermaidNokiaPhilipsPirelliProcter & GambleRubbermaidSony
Communications & TechnologyAdobeBellSouthAT&T / Cingular WirelessDellEMCFrance TelecomHewlett PackardHitachiIntuitMicrosoftOrange PLCSonyTelefonicaT-MobileVerisignVerizonVodafone
Travel, Media, and EntertainmentAOLBMG DirectClub MedElsevierExpediaHarvard Business School PublishingHilton HotelsHotels.comHyattInterContinental Hotels GroupKnight-RidderMedia News GroupMeredith CorporationNintendoReader’s DigestThe MTVi GroupTime, Inc.Warner Music
ATG Customer ListThis list represents a subset of our customers.
UNITED STATES SECURITIES AND EXCHANGE COMMISSIONWashington, DC 20549
Form 10-K(Mark One)
¥ ANNUAL REPORT PURSUANT TO SECTION 13 OR 15(d)OF THE SECURITIES EXCHANGE ACT OF 1934For the fiscal year ended December 31, 2006
orn TRANSITION REPORT PURSUANT TO SECTION 13 OR 15(d)
OF THE SECURITIES EXCHANGE ACT OF 1934For the transition period from to
Commission file number 000-26679
Art Technology Group, Inc.(Exact name of registrant as specified in its charter)
Delaware 04-3141918(State or other jurisdiction ofincorporation or organization)
(I.R.S. EmployerIdentification No.)
One Main Street 02142Cambridge, Massachusetts (Zip Code)
(Address of principal executive offices)
(617) 386-1000(Registrant’s telephone number, including area code)
Securities registered pursuant to Section 12(b) of the Act:
Title of Each Class Name of Each Exchange on Which Registered
Common Stock, $0.01 par value with Associated Preferred Stock Purchase Rights The Nasdaq Stock Market, LLC
Securities registered pursuant to Section 12(g) of the Act:None
Indicate by check mark if the registrant is a well-known seasoned issuer, as defined in Rule 405 of the SecuritiesAct. Yes n No ¥
Indicate by check mark if the registrant is not required to file reports pursuant to Section 13 or Section 15(d) of the ExchangeAct. Yes n No ¥
Indicate by check mark whether the registrant (1) has filed all reports required to be filed by Section 13 or 15(d) of the SecuritiesExchange Act of 1934 during the preceding 12 months (or for such shorter period that the registrant was required to file such reports),and (2) has been subject to such filing requirements for the past 90 days. Yes ¥ No n
Indicate by check mark if disclosure of delinquent filers pursuant to Item 405 of Regulation S-K is not contained herein, and willnot be contained, to the best of registrant’s knowledge, in definitive proxy or information statements incorporated by reference inPart III of this Form 10-K or any amendment to this Form 10-K. ¥
Indicate by check mark whether the registrant is a large accelerated filer, an accelerated filer, or a non-accelerated filer. Seedefinition of “accelerated filer” and “large accelerated filer” in Rule 12b-2 of the Exchange Act.
Large accelerated filer n Accelerated filer ¥ Non-accelerated filer n
Indicate by check mark whether the registrant is a shell company (as defined in Rule 12b-2 of the ExchangeAct). Yes n No ¥
As of June 30, 2006 (the last business day of the registrant’s most recently completed second fiscal quarter), the aggregate marketvalue of voting stock held by non-affiliates of the registrant was approximately $332,794,140.
As of March 13, 2007, the number of shares of the registrant’s common stock outstanding was 127,521,957.
Documents Incorporated by Reference
Portions of the registrant’s definitive proxy statement for its annual meeting of stockholders to be held on May 17, 2007 areincorporated by reference in Items 10, 11, 12, 13 and 14 of Part III.

ART TECHNOLOGY GROUP, INC.
INDEX TO FORM 10-K
Page
PART IItem 1. Business . . . . . . . . . . . . . . . . . . . . . . . . . . . . . . . . . . . . . . . . . . . . . . . . . . . . . . . . . . . . . . . 1Item 1A. Risk Factors . . . . . . . . . . . . . . . . . . . . . . . . . . . . . . . . . . . . . . . . . . . . . . . . . . . . . . . . . . . . 10
Item 1B. Unresolved Staff Comments . . . . . . . . . . . . . . . . . . . . . . . . . . . . . . . . . . . . . . . . . . . . . . . . . 18
Item 2. Properties . . . . . . . . . . . . . . . . . . . . . . . . . . . . . . . . . . . . . . . . . . . . . . . . . . . . . . . . . . . . . . 18
Item 3. Legal Proceedings . . . . . . . . . . . . . . . . . . . . . . . . . . . . . . . . . . . . . . . . . . . . . . . . . . . . . . . . 18
Item 4. Submission of Matters to a Vote of Security Holders . . . . . . . . . . . . . . . . . . . . . . . . . . . . . . 19
PART IIItem 5. Market for Registrant’s Common Equity, Related Stockholder Matters and Issuer Purchases
of Equity Securities . . . . . . . . . . . . . . . . . . . . . . . . . . . . . . . . . . . . . . . . . . . . . . . . . . . . . . . 20
Item 6. Selected Consolidated Financial Data . . . . . . . . . . . . . . . . . . . . . . . . . . . . . . . . . . . . . . . . . . 20
Item 7. Management’s Discussion and Analysis of Financial Condition and Results of Operations . . . 23
Item 7A. Quantitative and Qualitative Disclosures About Market Risk . . . . . . . . . . . . . . . . . . . . . . . . . 35
Item 8. Consolidated Financial Statements and Supplementary Data . . . . . . . . . . . . . . . . . . . . . . . . . 36
Item 9. Changes in and Disagreements with Accountants on Accounting and Financial Disclosure . . . 70
Item 9A. Controls and Procedures . . . . . . . . . . . . . . . . . . . . . . . . . . . . . . . . . . . . . . . . . . . . . . . . . . . 70
Item 9B. Other Information . . . . . . . . . . . . . . . . . . . . . . . . . . . . . . . . . . . . . . . . . . . . . . . . . . . . . . . . 73
PART IIIItem 10. Directors, Executive Officers and Corporate Governance . . . . . . . . . . . . . . . . . . . . . . . . . . . . 73
Item 11. Executive Compensation . . . . . . . . . . . . . . . . . . . . . . . . . . . . . . . . . . . . . . . . . . . . . . . . . . . 74
Item 12. Security Ownership of Certain Beneficial Owners and Management and Related StockholderMatters . . . . . . . . . . . . . . . . . . . . . . . . . . . . . . . . . . . . . . . . . . . . . . . . . . . . . . . . . . . . . . . . 74
Item 13. Certain Relationships and Related Transactions and Director Independence . . . . . . . . . . . . . . 74Item 14. Principal Accountant Fees and Services . . . . . . . . . . . . . . . . . . . . . . . . . . . . . . . . . . . . . . . . 74
PART IVItem 15. Exhibits and Financial Statement Schedules . . . . . . . . . . . . . . . . . . . . . . . . . . . . . . . . . . . . . 75
SIGNATURESSignatures . . . . . . . . . . . . . . . . . . . . . . . . . . . . . . . . . . . . . . . . . . . . . . . . . . . . . . . . . . . . . . 76
References in this Report to “we,” “us,” “our” and “ATG” refer to Art Technology Group, Inc. and itssubsidiaries. ATG and Art Technology Group are our registered trademarks, and ATG Wisdom is our trademark.This Report also includes trademarks and trade names of other companies.
i

PART I
Some of the information contained in this Report consists of “forward-looking statements” within the meaningof the Private Securities Litigation Reform Act of 1995. Use of words such as “believes,” “expects,” “anticipates,”“intends,” “plans,” “estimates,” “should,” “likely” or similar expressions indicate a forward-looking statement.These statements are subject to risks and uncertainties and are based on the beliefs and assumptions of ourmanagement based on information currently available to our management. Important factors that could causeactual results to differ materially from the forward-looking statements include, but are not limited to, those set forthbelow under the heading “Risk Factors.” We assume no obligation to update any forward-looking statements.
Item 1. Business
Our Business
We develop and market a comprehensive suite of e-commerce software products, as well as provide relatedservices, including support and maintenance, education, application hosting, professional services and proactiveconversion solutions for enhancing online sales and support. Our customers use our products and services to powertheir e-commerce websites, attract prospects, convert sales, and offer ongoing customer care services. Our solutionsare designed to provide a scalable, reliable and sophisticated e-commerce website for our customers to create asatisfied, loyal and profitable online customer base.
Corporate Information
We were incorporated in 1991 in the State of Delaware and have been a publicly traded corporation since 1999.Our corporate headquarters are at One Main Street, Cambridge, Massachusetts 02142. We have domestic offices inChicago, Illinois; New York, New York; Washington, D.C.; Reston, Virginia; San Francisco, California; andSeattle, Washington; and international offices in the Canada; France; Northern Ireland; Singapore; and UnitedKingdom. As of December 31, 2006, we had a total of 378 employees and we have more than 900 customers. OurInternet web site address is www.atg.com.
Overview
We provide software and services that help online businesses increase their revenues. We seek to differentiateourselves by enabling businesses to use our solutions to provide a richer, more personalized and more compellingonline shopping experience. This provides their merchandisers and marketers more control over the online channel,and enables customer service agents to provide consumers more consistent, personalized and relevant assistance.Our solutions deliver better consistency and relevancy by capturing and maintaining information about customers’personal preferences, online activity, and transaction history, and by using this information to deliver morepersonalized and contextual content.
Through our eStara subsidiary, we deliver OnDemand services for multi-channel interaction. Our Click to Calland Click to Chat services provide online businesses with proactive conversion solutions for enhancing online salesand support. eStara solutions allow customers to initiate a conversation with a sales person or customer care agentby clicking a button on a website, e-mail, banner ad or directory listing, and eStara’s Call Tracking solutions allowadvertisers to track the source of each in-bound call as well as information about callers. We seek to differentiateourselves by providing enterprise-class solutions suitable for higher-volume, more demanding applications.
We market our products and services primarily to Global 2000 companies and other businesses that have alarge number of online users and utilize the Internet as an important business channel. We focus primarily onproviding our software and services to businesses in the retail, consumer products, manufacturing, media andentertainment, telecommunications, financial services, travel and high technology industries. We have over 900customers, including Amazon, American Eagle Outfitters, American Express, AOL, AT&T, Best Buy, B&Q,Cabelas, Carrefour, Cingular, Coca-Cola, Continental Airlines, Dell, DirecTV, El Corte Ingles, Expedia, FranceTelecom, Harvard Business School Publishing, Hewlett-Packard, Intuit, Hilton, HSBC, J. Crew, LL Bean, Macy’s,Meredith, Microsoft, Neiman Marcus, New York & Company, Nike, Nokia, OfficeMax, PayPal, Philips, Procter &Gamble, Sears, Sony, Symantec, T Mobile, Target, Urban Outfitters, Verizon, Viacom, Vodafone and Walgreens.
1
Our business has evolved significantly since our incorporation in 1991:
• Until 1995, we functioned primarily as a professional services organization in the Internet commercemarket.
• In 1996, we began offering Internet commerce and software solutions, initially focusing on infrastructureproducts, such as our ATG Dynamo Application Server.
• In 2004, we began to concentrate on developing application products, having concluded that the market forinfrastructure products had become increasingly standards driven and that we could best differentiateourselves by offering our clients advanced applications functionality.
• In November 2004, we acquired Primus Knowledge Solutions, Inc. (“Primus”), a provider of softwaresolutions for customer service designed to help companies deliver a superior customer experience viacontact centers, e-mail and web self-service. The Primus solutions extended ATG’s offerings beyondcommerce and marketing and into customer service.
• In 2004, we also began to offer our clients hosted services, also known as software-as-a-service, as analternative delivery model for our application solutions. We believe that hosted services can providesignificant advantages for our clients, and provide us with a substantial opportunity for growth.
• In 2005, we completed the integration of Primus applications into the ATG platform, in what we call ourWisdom strategy.
• In October 2006, we acquired eStara, Inc. (“eStara”), a provider of proactive conversion solutions forenhancing online sales and support initiatives. The eStara solutions provided us with a new channel to helpour clients convert web browsing activities into sales, as well as business opportunities independent of ATG-powered websites.
Our Strategy
Our objective is to be the industry leader in helping businesses do more business on the Internet. We intend toachieve this objective by implementing the following key components of our strategy:
• Deliver a commerce platform with leadership functionality, suitable for the most demanding enterprises.Our clients tell us that, in some cases, our platform delivers over 100,000 orders per day in peak periods.Leading industry analysts rank our overall offering number one among commerce platforms forbusiness-to-consumer sites, including reliability and scalability, administration and management, cata-log/content management, campaign management and customer self-service. It is our objective to continue toprovide leadership in e-commerce functionality and operational excellence.
• Through application hosting services, provide the same quality platform to mid-tier companies and otherswho opt to outsource their e-commerce operations. For clients that do not wish to expend resources onrunning e-commerce and e-business applications in-house, we offer hosting services for the full spectrum ofATG applications, which we call ATG OnDemand. Clients can purchase licenses to our solutions and electan OnDemand managed services model where we host the client’s solutions in our hosted environment. Orclients can elect an OnDemand subscription model, which requires neither an investment in softwarelicenses, nor support and maintenance agreements. With the OnDemand subscription model, we provide afull solution for the client, including the software, hardware and management. There are several advantagesfor organizations to choose an OnDemand hosting model, which makes this a potential growth area for us.These include:
• leveraging our experience to accelerate growth of the client’s online business and allowing clients to focuson their core competencies;
• shifting the client’s technology risks to us;
• shortening the time to market (vs. in-house development, deployment and maintenance); and
• avoiding upfront and ongoing expenditures required to purchase and maintain software and hardware.
2
• Differentiate by providing a more personalized, more relevant, more consistent shopping experience. Wegive merchandisers and marketers the power and analytics to define offers and cross-sells, to follow up onabandoned shopping carts, to perform A/B split tests and to create multi-channel, multi-stage web and e-mailcampaigns that match a company’s selling strategy with information about a visitor’s browsing behavior,purchase and interaction history, preferences and profile. This increases basket size and the number ofwebsite visitors who go on to purchase items from that website, resulting in increased revenue. We use thissame information to extend the consistent customer experience to the customer service agent in the callcenter, which results in a more satisfied, loyal and profitable customer.
• Through our eStara subsidiary, deliver solutions independent of the choice of web platform. Our eStaraproactive conversion solutions can be delivered to clients who are using any e-commerce platform, orcustom-built websites, across all industries. This enlarges the size of our market opportunity and customerpenetration.
• Leverage existing sales channels. We sell our products primarily through our direct sales organization. Inaddition, a significant portion of our revenue is co-sold or influenced by a variety of business partners,including systems integrators, solution providers and other technology partners. We currently have a broadrange of business alliances throughout the world, such as Accenture, Capgemini, Deloitte Consulting, HPConsulting and Tata Consultancy Services, as well as regional integrators and interactive agencies such asaQuantive, BlastRadius, imc2, CGI (EMEA), LBi Group (EMEA), McFadyen Consulting, ProfessionalAccess, Resource Interactive and D2C2 (Taiwan). In most geographies and situations, our goal is both tomaintain close relationships directly with our clients while also motivating systems integrators and otherchannel partners to implement our applications in their projects and solution sets.
• Leverage and expand our service capabilities. We have extensive experience in web application devel-opment and integration services, as well as knowledge management design and call-center systemsdeployment. Through our Professional and Education Services organizations, we provide services to trainour systems integrators, value added resellers and complementary software vendors in the use of ourproducts and offer consulting services to assist with customer implementations. We seek to motivate ourbusiness partners to provide joint implementation services to our end user customers. We intend to continueto seek additional opportunities to increase revenues from product sales by expanding our base of businesspartners trained in the implementation and application of our products.
ATG Licensed Products
We provide a comprehensive e-commerce product suite designed to enable our clients to attract visitors,convert them to buyers, deliver customer service and analyze the results. The products that comprise ourcomprehensive e-commerce product suite are as follows:
ATG Commerce is a comprehensive, highly scalable e-commerce platform. Its flexible, component-basedarchitecture enables our clients to personalize the online buying experience for their customers so thatcustomers can more easily find desired products, comparison shop, register for gifts, pre-order products,redeem coupons and execute other useful features. ATG Commerce’s functionality includes catalogs, productmanagement, shopping carts, checkout, pricing management, merchandising, promotions, inventory man-agement and business-to-business order management.
The ATG Adaptive Scenario Engine (ASE) is a platform that provides the enabling technology and corefunctionality to allow our clients to develop and manage robust, adaptable, scalable and personalizede-commerce applications across channels and through the complete customer lifecycle. The ATG platformis designed to allow our clients to easily integrate these applications across their marketing/merchandising,e-commerce and customer care organizations.
ATG Commerce Search is a dynamic, integrated search solution that incorporates natural languagetechnology into our clients’ online storefronts. ATG Commerce Search is designed to enable shoppers tonavigate our clients’ e-commerce sites quickly and efficiently to find merchandise they want and discover newitems, as well as make purchases directly from the search results page.
3
ATG Merchandising enables our clients’ merchandising professionals to directly manage their onlinestorefronts — including catalogs, products, search facets, promotions, pricing, coupons and special offers —to help quickly connect shoppers with the items most likely to interest them.
ATG Content Administration is a comprehensive web content management solution to support person-alized websites throughout the entire content process, including creation, version tracking, preview, editing,revision, approval and site deployment.
ATG Outreach is an e-marketing and proactive service solution that leverages customer informationgained through web interactions, preferences and behaviors to enable our clients to create relevant, person-alized outbound marketing and service campaigns.
ATG Self-Service offers consumers access to personalized answers to questions and helps the customeranswer his or her questions without telephoning for help. ATG Self-Service combines an answer repositorywith multi-lingual natural language search and navigation capabilities. The application also offers compre-hensive business reporting that helps clients better understand customers’ needs and preferences.
ATG Commerce Assist provides complete e-commerce support for call center agents to create and manageorders in a unified browser based application for the web and call-center environments.
ATG Response Management is a solution for automating responses to inbound electronic communica-tions, enabling our clients to provide answers to customer inquiries via e-mail, web forms, chat, shortmessaging service (SMS) or multimedia messaging service (MMS). ATG Response Management’s catego-rization capabilities assess an inquiry, then either send an automated response or route the inquiry to the agentbest skilled to handle the issue.
ATG Knowledge is a knowledge management solution that call center agents and help-desk personnelwho provide customers with assisted service can use to find the answers to customer inquiries and resolveproblems. ATG Knowledge enables our clients’ agents to fulfill a wide range of customer needs by unifyingcustomer management, knowledge management and incident management into a single solution.
ATG Campaign Optimizer assists marketing professionals in defining comparative tests of differentoffers, promotions and product representations through an A/B split testing solution. The product puts thosetests into production, specifying the segments of website visitors to be tested, and finally writes reports on thetest results. Methods for testing campaigns provided by our competitors often require programming by expertdevelopers, and sometimes even involve network infrastructure modifications. ATG Campaign Optimizer isdesigned to allow non-technical marketing professionals to create and execute comparative tests that can beused to increase the effectiveness of online marketing activities without the need for expert programming orinfrastructure modifications.
ATG Customer Intelligence is an integrated set of datamart and reporting capabilities to monitor andanalyze commerce and customer care performance. It is designed to combine key data from the ATG productsuite, such as purchases, searches, escalations and click-throughs, with behavioral data from web trafficanalysis and demographic data, such as age, gender and geography.
Our products allow companies to present a single view of themselves to their customers through our repositoryintegration. This integration technology is designed to allow companies to easily access and utilize data in theenterprise regardless of the data storage format or location. The data can be leveraged in native form without havingto move, duplicate or convert the data. By enabling these capabilities in a cost-effective manner, we believe ourproducts can help companies protect their brands and keep their customers from becoming confused or frustrated,all of which positively impact customer satisfaction and loyalty.
4
We support the adoption of open application server infrastructure by our existing and new clients and workclosely with other application server, operating system and database vendors to increase the value customers receivefrom our products on a variety of popular infrastructure components.
OnDemand Service Offerings
We offer OnDemand delivery of e-commerce and customer care with our ATG OnDemand service offerings.The ATG OnDemand offerings are available on a subscription and managed services basis. We also offerOnDemand multi-channel customer interaction through our eStara subsidiary.
Subscription Services. We offer our clients hosting services for the full spectrum of ATG applications. Theseservices include the provisioning, management and monitoring of the application infrastructure including band-width, network, security, servers, operating systems, enabling software and ATG applications. ATG OnDemandsubscription services (also known as software-as-a-service, or SaaS) require neither an investment in softwarelicenses nor maintenance agreements. The customer pays an initial set-up fee, and after a brief implementationperiod the solution is managed in our data center. For the OnDemand subscription offerings, we control theimplementation and management process. We support our hosted clients on a 24/7 basis by providing problemresolution services, application change management services, and the support for service level agreements relatedto application availability.
Managed Services. Through our OnDemand Managed Services program, we make our application hostingservices available for a fee to clients that have purchased ATG software licenses and maintenance agreements. TheOnDemand Managed Services program shifts the client’s technology risk to us and leverages our domain expertise.
eStara Service Offerings
In October 2006, we acquired eStara, Inc., a provider of proactive conversion solutions for enhancing onlinesales and support initiatives. Like the ATG OnDemand offerings, the eStara offerings are hosted on our servers;however, eStara’s products are platform independent, so a client can benefit from eStara’s products whether it electsto run its online environment on an ATG-powered e-commerce platform, another e-commerce platform or a custombuilt website.
eStara Click to Call is designed to allow online prospects and customers to transition seamlessly within thecontext of their online session into immediate telephone or PC-based voice contact with businesses. Web sitevisitors, e-mail recipients or viewers of a banner ad simply click a Click to Call button and select PC-to-phone orphone-to-phone to connect in real-time with our clients’ sales or customer service agents.
eStara Click to Chat allows online prospects and customers to initiate a text chat session online with ourclients’ sales or customer service agents by simply clicking a Click to Chat button.
eStara Call Tracking is designed to allow our clients to accurately track the source of inbound telephoneresponses to their print and online promotional campaigns.
Support and Services
Our services organization provides a variety of consulting, design, application development, deployment,integration, hosting, training, and support services in conjunction with our products. We provide these servicesthrough our Customer Support Services, Professional Services and Education Services groups.
Customer Support and Maintenance Services. We offer four levels of customer support and maintenanceincluding our Premium Support Program, which consists of access to technical support engineers 24/7, forcustomers deploying mission critical applications. For an annual support and maintenance fee, customers areentitled to receive software updates, maintenance releases, online documentation and eServices including bugreports and unlimited technical support.
Professional Services. The primary goal of our Professional Services organization is to ensure customersatisfaction and the successful implementation of our application solutions. ATG Professional Services has
5
developed an Adaptive Delivery Framework (ADF) to ensure consistent, high-quality service delivery throughoutall our project engagements. The ADF is used to create repeatable delivery processes from project to project in orderto provide a consistent look and feel for all ATG project deliverables. Our Professional Services include fourprimary service offerings:
• OnDemand Offerings. By leveraging our experience with the pre-built OnDemand offerings, our Pro-fessional Services organization assists our clients with their ATG implementations, thus helping our clientsquickly and economically launch their e-commerce and service projects.
• Full-lifecycle Solutions. We work with our clients from the earliest stages of their projects. The full-lifecycle approach encompasses everything from working with our clients’ end users and technical staff todefine project requirements to solution design, implementation, usability testing, staging and deployment.
• Custom Solutions. We can also manage specific areas of our clients’ projects, such as designing a solutionto meet a client’s requirements, implementing scenarios or integrating our solutions with a third-partyapplication.
• Structured Enablement. In this model, we give our clients the guidance they need while maximizing theskills of the clients’ own personnel. Depending on a client’s project goals and the expertise of its team,appropriate ATG personnel (such as architects or engineers) work onsite as advisors to aid the client’spersonnel in areas such as reviewing completed work or advising on a particular project area.
Education Services. We provide a broad selection of educational programs designed to train clients andpartners on our applications. This curriculum addresses the educational needs of developers, technical managers,business managers, and system administrators. ATG Education Services also offers an online learning program thatcomplements our instructor-led training. Developers can become certified on our products by taking a certificationexam in a proctored environment. We also measure partner quality using a partner accreditation program thatensures ATG partners have the skills necessary to effectively assist our clients with implementations. We provide afull range of instructor-led solutions to assist clients with these key initiatives.
6
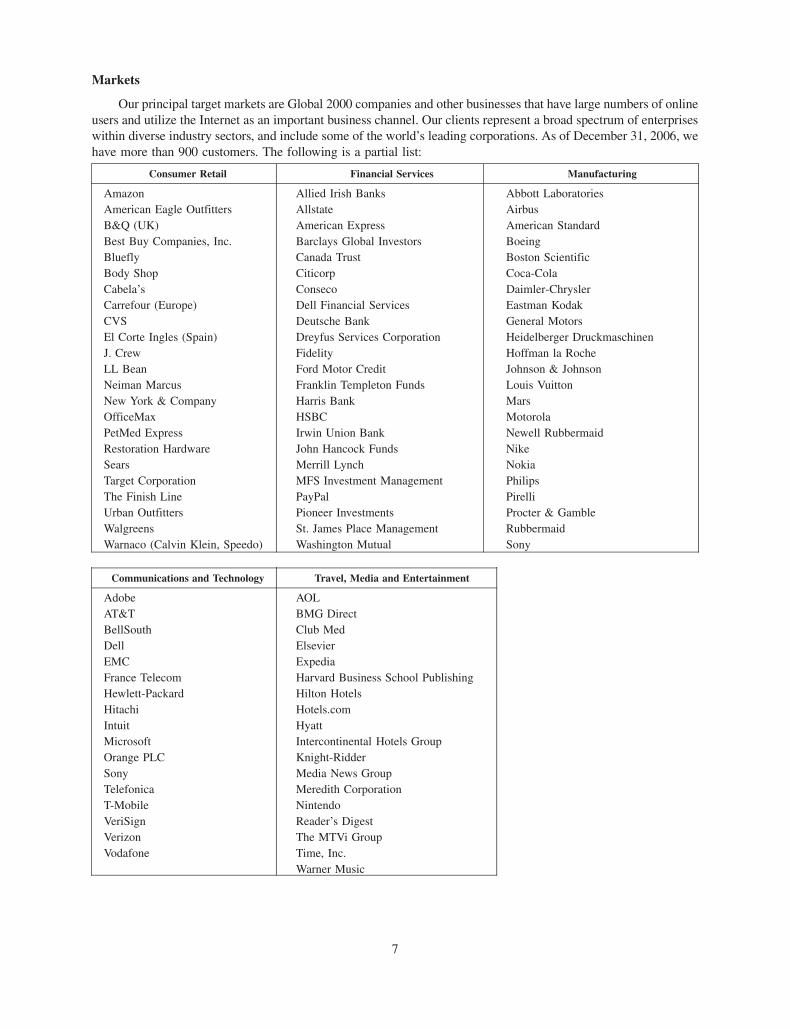
Markets
Our principal target markets are Global 2000 companies and other businesses that have large numbers of onlineusers and utilize the Internet as an important business channel. Our clients represent a broad spectrum of enterpriseswithin diverse industry sectors, and include some of the world’s leading corporations. As of December 31, 2006, wehave more than 900 customers. The following is a partial list:
Consumer Retail Financial Services Manufacturing
Amazon Allied Irish Banks Abbott LaboratoriesAmerican Eagle Outfitters Allstate AirbusB&Q (UK) American Express American StandardBest Buy Companies, Inc. Barclays Global Investors BoeingBluefly Canada Trust Boston ScientificBody Shop Citicorp Coca-ColaCabela’s Conseco Daimler-ChryslerCarrefour (Europe) Dell Financial Services Eastman KodakCVS Deutsche Bank General MotorsEl Corte Ingles (Spain) Dreyfus Services Corporation Heidelberger DruckmaschinenJ. Crew Fidelity Hoffman la RocheLL Bean Ford Motor Credit Johnson & JohnsonNeiman Marcus Franklin Templeton Funds Louis VuittonNew York & Company Harris Bank MarsOfficeMax HSBC MotorolaPetMed Express Irwin Union Bank Newell RubbermaidRestoration Hardware John Hancock Funds NikeSears Merrill Lynch NokiaTarget Corporation MFS Investment Management PhilipsThe Finish Line PayPal PirelliUrban Outfitters Pioneer Investments Procter & GambleWalgreens St. James Place Management RubbermaidWarnaco (Calvin Klein, Speedo) Washington Mutual Sony
Communications and Technology Travel, Media and Entertainment
Adobe AOLAT&T BMG DirectBellSouth Club MedDell ElsevierEMC ExpediaFrance Telecom Harvard Business School PublishingHewlett-Packard Hilton HotelsHitachi Hotels.comIntuit HyattMicrosoft Intercontinental Hotels GroupOrange PLC Knight-RidderSony Media News GroupTelefonica Meredith CorporationT-Mobile NintendoVeriSign Reader’s DigestVerizon The MTVi GroupVodafone Time, Inc.
Warner Music
7
Research and Development
Our research and development group is responsible for core technology, product architecture, productdevelopment, quality assurance, documentation and third-party software integration. This group also assists withpre-sale, customer support activities and quality assurance tasks supporting the services and sales organizations.
Since we began focusing on selling software products in 1996, the majority of our research and developmentactivities have been directed towards creating new versions of our products, which extend and enhance competitiveproduct features. In 2006, we focused primarily on developing new and innovative applications, as well asdeveloping and enhancing our new OnDemand offerings.
Sales and Marketing
We market and sell our products and services primarily through our direct sales force, which is compensatedbased on product and services sales made to our clients, directly or through business partners. We also sell productsand services through channel partners, including systems integrators and other technology partners. The majority ofour revenue is from direct sales.
Our sales and service organization includes employees in direct and channel sales, system engineers andaccount management. As of December 31, 2006, we had approximately 93 employees in our sales and supportorganization, including 54 direct and channel sales representatives whose performance is measured on the basis ofachievement of quota objectives.
To support our sales efforts and promote the ATG brand, we conduct comprehensive marketing programs.These programs include industry and partner events, market research, public relations activities, seminars,advertisements, direct mailings and the development of our website. Our marketing organization supports thesales process and helps identify key strategic alliances and other opportunities. They prepare product research,product planning, manage press coverage and other public relations. As of December 31, 2006, we had 16employees in our global marketing organization, which is a component of our sales and marketing organization.
As of December 31, 2006, in addition to offices throughout the United States, we had sales offices located inthe United Kingdom, France, Canada and Singapore.
Strategic Alliances
We have established strategic alliances with system integrators, technology partners and resellers to augmentour direct sales activities. We provide our systems integrators, technology partners and resellers with sales andtechnical training in order to encourage them to create demand for our products and services and to extend ourpresence globally and regionally. In addition, we encourage our channel partners to enroll in our accreditation andcertification programs. Our ATG Certified Professional Program is a training program for developers to learn moreabout our products and services, and our ATG Accredited Partner Program is intended to identify our most qualifiedpartners.
Competition
The market for online sales, marketing and customer service solutions is intensely competitive, subject to rapidtechnological change, and significantly affected by new product introductions and other market activities. Weexpect competition to persist and intensify in the future. We currently have the following primary sources ofcompetition:
• in-house development efforts by potential clients or partners;
• e-commerce application vendors, such as IBM and Escalate Retail;
• e-commerce business process outsourcers, such as Digital River and GSI Commerce;
• hosting managed service providers, such as Accenture, EDS and IBM;
8
• hosting on-demand subscription service providers, such as Demandware, Digital River, MarketLive andVenda;
• marketing and customer-service application vendors, including natural language, self-service and traditionalcustomer relationship management application vendors; and
• proactive solutions vendors, such as LivePerson.
We compete against these alternative products and services by providing a solution that enables our clients toprovide their customers with an integrated customer experience for online sales, marketing and customer service.We believe our solutions provide our clients with a rapid return on investment, attractive long-term total cost ofownership, a way to present a single view of themselves to their customers, the ability to improve the productivityand effectiveness of customer interactions, and the flexibility to adapt to rapidly changing and often unpredictablemarket needs.
We seek to provide our clients with a rapid return on investment through out-of-the-box functionality foronline sales (e-commerce), marketing and service built on a flexible, component architecture that is practical andcost-effective to customize. These capabilities enable our clients to get to market quickly in a manner that exploitstheir competitive advantages, which helps drive their return on investment.
Proprietary Rights and Licensing
Our success and ability to compete depends on our ability to develop and protect the proprietary aspects of ourtechnology and to operate without infringing on the proprietary rights of others. We rely on a combination of patent,trademark, trade secret and copyright law and contractual restrictions to protect our proprietary technology. AtDecember 31, 2006, we had ten issued United States and seven issued European patents covering our technology,and we have eleven additional patent applications pending. In addition, we have several trademarks that areregistered or pending registration in the United States or abroad. We seek to protect our source code for oursoftware, documentation and other written materials under trade secret and copyright laws. However, these legalprotections afford only limited protection for our technology.
We license our software pursuant to signed master license agreements, as well as “click through” or “shrinkwrap” agreements, which impose restrictions on the licensee’s ability to use the software, such as prohibitingreverse engineering and limiting the use of copies. We also seek to avoid disclosure of our intellectual property byrequiring employees and consultants with access to our proprietary information to execute confidentiality agree-ments and by restricting access to our source code. Due to rapid technological change, we believe that factors suchas the technological and creative skills of our personnel, new product developments and enhancements to existingproducts are more important than legal protections to establish and maintain a technology leadership position.
Employees
As of December 31, 2006, we had a total of 378 employees. Our success depends on our ability to attract, retainand motivate highly qualified technical and management personnel, for whom competition is intense. Ouremployees are not represented by any collective bargaining unit, and we have never experienced a work stoppage.We believe our relations with our employees are good.
Internet Address and SEC Reports
We are registered as a reporting company under the Securities Exchange Act of 1934, as amended, which werefer to as the Exchange Act. Accordingly, we file or furnish with the Securities and Exchange Commission, or theCommission, annual reports on Form 10-K, quarterly reports on Form 10-Q and current reports on Form 8-K asrequired by the Exchange Act and the rules and regulations of the Commission. We refer to these reports as PeriodicReports. The public may read and copy any Periodic Reports or other materials we file with the Commission at theCommission’s Public Reference Room at 100 F Street, NE, Washington, DC 20549. Information on the operation ofthe Public Reference Room is available by calling 1-800-SEC-0330. In addition, the Commission maintains anInternet website that contains reports, proxy and information statements and other information regarding issuers,
9
such as Art Technology Group, that file electronically with the Commission. The address of this website ishttp://www.sec.gov.
Our Internet website is www.atg.com. We make available, free of charge, on or through our Internet websiteour Periodic Reports and amendments to those Periodic Reports as soon as reasonably practicable after weelectronically file them with the Commission. We are not, however, including the information contained on ourwebsite, or information that may be accessed through links on our website, as part of, or incorporating it byreference into, this annual report on Form 10-K.
Item 1A. Risk Factors
The following are certain of the important factors that could cause our actual operating results to differmaterially from those indicated or suggested by forward-looking statements made in this annual report onForm 10-K or presented elsewhere by management from time to time.
We expect our revenues and operating results to continue to fluctuate for the foreseeable future. If ourquarterly or annual results are lower than the expectations of securities analysts, then the price of ourcommon stock is likely to fall.
Our revenues and operating results have varied from quarter to quarter in the past and will probably continue tovary significantly from quarter to quarter in the foreseeable future. A number of factors are likely to cause variationsin our operating results, including:
• the timing of sales and revenue recognition of our products and services, which are affected by the mix oflicensed, hosted and subscription-based sales in a period; depending on our sales terms with our customers,we expect to recognize an increasing portion of our revenue ratably over a period of time rather than at thetime of invoice;
• the timing of customer orders, especially larger transactions, and product implementations;
• fluctuating economic conditions, particularly as they affect our customers’ willingness to implement newe-commerce solutions;
• delays in introducing new products and services;
• the size of price discounting and concessions;
• changes in the mix of revenues derived from products and services;
• timing of hiring and utilization of personnel;
• cost overruns related to fixed-price services projects;
• the mix of domestic and international sales;
• variation in our actual costs from our cost estimates related to long term hosting contracts;
• increased expenses, whether related to sales and marketing, product development or administration; and
• costs related to possible acquisitions of technologies or businesses.
In any given quarter, we often depend on several relatively large license transactions to meet expected revenuesfor that quarter. If we expect to complete a large sale to a specific customer in a particular quarter and the sale is notcompleted in that quarter, then we are not likely to be able to generate revenue from alternate sources in time tocompensate for the shortfall. In addition, as is the case with many software companies, a significant portion of oursales are concentrated near the end of each fiscal quarter. If we are unable to close or recognize revenues on even arelatively small number of license deals at quarter-end, then we may not be able to meet expected revenues for thatquarter. Because of this concentration of sales at quarter end, our more sophisticated customers may be successful inpressuring us to give them higher price discounts than we might otherwise provide by waiting until quarter-end tocomplete their transactions with us.
10
Our management has concluded that there were material weaknesses in our internal control over finan-cial reporting which could undermine our investors’ confidence in our financial statements.
Section 404 of Sarbanes Oxley Act of 2002 requires that we annually evaluate and report on our systems ofinternal controls and that our independent registered public accounting firm must report on management’sevaluation of those controls. Our management has concluded that material weaknesses in our internal controlover financial reporting, specifically relating to inadequate and ineffective controls over the financial statementclose process and inadequate staffing within the accounting organization, existed as of December 31, 2006. As aresult of these material weaknesses, our management concluded that we did not maintain effective internal controlover financial reporting as of December 31, 2006. Our independent registered public accounting firm, Ernst &Young LLP, has concurred with management’s assessment. Our management’s report on our internal control overfinancial reporting and the report of Ernst & Young LLP thereon appear in Item 9A of this annual report onForm 10-K.
A material weakness is a control deficiency, or a combination of control deficiencies, that results in more than aremote likelihood that a material misstatement of the annual or interim financial statements will not be prevented ordetected. If the presence of these material weaknesses in our internal controls over financial reporting undermineinvestor confidence in the quality of our financial reporting, the market price of our common stock could beadversely affected. We cannot assure you that the remedial actions we have undertaken, as described in Item 9A,will be adequate to promptly and completely correct the reported deficiencies.
We may not be able to sustain or increase our revenue or attain profitability on a quarterly or annualbasis.
We incurred losses in five of the most recent 12 quarters preceding December 31, 2006, and we had anaccumulated deficit of $191.6 million as of December 31, 2006. We operate in a rapidly evolving industry, whichmakes it more difficult to predict our future operating results. We cannot be certain that our revenues will grow orour expenses will decrease at rates that will allow us to achieve profitability on a quarterly or annual basis.Additionally, we expect to recognize an increasing portion of our revenue ratably over a period of time rather than atthe time of invoice. In the near term, this may have an adverse effect on our revenue and net income, which couldresult in a decline in the price of our common stock.
Our lengthy sales cycle makes it difficult to predict our quarterly results and causes variability in ouroperating results.
We have a long sales cycle, often several months or quarters, because our clients often need to make largeexpenditures and invest substantial resources in order to take advantage of our products and services and alsobecause we generally need to educate potential customers about the use and benefits of our products and services.This long sales cycle makes it difficult to predict the quarter in which sales may occur. We may incur significantsales and marketing expenses in anticipation of selling our products, and if we do not achieve the level of revenueswe expected, our operating results will suffer and our stock price may decline. Further, our potential customersfrequently need to obtain approvals from multiple decision makers before making purchase decisions. Delays insales could cause significant variability in our revenues and operating results for any particular period.
Our common stock price has historically been volatile and will probably continue to be volatile.
The market price of our common stock has ranged from $0.58 per share to $126.88 per share since our initialpublic offering in July 1999 and has ranged from $1.83 per share to $3.81 per share between January 1, 2006 andDecember 31, 2006. Fluctuations in market price and volume are particularly common among securities of softwarecompanies. The market price of our common stock may fluctuate significantly in response to the following factorsamong others, some of which are beyond our control:
• variations in our quarterly operating results, in particular, our ability to meet the expectations of brokeragefirms, industry analysts and investors;
• changes in market valuations of software companies;
11

• our announcement of significant contracts, acquisitions, strategic partnerships, joint ventures or capitalcommitments;
• timing of completion of significant sales;
• additions or departures of our key personnel; or
• future sales of our common stock.
If the market for e-commerce does not continue to grow, then demand for our products and services maydecrease.
Our success depends heavily on the continued use of the Internet for e-commerce. Many companies continueto rely primarily or exclusively on traditional means of commerce and may be reluctant to change their patterns ofcommerce. For our customers and potential customers to be willing to invest in our electronic commerce and onlinemarketing, sales and service applications, the Internet must continue to be accepted and widely used for commerceand communication. If Internet commerce does not grow or grows more slowly than expected, then our futurerevenues and profits may not meet our expectations or those of analysts.
If we fail to adapt to rapid changes in the market for online business applications, then our products andservices could become obsolete.
The market for our products is constantly and rapidly evolving, as we and our competitors introduce new andenhanced products, retire older ones, and react to changes in Internet-related technology and customer demands,coalescence of product differentiators, product commoditization and evolving industry standards. We may not beable to develop or acquire new products or product enhancements that comply with present or emerging Internettechnology standards or differentiate our products based on functionality and performance. In addition, we may notbe able to establish or maintain strategic alliances with operating system and infrastructure vendors that will permitmigration or upgrade opportunities for our current user base. New products based on new technologies or newindustry standards could render our existing products obsolete and unmarketable.
To succeed, we need to enhance our current products and develop new products on a timely basis to keep pacewith market needs, satisfy the increasingly sophisticated requirements of customers and leverage strategic allianceswith third parties in the e-commerce field who have complementary or competing products. E-commercetechnology is complex, and new products and product enhancements can require long development and testingperiods. Any delays in developing and releasing new or enhanced products could cause us to lose revenueopportunities and customers.
We face intense competition in the market for online commerce applications and services, and we expectcompetition to intensify in the future. If we fail to remain competitive, then our revenues may decline,which could adversely affect our future operating results and our ability to grow our business.
A number of competitive factors could cause us to lose potential sales or to sell our products and services atlower prices or at reduced margins, including, among others:
• Potential clients or partners may choose to develop e-commerce applications in-house, rather than paying forour products or services.
• Some of our current and potential competitors have greater financial, marketing and technical resources thanwe do, allowing them to leverage a larger installed customer base and distribution network, adopt moreaggressive pricing policies and offer more attractive sales terms, adapt more quickly to new technologies andchanges in customer requirements, and devote greater resources to the promotion and sale of their productsand services than we can.
• Our suite of service products competes against various vendor software tools designed to address a specificelement or elements of the complete set of eService processes, including e-mail management, support,knowledge management, and web-based customer self-service and assisted service.
12
• Current and potential competitors have established or may establish cooperative relationships amongthemselves or with third parties to enhance their products and expand their markets. Accordingly, newcompetitors or alliances among competitors may emerge and rapidly acquire significant market share.
• Some of our current and potential competitors, especially our larger competitors like IBM that offer broadsuites of computer and software applications may offer free or low-cost e-commerce applications andfunctionality bundled with their own computer and software products. Potential customers may not see theneed to buy our products and services separately when they can use the bundled applications andfunctionality in our competitors’ product suites for little or no additional cost.
If the market for our OnDemand service offerings does not develop or develops more slowly than weexpect, then our business could be negatively affected.
Our OnDemand hosted service and subscription offerings are at an early stage of development, and we may notachieve or sustain demand for these offerings. Our success in this effort will depend in part on the price,performance and availability of our products and services in comparison with competing products and services andon the willingness of companies to increase their use of hosting applications. While we will continue to market andsell traditional licenses for our software solutions, we believe that the widespread market acceptance of our hostingsoftware solutions is important to the success of our business because of the growth acceleration opportunities.
If our clients experience interruptions, delays or failures in our hosted services, then we could incursignificant costs and lose revenue opportunities.
Our OnDemand hosted service offering is at an early stage of development and any equipment failures, mechanicalerrors, spikes in usage volume or failure to follow system protocols and procedures could cause our systems to fail,resulting in interruptions in our clients’ service to their customers. Any such interruptions or delays in our hostingservices, whether as a result of third-party error, our own error, natural disasters or accidental or willful security breaches,could harm our relationships with clients and our reputation. This in turn could reduce our revenue, subject us to liability,cause us to issue credits or pay penalties or cause our clients to decide not to renew their hosting agreements, any ofwhich could adversely affect our business, financial condition and results of operations.
We depend heavily on key employees in a competitive labor market.
Our success depends on our ability to attract, motivate and retain skilled personnel, especially in the areas ofmanagement, finance, sales, marketing and research and development, and we compete with other companies for asmall pool of highly qualified employees. Members of our management team, including executives with significantresponsibilities in these areas, have left us during the past few years for a variety of reasons, and there may beadditional departures in the future. These historical and potential future changes in personnel may be disruptive toour operations or affect our ability to maintain effective internal controls over financial reporting. In addition, equityincentives such as stock options constitute an important part of our total compensation program for employees, andthe volatility or lack of positive performance of our stock price may adversely affect our ability to retain ouremployees or hire replacements.
If we fail to anticipate and address the risks associated with eStara’s business, then our business could beharmed.
The integration of the business and operations of eStara, Inc., which we acquired in October 2006, into ourbusiness and operations is an important process. In order to be successful, we need to retain key eStara personneland also understand and address the risks associated with eStara’s business and products. For example, it is possiblethat the market for eStara’s Click to Call and Click to Chat products may be more limited than we anticipated or thateStara’s technology may infringe upon a third party’s intellectual property. If we fail to successfully integrateeStara’s business and operations, retain valuable eStara personnel and address the risks associated with ouracquisition of its business, then we could fail to realize the anticipated benefits of the acquisition, and the disruptioncaused by the acquisition could hurt our business.
13
We could incur substantial costs defending against a claim of infringement or protecting our intellectualproperty from infringement.
In recent years, there has been significant litigation in the United States involving patents and other intellectualproperty rights. Companies providing Internet-related products and services are increasingly bringing andbecoming subject to suits alleging infringement of proprietary rights, particularly patent rights. We could incursubstantial costs in prosecuting or defending any intellectual property litigation. If we sue to enforce our rights orare sued by a third party that claims that our technology infringes its rights, the litigation could be expensive andcould divert our management resources. For example, we have been involved in litigation alleging that we haveinfringed United States patents owned by third parties. We may be required to incur substantial costs in defendinginfringement litigation in the future, which could have a material adverse effect on our operating results andfinancial condition.
In addition, we have agreed to indemnify customers against claims that our products infringe the intellectualproperty rights of third parties. From time to time, our customers have been subject to third party patent claims andwe have agreed to indemnify these customers to the extent the claims related to our products. The results of anyintellectual property litigation to which we might become a party may force us to do one or more of the following:
• cease selling or using products or services that incorporate the challenged intellectual property;
• obtain a license, which may not be available on reasonable terms, to sell or use the relevant technology; or
• redesign those products or services to avoid infringement.
We seek to protect the source code for our proprietary software under a combination of patent, copyright andtrade secrets law. However, because we make the source code available to some customers, third parties may bemore likely to misappropriate it. Our policy is to enter into confidentiality agreements with our employees,consultants, vendors and customers and to control access to our software, documentation and other proprietaryinformation. Despite these precautions, it may be possible for someone to copy our software or other proprietaryinformation without authorization or to develop similar software independently.
Despite our efforts to protect our proprietary rights, unauthorized parties may attempt to copy aspects of ourproducts or to obtain and use information that we regard as proprietary. Policing unauthorized use of our products isdifficult, and while we are unable to determine the extent to which piracy of our software exists, we expect softwarepiracy to be a persistent problem. Litigation may be necessary in the future to enforce our intellectual propertyrights, to protect our trade secrets, to determine the validity and scope of the proprietary rights of others or to defendagainst claims of infringement or invalidity. However, the laws of many countries do not protect proprietary rights toas great an extent as the laws of the United States. Any such resulting litigation could result in substantial costs anddiversion of resources and could have a material adverse effect on our business, operating results and financialcondition. There can be no assurance that our means of protecting our proprietary rights will be adequate or that ourcompetitors will not independently develop similar technology. If we fail to meaningfully protect our intellectualproperty, then our business, operating results and financial condition could be materially harmed.
Finally, our professional services may involve the development of custom software applications for specificcustomers. In some cases, customers retain ownership or impose restrictions on our ability to use the technologiesdeveloped from these projects. Issues relating to the ownership of software can be complicated, and disputes couldarise that affect our ability to resell or reuse applications we develop for customers.
If we fail to maintain our existing customer base, then our ability to generate revenues will be harmed.
Historically, we have derived a significant portion of our revenues from existing customers that purchase oursupport and maintenance services and license enhanced versions of our products. If we are unable to continue toobtain significant revenues from our existing customer base, then our ability to grow our business would be harmed,and our competitors could achieve greater market share. To retain our existing customer base, we must:
• provide high levels of customer service and product support to help our clients maximize the benefits thatthey derive from our products;
14
• remain competitive by introducing enhancements and new versions of our products that provide additionalfunctionality; and
• manage the transition from our older products so as to minimize the disruption to our clients caused by themigration and integration with the clients’ information technology platform.
If we fail to address the challenges associated with our international operations, then revenues from ourproducts and services may decline, and the costs of providing our products or services may increase.
At December 31, 2006, we had offices in the United Kingdom, France, Northern Ireland, Canada andSingapore. We derived 25% of our total revenues in the year ended December 31, 2006 and 24% of our totalrevenues in the year ended December 31, 2005 from customers outside the United States. Our operations outside theUnited States are subject to additional risks, including:
• changes in regulatory requirements, exchange rates, tariffs and other barriers;
• longer payment cycles and problems in collecting accounts receivable in Western Europe and Asia;
• difficulties in managing systems integrators and technology partners;
• difficulties in staffing and managing foreign subsidiary operations;
• differing technology standards;
• difficulties and delays in translating products and product documentation into foreign languages forcountries in which English is not the primary language;
• reduced protection for intellectual property rights in some of the countries in which we operate or plan tooperate;
• difficulties related to entering into legal contracts under local laws and in foreign languages;
• fluctuations in the exchange rates between foreign and United States currency;
• potentially adverse tax consequences; and
• political and economic instability.
If we fail to comply with the financial covenants in our line of credit, or if our bank refuses to renew thisfacility, then our liquidity could be impaired.
We have a revolving line of credit with Silicon Valley Bank that allows us to borrow up to $20.0 million. Ourbank had issued letters of credit totaling $5.3 million to several of our landlords to secure our lease obligations,which letters of credit are supported by this facility. This line of credit will expire on January 31, 2008.
If we fail to comply with the financial covenants or default on any of the provisions of our loan agreement, thenthe bank may, among other things, declare all obligations immediately due and payable, cease to advance money orextend credit for our benefit and require our outstanding letters of credit to be cash secured. At December 31, 2006,we were in compliance with all of the financial covenants in our loan agreement. If in response to any future defaultthe bank declared our obligations due, or required us to secure each outstanding letter of credit on a dollar for dollarbasis, then our cash, cash equivalents and marketable securities balances would decrease substantially, and ourliquidity could be materially impaired.
We may need additional financing in the future, and any additional financing may result in restrictionson our operations or substantial dilution to our stockholders.
We may need to raise additional funds in the future, for example, to develop new technologies, expand ourbusiness, respond to competitive pressures, acquire complementary businesses or respond to unanticipatedsituations. We may try to raise additional funds through public or private financings, strategic relationships orother arrangements. Our ability to obtain debt or equity funding will depend on a number of factors, includingmarket conditions, our operating performance and investor interest. Additional funding may not be available to us
15
on acceptable terms or at all. If adequate funds are not available, we may be required to reduce expenditures,including curtailing our growth strategies, foregoing acquisitions or reducing our product development efforts. If wesucceed in raising additional funds through the issuance of equity or convertible securities, then the issuance couldresult in substantial dilution to existing stockholders. If we raise additional funds through the issuance of debtsecurities or preferred stock, these new securities would have rights, preferences and privileges senior to those of theholders of our common stock. The terms of these securities, as well as any borrowings under our credit agreement,could impose restrictions on our operations.
If systems integrators or value added resellers reduce their support and implementation of our products,then our revenues may fail to meet expectations and our operating results would suffer.
Since our potential customers often rely on third-party systems integrators to develop, deploy and managewebsites for conducting commerce on the Internet, we cultivate relationships with systems integrators to encouragethem to support our products. We do not, however, generally have written agreements with our systems integrators,and they are not required to implement solutions that include our products or to maintain minimum sales levels ofour products. Our revenues would be reduced if we fail to train a sufficient number of systems integratorsadequately or if systems integrators devote their efforts to integrating or co-selling products of other companies.Any such reduction in revenue would not be accompanied by a significant offset in our expenses. As a result, ouroperating results would suffer, and the price of our common stock would probably fall.
If our software products contain serious errors or defects, then we may lose revenues and marketacceptance and may incur costs to defend or settle product liability claims.
Complex software products such as ours often contain errors or defects, particularly when first introduced orwhen new versions or enhancements are released. Despite internal testing and testing by our customers, our currentand future products may contain serious defects, which could result in lost revenues or a delay in market acceptance.
Since our customers use our products for critical business applications such as e-commerce, errors, defects orother performance problems could result in damage to our customers. They could seek significant compensationfrom us for the losses they suffer. Although our license agreements typically contain provisions designed to limitour exposure to product liability claims, existing or future laws or unfavorable judicial decisions could negate theselimitations. Even if not successful, a product liability claim brought against us would likely be time consuming andcostly and could seriously damage our reputation in the marketplace, making it harder for us to sell our products.
If the Sun» JavaTM programming language loses market acceptance or if we are not able to continueusing Java technologies, then our business could be harmed.
We write our software in the Java computer programming language developed by Sun Microsystems, and weincorporate Sun’s Java 2 Platform, Enterprise Edition, or J2EE, and other Java technologies into our products underlicenses granted to us by Sun. If Sun were to decline to continue to allow us to use these technologies for any reason,we would be required to either license the equivalent technology from another source, create equivalent technologyourselves, or rewrite portions of our software to accommodate the change.
While a number of companies have introduced web applications based on Java technology, this technologycould fall out of favor, and support by Sun Microsystems or other companies could decline. Moreover, our newVersion 7 ATG Adaptive Scenario Engine is designed to support J2EE standards for developing modular Javaprograms that can be accessed over a network. We have licensed the J2EE brand and certification tests from Sun.There can be no assurance that these standards will be widely adopted, that we can continue to support J2EEstandards established by Sun from time to time or that the J2EE brand will continue to be made available to us oncommercially reasonable terms. If Java or J2EE support decreased or we could not continue to use Java or relatedJava technologies or to support J2EE, we might have to rewrite the source code for our entire product line to enableour products to run on other computer platforms. Also, changes to Java or J2EE standards or the loss of our licenseto the J2EE brand could require us to change our products and adversely affect the perception of our products by ourcustomers. If we were unable to develop or implement appropriate modifications to our products on a timely basis,we could lose revenue opportunities and our business could be harmed.
16
Government or industry regulations could directly restrict our business or indirectly affect our businessby limiting the growth of e-commerce.
As e-commerce evolves, federal, state and foreign agencies have adopted and could in the future adoptregulations covering issues such as user privacy, content and taxation of products and services. Governmentregulations could limit the market for our products and services or impose burdensome requirements that render ourbusiness unprofitable. Although many regulations might not apply to our business directly, we expect that lawsregulating the solicitation, collection or processing of personal and consumer information could indirectly affectour business. The Telecommunications Act of 1996 prohibits certain types of information and content from beingtransmitted over the Internet. The prohibition’s scope and the liability associated with a violation are currentlyunsettled. In addition, although substantial portions of the Communications Decency Act were held to beunconstitutional, we cannot be certain that similar legislation will not be enacted and upheld in the future. It ispossible that legislation could expose companies involved in e-commerce to liability, which could limit the growthof e-commerce generally. Legislation like the Telecommunications Act and the Communications Decency Actcould dampen the growth in web usage and decrease its acceptance as a medium of communications and commerce.
The Internet is generating privacy concerns that could result in legislation or market perceptions thatcould result in reduced sales of our products and harm our business.
Businesses use our ATG Adaptive Scenario Engine product to develop and maintain profiles to tailor thecontent to be provided to website visitors. When a visitor first arrives at a website, our software creates a profile forthat visitor. If the visitor registers or logs in, the visitor’s identity is added to the profile, preserving any profileinformation that was gathered up to that point. ATG Adaptive Scenario Engine product tracks both explicit userprofile data supplied by the user as well as implicit profile attributes derived from the user’s behavior on the website.Privacy concerns may cause visitors to resist providing the personal data or to avoid websites that track the webbehavioral information necessary to support our profiling capability. More importantly, even the perception ofsecurity and privacy concerns, whether or not valid, may indirectly inhibit market acceptance of our products. Inaddition, legislative or regulatory requirements may heighten these concerns if businesses must notify website usersthat the data captured after visiting websites may be used to direct product promotion and advertising to that user.Other countries and political entities, such as the European Economic Community, have adopted such legislation orregulatory requirements, and the United States may follow suit. Privacy legislation and consumer privacy concernscould make it harder for us to sell our products and services, resulting in reduced revenues.
Our products use “cookies” to track demographic information and user preferences. A “cookie” is informationkeyed to a specific user that is stored on a computer’s hard drive, typically without the user’s knowledge. The usercan generally remove the cookies, although removal could affect the content available on a particular site. Germanyhas imposed laws limiting the use of cookies, and a number of Internet commentators and governmental bodies inthe United States and other countries have urged passage of laws limiting or abolishing the use of cookies. If suchlaws are passed or if users begin to delete or refuse cookies as a common practice, then demand for ourpersonalization products could be reduced.
If NASDAQ were to delist our common stock from The NASDAQ Global Market, then the value of yourinvestment could be reduced, and your shares could be more difficult to sell.
For our common stock to trade on The NASDAQ Global Market (formerly known as The NASDAQ NationalMarket), we must continue to meet the listing standards of that market. Among other things, those standards requirethat our common stock maintain a minimum closing bid price of at least $1.00 per share. As recently as October2005, our common stock has traded at prices near or below $1.00. If we do not continue to meet NASDAQ’sapplicable minimum listing standards, NASDAQ could delist us from The NASDAQ Global Market, which could,among other things:
• hinder your ability to sell, or obtain an accurate quotation for the price of your shares of our common stock;
• hurt our reputation among our investors and prospects, which could lead to further declines in the marketprice of our common stock;
17
• make it more difficult and expensive for us to raise capital; and
• subject us to a Securities and Exchange Commission rule that could adversely affect the ability of broker-dealers to sell or make a market in our common stock, thus hindering your ability to sell your shares.
Anti-takeover provisions in our charter documents and Delaware law could prevent or delay a change incontrol of our company.
Certain provisions of our charter and by-laws may discourage, delay or prevent a merger or acquisition thatsome of our stockholders may consider favorable, which could reduce the market price of our common stock. Theseprovisions include:
• authorizing the issuance of “blank check” preferred stock;
• providing for a classified board of directors with staggered, three-year terms;
• providing that directors may only be removed for cause by a two-thirds vote of stockholders;
• limiting the persons who may call special meetings of stockholders and prohibiting stockholder action bywritten consent;
• establishing advance notice requirements for nominations for election to the board of directors or forproposing matters that can be acted on by stockholders at stockholder meetings; and
• authorizing anti-takeover provisions.
In addition, we adopted a shareholder rights plan in 2001, and Delaware law may further discourage, delay orprevent someone from acquiring or merging with us.
Item 1B. Unresolved Staff Comments
Not applicable.
Item 2. Properties
Our headquarters are located in 45,000 square feet of leased office space in Cambridge, Massachusetts. Inaddition, we have major United States facilities in Seattle, Washington (approximately 19,000 square feet);Chicago, Illinois (approximately 12,000 square feet); San Francisco, California (approximately 5,000 square feet);and Washington, D.C. (approximately 7,000 square feet). Our European headquarters are located in Apex Plaza,Reading, United Kingdom where we lease approximately 8,000 square. We also maintain offices in NorthernIreland, Canada, France and Singapore. All of our facilities are leased. We believe our facilities are sufficient tomeet our needs for the foreseeable future and, if needed, additional space will be available at a reasonable cost.
Item 3. Legal Proceedings
As previously disclosed, in 2001, we were named as defendants in seven purported class action suits that wereconsolidated into one action in the United States District Court for the District of Massachusetts under the caption Inre Art Technology Group, Inc. Securities Litigation. The action alleges that we, and certain of our former officers,violated Sections 10(b) and 20(a) of the Securities Exchange Act of 1934 and SEC Rule 10b-5 promulgated thereunder. In October 2006, the court ruled in our favor and dismissed the case on summary judgment. The plaintiffshave appealed the decision. Management believes that none of the claims that plaintiffs have asserted has merit, andwe intend to continue to defend the action vigorously. While we cannot predict with certainty the outcome of thelitigation, we do not expect any material adverse impact to our business, or the results of our operations, from thismatter.
As previously disclosed, in December 2001, a purported class action complaint was filed against our whollyowned subsidiary Primus Knowledge Solutions, Inc., two former officers of Primus and the underwriters of Primus’1999 initial public offering. The complaints are similar and allege violations of the Securities Act of 1933, asamended, and the Securities Exchange Act of 1934 primarily based on the allegation that the underwriters
18
received undisclosed compensation in connection with Primus’ initial public offering. The litigation has beenconsolidated in the United States District Court for the Southern District of New York (“SDNY”) with claimsagainst approximately 300 other companies that had initial public offerings during the same general time period. OnFebruary 15, 2005, the court issued an opinion and order granting preliminary approval of the settlement, subject tocertain non-material modifications. The court held a settlement fairness meeting on April 24, 2006 following whichit took under advisement the motion for final approval of the settlement. In December 2006, the Court of Appealsfor the Second Circuit ruled that the certification of this proceeding as a class action was invalid and remanded thecase to the SDNY. The class plaintiffs have requested the Second Circuit to reconsider. If the settlement is notapproved, we believe we have meritorious defenses and intend to defend the case vigorously. While we cannotpredict the outcome of the litigation or appeal, we do not expect any material adverse impact to our business, or theresults of our operations, from this matter.
We are also subject to various other claims and legal actions arising in the ordinary course of business. In theopinion of management, the ultimate disposition of these matters is not expected to have a material effect on ourbusiness, financial condition or results of operations.
Item 4. Submission of Matters to a Vote of Security Holders
Not applicable.
19
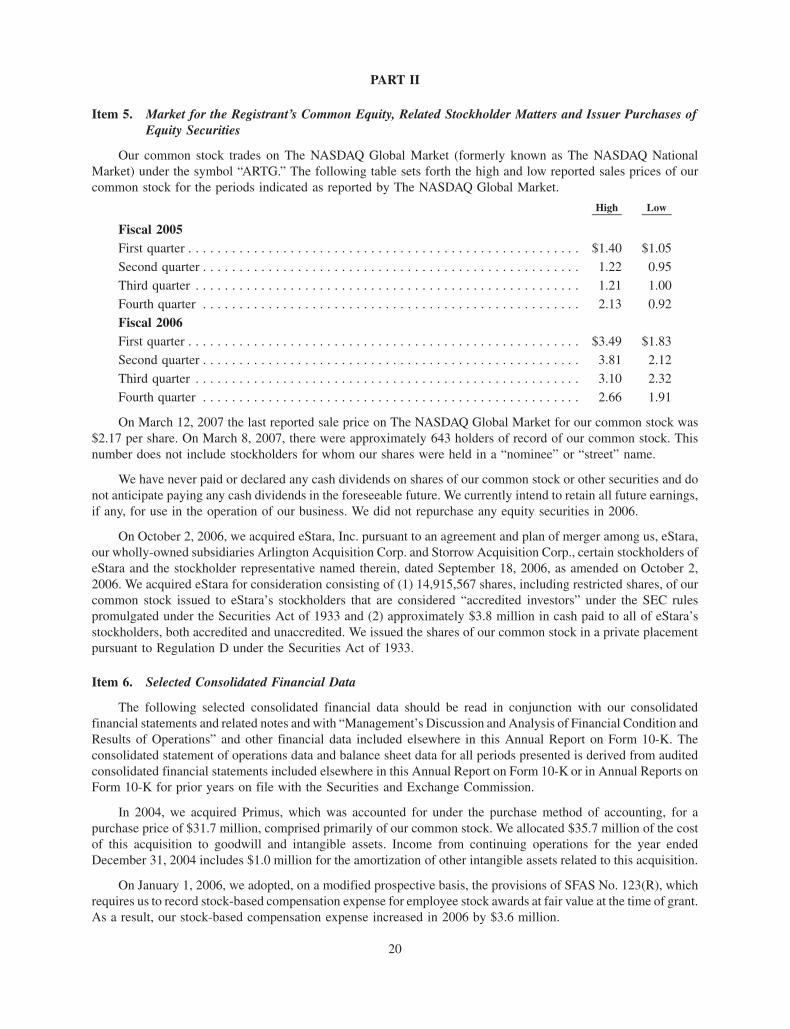
PART II
Item 5. Market for the Registrant’s Common Equity, Related Stockholder Matters and Issuer Purchases ofEquity Securities
Our common stock trades on The NASDAQ Global Market (formerly known as The NASDAQ NationalMarket) under the symbol “ARTG.” The following table sets forth the high and low reported sales prices of ourcommon stock for the periods indicated as reported by The NASDAQ Global Market.
High Low
Fiscal 2005First quarter . . . . . . . . . . . . . . . . . . . . . . . . . . . . . . . . . . . . . . . . . . . . . . . . . . . . . . $1.40 $1.05
Second quarter . . . . . . . . . . . . . . . . . . . . . . . . . . . . . . . . . . . . . . . . . . . . . . . . . . . . 1.22 0.95
Third quarter . . . . . . . . . . . . . . . . . . . . . . . . . . . . . . . . . . . . . . . . . . . . . . . . . . . . . 1.21 1.00
Fourth quarter . . . . . . . . . . . . . . . . . . . . . . . . . . . . . . . . . . . . . . . . . . . . . . . . . . . . 2.13 0.92
Fiscal 2006First quarter . . . . . . . . . . . . . . . . . . . . . . . . . . . . . . . . . . . . . . . . . . . . . . . . . . . . . . $3.49 $1.83
Second quarter . . . . . . . . . . . . . . . . . . . . . . . . . . . . . . . . . . . . . . . . . . . . . . . . . . . . 3.81 2.12
Third quarter . . . . . . . . . . . . . . . . . . . . . . . . . . . . . . . . . . . . . . . . . . . . . . . . . . . . . 3.10 2.32
Fourth quarter . . . . . . . . . . . . . . . . . . . . . . . . . . . . . . . . . . . . . . . . . . . . . . . . . . . . 2.66 1.91
On March 12, 2007 the last reported sale price on The NASDAQ Global Market for our common stock was$2.17 per share. On March 8, 2007, there were approximately 643 holders of record of our common stock. Thisnumber does not include stockholders for whom our shares were held in a “nominee” or “street” name.
We have never paid or declared any cash dividends on shares of our common stock or other securities and donot anticipate paying any cash dividends in the foreseeable future. We currently intend to retain all future earnings,if any, for use in the operation of our business. We did not repurchase any equity securities in 2006.
On October 2, 2006, we acquired eStara, Inc. pursuant to an agreement and plan of merger among us, eStara,our wholly-owned subsidiaries Arlington Acquisition Corp. and Storrow Acquisition Corp., certain stockholders ofeStara and the stockholder representative named therein, dated September 18, 2006, as amended on October 2,2006. We acquired eStara for consideration consisting of (1) 14,915,567 shares, including restricted shares, of ourcommon stock issued to eStara’s stockholders that are considered “accredited investors” under the SEC rulespromulgated under the Securities Act of 1933 and (2) approximately $3.8 million in cash paid to all of eStara’sstockholders, both accredited and unaccredited. We issued the shares of our common stock in a private placementpursuant to Regulation D under the Securities Act of 1933.
Item 6. Selected Consolidated Financial Data
The following selected consolidated financial data should be read in conjunction with our consolidatedfinancial statements and related notes and with “Management’s Discussion and Analysis of Financial Condition andResults of Operations” and other financial data included elsewhere in this Annual Report on Form 10-K. Theconsolidated statement of operations data and balance sheet data for all periods presented is derived from auditedconsolidated financial statements included elsewhere in this Annual Report on Form 10-K or in Annual Reports onForm 10-K for prior years on file with the Securities and Exchange Commission.
In 2004, we acquired Primus, which was accounted for under the purchase method of accounting, for apurchase price of $31.7 million, comprised primarily of our common stock. We allocated $35.7 million of the costof this acquisition to goodwill and intangible assets. Income from continuing operations for the year endedDecember 31, 2004 includes $1.0 million for the amortization of other intangible assets related to this acquisition.
On January 1, 2006, we adopted, on a modified prospective basis, the provisions of SFAS No. 123(R), whichrequires us to record stock-based compensation expense for employee stock awards at fair value at the time of grant.As a result, our stock-based compensation expense increased in 2006 by $3.6 million.
20
In 2006, we acquired eStara for a purchase price of $49.8 million, comprised primarily of our common stock.This acquisition was accounted for under the purchase method of accounting. We allocated $46.1 million of the costof this acquisition to goodwill and intangible assets. Net income from continuing operations for the year endedDecember 31, 2006 includes $791,000 for the amortization of intangible assets to this acquisition.
During 2006, we determined that certain foreign subsidiaries’ operations had substantially ceased and wereeffectively liquidated in 2002 and 2003. In accordance with SFAS 52, companies are required to eliminate thecumulative translation adjustment related to entities that have either been sold or substantially liquidated. As aresult, we are restating our 2002 and 2003 financial statements to reflect the write-off of the cumulative translationadjustment related to substantially liquidated entities. We are recording adjustments of $442,000 in 2002 and$1,345,000 in 2003 to eliminate the cumulative translation adjustment related to these substantially liquidatedentities and are recording corresponding increases in our accumulated deficit as of December 31, 2002 and 2003.The write-off of the cumulative translation adjustment is recorded as a charge to the interest and other income, netline item in the Statement of Operations.
In connection with recording the adjustments to write-off the cumulative translation adjustment for liquidatedforeign subsidiaries in 2002 and 2003, we are also recording historical identified errors. In 2002 and 2003, weshould have recorded certain amounts as deferred revenue to properly recognize support and maintenance revenueratably as the service was provided and for future discounts provided to customers. In addition, we had anunsupported revenue reserve. We recorded net revenue adjustments to decrease revenue by $608,000 and $386,000in 2002 and 2003, respectively. Regarding expenses, we had over-accrued for certain sales and marketing, generaland administrative and restructuring expenses. The net impact to recording these errors was a decrease to operatingexpenses of $584,000 in 2002 and an increase to operating expenses of $83,000 in 2003. The errors to revenue andoperating expenses were deemed to not be material individually, or in aggregate, in 2002 and 2003. The net impactof the restatement is to increase our net loss and net loss per basic and diluted share for 2002 from $29.5 million to$30.0 million, and from $0.42 per share to $0.43 per share, respectively, and to decrease our net income and netincome per basic and diluted share for 2003 from $4.2 million to $2.4 million, and from $0.06 per share to $0.03 pershare, respectively.
The correction of these errors had no impact to our results of operations for 2004, 2005 or 2006. We haverecorded an adjustment of $1,787,000 to the beginning balances at January 1, 2004 to increase accumulated deficitand decrease cumulative translation adjustment, which is the only component of accumulated other comprehensiveloss. There was no net impact to stockholders’ equity.
21
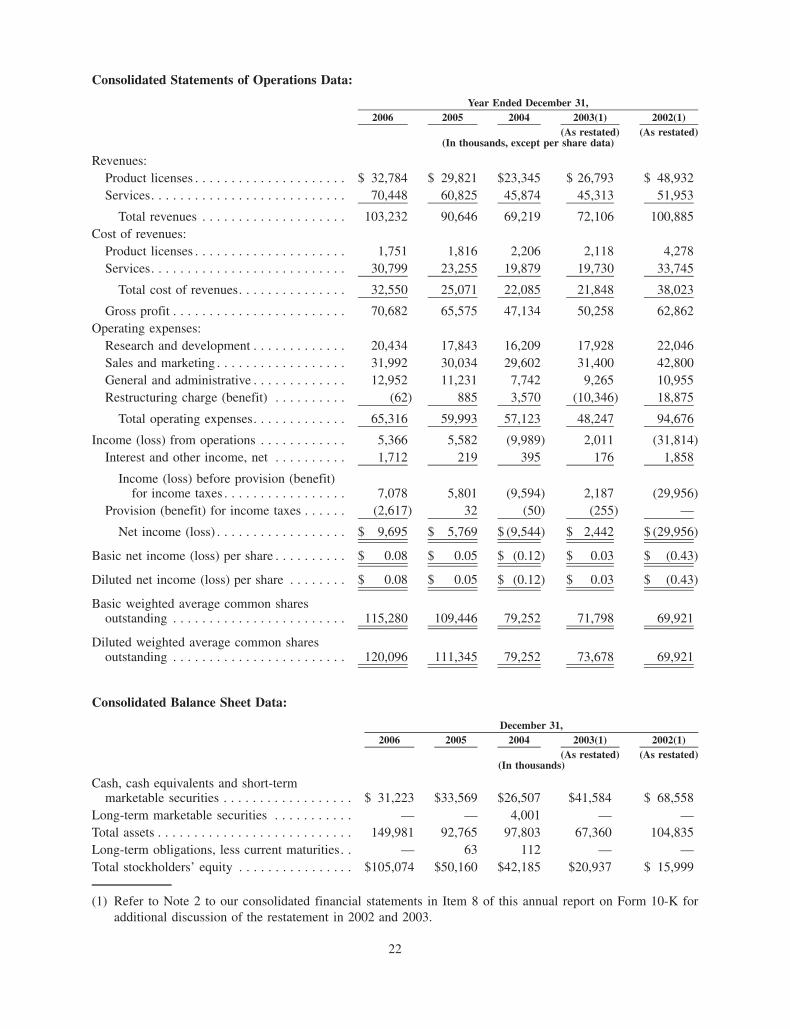
Consolidated Statements of Operations Data:
2006 2005 2004 2003(1) 2002(1)Year Ended December 31,
(As restated) (As restated)(In thousands, except per share data)
Revenues:Product licenses . . . . . . . . . . . . . . . . . . . . . $ 32,784 $ 29,821 $23,345 $ 26,793 $ 48,932Services. . . . . . . . . . . . . . . . . . . . . . . . . . . 70,448 60,825 45,874 45,313 51,953
Total revenues . . . . . . . . . . . . . . . . . . . . 103,232 90,646 69,219 72,106 100,885Cost of revenues:
Product licenses . . . . . . . . . . . . . . . . . . . . . 1,751 1,816 2,206 2,118 4,278Services. . . . . . . . . . . . . . . . . . . . . . . . . . . 30,799 23,255 19,879 19,730 33,745
Total cost of revenues. . . . . . . . . . . . . . . 32,550 25,071 22,085 21,848 38,023
Gross profit . . . . . . . . . . . . . . . . . . . . . . . . 70,682 65,575 47,134 50,258 62,862Operating expenses:
Research and development . . . . . . . . . . . . . 20,434 17,843 16,209 17,928 22,046Sales and marketing . . . . . . . . . . . . . . . . . . 31,992 30,034 29,602 31,400 42,800General and administrative . . . . . . . . . . . . . 12,952 11,231 7,742 9,265 10,955Restructuring charge (benefit) . . . . . . . . . . (62) 885 3,570 (10,346) 18,875
Total operating expenses. . . . . . . . . . . . . 65,316 59,993 57,123 48,247 94,676
Income (loss) from operations . . . . . . . . . . . . 5,366 5,582 (9,989) 2,011 (31,814)Interest and other income, net . . . . . . . . . . 1,712 219 395 176 1,858
Income (loss) before provision (benefit)for income taxes . . . . . . . . . . . . . . . . . 7,078 5,801 (9,594) 2,187 (29,956)
Provision (benefit) for income taxes . . . . . . (2,617) 32 (50) (255) —
Net income (loss) . . . . . . . . . . . . . . . . . . $ 9,695 $ 5,769 $ (9,544) $ 2,442 $ (29,956)
Basic net income (loss) per share . . . . . . . . . . $ 0.08 $ 0.05 $ (0.12) $ 0.03 $ (0.43)
Diluted net income (loss) per share . . . . . . . . $ 0.08 $ 0.05 $ (0.12) $ 0.03 $ (0.43)
Basic weighted average common sharesoutstanding . . . . . . . . . . . . . . . . . . . . . . . . 115,280 109,446 79,252 71,798 69,921
Diluted weighted average common sharesoutstanding . . . . . . . . . . . . . . . . . . . . . . . . 120,096 111,345 79,252 73,678 69,921
Consolidated Balance Sheet Data:
2006 2005 2004 2003(1) 2002(1)December 31,
(As restated) (As restated)(In thousands)
Cash, cash equivalents and short-termmarketable securities . . . . . . . . . . . . . . . . . . $ 31,223 $33,569 $26,507 $41,584 $ 68,558
Long-term marketable securities . . . . . . . . . . . — — 4,001 — —Total assets . . . . . . . . . . . . . . . . . . . . . . . . . . . 149,981 92,765 97,803 67,360 104,835Long-term obligations, less current maturities. . — 63 112 — —Total stockholders’ equity . . . . . . . . . . . . . . . . $105,074 $50,160 $42,185 $20,937 $ 15,999
(1) Refer to Note 2 to our consolidated financial statements in Item 8 of this annual report on Form 10-K foradditional discussion of the restatement in 2002 and 2003.
22

Item 7. Management’s Discussion and Analysis of Financial Condition and Results of Operations
Overview
We develop and market a comprehensive suite of e-commerce software products, as well as provide relatedservices including support and maintenance, education, application hosting, professional services and proactiveconversion solutions for enhancing online sales and support. We primarily derive revenue from the sale of softwareproducts and related services. Our software licenses are priced based on the size of the customer implementation.Services revenue is derived from fees for professional services, training, support and maintenance, applicationhosting and proactive conversion solutions. Professional services include implementation, custom applicationdevelopment and project and technical consulting. We bill professional service fees primarily on a time andmaterials basis. Support and maintenance arrangements are priced based on the level of support services provided asa percent of net license fees on a per annum basis. Under support and maintenance services, customers are generallyentitled to receive software updates, maintenance releases and technical support. Training is billed as services areprovided. Revenue from application hosting services is recognized monthly as the services are provided based on aper transaction, per CPU or percent of revenue basis. Proactive conversion solutions, recently offered as a result ofthe eStara acquisition, are priced on a per transaction basis and recognized monthly as the services are provided.
This Management’s Discussion and Analysis of Financial Condition and Results of Operations should be readin conjunction with our consolidated financial statements and notes thereto which appear elsewhere in this AnnualReport on Form 10-K. See “Risk Factors” elsewhere in this Annual Report on Form 10-K for a discussion of certainrisks associated with our business. The following discussion contains forward-looking statements. The forward-looking statements do not include the potential impact of any mergers, acquisitions, or divestitures of businesscombinations that may be announced after the date hereof.
Recent Events
On October 2, 2006, we acquired all of the outstanding shares of common stock and common stock equivalents ofeStara, Inc., a provider of proactive conversion solutions for enhancing online sales and support initiatives, in exchangefor approximately 14.6 million shares of ATG common stock valued at $39.2 million and approximately $8.4 million incash, excluding transaction costs. We also issued 0.3 million shares of restricted stock, which will be recognized as stock-based compensation expense over the vesting term. The revenues and expenses generated from acquisition date,October 2, 2006 to December 31, 2006 were not significant to our fiscal 2006 financial results reported in ourconsolidated statement of operations included elsewhere in this Annual Report on Form 10-K.
On January 1, 2006, we adopted SFAS 123R using the modified prospective method as permitted underSFAS 123R. Under this transition method, compensation cost recognized in fiscal 2006 includes: (a) compensationcost for all share-based payments granted prior to but not yet vested as of December 31, 2005, based on the grant-date fair value estimated in accordance with the provisions of SFAS 123, and (b) compensation cost for all share-based payments granted subsequent to January 1, 2006, based on the grant-date fair value estimated in accordancewith the provisions of SFAS 123R. In accordance with the modified prospective method of adoption, our results ofoperations and financial position for prior periods have not been restated. For the year ended December 31, 2006,our stock-based compensation expense was $3.8 million, as compared to a de minimis expense for years endedDecember 31, 2005 and 2004.
Critical Accounting Policies and Estimates
This Management’s Discussion and Analysis of financial condition and results of operations discusses ourconsolidated financial statements, which have been prepared in accordance with accounting principles generallyaccepted in the United States.
The preparation of these financial statements requires management to make estimates and assumptions thataffect the reported amounts of assets and liabilities and the disclosure of contingent assets and liabilities at the dateof the financial statements and the reported amounts of revenues and expenses during the reporting period. On anongoing basis, management evaluates its estimates and judgments, including those related to revenue recognition,the allowance for doubtful accounts, research and development costs, restructuring expenses, the impairment of
23
long-lived assets, income taxes and assumptions for stock-based compensation. Management bases its estimatesand judgments on historical experience, known trends or events and various other factors that are believed to bereasonable under the circumstances, the results of which form the basis for making judgments about the carryingvalues of assets and liabilities that are not readily apparent from other sources. Actual results may differ from theseestimates under different assumptions or conditions.
Definitions
We define our “critical accounting policies” as those accounting principles generally accepted in the UnitedStates that require us to make subjective estimates about matters that are uncertain and are likely to have a materialimpact on our financial condition and results of operations as well as the specific manner in which we apply thoseprinciples. Our estimates are based upon assumptions and judgments about matters that are highly uncertain at thetime the accounting estimate is made and applied and require us to assess a range of potential outcomes.
We believe the following critical accounting policies to be both those most important to the portrayal of ourfinancial condition and those that require the most subjective judgment.
Revenue Recognition
We recognize service and hosting revenue not related to software arrangements in accordance with theSecurities and Exchange Commission’s Staff Accounting Bulletin No. 104, Revenue Recognition, and the FinancialAccounting Standards Board, or FASB, Emerging Issues Task Force Issue No. 00-21, Revenue Arrangements withMultiple Deliverables. Revenue is recognized only when the price is fixed or determinable, persuasive evidence ofan arrangement exists, the service is performed and collectibility of the resulting receivable is reasonably assured. Inaddition, the delivered element must have stand-alone value and we must have specific objective evidence of the fairvalue of the undelivered elements.
At the inception of a customer contract for service, we make a judgment of the customer’s ability to pay for theservices provided. We base our estimate on a combination of factors, including the successful completion of a creditcheck or financial review, our payment history with the customer and other forms of payment assurance. Upon thecompletion of these steps, we recognize revenue monthly in accordance with our revenue recognition policy.
We also license software under perpetual license agreements. We apply the provisions of Statement ofPosition, or SOP, 97-2, Software Revenue Recognition, as amended by SOP 98-9, Modifications of SOP 97-2,Software Revenue Recognition, With Respect to Certain Transactions. In accordance with SOP 97-2 and SOP 98-9,revenues from software product license agreements are recognized upon execution of a license agreement anddelivery of the software, provided that the fee is fixed or determinable and deemed collectible by management. Ifconditions for acceptance are required subsequent to delivery, revenues are recognized upon customer acceptance ifsuch acceptance is not deemed to be perfunctory.
As prescribed by this accounting guidance, we apply the residual method of accounting. The residual methodrequires that the portion of the total arrangement fee attributable to undelivered elements, as indicated by vendor specificobjective evidence of fair value, is deferred and subsequently recognized when delivered. The difference between thetotal arrangement fee and the amount deferred for the undelivered elements is recognized as revenue related to thedelivered elements, if all other revenue recognition criteria of SOP 97-2 are met. Consulting revenues from thesearrangements are generally accounted for separately from software licenses because the arrangements qualify as servicetransactions as defined in SOP 97-2. The more significant factors considered in determining whether the revenue shouldbe accounted for separately include the nature of services (i.e., consideration of whether the services are essential to thefunctionality of the licensed product), degree of risk, availability of services from other vendors, timing of payments andimpact of milestones or acceptance criteria on the realizability of the software license fee. Revenues from softwaremaintenance are recognized ratably over the term of the maintenance, which is typically one year.
We derive revenues from the sale of application hosting and proactive conversion solutions by providingservices to customers who have executed contracts with terms of one year or longer. These contracts generallycommit the customer to a minimum monthly level of usage and provide the rate at which the customer must pay foractual usage above the monthly minimum. For these services, we recognize the monthly minimum as revenue each
24
month provided that an enforceable contract has been signed by both parties, the service has been delivered to thecustomer, the fee for the service is fixed or determinable and collection is reasonably assured. Should a customer’susage of these services exceed the monthly minimum, we recognize revenue for such excess usage in the period ofthe usage. We typically charge the customer an installation fee when the services are first activated. The installationfees are recorded as deferred revenue and recognized as revenue ratably over the estimated life of the customerarrangement.
When software products are licensed perpetually in conjunction with application hosting and or proactiveconversion solutions, we allocate revenue between the elements based on each element’s relative fair value,provided that each element meets the criteria as a separate element under SOP 97-2. An item is considered aseparate element if we have vendor-specific objective evidence of fair value of the element. Fair value is generallydetermined based upon the price charged when the element is sold separately. If the fair value of each elementcannot be objectively determined, the total value of the arrangement is recognized ratably over the entire serviceperiod to the extent that all services were provided at the outset of the period. For most multiple elementarrangements where software products are sold in conjunction with application hosting and or proactive conversionsolutions, the fair value of each element has not been objectively determinable. Therefore, all revenue under thesetypes of arrangements is recognized ratably over the related estimated service period to the extent that all serviceshave begun to be provided at the outset of the period.
Revenues from professional service arrangements are recognized as the services are performed, provided thatamounts due from customers are fixed or determinable and deemed collectible by management. We charge forprofessional services primarily on a time-and-material basis. Amounts collected prior to satisfying the aboverevenue recognition criteria are reflected as deferred revenue. Deferred revenue primarily consists of advancepayments related to support and maintenance, hosting and service agreements.
We also sell our services through a reseller channel. Assuming all other revenue recognition criteria are met,we recognize revenue from reseller arrangements based on the reseller’s contracted commitment. We do not grantour resellers the right of return or price protection.
Accounts Receivable and Bad Debts
We maintain allowances for doubtful accounts for estimated losses resulting from the inability of ourcustomers to make required payments. We continuously monitor collections and payments from our customersand determine the allowance for doubtful accounts based upon historical experience and specific customercollection issues. If the financial condition of our customers were to deteriorate, resulting in an impairment oftheir ability to make payments, additional allowances would be required.
Research and Development Costs
We account for research and development costs in accordance with SFAS No. 2, Accounting for Research andDevelopment Costs, and SFAS No. 86, Accounting for the Costs of Computer Software to be Sold, Leased, orOtherwise Marketed, which specifies that costs incurred internally to develop computer software products shouldbe charged to expense as incurred until technological feasibility is reached for the product. Once technologicalfeasibility is reached, all software costs should be capitalized until the product is made available for general releaseto customers. Judgment is required in determining when technological feasibility is established. We believe that thetime period from reaching technological feasibility until the time of general product release is very short. Costsincurred after technological feasibility is reached are not material, and accordingly, all such costs are charged toresearch and development expense as incurred.
Restructuring Expenses
During the years ended 2006, 2005 and 2004, we recorded net restructuring charges/(benefits) of ($0.1) mil-lion, $0.9 million and $3.6 million, respectively, pertaining to the closure and consolidation of excess facilities,impairment of assets as discussed below, employee severance benefits and settlement of certain contractualobligations. These charges and benefits were recorded in accordance with SFAS No. 146, Accounting for CostsAssociated with Exit or Disposal Activities, SFAS No. 88, Employers’ Accounting for Settlements and Curtailments
25
of Defined Benefit Pension Plans and for Termination Benefits and SAB No. 100 (SAB 100), Restructuring andImpairment Charges. The 2002 and 2001 charges were recorded in accordance with EITF, Issue No. 94-3, LiabilityRecognition for Certain Employee Termination Benefits and Other Costs to Exit an Activity (including CertainCosts Incurred in a Restructuring), SFAS 88, and SAB 100. In determining the charges to record, we made certainestimates and judgments surrounding the amounts ultimately to be paid for the actions we have taken. AtDecember 31, 2006, there were several accruals recorded for lease obligations, which may be adjusted periodicallyfor either resolution of certain contractual commitments or changes in estimates of sublease income or the period oftime the facilities will be vacant and subleased. Although we do not anticipate additional significant changes to ourrestructuring accruals, the actual costs may differ from those recorded in the event that the subleasing assumptionsrequire adjustment. Such changes in estimates have had a material impact on our operating results in the past andcould have a material impact on our operating results in the future.
To estimate the costs related to our restructuring efforts, management made its best estimates of the most likelyexpected outcomes of the significant actions to accomplish the restructuring. These estimates principally related tocosts attributable to excess leased facilities and included estimates of future sublease income, future net operatingexpenses of the facilities, brokerage commissions and other expenses. The most significant of these estimatesrelated to the timing and extent of future sublease income that would reduce our lease obligations.
Included in our accrued restructuring balance at December 31, 2006 was estimated sublease income of$2.4 million. We based our estimate of sublease income on the status of current negotiations with a potentialsubtenant and current market conditions and rental rates for this location. Actual results may vary significantly fromthis estimate, depending in part on our ability to obtain approval of the sublease from the landlord. We review thestatus of our restructuring activities on a quarterly basis and, if appropriate, record adjustments to our restructuringobligations in our financial statements for such quarter based on management’s current best estimates.
Impairment or Disposal of Long Lived Assets, including Intangible Assets
We review our long-lived assets, including intangible assets subject to amortization, whenever events orchanges in circumstances indicate that the carrying amount of such an asset may not be recoverable. Recoverabilityof these assets is measured by comparison of their carrying amount to the future undiscounted cash flows the assetsare expected to generate. If such assets are considered impaired, the impairment to be recognized is equal to theamount by which the carrying value of the assets exceeds their fair market value determined by either a quotedmarket price, if any, or a value determined by utilizing a discounted cash flow technique. In assessing recoverability,we must make assumptions regarding estimated future cash flows and discount factors. If these estimates or relatedassumptions change in the future, we may be required to record impairment charges. Intangible assets withdeterminable lives are amortized over their estimated useful lives, based upon the pattern in which the expectedbenefits will be realized, or on a straight-line basis, whichever is greater.
Goodwill
Goodwill represents the excess of the purchase price in a business combination over the fair value of nettangible and intangible assets acquired in a business combination. In accordance with SFAS No. 142, Goodwill andOther Intangible Assets, we evaluate goodwill for impairment annually, as well as whenever events or changes incircumstances suggest that the carrying amount may not be recoverable from estimated discounted future cashflows. Because we have one reporting segment under SFAS 142, we utilize the entity-wide approach for assessinggoodwill for impairment and compare our market value to our net book value to determine if impairment exists. Noimpairment of goodwill resulted from our evaluation of goodwill in any of the fiscal years presented.
Accounting for Income Taxes
We account for income taxes in accordance with SFAS No. 109, Accounting for Income Taxes, which requiresthat deferred tax assets and liabilities be recognized using enacted tax rates for the effect of temporary differencesbetween the book and tax bases of recorded assets and liabilities. SFAS 109 also requires that deferred tax assets bereduced by a valuation allowance if it is more likely than not that some portion or all of the deferred tax assets willnot be realized. We evaluate the realizability of our deferred tax assets quarterly and adjust the amount of such
26
allowance, if necessary. At December 31, 2006 and 2005, we have provided a full valuation allowance against ournet deferred tax assets due to the uncertainty surrounding the realizability of these assets. The valuation allowancedecreased $1.6 million to $117.8 million in 2006 from $119.4 million in 2005. The primary reason for the decreasein the valuation allowance is due to a decrease of $7.1 million utilized to offset current book income and an increaseof $5.5 million related to tax credits and other temporary differences.
In addition, we have provided for potential amounts due in various foreign tax jurisdictions. Judgment isrequired in determining our worldwide income tax expense provision. In the ordinary course of global business,there are many transactions and calculations where the ultimate tax outcome is uncertain. Some of theseuncertainties arise as a consequence of cost reimbursement arrangements among related entities. Although webelieve our estimates are reasonable, no assurance can be given that the final tax outcome of these matters will notbe different from that which is reflected in our historical income tax provisions and accruals. Such differences couldhave a material impact on our income tax provision and operating results in the period in which such determinationis made. During 2006 and 2004, we reversed previously accrued taxes of $2.6 million and $158,000, respectively,for foreign locations due to the closure of the tax years under audit or the expiration of the statute of limitations incertain foreign jurisdictions.
Stock-Based Compensation Expense
Since January 1, 2006, we have accounted for stock-based compensation in accordance with SFAS No. 123(R).Historically, we recognized stock-based compensation costs pursuant to Accounting Principles Bulletin No. 25,Accounting for Stock Issued to Employees, and elected to disclose the impact of expensing stock options pursuant toSFAS No. 123, Share-Based Payment, in the notes to our financial statements. See Note 6 to the FinancialStatements included elsewhere in this Annual Report on Form 10-K. Under the fair value recognition provisions ofSFAS No. 123(R), stock-based compensation cost is measured at the grant date based on the value of the award andis recognized as expense over the vesting period. We have selected the Black-Scholes option pricing model todetermine fair value of stock option awards. Determining the fair value of stock-based awards at the grant daterequires judgment, including estimating the expected life of the stock awards and the volatility of the underlyingcommon stock. Our assumptions may differ from those used in prior periods because of adjustments to thecalculation of such assumptions based upon the guidance of SFAS No. 123(R) and SAB No. 107, Share-BasedPayment. Changes to the assumptions may have a significant impact on the fair value of stock options, which couldhave a material impact on our financial statements. In addition, judgment is also required in estimating the amountof stock-based awards that are expected to be forfeited. Should our actual forfeiture rates differ significantly fromour estimates, our stock-based compensation expense and results of operations could be materially impacted.
27
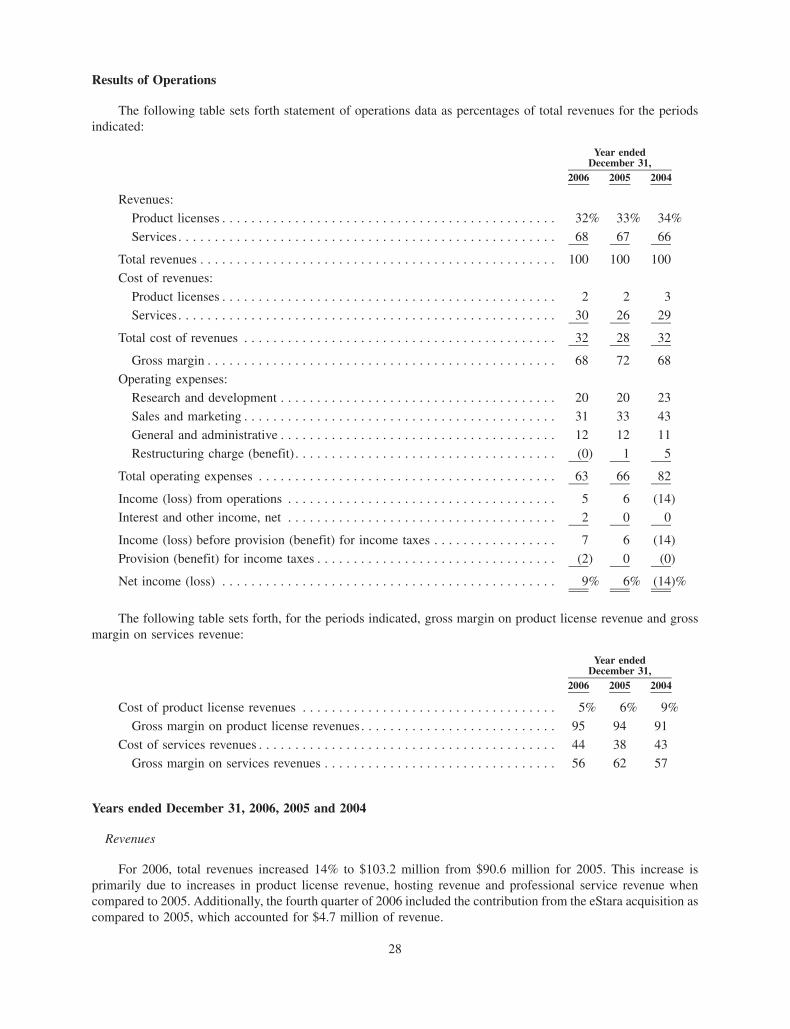
Results of Operations
The following table sets forth statement of operations data as percentages of total revenues for the periodsindicated:
2006 2005 2004
Year endedDecember 31,
Revenues:
Product licenses . . . . . . . . . . . . . . . . . . . . . . . . . . . . . . . . . . . . . . . . . . . . . . 32% 33% 34%
Services . . . . . . . . . . . . . . . . . . . . . . . . . . . . . . . . . . . . . . . . . . . . . . . . . . . . 68 67 66
Total revenues . . . . . . . . . . . . . . . . . . . . . . . . . . . . . . . . . . . . . . . . . . . . . . . . . 100 100 100
Cost of revenues:
Product licenses . . . . . . . . . . . . . . . . . . . . . . . . . . . . . . . . . . . . . . . . . . . . . . 2 2 3
Services . . . . . . . . . . . . . . . . . . . . . . . . . . . . . . . . . . . . . . . . . . . . . . . . . . . . 30 26 29
Total cost of revenues . . . . . . . . . . . . . . . . . . . . . . . . . . . . . . . . . . . . . . . . . . . 32 28 32
Gross margin . . . . . . . . . . . . . . . . . . . . . . . . . . . . . . . . . . . . . . . . . . . . . . . . 68 72 68
Operating expenses:Research and development . . . . . . . . . . . . . . . . . . . . . . . . . . . . . . . . . . . . . . 20 20 23
Sales and marketing . . . . . . . . . . . . . . . . . . . . . . . . . . . . . . . . . . . . . . . . . . . 31 33 43
General and administrative . . . . . . . . . . . . . . . . . . . . . . . . . . . . . . . . . . . . . . 12 12 11
Restructuring charge (benefit) . . . . . . . . . . . . . . . . . . . . . . . . . . . . . . . . . . . . (0) 1 5
Total operating expenses . . . . . . . . . . . . . . . . . . . . . . . . . . . . . . . . . . . . . . . . . 63 66 82
Income (loss) from operations . . . . . . . . . . . . . . . . . . . . . . . . . . . . . . . . . . . . . 5 6 (14)
Interest and other income, net . . . . . . . . . . . . . . . . . . . . . . . . . . . . . . . . . . . . . 2 0 0
Income (loss) before provision (benefit) for income taxes . . . . . . . . . . . . . . . . . 7 6 (14)
Provision (benefit) for income taxes . . . . . . . . . . . . . . . . . . . . . . . . . . . . . . . . . (2) 0 (0)
Net income (loss) . . . . . . . . . . . . . . . . . . . . . . . . . . . . . . . . . . . . . . . . . . . . . . 9% 6% (14)%
The following table sets forth, for the periods indicated, gross margin on product license revenue and grossmargin on services revenue:
2006 2005 2004
Year endedDecember 31,
Cost of product license revenues . . . . . . . . . . . . . . . . . . . . . . . . . . . . . . . . . . . 5% 6% 9%
Gross margin on product license revenues . . . . . . . . . . . . . . . . . . . . . . . . . . . 95 94 91
Cost of services revenues . . . . . . . . . . . . . . . . . . . . . . . . . . . . . . . . . . . . . . . . . 44 38 43
Gross margin on services revenues . . . . . . . . . . . . . . . . . . . . . . . . . . . . . . . . 56 62 57
Years ended December 31, 2006, 2005 and 2004
Revenues
For 2006, total revenues increased 14% to $103.2 million from $90.6 million for 2005. This increase isprimarily due to increases in product license revenue, hosting revenue and professional service revenue whencompared to 2005. Additionally, the fourth quarter of 2006 included the contribution from the eStara acquisition ascompared to 2005, which accounted for $4.7 million of revenue.
28
Total revenues increased 31% to $90.6 million in 2005 from $69.2 million in 2004. The increase was primarilyattributable to our acquisition of Primus in November 2004 and the shift in our focus to marketing and sellingapplication products rather than infrastructure products.
Since 2004 our focus has been on e-commerce and service applications, and through our Primus acquisition,solutions that enable our customers to deliver a superior customer experience via contact centers, informationtechnology help desks, web (intranet and Internet) self-service and electronic communication channels.
For 2006, revenues generated from international customers increased to 25% of total revenues from 24% oftotal revenues in 2005.
No single customer accounted for more than 10% of our total revenues in 2006, 2005 or 2004.
We expect full year 2007 revenues in the range of $117.0 million to $123.0 million.
Product License Revenues
Product license revenues increased 10% to $32.8 million for 2006 from $29.8 million for 2005. This increase isprimarily attributable to increased demand of our Commerce product suite due to an improvement in the overalle-commerce market.
Product license revenues increased 28% to $29.8 million in 2005 from $23.3 million in 2004. The increase wasprimarily attributable to our acquisition of Primus in November 2004 and the shift in our focus of our marketing andselling efforts to applications products from infrastructure products.
Product license revenues generated from international customers increased 22% to $9.0 million in 2006 from$7.4 million for the 2005. The increase in international revenues was primarily due to several new internationalcustomers.
Product license revenues generated from international customers decreased to $7.4 million in 2005 from$9.4 million in 2004. The decrease in international revenues was primarily due to the timing of certain deals.
Product license revenues as a percentage of total revenues for 2006, 2005 and 2004 were 32%, 33% and 34%,respectively. We expect this percentage to be in the range of 15% to 20% in 2007. The expected year over yeardecrease in product license revenue as a percent of total revenue is due to our expectation that an increasing percentof product license revenue will be recognized ratably.
Our resellers receive a discount from our list price. The extent of any discount is based on negotiatedcontractual agreements between us and the reseller. We do not grant our resellers the right of return, price protectionor favorable payment terms. We rely upon resellers to market and sell our products and support and maintenance togovernmental entities and to customers in geographic regions where it is not cost effective for us to sell directly. Wehave approximately 17 active resellers. Reseller revenues and the percentage of revenues from resellers can varysignificantly from period to period. No resellers accounted for more than 10% of our revenues in 2006, 2005 or2004.
Services Revenues
Services revenues increased 16% to $70.4 million for 2006 from $60.8 million for 2005. The increase wasprimarily attributable to the addition of eStara service revenue. The increase is also attributed to new servicerevenue from professional services and application hosting services associated with our new ATG OnDemandService offerings.
Services revenues increased 33% to $60.8 million in 2005 from $45.9 million in 2004. The increase wasattributable to new service revenues from the acquisition of Primus, specifically including application hostingservices.
Support and maintenance revenues were 56% of total service revenues for 2006 as compared to 64.0% for2005. Support and maintenance revenues decreased as a percentage of total service revenue due to increases inprofessional services, hosting and eStara revenue.
29
Support and maintenance revenues were 64% of total services revenues in 2005 and 2004. Support andmaintenance revenues, in absolute dollars, were higher during 2005 due primarily to the addition of Primus’ activesupport and maintenance customer base.
Revenue from on demand services (includes both application hosting services and eStara) increased 122% to$11.8 million for 2006 from $5.3 million for 2005. This increase is primarily due to the addition of $4.7 million ofeStara revenue in the fourth quarter of 2006. We expect on demand service revenue to become a larger portion of ourservices revenue as a result of our new expanding product offerings and the contribution from eStara.
Services revenues as a percentage of total revenues for 2006, 2005 and 2004 were 68%, 67% and 66%,respectively.
Cost of Product License Revenues
Cost of product license revenues includes salary, benefits and stock-based compensation costs associated withfulfillment and engineering staff dedicated to maintenance of products that are in general release, the amortizationof licenses purchased in support of and used in our products, royalties paid to vendors whose technology isincorporated into our products and amortization expense related to acquired developed technology.
Cost of product license revenues was $1.8 million in 2006 and 2005. Cost of product license revenuesdecreased 18% to $1.8 million in 2005 from $2.2 million in 2004. This decrease was primarily related to a reductionin salary and related costs along with decreased royalties paid on third party software embedded in our products,partially offset by an increase in amortization of acquired intangibles.
Gross Margin on Product License Revenues
For 2006, 2005 and 2004, gross margin on product license revenues was 95%, or $31.0 million, 94%, or$28.0 million and 91%, or $21.1 million, respectively. The sequential increase primarily relates to higher productlicense revenue, partially offset by an increase in royalties.
Cost of Services Revenues
Cost of services revenues includes salary, benefits and stock-based compensation and other related costs forour professional services and technical support staff, as well as third-party contractor expenses. Additionally, cost ofservices revenues includes fees for hosting facilities, bandwidth costs, telecommunication fees, amortization ofacquired intangibles and equipment and related depreciation costs. Cost of services revenues will vary significantlyfrom period to period depending on the level of professional services staffing, the effective utilization rates of ourprofessional services staff, the mix of services performed, including product license technical support services, theextent to which these services are performed by us or by third-party contractors, the level of third-party contractors’fees, and the amount of equipment, bandwidth and hosting space required.
Cost of services revenues increased 32% to $30.8 million in 2006 from $23.3 million in 2005. The increase in2006 was primarily attributable to an increase in professional services salary and salary related expenses,specifically including stock-based compensation expense related to our adoption of SFAS 123R in 2006. Addi-tionally, eStara cost of services was included in the fourth quarter of 2006.
Cost of services revenues increased 17% to $23.3 million in 2005 from $19.9 million in 2004. The increase wasprimarily attributable to an increase in service revenues of 33% for the year and a full year of hosting activities;resulting in an increase in salaries and benefits and increased use of third party contractors.
Gross Margin on Services Revenues
For 2006, gross margin on services revenues was 56%, or $39.6 million, compared to 62%, or $37.6 million, inthe corresponding period in 2005 and 57%, or $26.0 million in 2004. The decrease in gross margin was primarilyattributable to the change in service revenue mix, our continued investment in OnDemand services and stock-basedcompensation expenses under SFAS 123R. The nature of our OnDemand service requires us to make an upfrontfixed investment in both people and capital before we realize economies of scale in our infrastructure. The increase
30
in gross margin in 2005 compared with 2004 was primarily attributable to continued use of third party contractors tocontrol costs.
Research and Development Expenses
Research and development expenses consist primarily of salary, benefits and stock-based compensation tosupport product development, as well as costs related to our use of third party offshore contractors. To date, allsoftware development costs have been expensed as research and development in the period incurred.
Research and development expenses increased 15% to $20.4 million in 2006 from $17.8 million in 2005. Theincrease in 2006 compared to 2005 was primarily attributable to an increase in outsourcing services and stock-basedcompensation expense related to our adoption of SFAS 123R in 2006. Research and development expensesincreased 10% in 2005 as compared to 2004. The increase was primarily attributable to an increase in our use ofthird party offshore contractors.
We expect 2007 research and development expenses as a percentage of revenue to be in the 20% - 21% range.
Sales and Marketing Expenses
Sales and marketing expenses consist primarily of salaries, benefits, stock-based compensation, commissionsfor sales and marketing personnel, travel, public relations, and marketing materials and events.
Sales and marketing expenses increased 7% to $32.0 million in 2006 from $30.0 million in 2005. The increasein 2006 compared to 2005 was primarily attributable to the inclusion of eStara expenses, including amortization ofacquired intangibles for customer relationships and stock-based compensation expense related to our adoption ofSFAS 123R in 2006.
Sales and marketing expenses increased 1% in 2005 as compared to 2004. The increase was primarilyattributable to an increase in amortization of acquired intangibles for customer relationships related to the Primusacquisition.
We anticipate that 2007 sales and marketing expenses as a percentage of total revenues will be in the mid-30%range. However, sales and marketing expenses can fluctuate as a percentage of total revenues depending on the leveland timing of global expansion, program spending, the rate at which new sales personnel become productive and thelevel of revenue.
General and Administrative Expenses
General and administrative expenses consist primarily of the following components: salary benefits, stock-based compensation and other related costs, including expenses for executive, finance, legal, business applications,internal network management, human resources and other administrative personnel; fees for professional services;non-income related taxes; insurance costs; and rent and other facility-related expenditures for leased properties.
General and administrative expenses increased 15% to $13.0 million in 2006 from $11.2 million in 2005. Theincrease for 2006 when compared to 2005 is primarily due to eStara expenses and stock-based compensationexpense related to our adoption of SFAS 123R in 2006.
General and administrative expenses increased 45% to $11.2 million in 2005 from $7.7 million in 2004. Theincrease was primarily attributable to an increase in outside services and professional fees, an increase in insuranceexpenses and amortization of acquired intangibles attributable to our acquisition of Primus.
Stock-based Compensation Expense
On January 1, 2006, we adopted Statement of Financial Accounting Standards No. 123(R), Share-BasedPayment, or SFAS 123R, using the modified prospective application method. Compensation cost is calculated onthe date of grant using the fair value of the options as calculated by the Black-Scholes valuation model and isrecognized ratably over the employee’s service period.
31

As a result of adopting SFAS 123R on January 1, 2006, our operating profit before income taxes and netincome were each lower by $3.6 million, and basic and diluted earnings per share were lower by $0.04 and $0.03,respectively, than if we had continued to account for share-based compensation under APB 25. As of December 31,2006, the total compensation cost related to unvested awards to employees not yet recognized in the statement ofoperations was approximately $10.9 million, which will be recognized over a weighted average period of 1.5 years.
Restructuring
In 2001 through 2005, we took restructuring actions to realign our operating expenses and facilities with therequirements of our business and current market conditions and recorded adjustments to prior restructuring charges.These actions have included closure and consolidation of excess facilities, reductions in the number of ouremployees, abandonment or disposal of tangible assets and settlement of contractual obligations. In connectionwith each of these actions we have recorded restructuring charges, based in part upon our estimates of the costsultimately to be paid for the actions we have taken. When circumstances result in changes in our estimates relatingto our accrued restructuring costs, we reflect these changes as additional charges or benefits in the period in whichthe change of estimate occurs. As of December 31, 2006, we had restructuring accruals of $2.2 million. We recordedcharges (benefits) of $(0.1) million, $0.9 million and $3.6 million in 2006, 2005 and 2004, respectively. For detailedinformation about our restructuring activities and related costs and accruals, see Note 11 to the ConsolidatedFinancial Statements contained in Item 8 of this Annual Report on Form 10-K.
Abandoned Facilities Obligations
At December 31, 2006, we had lease arrangements related to three abandoned facilities. Of these locations, therestructuring accrual for the Waltham, Massachusetts location is net of assumed sublease income. We have madecertain assumptions regarding the future sublease income for this facility which are shown in the table below. Therestructuring accrual for the other facilities, is net of contractual amounts due under any executed sub-leaseagreement. All locations for which we have recorded restructuring charges have been exited, and thus our plans withrespect to these leases have been completed. A summary of the remaining abandoned facility locations and thetiming of the remaining cash payments are as follows (in thousands):
2007 2008 2009 Total
Waltham, MA . . . . . . . . . . . . . . . . . . . . . . . . . . . . . . . . . . $ 1,384 $ 1,384 $ 346 $ 3,114
San Francisco, CA. . . . . . . . . . . . . . . . . . . . . . . . . . . . . . . 515 — — 515
Reading, UK . . . . . . . . . . . . . . . . . . . . . . . . . . . . . . . . . . . 483 483 81 1,047
Facility obligations, gross . . . . . . . . . . . . . . . . . . . . . . . . . 2,382 1,867 427 4,676
Contracted and assumed sublet income. . . . . . . . . . . . . . . . (1,153) (1,051) (193) (2,397)
Net cash obligations . . . . . . . . . . . . . . . . . . . . . . . . . . . . . $ 1,229 $ 816 $ 234 $ 2,279
Interest and Other Income, Net
Interest and other income, net increased to $1.7 million for 2006 from $219,000 for 2005. The increase wasprimarily due to an increase in interest income resulting from our higher average cash and investment balances andforeign currency exchange gains.
Interest and other income, net decreased 45% to $219,000 from $395,000 in 2004. The decrease was primarilydue to an increase in foreign exchange losses, partially offset by an increase in interest income.
Provision (Benefit) for Income Taxes
For the year ended December 31, 2006, we recorded an income tax benefit of $2.6 million. This relates toreversing certain tax reserves in foreign locations that were no longer required due to closed tax years under auditand expiration of the statue of limitations at certain foreign jurisdictions.
We had no Federal or foreign income taxes for 2006 due to taxable losses in domestic and certain foreignlocations in 2006 and the use of net operating loss carry-forwards. We recorded state income taxes for 2006 of
32
approximately $12,000. Accordingly, only a state provision for taxes has been recorded for 2006. Taxes recorded in2005 were for foreign locations. In 2004, we reversed previously accrued taxes for foreign locations due to theclosure of statute of limitations, or as a result of changes in our estimates of potential amounts due in those locations.
As a result of historical net operating losses incurred, and after evaluating our anticipated performance over ournormal planning horizon, we have provided a full valuation allowance for our net operating loss carry-forwards, researchcredit carry-forwards and other net deferred tax assets. The primary differences between our book and tax income thatgive rise to a tax loss for 2006 are due to the amortization of capitalized research and development expenses andpayments on lease restructuring reserves partially offset by SFAS 123R stock compensation expenses.
eStara Acquisition
On October 2, 2006, we acquired all of the outstanding shares of common stock of privately held eStara, Inc. toenhance online sales and support initiatives. The aggregate purchase price was $49.8 million, which consisted of$39.2 million of our common stock, $8.4 million of cash issued for transaction bonus to eStara employees of$4.8 million and $3.6 million in lieu of issuing ATG common stock to non-accredited investors, and $2.2 million oftransaction costs, which primarily consisted of fees paid for financial advisory, legal and accounting services. Weissued approximately 14.6 million shares of ATG common stock, the fair value of which was based upon a five-dayaverage of the closing price two days before and two days after the terms of the acquisition were agreed to andpublicly announced. The excess of the purchase price over the net assets acquired resulted in goodwill of$32.1 million. We also issued 0.3 million shares of restricted stock which will be recognized as stock-basedcompensation expense over the vesting term. In connection with this acquisition, we acquired $14.0 million ofintangible assets for customer relationships, developed technology and trademarks, which are being amortized overtheir estimated useful lives.
We may also pay up to an additional $6.0 million in potential earn-out payments to the stockholders and employeesof eStara based on the eStara revenues for fiscal 2007. If eStara’s revenues exceed $25.0 million but are less than$30.0 million, ATG will be required to pay $2.0 million, of which $0.6 million will be distributed to the stockholders and$1.4 million will be distributed to employees. In the event eStara’s revenues exceed $30.0 million, ATG will be requiredto pay an additional $4.0 million, of which $2.5 million will be distributed to stockholders and $1.5 million will bedistributed to employees. The payments to stockholders will be recorded as additional purchase price, and the amountspaid to employees will be accounted for as compensation expense in our income statement as it relates to amounts paid toeStara employee shareholders in excess of that paid to non-employee stockholders. These payments may be made, at ouroption, in the form of cash or stock, subject to the applicable rules of the Nasdaq stock market and applicable limitationsunder the tax rules to permit the transaction to be categorized as a tax-free reorganization.
Liquidity and Capital Resources
Our capital requirements relate primarily to facilities, employee infrastructure and working capital require-ments. Our primary sources of liquidity at December 31, 2006 were our cash, cash equivalents and short-termmarketable securities of $31.2 million.
Cash provided by operating activities was $7.6 million in 2006. This consisted of net income of $9.7 million,depreciation and amortization of $5.1 million, stock-based compensation expense of $3.8 million, offset by a$9.4 million increase in accounts receivable and a $2.5 million decrease in accrued restructuring costs.
Our investing activities for the year ended December 31, 2006 used cash of $15.6 million, which consistedprimarily of net cash payments associated with the acquisition of eStara, Inc. of $7.2 million, capital expenditures of$4.5 million and net purchases of marketable securities of $3.8 million. We expect capital expenditures in 2007 tobe approximately 5% of annual revenue.
Net cash provided by financing activities was $1.9 million for the year ended December 31, 2006, whichconsisted primarily of $2.2 million in proceeds from exercised employee stock options offset by principal paymentson notes payable and capital leases.
We believe that our balance of $31.2 million in cash and cash equivalents and marketable securities atDecember 31, 2006, including the effect of the cash to be paid to complete the eStara acquisition, along with other
33
working capital and cash expected to be generated by our operations will allow us to meet our liquidity needs over atleast the next twelve months. However, our actual cash requirements will depend on many factors, includingparticularly, overall economic conditions both domestically and abroad. We may seek additional external fundsthrough public or private securities offerings, strategic alliances or other financing sources. There can be noassurance that if we seek external funding, it will be available on favorable terms, if at all.
Credit Facility
We have an existing $20.0 million revolving line of credit with Silicon Valley Bank (the Bank). The line ofcredit is secured by all of our tangible and intangible personal property and is subject to financial covenantsincluding liquidity coverage and profitability. The line of credit will expire on January 31, 2008.
While there were no outstanding borrowings under the facility at December 31, 2006, the Bank had issuedstanding letters of credit totaling $5.3 million on our behalf, which are supported by this facility. The standing lettersof credit have been issued in favor of various landlords to secure obligations under our facility leases pursuant toleases expiring through December 2012. The line of credit bears interest at the Bank’s prime rate (8.25% atDecember 31, 2006). As of December 31, 2006, approximately $14.7 million was available under the facility.
Contractual Obligations
On December 31, 2006, our contractual cash obligations, which consist primarily of operating leases, were asfollows (in thousands):
Contractual Obligations TotalLess than
1 year 1-3 years 3-5 yearsMore than
5 years
Operating Leases . . . . . . . . . . . . . . . . . . . . $15,216 $4,823 $6,819 $3,574 $0
In addition, we have an obligation for contingent consideration of up to $6 million based on eStara’s 2007revenue.
Recent Accounting Pronouncements
In June 2006, the FASB issued FIN No. 48, Accounting for Uncertainty in Income Taxes, an Interpretation ofFASB Statement No. 109 (“FIN No. 48”). FIN No. 48 clarifies the accounting for uncertainty in income taxesrecognized in an enterprise’s financial statements in accordance with FASB Statement No. 109, Accounting forIncome Taxes. FIN No. 48 prescribes a two-step process to determine the amount of tax benefit to be recognized.First, the tax position must be evaluated to determine the likelihood that it will be sustained upon externalexamination. If the tax position is deemed more-likely-than-not to be sustained, the tax position is then assessed todetermine the amount of benefit to recognize in the financial statements. The amount of the benefit that may berecognized is the largest amount that has a greater than 50 percent likelihood of being realized upon ultimatesettlement. FIN No. 48 is effective for us beginning in 2007. We do not expect the implementation of FIN No. 48 tohave a material impact on our financial statements.
In September 2006, the Securities and Exchange Commission, or the SEC, released SAB No. 108,(“SAB 108”). SAB 108 expresses the SEC staff’s views regarding the process of quantifying and recordingfinancial statement misstatements. These interpretations were issued to address diversity in practice and thepotential under current practice for the build up of improper amounts on the balance sheet. SAB 108 expresses theSEC staff’s view that a registrant’s materiality evaluation of an identified unadjusted error should quantify theeffects of the error on each financial statement and related financial statement disclosures and that prior yearmisstatements should be considered in quantifying misstatements in current year financial statements. SAB 108also states that correcting prior year financial statements for immaterial errors would not require previously filedreports to be amended. Such correction may be made the next time the registrant files the prior year financialstatements. Registrants electing not to restate prior periods should reflect the effects of initially applying theguidance in SAB 108 in their annual financial statements covering the first fiscal year ending after November 15,2006. The cumulative effect of the initial application should be reported in the carrying amounts of assets andliabilities as of the beginning of that fiscal year and the offsetting adjustment should be made to the opening balanceof retained earnings for that year. Registrants should disclose the nature and amount of each individual error being
34
corrected in the cumulative adjustment. The disclosure should also include when and how each error arose and thefact that the errors had previously been considered immaterial. The SEC staff encourages early application of theguidance in SAB 108 for interim periods of the first fiscal year ending after November 15, 2006. The imple-mentation of SAB 108 did not have any impact on our financial statements.
In September 2006, the FASB issued SFAS No. 157, Fair Value Measurements, (“SFAS 157”). SFAS 157defines “fair value”, establishes a framework for measuring fair value in generally accepted accounting principles,and expands disclosures about fair value measurements. SFAS 157 does not require any new fair value measure-ments but may change current practice for some entities. SFAS 157 is effective for financial statements issued forfiscal years beginning after November 15, 2007 and interim periods within those years. We are currently evaluatingthe potential impact of SFAS 157 on our financial position and results of operations.
Item 7A. Quantitative and Qualitative Disclosures about Market Risk
We maintain an investment portfolio consisting mainly of investment grade money market funds, corporateobligations and government obligations with a weighted average maturity of less than one year. These held-to-ma-turity securities are subject to interest rate risk. However, a 10% change in interest rates would not have any impactto the fair values of these securities at December 31, 2006 and 2005 primarily due to their short maturity and ourintent to hold the securities to maturity. There have been no significant changes since December 31, 2006.
The majority of our operations are based in the U.S., and accordingly, the majority of our transactions aredenominated in U.S. dollars. However, we have foreign-based operations where transactions are denominated inforeign currencies and are subject to market risk with respect to fluctuations in the relative value of foreigncurrencies. Our primary foreign currency exposures relate to our short-term intercompany balances with our foreignsubsidiaries and accounts receivable valued in the United Kingdom in U.S. dollars. Our primary foreign subsidiarieshave functional currencies denominated in the British pound and Euro, and foreign denominated assets andliabilities are remeasured each reporting period with any exchange gains and losses recorded in our consolidatedstatements of operations. Based on currency exposures existing at December 31, 2006 and 2005, a 10% movementin foreign exchange rates would not expose us to significant gains or losses in earnings or cash flows. We may usederivative instruments to manage the risk of exchange rate fluctuations. However, at December 31, 2006, we had nooutstanding derivative instruments. We do not use derivative instruments for trading or speculative purposes.
35
Item 8. Consolidated Financial Statements and Supplementary Data
Report of Independent Registered Public Accounting Firm
The Board of Directors and StockholdersArt Technology Group, Inc.
We have audited the accompanying consolidated balance sheets of Art Technology Group, Inc. as ofDecember 31, 2006 and 2005, and the related consolidated statements of operations, stockholders’ equity andcomprehensive income (loss), and cash flows for each of the three years in the period ended December 31, 2006.These financial statements are the responsibility of the Company’s management. Our responsibility is to express anopinion on these financial statements based on our audits.
We conducted our audits in accordance with the standards of the Public Company Accounting Oversight Board(United States). Those standards require that we plan and perform the audit to obtain reasonable assurance aboutwhether the financial statements are free of material misstatement. An audit includes examining, on a test basis,evidence supporting the amounts and disclosures in the financial statements. An audit also includes assessing theaccounting principles used and significant estimates made by management, as well as evaluating the overallfinancial statement presentation. We believe that our audits provide a reasonable basis for our opinion.
In our opinion, the financial statements referred to above present fairly, in all material respects, theconsolidated financial position of Art Technology Group, Inc. at December 31, 2006 and 2005, and the consolidatedresults of its operations and its cash flows for each of the three years in the period ended December 31, 2006, inconformity with U.S. generally accepted accounting principles.
As discussed in Note 1(m) and Note 6 to the financial statements, effective January 1, 2006, the Companyadopted Statement of Financial Accounting Standards No. 123(R), Share-Based Payment, using the modified-prospective transition method.
We also have audited, in accordance with the standards of the Public Company Accounting Oversight Board(United States), the effectiveness of Art Technology Group, Inc.’s internal control over financial reporting as ofDecember 31, 2006, based on criteria established in Internal Control-Integrated Framework issued by theCommittee of Sponsoring Organizations of the Treadway Commission and our report dated March 14, 2007expressed an adverse opinion thereon.
/s/ ERNST & YOUNG LLP
Boston, MassachusettsMarch 14, 2007
36

ART TECHNOLOGY GROUP, INC.
CONSOLIDATED BALANCE SHEETS(In thousands, except share and per share data)
2006 2005December 31,
ASSETSCurrent Assets:
Cash and cash equivalents . . . . . . . . . . . . . . . . . . . . . . . . . . . . . . . . . . . . . . . . . . $ 17,911 $ 24,060
Marketable securities . . . . . . . . . . . . . . . . . . . . . . . . . . . . . . . . . . . . . . . . . . . . . . 13,312 9,509
Accounts receivable, net of reserves of $447 ($778 in 2005) . . . . . . . . . . . . . . . . . 34,554 21,459
Prepaid expenses and other current assets . . . . . . . . . . . . . . . . . . . . . . . . . . . . . . . 2,501 1,130
Total current assets . . . . . . . . . . . . . . . . . . . . . . . . . . . . . . . . . . . . . . . . . . . . . . . . . 68,278 56,158
Property and equipment, net . . . . . . . . . . . . . . . . . . . . . . . . . . . . . . . . . . . . . . . . . 5,326 2,995
Goodwill . . . . . . . . . . . . . . . . . . . . . . . . . . . . . . . . . . . . . . . . . . . . . . . . . . . . . . . 59,328 27,347
Intangible assets, net . . . . . . . . . . . . . . . . . . . . . . . . . . . . . . . . . . . . . . . . . . . . . . 16,013 4,859
Other assets . . . . . . . . . . . . . . . . . . . . . . . . . . . . . . . . . . . . . . . . . . . . . . . . . . . . . 1,036 1,406
$ 149,981 $ 92,765
LIABILITIES AND STOCKHOLDERS’ EQUITYCurrent Liabilities:
Accounts payable. . . . . . . . . . . . . . . . . . . . . . . . . . . . . . . . . . . . . . . . . . . . . . . . . $ 2,607 $ 2,719
Accrued expenses . . . . . . . . . . . . . . . . . . . . . . . . . . . . . . . . . . . . . . . . . . . . . . . . 15,791 13,359
Deferred revenue . . . . . . . . . . . . . . . . . . . . . . . . . . . . . . . . . . . . . . . . . . . . . . . . . 24,178 21,113
Accrued restructuring, current portion. . . . . . . . . . . . . . . . . . . . . . . . . . . . . . . . . . 1,213 3,012
Capital lease obligations, current portion . . . . . . . . . . . . . . . . . . . . . . . . . . . . . . . 56 56
Notes payable . . . . . . . . . . . . . . . . . . . . . . . . . . . . . . . . . . . . . . . . . . . . . . . . . . . — 198
Total current liabilities . . . . . . . . . . . . . . . . . . . . . . . . . . . . . . . . . . . . . . . . . . . . . . . 43,845 40,457
Accrued restructuring, less current portion . . . . . . . . . . . . . . . . . . . . . . . . . . . . . . . . 1,031 2,085
Capital lease obligations, less current portion . . . . . . . . . . . . . . . . . . . . . . . . . . . . . . — 63
Long-term deferred revenue . . . . . . . . . . . . . . . . . . . . . . . . . . . . . . . . . . . . . . . . . . . 31 —
Commitments and contingencies (Notes 8 and 12) . . . . . . . . . . . . . . . . . . . . . . . . . .
Stockholders’ equity:
Preferred stock, $0.01 par value; Authorized — 10,000,000 shares; Issued andoutstanding — no shares . . . . . . . . . . . . . . . . . . . . . . . . . . . . . . . . . . . . . . . . . . . — —
Common stock, $0.01 par value; Authorized — 200,000,000 shares; Issued andoutstanding — 127,055,373 shares and 110,637,606 shares at December 31, 2006and 2005, respectively . . . . . . . . . . . . . . . . . . . . . . . . . . . . . . . . . . . . . . . . . . . . . 1,270 1,106
Additional paid-in capital . . . . . . . . . . . . . . . . . . . . . . . . . . . . . . . . . . . . . . . . . . . . 296,291 251,454
Accumulated deficit . . . . . . . . . . . . . . . . . . . . . . . . . . . . . . . . . . . . . . . . . . . . . . . . (191,558) (201,253)
Accumulated other comprehensive loss . . . . . . . . . . . . . . . . . . . . . . . . . . . . . . . . . . (929) (1,147)
Total stockholders’ equity . . . . . . . . . . . . . . . . . . . . . . . . . . . . . . . . . . . . . . . . . . . . 105,074 50,160
$ 149,981 $ 92,765
The accompanying notes are an integral part of these consolidated financial statements.
37
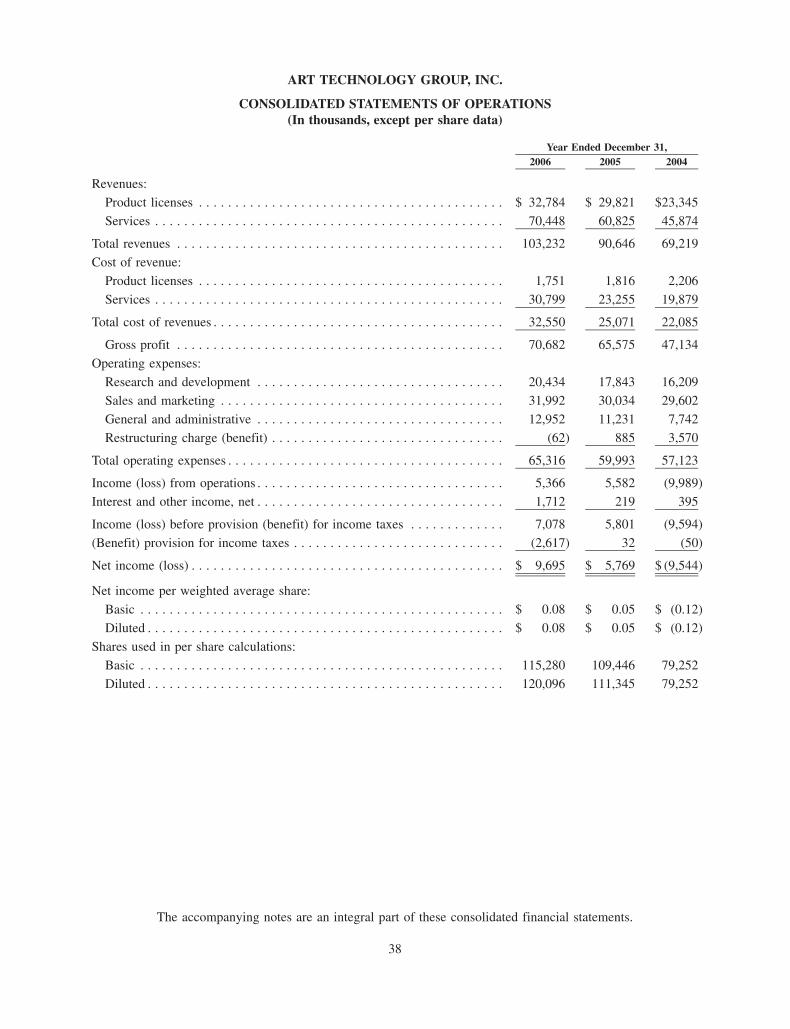
ART TECHNOLOGY GROUP, INC.
CONSOLIDATED STATEMENTS OF OPERATIONS(In thousands, except per share data)
2006 2005 2004Year Ended December 31,
Revenues:
Product licenses . . . . . . . . . . . . . . . . . . . . . . . . . . . . . . . . . . . . . . . . . . $ 32,784 $ 29,821 $23,345
Services . . . . . . . . . . . . . . . . . . . . . . . . . . . . . . . . . . . . . . . . . . . . . . . . 70,448 60,825 45,874
Total revenues . . . . . . . . . . . . . . . . . . . . . . . . . . . . . . . . . . . . . . . . . . . . . 103,232 90,646 69,219
Cost of revenue:
Product licenses . . . . . . . . . . . . . . . . . . . . . . . . . . . . . . . . . . . . . . . . . . 1,751 1,816 2,206
Services . . . . . . . . . . . . . . . . . . . . . . . . . . . . . . . . . . . . . . . . . . . . . . . . 30,799 23,255 19,879
Total cost of revenues . . . . . . . . . . . . . . . . . . . . . . . . . . . . . . . . . . . . . . . . 32,550 25,071 22,085
Gross profit . . . . . . . . . . . . . . . . . . . . . . . . . . . . . . . . . . . . . . . . . . . . . 70,682 65,575 47,134
Operating expenses:
Research and development . . . . . . . . . . . . . . . . . . . . . . . . . . . . . . . . . . 20,434 17,843 16,209
Sales and marketing . . . . . . . . . . . . . . . . . . . . . . . . . . . . . . . . . . . . . . . 31,992 30,034 29,602
General and administrative . . . . . . . . . . . . . . . . . . . . . . . . . . . . . . . . . . 12,952 11,231 7,742
Restructuring charge (benefit) . . . . . . . . . . . . . . . . . . . . . . . . . . . . . . . . (62) 885 3,570
Total operating expenses . . . . . . . . . . . . . . . . . . . . . . . . . . . . . . . . . . . . . . 65,316 59,993 57,123
Income (loss) from operations . . . . . . . . . . . . . . . . . . . . . . . . . . . . . . . . . . 5,366 5,582 (9,989)
Interest and other income, net . . . . . . . . . . . . . . . . . . . . . . . . . . . . . . . . . . 1,712 219 395
Income (loss) before provision (benefit) for income taxes . . . . . . . . . . . . . 7,078 5,801 (9,594)
(Benefit) provision for income taxes . . . . . . . . . . . . . . . . . . . . . . . . . . . . . (2,617) 32 (50)
Net income (loss) . . . . . . . . . . . . . . . . . . . . . . . . . . . . . . . . . . . . . . . . . . . $ 9,695 $ 5,769 $ (9,544)
Net income per weighted average share:
Basic . . . . . . . . . . . . . . . . . . . . . . . . . . . . . . . . . . . . . . . . . . . . . . . . . . $ 0.08 $ 0.05 $ (0.12)
Diluted . . . . . . . . . . . . . . . . . . . . . . . . . . . . . . . . . . . . . . . . . . . . . . . . . $ 0.08 $ 0.05 $ (0.12)
Shares used in per share calculations:
Basic . . . . . . . . . . . . . . . . . . . . . . . . . . . . . . . . . . . . . . . . . . . . . . . . . . 115,280 109,446 79,252
Diluted . . . . . . . . . . . . . . . . . . . . . . . . . . . . . . . . . . . . . . . . . . . . . . . . . 120,096 111,345 79,252
The accompanying notes are an integral part of these consolidated financial statements.
38

ART TECHNOLOGY GROUP, INC.
CONSOLIDATED STATEMENTS OF STOCKHOLDERS’ EQUITY ANDCOMPREHENSIVE INCOME (LOSS)
(In thousands, except share and per share information)
Number ofShares
ParValue
AdditionalPaid-InCapital
DeferredCompensation
AccumulatedDeficit
AccumulatedOther
ComprehensiveLoss
TotalStockholders’
Equity
ComprehensiveIncome(Loss)
Common Stock
(Restated) (Restated)
Balance, January 1, 2004 as restated(See Note 2) . . . . . . . . . . . . . . . 72,936,165 $ 729 $218,927 $(11) $(197,478) $(1,230) $ 20,937
Exercise of stock options. . . . . . . . . 718,126 7 525 — — — 532Issuance of common stock in
connection with employee stockpurchase plan . . . . . . . . . . . . . . 1,016,419 10 926 — — — 936 —
Issuance of common stock andvaluation of options related toPrimus acquisition . . . . . . . . . . . 33,471,256 335 29,087 — — — 29,422 —
Amortization of deferredcompensation . . . . . . . . . . . . . . — — — 11 — — 11 —
Comprehensive Income:Net loss . . . . . . . . . . . . . . . . . . . — — — — (9,544) — (9,544) $(9,544)Foreign currency translation
adjustment . . . . . . . . . . . . . . . . — — — — — (109) (109) (109)
Comprehensive loss . . . . . . . . . . . . — — — — — — — $(9,653)
Balance, December 31, 2004 . . . . . . 108,141,966 $1,081 $249,465 $ — $(207,022) $(1,339) $ 42,185Exercise of stock options. . . . . . . . . 1,751,942 18 1,342 — — — 1,360Issuance of common stock in
connection with employee stockpurchase plan . . . . . . . . . . . . . . 743,698 7 647 — — — 654
Comprehensive Income:Net income . . . . . . . . . . . . . . . . . — — — — 5,769 5,769 $ 5,769Foreign currency translation
adjustment . . . . . . . . . . . . . . . . — — — — — 192 192 192
Comprehensive income . . . . . . . . . . — — — — — — — $ 5,961
Balance, December 31, 2005 . . . . . . 110,637,606 $1,106 $251,454 $ — $(201,253) $(1,147) $ 50,160Exercise of stock options. . . . . . . . . 1,474,897 15 1,535 — — — 1,550Issuance of common stock in
connection with employee stockpurchase plan . . . . . . . . . . . . . . 327,643 3 658 — — — 661
Issuance of common stock related toeStara acquisition . . . . . . . . . . . . 14,523,386 145 38,894 — — — 39,039
Vesting of restricted stock issued toemployees . . . . . . . . . . . . . . . . 45,284 120 — — — 120
Vesting of restricted stock issuedunder the non-employee directorplan . . . . . . . . . . . . . . . . . . . . 46,557 1 55 — — — 56
Stock based compensation expense . . . — — 3,575 — — — 3,575Comprehensive Income:Net income . . . . . . . . . . . . . . . . . — — — — 9,695 — 9,695 $ 9,695Foreign currency translation
adjustment . . . . . . . . . . . . . . . . — — — — — 218 218 218
Comprehensive income . . . . . . . . . . — — — — — — — $ 9,913
Balance, December 31, 2006 . . . . . . 127,055,373 $1,270 $296,291 $ — $(191,558) $ (929) $105,074
The accompanying notes are an integral part of these consolidated financial statements.
39

ART TECHNOLOGY GROUP, INC.
CONSOLIDATED STATEMENTS OF CASH FLOWS(In thousands)
2006 2005 2004Years Ended December 31,
Cash Flows from Operating Activities:Net income (loss) . . . . . . . . . . . . . . . . . . . . . . . . . . . . . . . . . . . . . . . . . . . $ 9,695 $ 5,769 $ (9,544)Adjustments to reconcile net income (loss) to net cash provided by (used
in) operating activities:Stock-based compensation expense . . . . . . . . . . . . . . . . . . . . . . . . . . . . 3,751 — 11Depreciation and amortization . . . . . . . . . . . . . . . . . . . . . . . . . . . . . . . . 5,141 4,180 2,957Non-cash restructuring charge . . . . . . . . . . . . . . . . . . . . . . . . . . . . . . . . — 1,167 667Loss on disposal of fixed assets, net . . . . . . . . . . . . . . . . . . . . . . . . . . . — — 33
Changes in current assets and liabilities:Accounts receivable, net . . . . . . . . . . . . . . . . . . . . . . . . . . . . . . . . . . . . (9,424) 2,940 (7,147)Prepaid expenses and other current assets . . . . . . . . . . . . . . . . . . . . . . . (1,183) 434 671Deferred rent . . . . . . . . . . . . . . . . . . . . . . . . . . . . . . . . . . . . . . . . . . . . 562 664 978Accounts payable . . . . . . . . . . . . . . . . . . . . . . . . . . . . . . . . . . . . . . . . . (629) (1,428) 519Accrued expenses . . . . . . . . . . . . . . . . . . . . . . . . . . . . . . . . . . . . . . . . . (169) 310 (3,364)Deferred revenues . . . . . . . . . . . . . . . . . . . . . . . . . . . . . . . . . . . . . . . . . 2,417 (4,067) 6,957Accrued restructuring . . . . . . . . . . . . . . . . . . . . . . . . . . . . . . . . . . . . . . (2,536) (6,061) (6,841)
Net cash provided by (used in) operating activities . . . . . . . . . . . . . . . 7,625 3,908 (14,103)
Cash Flows from Investing Activities:Purchases of marketable securities . . . . . . . . . . . . . . . . . . . . . . . . . . . . . (18,904) (14,115) (11,426)Maturities of marketable securities . . . . . . . . . . . . . . . . . . . . . . . . . . . . 15,101 13,804 11,878Purchases of property and equipment . . . . . . . . . . . . . . . . . . . . . . . . . . . (4,459) (1,924) (763)Acquisition costs, net of cash acquired . . . . . . . . . . . . . . . . . . . . . . . . . (7,153) (1,010) 2,730Decrease in other assets . . . . . . . . . . . . . . . . . . . . . . . . . . . . . . . . . . . . (155) 313 (12)
Net cash (used in) provided by investing activities . . . . . . . . . . . . . . . (15,570) (2,932) 2,407
Cash Flows from Financing Activities:Principal payments on notes payable . . . . . . . . . . . . . . . . . . . . . . . . . . . (198) (413) (502)Proceeds from exercise of stock options. . . . . . . . . . . . . . . . . . . . . . . . . 1,537 1,360 532Proceeds from employee stock purchase plan . . . . . . . . . . . . . . . . . . . . . 661 654 936Payments on capital leases . . . . . . . . . . . . . . . . . . . . . . . . . . . . . . . . . . (63) (55) (7)
Net cash provided by financing activities . . . . . . . . . . . . . . . . . . . . . . 1,937 1,546 959Effect of foreign exchange rate changes on cash and cash equivalents . . . . (141) 228 113
Net increase (decrease) in cash and cash equivalents . . . . . . . . . . . . . . . . . (6,149) 2,750 (10,624)Cash and cash equivalents, beginning of period . . . . . . . . . . . . . . . . . . . . . 24,060 21,310 31,934
Cash and cash equivalents, end of period. . . . . . . . . . . . . . . . . . . . . . . . . . $ 17,911 $ 24,060 $ 21,310
Supplemental Disclosure of Cash Flow information:Cash paid for interest expense . . . . . . . . . . . . . . . . . . . . . . . . . . . . . . . . $ 11 $ 18 $ 4Cash paid for income taxes . . . . . . . . . . . . . . . . . . . . . . . . . . . . . . . . . . $ — $ 39 $ 38
Supplemental Disclosure of Noncash Investing and Financing Activities:Issuance of stock and options related to acquisitions . . . . . . . . . . . . . . . $ 39,039 $ — $ 29,422
The accompanying notes are an integral part of these consolidated financial statements.
40
ART TECHNOLOGY GROUP, INC.NOTES TO CONSOLIDATED FINANCIAL STATEMENTS
(1) Organization, Business and Summary of Significant Accounting Policies
Art Technology Group, Inc. (ATG or the Company) develops and markets a comprehensive suite ofe-commerce software products, as well as provides related services including support and maintenance, education,application hosting, professional services and proactive conversion solutions for enhancing online sales andsupport.
(a) Principles of Consolidation
The accompanying consolidated financial statements include the accounts of ATG and its wholly ownedsubsidiaries. All intercompany accounts and transactions have been eliminated in consolidation.
(b) Use of Estimates
The preparation of consolidated financial statements in conformity with accounting principles generallyaccepted in the United States requires management to make estimates and assumptions that affect the reportedamounts of assets and liabilities and disclosure of contingent assets and liabilities at the date of the financialstatements, and the reported amounts of revenues and expenses during the reporting period. Our actual results coulddiffer from those estimates.
(c) Revenue Recognition
ATG recognizes service and hosting revenue not related to software arrangements in accordance with theSecurities and Exchange Commission’s Staff Accounting Bulletin No. 104, Revenue Recognition, and the FinancialAccounting Standards Board, or FASB, Emerging Issues Task Force Issue No. 00-21, Revenue Arrangements withMultiple Deliverables. Revenue is recognized only when the price is fixed or determinable, persuasive evidence ofan arrangement exists, the service is performed and collectibility of the resulting receivable is reasonably assured. Inaddition, the delivered element must have stand-alone value and ATG must have specific objective evidence of fairvalue of the undelivered elements.
At the inception of a customer contract for service, ATG makes a judgment of the customer’s ability to pay forthe services provided. This judgment is based on a combination of factors, including the successful completion of acredit check or financial review, payment history with the customer and other forms of payment assurance. Uponthe completion of these steps, ATG recognizes revenue monthly in accordance with its revenue recognition policy.
ATG also licenses software under perpetual license agreements. ATG applies the provisions of Statement ofPosition, or SOP, 97-2, Software Revenue Recognition, as amended by SOP 98-9, Modifications of SOP 97-2,Software Revenue Recognition, With Respect to Certain Transactions. In accordance with SOP 97-2 and SOP 98-9,revenues from software product license agreements are recognized upon execution of a license agreement anddelivery of the software, provided that the fee is fixed or determinable and deemed collectible by management. Ifconditions for acceptance are required subsequent to delivery, revenues are recognized upon customer acceptance ifsuch acceptance is not deemed to be perfunctory.
As prescribed by this accounting guidance, ATG applies the residual method of accounting. The residualmethod requires that the portion of the total arrangement fee attributable to undelivered elements, as indicated byvendor specific objective evidence of fair value, is deferred and subsequently recognized when delivered. Thedifference between the total arrangement fee and the amount deferred for the undelivered elements is recognized asrevenue related to the delivered elements, if all other revenue recognition criteria of SOP 97-2 are met. Consultingrevenues from these arrangements are generally accounted for separately from software licenses because the
41
arrangements qualify as service transactions as defined in SOP 97-2. The more significant factors considered indetermining whether the revenue should be accounted for separately include the nature of services (i.e., consid-eration of whether the services are essential to the functionality of the licensed product), degree of risk, availabilityof services from other vendors, timing of payments and impact of milestones or acceptance criteria on therealizability of the software license fee. Revenues from software maintenance are recognized ratably over the termof the maintenance, which is typically one year.
ATG derives revenue from the sale of application hosting and proactive conversion solutions by providingservices to customers who have executed contracts with terms of one year or longer. These contracts generallycommit the customer to a minimum monthly level of usage and provide the rate at which the customer must pay foractual usage above the monthly minimum. For these services, ATG recognizes the monthly minimum as revenueeach month provided that an enforceable contract has been signed by both parties, the service has been delivered tothe customer, the fee for the service is fixed or determinable and collection is reasonably assured. Should acustomer’s usage of these services exceed the monthly minimum, ATG recognizes revenue for such excess usage inthe period of the usage. ATG typically charges the customer an installation fee when the services are first activated.The installation fees are recorded as deferred revenue and recognized as revenue ratably over the estimated life ofthe customer arrangement.
When software products are licensed perpetually in conjunction with application hosting and or proactiveconversion solutions, ATG allocates revenue between the elements based on each element’s relative fair value,provided that each element meets the criteria as a separate element under SOP 97-2. An item is considered aseparate element if the Company has vendor-specific objective evidence of fair value of the element. Fair value isgenerally determined based upon the price charged when the element is sold separately. If the fair value of eachelement cannot be objectively determined, the total value of the arrangement is recognized ratably over the entireservice period to the extent that all services were provided at the outset of the period. For most multiple elementarrangements where software products are sold in conjunction with application hosting and or proactive conversionsolutions, the fair value of each element has not been objectively determinable. Therefore, all revenue under thesetypes of arrangements is recognized ratably over the related estimated service period to the extent that all serviceshave begun to be provided at the outset of the period.
Revenues from professional service arrangements are recognized as the services are performed, provided thatamounts due from customers are fixed or determinable and deemed collectible by management. ATG charges forprofessional services primarily on a time-and-material basis. Amounts collected prior to satisfying the aboverevenue recognition criteria are reflected as deferred revenue. Deferred revenue primarily consists of advancepayments related to support and maintenance, hosting and service agreements.
ATG also sells its services through a reseller channel. Assuming all other revenue recognition criteria are met,ATG recognizes revenue from reseller arrangements based on the reseller’s contracted commitment. ATG does notgrant resellers the right of return or price protection.
(d) Allowances for Doubtful Accounts and Returns
ATG records allowances for doubtful accounts based upon a specific review of all outstanding invoices, knowncollection issues and historical experience. ATG also records a provision for estimated sales returns and allowanceson product and service related sales in the same period the related revenues are recorded in accordance withStatement of Financial Accounting Standards (SFAS) No. 48, Revenue Recognition When Right of Return Exists.These estimates are based on historical sales returns, analysis of credit memo data and other known factors.
42
ART TECHNOLOGY GROUP, INC.NOTES TO CONSOLIDATED FINANCIAL STATEMENTS — (Continued)
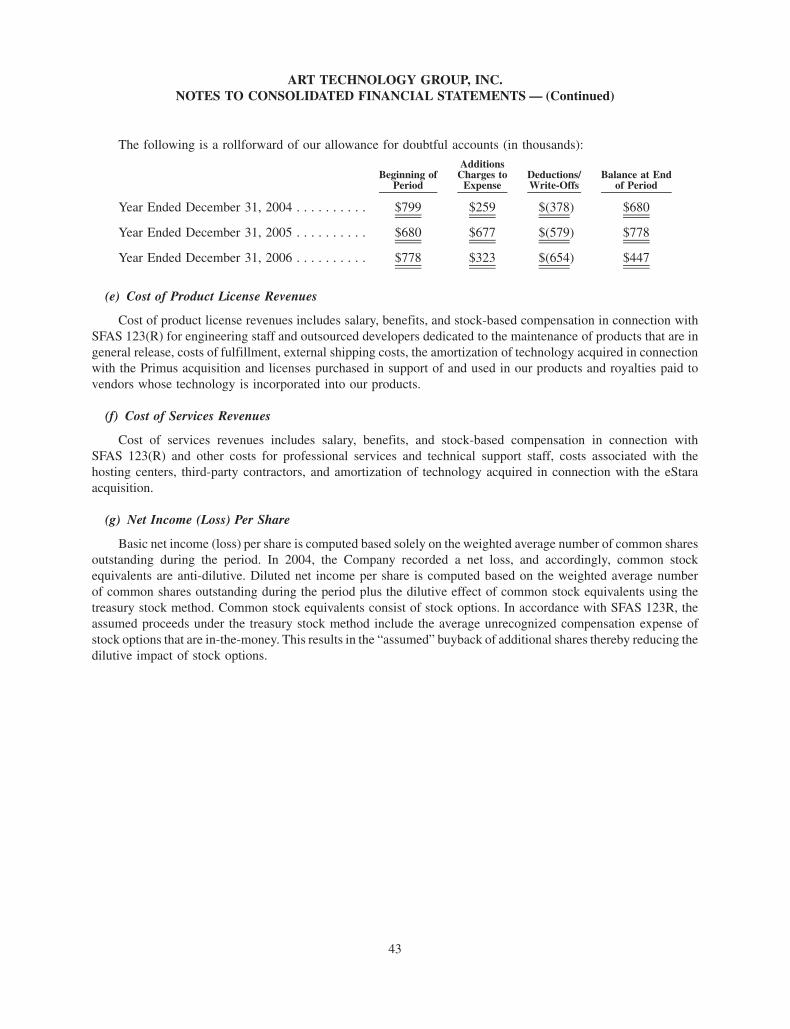
The following is a rollforward of our allowance for doubtful accounts (in thousands):
Beginning ofPeriod
AdditionsCharges to
ExpenseDeductions/Write-Offs
Balance at Endof Period
Year Ended December 31, 2004 . . . . . . . . . . $799 $259 $(378) $680
Year Ended December 31, 2005 . . . . . . . . . . $680 $677 $(579) $778
Year Ended December 31, 2006 . . . . . . . . . . $778 $323 $(654) $447
(e) Cost of Product License Revenues
Cost of product license revenues includes salary, benefits, and stock-based compensation in connection withSFAS 123(R) for engineering staff and outsourced developers dedicated to the maintenance of products that are ingeneral release, costs of fulfillment, external shipping costs, the amortization of technology acquired in connectionwith the Primus acquisition and licenses purchased in support of and used in our products and royalties paid tovendors whose technology is incorporated into our products.
(f) Cost of Services Revenues
Cost of services revenues includes salary, benefits, and stock-based compensation in connection withSFAS 123(R) and other costs for professional services and technical support staff, costs associated with thehosting centers, third-party contractors, and amortization of technology acquired in connection with the eStaraacquisition.
(g) Net Income (Loss) Per Share
Basic net income (loss) per share is computed based solely on the weighted average number of common sharesoutstanding during the period. In 2004, the Company recorded a net loss, and accordingly, common stockequivalents are anti-dilutive. Diluted net income per share is computed based on the weighted average numberof common shares outstanding during the period plus the dilutive effect of common stock equivalents using thetreasury stock method. Common stock equivalents consist of stock options. In accordance with SFAS 123R, theassumed proceeds under the treasury stock method include the average unrecognized compensation expense ofstock options that are in-the-money. This results in the “assumed” buyback of additional shares thereby reducing thedilutive impact of stock options.
43
ART TECHNOLOGY GROUP, INC.NOTES TO CONSOLIDATED FINANCIAL STATEMENTS — (Continued)
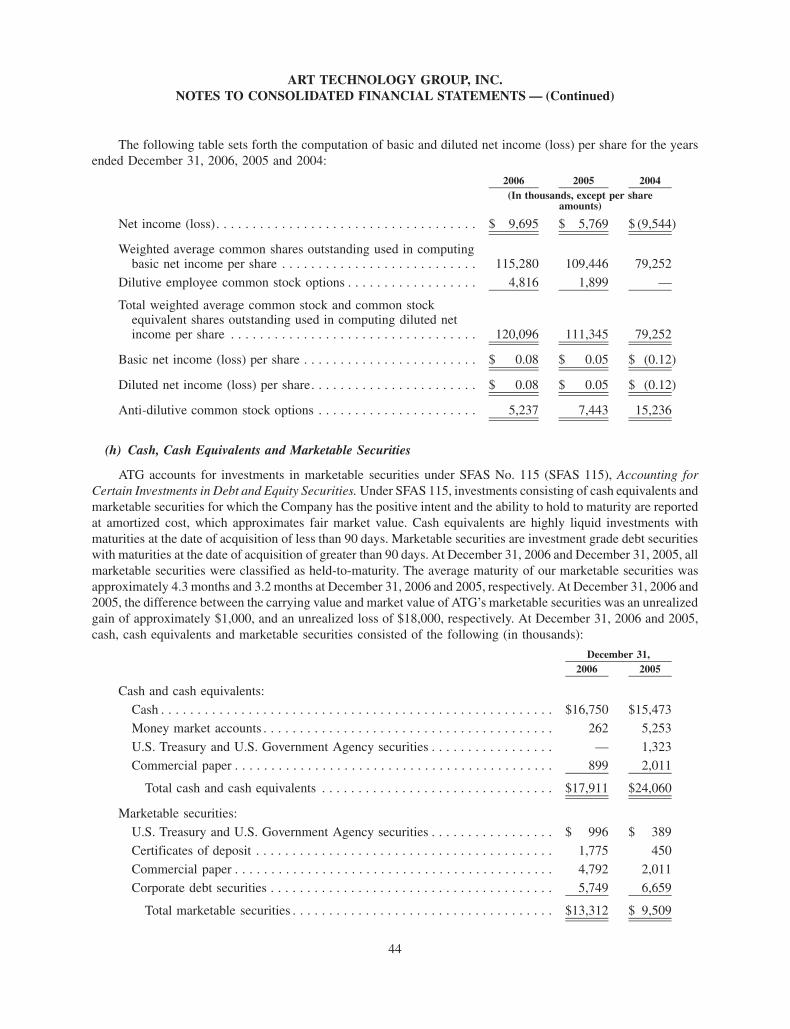
The following table sets forth the computation of basic and diluted net income (loss) per share for the yearsended December 31, 2006, 2005 and 2004:
2006 2005 2004(In thousands, except per share
amounts)
Net income (loss). . . . . . . . . . . . . . . . . . . . . . . . . . . . . . . . . . . . $ 9,695 $ 5,769 $ (9,544)
Weighted average common shares outstanding used in computingbasic net income per share . . . . . . . . . . . . . . . . . . . . . . . . . . . 115,280 109,446 79,252
Dilutive employee common stock options . . . . . . . . . . . . . . . . . . 4,816 1,899 —
Total weighted average common stock and common stockequivalent shares outstanding used in computing diluted netincome per share . . . . . . . . . . . . . . . . . . . . . . . . . . . . . . . . . . 120,096 111,345 79,252
Basic net income (loss) per share . . . . . . . . . . . . . . . . . . . . . . . . $ 0.08 $ 0.05 $ (0.12)
Diluted net income (loss) per share. . . . . . . . . . . . . . . . . . . . . . . $ 0.08 $ 0.05 $ (0.12)
Anti-dilutive common stock options . . . . . . . . . . . . . . . . . . . . . . 5,237 7,443 15,236
(h) Cash, Cash Equivalents and Marketable Securities
ATG accounts for investments in marketable securities under SFAS No. 115 (SFAS 115), Accounting forCertain Investments in Debt and Equity Securities. Under SFAS 115, investments consisting of cash equivalents andmarketable securities for which the Company has the positive intent and the ability to hold to maturity are reportedat amortized cost, which approximates fair market value. Cash equivalents are highly liquid investments withmaturities at the date of acquisition of less than 90 days. Marketable securities are investment grade debt securitieswith maturities at the date of acquisition of greater than 90 days. At December 31, 2006 and December 31, 2005, allmarketable securities were classified as held-to-maturity. The average maturity of our marketable securities wasapproximately 4.3 months and 3.2 months at December 31, 2006 and 2005, respectively. At December 31, 2006 and2005, the difference between the carrying value and market value of ATG’s marketable securities was an unrealizedgain of approximately $1,000, and an unrealized loss of $18,000, respectively. At December 31, 2006 and 2005,cash, cash equivalents and marketable securities consisted of the following (in thousands):
2006 2005December 31,
Cash and cash equivalents:
Cash . . . . . . . . . . . . . . . . . . . . . . . . . . . . . . . . . . . . . . . . . . . . . . . . . . . . . . $16,750 $15,473
Money market accounts . . . . . . . . . . . . . . . . . . . . . . . . . . . . . . . . . . . . . . . . 262 5,253
U.S. Treasury and U.S. Government Agency securities . . . . . . . . . . . . . . . . . — 1,323
Commercial paper . . . . . . . . . . . . . . . . . . . . . . . . . . . . . . . . . . . . . . . . . . . . 899 2,011
Total cash and cash equivalents . . . . . . . . . . . . . . . . . . . . . . . . . . . . . . . . $17,911 $24,060
Marketable securities:
U.S. Treasury and U.S. Government Agency securities . . . . . . . . . . . . . . . . . $ 996 $ 389
Certificates of deposit . . . . . . . . . . . . . . . . . . . . . . . . . . . . . . . . . . . . . . . . . 1,775 450
Commercial paper . . . . . . . . . . . . . . . . . . . . . . . . . . . . . . . . . . . . . . . . . . . . 4,792 2,011
Corporate debt securities . . . . . . . . . . . . . . . . . . . . . . . . . . . . . . . . . . . . . . . 5,749 6,659
Total marketable securities . . . . . . . . . . . . . . . . . . . . . . . . . . . . . . . . . . . . $13,312 $ 9,509
44
ART TECHNOLOGY GROUP, INC.NOTES TO CONSOLIDATED FINANCIAL STATEMENTS — (Continued)

(i) Other Assets
Included in other assets at December 31, 2006 are primarily lease security deposits for the Company’s variousoffices and locations. At December 31, 2005, other assets included deferred rent expense related to lease settlementsreached with landlords during 2003. These settlement agreements involved both reaching a settlement onabandoned space and renegotiating a reduction in the rate for continuing operating space. In these cases, a portionof the settlement payment was accounted for as deferred rent expense. The deferred rent is amortized over theremaining lease term, which had the effect of maintaining the effective rent expense per square foot on the existingoperating space equal to the effective rent expense per square foot per the original lease. At December 31, 2006, theCompany had no remaining deferred rent.
Other assets at December 31, 2006 and 2005 consisted of the following (in thousands):
2006 2005December 31,
Deferred rent resulting from lease settlements . . . . . . . . . . . . . . . . . . . . . . . . . . . $ — $ 562
Other assets, primarily lease deposits . . . . . . . . . . . . . . . . . . . . . . . . . . . . . . . . . 1,036 844
$1,036 $1,406
(j) Property and Equipment
Property and equipment are stated at cost, net of accumulated depreciation and amortization. ATG recordsdepreciation and amortization using the straight-line method.
Property and equipment at December 31, 2006 and 2005 consisted of the following (in thousands):
Asset Classification Estimated Useful Life 2006 2005December 31,
Computer equipment . . . . . . . . . . . . . . . . . . . . . . . . 3 years $ 5,839 $12,564
Leasehold improvements . . . . . . . . . . . . . . . . . . . . . Lesser of useful life orlife of lease
2,309 3,342
Furniture and fixtures . . . . . . . . . . . . . . . . . . . . . . . 5 years 1,512 2,969
Computer software . . . . . . . . . . . . . . . . . . . . . . . . . 3 years 4,875 4,417
14,535 23,292
Less — accumulated depreciation and amortization. . 9,209 20,297
$ 5,326 $ 2,995
Depreciation and amortization expense related to property and equipment was $2.3 million, $1.9 million and$1.9 million for each of the years ended December 31, 2006, 2005 and 2004, respectively.
During 2006, in connection with the Company’s annual evaluation of its property and equipment forimpairment, the Company identified $13.3 million of fully depreciated assets that were disposed of or no longerin use. As a result, the Company wrote-off the related cost basis and accumulated depreciation.
In accordance with SFAS No. 144, Accounting for the Impairment or Disposal of Long-Lived Assets, ATGreviews the carrying value of long-lived assets, including intangible assets subject to amortization, for impairmentwhenever events and circumstances indicate that the carrying value of the assets may not be recoverable.Recoverability of these assets is measured by comparing the carrying value of the assets to the undiscountedcash flows estimated to be generated by those assets over their remaining economic life. If the undiscounted cashflows are not sufficient to recover the carrying value of the assets, the assets are considered impaired. Theimpairment loss is measured by comparing the fair value of the assets to their carrying values. Fair value is
45
ART TECHNOLOGY GROUP, INC.NOTES TO CONSOLIDATED FINANCIAL STATEMENTS — (Continued)

determined by either a quoted market price or a value determined by a discounted cash flow technique, whichever ismore appropriate under the circumstances involved. There were no impairment charges related to property andequipment in 2006. However, the Company recorded impairment charges related to property and equipment in 2005and 2004, as discussed in Note 11.
(k) Research and Development Expenses for Software Products
ATG evaluates the establishment of technological feasibility of its products in accordance with SFAS No. 86,Accounting for the Costs of Computer Software to be Sold, Leased, or Otherwise Marketed. ATG sells products in amarket that is subject to rapid technological change, new product development and changing customer needs.Accordingly, management has concluded that technological feasibility is not established until the developmentstage of the product is nearly complete. ATG defines technological feasibility as the completion of a working model.The time period during which costs could be capitalized, from the point of reaching technological feasibility untilthe time of general product release, is very short, and consequently, the amounts that could be capitalized are notmaterial to ATG’s financial position or results of operations. Therefore, ATG expenses all such costs to research anddevelopment in the period incurred.
(l) Income Taxes
ATG accounts for income taxes in accordance with the provisions of SFAS 109, Accounting for Income Taxes.This statement requires ATG to recognize a current tax asset or liability for current taxes payable or refundable andto record deferred tax assets or liabilities for the estimated future tax effects of temporary differences andcarryforwards to the extent that they are realizable. A valuation allowance is established against net deferred taxassets, if based on the weighted available evidence, it is more likely than not that all or a portion of the deferred taxassets will not be realized (see Note 5). As a result of historical net operating losses incurred, and after evaluatingATG’s anticipated performance over its normal planning horizon, ATG has provided for a full valuation allowancefor its net operating loss carry-forwards, research credit carry-forwards and other net deferred tax assets.
(m) Stock-Based Compensation
On December 16, 2004, the Financial Accounting Standards Board (FASB) issued SFAS 123 (revised 2004),Share-Based Payment (SFAS 123R). SFAS 123R supersedes APB Opinion No. 25, Accounting for Stock Issued toEmployees, and amends SFAS No. 95, Statement of Cash Flows. Generally, the approach in SFAS 123R is similar tothe approach described in SFAS 123. However, SFAS 123R requires all share-based payments to employees,including grants of employee stock options, to be recognized in the income statement based on their fair values atthe date of grant. Pro forma disclosure is no longer an alternative. On January 1, 2006, ATG adopted SFAS 123Rusing the modified prospective method as permitted under SFAS 123R. Under this transition method, compensationcost recognized in 2006 includes: (a) compensation cost for all share-based payments granted before but not yetvested as of December 31, 2005 based on the grant-date fair value estimated in accordance with the provisions ofSFAS 123, and (b) compensation cost for all share-based payments granted after December 31, 2005 based on thegrant-date fair value estimated in accordance with the provisions of SFAS 123R. In accordance with the modifiedprospective method of adoption, results of operations and financial position for prior periods have not been restated.See Note 6 for further information related to stock-based compensation.
(n) Comprehensive Income (Loss)
SFAS No. 130, Reporting Comprehensive Income, requires financial statements to include the reporting ofcomprehensive income, which includes net income and certain transactions that have generally been reported in thestatement of stockholders’ equity. ATG’s comprehensive income (loss) consists of net income (loss) and foreigncurrency translation adjustments.
46
ART TECHNOLOGY GROUP, INC.NOTES TO CONSOLIDATED FINANCIAL STATEMENTS — (Continued)
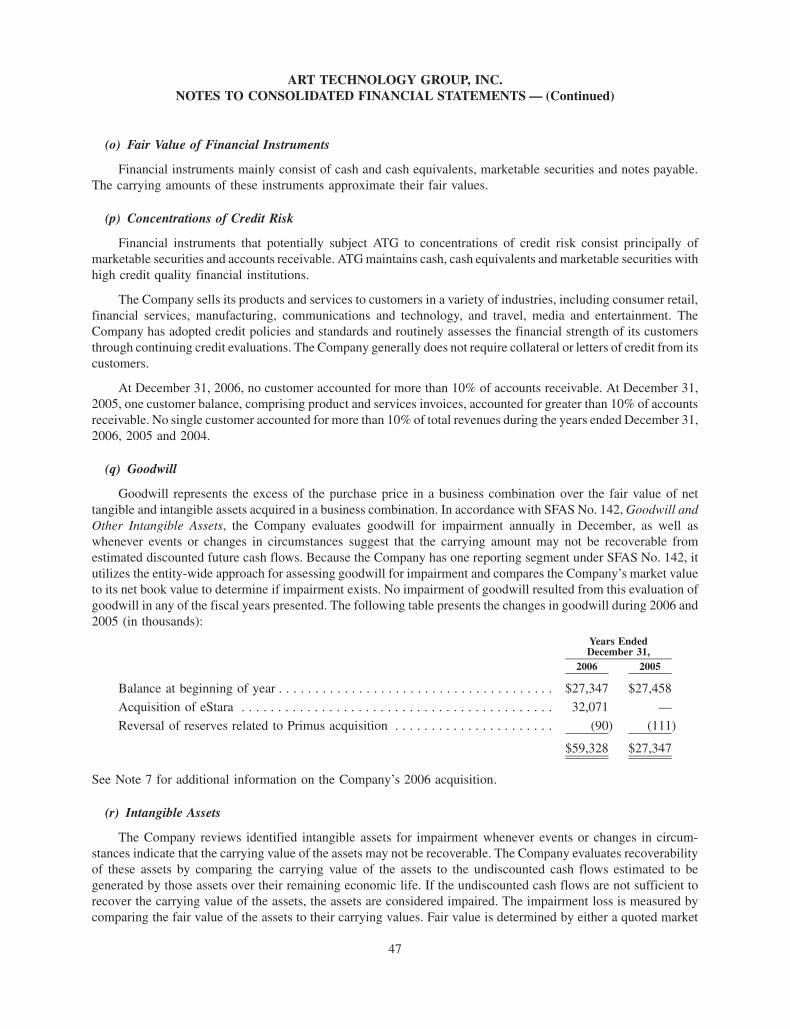
(o) Fair Value of Financial Instruments
Financial instruments mainly consist of cash and cash equivalents, marketable securities and notes payable.The carrying amounts of these instruments approximate their fair values.
(p) Concentrations of Credit Risk
Financial instruments that potentially subject ATG to concentrations of credit risk consist principally ofmarketable securities and accounts receivable. ATG maintains cash, cash equivalents and marketable securities withhigh credit quality financial institutions.
The Company sells its products and services to customers in a variety of industries, including consumer retail,financial services, manufacturing, communications and technology, and travel, media and entertainment. TheCompany has adopted credit policies and standards and routinely assesses the financial strength of its customersthrough continuing credit evaluations. The Company generally does not require collateral or letters of credit from itscustomers.
At December 31, 2006, no customer accounted for more than 10% of accounts receivable. At December 31,2005, one customer balance, comprising product and services invoices, accounted for greater than 10% of accountsreceivable. No single customer accounted for more than 10% of total revenues during the years ended December 31,2006, 2005 and 2004.
(q) Goodwill
Goodwill represents the excess of the purchase price in a business combination over the fair value of nettangible and intangible assets acquired in a business combination. In accordance with SFAS No. 142, Goodwill andOther Intangible Assets, the Company evaluates goodwill for impairment annually in December, as well aswhenever events or changes in circumstances suggest that the carrying amount may not be recoverable fromestimated discounted future cash flows. Because the Company has one reporting segment under SFAS No. 142, itutilizes the entity-wide approach for assessing goodwill for impairment and compares the Company’s market valueto its net book value to determine if impairment exists. No impairment of goodwill resulted from this evaluation ofgoodwill in any of the fiscal years presented. The following table presents the changes in goodwill during 2006 and2005 (in thousands):
2006 2005
Years EndedDecember 31,
Balance at beginning of year . . . . . . . . . . . . . . . . . . . . . . . . . . . . . . . . . . . . . . $27,347 $27,458
Acquisition of eStara . . . . . . . . . . . . . . . . . . . . . . . . . . . . . . . . . . . . . . . . . . . 32,071 —
Reversal of reserves related to Primus acquisition . . . . . . . . . . . . . . . . . . . . . . (90) (111)
$59,328 $27,347
See Note 7 for additional information on the Company’s 2006 acquisition.
(r) Intangible Assets
The Company reviews identified intangible assets for impairment whenever events or changes in circum-stances indicate that the carrying value of the assets may not be recoverable. The Company evaluates recoverabilityof these assets by comparing the carrying value of the assets to the undiscounted cash flows estimated to begenerated by those assets over their remaining economic life. If the undiscounted cash flows are not sufficient torecover the carrying value of the assets, the assets are considered impaired. The impairment loss is measured bycomparing the fair value of the assets to their carrying values. Fair value is determined by either a quoted market
47
ART TECHNOLOGY GROUP, INC.NOTES TO CONSOLIDATED FINANCIAL STATEMENTS — (Continued)
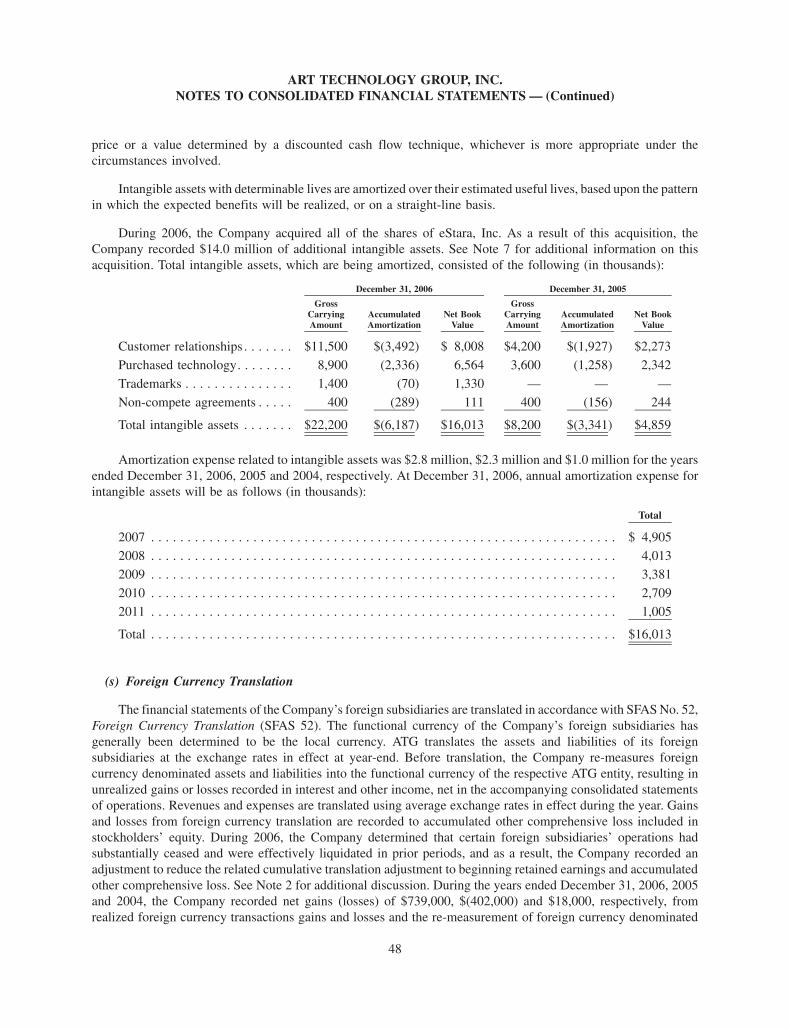
price or a value determined by a discounted cash flow technique, whichever is more appropriate under thecircumstances involved.
Intangible assets with determinable lives are amortized over their estimated useful lives, based upon the patternin which the expected benefits will be realized, or on a straight-line basis.
During 2006, the Company acquired all of the shares of eStara, Inc. As a result of this acquisition, theCompany recorded $14.0 million of additional intangible assets. See Note 7 for additional information on thisacquisition. Total intangible assets, which are being amortized, consisted of the following (in thousands):
GrossCarryingAmount
AccumulatedAmortization
Net BookValue
GrossCarryingAmount
AccumulatedAmortization
Net BookValue
December 31, 2006 December 31, 2005
Customer relationships . . . . . . . $11,500 $(3,492) $ 8,008 $4,200 $(1,927) $2,273
Purchased technology. . . . . . . . 8,900 (2,336) 6,564 3,600 (1,258) 2,342
Trademarks . . . . . . . . . . . . . . . 1,400 (70) 1,330 — — —
Non-compete agreements . . . . . 400 (289) 111 400 (156) 244
Total intangible assets . . . . . . . $22,200 $(6,187) $16,013 $8,200 $(3,341) $4,859
Amortization expense related to intangible assets was $2.8 million, $2.3 million and $1.0 million for the yearsended December 31, 2006, 2005 and 2004, respectively. At December 31, 2006, annual amortization expense forintangible assets will be as follows (in thousands):
Total
2007 . . . . . . . . . . . . . . . . . . . . . . . . . . . . . . . . . . . . . . . . . . . . . . . . . . . . . . . . . . . . . . . . $ 4,905
2008 . . . . . . . . . . . . . . . . . . . . . . . . . . . . . . . . . . . . . . . . . . . . . . . . . . . . . . . . . . . . . . . . 4,013
2009 . . . . . . . . . . . . . . . . . . . . . . . . . . . . . . . . . . . . . . . . . . . . . . . . . . . . . . . . . . . . . . . . 3,381
2010 . . . . . . . . . . . . . . . . . . . . . . . . . . . . . . . . . . . . . . . . . . . . . . . . . . . . . . . . . . . . . . . . 2,709
2011 . . . . . . . . . . . . . . . . . . . . . . . . . . . . . . . . . . . . . . . . . . . . . . . . . . . . . . . . . . . . . . . . 1,005
Total . . . . . . . . . . . . . . . . . . . . . . . . . . . . . . . . . . . . . . . . . . . . . . . . . . . . . . . . . . . . . . . . $16,013
(s) Foreign Currency Translation
The financial statements of the Company’s foreign subsidiaries are translated in accordance with SFAS No. 52,Foreign Currency Translation (SFAS 52). The functional currency of the Company’s foreign subsidiaries hasgenerally been determined to be the local currency. ATG translates the assets and liabilities of its foreignsubsidiaries at the exchange rates in effect at year-end. Before translation, the Company re-measures foreigncurrency denominated assets and liabilities into the functional currency of the respective ATG entity, resulting inunrealized gains or losses recorded in interest and other income, net in the accompanying consolidated statementsof operations. Revenues and expenses are translated using average exchange rates in effect during the year. Gainsand losses from foreign currency translation are recorded to accumulated other comprehensive loss included instockholders’ equity. During 2006, the Company determined that certain foreign subsidiaries’ operations hadsubstantially ceased and were effectively liquidated in prior periods, and as a result, the Company recorded anadjustment to reduce the related cumulative translation adjustment to beginning retained earnings and accumulatedother comprehensive loss. See Note 2 for additional discussion. During the years ended December 31, 2006, 2005and 2004, the Company recorded net gains (losses) of $739,000, $(402,000) and $18,000, respectively, fromrealized foreign currency transactions gains and losses and the re-measurement of foreign currency denominated
48
ART TECHNOLOGY GROUP, INC.NOTES TO CONSOLIDATED FINANCIAL STATEMENTS — (Continued)
assets and liabilities. These amounts are included in interest and other income, net in the accompanyingConsolidated Statements of Operations.
(t) Recent Accounting Pronouncements
In June 2006, the FASB issued FASB Interpretation No. 48, Accounting for Uncertainty in Income Taxes, anInterpretation of FASB Statement No. 109 (“FIN No. 48”). FIN No. 48 clarifies the accounting for uncertainty inincome taxes recognized in an enterprise’s financial statements in accordance with SFAS Statement No. 109,Accounting for Income Taxes. FIN No. 48 prescribes a two-step process to determine the amount of tax benefit to berecognized. First, the tax position must be evaluated to determine the likelihood that it will be sustained uponexternal examination. If the tax position is deemed more-likely-than-not to be sustained, the tax position is thenassessed to determine the amount of benefit to recognize in the financial statements. The amount of the benefit thatmay be recognized is the largest amount that has a greater than 50 percent likelihood of being realized upon ultimatesettlement. FIN No. 48 is effective for the Company beginning in 2007. The Company does not expect theimplementation of FIN No. 48 to have a material impact on its financial statements.
In September 2006, the Securities and Exchange Commission, or the SEC, released Staff AccountingBulletin No. 108 (“SAB 108”). SAB 108 expresses the SEC staff’s views regarding the process of quantifyingand recording financial statement misstatements. These interpretations were issued to address diversity in practiceand the potential under current practice for the build up of improper amounts on the balance sheet. SAB 108expresses the SEC staff’s view that a registrant’s materiality evaluation of an identified unadjusted error shouldquantify the effects of the error on each financial statement and related financial statement disclosures and that prioryear misstatements should be considered in quantifying misstatements in current year financial statements.SAB 108 also states that correcting prior year financial statements for immaterial errors would not requirepreviously filed reports to be amended. Such correction may be made the next time the registrant files the prior yearfinancial statements. Registrants electing not to restate prior periods should reflect the effects of initially applyingthe guidance in SAB 108 in their annual financial statements covering the first fiscal year ending after November 15,2006. The cumulative effect of the initial application should be reported in the carrying amounts of assets andliabilities as of the beginning of that fiscal year and the offsetting adjustment should be made to the opening balanceof retained earnings for that year. Registrants should disclose the nature and amount of each individual error beingcorrected in the cumulative adjustment. The disclosure should also include when and how each error arose and thefact that the errors had previously been considered immaterial. The SEC staff encourages early application of theguidance in SAB 108 for interim periods of the first fiscal year ending after November 15, 2006. The imple-mentation of SAB 108 did not have any impact on the Company’s financial statements.
In September 2006, the FASB issued SFAS No. 157, Fair Value Measurements, (“SFAS 157”). SFAS 157defines “fair value,” establishes a framework for measuring fair value in generally accepted accounting principles,and expands disclosures about fair value measurements. SFAS 157 does not require any new fair value measure-ments but may change current practice for some entities. SFAS 157 is effective for financial statements issued forfiscal years beginning after November 15, 2007 and interim periods within those years. The Company is currentlyevaluating the potential impact of SFAS 157 on the Company’s financial position and results of operations.
(2) Restatement of Financial Statements
During 2006, the Company determined that certain foreign subsidiaries’ operations substantially ceased andwere effectively liquidated in 2002 and 2003. In accordance with SFAS 52, companies are required to eliminate thecumulative translation adjustment related to entities that have either been sold or substantially liquidated. As aresult, the Company is restating its 2002 and 2003 financial statements to reflect the write-off of the cumulativetranslation adjustment related to substantially liquidated entities. The Company is recording adjustments of$442,000 in 2002 and $1,345,000 in 2003 to eliminate the cumulative translation adjustment related to thesesubstantially liquidated entities and is recording corresponding increases in the Company’s accumulated deficit as
49
ART TECHNOLOGY GROUP, INC.NOTES TO CONSOLIDATED FINANCIAL STATEMENTS — (Continued)

of December 31, 2002 and 2003. The write-off of the cumulative translation adjustment is recorded as a charge tothe interest and other income, net line item in the statement of operations.
In connection with recording the adjustments to write-off the cumulative translation adjustment for liquidatedforeign subsidiaries in 2002 and 2003, the Company is also recording historical identified errors. In 2002 and 2003,the Company should have recorded certain amounts as deferred revenue to properly recognize support andmaintenance revenue ratably as the service was provided and for future discounts provided to customers. Inaddition, the Company had an unsupported revenue reserve. The Company recorded net revenue adjustments todecrease revenue by $608,000 and $386,000 in 2002 and 2003, respectively. Regarding expenses, the Company hadover-accrued for certain sales and marketing, general and administrative and restructuring expenses. The net impactto recording these errors was a decrease to operating expenses of $584,000 in 2002 and an increase to operatingexpenses of $83,000 in 2003. The errors to revenue and operating expenses were deemed to not be materialindividually, or in aggregate, in 2002 and 2003. The net impact of the restatement is to increase the Company’s netloss and net loss per basic and diluted share for 2002 from $29.5 million to $30.0 million, and from $0.42 per shareto $0.43 per share, respectively, and to decrease the Company’s net income and net income per basic and dilutedshare for 2003 from $4.2 million to $2.4 million, and from $0.06 per share to $0.03 per share, respectively.
The correction of these errors had no impact to the Company’s results of operations for 2004, 2005 or 2006.The Company has recorded an adjustment of $1,787,000 to the beginning balances at January 1, 2004 to increaseaccumulated deficit and decrease cumulative translation adjustment, which is the Company’s only component ofaccumulated other comprehensive loss. There was no net impact to stockholders’ equity.
50
ART TECHNOLOGY GROUP, INC.NOTES TO CONSOLIDATED FINANCIAL STATEMENTS — (Continued)
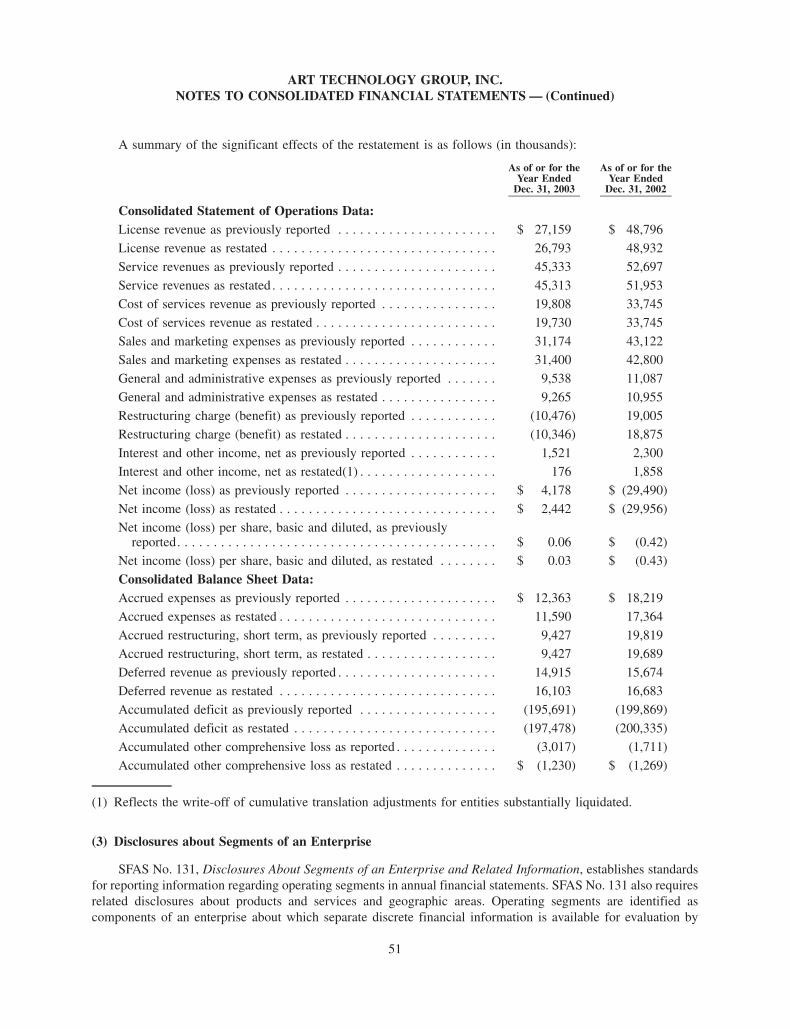
A summary of the significant effects of the restatement is as follows (in thousands):
As of or for theYear Ended
Dec. 31, 2003
As of or for theYear Ended
Dec. 31, 2002
Consolidated Statement of Operations Data:License revenue as previously reported . . . . . . . . . . . . . . . . . . . . . . $ 27,159 $ 48,796
License revenue as restated . . . . . . . . . . . . . . . . . . . . . . . . . . . . . . . 26,793 48,932
Service revenues as previously reported . . . . . . . . . . . . . . . . . . . . . . 45,333 52,697
Service revenues as restated . . . . . . . . . . . . . . . . . . . . . . . . . . . . . . . 45,313 51,953
Cost of services revenue as previously reported . . . . . . . . . . . . . . . . 19,808 33,745
Cost of services revenue as restated . . . . . . . . . . . . . . . . . . . . . . . . . 19,730 33,745
Sales and marketing expenses as previously reported . . . . . . . . . . . . 31,174 43,122
Sales and marketing expenses as restated . . . . . . . . . . . . . . . . . . . . . 31,400 42,800
General and administrative expenses as previously reported . . . . . . . 9,538 11,087
General and administrative expenses as restated . . . . . . . . . . . . . . . . 9,265 10,955
Restructuring charge (benefit) as previously reported . . . . . . . . . . . . (10,476) 19,005
Restructuring charge (benefit) as restated . . . . . . . . . . . . . . . . . . . . . (10,346) 18,875
Interest and other income, net as previously reported . . . . . . . . . . . . 1,521 2,300
Interest and other income, net as restated(1) . . . . . . . . . . . . . . . . . . . 176 1,858
Net income (loss) as previously reported . . . . . . . . . . . . . . . . . . . . . $ 4,178 $ (29,490)
Net income (loss) as restated . . . . . . . . . . . . . . . . . . . . . . . . . . . . . . $ 2,442 $ (29,956)
Net income (loss) per share, basic and diluted, as previouslyreported. . . . . . . . . . . . . . . . . . . . . . . . . . . . . . . . . . . . . . . . . . . . $ 0.06 $ (0.42)
Net income (loss) per share, basic and diluted, as restated . . . . . . . . $ 0.03 $ (0.43)
Consolidated Balance Sheet Data:Accrued expenses as previously reported . . . . . . . . . . . . . . . . . . . . . $ 12,363 $ 18,219
Accrued expenses as restated . . . . . . . . . . . . . . . . . . . . . . . . . . . . . . 11,590 17,364
Accrued restructuring, short term, as previously reported . . . . . . . . . 9,427 19,819Accrued restructuring, short term, as restated . . . . . . . . . . . . . . . . . . 9,427 19,689
Deferred revenue as previously reported . . . . . . . . . . . . . . . . . . . . . . 14,915 15,674
Deferred revenue as restated . . . . . . . . . . . . . . . . . . . . . . . . . . . . . . 16,103 16,683
Accumulated deficit as previously reported . . . . . . . . . . . . . . . . . . . (195,691) (199,869)
Accumulated deficit as restated . . . . . . . . . . . . . . . . . . . . . . . . . . . . (197,478) (200,335)
Accumulated other comprehensive loss as reported . . . . . . . . . . . . . . (3,017) (1,711)
Accumulated other comprehensive loss as restated . . . . . . . . . . . . . . $ (1,230) $ (1,269)
(1) Reflects the write-off of cumulative translation adjustments for entities substantially liquidated.
(3) Disclosures about Segments of an Enterprise
SFAS No. 131, Disclosures About Segments of an Enterprise and Related Information, establishes standardsfor reporting information regarding operating segments in annual financial statements. SFAS No. 131 also requiresrelated disclosures about products and services and geographic areas. Operating segments are identified ascomponents of an enterprise about which separate discrete financial information is available for evaluation by
51
ART TECHNOLOGY GROUP, INC.NOTES TO CONSOLIDATED FINANCIAL STATEMENTS — (Continued)
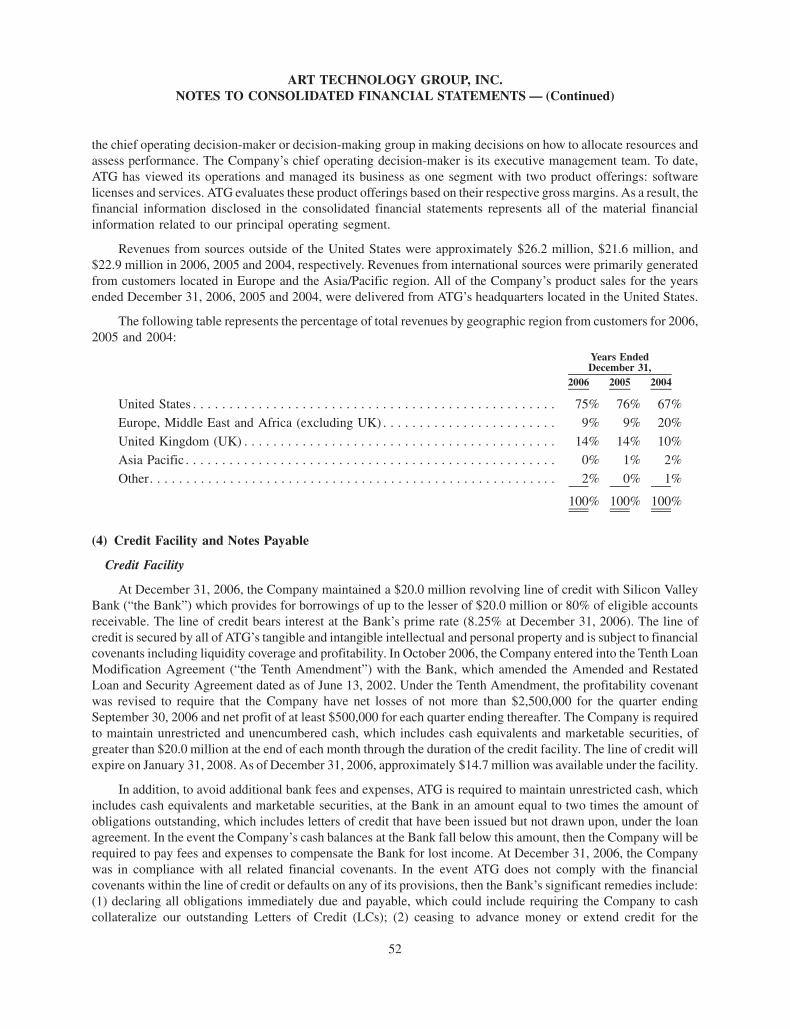
the chief operating decision-maker or decision-making group in making decisions on how to allocate resources andassess performance. The Company’s chief operating decision-maker is its executive management team. To date,ATG has viewed its operations and managed its business as one segment with two product offerings: softwarelicenses and services. ATG evaluates these product offerings based on their respective gross margins. As a result, thefinancial information disclosed in the consolidated financial statements represents all of the material financialinformation related to our principal operating segment.
Revenues from sources outside of the United States were approximately $26.2 million, $21.6 million, and$22.9 million in 2006, 2005 and 2004, respectively. Revenues from international sources were primarily generatedfrom customers located in Europe and the Asia/Pacific region. All of the Company’s product sales for the yearsended December 31, 2006, 2005 and 2004, were delivered from ATG’s headquarters located in the United States.
The following table represents the percentage of total revenues by geographic region from customers for 2006,2005 and 2004:
2006 2005 2004
Years EndedDecember 31,
United States . . . . . . . . . . . . . . . . . . . . . . . . . . . . . . . . . . . . . . . . . . . . . . . . . . 75% 76% 67%
Europe, Middle East and Africa (excluding UK) . . . . . . . . . . . . . . . . . . . . . . . . 9% 9% 20%
United Kingdom (UK) . . . . . . . . . . . . . . . . . . . . . . . . . . . . . . . . . . . . . . . . . . . 14% 14% 10%
Asia Pacific . . . . . . . . . . . . . . . . . . . . . . . . . . . . . . . . . . . . . . . . . . . . . . . . . . . 0% 1% 2%
Other. . . . . . . . . . . . . . . . . . . . . . . . . . . . . . . . . . . . . . . . . . . . . . . . . . . . . . . . 2% 0% 1%
100% 100% 100%
(4) Credit Facility and Notes Payable
Credit Facility
At December 31, 2006, the Company maintained a $20.0 million revolving line of credit with Silicon ValleyBank (“the Bank”) which provides for borrowings of up to the lesser of $20.0 million or 80% of eligible accountsreceivable. The line of credit bears interest at the Bank’s prime rate (8.25% at December 31, 2006). The line ofcredit is secured by all of ATG’s tangible and intangible intellectual and personal property and is subject to financialcovenants including liquidity coverage and profitability. In October 2006, the Company entered into the Tenth LoanModification Agreement (“the Tenth Amendment”) with the Bank, which amended the Amended and RestatedLoan and Security Agreement dated as of June 13, 2002. Under the Tenth Amendment, the profitability covenantwas revised to require that the Company have net losses of not more than $2,500,000 for the quarter endingSeptember 30, 2006 and net profit of at least $500,000 for each quarter ending thereafter. The Company is requiredto maintain unrestricted and unencumbered cash, which includes cash equivalents and marketable securities, ofgreater than $20.0 million at the end of each month through the duration of the credit facility. The line of credit willexpire on January 31, 2008. As of December 31, 2006, approximately $14.7 million was available under the facility.
In addition, to avoid additional bank fees and expenses, ATG is required to maintain unrestricted cash, whichincludes cash equivalents and marketable securities, at the Bank in an amount equal to two times the amount ofobligations outstanding, which includes letters of credit that have been issued but not drawn upon, under the loanagreement. In the event the Company’s cash balances at the Bank fall below this amount, then the Company will berequired to pay fees and expenses to compensate the Bank for lost income. At December 31, 2006, the Companywas in compliance with all related financial covenants. In the event ATG does not comply with the financialcovenants within the line of credit or defaults on any of its provisions, then the Bank’s significant remedies include:(1) declaring all obligations immediately due and payable, which could include requiring the Company to cashcollateralize our outstanding Letters of Credit (LCs); (2) ceasing to advance money or extend credit for the
52
ART TECHNOLOGY GROUP, INC.NOTES TO CONSOLIDATED FINANCIAL STATEMENTS — (Continued)
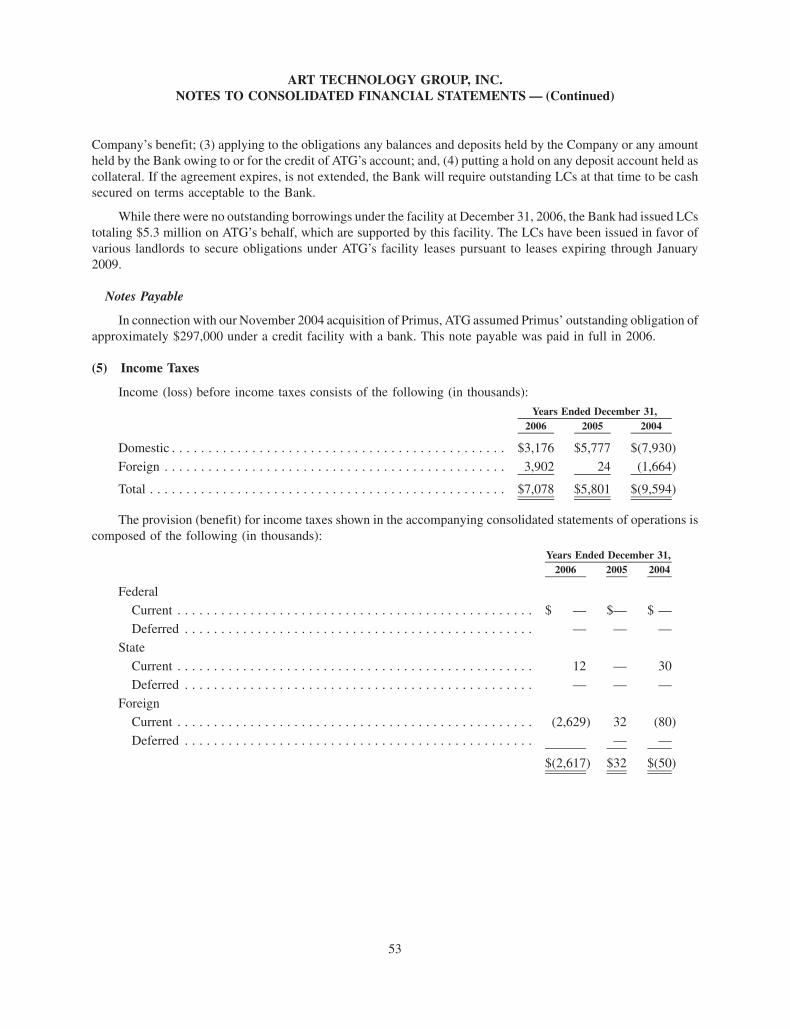
Company’s benefit; (3) applying to the obligations any balances and deposits held by the Company or any amountheld by the Bank owing to or for the credit of ATG’s account; and, (4) putting a hold on any deposit account held ascollateral. If the agreement expires, is not extended, the Bank will require outstanding LCs at that time to be cashsecured on terms acceptable to the Bank.
While there were no outstanding borrowings under the facility at December 31, 2006, the Bank had issued LCstotaling $5.3 million on ATG’s behalf, which are supported by this facility. The LCs have been issued in favor ofvarious landlords to secure obligations under ATG’s facility leases pursuant to leases expiring through January2009.
Notes Payable
In connection with our November 2004 acquisition of Primus, ATG assumed Primus’ outstanding obligation ofapproximately $297,000 under a credit facility with a bank. This note payable was paid in full in 2006.
(5) Income Taxes
Income (loss) before income taxes consists of the following (in thousands):
2006 2005 2004Years Ended December 31,
Domestic . . . . . . . . . . . . . . . . . . . . . . . . . . . . . . . . . . . . . . . . . . . . . . $3,176 $5,777 $(7,930)
Foreign . . . . . . . . . . . . . . . . . . . . . . . . . . . . . . . . . . . . . . . . . . . . . . . 3,902 24 (1,664)
Total . . . . . . . . . . . . . . . . . . . . . . . . . . . . . . . . . . . . . . . . . . . . . . . . . $7,078 $5,801 $(9,594)
The provision (benefit) for income taxes shown in the accompanying consolidated statements of operations iscomposed of the following (in thousands):
2006 2005 2004Years Ended December 31,
Federal
Current . . . . . . . . . . . . . . . . . . . . . . . . . . . . . . . . . . . . . . . . . . . . . . . . . $ — $— $ —
Deferred . . . . . . . . . . . . . . . . . . . . . . . . . . . . . . . . . . . . . . . . . . . . . . . . — — —
State
Current . . . . . . . . . . . . . . . . . . . . . . . . . . . . . . . . . . . . . . . . . . . . . . . . . 12 — 30
Deferred . . . . . . . . . . . . . . . . . . . . . . . . . . . . . . . . . . . . . . . . . . . . . . . . — — —
Foreign
Current . . . . . . . . . . . . . . . . . . . . . . . . . . . . . . . . . . . . . . . . . . . . . . . . . (2,629) 32 (80)
Deferred . . . . . . . . . . . . . . . . . . . . . . . . . . . . . . . . . . . . . . . . . . . . . . . . — —
$(2,617) $32 $(50)
53
ART TECHNOLOGY GROUP, INC.NOTES TO CONSOLIDATED FINANCIAL STATEMENTS — (Continued)
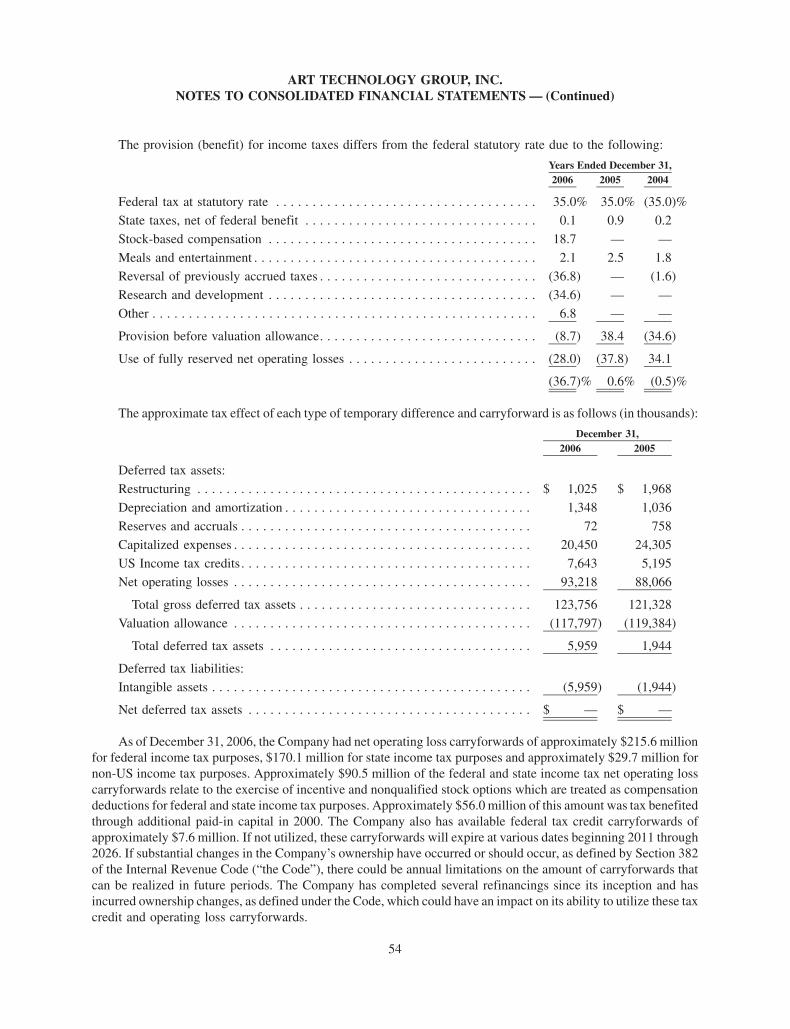
The provision (benefit) for income taxes differs from the federal statutory rate due to the following:
2006 2005 2004Years Ended December 31,
Federal tax at statutory rate . . . . . . . . . . . . . . . . . . . . . . . . . . . . . . . . . . . . 35.0% 35.0% (35.0)%
State taxes, net of federal benefit . . . . . . . . . . . . . . . . . . . . . . . . . . . . . . . . 0.1 0.9 0.2
Stock-based compensation . . . . . . . . . . . . . . . . . . . . . . . . . . . . . . . . . . . . . 18.7 — —
Meals and entertainment . . . . . . . . . . . . . . . . . . . . . . . . . . . . . . . . . . . . . . . 2.1 2.5 1.8
Reversal of previously accrued taxes . . . . . . . . . . . . . . . . . . . . . . . . . . . . . . (36.8) — (1.6)
Research and development . . . . . . . . . . . . . . . . . . . . . . . . . . . . . . . . . . . . . (34.6) — —
Other . . . . . . . . . . . . . . . . . . . . . . . . . . . . . . . . . . . . . . . . . . . . . . . . . . . . . 6.8 — —
Provision before valuation allowance. . . . . . . . . . . . . . . . . . . . . . . . . . . . . . (8.7) 38.4 (34.6)
Use of fully reserved net operating losses . . . . . . . . . . . . . . . . . . . . . . . . . . (28.0) (37.8) 34.1
(36.7)% 0.6% (0.5)%
The approximate tax effect of each type of temporary difference and carryforward is as follows (in thousands):
2006 2005December 31,
Deferred tax assets:
Restructuring . . . . . . . . . . . . . . . . . . . . . . . . . . . . . . . . . . . . . . . . . . . . . . $ 1,025 $ 1,968
Depreciation and amortization . . . . . . . . . . . . . . . . . . . . . . . . . . . . . . . . . . 1,348 1,036
Reserves and accruals . . . . . . . . . . . . . . . . . . . . . . . . . . . . . . . . . . . . . . . . 72 758
Capitalized expenses . . . . . . . . . . . . . . . . . . . . . . . . . . . . . . . . . . . . . . . . . 20,450 24,305
US Income tax credits. . . . . . . . . . . . . . . . . . . . . . . . . . . . . . . . . . . . . . . . 7,643 5,195
Net operating losses . . . . . . . . . . . . . . . . . . . . . . . . . . . . . . . . . . . . . . . . . 93,218 88,066
Total gross deferred tax assets . . . . . . . . . . . . . . . . . . . . . . . . . . . . . . . . 123,756 121,328
Valuation allowance . . . . . . . . . . . . . . . . . . . . . . . . . . . . . . . . . . . . . . . . . (117,797) (119,384)
Total deferred tax assets . . . . . . . . . . . . . . . . . . . . . . . . . . . . . . . . . . . . 5,959 1,944
Deferred tax liabilities:Intangible assets . . . . . . . . . . . . . . . . . . . . . . . . . . . . . . . . . . . . . . . . . . . . (5,959) (1,944)
Net deferred tax assets . . . . . . . . . . . . . . . . . . . . . . . . . . . . . . . . . . . . . . . $ — $ —
As of December 31, 2006, the Company had net operating loss carryforwards of approximately $215.6 millionfor federal income tax purposes, $170.1 million for state income tax purposes and approximately $29.7 million fornon-US income tax purposes. Approximately $90.5 million of the federal and state income tax net operating losscarryforwards relate to the exercise of incentive and nonqualified stock options which are treated as compensationdeductions for federal and state income tax purposes. Approximately $56.0 million of this amount was tax benefitedthrough additional paid-in capital in 2000. The Company also has available federal tax credit carryforwards ofapproximately $7.6 million. If not utilized, these carryforwards will expire at various dates beginning 2011 through2026. If substantial changes in the Company’s ownership have occurred or should occur, as defined by Section 382of the Internal Revenue Code (“the Code”), there could be annual limitations on the amount of carryforwards thatcan be realized in future periods. The Company has completed several refinancings since its inception and hasincurred ownership changes, as defined under the Code, which could have an impact on its ability to utilize these taxcredit and operating loss carryforwards.
54
ART TECHNOLOGY GROUP, INC.NOTES TO CONSOLIDATED FINANCIAL STATEMENTS — (Continued)
During the year ended December 31, 2005, the Company amended its income tax returns for 2001 through2003 for the purpose of capitalizing certain expenses for income tax purposes. The amended returns resulted in adecrease to net operating losses and an increase in capitalized expenses of approximately $51 million. Theamortization of these capitalized costs will become deductible in income tax returns for the years 2002 through2013.
Included in the total net operating loss carryforwards is approximately $50.7 million acquired as a result of theacquisition of Primus. This amount includes only those net operating losses which would not be limited as a result ofthe acquisition of Primus triggering an ownership change pursuant to Section 382 of the Code. If Primus incurredany ownership changes before its acquisition by ATG, limitations imposed under Section 382 of the Code couldhave an impact on the Company’s ability to utilize these net operating loss carryforwards.
To the extent that any Primus pre-acquisition net operating losses and other temporary differences result infuture tax benefits, such tax benefits will be recognized as a reduction in goodwill associated with the acquisition ofPrimus.
Included in the total net operating loss carryforwards is approximately $16.7 million acquired as a result of theacquisition of eStara. This amount includes net operating losses which may be subject to limitation pursuant toSection 382 of the Code as a result of the acquisition. If eStara incurred any ownership changes before its acquisitionby ATG, limitations imposed under Section 382 of the Code could have an impact on our ability to utilize these netoperating loss carryforwards.
To the extent that any eStara pre-acquisition net operating losses and other temporary differences result infuture tax benefits, such tax benefits will be recognized as a reduction in goodwill associated with the acquisition ofeStara.
As of December 31, 2006, 2005 and 2004, the Company recorded a full valuation allowance against itsdeferred tax assets due to the uncertainty surrounding the realizability of these assets. The valuation allowancedecreased $1.6 million to $117.8 million in 2006 from $119.4 million in 2005. The primary reason for the decreasein the valuation allowance is due to a decrease of $7.1 million utilized to offset current book income and an increaseof $5.5 million related to tax credits and other temporary differences.
The Company has provided for potential amounts due in various foreign tax jurisdictions. Judgment is requiredin determining our worldwide income tax expense provision. In the ordinary course of global business, there aremany transactions and calculations where the ultimate tax outcome is uncertain. Some of these uncertainties arise asa consequence of cost reimbursement arrangements among related entities. Although the Company believes itsestimates are reasonable, no assurance can be given that the final tax outcome of these matters will not be differentfrom that which is reflected in the Company’s historical income tax provisions and accruals. Such differences couldhave a material impact on the Company’s income tax provision and operating results in the period in which suchdetermination is made. During 2006, 2005 and 2004, the Company reversed previously accrued taxes of$2.6 million, $0 and $158,000 respectively, due to the closure of tax years under audit and expiration of thestatute of limitations in foreign locations.
(6) Stock-Based Compensation and Stockholders’ Equity
On December 16, 2004, the FASB issued SFAS No. 123 (revised 2004), Share-Based Payment (SFAS 123R).SFAS 123R supersedes APB Opinion No. 25, Accounting for Stock Issued to Employees, and amends SFAS No. 95,Statement of Cash Flows. Generally, the approach in SFAS 123R is similar to the approach described in SFAS 123Accounting for Stock-Based Compensation. However, SFAS 123R requires all share-based payments to employees,including grants of employee stock options, to be recognized in the income statement over their vesting periodbased on their fair values at the date of grant. Pro forma disclosure is no longer an alternative.
55
ART TECHNOLOGY GROUP, INC.NOTES TO CONSOLIDATED FINANCIAL STATEMENTS — (Continued)
On January 1, 2006, the Company adopted SFAS 123R using the modified prospective method as permittedunder SFAS 123R. Under this transition method, compensation cost recognized in fiscal 2006 includes: (a) com-pensation cost for all share-based payments granted prior to but not yet vested as of December 31, 2005, based onthe grant-date fair value estimated in accordance with the provisions of SFAS 123, and (b) compensation cost for allshare-based payments granted subsequent to January 1, 2006, based on the grant-date fair value estimated inaccordance with the provisions of SFAS 123R. In accordance with the modified prospective method of adoption, theCompany’s results of operations and financial position for prior periods have not been restated.
Equity Compensation Plans
The Company grants, or has granted, stock options and other stock and stock-based awards under the followingequity compensation plans:
1996 Stock Option Plan
In April 1996, the Company’s Board of Directors and stockholders adopted and approved its 1996 StockOption Plan (“the 1996 Plan”). The purpose of the 1996 Plan is to reward its employees, officers and directors andconsultants and advisors who are expected to contribute to the Company’s growth and success. The 1996 Planprovides for the award of options to purchase shares of ATG’s common stock. Stock options granted under the 1996Plan may be either incentive stock options or nonqualified stock options. In 2004, the Company’s stockholdersapproved the amendment and restatement of the 1996 Plan to allow for the grant of restricted stock awards,performance share awards and other forms of equity based compensation that were not previously provided for inthe plan and the extension of the term of the 1996 Plan to December 31, 2013. The Board of Directors administersthe 1996 Plan and has the authority to designate participants, determine the number and type of awards to begranted, the time at which awards are exercisable, the method of payment and any other terms or conditions of theawards. Options generally vest quarterly over a two to four-year period and expire 10 years from the date of grant.While the Board determines the prices at which options may be exercised under the 1996 Plan, the exercise price ofan incentive stock option shall be at least 100% (110% for incentive stock options granted to a 10% stockholder) ofthe fair market value of the Company’s common stock on the date of grant. As of December 31, 2006, there were25,600,000 shares authorized under the 1996 Plan.
Additionally, in May 1999, the Company granted options to purchase 150,000 shares of ATG’s common stockoutside of the Company’s stock option plans to an executive of ATG. As of December 31, 2006, these options havenot been exercised.
1999 Outside Director Stock Option Plan
In May 1999, the Board of Directors and stockholders adopted and approved its 1999 Outside Director StockOption Plan (“Director Plan”). Under the terms of the Director Plan, non-employee directors of ATG receivenonqualified options to purchase shares of ATG’s common stock. In 2004, the stockholders approved theamendment and restatement of the Director Plan to allow for the grant of restricted stock awards, performanceshare awards and other forms of equity based compensation that were not previously provided for in the plan and theextension of the term of the Director Plan to December 31, 2013. On April 4, 2006, the Company amended its Non-Employee Director Compensation Plan. The changes to the plan provide that (i) the vesting of the annual stockoption awards to the Company’s non-employee directors under the plan change from quarterly vesting over one yearto quarterly vesting over two years, with full acceleration of vesting upon a change of control of the Company; and(ii) the amount of the Company’s annual restricted stock awards to the Company’s non-employee directors underthe plan increase from shares of the Company’s common stock valued at $2,500 to shares of the Company’scommon stock valued at $4,500. As of December 31, 2006, there were 800,000 shares authorized under the DirectorPlan.
56
ART TECHNOLOGY GROUP, INC.NOTES TO CONSOLIDATED FINANCIAL STATEMENTS — (Continued)
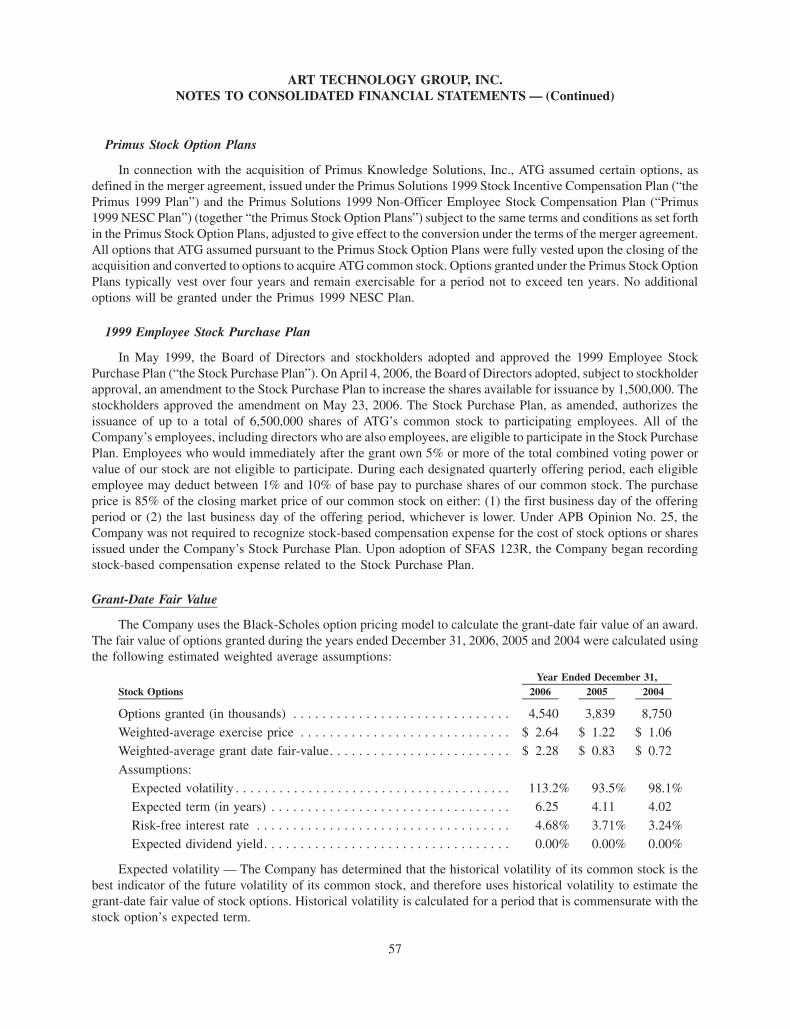
Primus Stock Option Plans
In connection with the acquisition of Primus Knowledge Solutions, Inc., ATG assumed certain options, asdefined in the merger agreement, issued under the Primus Solutions 1999 Stock Incentive Compensation Plan (“thePrimus 1999 Plan”) and the Primus Solutions 1999 Non-Officer Employee Stock Compensation Plan (“Primus1999 NESC Plan”) (together “the Primus Stock Option Plans”) subject to the same terms and conditions as set forthin the Primus Stock Option Plans, adjusted to give effect to the conversion under the terms of the merger agreement.All options that ATG assumed pursuant to the Primus Stock Option Plans were fully vested upon the closing of theacquisition and converted to options to acquire ATG common stock. Options granted under the Primus Stock OptionPlans typically vest over four years and remain exercisable for a period not to exceed ten years. No additionaloptions will be granted under the Primus 1999 NESC Plan.
1999 Employee Stock Purchase Plan
In May 1999, the Board of Directors and stockholders adopted and approved the 1999 Employee StockPurchase Plan (“the Stock Purchase Plan”). On April 4, 2006, the Board of Directors adopted, subject to stockholderapproval, an amendment to the Stock Purchase Plan to increase the shares available for issuance by 1,500,000. Thestockholders approved the amendment on May 23, 2006. The Stock Purchase Plan, as amended, authorizes theissuance of up to a total of 6,500,000 shares of ATG’s common stock to participating employees. All of theCompany’s employees, including directors who are also employees, are eligible to participate in the Stock PurchasePlan. Employees who would immediately after the grant own 5% or more of the total combined voting power orvalue of our stock are not eligible to participate. During each designated quarterly offering period, each eligibleemployee may deduct between 1% and 10% of base pay to purchase shares of our common stock. The purchaseprice is 85% of the closing market price of our common stock on either: (1) the first business day of the offeringperiod or (2) the last business day of the offering period, whichever is lower. Under APB Opinion No. 25, theCompany was not required to recognize stock-based compensation expense for the cost of stock options or sharesissued under the Company’s Stock Purchase Plan. Upon adoption of SFAS 123R, the Company began recordingstock-based compensation expense related to the Stock Purchase Plan.
Grant-Date Fair Value
The Company uses the Black-Scholes option pricing model to calculate the grant-date fair value of an award.The fair value of options granted during the years ended December 31, 2006, 2005 and 2004 were calculated usingthe following estimated weighted average assumptions:
Stock Options 2006 2005 2004Year Ended December 31,
Options granted (in thousands) . . . . . . . . . . . . . . . . . . . . . . . . . . . . . . 4,540 3,839 8,750
Weighted-average exercise price . . . . . . . . . . . . . . . . . . . . . . . . . . . . . $ 2.64 $ 1.22 $ 1.06
Weighted-average grant date fair-value. . . . . . . . . . . . . . . . . . . . . . . . . $ 2.28 $ 0.83 $ 0.72
Assumptions:
Expected volatility . . . . . . . . . . . . . . . . . . . . . . . . . . . . . . . . . . . . . . 113.2% 93.5% 98.1%Expected term (in years) . . . . . . . . . . . . . . . . . . . . . . . . . . . . . . . . . 6.25 4.11 4.02
Risk-free interest rate . . . . . . . . . . . . . . . . . . . . . . . . . . . . . . . . . . . 4.68% 3.71% 3.24%
Expected dividend yield. . . . . . . . . . . . . . . . . . . . . . . . . . . . . . . . . . 0.00% 0.00% 0.00%
Expected volatility — The Company has determined that the historical volatility of its common stock is thebest indicator of the future volatility of its common stock, and therefore uses historical volatility to estimate thegrant-date fair value of stock options. Historical volatility is calculated for a period that is commensurate with thestock option’s expected term.
57
ART TECHNOLOGY GROUP, INC.NOTES TO CONSOLIDATED FINANCIAL STATEMENTS — (Continued)
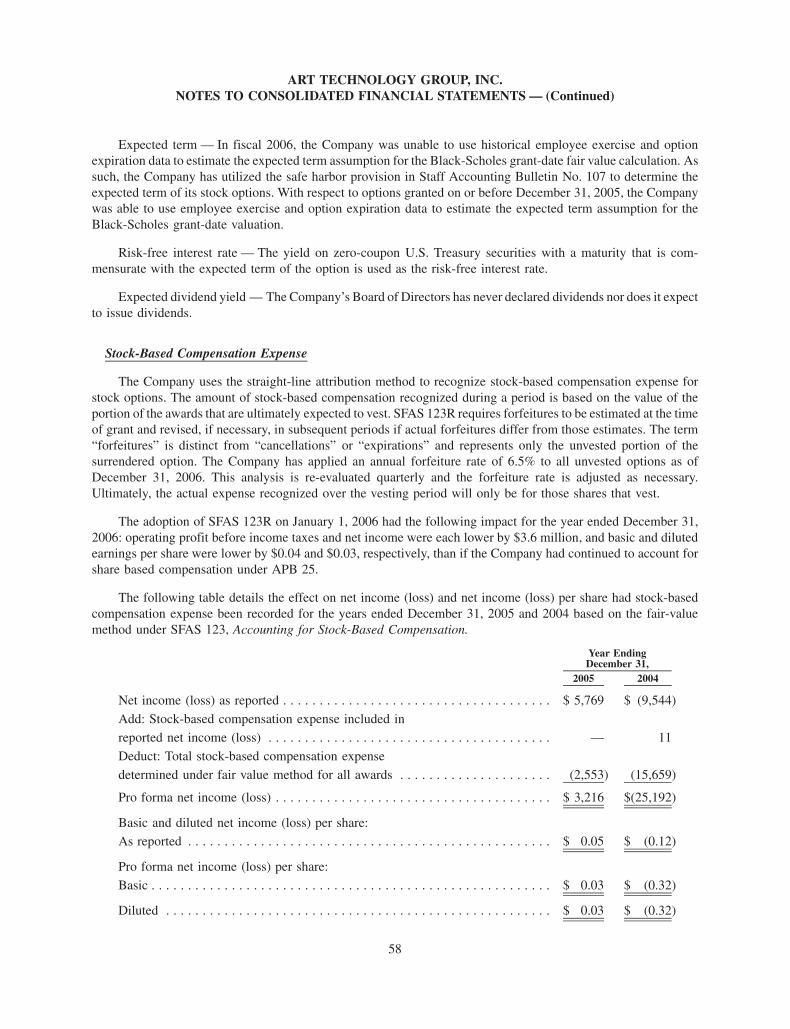
Expected term — In fiscal 2006, the Company was unable to use historical employee exercise and optionexpiration data to estimate the expected term assumption for the Black-Scholes grant-date fair value calculation. Assuch, the Company has utilized the safe harbor provision in Staff Accounting Bulletin No. 107 to determine theexpected term of its stock options. With respect to options granted on or before December 31, 2005, the Companywas able to use employee exercise and option expiration data to estimate the expected term assumption for theBlack-Scholes grant-date valuation.
Risk-free interest rate — The yield on zero-coupon U.S. Treasury securities with a maturity that is com-mensurate with the expected term of the option is used as the risk-free interest rate.
Expected dividend yield — The Company’s Board of Directors has never declared dividends nor does it expectto issue dividends.
Stock-Based Compensation Expense
The Company uses the straight-line attribution method to recognize stock-based compensation expense forstock options. The amount of stock-based compensation recognized during a period is based on the value of theportion of the awards that are ultimately expected to vest. SFAS 123R requires forfeitures to be estimated at the timeof grant and revised, if necessary, in subsequent periods if actual forfeitures differ from those estimates. The term“forfeitures” is distinct from “cancellations” or “expirations” and represents only the unvested portion of thesurrendered option. The Company has applied an annual forfeiture rate of 6.5% to all unvested options as ofDecember 31, 2006. This analysis is re-evaluated quarterly and the forfeiture rate is adjusted as necessary.Ultimately, the actual expense recognized over the vesting period will only be for those shares that vest.
The adoption of SFAS 123R on January 1, 2006 had the following impact for the year ended December 31,2006: operating profit before income taxes and net income were each lower by $3.6 million, and basic and dilutedearnings per share were lower by $0.04 and $0.03, respectively, than if the Company had continued to account forshare based compensation under APB 25.
The following table details the effect on net income (loss) and net income (loss) per share had stock-basedcompensation expense been recorded for the years ended December 31, 2005 and 2004 based on the fair-valuemethod under SFAS 123, Accounting for Stock-Based Compensation.
2005 2004
Year EndingDecember 31,
Net income (loss) as reported . . . . . . . . . . . . . . . . . . . . . . . . . . . . . . . . . . . . . $ 5,769 $ (9,544)
Add: Stock-based compensation expense included inreported net income (loss) . . . . . . . . . . . . . . . . . . . . . . . . . . . . . . . . . . . . . . . — 11
Deduct: Total stock-based compensation expense
determined under fair value method for all awards . . . . . . . . . . . . . . . . . . . . . (2,553) (15,659)
Pro forma net income (loss) . . . . . . . . . . . . . . . . . . . . . . . . . . . . . . . . . . . . . . $ 3,216 $(25,192)
Basic and diluted net income (loss) per share:As reported . . . . . . . . . . . . . . . . . . . . . . . . . . . . . . . . . . . . . . . . . . . . . . . . . . $ 0.05 $ (0.12)
Pro forma net income (loss) per share:
Basic . . . . . . . . . . . . . . . . . . . . . . . . . . . . . . . . . . . . . . . . . . . . . . . . . . . . . . . $ 0.03 $ (0.32)
Diluted . . . . . . . . . . . . . . . . . . . . . . . . . . . . . . . . . . . . . . . . . . . . . . . . . . . . . $ 0.03 $ (0.32)
58
ART TECHNOLOGY GROUP, INC.NOTES TO CONSOLIDATED FINANCIAL STATEMENTS — (Continued)
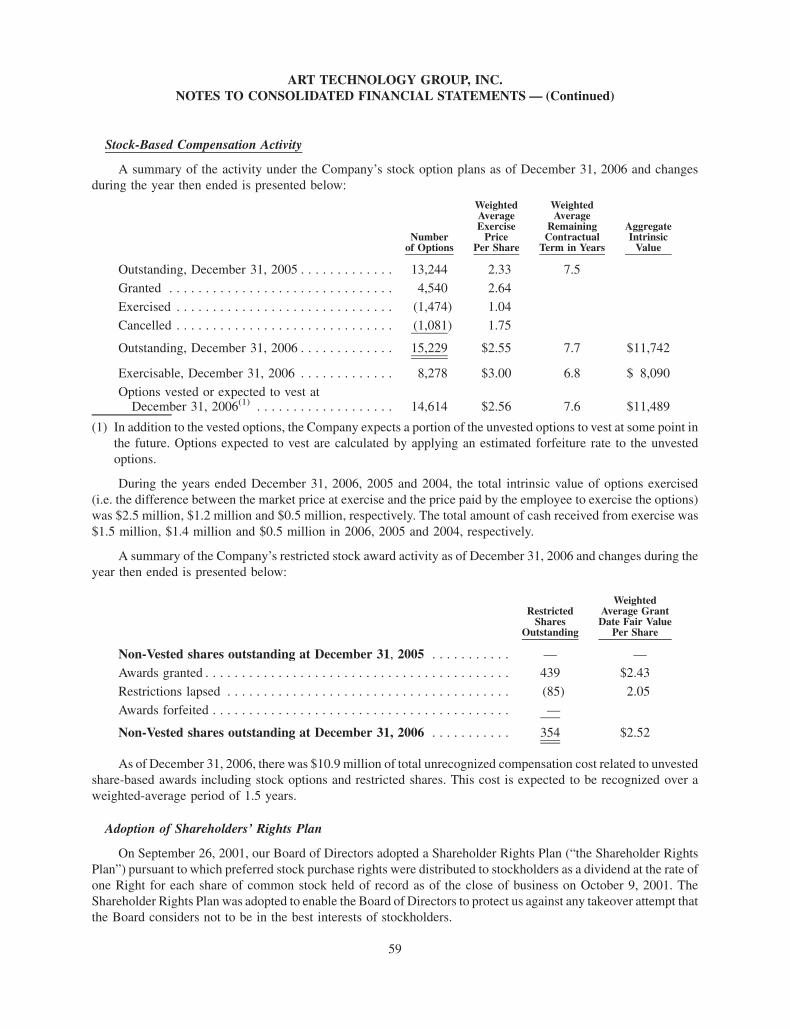
Stock-Based Compensation Activity
A summary of the activity under the Company’s stock option plans as of December 31, 2006 and changesduring the year then ended is presented below:
Numberof Options
WeightedAverageExercise
PricePer Share
WeightedAverage
RemainingContractual
Term in Years
AggregateIntrinsic
Value
Outstanding, December 31, 2005 . . . . . . . . . . . . . 13,244 2.33 7.5
Granted . . . . . . . . . . . . . . . . . . . . . . . . . . . . . . . 4,540 2.64
Exercised . . . . . . . . . . . . . . . . . . . . . . . . . . . . . . (1,474) 1.04
Cancelled . . . . . . . . . . . . . . . . . . . . . . . . . . . . . . (1,081) 1.75
Outstanding, December 31, 2006 . . . . . . . . . . . . . 15,229 $2.55 7.7 $11,742
Exercisable, December 31, 2006 . . . . . . . . . . . . . 8,278 $3.00 6.8 $ 8,090
Options vested or expected to vest atDecember 31, 2006(1) . . . . . . . . . . . . . . . . . . . 14,614 $2.56 7.6 $11,489
(1) In addition to the vested options, the Company expects a portion of the unvested options to vest at some point inthe future. Options expected to vest are calculated by applying an estimated forfeiture rate to the unvestedoptions.
During the years ended December 31, 2006, 2005 and 2004, the total intrinsic value of options exercised(i.e. the difference between the market price at exercise and the price paid by the employee to exercise the options)was $2.5 million, $1.2 million and $0.5 million, respectively. The total amount of cash received from exercise was$1.5 million, $1.4 million and $0.5 million in 2006, 2005 and 2004, respectively.
A summary of the Company’s restricted stock award activity as of December 31, 2006 and changes during theyear then ended is presented below:
RestrictedShares
Outstanding
WeightedAverage GrantDate Fair Value
Per Share
Non-Vested shares outstanding at December 31, 2005 . . . . . . . . . . . — —
Awards granted . . . . . . . . . . . . . . . . . . . . . . . . . . . . . . . . . . . . . . . . . . 439 $2.43
Restrictions lapsed . . . . . . . . . . . . . . . . . . . . . . . . . . . . . . . . . . . . . . . (85) 2.05
Awards forfeited . . . . . . . . . . . . . . . . . . . . . . . . . . . . . . . . . . . . . . . . . —
Non-Vested shares outstanding at December 31, 2006 . . . . . . . . . . . 354 $2.52
As of December 31, 2006, there was $10.9 million of total unrecognized compensation cost related to unvestedshare-based awards including stock options and restricted shares. This cost is expected to be recognized over aweighted-average period of 1.5 years.
Adoption of Shareholders’ Rights Plan
On September 26, 2001, our Board of Directors adopted a Shareholder Rights Plan (“the Shareholder RightsPlan”) pursuant to which preferred stock purchase rights were distributed to stockholders as a dividend at the rate ofone Right for each share of common stock held of record as of the close of business on October 9, 2001. TheShareholder Rights Plan was adopted to enable the Board of Directors to protect us against any takeover attempt thatthe Board considers not to be in the best interests of stockholders.
59
ART TECHNOLOGY GROUP, INC.NOTES TO CONSOLIDATED FINANCIAL STATEMENTS — (Continued)
When exercisable, each Right will entitle stockholders to buy one one-thousandth of a share of Series A JuniorParticipating Preferred Stock at an exercise price of $15.00 per Right. Subject to certain exceptions, the Rights willbe exercisable after a person or group (except for certain excluded persons) acquires beneficial ownership of 15% ormore of our outstanding common stock or undertakes a tender or exchange offer which, if consummated, wouldresult in that person or group beneficially owning 15% or more of our outstanding common stock. The Rights willbe redeemable by the Board at any time before a person or group acquires 15% or more of our outstanding commonstock and under certain other circumstances at a redemption price of $.001 per Right.
(7) Acquisitions
Acquisition of eStara, Inc.
On October 2, 2006, the Company acquired all of the outstanding shares of common stock of privately heldeStara, Inc., a provider of proactive conversion solutions for enhancing online sales and support initiatives. Theaggregate purchase price was approximately $49.8 million, which consisted of $39.2 million of ATG commonstock, $2.2 million of transaction costs, which primarily consisted of fees paid for financial advisory, legal andaccounting services, a transaction bonus to eStara employees of $4.8 million and $3.6 million of cash in lieu ofissuing ATG common stock to non accredited investors. The Company issued approximately 14.6 million shares ofATG common stock, the fair value of which was based upon a five-day average of the closing price two days beforeand two days after the terms of the acquisition were agreed to and publicly announced. In addition, the Companyissued 0.3 million shares of restricted stock were issued, which will be recognized as stock-based compensationexpense over the vesting term. The excess of the purchase price over the net assets acquired resulted in goodwill of$32.1 million.
The Company may also pay up to an additional $6.0 million in potential earn-out payments to the eStara non-employee stockholders and employee stockholders as of October 2, 2006 based on eStara revenues for fiscal 2007.If eStara’s revenues exceed $25.0 million but are less than $30 million, ATG will be required to pay $2.0 million, ofwhich $0.6 million will be distributed to the stockholders and $1.4 million will be distributed to employeestockholders. In the event eStara’s revenues exceed $30.0 million, ATG will be required to pay an additional$4.0 million, of which $2.5 million will be distributed to non-employee stockholders and $1.5 million will bedistributed to employee stockholders. The payments to stockholders will be recorded as additional purchase price,and the amounts paid to employee stockholders will be accounted for as compensation expense in the Company’sincome statement to the extent it relates to amounts paid to eStara employee stockholders in excess of that paid tonon-employee stockholders. These payments may be made, at the Company’s option, in the form of cash or stock,subject to the applicable rules of the Nasdaq stock market and applicable limitations under the tax rules to permit thetransaction to be categorized as a tax free reorganization.
In determining the purchase price allocation, the Company considered, among other factors, the expected useof the acquired assets, historical demand and estimates of future demand of eStara’s products and services. The fairvalue of intangible assets was primarily determined using the income approach, which is based upon a forecast ofthe expected future net cash flows associated with the assets. These net cash flows were then discounted to a presentvalue by applying a discount rate of 14% to 16%. The discount rate was determined after consideration of eStaras’weighted average cost of capital and the risk associated with achieving forecast sales related to the technology andassets acquired from eStara.
60
ART TECHNOLOGY GROUP, INC.NOTES TO CONSOLIDATED FINANCIAL STATEMENTS — (Continued)

The preliminary purchase price was allocated based on estimated fair values as of the acquisition date. Thefollowing represents the allocation of the purchase price (in thousands):
Cash . . . . . . . . . . . . . . . . . . . . . . . . . . . . . . . . . . . . . . . . . . . . . . . . . . . . . . . . . . . . . . . . $ 2,699
Accounts receivable . . . . . . . . . . . . . . . . . . . . . . . . . . . . . . . . . . . . . . . . . . . . . . . . . . . . . 3,671
Other current assets . . . . . . . . . . . . . . . . . . . . . . . . . . . . . . . . . . . . . . . . . . . . . . . . . . . . . 188
Property, plant and equipment. . . . . . . . . . . . . . . . . . . . . . . . . . . . . . . . . . . . . . . . . . . . . . 167
Goodwill . . . . . . . . . . . . . . . . . . . . . . . . . . . . . . . . . . . . . . . . . . . . . . . . . . . . . . . . . . . . . 32,071
Intangible assets:
Customer relationship (estimated useful life of 4 years) . . . . . . . . . . . . . . . . . . . . . . . . . 7,300
Purchased technology (estimated useful life of 5 years) . . . . . . . . . . . . . . . . . . . . . . . . . 5,300
Trademarks (estimated useful life of 5 years). . . . . . . . . . . . . . . . . . . . . . . . . . . . . . . . . 1,400
Total intangible assets . . . . . . . . . . . . . . . . . . . . . . . . . . . . . . . . . . . . . . . . . . . . . . . . 14,000
Other long-term assets . . . . . . . . . . . . . . . . . . . . . . . . . . . . . . . . . . . . . . . . . . . . . . . . . . . 37
Accounts payable . . . . . . . . . . . . . . . . . . . . . . . . . . . . . . . . . . . . . . . . . . . . . . . . . . . . . . . (517)
Deferred revenue . . . . . . . . . . . . . . . . . . . . . . . . . . . . . . . . . . . . . . . . . . . . . . . . . . . . . . . (679)
Accrued and other expenses . . . . . . . . . . . . . . . . . . . . . . . . . . . . . . . . . . . . . . . . . . . . . . . (1,821)
Total purchase price . . . . . . . . . . . . . . . . . . . . . . . . . . . . . . . . . . . . . . . . . . . . . . . . . . . $49,816
The consolidated financial statements include the results of eStara from the date of acquisition. The followingpro forma information assumes the eStara acquisition occurred as of the beginning of each year presented aftergiving effect to certain adjustments, primarily amortization of intangible assets and reduction of revenues for thefair market value adjustment to eStara’s deferred revenue balance. The pro forma results are not necessarilyindicative of the results of operations that actually would have occurred had the acquisition been in effect for theperiods presented or of results that may occur in the future (in thousands, except per share data):
2006 2005December 31,
(Unaudited)
Revenue . . . . . . . . . . . . . . . . . . . . . . . . . . . . . . . . . . . . . . . . . . . . . . . . . . . . $113,935 $98,078
Net income . . . . . . . . . . . . . . . . . . . . . . . . . . . . . . . . . . . . . . . . . . . . . . . . . . $ 7,111 $ 2,591
Net income per share — basic . . . . . . . . . . . . . . . . . . . . . . . . . . . . . . . . . . . . $ 0.06 $ 0.02
Net income per share — assuming dilution. . . . . . . . . . . . . . . . . . . . . . . . . . . $ 0.05 $ 0.02
Intangible assets acquired in the eStara acquisition are being amortized based on the pattern in which theeconomic benefits of the intangible assets are being utilized or on a straight-line basis. The total weighted averageamortization period for the intangible assets is 4.5 years.
Acquisition of Primus Knowledge Solutions, Inc.
Effective November 1, 2004, the Company acquired all of the outstanding shares of common stock of PrimusKnowledge Solutions, Inc. In connection with the Primus acquisition, the Company commenced integrationactivities which resulted in involuntary terminations and lease and contract terminations. The liability forinvoluntary termination benefits was for 49 employees, primarily in general and administrative and research
61
ART TECHNOLOGY GROUP, INC.NOTES TO CONSOLIDATED FINANCIAL STATEMENTS — (Continued)
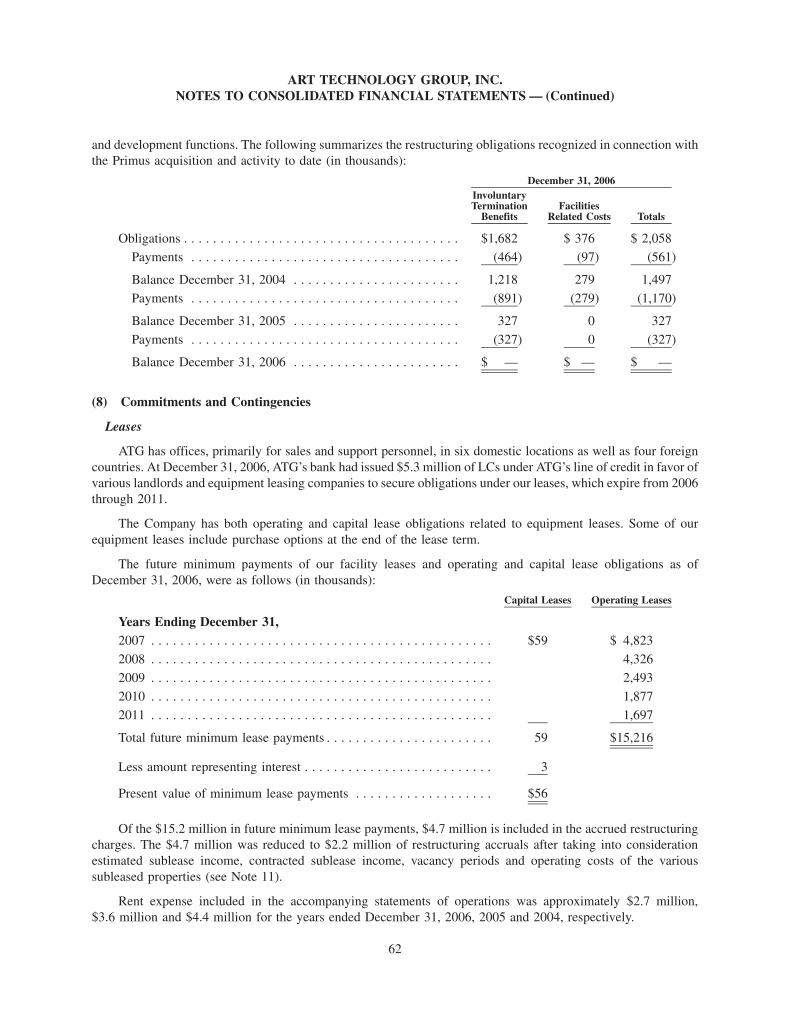
and development functions. The following summarizes the restructuring obligations recognized in connection withthe Primus acquisition and activity to date (in thousands):
InvoluntaryTermination
BenefitsFacilities
Related Costs Totals
December 31, 2006
Obligations . . . . . . . . . . . . . . . . . . . . . . . . . . . . . . . . . . . . . . $1,682 $ 376 $ 2,058
Payments . . . . . . . . . . . . . . . . . . . . . . . . . . . . . . . . . . . . . (464) (97) (561)
Balance December 31, 2004 . . . . . . . . . . . . . . . . . . . . . . . 1,218 279 1,497
Payments . . . . . . . . . . . . . . . . . . . . . . . . . . . . . . . . . . . . . (891) (279) (1,170)
Balance December 31, 2005 . . . . . . . . . . . . . . . . . . . . . . . 327 0 327
Payments . . . . . . . . . . . . . . . . . . . . . . . . . . . . . . . . . . . . . (327) 0 (327)
Balance December 31, 2006 . . . . . . . . . . . . . . . . . . . . . . . $ — $ — $ —
(8) Commitments and Contingencies
Leases
ATG has offices, primarily for sales and support personnel, in six domestic locations as well as four foreigncountries. At December 31, 2006, ATG’s bank had issued $5.3 million of LCs under ATG’s line of credit in favor ofvarious landlords and equipment leasing companies to secure obligations under our leases, which expire from 2006through 2011.
The Company has both operating and capital lease obligations related to equipment leases. Some of ourequipment leases include purchase options at the end of the lease term.
The future minimum payments of our facility leases and operating and capital lease obligations as ofDecember 31, 2006, were as follows (in thousands):
Capital Leases Operating Leases
Years Ending December 31,2007 . . . . . . . . . . . . . . . . . . . . . . . . . . . . . . . . . . . . . . . . . . . . . . . $59 $ 4,823
2008 . . . . . . . . . . . . . . . . . . . . . . . . . . . . . . . . . . . . . . . . . . . . . . . 4,326
2009 . . . . . . . . . . . . . . . . . . . . . . . . . . . . . . . . . . . . . . . . . . . . . . . 2,493
2010 . . . . . . . . . . . . . . . . . . . . . . . . . . . . . . . . . . . . . . . . . . . . . . . 1,877
2011 . . . . . . . . . . . . . . . . . . . . . . . . . . . . . . . . . . . . . . . . . . . . . . . 1,697
Total future minimum lease payments . . . . . . . . . . . . . . . . . . . . . . . 59 $15,216
Less amount representing interest . . . . . . . . . . . . . . . . . . . . . . . . . . 3
Present value of minimum lease payments . . . . . . . . . . . . . . . . . . . $56
Of the $15.2 million in future minimum lease payments, $4.7 million is included in the accrued restructuringcharges. The $4.7 million was reduced to $2.2 million of restructuring accruals after taking into considerationestimated sublease income, contracted sublease income, vacancy periods and operating costs of the varioussubleased properties (see Note 11).
Rent expense included in the accompanying statements of operations was approximately $2.7 million,$3.6 million and $4.4 million for the years ended December 31, 2006, 2005 and 2004, respectively.
62
ART TECHNOLOGY GROUP, INC.NOTES TO CONSOLIDATED FINANCIAL STATEMENTS — (Continued)
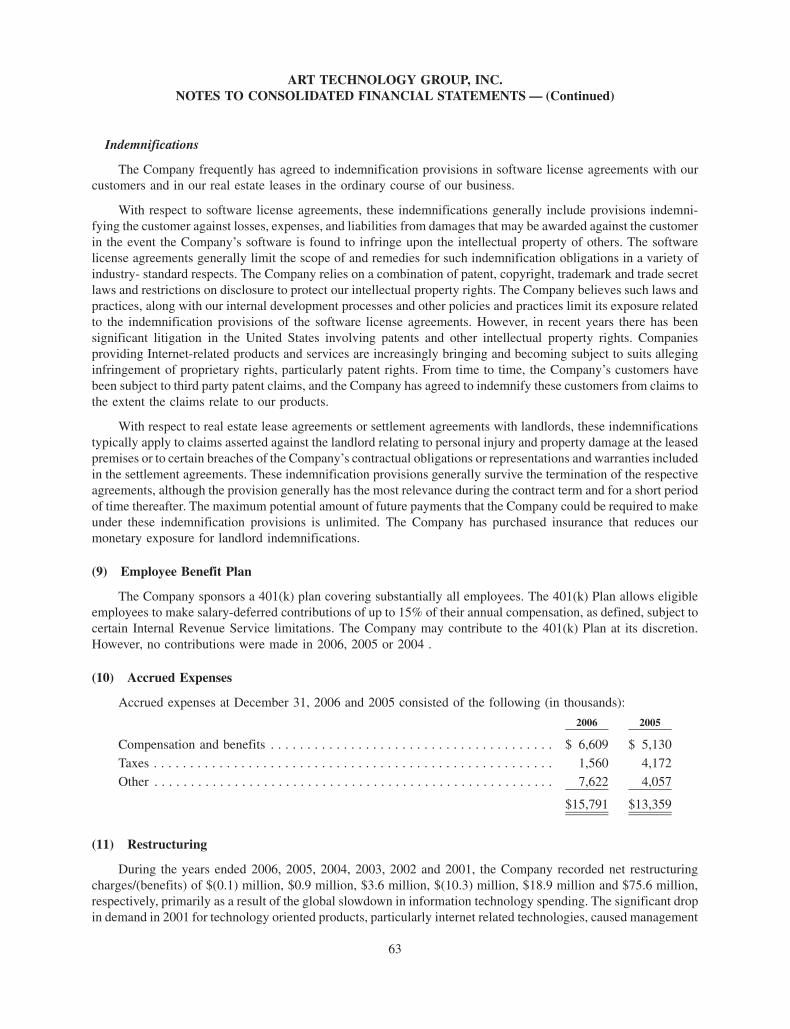
Indemnifications
The Company frequently has agreed to indemnification provisions in software license agreements with ourcustomers and in our real estate leases in the ordinary course of our business.
With respect to software license agreements, these indemnifications generally include provisions indemni-fying the customer against losses, expenses, and liabilities from damages that may be awarded against the customerin the event the Company’s software is found to infringe upon the intellectual property of others. The softwarelicense agreements generally limit the scope of and remedies for such indemnification obligations in a variety ofindustry- standard respects. The Company relies on a combination of patent, copyright, trademark and trade secretlaws and restrictions on disclosure to protect our intellectual property rights. The Company believes such laws andpractices, along with our internal development processes and other policies and practices limit its exposure relatedto the indemnification provisions of the software license agreements. However, in recent years there has beensignificant litigation in the United States involving patents and other intellectual property rights. Companiesproviding Internet-related products and services are increasingly bringing and becoming subject to suits alleginginfringement of proprietary rights, particularly patent rights. From time to time, the Company’s customers havebeen subject to third party patent claims, and the Company has agreed to indemnify these customers from claims tothe extent the claims relate to our products.
With respect to real estate lease agreements or settlement agreements with landlords, these indemnificationstypically apply to claims asserted against the landlord relating to personal injury and property damage at the leasedpremises or to certain breaches of the Company’s contractual obligations or representations and warranties includedin the settlement agreements. These indemnification provisions generally survive the termination of the respectiveagreements, although the provision generally has the most relevance during the contract term and for a short periodof time thereafter. The maximum potential amount of future payments that the Company could be required to makeunder these indemnification provisions is unlimited. The Company has purchased insurance that reduces ourmonetary exposure for landlord indemnifications.
(9) Employee Benefit Plan
The Company sponsors a 401(k) plan covering substantially all employees. The 401(k) Plan allows eligibleemployees to make salary-deferred contributions of up to 15% of their annual compensation, as defined, subject tocertain Internal Revenue Service limitations. The Company may contribute to the 401(k) Plan at its discretion.However, no contributions were made in 2006, 2005 or 2004 .
(10) Accrued Expenses
Accrued expenses at December 31, 2006 and 2005 consisted of the following (in thousands):
2006 2005
Compensation and benefits . . . . . . . . . . . . . . . . . . . . . . . . . . . . . . . . . . . . . . . $ 6,609 $ 5,130
Taxes . . . . . . . . . . . . . . . . . . . . . . . . . . . . . . . . . . . . . . . . . . . . . . . . . . . . . . . 1,560 4,172Other . . . . . . . . . . . . . . . . . . . . . . . . . . . . . . . . . . . . . . . . . . . . . . . . . . . . . . . 7,622 4,057
$15,791 $13,359
(11) Restructuring
During the years ended 2006, 2005, 2004, 2003, 2002 and 2001, the Company recorded net restructuringcharges/(benefits) of $(0.1) million, $0.9 million, $3.6 million, $(10.3) million, $18.9 million and $75.6 million,respectively, primarily as a result of the global slowdown in information technology spending. The significant dropin demand in 2001 for technology oriented products, particularly internet related technologies, caused management
63
ART TECHNOLOGY GROUP, INC.NOTES TO CONSOLIDATED FINANCIAL STATEMENTS — (Continued)

to significantly scale back the Company’s prior growth plans, resulting in a significant reduction in the Company’sworkforce and consolidation of the Company’s facilities in 2001. Throughout 2002, the continued softness ofdemand for technology products, as well as near term revenue projections, caused management to further evaluatethe Company’s marketing, sales and service resource capabilities as well as its overall general and administrativecost structure, which resulted in additional restructuring actions being taken in 2002. These actions resulted in afurther reduction in headcount and consolidation of additional facilities. In 2003, as the Company continued torefine its business strategy and to consider future revenue opportunities, the Company took further restructuringactions to reduce costs, including product development costs, to help move the Company towards profitability. In2004, the Company’s restructuring activities were undertaken to align the Company’s headcount more closely withmanagement’s revenue projections and changing staff requirements as a result of strategic product realignments andthe Company’s acquisition of Primus, and to eliminate facilities that were not needed to efficiently run theCompany’s operations. In 2005, the Company’s restructuring was to align workforce and facilities needs. The netbenefit recorded in 2006 was related to adjustments to charges recorded in 2001 and 2003. The charges referred toabove primarily pertain to the closure and consolidation of excess facilities, impairment of assets, employeeseverance benefits, and the settlement of certain contractual obligations. The 2005, 2004 and 2003 charges wererecorded in accordance with SFAS No. 146, Accounting for Costs Associated with Exit or Disposal Activities,SFAS No. 88, Employers’ Accounting for Settlements and Curtailments of Defined Benefit Pension Plans and forTermination Benefits and Staff Accounting Bulletin (SAB) No. 100, Restructuring and Impairment Charges. The2002 and 2001 charges were recorded in accordance with Emerging Issues Task Force Issue No. 94-3, “LiabilityRecognition for Certain Employee Termination Benefits and Other Costs to Exit an Activity (Including CertainCosts Incurred in a Restructuring), SFAS 88 and SAB 100. During the years 2001 through 2006, the Company hasrecorded adjustments to previously recorded restructuring charges to reflect changes in estimates and assumptions.
As of December 31, 2006, the Company had an accrued restructuring liability of $2.2 million related to facilityclosure costs for net lease obligations. The long-term portion of the accrued restructuring liability was $1.0 million.
A summary of the Company’s charges and activity in its restructuring accruals is as follows:
2006 2005 2004 2003 2002 2001 Total(In thousands)
Restructuring Charge (Benefit)
Facility-related costs and impairments . . . . . . $ $1,817 $1,488 $ 1,464 $14,634 $59,418 $ 78,821Employee severance and benefits costs . . . . . 2,461 1,236 3,553 7,938 15,188Asset impairments . . . . . . . . . . . . . . . . . . . . 4,205 4,205Exchangeable share settlement . . . . . . . . . . . 1,263 1,263Marketing costs . . . . . . . . . . . . . . . . . . . . . 851 851Legal and accounting . . . . . . . . . . . . . . . . . 405 405
Restructuring charge . . . . . . . . . . . . . . . . . . — 1,817 3,949 2,700 18,187 74,080 100,733Adjustments to 2001 action, net . . . . . . . . . . 545 (792) (60) (8,338) 688 1,500 (6,457)Adjustments to 2002 action, net . . . . . . . . . . 43 (242) (5,118) (5,317)Adjustments to 2003 action, net . . . . . . . . . . (607) 74 (77) 410 (200)Adjustments to 2004 action, net . . . . . . . . . . (257) (257)Adjustments to 2005 action, net . . . . . . . . . . —
Total adjustments to prior actions, net . . . . . . (62) (932) (379) (13,046) 688 1,500 (12,231)
Restructuring charge (benefit) . . . . . . . . . . . . $ (62) $ 885 $3,570 $(10,346) $18,875 $75,580 $ 88,502
64
ART TECHNOLOGY GROUP, INC.NOTES TO CONSOLIDATED FINANCIAL STATEMENTS — (Continued)
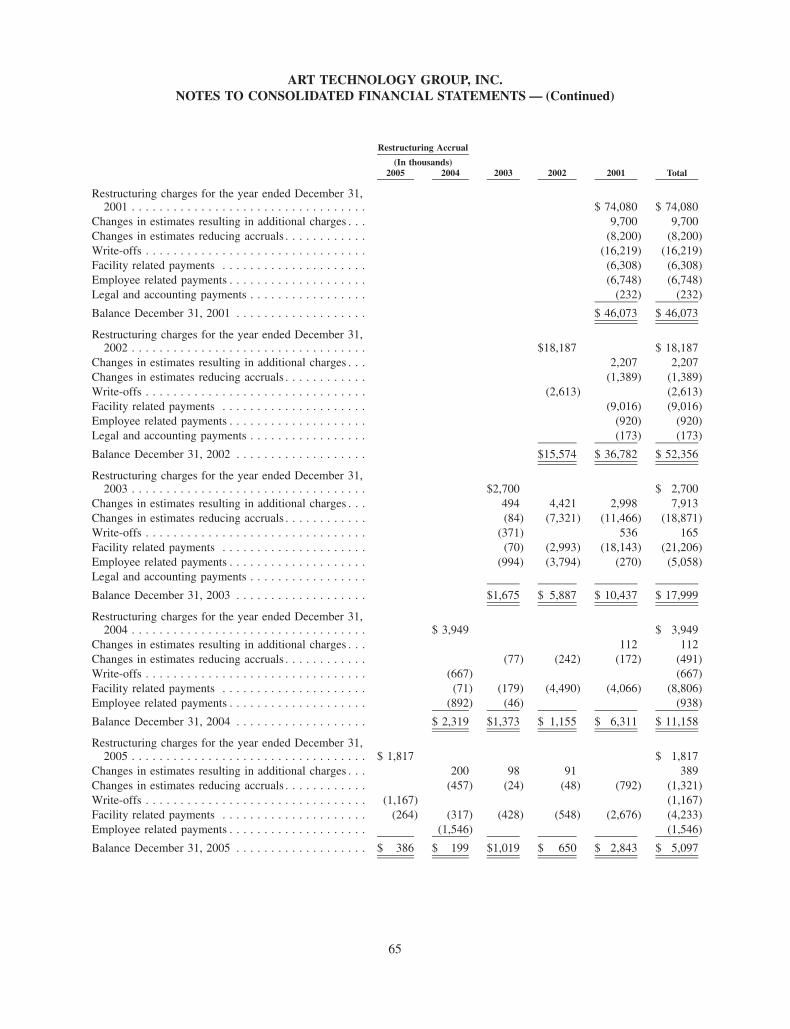
2005 2004 2003 2002 2001 Total(In thousands)
Restructuring Accrual
Restructuring charges for the year ended December 31,2001 . . . . . . . . . . . . . . . . . . . . . . . . . . . . . . . . . . $ 74,080 $ 74,080
Changes in estimates resulting in additional charges . . . 9,700 9,700Changes in estimates reducing accruals . . . . . . . . . . . . (8,200) (8,200)Write-offs . . . . . . . . . . . . . . . . . . . . . . . . . . . . . . . . (16,219) (16,219)Facility related payments . . . . . . . . . . . . . . . . . . . . . (6,308) (6,308)Employee related payments . . . . . . . . . . . . . . . . . . . . (6,748) (6,748)Legal and accounting payments . . . . . . . . . . . . . . . . . (232) (232)
Balance December 31, 2001 . . . . . . . . . . . . . . . . . . . $ 46,073 $ 46,073
Restructuring charges for the year ended December 31,2002 . . . . . . . . . . . . . . . . . . . . . . . . . . . . . . . . . . $18,187 $ 18,187
Changes in estimates resulting in additional charges . . . 2,207 2,207Changes in estimates reducing accruals . . . . . . . . . . . . (1,389) (1,389)Write-offs . . . . . . . . . . . . . . . . . . . . . . . . . . . . . . . . (2,613) (2,613)Facility related payments . . . . . . . . . . . . . . . . . . . . . (9,016) (9,016)Employee related payments . . . . . . . . . . . . . . . . . . . . (920) (920)Legal and accounting payments . . . . . . . . . . . . . . . . . (173) (173)
Balance December 31, 2002 . . . . . . . . . . . . . . . . . . . $15,574 $ 36,782 $ 52,356
Restructuring charges for the year ended December 31,2003 . . . . . . . . . . . . . . . . . . . . . . . . . . . . . . . . . . $2,700 $ 2,700
Changes in estimates resulting in additional charges . . . 494 4,421 2,998 7,913Changes in estimates reducing accruals . . . . . . . . . . . . (84) (7,321) (11,466) (18,871)Write-offs . . . . . . . . . . . . . . . . . . . . . . . . . . . . . . . . (371) 536 165Facility related payments . . . . . . . . . . . . . . . . . . . . . (70) (2,993) (18,143) (21,206)Employee related payments . . . . . . . . . . . . . . . . . . . . (994) (3,794) (270) (5,058)Legal and accounting payments . . . . . . . . . . . . . . . . .
Balance December 31, 2003 . . . . . . . . . . . . . . . . . . . $1,675 $ 5,887 $ 10,437 $ 17,999
Restructuring charges for the year ended December 31,2004 . . . . . . . . . . . . . . . . . . . . . . . . . . . . . . . . . . $ 3,949 $ 3,949
Changes in estimates resulting in additional charges . . . 112 112Changes in estimates reducing accruals . . . . . . . . . . . . (77) (242) (172) (491)Write-offs . . . . . . . . . . . . . . . . . . . . . . . . . . . . . . . . (667) (667)Facility related payments . . . . . . . . . . . . . . . . . . . . . (71) (179) (4,490) (4,066) (8,806)Employee related payments . . . . . . . . . . . . . . . . . . . . (892) (46) (938)
Balance December 31, 2004 . . . . . . . . . . . . . . . . . . . $ 2,319 $1,373 $ 1,155 $ 6,311 $ 11,158
Restructuring charges for the year ended December 31,2005 . . . . . . . . . . . . . . . . . . . . . . . . . . . . . . . . . . $ 1,817 $ 1,817
Changes in estimates resulting in additional charges . . . 200 98 91 389Changes in estimates reducing accruals . . . . . . . . . . . . (457) (24) (48) (792) (1,321)Write-offs . . . . . . . . . . . . . . . . . . . . . . . . . . . . . . . . (1,167) (1,167)Facility related payments . . . . . . . . . . . . . . . . . . . . . (264) (317) (428) (548) (2,676) (4,233)Employee related payments . . . . . . . . . . . . . . . . . . . . (1,546) (1,546)
Balance December 31, 2005 . . . . . . . . . . . . . . . . . . . $ 386 $ 199 $1,019 $ 650 $ 2,843 $ 5,097
65
ART TECHNOLOGY GROUP, INC.NOTES TO CONSOLIDATED FINANCIAL STATEMENTS — (Continued)
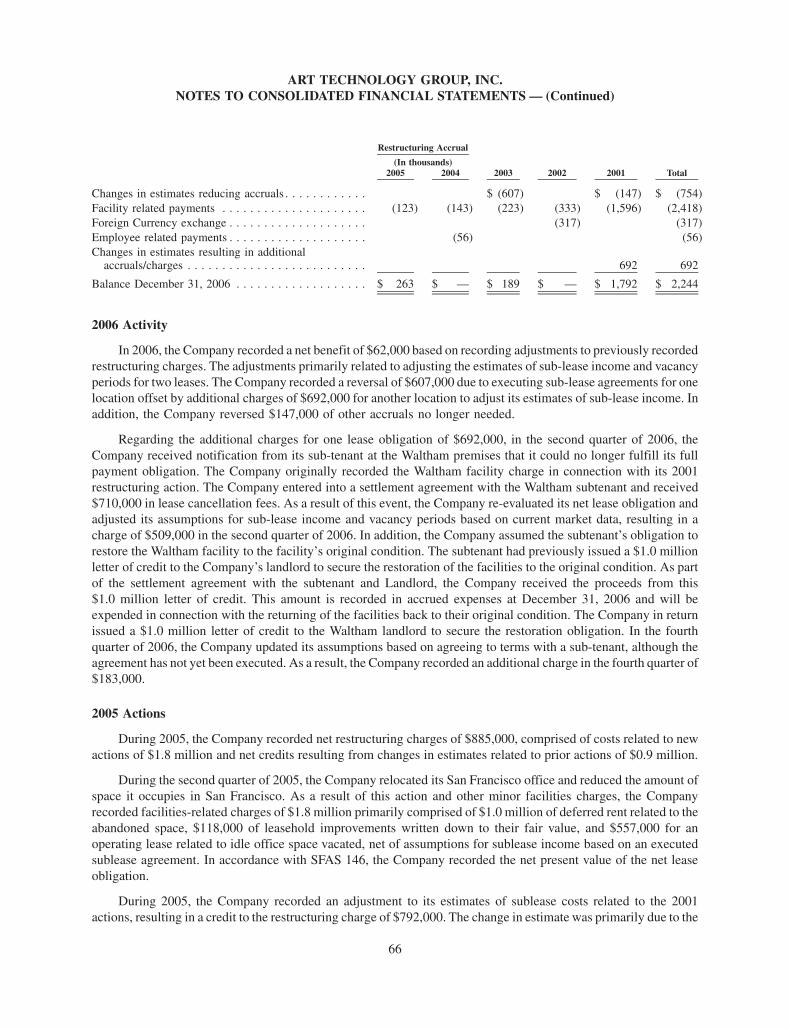
2005 2004 2003 2002 2001 Total(In thousands)
Restructuring Accrual
Changes in estimates reducing accruals . . . . . . . . . . . . $ (607) $ (147) $ (754)Facility related payments . . . . . . . . . . . . . . . . . . . . . (123) (143) (223) (333) (1,596) (2,418)Foreign Currency exchange . . . . . . . . . . . . . . . . . . . . (317) (317)Employee related payments . . . . . . . . . . . . . . . . . . . . (56) (56)Changes in estimates resulting in additional
accruals/charges . . . . . . . . . . . . . . . . . . . . . . . . . . 692 692
Balance December 31, 2006 . . . . . . . . . . . . . . . . . . . $ 263 $ — $ 189 $ — $ 1,792 $ 2,244
2006 Activity
In 2006, the Company recorded a net benefit of $62,000 based on recording adjustments to previously recordedrestructuring charges. The adjustments primarily related to adjusting the estimates of sub-lease income and vacancyperiods for two leases. The Company recorded a reversal of $607,000 due to executing sub-lease agreements for onelocation offset by additional charges of $692,000 for another location to adjust its estimates of sub-lease income. Inaddition, the Company reversed $147,000 of other accruals no longer needed.
Regarding the additional charges for one lease obligation of $692,000, in the second quarter of 2006, theCompany received notification from its sub-tenant at the Waltham premises that it could no longer fulfill its fullpayment obligation. The Company originally recorded the Waltham facility charge in connection with its 2001restructuring action. The Company entered into a settlement agreement with the Waltham subtenant and received$710,000 in lease cancellation fees. As a result of this event, the Company re-evaluated its net lease obligation andadjusted its assumptions for sub-lease income and vacancy periods based on current market data, resulting in acharge of $509,000 in the second quarter of 2006. In addition, the Company assumed the subtenant’s obligation torestore the Waltham facility to the facility’s original condition. The subtenant had previously issued a $1.0 millionletter of credit to the Company’s landlord to secure the restoration of the facilities to the original condition. As partof the settlement agreement with the subtenant and Landlord, the Company received the proceeds from this$1.0 million letter of credit. This amount is recorded in accrued expenses at December 31, 2006 and will beexpended in connection with the returning of the facilities back to their original condition. The Company in returnissued a $1.0 million letter of credit to the Waltham landlord to secure the restoration obligation. In the fourthquarter of 2006, the Company updated its assumptions based on agreeing to terms with a sub-tenant, although theagreement has not yet been executed. As a result, the Company recorded an additional charge in the fourth quarter of$183,000.
2005 Actions
During 2005, the Company recorded net restructuring charges of $885,000, comprised of costs related to newactions of $1.8 million and net credits resulting from changes in estimates related to prior actions of $0.9 million.
During the second quarter of 2005, the Company relocated its San Francisco office and reduced the amount ofspace it occupies in San Francisco. As a result of this action and other minor facilities charges, the Companyrecorded facilities-related charges of $1.8 million primarily comprised of $1.0 million of deferred rent related to theabandoned space, $118,000 of leasehold improvements written down to their fair value, and $557,000 for anoperating lease related to idle office space vacated, net of assumptions for sublease income based on an executedsublease agreement. In accordance with SFAS 146, the Company recorded the net present value of the net leaseobligation.
During 2005, the Company recorded an adjustment to its estimates of sublease costs related to the 2001actions, resulting in a credit to the restructuring charge of $792,000. The change in estimate was primarily due to the
66
ART TECHNOLOGY GROUP, INC.NOTES TO CONSOLIDATED FINANCIAL STATEMENTS — (Continued)
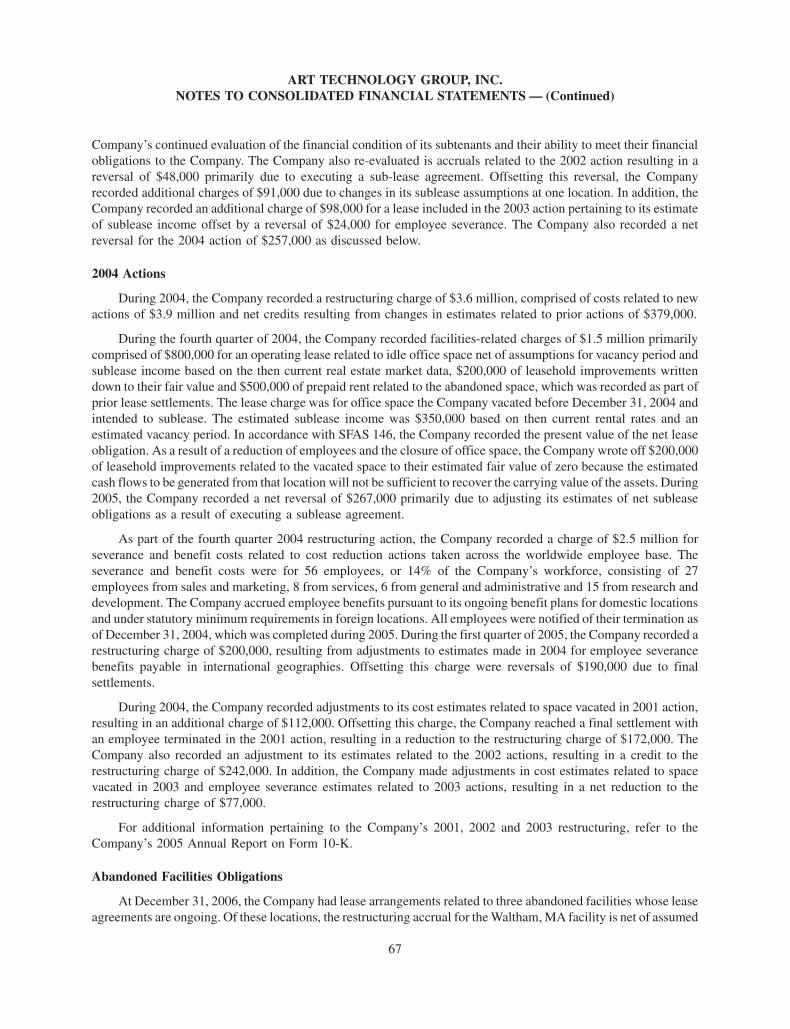
Company’s continued evaluation of the financial condition of its subtenants and their ability to meet their financialobligations to the Company. The Company also re-evaluated is accruals related to the 2002 action resulting in areversal of $48,000 primarily due to executing a sub-lease agreement. Offsetting this reversal, the Companyrecorded additional charges of $91,000 due to changes in its sublease assumptions at one location. In addition, theCompany recorded an additional charge of $98,000 for a lease included in the 2003 action pertaining to its estimateof sublease income offset by a reversal of $24,000 for employee severance. The Company also recorded a netreversal for the 2004 action of $257,000 as discussed below.
2004 Actions
During 2004, the Company recorded a restructuring charge of $3.6 million, comprised of costs related to newactions of $3.9 million and net credits resulting from changes in estimates related to prior actions of $379,000.
During the fourth quarter of 2004, the Company recorded facilities-related charges of $1.5 million primarilycomprised of $800,000 for an operating lease related to idle office space net of assumptions for vacancy period andsublease income based on the then current real estate market data, $200,000 of leasehold improvements writtendown to their fair value and $500,000 of prepaid rent related to the abandoned space, which was recorded as part ofprior lease settlements. The lease charge was for office space the Company vacated before December 31, 2004 andintended to sublease. The estimated sublease income was $350,000 based on then current rental rates and anestimated vacancy period. In accordance with SFAS 146, the Company recorded the present value of the net leaseobligation. As a result of a reduction of employees and the closure of office space, the Company wrote off $200,000of leasehold improvements related to the vacated space to their estimated fair value of zero because the estimatedcash flows to be generated from that location will not be sufficient to recover the carrying value of the assets. During2005, the Company recorded a net reversal of $267,000 primarily due to adjusting its estimates of net subleaseobligations as a result of executing a sublease agreement.
As part of the fourth quarter 2004 restructuring action, the Company recorded a charge of $2.5 million forseverance and benefit costs related to cost reduction actions taken across the worldwide employee base. Theseverance and benefit costs were for 56 employees, or 14% of the Company’s workforce, consisting of 27employees from sales and marketing, 8 from services, 6 from general and administrative and 15 from research anddevelopment. The Company accrued employee benefits pursuant to its ongoing benefit plans for domestic locationsand under statutory minimum requirements in foreign locations. All employees were notified of their termination asof December 31, 2004, which was completed during 2005. During the first quarter of 2005, the Company recorded arestructuring charge of $200,000, resulting from adjustments to estimates made in 2004 for employee severancebenefits payable in international geographies. Offsetting this charge were reversals of $190,000 due to finalsettlements.
During 2004, the Company recorded adjustments to its cost estimates related to space vacated in 2001 action,resulting in an additional charge of $112,000. Offsetting this charge, the Company reached a final settlement withan employee terminated in the 2001 action, resulting in a reduction to the restructuring charge of $172,000. TheCompany also recorded an adjustment to its estimates related to the 2002 actions, resulting in a credit to therestructuring charge of $242,000. In addition, the Company made adjustments in cost estimates related to spacevacated in 2003 and employee severance estimates related to 2003 actions, resulting in a net reduction to therestructuring charge of $77,000.
For additional information pertaining to the Company’s 2001, 2002 and 2003 restructuring, refer to theCompany’s 2005 Annual Report on Form 10-K.
Abandoned Facilities Obligations
At December 31, 2006, the Company had lease arrangements related to three abandoned facilities whose leaseagreements are ongoing. Of these locations, the restructuring accrual for the Waltham, MA facility is net of assumed
67
ART TECHNOLOGY GROUP, INC.NOTES TO CONSOLIDATED FINANCIAL STATEMENTS — (Continued)

sub-lease income, as a sub-lease agreement was in negotiations as of December 31, 2006, which was executed onMarch 9, 2007. The restructuring accrual for all other locations is net of the contractual amounts due under anexecuted sub-lease agreement. All locations for which the Company recorded restructuring charges have beenexited, and thus the Company’s plans with respect to these leases have been completed. A summary of theremaining facility locations and the timing of the remaining cash payments is as follows (in thousands):
2007 2008 2009 Total
Waltham, MA . . . . . . . . . . . . . . . . . . . . . . . . . . . . . . . . . . $ 1,384 $ 1,384 $ 346 $ 3,114
San Francisco, CA. . . . . . . . . . . . . . . . . . . . . . . . . . . . . . . 515 — — 515
Reading, UK . . . . . . . . . . . . . . . . . . . . . . . . . . . . . . . . . . . 483 483 81 1,047
Facility obligations, gross . . . . . . . . . . . . . . . . . . . . . . . . . 2,382 1,867 427 4,676
Contracted and assumed sublet income. . . . . . . . . . . . . . . . (1,153) (1,051) (193) (2,397)
Net cash obligations . . . . . . . . . . . . . . . . . . . . . . . . . . . . . $ 1,229 $ 816 $ 234 $ 2,279
(12) Litigation
As previously disclosed, in 2001, the Company was named as a defendant in seven purported class action suitsthat were consolidated into one action in the United States District Court for the District of Massachusetts under thecaption In re Art Technology Group, Inc. Securities Litigation. The case alleges that the Company, and certain of itsformer officers, violated Sections 10(b) and 20(a) of the Securities Exchange Act of 1934 and SEC Rule 10b-5promulgated there under. In October 2006, the court ruled in the Company’s favor and dismissed the case onsummary judgment. The plaintiffs have appealed the decision. Management believes that none of the claims that theplaintiffs have asserted has merit, and the Company intends to continue to defend the action vigorously. While theCompany cannot predict with certainty the outcome of the litigation, the Company does not expect any materialadverse impact to our business, or the results of our operations, from this matter.
As previously disclosed, in December 2001, a purported class action complaint was filed against theCompany’s wholly owned subsidiary Primus Knowledge Solutions, Inc., two former officers of Primus and theunderwriters of Primus’ 1999 initial public offering. The complaints are similar and allege violations of theSecurities Act of 1933, as amended, and the Securities Exchange Act of 1934 primarily based on the allegation thatthe underwriters received undisclosed compensation in connection with Primus’ initial public offering. Thelitigation has been consolidated in the United States District Court for the Southern District of New York (“SDNY”)with claims against approximately 300 other companies that had initial public offerings during the same generaltime period. On February 15, 2005, the court issued an opinion and order granting preliminary approval of asettlement, subject to certain non-material modifications. The court held a settlement fairness meeting on April 24,2006 following which it took under advisement the motion for final approval of the settlement. In December 2006,the Court of Appeals for the Second Circuit ruled that the certification of this proceeding as a class action wasinvalid and remanded the case to the SDNY. The class plaintiffs have requested the Second Circuit to reconsider. Ifthe settlement is not approved, we believe we have meritorious defenses and intend to defend the case vigorously.While we cannot predict the outcome of the litigation or appeal, we do not expect any material adverse impact to ourbusiness, or the results of our operations, from this matter.
The Company is also subject to various other claims and legal actions arising in the ordinary course ofbusiness. In the opinion of management, the ultimate disposition of these matters is not expected to have a materialeffect on the Company’s business, financial condition or results of operations.
68
ART TECHNOLOGY GROUP, INC.NOTES TO CONSOLIDATED FINANCIAL STATEMENTS — (Continued)
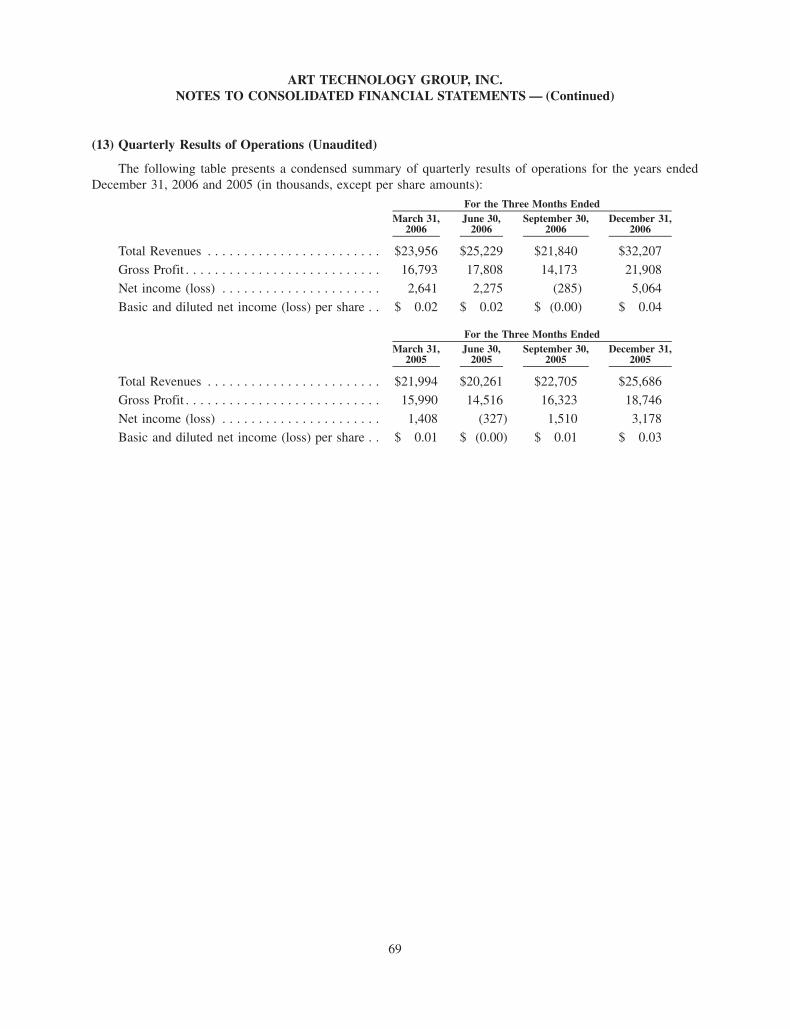
(13) Quarterly Results of Operations (Unaudited)
The following table presents a condensed summary of quarterly results of operations for the years endedDecember 31, 2006 and 2005 (in thousands, except per share amounts):
March 31,2006
June 30,2006
September 30,2006
December 31,2006
For the Three Months Ended
Total Revenues . . . . . . . . . . . . . . . . . . . . . . . . $23,956 $25,229 $21,840 $32,207
Gross Profit . . . . . . . . . . . . . . . . . . . . . . . . . . . 16,793 17,808 14,173 21,908
Net income (loss) . . . . . . . . . . . . . . . . . . . . . . 2,641 2,275 (285) 5,064
Basic and diluted net income (loss) per share . . $ 0.02 $ 0.02 $ (0.00) $ 0.04
March 31,2005
June 30,2005
September 30,2005
December 31,2005
For the Three Months Ended
Total Revenues . . . . . . . . . . . . . . . . . . . . . . . . $21,994 $20,261 $22,705 $25,686
Gross Profit . . . . . . . . . . . . . . . . . . . . . . . . . . . 15,990 14,516 16,323 18,746
Net income (loss) . . . . . . . . . . . . . . . . . . . . . . 1,408 (327) 1,510 3,178
Basic and diluted net income (loss) per share . . $ 0.01 $ (0.00) $ 0.01 $ 0.03
69
ART TECHNOLOGY GROUP, INC.NOTES TO CONSOLIDATED FINANCIAL STATEMENTS — (Continued)
Item 9. Changes in and Disagreements with Accountants on Accounting and Financial Disclosure
None.
Item 9A. Controls and Procedures
1. Management’s Report on Disclosure Controls and Procedures
Our management, with the participation of our chief executive officer and chief financial officer, evaluated theeffectiveness of our disclosure controls and procedures (as defined in Rules 13a-15(e) and 15d-15(e) under theExchange Act) as of December 31, 2006. Disclosure controls and procedures means controls and other proceduresthat are designed to ensure that information required to be disclosed by us in the reports that we file or submit underthe Exchange Act is (a) recorded, processed, summarized and reported, within the time periods specified in theCommission’s rules and forms and (b) accumulated and communicated to our management, including our principalexecutive and principal financial officers, or persons performing similar functions, as appropriate to allow timelydecisions regarding required disclosure.
Based on the evaluation of our disclosure controls and procedures as of December 31, 2006, our ChiefExecutive Officer and Chief Financial Officer concluded that, as of such date, our disclosure controls andprocedures were ineffective, due to the material weaknesses in our internal control over financial reportingdescribed below.
2. Management’s Annual Report on Internal Control over Financial Reporting.
Our management is responsible for establishing and maintaining adequate internal control over financialreporting, as such term is defined in Exchange Act Rules 13a-15(f) and 15d-15(f). Under the supervision and withthe participation of our management, including our Chief Executive Officer and Chief Financial Officer, weconducted an evaluation of the effectiveness of our internal control over financial reporting as of December 31,2006 based on the guidelines established in Internal Control — Integrated Framework issued by the Committee ofSponsoring Organizations of the Treadway Commission. (COSO).
Because of its inherent limitations, internal control over financial reporting cannot provide absolute assuranceof achieving financial reporting objectives. Internal control over financial reporting is a process that involves humandiligence and compliance and is subject to lapses in judgment and breakdowns resulting from human failures.Internal control over financial reporting also can be circumvented by collision or improper management override.Because of such limitations, there is a risk that material misstatements may not be prevented or detected on a timelybasis by internal control over financial reporting. Also, projections of any evaluation of effectiveness to futureperiods are subject to the risk that controls may become inadequate because of changes in conditions or that thedegree of compliance with established policies or procedures may deteriorate.
Our management’s assessment of and conclusions on the effectiveness of our internal control over financialreporting did not include the internal controls of eStara, Inc., which we acquired in October 2006. eStara’s assetsand liabilities and the results of its operations from the date of acquisition are included in our consolidated financialstatements at and for the year ended December 31, 2006. eStara’s assets constituted 36.0% of our total assets atDecember 31, 2006, and revenue attributable to eStara accounted for 4.5% of our revenue for the year then ended.
A material weakness is a control deficiency, or a combination of control deficiencies, that results in more than aremote likelihood that a material misstatement of the annual or interim financial statements will not be prevented ordetected. As a result of our management’s assessment of the effectiveness of internal control over financialreporting, we have identified the following material weaknesses that existed as of December 31, 2006:
1. Inadequate and ineffective controls over the financial statement close process.
In conjunction with the year-end financial close, our procedures and controls to ensure that accurate financialstatements in accordance with generally accepted accounting principles could be prepared and reviewed on timelybasis were not operating effectively. Such ineffective procedures and controls include (a) ineffective review ofhistorical cumulative translation adjustment balances relative to the timing of substantial liquidation of foreign
70
locations, which resulted in a restatement of our 2002 and 2003 financial statements; (b) inadequate processes toaccount for transactions and accounts, such as business combinations, commissions, restructuring accruals andcumulative translation adjustments; and (c) insufficient documentation of accounting policies and procedures andretention of historical accounting portions. As a result of the above deficiencies, material and less significant post-closing adjustments were identified by our independent registered public accounting firm, Ernst & Young LLP, andrecorded in our financial statements as of and for the year ended December 31, 2006. These adjustments affected thefollowing financial statement account line items: current liabilities, cumulative translation adjustment, stockhold-ers’ equity, operating expenses and foreign currency exchange gain. This weakness could continue to affect thebalances in the accounts previously mentioned and affect our ability to timely close our books and review andanalyze our financial statements.
2. Inadequate staffing within the accounting organization.
During 2006, there were numerous changes in our accounting personnel. This has led to our not having a sufficientnumber of experienced personnel in the accounting organization to provide reasonable assurance that transactions arebeing recorded as necessary to ensure timely preparation of financial statements in accordance with generally acceptedaccounting principles, including the preparation of our Annual Report on Form 10-K. We consider this weakness to be amaterial weakness in the operation of entity-level controls and operation level controls. The ineffectiveness of suchcontrols can result in misstatement to assets, liabilities, revenues, and expenses.
Our management concluded that, due to the material weaknesses described above, we did not maintaineffective internal control over financial reporting as of December 31, 2006.
Our independent registered public accounting firm, Ernst & Young LLP, has issued a report on our assessmentof our internal control over financial reporting. This report appears on the next page.
3. Remedial actions
In an effort to remediate the identified deficiencies, we have commenced, and are continuing to implement, anumber of changes to our internal control over financial reporting. These following changes will be made before theend of 2007:
• We are enhancing our existing policies and procedures for accounting review of month-end close, accountreconciliation processes, journal entries, write-offs, restructuring-related entries, purchase accounting-related entries, and impairment reviews; and
• We have taken steps to reduce the complexity of our consolidation processes.
Additionally, in response to the identified deficiencies, we intend to implement additional remedial measures,including but not limited to the following:
• Hiring key leadership accounting personnel to focus on our technical accounting issues and managing themonthly close process and the SEC reporting process; and
• Improving our documentation and training related to policies and procedures for the controls related to oursignificant accounts and processes.
4. Changes in internal control over financial reporting.
Except as described above, during its assessment of our internal control over financial reporting our managementidentified no change in our internal control over financial reporting that occurred during the fourth quarter of 2006 thathas materially affected, or is reasonably likely to affect, our internal control over financial reporting.
71

Report of Independent Registered Public Accounting Firm
The Board of Directors and StockholdersArt Technology Group, Inc.
We have audited management’s assessment, included in the accompanying Management’s Annual Report onInternal Control Over Financial Reporting, that Art Technology Group, Inc. did not maintain effective internalcontrol over financial reporting as of December 31, 2006, because of the effect of the two material weaknessesidentified in management’s assessment, based on criteria established in Internal Control — Integrated Frameworkissued by the Committee of Sponsoring Organizations of the Treadway Commission (the COSO criteria). ArtTechnology Group, Inc.’s management is responsible for maintaining effective internal control over financialreporting and for its assessment of the effectiveness of internal control over financial reporting. Our responsibility isto express an opinion on management’s assessment and an opinion on the effectiveness of the company’s internalcontrol over financial reporting based on our audit.
We conducted our audit in accordance with the standards of the Public Company Accounting Oversight Board(United States). Those standards require that we plan and perform the audit to obtain reasonable assurance aboutwhether effective internal control over financial reporting was maintained in all material respects. Our auditincluded obtaining an understanding of internal control over financial reporting, evaluating management’sassessment, testing and evaluating the design and operating effectiveness of internal control, and performingsuch other procedures as we considered necessary in the circumstances. We believe that our audit provides areasonable basis for our opinion.
A company’s internal control over financial reporting is a process designed to provide reasonable assuranceregarding the reliability of financial reporting and the preparation of financial statements for external purposes inaccordance with generally accepted accounting principles. A company’s internal control over financial reportingincludes those policies and procedures that (1) pertain to the maintenance of records that, in reasonable detail,accurately and fairly reflect the transactions and dispositions of the assets of the company; (2) provide reasonableassurance that transactions are recorded as necessary to permit preparation of financial statements in accordancewith generally accepted accounting principles, and that receipts and expenditures of the company are being madeonly in accordance with authorizations of management and directors of the company; and (3) provide reasonableassurance regarding prevention or timely detection of unauthorized acquisition, use, or disposition of the company’sassets that could have a material effect on the financial statements.
Because of its inherent limitations, internal control over financial reporting may not prevent or detectmisstatements. Also, projections of any evaluation of effectiveness to future periods are subject to the risk thatcontrols may become inadequate because of changes in conditions, or that the degree of compliance with thepolicies or procedures may deteriorate.
As indicated in the accompanying Management’s Annual Report on Internal Control Over FinancialReporting, management’s assessment of and conclusion on the effectiveness of internal control over financialreporting did not include the internal controls of eStara, Inc., which is included in the 2006 consolidated financialstatements of Art Technology Group, Inc. and constituted 36% of total assets at December 31, 2006 and 4.5% ofrevenues for the year then ended. Our audit of internal control over financial reporting of Art Technology Group,Inc. also did not include an evaluation of the internal control over financial reporting of eStara, Inc.
A material weakness is a control deficiency, or combination of control deficiencies, that results in more than aremote likelihood that a material misstatement of the annual or interim financial statements will not be prevented ordetected. The following material weaknesses have been identified and included in management’s assessment.
1. Inadequate and ineffective controls over the financial statement close process.
In connection with the year end financial statement close, the Company’s procedures and controls to ensurethat accurate financial statements in accordance with generally accepted accounting principles could be preparedand reviewed on timely basis were not operating effectively. Such ineffective procedures and controls include(a) ineffective review of historical cumulative translation adjustment balances relative to the timing of substantially
72
liquidating foreign locations, which resulted in a restatement of the 2002 and 2003 financial statements; (b) inad-equate processes to account for certain transactions and accounts such as business combinations, commissions,restructuring accruals, and cumulative translation adjustments; and (c) insufficient documentation of accountingpolicies and procedures and retention of historical accounting positions. As a result of the above, material and lesssignificant post-closing adjustments were identified by us and recorded in the Company’s financial statements as ofand for the year ended December 31, 2006. These adjustments impacted the following financial statement accountline items: current liabilities, cumulative translation adjustment, stockholders’ equity, operating expenses andforeign currency exchange gain. Such weakness could continue to impact the balances in all of the accountspreviously mentioned and affect the Company’s ability to timely close its books and review and analyze its financialstatements.
2. Inadequate staffing within the accounting organization.
During 2006, there were numerous changes in accounting personnel. This has led to the Company not having asufficient number of experienced personnel in the accounting organization to provide reasonable assurance thattransactions are being recorded as necessary to ensure timely preparation of financial statements in accordance withgenerally accepted accounting principles, including preparation of the Form 10-K. This weakness is considered tobe a material weakness in the operation of entity-level controls and operation level controls and the ineffectivenessof such controls can result in misstatements to assets, liabilities, revenues, and expenses.
These material weaknesses were considered in determining the nature, timing, and extent of audit tests appliedin our audit of the 2006 financial statements, and this report does not affect our report dated March 14, 2007 on thosefinancial statements.
In our opinion, management’s assessment that Art Technology Group, Inc. did not maintain effective internalcontrol over financial reporting as of December 31, 2006, is fairly stated, in all material respects, based on theCOSO criteria. Also, in our opinion, because of the effect of the material weaknesses described above on theachievement of the objectives of the control criteria, Art Technology Group, Inc. has not maintained effectiveinternal control over financial reporting as of December 31, 2006, based on the COSO criteria.
/s/ ERNST & YOUNG LLP
Boston, MassachusettsMarch 14, 2007
Item 9B. Other information
Not applicable
PART III
Item 10. Directors, Executive Officers and Corporate Governance
The information required under this Item is incorporated herein by reference to our definitive proxy statementpursuant to Regulation 14A, with respect to our annual meeting of stockholders to be held on May 17, 2007, to befiled with the Securities and Exchange Commission (SEC) not later than April 30, 2007 (the “Definitive ProxyStatement” under the headings “Election of Class II Directors,” “Background Information About Directors
73
Continuing in Office.” “Information About Executive Officers,” “Compliance with Section 16(a) of The ExchangeAct” and “Corporate Governance.”
We have adopted a Code of Business Conduct and Ethics that applies to all of our directors, officers andemployees, including our principal executive officer and principal financial officer. The Code of Business Conductand Ethics is posted on our website at http://www.atg.com/ under the caption About ATG/ Legal Information/Codeof Conduct.
We intend to satisfy the disclosure requirement under Item 10 of Form 8-K regarding an amendment to, orwaiver from, a provision of this Code of Business Conduct and Ethics by posting such information on our website, atthe address and location specified above and, to the extent required by the listing standards of The NASDAQ StockMarket, by filing a Current Report on Form 8-K with the SEC, disclosing such information.
Item 11. Executive Compensation
The information required under this Item is incorporated herein by reference to our Definitive Proxy Statementunder the headings “Executive Compensation,” “Director Compensation,” “Compensation Committee Interlocksand Insider Participation,” “Compensation Committee Report,” and “Information About Stock Ownership andPerformance — Stock Performance Graph.”
Item 12. Security Ownership of Certain Beneficial Owners and Management and Related StockholderMatters
The information required under this Item is incorporated herein by reference to our Definitive Proxy Statementunder the headings “Information About Stock Ownership” and “Securities Authorized for Issuance under EquityCompensation Plans.”
Item 13. Certain Relationships and Related Transactions, and Director Independence
The information, if any, required under this Item is incorporated herein by reference to our Definitive ProxyStatement under the headings “Related Party Transactions” and “Corporate Governance.”
Item 14. Principal Accountant Fees and Services
The information required under this Item is incorporated herein by reference to our Definitive Proxy Statementunder the caption “Principal Accountant Fees and Services.”
74
PART IV
Item 15. Exhibits and Financial Statement Schedules
(a) (1) Financial Statements
The following are included in Item 8:
• Report of Independent Registered Public Accounting Firm
• Consolidated Balance Sheets as of December 31, 2006 and 2005
• Consolidated Statements of Operations for the years ended December 31, 2006, 2005 and 2004
• Consolidated Statements of Stockholders’ Equity and Comprehensive Income (Loss) for the years endedDecember 31, 2006, 2005 and 2004
• Consolidated Statements of Cash Flows for the years ended December 31, 2006, 2005 and 2004
• Notes to Consolidated Financial Statements
(a) (2) Financial Statement Schedule
Schedule II for Valuation and Qualifying Accounts is contained in Item 8 in the Notes to the ConsolidatedFinancial Statements. All other schedules have been omitted since the required information is not present, or notpresent in amounts sufficient to require submission of the schedule or because information required is included inthe consolidated financial statements or the notes thereto.
(a) (3) Exhibits
We are filing as part of this Report the Exhibits listed in the Exhibit Index following the signature page to thisReport.
75
SIGNATURES
Pursuant to the requirements of Section 13 or 15(d) of the Securities Exchange Act of 1934, the registrant hasduly caused this report to be signed on its behalf by the undersigned, thereunto duly authorized, as of March 16, 2007.
ART TECHNOLOGY GROUP, INC.(Registrant)
By: /s/ ROBERT D. BURKE
Robert D. BurkeChief Executive Officer
and President
Pursuant to the requirements of the Securities Exchange Act of 1934, this report has been signed below by thefollowing persons on behalf of the registrant and in the capacities as of March 16, 2007.
Name Title
/s/ ROBERT D. BURKE
Robert D. Burke
Chief Executive Officer and President(Principal Executive Officer)
/s/ JULIE M.B. BRADLEY
Julie M.B. Bradley
Senior Vice President and Chief Financial Officer(Principal Financial and Accounting Officer)
/s/ DANIEL C. REGIS
Daniel C. Regis
Chairman of the Board
/s/ JOHN R. HELD
John R. Held
Director
/s/ ILENE H. LANG
Ilene H. Lang
Director
/s/ MARY E. MAKELA
Mary E. Makela
Director
/s/ MICHAEL A. BROCHUMichael A. Brochu
Director
/s/ DAVID B. ELSBREE
David B. Elsbree
Director
/s/ PHYLLIS S. SWERSKY
Phyllis S. Swersky
Director
76
EXHIBIT INDEX
ExhibitNo. Description
Filed withThisForm10-K Form Filing Date
ExhibitNo.
Incorporated by Reference
2.1 Agreement and Plan of Merger dated as ofSeptember 18, 2006 among ATG, eStara, Inc.,Arlington Acquisition Corp., Storrow AcquisitionCorp., and the stockholder representative andprincipal stockholders of eStara named therein
8-K September 22, 2006 10.1
2.2 Amendment No. 1 to Agreement and Plan ofMerger dated as of October 2, 2006 among ATG,eStara, Inc. and the stockholder representativenamed therein
8-K October 6, 2006 2.2
3.1 Amended and Restated Certificate of Incorporation S-8 June 12, 2003 4.1
3.2 Amended and Restated By-Laws S-3 July 6, 2001 4.2
4.1 Rights Agreement dated September 26, 2001 withEquiServe Trust Company, N.A. (SECfile no. 000-26679)
8-K October 2, 2001 4.1
10.1* 1996 Stock Option Plan, as amended 10-Q November 8, 2005 10.4
10.2* 1999 Outside Director Stock Option Plan, asamended (including form of option agreement)
10-Q November 8, 2005 10.3
10.3* 1999 Employee Stock Purchase Plan DEF14A(proxy
statement)
April 10, 2006 Annex A
10.4 Primus 1999 Non-Officer Stock Option Plan 10-K March 16, 2005 10.4
10.5 Primus 1999 Stock Incentive Compensation Plan 10-K March 16, 2005 10.5
10.6* General Change-in-Control Policy for Employees 10-Q November 9, 2004 10.21
10.7* Amended and Restated Employment Agreementdated November 8, 2004 with Robert Burke
10-Q November 9, 2004 10.22
10.8* Offer letter with Julie M.B. Bradley dated July 6,2005
10-Q November 8, 2005 10.1
10.10* 2006 Executive Management Compensation Plan,as Amended
8-K June 19, 2006 99.1
10.11* Non-Employee Director Compensation Plan, asAmended
10-Q May 10, 2006 10.34
10.12 Lease agreement dated May 6, 2006 with RREEFAmerica REIT II Corp. PPP
10-Q May 10, 2006 10.33
10.13 Lease dated October 6, 1999 with Pine StreetInvestors I, LLC
10-K March 28, 2003 10.5
10.14 First Amendment to Lease dated December 30,1999 with Pine Street Investors I, LLC
10-K March 28, 2003 10.6
10.15 Second Amendment to Lease dated August 20,2000 with Pine Street Investors I, LLC
10-K March 28, 2003 10.7
10.16 Third Amendment to Lease dated December 22,2000 with Pine Street Investors I, LLC
10-K March 28, 2003 10.8
10.17 Fourth Amendment to Lease dated July 15, 2001with Pine Street Investors I, LLC
10-K March 15, 2004 10.10
10.18 Fifth Amendment to Lease dated March 31, 2003with Pine Street Investors I, LLC
10-K March 15, 2004 10.11
77
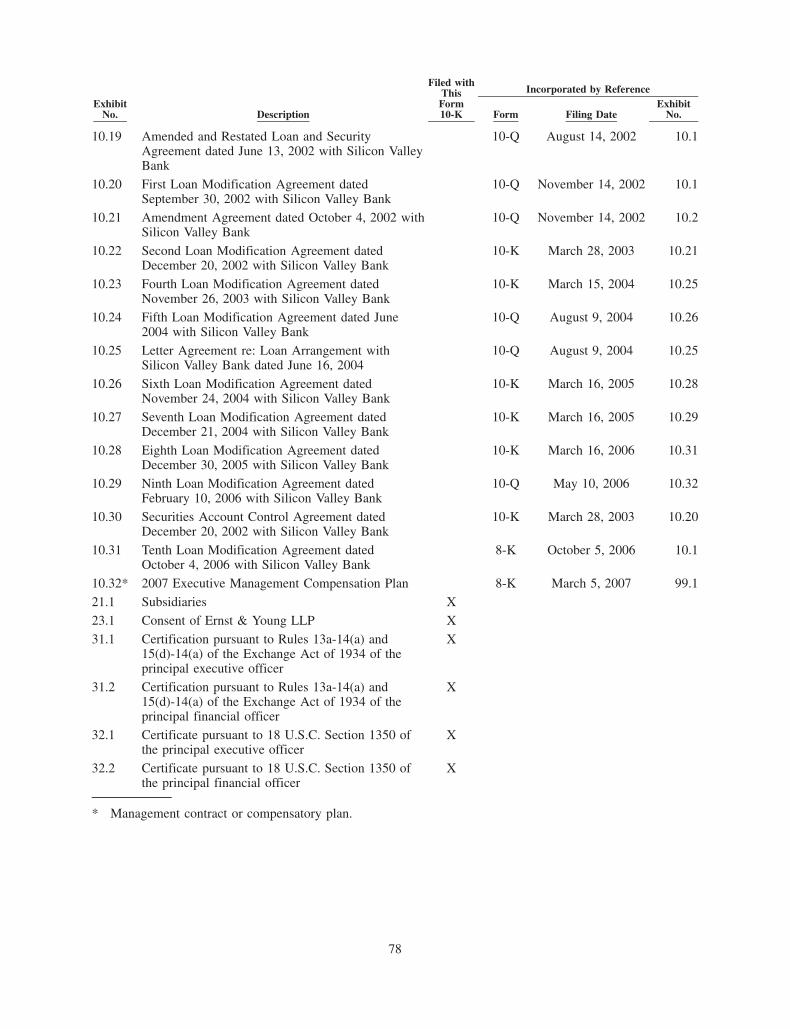
ExhibitNo. Description
Filed withThisForm10-K Form Filing Date
ExhibitNo.
Incorporated by Reference
10.19 Amended and Restated Loan and SecurityAgreement dated June 13, 2002 with Silicon ValleyBank
10-Q August 14, 2002 10.1
10.20 First Loan Modification Agreement datedSeptember 30, 2002 with Silicon Valley Bank
10-Q November 14, 2002 10.1
10.21 Amendment Agreement dated October 4, 2002 withSilicon Valley Bank
10-Q November 14, 2002 10.2
10.22 Second Loan Modification Agreement datedDecember 20, 2002 with Silicon Valley Bank
10-K March 28, 2003 10.21
10.23 Fourth Loan Modification Agreement datedNovember 26, 2003 with Silicon Valley Bank
10-K March 15, 2004 10.25
10.24 Fifth Loan Modification Agreement dated June2004 with Silicon Valley Bank
10-Q August 9, 2004 10.26
10.25 Letter Agreement re: Loan Arrangement withSilicon Valley Bank dated June 16, 2004
10-Q August 9, 2004 10.25
10.26 Sixth Loan Modification Agreement datedNovember 24, 2004 with Silicon Valley Bank
10-K March 16, 2005 10.28
10.27 Seventh Loan Modification Agreement datedDecember 21, 2004 with Silicon Valley Bank
10-K March 16, 2005 10.29
10.28 Eighth Loan Modification Agreement datedDecember 30, 2005 with Silicon Valley Bank
10-K March 16, 2006 10.31
10.29 Ninth Loan Modification Agreement datedFebruary 10, 2006 with Silicon Valley Bank
10-Q May 10, 2006 10.32
10.30 Securities Account Control Agreement datedDecember 20, 2002 with Silicon Valley Bank
10-K March 28, 2003 10.20
10.31 Tenth Loan Modification Agreement datedOctober 4, 2006 with Silicon Valley Bank
8-K October 5, 2006 10.1
10.32* 2007 Executive Management Compensation Plan 8-K March 5, 2007 99.1
21.1 Subsidiaries X
23.1 Consent of Ernst & Young LLP X
31.1 Certification pursuant to Rules 13a-14(a) and15(d)-14(a) of the Exchange Act of 1934 of theprincipal executive officer
X
31.2 Certification pursuant to Rules 13a-14(a) and15(d)-14(a) of the Exchange Act of 1934 of theprincipal financial officer
X
32.1 Certificate pursuant to 18 U.S.C. Section 1350 ofthe principal executive officer
X
32.2 Certificate pursuant to 18 U.S.C. Section 1350 ofthe principal financial officer
X
* Management contract or compensatory plan.
78
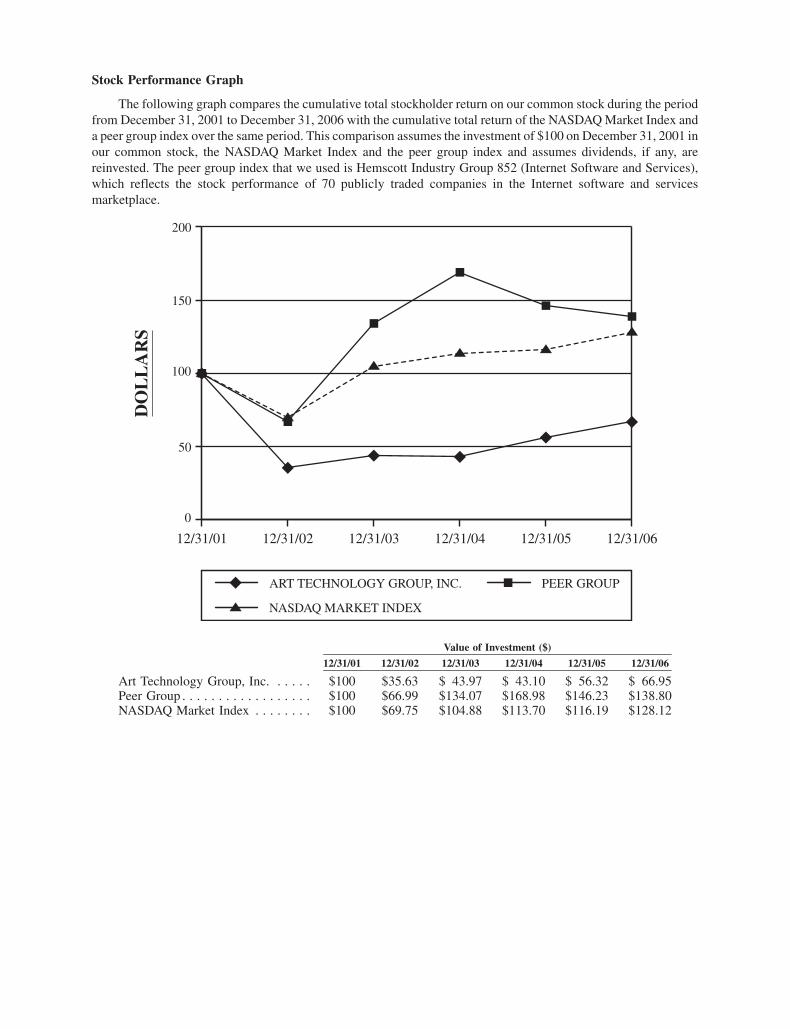
Stock Performance Graph
The following graph compares the cumulative total stockholder return on our common stock during the periodfrom December 31, 2001 to December 31, 2006 with the cumulative total return of the NASDAQ Market Index anda peer group index over the same period. This comparison assumes the investment of $100 on December 31, 2001 inour common stock, the NASDAQ Market Index and the peer group index and assumes dividends, if any, arereinvested. The peer group index that we used is Hemscott Industry Group 852 (Internet Software and Services),which reflects the stock performance of 70 publicly traded companies in the Internet software and servicesmarketplace.
0
50
100
150
200
12/31/0612/31/0512/31/0412/31/0312/31/0212/31/01
NASDAQ MARKET INDEX
PEER GROUPART TECHNOLOGY GROUP, INC.
DO
LL
AR
S
12/31/01 12/31/02 12/31/03 12/31/04 12/31/05 12/31/06
Value of Investment ($)
Art Technology Group, Inc. . . . . . $100 $35.63 $ 43.97 $ 43.10 $ 56.32 $ 66.95Peer Group . . . . . . . . . . . . . . . . . . $100 $66.99 $134.07 $168.98 $146.23 $138.80NASDAQ Market Index . . . . . . . . $100 $69.75 $104.88 $113.70 $116.19 $128.12

ATG BOARD OF DIRECTORS
Daniel C. RegisChairman of the BoardAudit Committee
Robert D. BurkePresident and Chief Executive Officer
David B. ElsbreeChairperson, Audit Committee
John R. HeldCompensation Committee; Nominating and Governance Committee
Ilene H. LangNominating and GovernanceCommittee
Mary E. MakelaChairperson, Compensation Committee;Audit Committee
Phyllis S. SwerskyChairperson, Nominating andGovernance Committee;Compensation Committee
Michael A. BrochuDirector
ATG MANAGEMENT TEAM
Robert D. BurkePresident, Chief Executive Officer,& Director
Julie M.B. BradleySenior Vice President, Chief FinancialOfficer,Secretary & Treasurer
Barry E. ClarkSenior Vice Presidentof Worldwide Sales
Clifford J. ConneightonSenior Vice President of Marketing
John FedermanGeneral Manager, eStara
Louis R. FrioSenior Vice President of Services
Patricia M. O'NeillSenior Vice Presidentof Human Resources
Kenneth Z. VolpeSenior Vice Presidentof Products and Technology
CORPORATE INFORMATION
Transfer Agent and RegistrarComputershare Investor ServicesP.O. Box 43078Providence, RI 02940-3078www.computershare.com
Annual MeetingMay 17, 2007Foley Hoag LLPSeaport World Trade Center West155 Seaport BoulevardBoston, Massachusetts 02210-2600
Corporate CounselFoley Hoag LLPSeaport World Trade Center West155 Seaport BoulevardBoston, Massachusetts 02210-2600www.foleyhoag.com
Independent AuditorErnst & Young LLP200 Clarendon StreetBoston, Massachusetts 02116www.ey.com
Stock Trading InformationNasdaq Global MarketSymbol: ARTG
Investor ContactFinancial results, corporate news, SEC filings and company information is available on ATG’sWeb site at : www.atg.com
For a free copy of ATG’s Annual Report to the SEC on Form 10-K, or further informationabout ATG, please mail, e-mail, or call:
ATTN: Investor RelationsArt Technology Group, Inc.One Main StreetCambridge, MA 02142

Worldwide Headquarters
Art Technology Group, Inc.
One Main Street
Cambridge, MA 02142 USA
Tel: +1 617 386 1000
Fax: +1 617 386 1111
© 2007 Art Technology Group, Inc.
ATG, Art Technology Group and the ATG logo are
registered trademarks of Art Technology Group.
All other trademarks are the property of their
respective holders. NASDAQ: ARTG
European Headquarters
Art Technology Group (Europe), Ltd.
Apex Plaza, Forbury Road
Reading RG1 1AX UK
Tel: +44 (0) 118 956 5000
Fax: +44 (0) 118 956 5001
www.atg.com
The Magic Quadrant is copyrighted 8 February, 2007 by Gartner, Inc. and is reused with permission. The Magic Quadrant is a graphical representation of a
marketplace at and for a specific time period. It depicts Gartner's analysis of how certain vendors measure against criteria for that marketplace, as defined by
Gartner. Gartner does not endorse any vendor, product or service depicted in the Magic Quadrant, and does not advise technology users to select only those
vendors placed in the "Leaders" quadrant. The Magic Quadrant is intended solely as a research tool, and is not meant to be a specific guide to action. Gartner
disclaims all warranties, express or implied, with respect to this research, including any warranties of merchantability or fitness for a particular purpose.