mindray medical international limited - iis windows...
TRANSCRIPT

Mindray Medical International Limited
Third Quarter 2007

1
Disclaimer
This material contains forward-looking statements with respect to the company's outlook regarding drivers, developments, and trends affecting its worldwide markets, opening of international offices, new product development and commercial launch dates, projected revenues, net income margins, earnings per share, revenue growth targets, net income growth targets, sales force and distributor targets, projections of the size of China's healthcare market, estimated government expenditures, research and development expenditure targets, the company's manufacturing development plan, and the anticipated results of its product development activities. These statements are based on information available at the time they are made and are subject to a number of risks and uncertainties. Actual results could differ materially from those anticipated by these forward-looking statements as a result of a number of factors, some of which may be beyond the company's control. Factors that affect the Company's business operations and product development, as well as a further list and description of risks and uncertainties associated with Mindray's business, are discussed in its reports filed with the Securities and Exchange Commission, including its most recent annual report on Form 20-F. Mindray disclaims any intention or obligation to update or revise any forward-looking statements, whether as a result of new information, future events or otherwise, except as required by law.

2
Mission and Vision
To improve the health and well-being of the world’s people by providing thehighest quality medical equipment and services at the most competitive prices
MISSION VISIONTo be a world-class medical equipment solutions provider by increasing accessibility to affordable quality health care while creating value for customers, employees, shareholders and society

3
Company Snapshot
Founded in 1991 in Shenzhen, China - 29 offices in China, 11 international offices
More than 3,700 employees worldwide
World-class R&D platform with largest R&D team in China and a research center in Seattle, USA
Leading market position in China29 sales and service offices in major cities throughout China850 sales and sales support staffOver 2,000 distributors including nearly 900 exclusive distributors
Established and rapidly growing presence abroadSales in more than 140 countriesMore than 1,200 international distributors
4
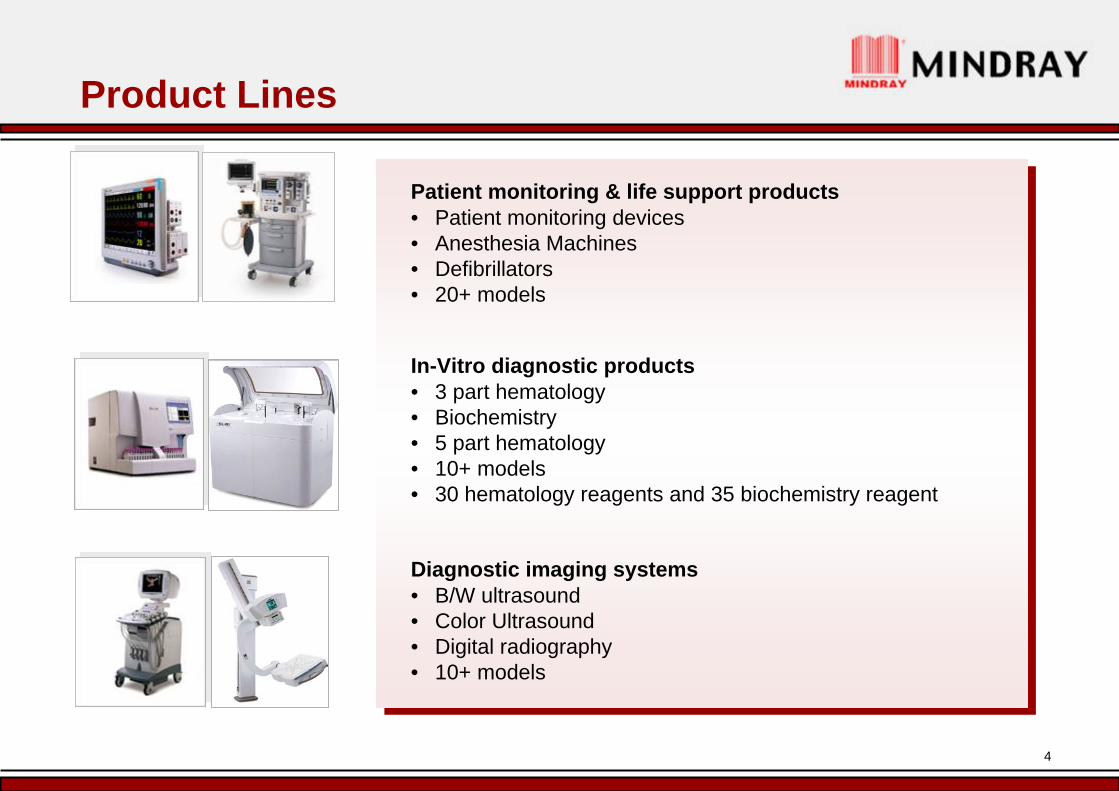
Product Lines
Diagnostic imaging systems• B/W ultrasound• Color Ultrasound• Digital radiography• 10+ models
In-Vitro diagnostic products• 3 part hematology• Biochemistry• 5 part hematology• 10+ models• 30 hematology reagents and 35 biochemistry reagent
Patient monitoring & life support products• Patient monitoring devices• Anesthesia Machines• Defibrillators• 20+ models
5
2335
89
13
5329.7%
27.5%
25.6%26.0%22.0%20
40
60
80
100
2003 2004 2005 2006 2007E0%
25%
50%
75%
100%
300
59
19489 138
54.6% 54.3% 54.3% 54.3%
04080
120160200240280
2003 2004 2005 2006 2007E0%
25%
50%
75%
100%
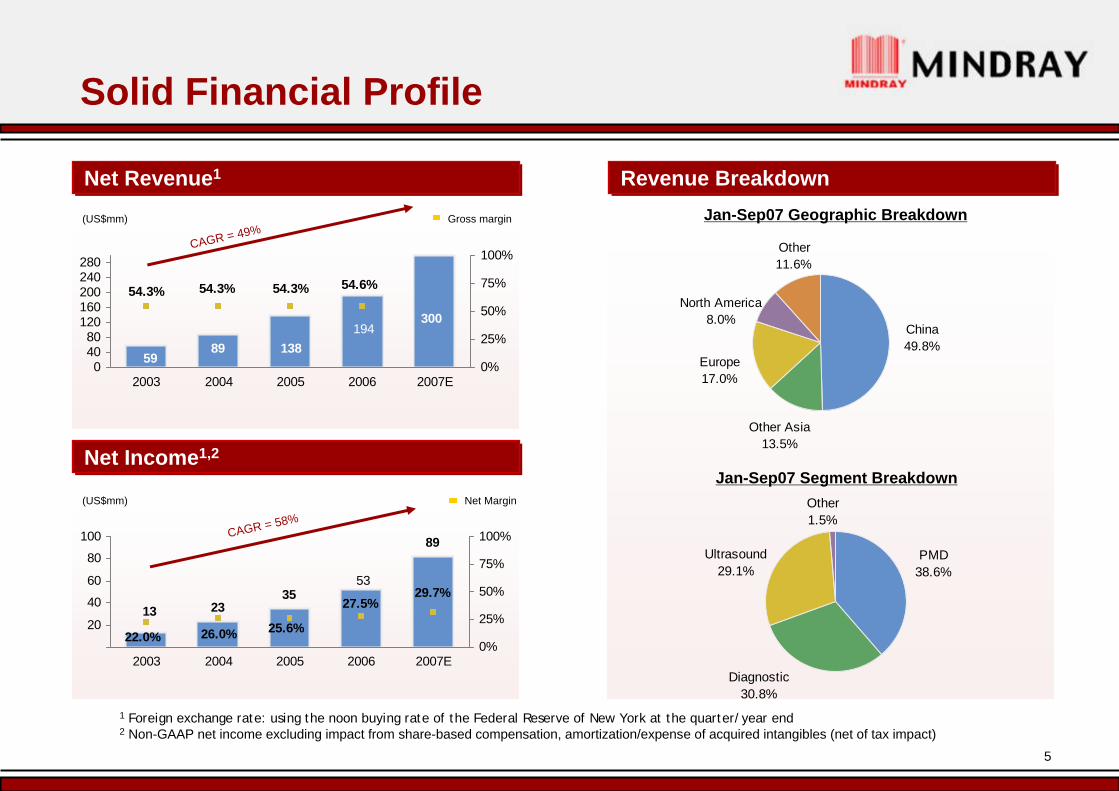
Solid Financial Profile
Revenue BreakdownRevenue BreakdownNet Revenue1Net Revenue1
Gross margin(US$mm)
Net Income1,2Net Income1,2
1 Foreign exchange rate: using the noon buying rate of the Federal Reserve of New York at the quarter/year end 2 Non-GAAP net income excluding impact from share-based compensation, amortization/expense of acquired intangibles (net of tax impact)
CAGR = 49%
(US$mm) Net Margin
CAGR = 58%
Diagnostic30.8%
PMD38.6%
Ultrasound29.1%
Other1.5%
North America8.0%
Europe17.0%
Other11.6%
China49.8%
Other Asia13.5%
Jan-Sep07 Geographic Breakdown
Jan-Sep07 Segment Breakdown

6
2007 Achievements
Achieved robust top- and bottom-line growthNet revenues in the range of RMB2,180 to 2,200 million, a 43.9% or 45.2% YoY growth
Net income in the range of RMB 640 to 660 million, a 53.6% or 58.3% YoY growth
Leveraged our leading market position in ChinaExpanded No. 1 market share position in existing product segments
No. 1 domestic player in 5-part hematology analyzers and color ultrasound imaging systems
Enhanced international presenceAchieved more than 50% growth rate (60%+ in constant dollar terms) in international markets
Opened six more international offices in 2007
Expanded current product offerings to broaden market reachLaunched seven new products
Entered into a new product segment – Digital Radiography
Maintained a disciplined cost focus

7
Leading Market Position in China
More than 80% of our sales are through distributorsMore than 80% of our sales are through distributors Competitive Price to Performance Ratio
Around 30% discount vs. international players20% premium vs. domestic players
Extensive Sales Network29 sales and sales support offices800+ sales and service staff2,000+ distributors (incl. over 800+ exclusive distributors
Sales Force ManagementLow employee turnover rate 200+ experienced sales employees
Strong Brand Recognition Brand loyalty – recognized domestic hospitals across ChinaHigh-quality products and customer support services
Competitive Price to Performance Ratio
Around 30% discount vs. international players20% premium vs. domestic players
Extensive Sales Network29 sales and sales support offices800+ sales and service staff2,000+ distributors (incl. over 800+ exclusive distributors
Sales Force ManagementLow employee turnover rate 200+ experienced sales employees
Strong Brand Recognition Brand loyalty – recognized domestic hospitals across ChinaHigh-quality products and customer support services
Urumchi
Shenyang
DalianBeijing
QingdaoJinan
Taiyuan
Zhengzhou
Xi’an
Lanzhou
ShanghaiNanjing
Hangzhou
Fuzhou
HefeiWuhan
NanchangChangsha
Guangzhou
Hong Kong
ShenzhenNanning
Chengdu
Chongqing
Kunming
Guiyang
Changchun
Shijiazhuang
8
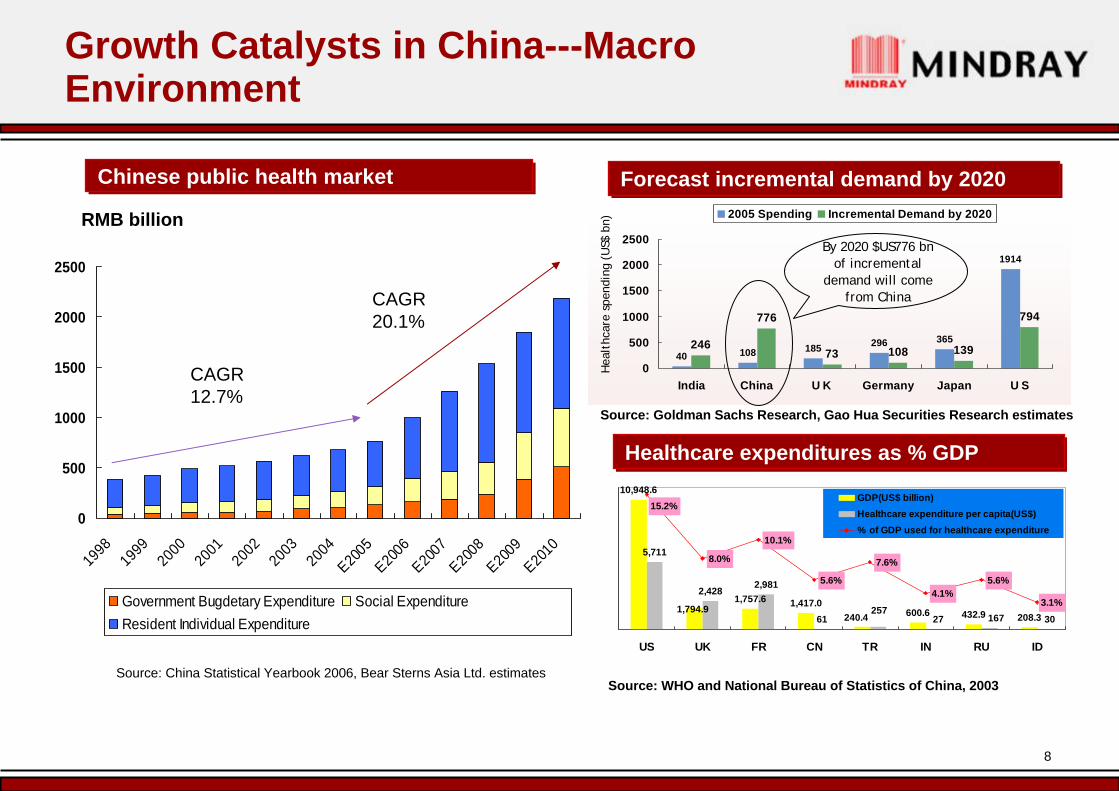
Forecast incremental demand by 2020 Forecast incremental demand by 2020 Chinese public health marketChinese public health market
Source: China Statistical Yearbook 2006, Bear Sterns Asia Ltd. estimates
Source: Goldman Sachs Research, Gao Hua Securities Research estimates
0
500
1000
1500
2000
2500
1998
1999
2000
2001
2002
2003
2004
E2005
E2006
E2007
E2008
E2009
E2010
Government Bugdetary Expenditure Social ExpenditureResident Individual Expenditure
RMB billion
CAGR 12.7%
CAGR 20.1%
40 108 185 296 365
1914
246
776
73 108 139
794
0
500
1000
1500
2000
2500
India China U K Germany Japan U S
2005 Spending Incremental Demand by 2020
Growth Catalysts in China---Macro Environment
Healthcare expenditures as % GDPHealthcare expenditures as % GDP10,948.6
1,757.6 1,417.0600.6 432.9 208.3
5,711
2,428 2,981
61 240.41,794.9
3016727257
8.0%
10.1%
5.6%
7.6%
4.1%5.6%
3.1%
15.2%
US UK FR CN TR IN RU ID
GDP(US$ billion)Healthcare expenditure per capita(US$)% of GDP used for healthcare expenditure
Source: WHO and National Bureau of Statistics of China, 2003
By 2020 $US776 bn of incremental
demand will come from China
Hea
lthc
are
spen
ding
(U
S$ b
n)

9
Gain market share in high-end markets Further penetrate high-end patient monitoring market with Beneview Series products
5-Part Hematology Analyzer – newly released, significant market potential
Target rural area hospitals and community clinicsDC3 Color Ultrasound
—First color ultrasound targeted rural hospitals—Strong government tender potential
BS-120: Replacement for semi-auto bio-chemistry analyzer
Introduce new products to penetrate new marketsAnesthesia Machine– new product segment, significant market potential
Digital Radiography
Biochemistry analyzers with speed of 400 tests per hour
Generate more recurring revenue from reagentsWide installation base of 3-part hematology analyzers
More biochemistry reagents launched into market
Enhance brand recognition Differentiate from domestic peers by branding
2008 Growth Strategy in China

10
Revenue Breakdown by RegionRevenue Breakdown by Region
2003 Total Revenues: RMB 460million
(US$56mm)
Jan-Sept / 2007Total Revenues:
RMB 1,557 million(US$208mm)
Other11.6%
NorthAmerica
8.0%
Europe17.0%
OtherAsia13.5%
China49.8%
2003 – 2006 CAGR2003 – 2006 CAGR
America
103.8% 87.3%50.5% 31.0% 48.8%
Other Asia Europe Other North China Total
Rapidly Expanding International Presence
Other3.1%
NorthAmerica
7.7%Europe6.7%
OtherAsia7.3%
China75.2%
112.9%

11
Growth Catalysts in International Markets
Aging Population (More Patients)
Developed Countries (North America, Western Europe and Japan)Cost-cutting healthcare reformDoctor/Nursing - staff shortagesExpansion in clinical application
Emerging Markets (BRICs, VISTA, Eastern Europe, Mexico)Increased disease awarenessBetter affordability
Expansion to other product areas such as DR and defibrillators

12
Strategy for International Expansion
AMERICA EUROPE ASIA-PACIFICAFRICA
Vancouver
Mexico City
Indonesia
Amsterdam
Moscow
Istanbul
Mumbai
SeattleBoston
Toronto
Sao Paulo
Global HQ in
Shenzhen
30 Offices in China
Current Offices
Opening Soon
London
France
Open more overseas offices
Localization
Expand and optimize distribution and service network
Enhance brand awareness

13
Patents
Authorized (in China): 212
Pending (in China): 484
Pending (in USA): 107
Others8.0%
Mechanic11.0%
System16.0%
Testing8.0%
Software33.0%
Hardware24.0%
PhD2.8%Others
7.4% Bachelor42.2%
Master47.6%
Total: 1,036 Engineers
Note: As of April 30, 2007
Degree Functionality
1.63.0
4.8
7.4
13.2
19.1
28.0
6.6%
8.1%8.6% 8.8%
9.8% 9.8%
10.6%
0.0
5.0
10.0
15.0
20.0
25.0
30.0
2001 2002 2003 2004 2005 2006 2007E0.0%
2.0%
4.0%
6.0%
8.0%
10.0%
12.0%
R&D InvestmentR&D Investment
Note: GAAP R&D investment as percentage of sales is 8.8% in 2004, 9.6% in 2005 and 9.4% in 2006
(US$mm) % of sales (%)
R&D Headcount R&D Headcount
R&D StructureR&D Structure PatentsPatents
Proven R&D Capabilities
Over 1,000 staffOver 1,000 staff
700 719
1036
154 188283
472
246189 207
288200 208
217
145 155
258
150 149
2001 2002 2003 2004 2005 2006 2007
R&D Team Size
PMDDiagnostic
Ultrasound
Others

14
3-part Hematology
Patient Monitoring
Devices
Anesthesia Machines
Addr
essa
ble
Mar
ket
New Product Pipeline
Patient Monitoring & Life Support ProductsPatient Monitoring & Life Support Products
In-Vitro Diagnostic ProductsIn-Vitro Diagnostic Products Diagnostic Imaging SystemsDiagnostic Imaging Systems
Time
Immunoassay
Addr
essa
ble
Mar
ket
3-Part Hematology
5-Part Hematology
Biochemistry
Addr
essa
ble
Mar
ket
B/W Ultrasound
Digital Radiography
Time
Other Imaging Products
Color Ultrasound
Defibrillator & Surgical beds and lights
iPM Monitor(4Q, 2008)
Time
Defibrillator(4Q 2008)
BC-5300/5380 5-PartHematology Analyzer(1Q, 2008)
BS-380 Biochemistry Analyzer(4Q 2008)
6 Reagents(1Q 2008)
DC-3 Ultrasound (1Q 2008)
DC-7 Ultrasound (4Q 2008)
DR-50 Digital Radiography(2Q 2008)
DR-51(4Q 2008)
New Products in 2008

15
54.3% 54.3%54.7%
54.3%
56.7%
55.0%
52%
53%
54%
55%
56%
57%
58%
2003
2004
2005
2006
1-9/20
06
1-9/20
07
* Non- GAAP
Maintain Sustainable Cost Advantage
Maintain a consistent gross margin of 54~56% during the past 4 years
R&D lowers costs and pushes products up the value chain
R&D working together with manufacturing to deliver competitive cost advantage
Further increase our operational efficiencies as we build economies of scale
Consolidated Gross Margin * (%)Consolidated Gross Margin * (%)

16
Summary
Mindray’s mission to provide high-quality medical devices at affordable prices has proven to deliver high-growth in both developed and developing markets
Pragmatic positioning in each market and segment optimizes earnings by striking a balance between profit and market share
World-class R&D capabilities and operational efficiency ensures quality consistency, pricing competitiveness and abundant cash flow
Diversified product portfolio and geographic distribution reduces earnings fluctuations and maximizes exposure to growth opportunities across segments and geographies

17
Thank you!
Q&A

18
Emperor4.5%
Landwind3.3%
Zhonghui6.2%
Well2.7%
Toshiba5.3%Hitachi
1.9%
Teknova3.5%
Other4.8%
Aloka9.0%
Siemens4.5%
Medison2.3%
GE14.3%
SIUI5.6%Chinson
4.0%
Mindray28.1%
Procan2.1%
Other Imported8.6%
NK3.9%
Other Domestic5.6%
Biote3.4%
Sysmex14.2%
Tecom11.2%
Botest5.6%
Perlong3.0%
Mindray42.4%
Transasia3.0%
Toshiba8.2%
Hitachi16.0%
Glamour3%
Other15.3%
Sinnowa1.7%
Olympus11.3%
Beckman5.4%
Vitalab3.2%
Sysmex4.1%
Mindray28.4%
And Leading Market Positions in China
Other Domestic5.9%SH Likang
3.2%
Philips18.1%
GE13.5%
Goldway3.3%BLT
1.6%
Gotom2.7%
Other Imported2.9%
Drager3.7%
Spacelabs2.0%
NK3.5%
Mindray39.9%
RMB 1,025mm
RMB 465mm
Patient Monitor DevicesPatient Monitor Devices
3-Part Hematology Analyzer3-Part Hematology Analyzer
200~400 T/H Biochemistry Analyzer200~400 T/H Biochemistry Analyzer
RMB 590mm
Source: Company Estimates
RMB: 693mm
B/W UltrasoundB/W Ultrasound

19
Other2.5%
Tearson1.0%
Neusoft1.7%
Aloka9.1%
Esaote5.9%
SonoScape1.4%
Medison4.3% Hitachi
4.0%
Toshiba5.4%
Philips20.3%
Siemens10.4%
Mindray4.7%Sysmex
33.9%
Other5.0%
NK8.9%
Bayer3.7%
Abbott8.6%
ABX7.6%
Coulter18.3%
Mindray14.0%
New Growth Areas in China
百思8.8%
航天长峰6.4%
Other4.3%
江苏凯泰5.7% 晨伟
2.8%无锡中原5.7%
Drager21.3%
谊安18.2%
GE22.8%
Mindray4.0%
RMB 301mm
5-Part Hematology Analyzer5-Part Hematology Analyzer
Source: Company Estimates
RMB 2,560mm
Color UltrasoundColor Ultrasound
RMB 703mm
Anesthesia MachineAnesthesia Machine
GE29.7%
Biochemistry AnalyzerBiochemistry Analyzer
Toshiba6.9%
Roche6.5%
Other19.0%
Abbott3.3%
Sysmex2.1%
Sinnowa4.3%
Olympus14.5%
Beckman10.9%
Hitachi17.7%
Mindray14.8%
RMB 1,078mm
20
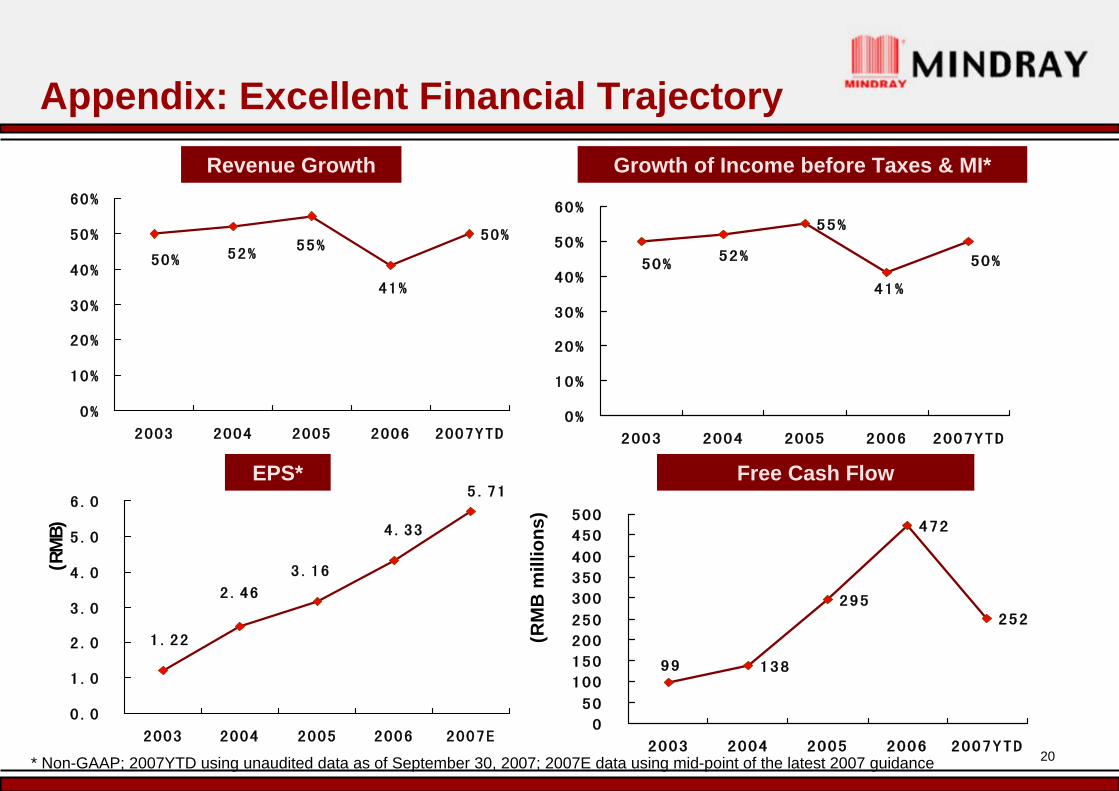
Appendix: Excellent Financial Trajectory
50%
41%
55%52%50%
0%
10%
20%
30%
40%
50%
60%
2003 2004 2005 2006 2007YTD
Revenue Growth
55%
50%
41%
52%50%
0%
10%
20%
30%
40%
50%
60%
2003 2004 2005 2006 2007YTD
Growth of Income before Taxes & MI*
1.22
2.46
3.16
5.71
4.33
0.0
1.0
2.0
3.0
4.0
5.0
6.0
2003 2004 2005 2006 2007E
EPS*
138
295
472
252
99
0
50
100
150
200
250
300
350
400
450
500
2003 2004 2005 2006 2007YTD
Free Cash Flow
(RM
B)
(RM
B m
illio
ns)
* Non-GAAP; 2007YTD using unaudited data as of September 30, 2007; 2007E data using mid-point of the latest 2007 guidance

21
Prudent Working Capital Management
222119
17
0
5
10
15
20
25
2004 2005 2006 3Q07
Accounts Receivable
64
6071
87
0
10
20
30
40
50
60
70
80
90
100
2004 2005 2006 3Q07
Inventory Days
57
38
3527
0
10
20
30
40
50
60
2004 2005 2006 3Q07
Accounts Payable
166
363
545
418
0
100
200
300
400
500
600
700
2004 2005 2006 2007YTD
Operating Cash Flow
(Day
s)
(Day
s)(D
ays)
(RM
B m
m)

22
Financials -- 3Q2007 Results Highlights
1 Non-GAAP figures excluding impact from share-based compensation expenses and amortization of intangibles
5964Inventory Days
Y/Y (%)Q/Q (%)3Q06(RMB)
2Q07(RMB)
3Q07(RMB) ( US$)(in millions)
100106201361
5757A/P Days
2122A/R Days2,3893422,562Total Shareholder’s Equity
44855413Total Liabilities19827199Inventories15619145Account Receivables
1,6201761,318Cash and Cash Equivalents
72%-2%17523172Net Income1
63%-5%18223173Operating Income160%0%32043321Gross Profit1
59%2%56277573Net Revenues

23
Financials – 3Q07 Results Highlights
Summary
Net sales increased 58.9% YOY
Non-GAAP gross margin was 56.0% in 3Q07 compared to 57% in 2Q07
70.0% increase YOY in net income (71.5% YOY increase in non-GAAP net income)
Cash & cash equivalents was US$232 million as of Sep. 30, 2007
Accounts receivable, 22 days and inventory, 64 days

24
Stable Margins and Disciplined Investment
56.0 55.8 54.757.0
3Q07 3Q06 2Q07 2006
Gross Margin (%)• Stable
margins• New
products drive slight gross margin expansion
R&D % of Sales (%)• Goal to
invest 10% of sales in R&D activities
G&A % of Sales (%)• Likely to be
lower than 4% in 2007
Selling % of Sales (%)• Increasing
investment in overseas sales & distribution networks
** Non-GAAP margins excluding impact from share-based compensation, amortization/expense of acquired intangibles (net of tax impact)
9.2 9.4 9.48.1
3Q07 3Q06 2Q07 2006
13.7 13.1 13.613.5
3Q07 3Q06 2Q07 2006
3.0 3.9 4.22.9
3Q07 3Q06 2Q07 2006

25
Manufacturing Expansion Plans
Operational in 2010
Operational in 2009,Focused on Producing Fundamental Parts for Products
Operational in 2008(Product assembly, Mechanical Machining, PCBA and Medical Accessories)Focus on Product Assembly and Medical Accessories after 2009
Operational in 2H 2008,Focused on Producing Reagents
Role and Configuration
240,000E
200,000E
75,000
21,000
Square Meters
Reagents(Hematology, Bio-chemistryRadioactive Immures)
Hong Hua Ling
Operation Lighting, Tables and Medical Imaging
NanJing JiangNing
Mechanical Machining, Plate Metal Machining, Plastic module and PCBA
Long Gang
Primary Products(Patient Monitors,Hematology Analyzers, etc), medical consumables and key accessories
Bai Wang Xin
ProductsFacility Location