the kauffman index 2015: startup activity | state trends/media/kauffman_org/research reports...
TRANSCRIPT

U N E 2 0 1 5
KAUFFMAN
INDEX2015
THE
startupactivitysTaTE TRENDs Arnobio Morelix
Robert W. FairlieJoshua RussellE.J. Reedy
J

2 | 2 0 1 5 | T H E K A U F F M A N I N D E X | S T A R T U P A C T I V I T Y | S T A T E T R E N D S
©2015 by the Ewing Marion Kauffman Foundation. all rights reserved.
The authors would like to thank Alicia Robb, Amisha Miller, Barb Pruitt, Chris Jackson, Chris Newton, Colin Tomkins-Bergh, Dane Stangler, Keith Mays, and Lacey Graverson for their feedback, support, and advice.
Explore the interactive data at www.kauffmanindex.org

T H E K A U F F M A N I N D E X | S T A R T U P A C T I V I T Y | S T A T E T R E N D S | 2 0 1 5 | 1
TABLE OF CONTENTSForeword .......................................................................................................................................................................................................................................3
Introducing the New Kauffman Index ..................................................................................................................................................................................4
Executive Summary ....................................................................................................................................................................................................................5
Figure 1: Kauffman Index: startup activity (1997–2015) ...............................................................................................................................5
Introduction ..................................................................................................................................................................................................................................6
The Components of the Kauffman Index: Startup Activity .............................................................................................................................................7
State Trends in Startup Activity ...............................................................................................................................................................................................9
Table 1: state Rankings—Kauffman Index: startup activity ........................................................................................................................10
Figure 2: 2015 Rank for the Kauffman Index: startup activity by state ......................................................................................................11
A Look at State GDP Growth and Entrepreneurial Performance ...............................................................................................................................12
State Trends in Rate of New Entrepreneurs ......................................................................................................................................................................13
Figure 3: 2015 Rate of New Entrepreneurs Component of the Kauffman Index: startup activity by state ..................................................................................................................................................................................13
State Trends in Opportunity Share of New Entrepreneurs ...........................................................................................................................................14
Figure 4: 2015 Opportunity share of New Entrepreneurs Component of the Kauffman Index: startup activity by state .....................................................................................................................................................14
State Trends in Startup Density.............................................................................................................................................................................................15
Figure 5: 2015 startup Density Component of the Kauffman Index: startup activity by state ..................................................................................................................................................................................15
Appendix: State Rankings and State Profiles Ordered by Rank ..................................................................................................................................16
Table 1: state Rankings—Kauffman Index: startup activity ........................................................................................................................17
Kauffman Index: Montana—Index Rank 1 ...................................................................................................................................................18
Kauffman Index: Wyoming—Index Rank 2 .................................................................................................................................................19
Kauffman Index: North Dakota—Index Rank 3 ...........................................................................................................................................20
Kauffman Index: Colorado—Index Rank 4 ..................................................................................................................................................21
Kauffman Index: Vermont—Index Rank 5 ...................................................................................................................................................22
Kauffman Index: south Dakota—Index Rank 6 ...........................................................................................................................................23
Kauffman Index: alaska—Index Rank 7 .......................................................................................................................................................24
Kauffman Index: Idaho—Index Rank 8 .........................................................................................................................................................25
Kauffman Index: Florida —Index Rank 9 .....................................................................................................................................................26
Kauffman Index: Nevada—Index Rank 10 ..................................................................................................................................................27
Kauffman Index: New York—Index Rank 11 ...............................................................................................................................................28
Kauffman Index: Hawaii—Index Rank 12 ....................................................................................................................................................29
Kauffman Index: Louisiana—Index Rank 13 ................................................................................................................................................30
Kauffman Index: California—Index Rank 14 ................................................................................................................................................31
Kauffman Index: Utah—Index Rank 15 ........................................................................................................................................................32
Kauffman Index: Oklahoma—Index Rank 16 ..............................................................................................................................................33

2 | 2 0 1 5 | T H E K A U F F M A N I N D E X | S T A R T U P A C T I V I T Y | S T A T E T R E N D S
Kauffman Index: Texas—Index Rank 17 ......................................................................................................................................................34
Kauffman Index: New Mexico—Index Rank 18 ..........................................................................................................................................35
Kauffman Index: Delaware—Index Rank 19 ...............................................................................................................................................36
Kauffman Index: Nebraska—Index Rank 20 ................................................................................................................................................37
Kauffman Index: arizona—Index Rank 21 ...................................................................................................................................................38
Kauffman Index: Mississippi—Index Rank 22 ..............................................................................................................................................39
Kauffman Index: Maine—Index Rank 23 .....................................................................................................................................................40
Kauffman Index: North Carolina—Index Rank 24 .......................................................................................................................................41
Kauffman Index: Kansas—Index Rank 25 ....................................................................................................................................................42
Kauffman Index: Illinois—Index Rank 26 .....................................................................................................................................................43
Kauffman Index: Missouri—Index Rank 27 ..................................................................................................................................................44
Kauffman Index: Maryland—Index Rank 28 ................................................................................................................................................45
Kauffman Index: south Carolina—Index Rank 29 .......................................................................................................................................46
Kauffman Index: Rhode Island—Index Rank 30 ..........................................................................................................................................47
Kauffman Index: Kentucky—Index Rank 31 ................................................................................................................................................48
Kauffman Index: arkansas—Index Rank 32 .................................................................................................................................................49
Kauffman Index: Oregon—Index Rank 33 ...................................................................................................................................................50
Kauffman Index: Massachusetts—Index Rank 34 ........................................................................................................................................51
Kauffman Index: Connecticut—Index Rank 35 ...........................................................................................................................................52
Kauffman Index: New Jersey—Index Rank 36 .............................................................................................................................................53
Kauffman Index: Ohio—Index Rank 37 .......................................................................................................................................................54
Kauffman Index: Washington—Index Rank 38............................................................................................................................................55
Kauffman Index: Virginia—Index Rank 39 ...................................................................................................................................................56
Kauffman Index: Georgia—Index Rank 40 ..................................................................................................................................................57
Kauffman Index: Michigan—Index Rank 41 ................................................................................................................................................58
Kauffman Index: Iowa—Index Rank 42 ........................................................................................................................................................59
Kauffman Index: New Hampshire—Index Rank 43 ....................................................................................................................................60
Kauffman Index: Indiana—Index Rank 44 ...................................................................................................................................................61
Kauffman Index: Tennessee—Index Rank 45 ..............................................................................................................................................62
Kauffman Index: West Virginia—Index Rank 46 .........................................................................................................................................63
Kauffman Index: Minnesota—Index Rank 47 ..............................................................................................................................................64
Kauffman Index: Pennsylvania—Index Rank 48 ..........................................................................................................................................65
Kauffman Index: alabama—Index Rank 49 .................................................................................................................................................66
Kauffman Index: Wisconsin—Index Rank 50 ..............................................................................................................................................67
Methodology and Framework ..............................................................................................................................................................................................68
Data Sources and Component Measures ..........................................................................................................................................................................71
Advantages over Other Possible Measures of Entrepreneurship ................................................................................................................................72
References ..................................................................................................................................................................................................................................74

T H E K A U F F M A N I N D E X | S T A R T U P A C T I V I T Y | S T A T E T R E N D S | 2 0 1 5 | 3
Forewordby Dane stangler, Vice President of Research and Policy, Kauffman Foundation
Entrepreneurship is one of the most important activities of modern economic life. The creation and growth of new companies, as well as the closure and shrinkage of existing companies, are at the heart of “economic dynamism.” Many of the statistics tracked closely by economists, policymakers, investors, and others—such as unemployment, wage growth, and productivity—are driven by entrepreneurial activity.
Yet the measurement of entrepreneurship has consistently lagged behind these other “leading indicators.” In part, this is due to the diversity of the phenomenon we call “entrepreneurship.” It includes the venture-backed startups of Silicon Valley as well as the new restaurant down the street; for many, entrepreneurship includes independent franchise owners and those who might take over and transform a century-old bank.
But why should measurement matter with respect to entrepreneurship? The American economy has been consistently entrepreneurial for more than 200 years in the absence of solid data for tracking that entrepreneurial activity—what difference will better entrepreneurship data make? There are three main reasons that come to mind.
First, as Zachary Karabell laid out in his book, The Leading Indicators, there are serious limitations to the current set of economic statistics on which we all rely to track the economy. Second, entrepreneurship will grow in importance as technological progress forces change in different economic structures: new, young, and growing companies will assume an even more prominent role in economic dynamism. Third, as the saying goes, you can’t manage what you don’t measure. Even though entrepreneurial activity is not necessarily something that can be strictly “managed,” improvements in entrepreneurship data allow for improvements in public and private decision-making. This includes federal economic policy, university courses and programs, state and local spending priorities, and individual choices.
Data innovations from the Census Bureau and others in the last decade have allowed economists to reveal that new and young firms are the principal sources of net job creation in the United States.
Previously, as a result of mis-measurement, it was assumed that either small or big companies played this role. The magnitude of the mindset shift that this prompted—from an exclusive focus on firm size to an appreciation of the importance of firm age—is hard to overestimate. Further work with these datasets, including by Federal Reserve researchers, has generated insight into the role that new and young firms play in wage growth and career dynamics for young workers. The Kauffman Foundation has been a proud partner in these efforts.
The impact of data innovations is not restricted to public datasets. In recent years, companies like Crunchbase, Mattermark, and AngelList have demonstrated the importance of private data and the impact it can have for investors and entrepreneurs and others.
Measurement matters, and further improvements in entrepreneurship data will continue to shape public policy, private decision-making, and other areas.
This is why the Kauffman Foundation has put so much effort into improving one of our signature products, the Kauffman Index of Entrepreneurship. Readers will find more detail about this effort in the pages that follow. Kauffman researchers Arnobio Morelix, E.J. Reedy, and Josh Russell have worked diligently with economist Robert Fairlie and others to produce this report and the reports that will follow later this year.
Numbers, of course, are only as good as they’re used. For this reason, the Kauffman Foundation continues to devote considerable resources to innovations in data collection, data access, and data use. We are working closely with the Census Bureau and other government agencies on the new Annual Survey of Entrepreneurs (ASE), which is an effort to expand the quinquennial Survey of Business Owners. The first results from the new ASE will be available in 2016.
What a society measures is an indication of what that society values. Entrepreneurship in all its forms will continue to be essential to rising standards of living and expanding economic opportunity. Innovations and improvements in entrepreneurship data will allow us to do a better job in pursuit of those objectives.

4 | 2 0 1 5 | T H E K A U F F M A N I N D E X | S T A R T U P A C T I V I T Y | S T A T E T R E N D S
Introducing the New Kauffman Index
How can I actually measure the entrepreneurial activity in my region?
This is a question we at the Kauffman Foundation often hear from economic and policy leaders. As cities around the globe rally to foster entrepreneurship, the challenge of how to consistently measure and benchmark progress remains largely unanswered.
While anecdotal evidence abounds, most ecosystems struggle to answer straightforward, yet often elusive, questions: How many new startups does our city or state have? How much are our ventures growing? How many of our businesses are surviving?
To begin to answer these questions and address this challenge, we introduce the new Kauffman Index of Entrepreneurship, the first and largest index tracking entrepreneurship across city, state, and national levels for the United States. In this release, we introduce the Kauffman Index: Startup Activity—the first of various research installments under the umbrella of the new Kauffman Index of Entrepreneurship.
For the past ten years, the original Kauffman Index—authored by Robert W. Fairlie—has been an early indicator for entrepreneurship in the United States, used by entrepreneurs and policymakers, from the federal to state and local levels. The Kauffman Index also has been one of the most requested and far-reaching entrepreneurship indicators in the United States and, arguably, the world.
In the policy world, the Index has been referenced in multiple testimonies to the U.S. Senate and House of Representatives, by U.S. Embassies and Consulates across various countries—including nations like Spain, Ukraine, and United Kingdom—by multiple federal agencies, by state governments and governors from fifteen states—from Arizona to New York—and by the White House’s office of the President of the United States. On the academic side, more than 200 research papers quote the Kauffman Index. In media circles, the Kauffman Index has been highlighted in more than 100 media channels, including most major publications like The New York Times, The Wall Street Journal, TIME, CNN, the Financial Times, and Harvard Business Review.
Originally, the Kauffman Index tracked one of the earliest measures of business creation: When and how many people first start working for themselves, becoming entrepreneurs. Now, we are expanding it to include other dimensions of entrepreneurship.
The new and expanded Kauffman Index of Entrepreneurship 2015 remains focused primarily on
entrepreneurial outcomes, as opposed to inputs. That means we are more concerned with actual results of entrepreneurial activity—things like new companies and growth rates.
The Kauffman Index: Startup Activity algorithm presented in this report takes into account three variables:
• RateofNewEntrepreneurs• OpportunityShareofNewEntrepreneurs• StartupDensity
Future installments of the Kauffman Index to be released later this year also take into consideration, among other variables:
• VentureGrowth• DensityofScale-Ups• SurvivalRates• PercentofBusinessOwnersinthePopulation
And, with the Kauffman Index of Entrepreneurship 2015, all these data will be presented at three geographic levels:
• National• State• Metropolitan—coveringthefortylargestU.S.
metropolitan areas by population
Wherever possible, the Kauffman Index also presents demographic characteristics of the business owners examined in different contexts.
The new Kauffman Index of Entrepreneurship is based on extensive entrepreneurship research, and our algorithm attempts to present a balanced perspective on how to measure entrepreneurship. Nonetheless, entrepreneurship is a complex phenomenon, and we expect to further build out and enhance the Index in the coming years, particularly as new data become available from the Annual Survey of Entrepreneurs, a forthcoming project from a major public-private partnership between the U.S. Census Bureau and the Kauffman Foundation.
The Kauffman Index 2015 series will include two more reports that follow the Startup Activity report, one on “main street” businesses and one on growth ventures, and a final report that synthesizes all three reports into one view of U.S. business activity for the year.
To help state and local leaders access the data relevant to their locales, the Index will offer enhanced, customizable data visualization, benchmarking tools, and detailed reports diving into the trends of different ecosystems across the United States.
We hope that you can use what we developed here to learn more about and foster your own entrepreneurial ecosystem.

T H E K A U F F M A N I N D E X | S T A R T U P A C T I V I T Y | S T A T E T R E N D S | 2 0 1 5 | 5
Executive SummaryThe Kauffman Index: Startup Activity is a novel
early indicator of new business creation in the United States, integrating several high-quality sources of timely entrepreneurship information into one composite indicator of startup activity. The Index captures business activity in all industries, and is based on both a nationally representative sample size of more than a half million observations each year and on the universe of all employer businesses in the United States. This allows us to look at both entrepreneurs and the startups they create.
This report presents trends in startup activity over the past two decades for all the fifty states of the United States. Broad-based entrepreneurship in America appears to be slowly crawling its way out of the depths it has been stuck in since 2010.
Startup activity rose in 2015, reversing a five-year downward trend in the United States, giving rise to hope for a revival of entrepreneurship. However, the return remains tepid and well below historical trends, as shown in Figure 1 below. A principle driver of this year’s uptick is the growth of male opportunity entrepreneurship,
accompanied by the continued strength of immigrant entrepreneurship—covered in the Kauffman Index: Startup Activity | National Trends. Males were hit particularly hardduringtheGreatRecession.Metro-areastarsofthestartup surge include perennial favorites like Austin and San Jose—covered in the Kauffman Index: Startup Activity | Metropolitan Area and City Trends—as well as some less- highlighted places, such as Miami and San Antonio.
In this report, we focus on startup activity at the state level. Key findings include:
State Trends in Startup Activity
Startup Activity and Rankings
• Startupactivitywashigherforthirty-twoofthefiftyU.S. states in the 2015 Index when compared to the 2014 Index.
• Thefivestateswiththehigheststartupactivityinthe2015 Index were Montana, Wyoming, North Dakota, Colorado, and Vermont. The high level of startup activity in these states is likely associated with the veryhighrealGDPgrowthmostofthesestateshaverecently experienced.
-1.00
-1.501997 1998 1999 2000 2001 2002 2003 2004 2005 2006 2007 2008 2009 2010 2011 2012 2013 2014 2015
-0.50
0.00
0.50
1.00
1.50
SOURCE: Authors’ calculations using the CPS, BDS, and BEA. For an interactive version, please see: www.kauffmanindex.org.
Figure 1
Kauffman Index: Startup Activity (1997–2015)
Kauffman Foundation

6 | 2 0 1 5 | T H E K A U F F M A N I N D E X | S T A R T U P A C T I V I T Y | S T A T E T R E N D S
Rate of New Entrepreneurs
• LookingatthecomponentsoftheStartupActivityIndex, the Rate of New Entrepreneurs has a high variation across states, going from a low of 170 new entrepreneurs for every 100,000 adults (Minnesota and Wisconsin) in a given month to 540 new entrepreneurs for every 100,000 adults (Montana) in a given month.
Opportunity Share of New Entrepreneurs
• ThesecondcomponentoftheStartupActivityIndex, the Opportunity Share of New Entrepreneurs, varies across states, from 69.0 percent in Alabama to 90.3 percent in Idaho. This means that, in Alabama, approximately three out of every ten new entrepreneurs were previously unemployed, while in Idaho less than one out of every ten new entrepreneurs was previously unemployed. The states in the Plains, Rocky Mountains, and Southwest regions of the United States performed better in terms of Opportunity Share of New Entrepreneurs when compared to other regions of the country.
Startup Density
• StartupDensity—acomponentoftheIndexmeasuring the number of startups per 100,000 people—varies immensely across states, going from 81.4 startups per 100,000 people in West Virginia to 177.7 startups per 100,000 in the state of New York to 244.7 startups per 100,000 in North Dakota. Only nineteen of the fifty U.S. states’ startup density in the 2015 Index exceeded the overall United States’ startup density.
IntroductionThe Kauffman Index: Startup Activity presents a novel
index measure of a broad range of startup activity in the United States—across national, state, and metropolitan-area levels. The index captures startup activity along three dimensions. First, it captures the Rate of New Entrepreneurs in the economy—the percentage of adults becoming entrepreneurs in a given month. Second, it captures the Opportunity Share of New Entrepreneurs, the percentage of new entrepreneurs driven primarily by “opportunity entrepreneurship” as opposed to “necessity entrepreneurship.” Third, it captures Startup Density, the rate at which businesses with employees are created in the economy. The combination of these three distinct and important dimensions of new business creation provides a broad view of startup activity in the country, across national, state, and metropolitan-area levels.
The Kauffman Index: Startup Activity is an early indicator of new business creation in the United States. Capturing new entrepreneurs in their first month and new employer businesses in their first year, the Index provides the earliest documentation of new business development across the country. The Startup Activity Index captures all types of business activity and is based on nationally representative sample sizes of more than a half million observations each year or administrative data covering the universe of employer business entities. The separate components of the Index also provide evidence on potentially different trends in business creation created by “opportunity” business creation relative to unemployment-related (“necessity”) business creation over the business cycle. The Startup Activity Index improves over other possible measures of entrepreneurship because of its timeliness, dynamic nature, exclusion of “casual” businesses, and inclusion of all types of business activity, regardless of industry.
The Startup Activity Index captures all types of business activity and is based on nationally representative sample sizes of more than a half million
observations each year or administrative data covering the universe of employer business entities.

T H E K A U F F M A N I N D E X | S T A R T U P A C T I V I T Y | S T A T E T R E N D S | 2 0 1 5 | 7
1. We normalize each of three measures by subtracting the mean and dividing by the standard deviation for that measure (i.e., create a z-score for each variable). This creates a comparable scale for including the three measures in the startup activity Index. We use annual estimates from 1996 to the latest year available (2012 or 2014) to calculate the mean and standard deviations for each component measure (see Methodology and Framework for more details).
2. see “Kauffman Index of Entrepreneurial activity, 1996–2012” (Fairlie 2013) and http://www.kauffman.org/research-and-policy/kauffman-index-of-entrepreneurial-activity.aspx for previous reports.
• Earlyandbroadmeasureofbusinessownership.
• MeasuresthepercentoftheU.S.adultpopulation that became entrepreneurs, on average, in a given month.
• Includesentrepreneurswithincorporatedor unincorporated businesses, with or without employees.
• DatabasedontheCurrentPopulationsurvey, jointly produced by the U.s. Census Bureau and the U.s. Bureau of Labor statistics.
• Whatthenumbermeans:
- For example, the Rate of New Entrepreneurs was 0.35 percent for Colorado in the 2015 Index. That means that, on average, 350 people out of 100,000 adults became entrepreneurs in Colorado in each month.
Rate of New Entrepreneurs
KAUFFMAN
INDEX:startupactivity
Rate of New Entrepreneurs
Opportunity Share of New Entrepreneurs
Startup Density
OPP
ORT
UN
ITY
SHARE OF NEW ENTREPREN
EURS
RATE
O
F NEW ENTREPRENEU
RS
STARTUP DENSITY
The Components of the Kauffman Index: Startup Activity
The Kauffman Index: Startup Activity provides a broad index measure of business startup activity in the United States. It is an equally weighted index of three normalized measures of startup activity.1 The three component measures of the Startup Activity Index are:
i) The Rate of New Entrepreneurs in the economy, calculated as the percentage of adults becoming entrepreneurs in a given month.
ii) The Opportunity Share of New Entrepreneurs, calculated as the percentage of new entrepreneurs driven primarily by “opportunity” vs. “necessity.”
iii) The Startup Density of a region, measured as the number of new employer businesses normalized by population.
Before presenting trends in the Startup Activity Index, we briefly discuss each component measure (see Methodology and Framework for more details).
First, the Rate of New Entrepreneurs captures the percentage of the adult, non-business-owner population that starts a business each month. This component was formerly known as the Kauffman Index of Entrepreneurial Activity and was presented in a series of reports over more than a decade (Fairlie 2014).2 The Rate of New Entrepreneurs as measured here captures all new business
8 | 2 0 1 5 | T H E K A U F F M A N I N D E X | S T A R T U P A C T I V I T Y | S T A T E T R E N D S
3. The U.s. Census Bureau notes that the definitions of non-employers and self-employed business owners are not the same. although most self-employed business owners are non-employers, about a million self-employed business owners are classified as employer businesses. http://www.census.gov/econ/nonemployer/index.html.
4. see Fairlie (2011), “Entrepreneurship, Economic Conditions, and the Great Recession,” Journal of Economics and Management Strategy for more evidence and discussion.
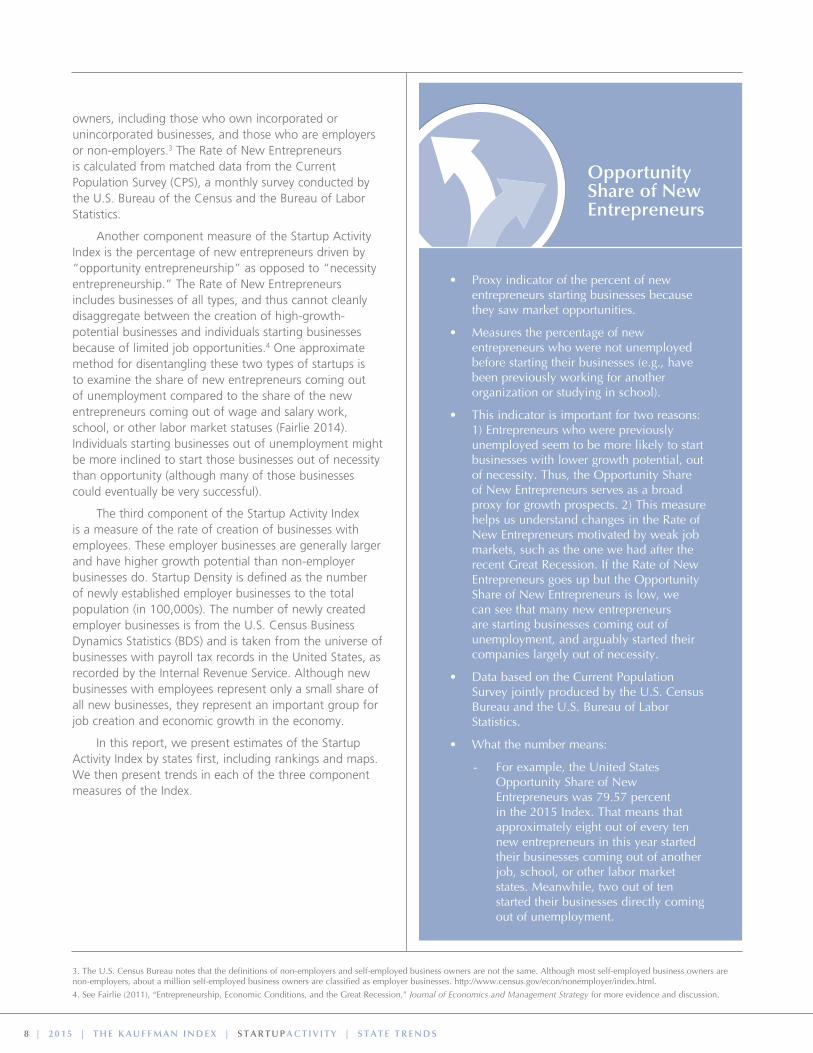
Opportunity Share of New Entrepreneurs
• Proxyindicatorofthepercentofnewentrepreneurs starting businesses because they saw market opportunities.
• Measuresthepercentageofnewentrepreneurs who were not unemployed before starting their businesses (e.g., have been previously working for another organization or studying in school).
• Thisindicatorisimportantfortworeasons:1) Entrepreneurs who were previously unemployed seem to be more likely to start businesses with lower growth potential, out of necessity. Thus, the Opportunity share of New Entrepreneurs serves as a broad proxy for growth prospects. 2) This measure helps us understand changes in the Rate of New Entrepreneurs motivated by weak job markets, such as the one we had after the recent Great Recession. If the Rate of New Entrepreneurs goes up but the Opportunity share of New Entrepreneurs is low, we can see that many new entrepreneurs are starting businesses coming out of unemployment, and arguably started their companies largely out of necessity.
• DatabasedontheCurrentPopulationsurvey jointly produced by the U.s. Census Bureau and the U.s. Bureau of Labor statistics.
• Whatthenumbermeans:
- For example, the United states Opportunity share of New Entrepreneurs was 79.57 percent in the 2015 Index. That means that approximately eight out of every ten new entrepreneurs in this year started their businesses coming out of another job, school, or other labor market states. Meanwhile, two out of ten started their businesses directly coming out of unemployment.
owners, including those who own incorporated or unincorporated businesses, and those who are employers or non-employers.3 The Rate of New Entrepreneurs is calculated from matched data from the Current Population Survey (CPS), a monthly survey conducted by the U.S. Bureau of the Census and the Bureau of Labor Statistics.
Another component measure of the Startup Activity Index is the percentage of new entrepreneurs driven by “opportunity entrepreneurship” as opposed to “necessity entrepreneurship.” The Rate of New Entrepreneurs includes businesses of all types, and thus cannot cleanly disaggregate between the creation of high-growth-potential businesses and individuals starting businesses because of limited job opportunities.4 One approximate method for disentangling these two types of startups is to examine the share of new entrepreneurs coming out of unemployment compared to the share of the new entrepreneurs coming out of wage and salary work, school, or other labor market statuses (Fairlie 2014). Individuals starting businesses out of unemployment might be more inclined to start those businesses out of necessity than opportunity (although many of those businesses could eventually be very successful).
The third component of the Startup Activity Index is a measure of the rate of creation of businesses with employees. These employer businesses are generally larger and have higher growth potential than non-employer businesses do. Startup Density is defined as the number of newly established employer businesses to the total population (in 100,000s). The number of newly created employer businesses is from the U.S. Census Business Dynamics Statistics (BDS) and is taken from the universe of businesses with payroll tax records in the United States, as recorded by the Internal Revenue Service. Although new businesses with employees represent only a small share of all new businesses, they represent an important group for job creation and economic growth in the economy.
In this report, we present estimates of the Startup Activity Index by states first, including rankings and maps. We then present trends in each of the three component measures of the Index.
T H E K A U F F M A N I N D E X | S T A R T U P A C T I V I T Y | S T A T E T R E N D S | 2 0 1 5 | 9
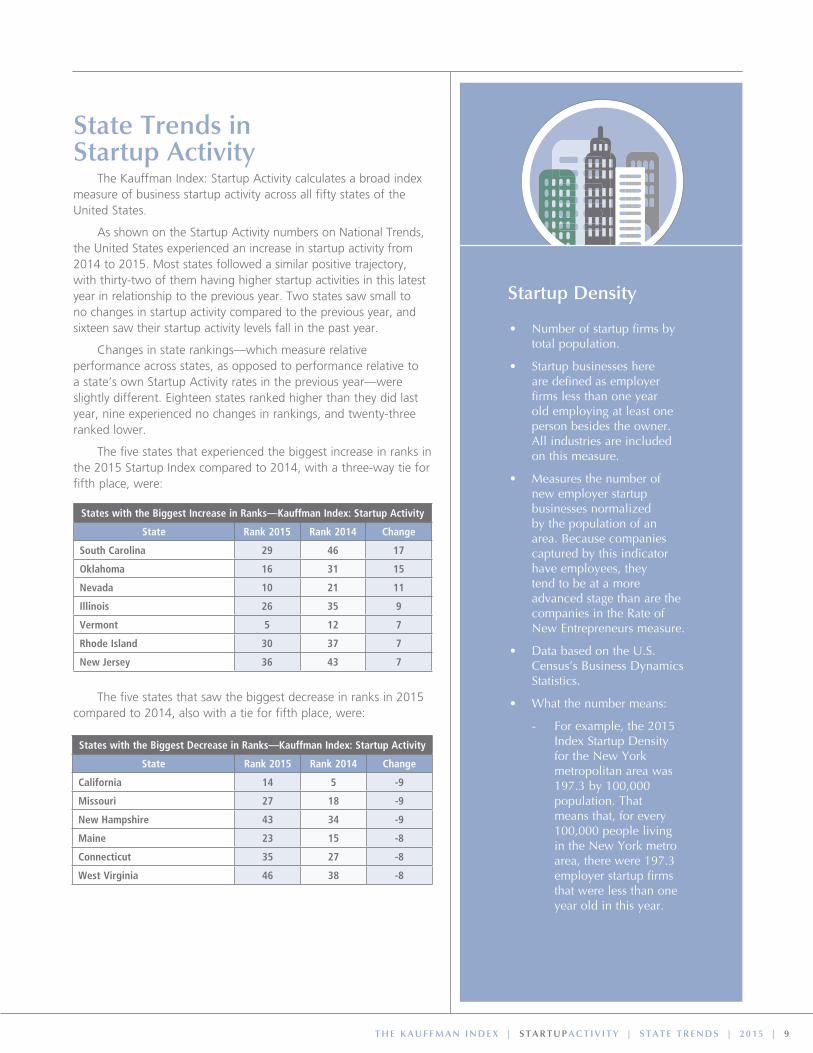
Startup Density
• Numberofstartupfirmsbytotal population.
• Startupbusinesseshereare defined as employer firms less than one year old employing at least one person besides the owner. all industries are included on this measure.
• Measuresthenumberofnew employer startup businesses normalized by the population of an area. Because companies captured by this indicator have employees, they tend to be at a more advanced stage than are the companies in the Rate of New Entrepreneurs measure.
• DatabasedontheU.S.Census’s Business Dynamics statistics.
• Whatthenumbermeans:
- For example, the 2015 Index startup Density for the New York metropolitan area was 197.3 by 100,000 population. That means that, for every 100,000 people living in the New York metro area, there were 197.3 employer startup firms that were less than one year old in this year.
Startup Density
States with the Biggest Increase in Ranks—Kauffman Index: Startup Activity
State Rank 2015 Rank 2014 Change
South Carolina 29 46 17
Oklahoma 16 31 15
Nevada 10 21 11
Illinois 26 35 9
Vermont 5 12 7
Rhode Island 30 37 7
New Jersey 36 43 7
States with the Biggest Decrease in Ranks—Kauffman Index: Startup Activity
State Rank 2015 Rank 2014 Change
California 14 5 -9
Missouri 27 18 -9
New Hampshire 43 34 -9
Maine 23 15 -8
Connecticut 35 27 -8
West Virginia 46 38 -8
State Trends in Startup Activity
The Kauffman Index: Startup Activity calculates a broad index measure of business startup activity across all fifty states of the United States.
As shown on the Startup Activity numbers on National Trends, the United States experienced an increase in startup activity from 2014 to 2015. Most states followed a similar positive trajectory, with thirty-two of them having higher startup activities in this latest year in relationship to the previous year. Two states saw small to no changes in startup activity compared to the previous year, and sixteen saw their startup activity levels fall in the past year.
Changes in state rankings—which measure relative performance across states, as opposed to performance relative to a state’s own Startup Activity rates in the previous year—were slightly different. Eighteen states ranked higher than they did last year, nine experienced no changes in rankings, and twenty-three ranked lower.
The five states that experienced the biggest increase in ranks in the 2015 Startup Index compared to 2014, with a three-way tie for fifth place, were:
The five states that saw the biggest decrease in ranks in 2015 compared to 2014, also with a tie for fifth place, were:

10 | 2 0 1 5 | T H E K A U F F M A N I N D E X | S T A R T U P A C T I V I T Y | S T A T E T R E N D S
TABLE 1
State Rankings—Kauffman Index: Startup Activity
Rank 2015 Index 2015 State Rank 2014 Change in Rank Rate of New Entrepreneurs
Opportunity Share of New Entrepreneurs Startup Density
1 4.77 Montana 1 0 0.54% 84.00% 195.7
2 2.04 Wyoming 6 4 0.32% 88.70% 216.3
3 1.74 North Dakota 3 0 0.27% 89.50% 244.7
4 1.5 Colorado 7 3 0.35% 84.90% 174.9
5 1.47 Vermont 12 7 0.40% 79.40% 157.4
6 1.43 South Dakota 10 4 0.34% 86.90% 166.7
7 1.35 Alaska 2 -5 0.45% 74.10% 132.8
8 1.32 Idaho 4 -4 0.33% 90.30% 146.2
9 1.23 Florida 8 -1 0.35% 80.30% 188.7
10 0.95 Nevada 21 11 0.37% 79.30% 155.5
11 0.91 New York 9 -2 0.33% 81.80% 177.7
12 0.77 Hawaii 14 2 0.35% 88.90% 97.5
13 0.7 Louisiana 11 -2 0.33% 89.20% 112.7
14 0.7 California 5 -9 0.39% 76.00% 140.6
15 0.69 Utah 17 2 0.30% 85.80% 168
16 0.67 Oklahoma 31 15 0.36% 81.90% 128.7
17 0.56 Texas 13 -4 0.36% 80.60% 130.4
18 0.22 New Mexico 16 -2 0.40% 74.20% 110
19 -0.15 Delaware 19 0 0.29% 83.60% 137.6
20 -0.29 Nebraska 23 3 0.25% 88.70% 135
21 -0.42 Arizona 20 -1 0.31% 80.90% 117.4
22 -0.48 Mississippi 22 0 0.34% 79.70% 88.4
23 -0.54 Maine 15 -8 0.29% 80.40% 133.8
24 -0.61 North Carolina 29 5 0.31% 79.20% 115.9
25 -0.87 Kansas 25 0 0.22% 90.10% 118.6
26 -1.14 Illinois 35 9 0.22% 86.40% 126.4
27 -1.15 Missouri 18 -9 0.28% 76.80% 128.9
28 -1.24 Maryland 28 0 0.24% 84.30% 113.2
29 -1.27 South Carolina 46 17 0.32% 72.60% 107.2
30 -1.31 Rhode Island 37 7 0.20% 87.80% 127
31 -1.33 Kentucky 24 -7 0.35% 69.40% 93.5
32 -1.38 Arkansas 26 -6 0.25% 82.50% 105.9
33 -1.4 Oregon 30 -3 0.27% 72.60% 152
34 -1.41 Massachusetts 33 -1 0.29% 73.40% 124.6
35 -1.46 Connecticut 27 -8 0.29% 74.90% 110.4
36 -1.54 New Jersey 43 7 0.24% 76.10% 150.5
37 -1.56 Ohio 36 -1 0.21% 89.20% 89.8
38 -1.59 Washington 32 -6 0.24% 76.20% 146.4
39 -1.74 Virginia 39 0 0.22% 81.50% 120.9
40 -1.78 Georgia 42 2 0.29% 69.70% 126
41 -1.9 Michigan 41 0 0.26% 76.40% 102.9
42 -1.97 Iowa 40 -2 0.18% 86.90% 110.6
43 -2.07 New Hampshire 34 -9 0.25% 72.60% 129.3
44 -2.61 Indiana 48 4 0.23% 75.20% 96
45 -2.94 Tennessee 47 2 0.24% 70.00% 99.3
46 -3.06 West Virginia 38 -8 0.20% 77.60% 81.4
47 -3.32 Minnesota 44 -3 0.17% 73.80% 122.5
48 -3.39 Pennsylvania 50 2 0.20% 71.50% 101.8
49 -3.47 Alabama 49 0 0.22% 69.00% 92.7
50 -3.92 Wisconsin 45 -5 0.17% 71.20% 100.6
For an interactive version of the rankings, please see: www.kauffmanindex.org.

T H E K A U F F M A N I N D E X | S T A R T U P A C T I V I T Y | S T A T E T R E N D S | 2 0 1 5 | 11
Kauffman Index Startup Activity Rank | 2015
1 High Low 50
2015 Rank for the Kau�man Index: Startup Activity by State
Kauffman Foundation
Figure 2
2015 Rank for the Kauffman Index: Startup Activity by State
For an interactive version of the map, please see: www.kauffmanindex.org.
In the following sections, we discuss state-level trends for each component of the Startup Activity Index: 1) Rate of New Entrepreneurs, 2) Opportunity Share of New Entrepreneurs, and 3) Startup Density.

12 | 2 0 1 5 | T H E K A U F F M A N I N D E X | S T A R T U P A C T I V I T Y | S T A T E T R E N D S
A Look at State GDP Growth and Entrepreneurial Performance
The Northern states in the Plains and Rocky Mountain regions of the United States are not typically talked about when the topic is startup activity. However, as the data show, overlooking the entrepreneurship activity in this region is probably a mistake. This is particularly true if we look at startup activity from an industry-agnostic perspective—beyond, for example, just information technology industries—as we do on the Kauffman Index.
With that in mind, there is one important indicator to observe that may help us understand why these states present relatively high rates of startup activity: some of these states recently have experienced high rates of realGDPgrowth,asdocumentedbytheBureauofEconomicAnalysisanddisplayedbelow.WearelookinghereatGDPgrowthinasingleyear,andwe cannot extrapolate much. But, as entrepreneurship is associated with economic growth, it should not come as a surprise if states experiencing recent economic expansion are also experiencing higher levels of startup activity.
The drivers behind the economic growth in these regions are a different story, and go beyond the scope of this report. Brown and Yücel (2013) highlight the influence of the oil and gas “boom” in the economic expansion on some of these states—at the same time warning for potential issues of less diversified state economies. More research is needed to investigate the topic.
Source: U.S. Bureau of Economic Analysis
2.7
2.7
2.0
1.0
3.0
4.17.6
3.8 3.8
1.1 1.5
9.7
3.1
3.0
2.8
2.9
0.81.9
4.2
3.7
1.72.0
1.80.9 2.1
2.4
1.31.6 0.8 1.8
2.2
4.2
2.30.8
1.6 0.15.1
Far West | 2.0
Southwest | 3.3
Southeast | 1.6
Mideast | 0.7
New England | 1.3Great Lakes | 1.6
Plains | 2.5Rocky Mountain | 4.1
-2.5–0.9
3.0–9.7
2.0–3.0
1.6–2.0
0.9–1.6
U.S. = 1.8
0.7
0.71.11.60.0
0.91.61.50.9
0.91.9
-2.5
1.9
-0.5
Kauffman Foundation
Percent Change in Real GDP by State, 2013
As entrepreneurship is associated with economic growth, it should not come as a surprise if states experiencing recent economic expansion are also experiencing higher levels of startup activity.
T H E K A U F F M A N I N D E X | S T A R T U P A C T I V I T Y | S T A T E T R E N D S | 2 0 1 5 | 13
Source: U.S. Bureau of Economic Analysis
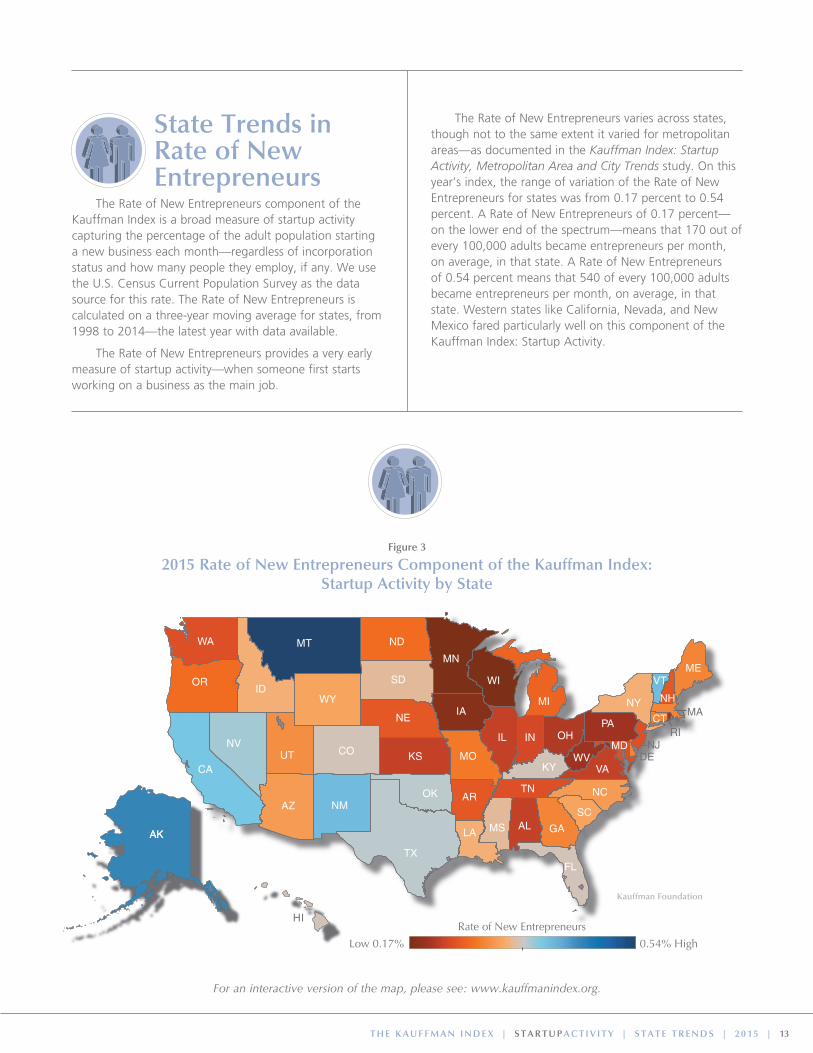
State Trends in Rate of New Entrepreneurs
The Rate of New Entrepreneurs component of the Kauffman Index is a broad measure of startup activity capturing the percentage of the adult population starting a new business each month—regardless of incorporation status and how many people they employ, if any. We use the U.S. Census Current Population Survey as the data source for this rate. The Rate of New Entrepreneurs is calculated on a three-year moving average for states, from 1998 to 2014—the latest year with data available.
The Rate of New Entrepreneurs provides a very early measure of startup activity—when someone first starts working on a business as the main job.
The Rate of New Entrepreneurs varies across states, though not to the same extent it varied for metropolitan areas—as documented in the Kauffman Index: Startup Activity, Metropolitan Area and City Trends study. On this year’s index, the range of variation of the Rate of New Entrepreneurs for states was from 0.17 percent to 0.54 percent. A Rate of New Entrepreneurs of 0.17 percent—on the lower end of the spectrum—means that 170 out of every 100,000 adults became entrepreneurs per month, on average, in that state. A Rate of New Entrepreneurs of 0.54 percent means that 540 of every 100,000 adults became entrepreneurs per month, on average, in that state. Western states like California, Nevada, and New Mexico fared particularly well on this component of the Kauffman Index: Startup Activity.
2015 Rank for the Rate of New Entrepreneurs Component of the Kau�man Index: Startup Activity by State
Rate of New Entrepreneurs
Low 0.17% 0.54% High
Kauffman Foundation
Figure 3
2015 Rate of New Entrepreneurs Component of the Kauffman Index: Startup Activity by State
For an interactive version of the map, please see: www.kauffmanindex.org.

14 | 2 0 1 5 | T H E K A U F F M A N I N D E X | S T A R T U P A C T I V I T Y | S T A T E T R E N D S
State Trends in Opportunity Share of New Entrepreneurs
The Opportunity Share of New Entrepreneurs component of the Kauffman Index: Startup Activity measures the percentage of the new entrepreneurs—measured by Rate of New Entrepreneurs described in the previous section—not coming out of unemployment. For states, we calculate Opportunity Shares of Entrepreneurship on a three-year moving average, from 1998 to 2014, the latest year with data available. The data source for this indicator is the U.S. Census Bureau Current Population Survey.
The Opportunity Share provides us nuance on the Rate of New Entrepreneurs: because entrepreneurs coming from unemployment are more likely to start new companies for necessity reasons rather than for opportunity reasons, Opportunity Share is a broad proxy used to identify the new businesses more likely to grow.
Of course, entrepreneurs coming out of unemployment also can achieve high growth, but Opportunity Share can give us an early indicator of potential. Moreover, the Opportunity Share helps us understand changes in the Rate of New Entrepreneurs that are potentially driven by weak job markets.
As with other Startup Activity indicators, there is high variance on Opportunity Share across different areas of the country. On the low end, the Opportunity Share of Entrepreneurship for the latest year available is 69.0 percent in Alabama. On the high end, the Opportunity Share of Entrepreneurship is 90.3 percent in Idaho. This means that out of every ten new Alabama entrepreneurs, approximately three came directly from unemployment. Meanwhile, in Idaho, only one out of every ten new entrepreneurs came directly from unemployment.
States in the Plains, Rocky Mountains, and Southwest regions of the United States performed better in terms of Opportunity Share of Entrepreneurship when compared to other areas of the country, as you can see on the map below.
Rank for the Opportunity Share of Entrepreneurship Component of the Kau�man Index: Startup Activity by State, All States
Opportunity Share of New EntrepreneursLow 69.0% 90.3% High
Kauffman Foundation
Figure 4
2015 Opportunity Share of New Entrepreneurs Component of the Kauffman Index: Startup Activity by State
For an interactive version of the map, please see: www.kauffmanindex.org.

T H E K A U F F M A N I N D E X | S T A R T U P A C T I V I T Y | S T A T E T R E N D S | 2 0 1 5 | 15
State Trends in Startup Density
The Startup Density component of the Kauffman Index measures the number of startups per 100,000 people. Here, we define startups as firms that are less than one year old and employing at least one person. This is a yearly measure calculated from the U.S. Census Business Dynamics Statistics—for firm data—and the Bureau of Economic Analysis—for population data.
We present this indicator going back from 1977 to 2012, the latest year for which the data are available. This measure differs from the Rate of New Entrepreneurs in two key ways: 1) the Rate of New Entrepreneurs is a measure based on individuals—the entrepreneurs themselves. As such, it tracks individuals starting new businesses rather than tracking the new businesses
themselves. 2) It is a very early and broad measure of startup activity, including all entrepreneurs, regardless of how many people their businesses employ, if any, and it includes self-employed entrepreneurs. Startup density only includes businesses employing at least one person—thus being a slightly more mature measure of startup activity.
Both researchers and entrepreneurs have suggested density as a key indicator of vibrancy in entrepreneurial ecosystems, and there is high variation on this indicator across U.S. metropolitan areas (Stangler and Bell-Masterson 2015 and Feld 2012). For the latest year available, the range of density goes all the way from the lower end of 81.4 startups per 100,000 people in West Virginia to the higher end of 244.7 startups per 100,000 people in North Dakota.
Compared to the U.S. startup density of 130.6 startups per 100,000 people, nineteen states had higher density rates.
Startup DensityLow 81.4 244.7 High
2015 Rank for the Startup Density Component of the Kau�man Index: Startup Activity by State
Kauffman Foundation
Figure 5
2015 Startup Density Component of the Kauffman Index: Startup Activity by State
For an interactive version of the map, please see: www.kauffmanindex.org.

16 | 2 0 1 5 | T H E K A U F F M A N I N D E X | S T A R T U P A C T I V I T Y | S T A T E T R E N D S
aPPENDIX: sTaTE RaNKINGs aND sTaTE PROFILEs ORDERED BY RaNK

T H E K A U F F M A N I N D E X | S T A R T U P A C T I V I T Y | S T A T E T R E N D S | 2 0 1 5 | 17
Rank 2015 Index 2015 State Rank 2014 Change in Rank Rate of New Entrepreneurs
Opportunity Share of New Entrepreneurs Startup Density
1 4.77 Montana 1 0 0.54% 84.00% 195.7
2 2.04 Wyoming 6 4 0.32% 88.70% 216.3
3 1.74 North Dakota 3 0 0.27% 89.50% 244.7
4 1.5 Colorado 7 3 0.35% 84.90% 174.9
5 1.47 Vermont 12 7 0.40% 79.40% 157.4
6 1.43 South Dakota 10 4 0.34% 86.90% 166.7
7 1.35 Alaska 2 -5 0.45% 74.10% 132.8
8 1.32 Idaho 4 -4 0.33% 90.30% 146.2
9 1.23 Florida 8 -1 0.35% 80.30% 188.7
10 0.95 Nevada 21 11 0.37% 79.30% 155.5
11 0.91 New York 9 -2 0.33% 81.80% 177.7
12 0.77 Hawaii 14 2 0.35% 88.90% 97.5
13 0.7 Louisiana 11 -2 0.33% 89.20% 112.7
14 0.7 California 5 -9 0.39% 76.00% 140.6
15 0.69 Utah 17 2 0.30% 85.80% 168
16 0.67 Oklahoma 31 15 0.36% 81.90% 128.7
17 0.56 Texas 13 -4 0.36% 80.60% 130.4
18 0.22 New Mexico 16 -2 0.40% 74.20% 110
19 -0.15 Delaware 19 0 0.29% 83.60% 137.6
20 -0.29 Nebraska 23 3 0.25% 88.70% 135
21 -0.42 Arizona 20 -1 0.31% 80.90% 117.4
22 -0.48 Mississippi 22 0 0.34% 79.70% 88.4
23 -0.54 Maine 15 -8 0.29% 80.40% 133.8
24 -0.61 North Carolina 29 5 0.31% 79.20% 115.9
25 -0.87 Kansas 25 0 0.22% 90.10% 118.6
26 -1.14 Illinois 35 9 0.22% 86.40% 126.4
27 -1.15 Missouri 18 -9 0.28% 76.80% 128.9
28 -1.24 Maryland 28 0 0.24% 84.30% 113.2
29 -1.27 South Carolina 46 17 0.32% 72.60% 107.2
30 -1.31 Rhode Island 37 7 0.20% 87.80% 127
31 -1.33 Kentucky 24 -7 0.35% 69.40% 93.5
32 -1.38 Arkansas 26 -6 0.25% 82.50% 105.9
33 -1.4 Oregon 30 -3 0.27% 72.60% 152
34 -1.41 Massachusetts 33 -1 0.29% 73.40% 124.6
35 -1.46 Connecticut 27 -8 0.29% 74.90% 110.4
36 -1.54 New Jersey 43 7 0.24% 76.10% 150.5
37 -1.56 Ohio 36 -1 0.21% 89.20% 89.8
38 -1.59 Washington 32 -6 0.24% 76.20% 146.4
39 -1.74 Virginia 39 0 0.22% 81.50% 120.9
40 -1.78 Georgia 42 2 0.29% 69.70% 126
41 -1.9 Michigan 41 0 0.26% 76.40% 102.9
42 -1.97 Iowa 40 -2 0.18% 86.90% 110.6
43 -2.07 New Hampshire 34 -9 0.25% 72.60% 129.3
44 -2.61 Indiana 48 4 0.23% 75.20% 95.9
45 -2.94 Tennessee 47 2 0.24% 70.00% 99.3
46 -3.06 West Virginia 38 -8 0.20% 77.60% 81.4
47 -3.32 Minnesota 44 -3 0.17% 73.80% 122.5
48 -3.39 Pennsylvania 50 2 0.20% 71.50% 101.8
49 -3.47 Alabama 49 0 0.22% 69.00% 92.7
50 -3.92 Wisconsin 45 -5 0.17% 71.20% 100.6
TABLE 1
State Rankings—Kauffman Index: Startup Activity
For an interactive version of the rankings, please see: www.kauffmanindex.org.

18 | 2 0 1 5 | T H E K A U F F M A N I N D E X | S T A R T U P A C T I V I T Y | S T A T E T R E N D S
1998 2000 2002 2004 2006 2008 2010 2012 2014
0.10%
0.20%
0.30%
0.40%
0.50%
0.60%
0.70%
Perc
ent
of A
dult
Popu
latio
n Be
com
ing
Entr
epre
neur
s(M
onth
ly A
vera
ge)
Year
Rate of New Entrepreneurs
Startup ActivityRank
2015 2014
1 1
1977 1982 1987 1992 1997 2002 2007 2012
50
100
150
200
250
300
350
400
450
500
Star
tups
per
100
,000
Res
iden
t Po
pula
tion
(Ann
ual)
Year
Startup Density
1998 2000 2002 2004 2006 2008 2010 2012 2014
10%
20%
30%
40%
50%
60%
70%
80%
90%
100%
Opportunity Share of New Entrepreneurs
Perc
ent
of N
ew E
ntre
pren
eurs
Not
Com
ing
Out
of
Une
mpl
oym
ent
(Mon
thly
Ave
rage
)
Year
Rate of New Entrepreneurs
Opportunity Share of New Entrepreneurs
Startup Density
2015Component
2014Component
2015Component
2014Component
2015Component
2014Component
0.54% 0.49%
84.0% 84.4%
195.7 184.7
Early and broad measure of business ownership. Measures the percent ofthe adult population of an area thatbecame entrepreneurs in a givenmonth.
Broad indicator of the percent ofnew entrepreneurs starting businesses because they saw marketopportunities. Measures the percentof new entrepreneurs who were notunemployed before starting their businesses.
Number of startup firms per 100,000resident population. Startup businesses here are defined as firms less than one-year old employing at least one person besides the owner.
Source: Author calculation from CPS.3-year moving average.
Source: Author calculations from CPS.3-year moving average.
Source: Author calculations from BDS/BEA.Yearly measure.

T H E K A U F F M A N I N D E X | S T A R T U P A C T I V I T Y | S T A T E T R E N D S | 2 0 1 5 | 19
1998 2000 2002 2004 2006 2008 2010 2012 2014
0.10%
0.20%
0.30%
0.40%
0.50%
0.60%
0.70%
Perc
ent
of A
dult
Popu
latio
n Be
com
ing
Entr
epre
neur
s(M
onth
ly A
vera
ge)
Year
Rate of New Entrepreneurs
Startup ActivityRank
2015 2014
2 6
1977 1982 1987 1992 1997 2002 2007 2012
50
100
150
200
250
300
350
400
450
500
Star
tups
per
100
,000
Res
iden
t Po
pula
tion
(Ann
ual)
Year
Startup Density
1998 2000 2002 2004 2006 2008 2010 2012 2014
10%
20%
30%
40%
50%
60%
70%
80%
90%
100%
Opportunity Share of New Entrepreneurs
Perc
ent
of N
ew E
ntre
pren
eurs
Not
Com
ing
Out
of
Une
mpl
oym
ent
(Mon
thly
Ave
rage
)
Year
Rate of New Entrepreneurs
Opportunity Share of New Entrepreneurs
Startup Density
2015Component
2014Component
2015Component
2014Component
2015Component
2014Component
0.32% 0.28%
88.7% 88.9%
216.3 204.8
Early and broad measure of business ownership. Measures the percent ofthe adult population of an area thatbecame entrepreneurs in a givenmonth.
Broad indicator of the percent ofnew entrepreneurs starting businesses because they saw marketopportunities. Measures the percentof new entrepreneurs who were notunemployed before starting their businesses.
Number of startup firms per 100,000resident population. Startup businesses here are defined as firms less than one-year old employing at least one person besides the owner.
Source: Author calculation from CPS.3-year moving average.
Source: Author calculations from CPS.3-year moving average.
Source: Author calculations from BDS/BEA.Yearly measure.

20 | 2 0 1 5 | T H E K A U F F M A N I N D E X | S T A R T U P A C T I V I T Y | S T A T E T R E N D S
1998 2000 2002 2004 2006 2008 2010 2012 2014
0.10%
0.20%
0.30%
0.40%
0.50%
0.60%
0.70%
Perc
ent
of A
dult
Popu
latio
n Be
com
ing
Entr
epre
neur
s(M
onth
ly A
vera
ge)
Year
Rate of New Entrepreneurs
Startup ActivityRank
2015 2014
3 3
1977 1982 1987 1992 1997 2002 2007 2012
50
100
150
200
250
300
350
400
450
500
Star
tups
per
100
,000
Res
iden
t Po
pula
tion
(Ann
ual)
Year
Startup Density
1998 2000 2002 2004 2006 2008 2010 2012 2014
10%
20%
30%
40%
50%
60%
70%
80%
90%
100%
Opportunity Share of New Entrepreneurs
Perc
ent
of N
ew E
ntre
pren
eurs
Not
Com
ing
Out
of
Une
mpl
oym
ent
(Mon
thly
Ave
rage
)
Year
Rate of New Entrepreneurs
Opportunity Share of New Entrepreneurs
Startup Density
2015Component
2014Component
2015Component
2014Component
2015Component
2014Component
0.27% 0.28%
89.5% 92.8%
244.7 195.5
Early and broad measure of business ownership. Measures the percent ofthe adult population of an area thatbecame entrepreneurs in a givenmonth.
Broad indicator of the percent ofnew entrepreneurs starting businesses because they saw marketopportunities. Measures the percentof new entrepreneurs who were notunemployed before starting their businesses.
Number of startup firms per 100,000resident population. Startup businesses here are defined as firms less than one-year old employing at least one person besides the owner.
Source: Author calculation from CPS.3-year moving average.
Source: Author calculations from CPS.3-year moving average.
Source: Author calculations from BDS/BEA.Yearly measure.

T H E K A U F F M A N I N D E X | S T A R T U P A C T I V I T Y | S T A T E T R E N D S | 2 0 1 5 | 21
1998 2000 2002 2004 2006 2008 2010 2012 2014
0.10%
0.20%
0.30%
0.40%
0.50%
0.60%
0.70%
Perc
ent
of A
dult
Popu
latio
n Be
com
ing
Entr
epre
neur
s(M
onth
ly A
vera
ge)
Year
Rate of New Entrepreneurs
Startup ActivityRank
2015 2014
4 7
1977 1982 1987 1992 1997 2002 2007 2012
50
100
150
200
250
300
350
400
450
500
Star
tups
per
100
,000
Res
iden
t Po
pula
tion
(Ann
ual)
Year
Startup Density
1998 2000 2002 2004 2006 2008 2010 2012 2014
10%
20%
30%
40%
50%
60%
70%
80%
90%
100%
Opportunity Share of New Entrepreneurs
Perc
ent
of N
ew E
ntre
pren
eurs
Not
Com
ing
Out
of
Une
mpl
oym
ent
(Mon
thly
Ave
rage
)
Year
Rate of New Entrepreneurs
Opportunity Share of New Entrepreneurs
Startup Density
2015Component
2014Component
2015Component
2014Component
2015Component
2014Component
0.35% 0.39%
84.9% 75.9%
174.9 177.9
Early and broad measure of business ownership. Measures the percent ofthe adult population of an area thatbecame entrepreneurs in a givenmonth.
Broad indicator of the percent ofnew entrepreneurs starting businesses because they saw marketopportunities. Measures the percentof new entrepreneurs who were notunemployed before starting their businesses.
Number of startup firms per 100,000resident population. Startup businesses here are defined as firms less than one-year old employing at least one person besides the owner.
Source: Author calculation from CPS.3-year moving average.
Source: Author calculations from CPS.3-year moving average.
Source: Author calculations from BDS/BEA.Yearly measure.

22 | 2 0 1 5 | T H E K A U F F M A N I N D E X | S T A R T U P A C T I V I T Y | S T A T E T R E N D S
1998 2000 2002 2004 2006 2008 2010 2012 2014
0.10%
0.20%
0.30%
0.40%
0.50%
0.60%
0.70%
Perc
ent
of A
dult
Popu
latio
n Be
com
ing
Entr
epre
neur
s(M
onth
ly A
vera
ge)
Year
Rate of New Entrepreneurs
Startup ActivityRank
2015 2014
5 12
1977 1982 1987 1992 1997 2002 2007 2012
50
100
150
200
250
300
350
400
450
500
Star
tups
per
100
,000
Res
iden
t Po
pula
tion
(Ann
ual)
Year
Startup Density
1998 2000 2002 2004 2006 2008 2010 2012 2014
10%
20%
30%
40%
50%
60%
70%
80%
90%
100%
Opportunity Share of New Entrepreneurs
Perc
ent
of N
ew E
ntre
pren
eurs
Not
Com
ing
Out
of
Une
mpl
oym
ent
(Mon
thly
Ave
rage
)
Year
Rate of New Entrepreneurs
Opportunity Share of New Entrepreneurs
Startup Density
2015Component
2014Component
2015Component
2014Component
2015Component
2014Component
0.40% 0.39%
79.4% 74.4%
157.4 145.6
Early and broad measure of business ownership. Measures the percent ofthe adult population of an area thatbecame entrepreneurs in a givenmonth.
Broad indicator of the percent ofnew entrepreneurs starting businesses because they saw marketopportunities. Measures the percentof new entrepreneurs who were notunemployed before starting their businesses.
Number of startup firms per 100,000resident population. Startup businesses here are defined as firms less than one-year old employing at least one person besides the owner.
Source: Author calculation from CPS.3-year moving average.
Source: Author calculations from CPS.3-year moving average.
Source: Author calculations from BDS/BEA.Yearly measure.

T H E K A U F F M A N I N D E X | S T A R T U P A C T I V I T Y | S T A T E T R E N D S | 2 0 1 5 | 23
1998 2000 2002 2004 2006 2008 2010 2012 2014
0.10%
0.20%
0.30%
0.40%
0.50%
0.60%
0.70%
Perc
ent
of A
dult
Popu
latio
n Be
com
ing
Entr
epre
neur
s(M
onth
ly A
vera
ge)
Year
Rate of New Entrepreneurs
Startup ActivityRank
2015 2014
6 10
1977 1982 1987 1992 1997 2002 2007 2012
50
100
150
200
250
300
350
400
450
500
Star
tups
per
100
,000
Res
iden
t Po
pula
tion
(Ann
ual)
Year
Startup Density
1998 2000 2002 2004 2006 2008 2010 2012 2014
10%
20%
30%
40%
50%
60%
70%
80%
90%
100%
Opportunity Share of New Entrepreneurs
Perc
ent
of N
ew E
ntre
pren
eurs
Not
Com
ing
Out
of
Une
mpl
oym
ent
(Mon
thly
Ave
rage
)
Year
Rate of New Entrepreneurs
Opportunity Share of New Entrepreneurs
Startup Density
2015Component
2014Component
2015Component
2014Component
2015Component
2014Component
0.34% 0.33%
86.9% 84.0%
166.7 153.4
Early and broad measure of business ownership. Measures the percent ofthe adult population of an area thatbecame entrepreneurs in a givenmonth.
Broad indicator of the percent ofnew entrepreneurs starting businesses because they saw marketopportunities. Measures the percentof new entrepreneurs who were notunemployed before starting their businesses.
Number of startup firms per 100,000resident population. Startup businesses here are defined as firms less than one-year old employing at least one person besides the owner.
Source: Author calculation from CPS.3-year moving average.
Source: Author calculations from CPS.3-year moving average.
Source: Author calculations from BDS/BEA.Yearly measure.

24 | 2 0 1 5 | T H E K A U F F M A N I N D E X | S T A R T U P A C T I V I T Y | S T A T E T R E N D S
1998 2000 2002 2004 2006 2008 2010 2012 2014
0.10%
0.20%
0.30%
0.40%
0.50%
0.60%
0.70%
Perc
ent
of A
dult
Popu
latio
n Be
com
ing
Entr
epre
neur
s(M
onth
ly A
vera
ge)
Year
Rate of New Entrepreneurs
Startup ActivityRank
2015 2014
7 2
1977 1982 1987 1992 1997 2002 2007 2012
50
100
150
200
250
300
350
400
450
500
Star
tups
per
100
,000
Res
iden
t Po
pula
tion
(Ann
ual)
Year
Startup Density
1998 2000 2002 2004 2006 2008 2010 2012 2014
10%
20%
30%
40%
50%
60%
70%
80%
90%
100%
Opportunity Share of New Entrepreneurs
Perc
ent
of N
ew E
ntre
pren
eurs
Not
Com
ing
Out
of
Une
mpl
oym
ent
(Mon
thly
Ave
rage
)
Year
Rate of New Entrepreneurs
Opportunity Share of New Entrepreneurs
Startup Density
2015Component
2014Component
2015Component
2014Component
2015Component
2014Component
0.45% 0.44%
74.1% 78.8%
132.8 130.1
Early and broad measure of business ownership. Measures the percent ofthe adult population of an area thatbecame entrepreneurs in a givenmonth.
Broad indicator of the percent ofnew entrepreneurs starting businesses because they saw marketopportunities. Measures the percentof new entrepreneurs who were notunemployed before starting their businesses.
Number of startup firms per 100,000resident population. Startup businesses here are defined as firms less than one-year old employing at least one person besides the owner.
Source: Author calculation from CPS.3-year moving average.
Source: Author calculations from CPS.3-year moving average.
Source: Author calculations from BDS/BEA.Yearly measure.

T H E K A U F F M A N I N D E X | S T A R T U P A C T I V I T Y | S T A T E T R E N D S | 2 0 1 5 | 25
1998 2000 2002 2004 2006 2008 2010 2012 2014
0.10%
0.20%
0.30%
0.40%
0.50%
0.60%
0.70%
Perc
ent
of A
dult
Popu
latio
n Be
com
ing
Entr
epre
neur
s(M
onth
ly A
vera
ge)
Year
Rate of New Entrepreneurs
Startup ActivityRank
2015 2014
8 4
1977 1982 1987 1992 1997 2002 2007 2012
50
100
150
200
250
300
350
400
450
500
Star
tups
per
100
,000
Res
iden
t Po
pula
tion
(Ann
ual)
Year
Startup Density
1998 2000 2002 2004 2006 2008 2010 2012 2014
10%
20%
30%
40%
50%
60%
70%
80%
90%
100%
Opportunity Share of New Entrepreneurs
Perc
ent
of N
ew E
ntre
pren
eurs
Not
Com
ing
Out
of
Une
mpl
oym
ent
(Mon
thly
Ave
rage
)
Year
Rate of New Entrepreneurs
Opportunity Share of New Entrepreneurs
Startup Density
2015Component
2014Component
2015Component
2014Component
2015Component
2014Component
0.33% 0.37%
90.3% 85.2%
146.2 143.9
Early and broad measure of business ownership. Measures the percent ofthe adult population of an area thatbecame entrepreneurs in a givenmonth.
Broad indicator of the percent ofnew entrepreneurs starting businesses because they saw marketopportunities. Measures the percentof new entrepreneurs who were notunemployed before starting their businesses.
Number of startup firms per 100,000resident population. Startup businesses here are defined as firms less than one-year old employing at least one person besides the owner.
Source: Author calculation from CPS.3-year moving average.
Source: Author calculations from CPS.3-year moving average.
Source: Author calculations from BDS/BEA.Yearly measure.

26 | 2 0 1 5 | T H E K A U F F M A N I N D E X | S T A R T U P A C T I V I T Y | S T A T E T R E N D S
1998 2000 2002 2004 2006 2008 2010 2012 2014
0.10%
0.20%
0.30%
0.40%
0.50%
0.60%
0.70%
Perc
ent
of A
dult
Popu
latio
n Be
com
ing
Entr
epre
neur
s(M
onth
ly A
vera
ge)
Year
Rate of New Entrepreneurs
Startup ActivityRank
2015 2014
9 8
1977 1982 1987 1992 1997 2002 2007 2012
50
100
150
200
250
300
350
400
450
500
Star
tups
per
100
,000
Res
iden
t Po
pula
tion
(Ann
ual)
Year
Startup Density
1998 2000 2002 2004 2006 2008 2010 2012 2014
10%
20%
30%
40%
50%
60%
70%
80%
90%
100%
Opportunity Share of New Entrepreneurs
Perc
ent
of N
ew E
ntre
pren
eurs
Not
Com
ing
Out
of
Une
mpl
oym
ent
(Mon
thly
Ave
rage
)
Year
Rate of New Entrepreneurs
Opportunity Share of New Entrepreneurs
Startup Density
2015Component
2014Component
2015Component
2014Component
2015Component
2014Component
0.35% 0.36%
80.3% 77.3%
188.7 186.8
Early and broad measure of business ownership. Measures the percent ofthe adult population of an area thatbecame entrepreneurs in a givenmonth.
Broad indicator of the percent ofnew entrepreneurs starting businesses because they saw marketopportunities. Measures the percentof new entrepreneurs who were notunemployed before starting their businesses.
Number of startup firms per 100,000resident population. Startup businesses here are defined as firms less than one-year old employing at least one person besides the owner.
Source: Author calculation from CPS.3-year moving average.
Source: Author calculations from CPS.3-year moving average.
Source: Author calculations from BDS/BEA.Yearly measure.
T H E K A U F F M A N I N D E X | S T A R T U P A C T I V I T Y | S T A T E T R E N D S | 2 0 1 5 | 27
1998 2000 2002 2004 2006 2008 2010 2012 2014
0.10%
0.20%
0.30%
0.40%
0.50%
0.60%
0.70%
Perc
ent
of A
dult
Popu
latio
n Be
com
ing
Entr
epre
neur
s(M
onth
ly A
vera
ge)
Year
Rate of New Entrepreneurs
Startup ActivityRank
2015 2014
10 21
1977 1982 1987 1992 1997 2002 2007 2012
50
100
150
200
250
300
350
400
450
500
Star
tups
per
100
,000
Res
iden
t Po
pula
tion
(Ann
ual)
Year
Startup Density
1998 2000 2002 2004 2006 2008 2010 2012 2014
10%
20%
30%
40%
50%
60%
70%
80%
90%
100%
Opportunity Share of New Entrepreneurs
Perc
ent
of N
ew E
ntre
pren
eurs
Not
Com
ing
Out
of
Une
mpl
oym
ent
(Mon
thly
Ave
rage
)
Year
Rate of New Entrepreneurs
Opportunity Share of New Entrepreneurs
Startup Density
2015Component
2014Component
2015Component
2014Component
2015Component
2014Component
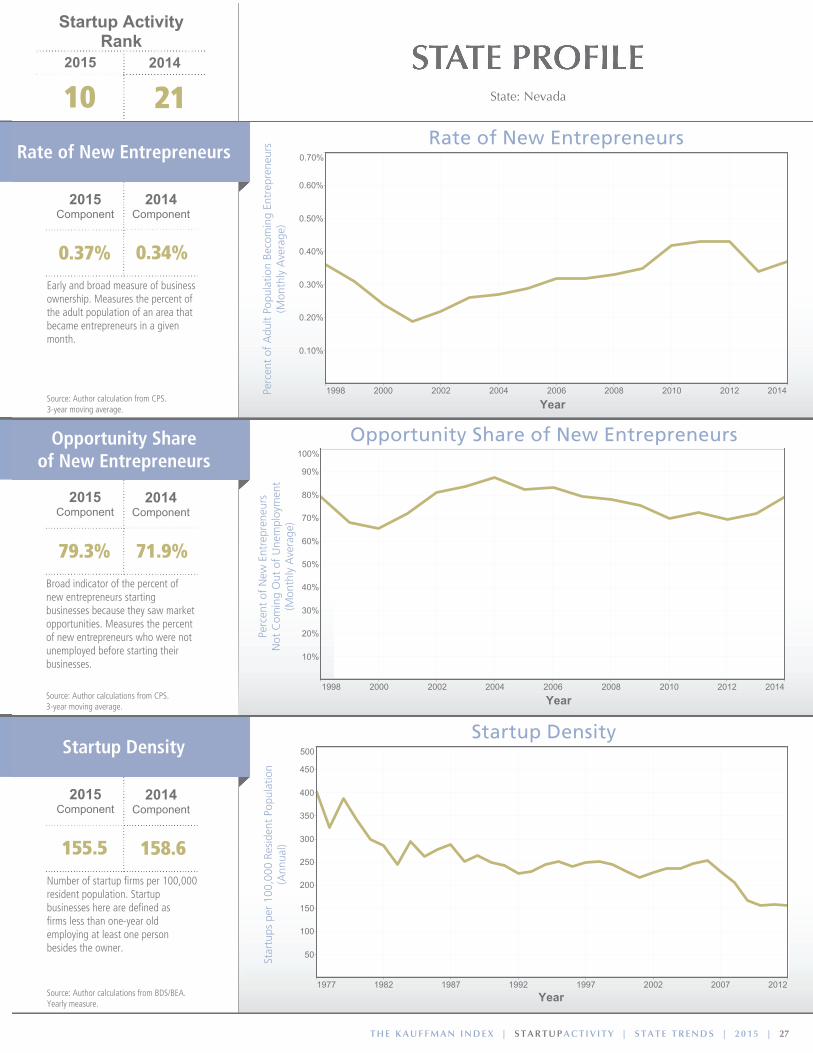
0.37% 0.34%
79.3% 71.9%
155.5 158.6
Early and broad measure of business ownership. Measures the percent ofthe adult population of an area thatbecame entrepreneurs in a givenmonth.
Broad indicator of the percent ofnew entrepreneurs starting businesses because they saw marketopportunities. Measures the percentof new entrepreneurs who were notunemployed before starting their businesses.
Number of startup firms per 100,000resident population. Startup businesses here are defined as firms less than one-year old employing at least one person besides the owner.
Source: Author calculation from CPS.3-year moving average.
Source: Author calculations from CPS.3-year moving average.
Source: Author calculations from BDS/BEA.Yearly measure.

28 | 2 0 1 5 | T H E K A U F F M A N I N D E X | S T A R T U P A C T I V I T Y | S T A T E T R E N D S
1998 2000 2002 2004 2006 2008 2010 2012 2014
0.10%
0.20%
0.30%
0.40%
0.50%
0.60%
0.70%
Perc
ent
of A
dult
Popu
latio
n Be
com
ing
Entr
epre
neur
s(M
onth
ly A
vera
ge)
Year
Rate of New Entrepreneurs
Startup ActivityRank
2015 2014
11 9
1977 1982 1987 1992 1997 2002 2007 2012
50
100
150
200
250
300
350
400
450
500
Star
tups
per
100
,000
Res
iden
t Po
pula
tion
(Ann
ual)
Year
Startup Density
1998 2000 2002 2004 2006 2008 2010 2012 2014
10%
20%
30%
40%
50%
60%
70%
80%
90%
100%
Opportunity Share of New Entrepreneurs
Perc
ent
of N
ew E
ntre
pren
eurs
Not
Com
ing
Out
of
Une
mpl
oym
ent
(Mon
thly
Ave
rage
)
Year
Rate of New Entrepreneurs
Opportunity Share of New Entrepreneurs
Startup Density
2015Component
2014Component
2015Component
2014Component
2015Component
2014Component
0.33% 0.34%
81.8% 81.3%
177.7 178.4
Early and broad measure of business ownership. Measures the percent ofthe adult population of an area thatbecame entrepreneurs in a givenmonth.
Broad indicator of the percent ofnew entrepreneurs starting businesses because they saw marketopportunities. Measures the percentof new entrepreneurs who were notunemployed before starting their businesses.
Number of startup firms per 100,000resident population. Startup businesses here are defined as firms less than one-year old employing at least one person besides the owner.
Source: Author calculation from CPS.3-year moving average.
Source: Author calculations from CPS.3-year moving average.
Source: Author calculations from BDS/BEA.Yearly measure.

T H E K A U F F M A N I N D E X | S T A R T U P A C T I V I T Y | S T A T E T R E N D S | 2 0 1 5 | 29
1998 2000 2002 2004 2006 2008 2010 2012 2014
0.10%
0.20%
0.30%
0.40%
0.50%
0.60%
0.70%
Perc
ent
of A
dult
Popu
latio
n Be
com
ing
Entr
epre
neur
s(M
onth
ly A
vera
ge)
Year
Rate of New Entrepreneurs
Startup ActivityRank
2015 2014
12 14
1977 1982 1987 1992 1997 2002 2007 2012
50
100
150
200
250
300
350
400
450
500
Star
tups
per
100
,000
Res
iden
t Po
pula
tion
(Ann
ual)
Year
Startup Density
1998 2000 2002 2004 2006 2008 2010 2012 2014
10%
20%
30%
40%
50%
60%
70%
80%
90%
100%
Opportunity Share of New Entrepreneurs
Perc
ent
of N
ew E
ntre
pren
eurs
Not
Com
ing
Out
of
Une
mpl
oym
ent
(Mon
thly
Ave
rage
)
Year
Rate of New Entrepreneurs
Opportunity Share of New Entrepreneurs
Startup Density
2015Component
2014Component
2015Component
2014Component
2015Component
2014Component
0.35% 0.31%
88.9% 90.1%
97.55 100.4
Early and broad measure of business ownership. Measures the percent ofthe adult population of an area thatbecame entrepreneurs in a givenmonth.
Broad indicator of the percent ofnew entrepreneurs starting businesses because they saw marketopportunities. Measures the percentof new entrepreneurs who were notunemployed before starting their businesses.
Number of startup firms per 100,000resident population. Startup businesses here are defined as firms less than one-year old employing at least one person besides the owner.
Source: Author calculation from CPS.3-year moving average.
Source: Author calculations from CPS.3-year moving average.
Source: Author calculations from BDS/BEA.Yearly measure.

30 | 2 0 1 5 | T H E K A U F F M A N I N D E X | S T A R T U P A C T I V I T Y | S T A T E T R E N D S
1998 2000 2002 2004 2006 2008 2010 2012 2014
0.10%
0.20%
0.30%
0.40%
0.50%
0.60%
0.70%
Perc
ent
of A
dult
Popu
latio
n Be
com
ing
Entr
epre
neur
s(M
onth
ly A
vera
ge)
Year
Rate of New Entrepreneurs
Startup ActivityRank
2015 2014
13 11
1977 1982 1987 1992 1997 2002 2007 2012
50
100
150
200
250
300
350
400
450
500
Star
tups
per
100
,000
Res
iden
t Po
pula
tion
(Ann
ual)
Year
Startup Density
1998 2000 2002 2004 2006 2008 2010 2012 2014
10%
20%
30%
40%
50%
60%
70%
80%
90%
100%
Opportunity Share of New Entrepreneurs
Perc
ent
of N
ew E
ntre
pren
eurs
Not
Com
ing
Out
of
Une
mpl
oym
ent
(Mon
thly
Ave
rage
)
Year
Rate of New Entrepreneurs
Opportunity Share of New Entrepreneurs
Startup Density
2015Component
2014Component
2015Component
2014Component
2015Component
2014Component
0.33% 0.35%
89.2% 86.1%
112.7 107.9
Early and broad measure of business ownership. Measures the percent ofthe adult population of an area thatbecame entrepreneurs in a givenmonth.
Broad indicator of the percent ofnew entrepreneurs starting businesses because they saw marketopportunities. Measures the percentof new entrepreneurs who were notunemployed before starting their businesses.
Number of startup firms per 100,000resident population. Startup businesses here are defined as firms less than one-year old employing at least one person besides the owner.
Source: Author calculation from CPS.3-year moving average.
Source: Author calculations from CPS.3-year moving average.
Source: Author calculations from BDS/BEA.Yearly measure.

T H E K A U F F M A N I N D E X | S T A R T U P A C T I V I T Y | S T A T E T R E N D S | 2 0 1 5 | 31
1998 2000 2002 2004 2006 2008 2010 2012 2014
0.10%
0.20%
0.30%
0.40%
0.50%
0.60%
0.70%
Perc
ent
of A
dult
Popu
latio
n Be
com
ing
Entr
epre
neur
s(M
onth
ly A
vera
ge)
Year
Rate of New Entrepreneurs
Startup ActivityRank
2015 2014
14 5
1977 1982 1987 1992 1997 2002 2007 2012
50
100
150
200
250
300
350
400
450
500
Star
tups
per
100
,000
Res
iden
t Po
pula
tion
(Ann
ual)
Year
Startup Density
1998 2000 2002 2004 2006 2008 2010 2012 2014
10%
20%
30%
40%
50%
60%
70%
80%
90%
100%
Opportunity Share of New Entrepreneurs
Perc
ent
of N
ew E
ntre
pren
eurs
Not
Com
ing
Out
of
Une
mpl
oym
ent
(Mon
thly
Ave
rage
)
Year
Rate of New Entrepreneurs
Opportunity Share of New Entrepreneurs
Startup Density
2015Component
2014Component
2015Component
2014Component
2015Component
2014Component
0.39% 0.42%
76.0% 77.2%
140.6 137.1
Early and broad measure of business ownership. Measures the percent ofthe adult population of an area thatbecame entrepreneurs in a givenmonth.
Broad indicator of the percent ofnew entrepreneurs starting businesses because they saw marketopportunities. Measures the percentof new entrepreneurs who were notunemployed before starting their businesses.
Number of startup firms per 100,000resident population. Startup businesses here are defined as firms less than one-year old employing at least one person besides the owner.
Source: Author calculation from CPS.3-year moving average.
Source: Author calculations from CPS.3-year moving average.
Source: Author calculations from BDS/BEA.Yearly measure.
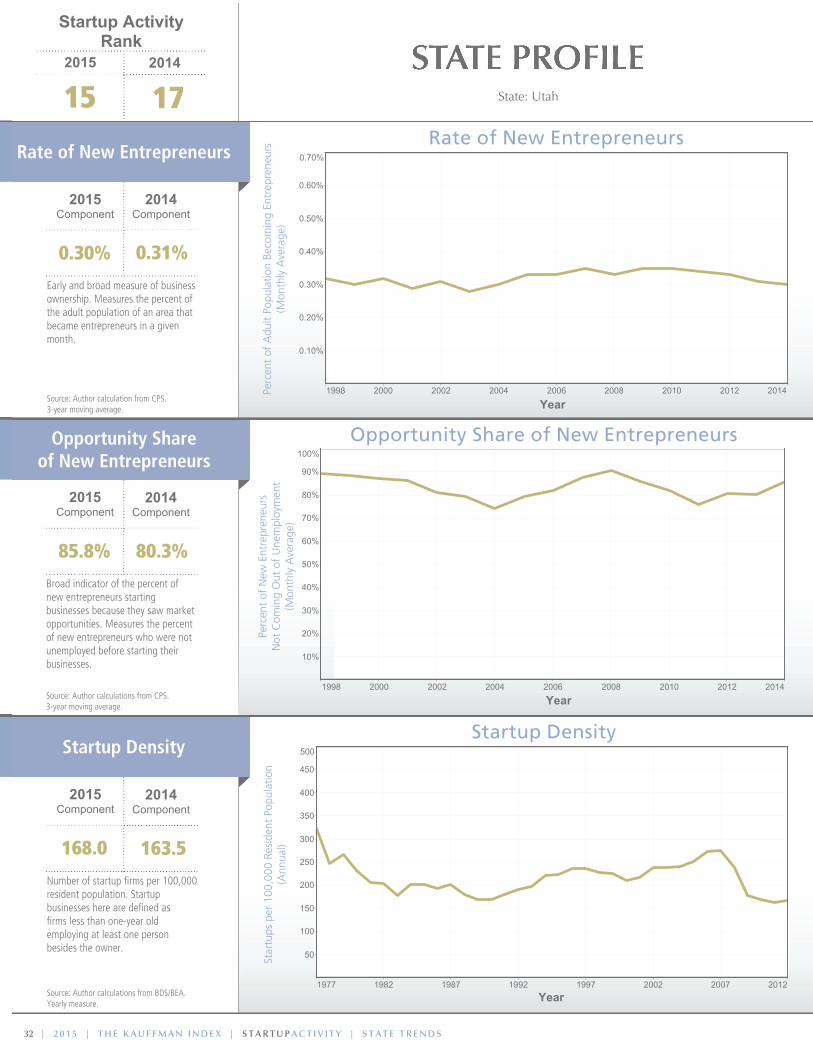
32 | 2 0 1 5 | T H E K A U F F M A N I N D E X | S T A R T U P A C T I V I T Y | S T A T E T R E N D S
1998 2000 2002 2004 2006 2008 2010 2012 2014
0.10%
0.20%
0.30%
0.40%
0.50%
0.60%
0.70%
Perc
ent
of A
dult
Popu
latio
n Be
com
ing
Entr
epre
neur
s(M
onth
ly A
vera
ge)
Year
Rate of New Entrepreneurs
Startup ActivityRank
2015 2014
15 17
1977 1982 1987 1992 1997 2002 2007 2012
50
100
150
200
250
300
350
400
450
500
Star
tups
per
100
,000
Res
iden
t Po
pula
tion
(Ann
ual)
Year
Startup Density
1998 2000 2002 2004 2006 2008 2010 2012 2014
10%
20%
30%
40%
50%
60%
70%
80%
90%
100%
Opportunity Share of New Entrepreneurs
Perc
ent
of N
ew E
ntre
pren
eurs
Not
Com
ing
Out
of
Une
mpl
oym
ent
(Mon
thly
Ave
rage
)
Year
Rate of New Entrepreneurs
Opportunity Share of New Entrepreneurs
Startup Density
2015Component
2014Component
2015Component
2014Component
2015Component
2014Component
0.30% 0.31%
85.8% 80.3%
168.0 163.5
Early and broad measure of business ownership. Measures the percent ofthe adult population of an area thatbecame entrepreneurs in a givenmonth.
Broad indicator of the percent ofnew entrepreneurs starting businesses because they saw marketopportunities. Measures the percentof new entrepreneurs who were notunemployed before starting their businesses.
Number of startup firms per 100,000resident population. Startup businesses here are defined as firms less than one-year old employing at least one person besides the owner.
Source: Author calculation from CPS.3-year moving average.
Source: Author calculations from CPS.3-year moving average.
Source: Author calculations from BDS/BEA.Yearly measure.
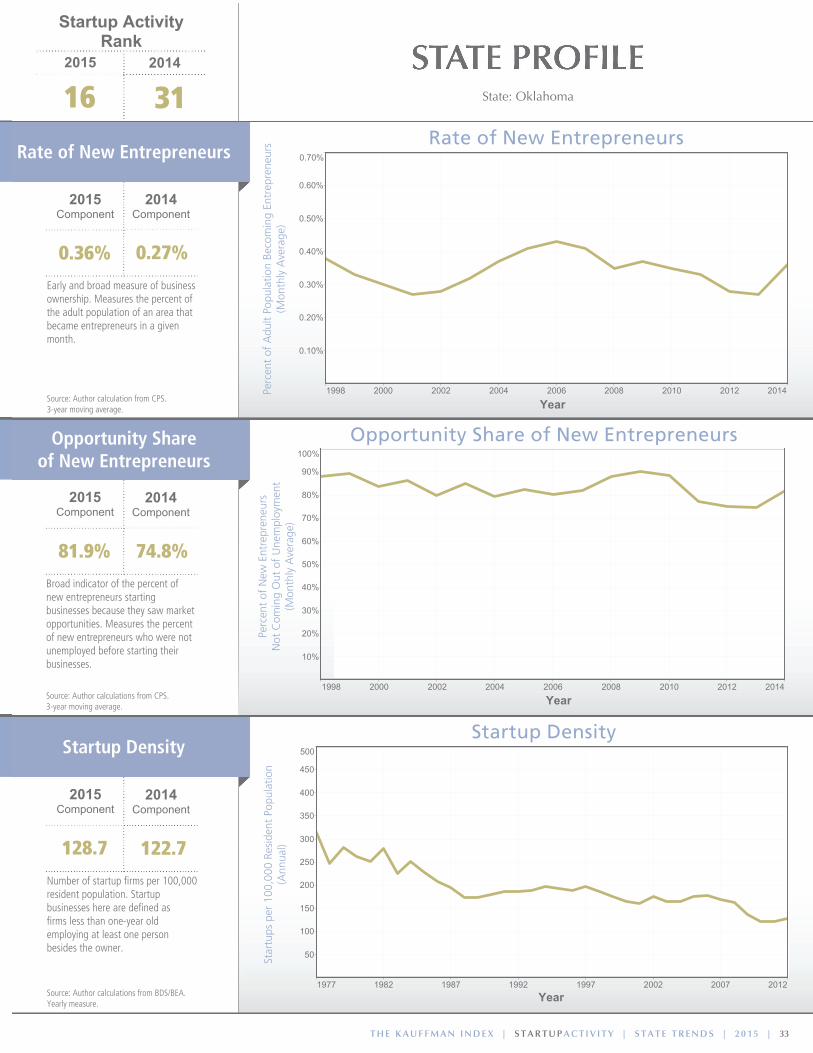
T H E K A U F F M A N I N D E X | S T A R T U P A C T I V I T Y | S T A T E T R E N D S | 2 0 1 5 | 33
1998 2000 2002 2004 2006 2008 2010 2012 2014
0.10%
0.20%
0.30%
0.40%
0.50%
0.60%
0.70%
Perc
ent
of A
dult
Popu
latio
n Be
com
ing
Entr
epre
neur
s(M
onth
ly A
vera
ge)
Year
Rate of New Entrepreneurs
Startup ActivityRank
2015 2014
16 31
1977 1982 1987 1992 1997 2002 2007 2012
50
100
150
200
250
300
350
400
450
500
Star
tups
per
100
,000
Res
iden
t Po
pula
tion
(Ann
ual)
Year
Startup Density
1998 2000 2002 2004 2006 2008 2010 2012 2014
10%
20%
30%
40%
50%
60%
70%
80%
90%
100%
Opportunity Share of New Entrepreneurs
Perc
ent
of N
ew E
ntre
pren
eurs
Not
Com
ing
Out
of
Une
mpl
oym
ent
(Mon
thly
Ave
rage
)
Year
Rate of New Entrepreneurs
Opportunity Share of New Entrepreneurs
Startup Density
2015Component
2014Component
2015Component
2014Component
2015Component
2014Component
0.36% 0.27%
81.9% 74.8%
128.7 122.7
Early and broad measure of business ownership. Measures the percent ofthe adult population of an area thatbecame entrepreneurs in a givenmonth.
Broad indicator of the percent ofnew entrepreneurs starting businesses because they saw marketopportunities. Measures the percentof new entrepreneurs who were notunemployed before starting their businesses.
Number of startup firms per 100,000resident population. Startup businesses here are defined as firms less than one-year old employing at least one person besides the owner.
Source: Author calculation from CPS.3-year moving average.
Source: Author calculations from CPS.3-year moving average.
Source: Author calculations from BDS/BEA.Yearly measure.

34 | 2 0 1 5 | T H E K A U F F M A N I N D E X | S T A R T U P A C T I V I T Y | S T A T E T R E N D S
1998 2000 2002 2004 2006 2008 2010 2012 2014
0.10%
0.20%
0.30%
0.40%
0.50%
0.60%
0.70%
Perc
ent
of A
dult
Popu
latio
n Be
com
ing
Entr
epre
neur
s(M
onth
ly A
vera
ge)
Year
Rate of New Entrepreneurs
Startup ActivityRank
2015 2014
17 13
1977 1982 1987 1992 1997 2002 2007 2012
50
100
150
200
250
300
350
400
450
500
Star
tups
per
100
,000
Res
iden
t Po
pula
tion
(Ann
ual)
Year
Startup Density
1998 2000 2002 2004 2006 2008 2010 2012 2014
10%
20%
30%
40%
50%
60%
70%
80%
90%
100%
Opportunity Share of New Entrepreneurs
Perc
ent
of N
ew E
ntre
pren
eurs
Not
Com
ing
Out
of
Une
mpl
oym
ent
(Mon
thly
Ave
rage
)
Year
Rate of New Entrepreneurs
Opportunity Share of New Entrepreneurs
Startup Density
2015Component
2014Component
2015Component
2014Component
2015Component
2014Component
0.36% 0.37%
80.6% 77.9%
130.4 126.5
Early and broad measure of business ownership. Measures the percent ofthe adult population of an area thatbecame entrepreneurs in a givenmonth.
Broad indicator of the percent ofnew entrepreneurs starting businesses because they saw marketopportunities. Measures the percentof new entrepreneurs who were notunemployed before starting their businesses.
Number of startup firms per 100,000resident population. Startup businesses here are defined as firms less than one-year old employing at least one person besides the owner.
Source: Author calculation from CPS.3-year moving average.
Source: Author calculations from CPS.3-year moving average.
Source: Author calculations from BDS/BEA.Yearly measure.

T H E K A U F F M A N I N D E X | S T A R T U P A C T I V I T Y | S T A T E T R E N D S | 2 0 1 5 | 35
1998 2000 2002 2004 2006 2008 2010 2012 2014
0.10%
0.20%
0.30%
0.40%
0.50%
0.60%
0.70%
Perc
ent
of A
dult
Popu
latio
n Be
com
ing
Entr
epre
neur
s(M
onth
ly A
vera
ge)
Year
Rate of New Entrepreneurs
Startup ActivityRank
2015 2014
18 16
1977 1982 1987 1992 1997 2002 2007 2012
50
100
150
200
250
300
350
400
450
500
Star
tups
per
100
,000
Res
iden
t Po
pula
tion
(Ann
ual)
Year
Startup Density
1998 2000 2002 2004 2006 2008 2010 2012 2014
10%
20%
30%
40%
50%
60%
70%
80%
90%
100%
Opportunity Share of New Entrepreneurs
Perc
ent
of N
ew E
ntre
pren
eurs
Not
Com
ing
Out
of
Une
mpl
oym
ent
(Mon
thly
Ave
rage
)
Year
Rate of New Entrepreneurs
Opportunity Share of New Entrepreneurs
Startup Density
2015Component
2014Component
2015Component
2014Component
2015Component
2014Component
0.40% 0.37%
74.2% 79.5%
110.0 104.7
Early and broad measure of business ownership. Measures the percent ofthe adult population of an area thatbecame entrepreneurs in a givenmonth.
Broad indicator of the percent ofnew entrepreneurs starting businesses because they saw marketopportunities. Measures the percentof new entrepreneurs who were notunemployed before starting their businesses.
Number of startup firms per 100,000resident population. Startup businesses here are defined as firms less than one-year old employing at least one person besides the owner.
Source: Author calculation from CPS.3-year moving average.
Source: Author calculations from CPS.3-year moving average.
Source: Author calculations from BDS/BEA.Yearly measure.

36 | 2 0 1 5 | T H E K A U F F M A N I N D E X | S T A R T U P A C T I V I T Y | S T A T E T R E N D S
1998 2000 2002 2004 2006 2008 2010 2012 2014
0.10%
0.20%
0.30%
0.40%
0.50%
0.60%
0.70%
Perc
ent
of A
dult
Popu
latio
n Be
com
ing
Entr
epre
neur
s(M
onth
ly A
vera
ge)
Year
Rate of New Entrepreneurs
Startup ActivityRank
2015 2014
19 19
1977 1982 1987 1992 1997 2002 2007 2012
50
100
150
200
250
300
350
400
450
500
Star
tups
per
100
,000
Res
iden
t Po
pula
tion
(Ann
ual)
Year
Startup Density
1998 2000 2002 2004 2006 2008 2010 2012 2014
10%
20%
30%
40%
50%
60%
70%
80%
90%
100%
Opportunity Share of New Entrepreneurs
Perc
ent
of N
ew E
ntre
pren
eurs
Not
Com
ing
Out
of
Une
mpl
oym
ent
(Mon
thly
Ave
rage
)
Year
Rate of New Entrepreneurs
Opportunity Share of New Entrepreneurs
Startup Density
2015Component
2014Component
2015Component
2014Component
2015Component
2014Component
0.29% 0.28%
83.6% 87.3%
137.6 134.7
Early and broad measure of business ownership. Measures the percent ofthe adult population of an area thatbecame entrepreneurs in a givenmonth.
Broad indicator of the percent ofnew entrepreneurs starting businesses because they saw marketopportunities. Measures the percentof new entrepreneurs who were notunemployed before starting their businesses.
Number of startup firms per 100,000resident population. Startup businesses here are defined as firms less than one-year old employing at least one person besides the owner.
Source: Author calculation from CPS.3-year moving average.
Source: Author calculations from CPS.3-year moving average.
Source: Author calculations from BDS/BEA.Yearly measure.

T H E K A U F F M A N I N D E X | S T A R T U P A C T I V I T Y | S T A T E T R E N D S | 2 0 1 5 | 37
1998 2000 2002 2004 2006 2008 2010 2012 2014
0.10%
0.20%
0.30%
0.40%
0.50%
0.60%
0.70%
Perc
ent
of A
dult
Popu
latio
n Be
com
ing
Entr
epre
neur
s(M
onth
ly A
vera
ge)
Year
Rate of New Entrepreneurs
Startup ActivityRank
2015 2014
20 23
1977 1982 1987 1992 1997 2002 2007 2012
50
100
150
200
250
300
350
400
450
500
Star
tups
per
100
,000
Res
iden
t Po
pula
tion
(Ann
ual)
Year
Startup Density
1998 2000 2002 2004 2006 2008 2010 2012 2014
10%
20%
30%
40%
50%
60%
70%
80%
90%
100%
Opportunity Share of New Entrepreneurs
Perc
ent
of N
ew E
ntre
pren
eurs
Not
Com
ing
Out
of
Une
mpl
oym
ent
(Mon
thly
Ave
rage
)
Year
Rate of New Entrepreneurs
Opportunity Share of New Entrepreneurs
Startup Density
2015Component
2014Component
2015Component
2014Component
2015Component
2014Component
0.25% 0.25%
88.7% 86.0%
135.0 130.9
Early and broad measure of business ownership. Measures the percent ofthe adult population of an area thatbecame entrepreneurs in a givenmonth.
Broad indicator of the percent ofnew entrepreneurs starting businesses because they saw marketopportunities. Measures the percentof new entrepreneurs who were notunemployed before starting their businesses.
Number of startup firms per 100,000resident population. Startup businesses here are defined as firms less than one-year old employing at least one person besides the owner.
Source: Author calculation from CPS.3-year moving average.
Source: Author calculations from CPS.3-year moving average.
Source: Author calculations from BDS/BEA.Yearly measure.

38 | 2 0 1 5 | T H E K A U F F M A N I N D E X | S T A R T U P A C T I V I T Y | S T A T E T R E N D S
1998 2000 2002 2004 2006 2008 2010 2012 2014
0.10%
0.20%
0.30%
0.40%
0.50%
0.60%
0.70%
Perc
ent
of A
dult
Popu
latio
n Be
com
ing
Entr
epre
neur
s(M
onth
ly A
vera
ge)
Year
Rate of New Entrepreneurs
Startup ActivityRank
2015 2014
21 20
1977 1982 1987 1992 1997 2002 2007 2012
50
100
150
200
250
300
350
400
450
500
Star
tups
per
100
,000
Res
iden
t Po
pula
tion
(Ann
ual)
Year
Startup Density
1998 2000 2002 2004 2006 2008 2010 2012 2014
10%
20%
30%
40%
50%
60%
70%
80%
90%
100%
Opportunity Share of New Entrepreneurs
Perc
ent
of N
ew E
ntre
pren
eurs
Not
Com
ing
Out
of
Une
mpl
oym
ent
(Mon
thly
Ave
rage
)
Year
Rate of New Entrepreneurs
Opportunity Share of New Entrepreneurs
Startup Density
2015Component
2014Component
2015Component
2014Component
2015Component
2014Component
0.31% 0.36%
80.9% 75.0%
117.4 121.1
Early and broad measure of business ownership. Measures the percent ofthe adult population of an area thatbecame entrepreneurs in a givenmonth.
Broad indicator of the percent ofnew entrepreneurs starting businesses because they saw marketopportunities. Measures the percentof new entrepreneurs who were notunemployed before starting their businesses.
Number of startup firms per 100,000resident population. Startup businesses here are defined as firms less than one-year old employing at least one person besides the owner.
Source: Author calculation from CPS.3-year moving average.
Source: Author calculations from CPS.3-year moving average.
Source: Author calculations from BDS/BEA.Yearly measure.

T H E K A U F F M A N I N D E X | S T A R T U P A C T I V I T Y | S T A T E T R E N D S | 2 0 1 5 | 39
1998 2000 2002 2004 2006 2008 2010 2012 2014
0.10%
0.20%
0.30%
0.40%
0.50%
0.60%
0.70%
Perc
ent
of A
dult
Popu
latio
n Be
com
ing
Entr
epre
neur
s(M
onth
ly A
vera
ge)
Year
Rate of New Entrepreneurs
Startup ActivityRank
2015 2014
22 22
1977 1982 1987 1992 1997 2002 2007 2012
50
100
150
200
250
300
350
400
450
500
Star
tups
per
100
,000
Res
iden
t Po
pula
tion
(Ann
ual)
Year
Startup Density
1998 2000 2002 2004 2006 2008 2010 2012 2014
10%
20%
30%
40%
50%
60%
70%
80%
90%
100%
Opportunity Share of New Entrepreneurs
Perc
ent
of N
ew E
ntre
pren
eurs
Not
Com
ing
Out
of
Une
mpl
oym
ent
(Mon
thly
Ave
rage
)
Year
Rate of New Entrepreneurs
Opportunity Share of New Entrepreneurs
Startup Density
2015Component
2014Component
2015Component
2014Component
2015Component
2014Component
0.34% 0.31%
79.7% 83.2%
88.43 90.13
Early and broad measure of business ownership. Measures the percent ofthe adult population of an area thatbecame entrepreneurs in a givenmonth.
Broad indicator of the percent ofnew entrepreneurs starting businesses because they saw marketopportunities. Measures the percentof new entrepreneurs who were notunemployed before starting their businesses.
Number of startup firms per 100,000resident population. Startup businesses here are defined as firms less than one-year old employing at least one person besides the owner.
Source: Author calculation from CPS.3-year moving average.
Source: Author calculations from CPS.3-year moving average.
Source: Author calculations from BDS/BEA.Yearly measure.

40 | 2 0 1 5 | T H E K A U F F M A N I N D E X | S T A R T U P A C T I V I T Y | S T A T E T R E N D S
1998 2000 2002 2004 2006 2008 2010 2012 2014
0.10%
0.20%
0.30%
0.40%
0.50%
0.60%
0.70%
Perc
ent
of A
dult
Popu
latio
n Be
com
ing
Entr
epre
neur
s(M
onth
ly A
vera
ge)
Year
Rate of New Entrepreneurs
Startup ActivityRank
2015 2014
23 15
1977 1982 1987 1992 1997 2002 2007 2012
50
100
150
200
250
300
350
400
450
500
Star
tups
per
100
,000
Res
iden
t Po
pula
tion
(Ann
ual)
Year
Startup Density
1998 2000 2002 2004 2006 2008 2010 2012 2014
10%
20%
30%
40%
50%
60%
70%
80%
90%
100%
Opportunity Share of New Entrepreneurs
Perc
ent
of N
ew E
ntre
pren
eurs
Not
Com
ing
Out
of
Une
mpl
oym
ent
(Mon
thly
Ave
rage
)
Year
Rate of New Entrepreneurs
Opportunity Share of New Entrepreneurs
Startup Density
2015Component
2014Component
2015Component
2014Component
2015Component
2014Component
0.29% 0.34%
80.4% 80.4%
133.8 135.8
Early and broad measure of business ownership. Measures the percent ofthe adult population of an area thatbecame entrepreneurs in a givenmonth.
Broad indicator of the percent ofnew entrepreneurs starting businesses because they saw marketopportunities. Measures the percentof new entrepreneurs who were notunemployed before starting their businesses.
Number of startup firms per 100,000resident population. Startup businesses here are defined as firms less than one-year old employing at least one person besides the owner.
Source: Author calculation from CPS.3-year moving average.
Source: Author calculations from CPS.3-year moving average.
Source: Author calculations from BDS/BEA.Yearly measure.

T H E K A U F F M A N I N D E X | S T A R T U P A C T I V I T Y | S T A T E T R E N D S | 2 0 1 5 | 41
1998 2000 2002 2004 2006 2008 2010 2012 2014
0.10%
0.20%
0.30%
0.40%
0.50%
0.60%
0.70%
Perc
ent
of A
dult
Popu
latio
n Be
com
ing
Entr
epre
neur
s(M
onth
ly A
vera
ge)
Year
Rate of New Entrepreneurs
Startup ActivityRank
2015 2014
24 29
1977 1982 1987 1992 1997 2002 2007 2012
50
100
150
200
250
300
350
400
450
500
Star
tups
per
100
,000
Res
iden
t Po
pula
tion
(Ann
ual)
Year
Startup Density
1998 2000 2002 2004 2006 2008 2010 2012 2014
10%
20%
30%
40%
50%
60%
70%
80%
90%
100%
Opportunity Share of New Entrepreneurs
Perc
ent
of N
ew E
ntre
pren
eurs
Not
Com
ing
Out
of
Une
mpl
oym
ent
(Mon
thly
Ave
rage
)
Year
Rate of New Entrepreneurs
Opportunity Share of New Entrepreneurs
Startup Density
2015Component
2014Component
2015Component
2014Component
2015Component
2014Component
0.31% 0.29%
79.2% 75.5%
115.9 116.5
Early and broad measure of business ownership. Measures the percent ofthe adult population of an area thatbecame entrepreneurs in a givenmonth.
Broad indicator of the percent ofnew entrepreneurs starting businesses because they saw marketopportunities. Measures the percentof new entrepreneurs who were notunemployed before starting their businesses.
Number of startup firms per 100,000resident population. Startup businesses here are defined as firms less than one-year old employing at least one person besides the owner.
Source: Author calculation from CPS.3-year moving average.
Source: Author calculations from CPS.3-year moving average.
Source: Author calculations from BDS/BEA.Yearly measure.

42 | 2 0 1 5 | T H E K A U F F M A N I N D E X | S T A R T U P A C T I V I T Y | S T A T E T R E N D S
1998 2000 2002 2004 2006 2008 2010 2012 2014
0.10%
0.20%
0.30%
0.40%
0.50%
0.60%
0.70%
Perc
ent
of A
dult
Popu
latio
n Be
com
ing
Entr
epre
neur
s(M
onth
ly A
vera
ge)
Year
Rate of New Entrepreneurs
Startup ActivityRank
2015 2014
25 25
1977 1982 1987 1992 1997 2002 2007 2012
50
100
150
200
250
300
350
400
450
500
Star
tups
per
100
,000
Res
iden
t Po
pula
tion
(Ann
ual)
Year
Startup Density
1998 2000 2002 2004 2006 2008 2010 2012 2014
10%
20%
30%
40%
50%
60%
70%
80%
90%
100%
Opportunity Share of New Entrepreneurs
Perc
ent
of N
ew E
ntre
pren
eurs
Not
Com
ing
Out
of
Une
mpl
oym
ent
(Mon
thly
Ave
rage
)
Year
Rate of New Entrepreneurs
Opportunity Share of New Entrepreneurs
Startup Density
2015Component
2014Component
2015Component
2014Component
2015Component
2014Component
0.22% 0.23%
90.1% 90.0%
118.6 116.4
Early and broad measure of business ownership. Measures the percent ofthe adult population of an area thatbecame entrepreneurs in a givenmonth.
Broad indicator of the percent ofnew entrepreneurs starting businesses because they saw marketopportunities. Measures the percentof new entrepreneurs who were notunemployed before starting their businesses.
Number of startup firms per 100,000resident population. Startup businesses here are defined as firms less than one-year old employing at least one person besides the owner.
Source: Author calculation from CPS.3-year moving average.
Source: Author calculations from CPS.3-year moving average.
Source: Author calculations from BDS/BEA.Yearly measure.

T H E K A U F F M A N I N D E X | S T A R T U P A C T I V I T Y | S T A T E T R E N D S | 2 0 1 5 | 43
1998 2000 2002 2004 2006 2008 2010 2012 2014
0.10%
0.20%
0.30%
0.40%
0.50%
0.60%
0.70%
Perc
ent
of A
dult
Popu
latio
n Be
com
ing
Entr
epre
neur
s(M
onth
ly A
vera
ge)
Year
Rate of New Entrepreneurs
Startup ActivityRank
2015 2014
26 35
1977 1982 1987 1992 1997 2002 2007 2012
50
100
150
200
250
300
350
400
450
500
Star
tups
per
100
,000
Res
iden
t Po
pula
tion
(Ann
ual)
Year
Startup Density
1998 2000 2002 2004 2006 2008 2010 2012 2014
10%
20%
30%
40%
50%
60%
70%
80%
90%
100%
Opportunity Share of New Entrepreneurs
Perc
ent
of N
ew E
ntre
pren
eurs
Not
Com
ing
Out
of
Une
mpl
oym
ent
(Mon
thly
Ave
rage
)
Year
Rate of New Entrepreneurs
Opportunity Share of New Entrepreneurs
Startup Density
2015Component
2014Component
2015Component
2014Component
2015Component
2014Component
0.22% 0.20%
86.4% 81.0%
126.4 127.2
Early and broad measure of business ownership. Measures the percent ofthe adult population of an area thatbecame entrepreneurs in a givenmonth.
Broad indicator of the percent ofnew entrepreneurs starting businesses because they saw marketopportunities. Measures the percentof new entrepreneurs who were notunemployed before starting their businesses.
Number of startup firms per 100,000resident population. Startup businesses here are defined as firms less than one-year old employing at least one person besides the owner.
Source: Author calculation from CPS.3-year moving average.
Source: Author calculations from CPS.3-year moving average.
Source: Author calculations from BDS/BEA.Yearly measure.

44 | 2 0 1 5 | T H E K A U F F M A N I N D E X | S T A R T U P A C T I V I T Y | S T A T E T R E N D S
1998 2000 2002 2004 2006 2008 2010 2012 2014
0.10%
0.20%
0.30%
0.40%
0.50%
0.60%
0.70%
Perc
ent
of A
dult
Popu
latio
n Be
com
ing
Entr
epre
neur
s(M
onth
ly A
vera
ge)
Year
Rate of New Entrepreneurs
Startup ActivityRank
2015 2014
27 18
1977 1982 1987 1992 1997 2002 2007 2012
50
100
150
200
250
300
350
400
450
500
Star
tups
per
100
,000
Res
iden
t Po
pula
tion
(Ann
ual)
Year
Startup Density
1998 2000 2002 2004 2006 2008 2010 2012 2014
10%
20%
30%
40%
50%
60%
70%
80%
90%
100%
Opportunity Share of New Entrepreneurs
Perc
ent
of N
ew E
ntre
pren
eurs
Not
Com
ing
Out
of
Une
mpl
oym
ent
(Mon
thly
Ave
rage
)
Year
Rate of New Entrepreneurs
Opportunity Share of New Entrepreneurs
Startup Density
2015Component
2014Component
2015Component
2014Component
2015Component
2014Component
0.28% 0.32%
76.8% 82.3%
128.9 128.5
Early and broad measure of business ownership. Measures the percent ofthe adult population of an area thatbecame entrepreneurs in a givenmonth.
Broad indicator of the percent ofnew entrepreneurs starting businesses because they saw marketopportunities. Measures the percentof new entrepreneurs who were notunemployed before starting their businesses.
Number of startup firms per 100,000resident population. Startup businesses here are defined as firms less than one-year old employing at least one person besides the owner.
Source: Author calculation from CPS.3-year moving average.
Source: Author calculations from CPS.3-year moving average.
Source: Author calculations from BDS/BEA.Yearly measure.

T H E K A U F F M A N I N D E X | S T A R T U P A C T I V I T Y | S T A T E T R E N D S | 2 0 1 5 | 45
1998 2000 2002 2004 2006 2008 2010 2012 2014
0.10%
0.20%
0.30%
0.40%
0.50%
0.60%
0.70%
Perc
ent
of A
dult
Popu
latio
n Be
com
ing
Entr
epre
neur
s(M
onth
ly A
vera
ge)
Year
Rate of New Entrepreneurs
Startup ActivityRank
2015 2014
28 28
1977 1982 1987 1992 1997 2002 2007 2012
50
100
150
200
250
300
350
400
450
500
Star
tups
per
100
,000
Res
iden
t Po
pula
tion
(Ann
ual)
Year
Startup Density
1998 2000 2002 2004 2006 2008 2010 2012 2014
10%
20%
30%
40%
50%
60%
70%
80%
90%
100%
Opportunity Share of New Entrepreneurs
Perc
ent
of N
ew E
ntre
pren
eurs
Not
Com
ing
Out
of
Une
mpl
oym
ent
(Mon
thly
Ave
rage
)
Year
Rate of New Entrepreneurs
Opportunity Share of New Entrepreneurs
Startup Density
2015Component
2014Component
2015Component
2014Component
2015Component
2014Component
0.24% 0.27%
84.3% 79.9%
113.2 109.1
Early and broad measure of business ownership. Measures the percent ofthe adult population of an area thatbecame entrepreneurs in a givenmonth.
Broad indicator of the percent ofnew entrepreneurs starting businesses because they saw marketopportunities. Measures the percentof new entrepreneurs who were notunemployed before starting their businesses.
Number of startup firms per 100,000resident population. Startup businesses here are defined as firms less than one-year old employing at least one person besides the owner.
Source: Author calculation from CPS.3-year moving average.
Source: Author calculations from CPS.3-year moving average.
Source: Author calculations from BDS/BEA.Yearly measure.

46 | 2 0 1 5 | T H E K A U F F M A N I N D E X | S T A R T U P A C T I V I T Y | S T A T E T R E N D S
1998 2000 2002 2004 2006 2008 2010 2012 2014
0.10%
0.20%
0.30%
0.40%
0.50%
0.60%
0.70%
Perc
ent
of A
dult
Popu
latio
n Be
com
ing
Entr
epre
neur
s(M
onth
ly A
vera
ge)
Year
Rate of New Entrepreneurs
Startup ActivityRank
2015 2014
29 46
1977 1982 1987 1992 1997 2002 2007 2012
50
100
150
200
250
300
350
400
450
500
Star
tups
per
100
,000
Res
iden
t Po
pula
tion
(Ann
ual)
Year
Startup Density
1998 2000 2002 2004 2006 2008 2010 2012 2014
10%
20%
30%
40%
50%
60%
70%
80%
90%
100%
Opportunity Share of New Entrepreneurs
Perc
ent
of N
ew E
ntre
pren
eurs
Not
Com
ing
Out
of
Une
mpl
oym
ent
(Mon
thly
Ave
rage
)
Year
Rate of New Entrepreneurs
Opportunity Share of New Entrepreneurs
Startup Density
2015Component
2014Component
2015Component
2014Component
2015Component
2014Component
0.32% 0.30%
72.6% 60.6%
107.2 106.3
Early and broad measure of business ownership. Measures the percent ofthe adult population of an area thatbecame entrepreneurs in a givenmonth.
Broad indicator of the percent ofnew entrepreneurs starting businesses because they saw marketopportunities. Measures the percentof new entrepreneurs who were notunemployed before starting their businesses.
Number of startup firms per 100,000resident population. Startup businesses here are defined as firms less than one-year old employing at least one person besides the owner.
Source: Author calculation from CPS.3-year moving average.
Source: Author calculations from CPS.3-year moving average.
Source: Author calculations from BDS/BEA.Yearly measure.

T H E K A U F F M A N I N D E X | S T A R T U P A C T I V I T Y | S T A T E T R E N D S | 2 0 1 5 | 47
1998 2000 2002 2004 2006 2008 2010 2012 2014
0.10%
0.20%
0.30%
0.40%
0.50%
0.60%
0.70%
Perc
ent
of A
dult
Popu
latio
n Be
com
ing
Entr
epre
neur
s(M
onth
ly A
vera
ge)
Year
Rate of New Entrepreneurs
Startup ActivityRank
2015 2014
30 37
1977 1982 1987 1992 1997 2002 2007 2012
50
100
150
200
250
300
350
400
450
500
Star
tups
per
100
,000
Res
iden
t Po
pula
tion
(Ann
ual)
Year
Startup Density
1998 2000 2002 2004 2006 2008 2010 2012 2014
10%
20%
30%
40%
50%
60%
70%
80%
90%
100%
Opportunity Share of New Entrepreneurs
Perc
ent
of N
ew E
ntre
pren
eurs
Not
Com
ing
Out
of
Une
mpl
oym
ent
(Mon
thly
Ave
rage
)
Year
Rate of New Entrepreneurs
Opportunity Share of New Entrepreneurs
Startup Density
2015Component
2014Component
2015Component
2014Component
2015Component
2014Component
0.20% 0.19%
87.8% 83.3%
127.0 120.2
Early and broad measure of business ownership. Measures the percent ofthe adult population of an area thatbecame entrepreneurs in a givenmonth.
Broad indicator of the percent ofnew entrepreneurs starting businesses because they saw marketopportunities. Measures the percentof new entrepreneurs who were notunemployed before starting their businesses.
Number of startup firms per 100,000resident population. Startup businesses here are defined as firms less than one-year old employing at least one person besides the owner.
Source: Author calculation from CPS.3-year moving average.
Source: Author calculations from CPS.3-year moving average.
Source: Author calculations from BDS/BEA.Yearly measure.

48 | 2 0 1 5 | T H E K A U F F M A N I N D E X | S T A R T U P A C T I V I T Y | S T A T E T R E N D S
1998 2000 2002 2004 2006 2008 2010 2012 2014
0.10%
0.20%
0.30%
0.40%
0.50%
0.60%
0.70%
Perc
ent
of A
dult
Popu
latio
n Be
com
ing
Entr
epre
neur
s(M
onth
ly A
vera
ge)
Year
Rate of New Entrepreneurs
Startup ActivityRank
2015 2014
31 24
1977 1982 1987 1992 1997 2002 2007 2012
50
100
150
200
250
300
350
400
450
500
Star
tups
per
100
,000
Res
iden
t Po
pula
tion
(Ann
ual)
Year
Startup Density
1998 2000 2002 2004 2006 2008 2010 2012 2014
10%
20%
30%
40%
50%
60%
70%
80%
90%
100%
Opportunity Share of New Entrepreneurs
Perc
ent
of N
ew E
ntre
pren
eurs
Not
Com
ing
Out
of
Une
mpl
oym
ent
(Mon
thly
Ave
rage
)
Year
Rate of New Entrepreneurs
Opportunity Share of New Entrepreneurs
Startup Density
2015Component
2014Component
2015Component
2014Component
2015Component
2014Component
0.35% 0.37%
69.4% 72.4%
93.54 94.42
Early and broad measure of business ownership. Measures the percent ofthe adult population of an area thatbecame entrepreneurs in a givenmonth.
Broad indicator of the percent ofnew entrepreneurs starting businesses because they saw marketopportunities. Measures the percentof new entrepreneurs who were notunemployed before starting their businesses.
Number of startup firms per 100,000resident population. Startup businesses here are defined as firms less than one-year old employing at least one person besides the owner.
Source: Author calculation from CPS.3-year moving average.
Source: Author calculations from CPS.3-year moving average.
Source: Author calculations from BDS/BEA.Yearly measure.

T H E K A U F F M A N I N D E X | S T A R T U P A C T I V I T Y | S T A T E T R E N D S | 2 0 1 5 | 49
1998 2000 2002 2004 2006 2008 2010 2012 2014
0.10%
0.20%
0.30%
0.40%
0.50%
0.60%
0.70%
Perc
ent
of A
dult
Popu
latio
n Be
com
ing
Entr
epre
neur
s(M
onth
ly A
vera
ge)
Year
Rate of New Entrepreneurs
Startup ActivityRank
2015 2014
32 26
1977 1982 1987 1992 1997 2002 2007 2012
50
100
150
200
250
300
350
400
450
500
Star
tups
per
100
,000
Res
iden
t Po
pula
tion
(Ann
ual)
Year
Startup Density
1998 2000 2002 2004 2006 2008 2010 2012 2014
10%
20%
30%
40%
50%
60%
70%
80%
90%
100%
Opportunity Share of New Entrepreneurs
Perc
ent
of N
ew E
ntre
pren
eurs
Not
Com
ing
Out
of
Une
mpl
oym
ent
(Mon
thly
Ave
rage
)
Year
Rate of New Entrepreneurs
Opportunity Share of New Entrepreneurs
Startup Density
2015Component
2014Component
2015Component
2014Component
2015Component
2014Component
0.25% 0.28%
82.5% 82.5%
105.9 110.0
Early and broad measure of business ownership. Measures the percent ofthe adult population of an area thatbecame entrepreneurs in a givenmonth.
Broad indicator of the percent ofnew entrepreneurs starting businesses because they saw marketopportunities. Measures the percentof new entrepreneurs who were notunemployed before starting their businesses.
Number of startup firms per 100,000resident population. Startup businesses here are defined as firms less than one-year old employing at least one person besides the owner.
Source: Author calculation from CPS.3-year moving average.
Source: Author calculations from CPS.3-year moving average.
Source: Author calculations from BDS/BEA.Yearly measure.

50 | 2 0 1 5 | T H E K A U F F M A N I N D E X | S T A R T U P A C T I V I T Y | S T A T E T R E N D S
1998 2000 2002 2004 2006 2008 2010 2012 2014
0.10%
0.20%
0.30%
0.40%
0.50%
0.60%
0.70%
Perc
ent
of A
dult
Popu
latio
n Be
com
ing
Entr
epre
neur
s(M
onth
ly A
vera
ge)
Year
Rate of New Entrepreneurs
Startup ActivityRank
2015 2014
33 30
1977 1982 1987 1992 1997 2002 2007 2012
50
100
150
200
250
300
350
400
450
500
Star
tups
per
100
,000
Res
iden
t Po
pula
tion
(Ann
ual)
Year
Startup Density
1998 2000 2002 2004 2006 2008 2010 2012 2014
10%
20%
30%
40%
50%
60%
70%
80%
90%
100%
Opportunity Share of New Entrepreneurs
Perc
ent
of N
ew E
ntre
pren
eurs
Not
Com
ing
Out
of
Une
mpl
oym
ent
(Mon
thly
Ave
rage
)
Year
Rate of New Entrepreneurs
Opportunity Share of New Entrepreneurs
Startup Density
2015Component
2014Component
2015Component
2014Component
2015Component
2014Component
0.27% 0.23%
72.6% 76.9%
152.0 152.1
Early and broad measure of business ownership. Measures the percent ofthe adult population of an area thatbecame entrepreneurs in a givenmonth.
Broad indicator of the percent ofnew entrepreneurs starting businesses because they saw marketopportunities. Measures the percentof new entrepreneurs who were notunemployed before starting their businesses.
Number of startup firms per 100,000resident population. Startup businesses here are defined as firms less than one-year old employing at least one person besides the owner.
Source: Author calculation from CPS.3-year moving average.
Source: Author calculations from CPS.3-year moving average.
Source: Author calculations from BDS/BEA.Yearly measure.

T H E K A U F F M A N I N D E X | S T A R T U P A C T I V I T Y | S T A T E T R E N D S | 2 0 1 5 | 51
1998 2000 2002 2004 2006 2008 2010 2012 2014
0.10%
0.20%
0.30%
0.40%
0.50%
0.60%
0.70%
Perc
ent
of A
dult
Popu
latio
n Be
com
ing
Entr
epre
neur
s(M
onth
ly A
vera
ge)
Year
Rate of New Entrepreneurs
Startup ActivityRank
2015 2014
34 33
1977 1982 1987 1992 1997 2002 2007 2012
50
100
150
200
250
300
350
400
450
500
Star
tups
per
100
,000
Res
iden
t Po
pula
tion
(Ann
ual)
Year
Startup Density
1998 2000 2002 2004 2006 2008 2010 2012 2014
10%
20%
30%
40%
50%
60%
70%
80%
90%
100%
Opportunity Share of New Entrepreneurs
Perc
ent
of N
ew E
ntre
pren
eurs
Not
Com
ing
Out
of
Une
mpl
oym
ent
(Mon
thly
Ave
rage
)
Year
Rate of New Entrepreneurs
Opportunity Share of New Entrepreneurs
Startup Density
2015Component
2014Component
2015Component
2014Component
2015Component
2014Component
0.29% 0.26%
73.4% 74.2%
124.6 118.6
Early and broad measure of business ownership. Measures the percent ofthe adult population of an area thatbecame entrepreneurs in a givenmonth.
Broad indicator of the percent ofnew entrepreneurs starting businesses because they saw marketopportunities. Measures the percentof new entrepreneurs who were notunemployed before starting their businesses.
Number of startup firms per 100,000resident population. Startup businesses here are defined as firms less than one-year old employing at least one person besides the owner.
Source: Author calculation from CPS.3-year moving average.
Source: Author calculations from CPS.3-year moving average.
Source: Author calculations from BDS/BEA.Yearly measure.

52 | 2 0 1 5 | T H E K A U F F M A N I N D E X | S T A R T U P A C T I V I T Y | S T A T E T R E N D S
1998 2000 2002 2004 2006 2008 2010 2012 2014
0.10%
0.20%
0.30%
0.40%
0.50%
0.60%
0.70%
Perc
ent
of A
dult
Popu
latio
n Be
com
ing
Entr
epre
neur
s(M
onth
ly A
vera
ge)
Year
Rate of New Entrepreneurs
Startup ActivityRank
2015 2014
35 27
1977 1982 1987 1992 1997 2002 2007 2012
50
100
150
200
250
300
350
400
450
500
Star
tups
per
100
,000
Res
iden
t Po
pula
tion
(Ann
ual)
Year
Startup Density
1998 2000 2002 2004 2006 2008 2010 2012 2014
10%
20%
30%
40%
50%
60%
70%
80%
90%
100%
Opportunity Share of New Entrepreneurs
Perc
ent
of N
ew E
ntre
pren
eurs
Not
Com
ing
Out
of
Une
mpl
oym
ent
(Mon
thly
Ave
rage
)
Year
Rate of New Entrepreneurs
Opportunity Share of New Entrepreneurs
Startup Density
2015Component
2014Component
2015Component
2014Component
2015Component
2014Component
0.29% 0.31%
74.9% 76.9%
110.4 105.3
Early and broad measure of business ownership. Measures the percent ofthe adult population of an area thatbecame entrepreneurs in a givenmonth.
Broad indicator of the percent ofnew entrepreneurs starting businesses because they saw marketopportunities. Measures the percentof new entrepreneurs who were notunemployed before starting their businesses.
Number of startup firms per 100,000resident population. Startup businesses here are defined as firms less than one-year old employing at least one person besides the owner.
Source: Author calculation from CPS.3-year moving average.
Source: Author calculations from CPS.3-year moving average.
Source: Author calculations from BDS/BEA.Yearly measure.

T H E K A U F F M A N I N D E X | S T A R T U P A C T I V I T Y | S T A T E T R E N D S | 2 0 1 5 | 53
1998 2000 2002 2004 2006 2008 2010 2012 2014
0.10%
0.20%
0.30%
0.40%
0.50%
0.60%
0.70%
Perc
ent
of A
dult
Popu
latio
n Be
com
ing
Entr
epre
neur
s(M
onth
ly A
vera
ge)
Year
Rate of New Entrepreneurs
Startup ActivityRank
2015 2014
36 43
1977 1982 1987 1992 1997 2002 2007 2012
50
100
150
200
250
300
350
400
450
500
Star
tups
per
100
,000
Res
iden
t Po
pula
tion
(Ann
ual)
Year
Startup Density
1998 2000 2002 2004 2006 2008 2010 2012 2014
10%
20%
30%
40%
50%
60%
70%
80%
90%
100%
Opportunity Share of New Entrepreneurs
Perc
ent
of N
ew E
ntre
pren
eurs
Not
Com
ing
Out
of
Une
mpl
oym
ent
(Mon
thly
Ave
rage
)
Year
Rate of New Entrepreneurs
Opportunity Share of New Entrepreneurs
Startup Density
2015Component
2014Component
2015Component
2014Component
2015Component
2014Component
0.24% 0.22%
76.1% 72.2%
150.5 144.3
Early and broad measure of business ownership. Measures the percent ofthe adult population of an area thatbecame entrepreneurs in a givenmonth.
Broad indicator of the percent ofnew entrepreneurs starting businesses because they saw marketopportunities. Measures the percentof new entrepreneurs who were notunemployed before starting their businesses.
Number of startup firms per 100,000resident population. Startup businesses here are defined as firms less than one-year old employing at least one person besides the owner.
Source: Author calculation from CPS.3-year moving average.
Source: Author calculations from CPS.3-year moving average.
Source: Author calculations from BDS/BEA.Yearly measure.

54 | 2 0 1 5 | T H E K A U F F M A N I N D E X | S T A R T U P A C T I V I T Y | S T A T E T R E N D S
1998 2000 2002 2004 2006 2008 2010 2012 2014
0.10%
0.20%
0.30%
0.40%
0.50%
0.60%
0.70%
Perc
ent
of A
dult
Popu
latio
n Be
com
ing
Entr
epre
neur
s(M
onth
ly A
vera
ge)
Year
Rate of New Entrepreneurs
Startup ActivityRank
2015 2014
37 36
1977 1982 1987 1992 1997 2002 2007 2012
50
100
150
200
250
300
350
400
450
500
Star
tups
per
100
,000
Res
iden
t Po
pula
tion
(Ann
ual)
Year
Startup Density
1998 2000 2002 2004 2006 2008 2010 2012 2014
10%
20%
30%
40%
50%
60%
70%
80%
90%
100%
Opportunity Share of New Entrepreneurs
Perc
ent
of N
ew E
ntre
pren
eurs
Not
Com
ing
Out
of
Une
mpl
oym
ent
(Mon
thly
Ave
rage
)
Year
Rate of New Entrepreneurs
Opportunity Share of New Entrepreneurs
Startup Density
2015Component
2014Component
2015Component
2014Component
2015Component
2014Component
0.21% 0.22%
89.2% 83.4%
89.82 87.25
Early and broad measure of business ownership. Measures the percent ofthe adult population of an area thatbecame entrepreneurs in a givenmonth.
Broad indicator of the percent ofnew entrepreneurs starting businesses because they saw marketopportunities. Measures the percentof new entrepreneurs who were notunemployed before starting their businesses.
Number of startup firms per 100,000resident population. Startup businesses here are defined as firms less than one-year old employing at least one person besides the owner.
Source: Author calculation from CPS.3-year moving average.
Source: Author calculations from CPS.3-year moving average.
Source: Author calculations from BDS/BEA.Yearly measure.

T H E K A U F F M A N I N D E X | S T A R T U P A C T I V I T Y | S T A T E T R E N D S | 2 0 1 5 | 55
1998 2000 2002 2004 2006 2008 2010 2012 2014
0.10%
0.20%
0.30%
0.40%
0.50%
0.60%
0.70%
Perc
ent
of A
dult
Popu
latio
n Be
com
ing
Entr
epre
neur
s(M
onth
ly A
vera
ge)
Year
Rate of New Entrepreneurs
Startup ActivityRank
2015 2014
38 32
1977 1982 1987 1992 1997 2002 2007 2012
50
100
150
200
250
300
350
400
450
500
Star
tups
per
100
,000
Res
iden
t Po
pula
tion
(Ann
ual)
Year
Startup Density
1998 2000 2002 2004 2006 2008 2010 2012 2014
10%
20%
30%
40%
50%
60%
70%
80%
90%
100%
Opportunity Share of New Entrepreneurs
Perc
ent
of N
ew E
ntre
pren
eurs
Not
Com
ing
Out
of
Une
mpl
oym
ent
(Mon
thly
Ave
rage
)
Year
Rate of New Entrepreneurs
Opportunity Share of New Entrepreneurs
Startup Density
2015Component
2014Component
2015Component
2014Component
2015Component
2014Component
0.24% 0.23%
76.2% 74.8%
146.4 148.6
Early and broad measure of business ownership. Measures the percent ofthe adult population of an area thatbecame entrepreneurs in a givenmonth.
Broad indicator of the percent ofnew entrepreneurs starting businesses because they saw marketopportunities. Measures the percentof new entrepreneurs who were notunemployed before starting their businesses.
Number of startup firms per 100,000resident population. Startup businesses here are defined as firms less than one-year old employing at least one person besides the owner.
Source: Author calculation from CPS.3-year moving average.
Source: Author calculations from CPS.3-year moving average.
Source: Author calculations from BDS/BEA.Yearly measure.

56 | 2 0 1 5 | T H E K A U F F M A N I N D E X | S T A R T U P A C T I V I T Y | S T A T E T R E N D S
1998 2000 2002 2004 2006 2008 2010 2012 2014
0.10%
0.20%
0.30%
0.40%
0.50%
0.60%
0.70%
Perc
ent
of A
dult
Popu
latio
n Be
com
ing
Entr
epre
neur
s(M
onth
ly A
vera
ge)
Year
Rate of New Entrepreneurs
Startup ActivityRank
2015 2014
39 39
1977 1982 1987 1992 1997 2002 2007 2012
50
100
150
200
250
300
350
400
450
500
Star
tups
per
100
,000
Res
iden
t Po
pula
tion
(Ann
ual)
Year
Startup Density
1998 2000 2002 2004 2006 2008 2010 2012 2014
10%
20%
30%
40%
50%
60%
70%
80%
90%
100%
Opportunity Share of New Entrepreneurs
Perc
ent
of N
ew E
ntre
pren
eurs
Not
Com
ing
Out
of
Une
mpl
oym
ent
(Mon
thly
Ave
rage
)
Year
Rate of New Entrepreneurs
Opportunity Share of New Entrepreneurs
Startup Density
2015Component
2014Component
2015Component
2014Component
2015Component
2014Component
0.22% 0.21%
81.5% 79.8%
120.9 120.1
Early and broad measure of business ownership. Measures the percent ofthe adult population of an area thatbecame entrepreneurs in a givenmonth.
Broad indicator of the percent ofnew entrepreneurs starting businesses because they saw marketopportunities. Measures the percentof new entrepreneurs who were notunemployed before starting their businesses.
Number of startup firms per 100,000resident population. Startup businesses here are defined as firms less than one-year old employing at least one person besides the owner.
Source: Author calculation from CPS.3-year moving average.
Source: Author calculations from CPS.3-year moving average.
Source: Author calculations from BDS/BEA.Yearly measure.

T H E K A U F F M A N I N D E X | S T A R T U P A C T I V I T Y | S T A T E T R E N D S | 2 0 1 5 | 57
1998 2000 2002 2004 2006 2008 2010 2012 2014
0.10%
0.20%
0.30%
0.40%
0.50%
0.60%
0.70%
Perc
ent
of A
dult
Popu
latio
n Be
com
ing
Entr
epre
neur
s(M
onth
ly A
vera
ge)
Year
Rate of New Entrepreneurs
Startup ActivityRank
2015 2014
40 42
1977 1982 1987 1992 1997 2002 2007 2012
50
100
150
200
250
300
350
400
450
500
Star
tups
per
100
,000
Res
iden
t Po
pula
tion
(Ann
ual)
Year
Startup Density
1998 2000 2002 2004 2006 2008 2010 2012 2014
10%
20%
30%
40%
50%
60%
70%
80%
90%
100%
Opportunity Share of New Entrepreneurs
Perc
ent
of N
ew E
ntre
pren
eurs
Not
Com
ing
Out
of
Une
mpl
oym
ent
(Mon
thly
Ave
rage
)
Year
Rate of New Entrepreneurs
Opportunity Share of New Entrepreneurs
Startup Density
2015Component
2014Component
2015Component
2014Component
2015Component
2014Component
0.29% 0.29%
69.7% 64.7%
126.0 126.7
Early and broad measure of business ownership. Measures the percent ofthe adult population of an area thatbecame entrepreneurs in a givenmonth.
Broad indicator of the percent ofnew entrepreneurs starting businesses because they saw marketopportunities. Measures the percentof new entrepreneurs who were notunemployed before starting their businesses.
Number of startup firms per 100,000resident population. Startup businesses here are defined as firms less than one-year old employing at least one person besides the owner.
Source: Author calculation from CPS.3-year moving average.
Source: Author calculations from CPS.3-year moving average.
Source: Author calculations from BDS/BEA.Yearly measure.

58 | 2 0 1 5 | T H E K A U F F M A N I N D E X | S T A R T U P A C T I V I T Y | S T A T E T R E N D S
1998 2000 2002 2004 2006 2008 2010 2012 2014
0.10%
0.20%
0.30%
0.40%
0.50%
0.60%
0.70%
Perc
ent
of A
dult
Popu
latio
n Be
com
ing
Entr
epre
neur
s(M
onth
ly A
vera
ge)
Year
Rate of New Entrepreneurs
Startup ActivityRank
2015 2014
41 41
1977 1982 1987 1992 1997 2002 2007 2012
50
100
150
200
250
300
350
400
450
500
Star
tups
per
100
,000
Res
iden
t Po
pula
tion
(Ann
ual)
Year
Startup Density
1998 2000 2002 2004 2006 2008 2010 2012 2014
10%
20%
30%
40%
50%
60%
70%
80%
90%
100%
Opportunity Share of New Entrepreneurs
Perc
ent
of N
ew E
ntre
pren
eurs
Not
Com
ing
Out
of
Une
mpl
oym
ent
(Mon
thly
Ave
rage
)
Year
Rate of New Entrepreneurs
Opportunity Share of New Entrepreneurs
Startup Density
2015Component
2014Component
2015Component
2014Component
2015Component
2014Component
0.26% 0.23%
76.4% 78.1%
102.9 100.3
Early and broad measure of business ownership. Measures the percent ofthe adult population of an area thatbecame entrepreneurs in a givenmonth.
Broad indicator of the percent ofnew entrepreneurs starting businesses because they saw marketopportunities. Measures the percentof new entrepreneurs who were notunemployed before starting their businesses.
Number of startup firms per 100,000resident population. Startup businesses here are defined as firms less than one-year old employing at least one person besides the owner.
Source: Author calculation from CPS.3-year moving average.
Source: Author calculations from CPS.3-year moving average.
Source: Author calculations from BDS/BEA.Yearly measure.

T H E K A U F F M A N I N D E X | S T A R T U P A C T I V I T Y | S T A T E T R E N D S | 2 0 1 5 | 59
1998 2000 2002 2004 2006 2008 2010 2012 2014
0.10%
0.20%
0.30%
0.40%
0.50%
0.60%
0.70%
Perc
ent
of A
dult
Popu
latio
n Be
com
ing
Entr
epre
neur
s(M
onth
ly A
vera
ge)
Year
Rate of New Entrepreneurs
Startup ActivityRank
2015 2014
42 40
1977 1982 1987 1992 1997 2002 2007 2012
50
100
150
200
250
300
350
400
450
500
Star
tups
per
100
,000
Res
iden
t Po
pula
tion
(Ann
ual)
Year
Startup Density
1998 2000 2002 2004 2006 2008 2010 2012 2014
10%
20%
30%
40%
50%
60%
70%
80%
90%
100%
Opportunity Share of New Entrepreneurs
Perc
ent
of N
ew E
ntre
pren
eurs
Not
Com
ing
Out
of
Une
mpl
oym
ent
(Mon
thly
Ave
rage
)
Year
Rate of New Entrepreneurs
Opportunity Share of New Entrepreneurs
Startup Density
2015Component
2014Component
2015Component
2014Component
2015Component
2014Component
0.18% 0.19%
86.9% 83.5%
110.6 112.0
Early and broad measure of business ownership. Measures the percent ofthe adult population of an area thatbecame entrepreneurs in a givenmonth.
Broad indicator of the percent ofnew entrepreneurs starting businesses because they saw marketopportunities. Measures the percentof new entrepreneurs who were notunemployed before starting their businesses.
Number of startup firms per 100,000resident population. Startup businesses here are defined as firms less than one-year old employing at least one person besides the owner.
Source: Author calculation from CPS.3-year moving average.
Source: Author calculations from CPS.3-year moving average.
Source: Author calculations from BDS/BEA.Yearly measure.
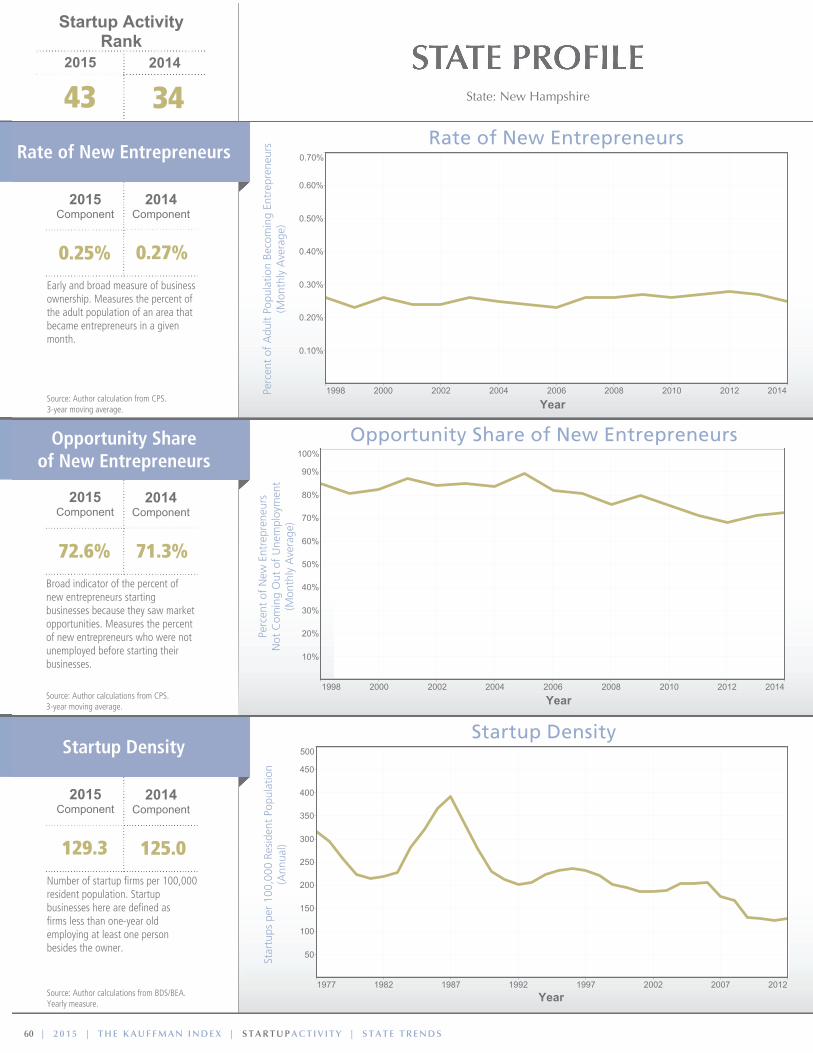
60 | 2 0 1 5 | T H E K A U F F M A N I N D E X | S T A R T U P A C T I V I T Y | S T A T E T R E N D S
1998 2000 2002 2004 2006 2008 2010 2012 2014
0.10%
0.20%
0.30%
0.40%
0.50%
0.60%
0.70%
Perc
ent
of A
dult
Popu
latio
n Be
com
ing
Entr
epre
neur
s(M
onth
ly A
vera
ge)
Year
Rate of New Entrepreneurs
Startup ActivityRank
2015 2014
43 34
1977 1982 1987 1992 1997 2002 2007 2012
50
100
150
200
250
300
350
400
450
500
Star
tups
per
100
,000
Res
iden
t Po
pula
tion
(Ann
ual)
Year
Startup Density
1998 2000 2002 2004 2006 2008 2010 2012 2014
10%
20%
30%
40%
50%
60%
70%
80%
90%
100%
Opportunity Share of New Entrepreneurs
Perc
ent
of N
ew E
ntre
pren
eurs
Not
Com
ing
Out
of
Une
mpl
oym
ent
(Mon
thly
Ave
rage
)
Year
Rate of New Entrepreneurs
Opportunity Share of New Entrepreneurs
Startup Density
2015Component
2014Component
2015Component
2014Component
2015Component
2014Component
0.25% 0.27%
72.6% 71.3%
129.3 125.0
Early and broad measure of business ownership. Measures the percent ofthe adult population of an area thatbecame entrepreneurs in a givenmonth.
Broad indicator of the percent ofnew entrepreneurs starting businesses because they saw marketopportunities. Measures the percentof new entrepreneurs who were notunemployed before starting their businesses.
Number of startup firms per 100,000resident population. Startup businesses here are defined as firms less than one-year old employing at least one person besides the owner.
Source: Author calculation from CPS.3-year moving average.
Source: Author calculations from CPS.3-year moving average.
Source: Author calculations from BDS/BEA.Yearly measure.

T H E K A U F F M A N I N D E X | S T A R T U P A C T I V I T Y | S T A T E T R E N D S | 2 0 1 5 | 61
1998 2000 2002 2004 2006 2008 2010 2012 2014
0.10%
0.20%
0.30%
0.40%
0.50%
0.60%
0.70%
Perc
ent
of A
dult
Popu
latio
n Be
com
ing
Entr
epre
neur
s(M
onth
ly A
vera
ge)
Year
Rate of New Entrepreneurs
Startup ActivityRank
2015 2014
44 48
1977 1982 1987 1992 1997 2002 2007 2012
50
100
150
200
250
300
350
400
450
500
Star
tups
per
100
,000
Res
iden
t Po
pula
tion
(Ann
ual)
Year
Startup Density
1998 2000 2002 2004 2006 2008 2010 2012 2014
10%
20%
30%
40%
50%
60%
70%
80%
90%
100%
Opportunity Share of New Entrepreneurs
Perc
ent
of N
ew E
ntre
pren
eurs
Not
Com
ing
Out
of
Une
mpl
oym
ent
(Mon
thly
Ave
rage
)
Year
Rate of New Entrepreneurs
Opportunity Share of New Entrepreneurs
Startup Density
2015Component
2014Component
2015Component
2014Component
2015Component
2014Component
0.23% 0.21%
75.2% 72.2%
95.97 95.31
Early and broad measure of business ownership. Measures the percent ofthe adult population of an area thatbecame entrepreneurs in a givenmonth.
Broad indicator of the percent ofnew entrepreneurs starting businesses because they saw marketopportunities. Measures the percentof new entrepreneurs who were notunemployed before starting their businesses.
Number of startup firms per 100,000resident population. Startup businesses here are defined as firms less than one-year old employing at least one person besides the owner.
Source: Author calculation from CPS.3-year moving average.
Source: Author calculations from CPS.3-year moving average.
Source: Author calculations from BDS/BEA.Yearly measure.

62 | 2 0 1 5 | T H E K A U F F M A N I N D E X | S T A R T U P A C T I V I T Y | S T A T E T R E N D S
1998 2000 2002 2004 2006 2008 2010 2012 2014
0.10%
0.20%
0.30%
0.40%
0.50%
0.60%
0.70%
Perc
ent
of A
dult
Popu
latio
n Be
com
ing
Entr
epre
neur
s(M
onth
ly A
vera
ge)
Year
Rate of New Entrepreneurs
Startup ActivityRank
2015 2014
45 47
1977 1982 1987 1992 1997 2002 2007 2012
50
100
150
200
250
300
350
400
450
500
Star
tups
per
100
,000
Res
iden
t Po
pula
tion
(Ann
ual)
Year
Startup Density
1998 2000 2002 2004 2006 2008 2010 2012 2014
10%
20%
30%
40%
50%
60%
70%
80%
90%
100%
Opportunity Share of New Entrepreneurs
Perc
ent
of N
ew E
ntre
pren
eurs
Not
Com
ing
Out
of
Une
mpl
oym
ent
(Mon
thly
Ave
rage
)
Year
Rate of New Entrepreneurs
Opportunity Share of New Entrepreneurs
Startup Density
2015Component
2014Component
2015Component
2014Component
2015Component
2014Component
0.24% 0.28%
70.0% 61.7%
99.34 99.26
Early and broad measure of business ownership. Measures the percent ofthe adult population of an area thatbecame entrepreneurs in a givenmonth.
Broad indicator of the percent ofnew entrepreneurs starting businesses because they saw marketopportunities. Measures the percentof new entrepreneurs who were notunemployed before starting their businesses.
Number of startup firms per 100,000resident population. Startup businesses here are defined as firms less than one-year old employing at least one person besides the owner.
Source: Author calculation from CPS.3-year moving average.
Source: Author calculations from CPS.3-year moving average.
Source: Author calculations from BDS/BEA.Yearly measure.

T H E K A U F F M A N I N D E X | S T A R T U P A C T I V I T Y | S T A T E T R E N D S | 2 0 1 5 | 63
1998 2000 2002 2004 2006 2008 2010 2012 2014
0.10%
0.20%
0.30%
0.40%
0.50%
0.60%
0.70%
Perc
ent
of A
dult
Popu
latio
n Be
com
ing
Entr
epre
neur
s(M
onth
ly A
vera
ge)
Year
Rate of New Entrepreneurs
Startup ActivityRank
2015 2014
46 38
1977 1982 1987 1992 1997 2002 2007 2012
50
100
150
200
250
300
350
400
450
500
Star
tups
per
100
,000
Res
iden
t Po
pula
tion
(Ann
ual)
Year
Startup Density
1998 2000 2002 2004 2006 2008 2010 2012 2014
10%
20%
30%
40%
50%
60%
70%
80%
90%
100%
Opportunity Share of New Entrepreneurs
Perc
ent
of N
ew E
ntre
pren
eurs
Not
Com
ing
Out
of
Une
mpl
oym
ent
(Mon
thly
Ave
rage
)
Year
Rate of New Entrepreneurs
Opportunity Share of New Entrepreneurs
Startup Density
2015Component
2014Component
2015Component
2014Component
2015Component
2014Component
0.20% 0.21%
77.6% 85.8%
81.38 80.15
Early and broad measure of business ownership. Measures the percent ofthe adult population of an area thatbecame entrepreneurs in a givenmonth.
Broad indicator of the percent ofnew entrepreneurs starting businesses because they saw marketopportunities. Measures the percentof new entrepreneurs who were notunemployed before starting their businesses.
Number of startup firms per 100,000resident population. Startup businesses here are defined as firms less than one-year old employing at least one person besides the owner.
Source: Author calculation from CPS.3-year moving average.
Source: Author calculations from CPS.3-year moving average.
Source: Author calculations from BDS/BEA.Yearly measure.

64 | 2 0 1 5 | T H E K A U F F M A N I N D E X | S T A R T U P A C T I V I T Y | S T A T E T R E N D S
1998 2000 2002 2004 2006 2008 2010 2012 2014
0.10%
0.20%
0.30%
0.40%
0.50%
0.60%
0.70%
Perc
ent
of A
dult
Popu
latio
n Be
com
ing
Entr
epre
neur
s(M
onth
ly A
vera
ge)
Year
Rate of New Entrepreneurs
Startup ActivityRank
2015 2014
47 44
1977 1982 1987 1992 1997 2002 2007 2012
50
100
150
200
250
300
350
400
450
500
Star
tups
per
100
,000
Res
iden
t Po
pula
tion
(Ann
ual)
Year
Startup Density
1998 2000 2002 2004 2006 2008 2010 2012 2014
10%
20%
30%
40%
50%
60%
70%
80%
90%
100%
Opportunity Share of New Entrepreneurs
Perc
ent
of N
ew E
ntre
pren
eurs
Not
Com
ing
Out
of
Une
mpl
oym
ent
(Mon
thly
Ave
rage
)
Year
Rate of New Entrepreneurs
Opportunity Share of New Entrepreneurs
Startup Density
2015Component
2014Component
2015Component
2014Component
2015Component
2014Component
0.17% 0.18%
73.8% 79.2%
122.5 125.5
Early and broad measure of business ownership. Measures the percent ofthe adult population of an area thatbecame entrepreneurs in a givenmonth.
Broad indicator of the percent ofnew entrepreneurs starting businesses because they saw marketopportunities. Measures the percentof new entrepreneurs who were notunemployed before starting their businesses.
Number of startup firms per 100,000resident population. Startup businesses here are defined as firms less than one-year old employing at least one person besides the owner.
Source: Author calculation from CPS.3-year moving average.
Source: Author calculations from CPS.3-year moving average.
Source: Author calculations from BDS/BEA.Yearly measure.

T H E K A U F F M A N I N D E X | S T A R T U P A C T I V I T Y | S T A T E T R E N D S | 2 0 1 5 | 65
1998 2000 2002 2004 2006 2008 2010 2012 2014
0.10%
0.20%
0.30%
0.40%
0.50%
0.60%
0.70%
Perc
ent
of A
dult
Popu
latio
n Be
com
ing
Entr
epre
neur
s(M
onth
ly A
vera
ge)
Year
Rate of New Entrepreneurs
Startup ActivityRank
2015 2014
48 50
1977 1982 1987 1992 1997 2002 2007 2012
50
100
150
200
250
300
350
400
450
500
Star
tups
per
100
,000
Res
iden
t Po
pula
tion
(Ann
ual)
Year
Startup Density
1998 2000 2002 2004 2006 2008 2010 2012 2014
10%
20%
30%
40%
50%
60%
70%
80%
90%
100%
Opportunity Share of New Entrepreneurs
Perc
ent
of N
ew E
ntre
pren
eurs
Not
Com
ing
Out
of
Une
mpl
oym
ent
(Mon
thly
Ave
rage
)
Year
Rate of New Entrepreneurs
Opportunity Share of New Entrepreneurs
Startup Density
2015Component
2014Component
2015Component
2014Component
2015Component
2014Component
0.20% 0.19%
71.5% 71.6%
101.8 100.4
Early and broad measure of business ownership. Measures the percent ofthe adult population of an area thatbecame entrepreneurs in a givenmonth.
Broad indicator of the percent ofnew entrepreneurs starting businesses because they saw marketopportunities. Measures the percentof new entrepreneurs who were notunemployed before starting their businesses.
Number of startup firms per 100,000resident population. Startup businesses here are defined as firms less than one-year old employing at least one person besides the owner.
Source: Author calculation from CPS.3-year moving average.
Source: Author calculations from CPS.3-year moving average.
Source: Author calculations from BDS/BEA.Yearly measure.
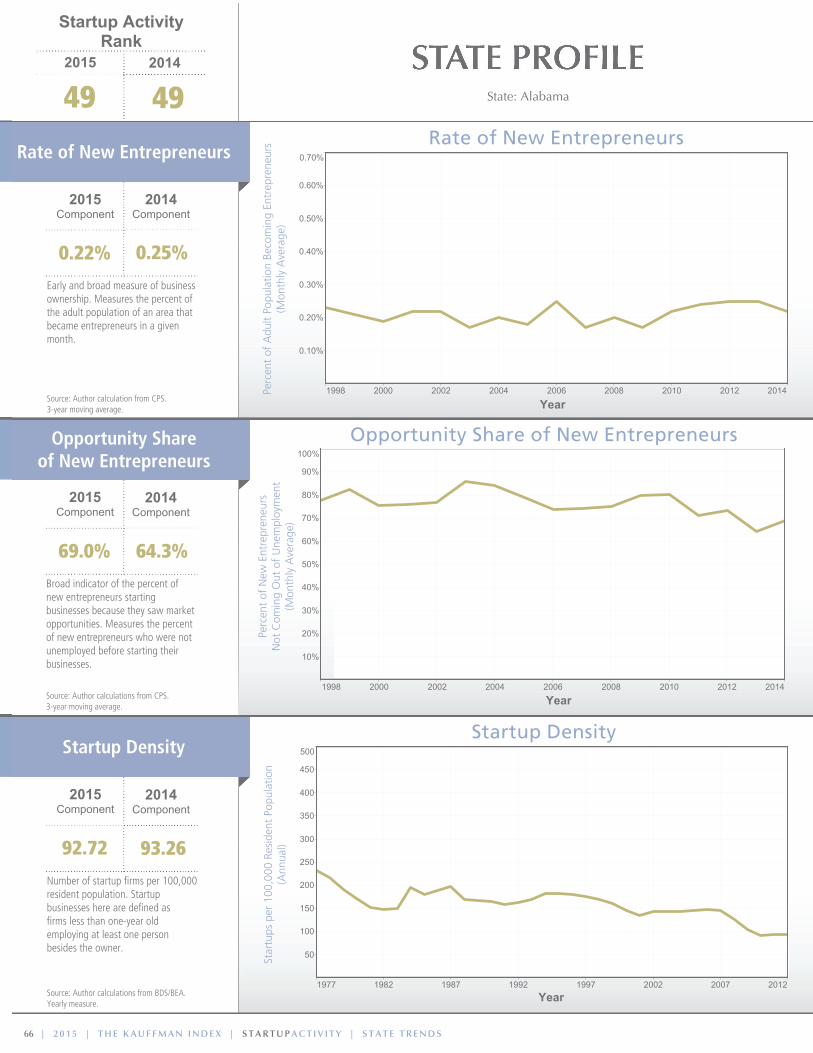
66 | 2 0 1 5 | T H E K A U F F M A N I N D E X | S T A R T U P A C T I V I T Y | S T A T E T R E N D S
1998 2000 2002 2004 2006 2008 2010 2012 2014
0.10%
0.20%
0.30%
0.40%
0.50%
0.60%
0.70%
Perc
ent
of A
dult
Popu
latio
n Be
com
ing
Entr
epre
neur
s(M
onth
ly A
vera
ge)
Year
Rate of New Entrepreneurs
Startup ActivityRank
2015 2014
49 49
1977 1982 1987 1992 1997 2002 2007 2012
50
100
150
200
250
300
350
400
450
500
Star
tups
per
100
,000
Res
iden
t Po
pula
tion
(Ann
ual)
Year
Startup Density
1998 2000 2002 2004 2006 2008 2010 2012 2014
10%
20%
30%
40%
50%
60%
70%
80%
90%
100%
Opportunity Share of New Entrepreneurs
Perc
ent
of N
ew E
ntre
pren
eurs
Not
Com
ing
Out
of
Une
mpl
oym
ent
(Mon
thly
Ave
rage
)
Year
Rate of New Entrepreneurs
Opportunity Share of New Entrepreneurs
Startup Density
2015Component
2014Component
2015Component
2014Component
2015Component
2014Component
0.22% 0.25%
69.0% 64.3%
92.72 93.26
Early and broad measure of business ownership. Measures the percent ofthe adult population of an area thatbecame entrepreneurs in a givenmonth.
Broad indicator of the percent ofnew entrepreneurs starting businesses because they saw marketopportunities. Measures the percentof new entrepreneurs who were notunemployed before starting their businesses.
Number of startup firms per 100,000resident population. Startup businesses here are defined as firms less than one-year old employing at least one person besides the owner.
Source: Author calculation from CPS.3-year moving average.
Source: Author calculations from CPS.3-year moving average.
Source: Author calculations from BDS/BEA.Yearly measure.

T H E K A U F F M A N I N D E X | S T A R T U P A C T I V I T Y | S T A T E T R E N D S | 2 0 1 5 | 67
1998 2000 2002 2004 2006 2008 2010 2012 2014
0.10%
0.20%
0.30%
0.40%
0.50%
0.60%
0.70%
Perc
ent
of A
dult
Popu
latio
n Be
com
ing
Entr
epre
neur
s(M
onth
ly A
vera
ge)
Year
Rate of New Entrepreneurs
Startup ActivityRank
2015 2014
50 45
1977 1982 1987 1992 1997 2002 2007 2012
50
100
150
200
250
300
350
400
450
500
Star
tups
per
100
,000
Res
iden
t Po
pula
tion
(Ann
ual)
Year
Startup Density
1998 2000 2002 2004 2006 2008 2010 2012 2014
10%
20%
30%
40%
50%
60%
70%
80%
90%
100%
Opportunity Share of New Entrepreneurs
Perc
ent
of N
ew E
ntre
pren
eurs
Not
Com
ing
Out
of
Une
mpl
oym
ent
(Mon
thly
Ave
rage
)
Year
Rate of New Entrepreneurs
Opportunity Share of New Entrepreneurs
Startup Density
2015Component
2014Component
2015Component
2014Component
2015Component
2014Component
0.17% 0.19%
71.2% 78.5%
100.6 100.3
Early and broad measure of business ownership. Measures the percent ofthe adult population of an area thatbecame entrepreneurs in a givenmonth.
Broad indicator of the percent ofnew entrepreneurs starting businesses because they saw marketopportunities. Measures the percentof new entrepreneurs who were notunemployed before starting their businesses.
Number of startup firms per 100,000resident population. Startup businesses here are defined as firms less than one-year old employing at least one person besides the owner.
Source: Author calculation from CPS.3-year moving average.
Source: Author calculations from CPS.3-year moving average.
Source: Author calculations from BDS/BEA.Yearly measure.

68 | 2 0 1 5 | T H E K A U F F M A N I N D E X | S T A R T U P A C T I V I T Y | S T A T E T R E N D S
Methodology and Framework
In this part of the report, we discuss the methodology and framework for the Kauffman Index: Startup Activity reports across all geographic levels: national, state, and metropolitan area.
Definitions of Startup Activity Index Components
The Kauffman Index: Startup Activity is calculated based on three components: Rate of New Entrepreneurs, Opportunity Share of New Entrepreneurs, and Startup Density. In this section, we will share detailed definitions of each one of these components.
Component A: Rate of Entrepreneurs
Component A of the Kauffman Index: Startup Activity comes from the Current
Population Survey (CPS) and is calculated by author Rob
Fairlie. The CPS microdata capture all business owners, including those who own incorporated or unincorporated businesses, and those who are employers or non-employers. To create the Rate of New Entrepreneurs (formerly known as the Kauffman Index of Entrepreneurial Activity), all individuals who do not own a business as their main job are identified in the first survey month. By matching CPS files, it is then determined whether these individuals own a business as their main job with fifteen or more usual hours worked in the following survey month. Reducing the likelihood of reporting spurious changes in business ownership status from month to month, survey-takers ask individuals whether they currently have the same main job as reported in the previous month. If the answer is yes, the interviewer carries forward job information, including business ownership, from the previous month’s survey. If the answer is no, the respondent is asked the full series of job-related questions. Survey-takers ask this question at the beginning of the job section to save time during the interview process and improve consistency in reporting.
The main job is defined as the one with the most hours worked. Individuals who start side businesses will,
• Earlyandbroadmeasureofbusinessownership.
• MeasuresthepercentoftheU.S.adultpopulationthatbecameentrepreneurs,onaverage,inagivenmonth.
• Includesentrepreneurswithincorporatedorunincorporatedbusinesses,withorwithoutemployees.
• DatabasedontheCurrentPopulationSurvey,jointlyproducedbytheU.S.CensusBureauandtheU.S. Bureau of Labor statistics.
• Whatthenumbermeans:
- For example, the Rate of New Entrepreneurs was 0.35 percent for Colorado in the 2015 Index. That means that, on average, 350 people out of 100,000 adults became entrepreneurs in Colorado in each month.
KAUFFMAN
INDEX:startupactivity
Rate of New Entrepreneurs
Opportunity Share of New Entrepreneurs
Startup Density
OPP
ORT
UN
ITY
SHARE OF NEW ENTREPREN
EURS
RATE
O
F NEW ENTREPRENEU
RS
STARTUP DENSITY
Rate of New Entrepreneurs
T H E K A U F F M A N I N D E X | S T A R T U P A C T I V I T Y | S T A T E T R E N D S | 2 0 1 5 | 69
therefore, not be counted if they are working more hours on a wage/salary job. The requirement that business owners work fifteen or more hours per week in the second month is imposed to rule out part-time business owners and very small business activities. It may, therefore, result in an understatement of the percent of individuals creating any type of business.
The Rate of New Entrepreneurs also excludes individuals who owned a business and worked fewer than fifteen hours in the first survey month. Thus, the Rate of New Entrepreneurs does not capture business owners who increased their hours from less than fifteen per week in one month to fifteen or more hours per week in the second month. In addition, the Rate of New Entrepreneurs does not capture when these business owners changed from non-business owners to business owners with less than fifteen hours worked. These individuals are excluded from the sample but may have been at the earliest stages of starting a business. More information concerning the definition is provided in Fairlie (2006).
The Rate of New Entrepreneurs component of the Startup Activity Index also may overstate entrepreneurship rates in certain respects because of small changes in how individuals report their work status. Longstanding business owners who also have salaried positions may, for example, report that they are not business owners as their main jobs in a particular month because their wage/salary jobs had more hours in that month. If the individuals then switched to having more hours in business ownership the following month, it would appear that a new business had been created.
For the definition of the Rate of New Entrepreneurs discussed in this report, all observations from the CPS with allocated labor force status, class of worker, and hours worked variables are excluded. The Rate of New Entrepreneurs is substantially higher for allocated or imputed observations. These observations were included in the first Kauffman Index report (Fairlie 2005). See Fairlie (2006) for a complete discussion of the issues and comparisons between unadjusted and adjusted Rate of New Entrepreneurs.
The CPS sample was designed to produce national and state estimates of the unemployment rate and additional labor force characteristics of the civilian, non-institutional population ages sixteen and older. The total national sample size is drawn to ensure a high level of precision for the monthly national unemployment rate. For each of the fifty states and the District of Columbia, the sample also is designed to guarantee precise estimates of average annual unemployment rates, resulting in varying sample rates by state (Polivka 2000). Sampling weights provided by the CPS, which also adjust for non-response and post-stratification raking, are used for all national and state-level estimates. The CPS also can be used to calculate metropolitan area estimates, but only for the largest metropolitan areas in the United States. For example, the Bureau of Labor Statistics reports annual labor-force participation and unemployment rates for the largest fifty-four MSAs.5 We focus on the forty largest MSAs in our analysis and calculate moving averages when needed to ensure adequate precision in all reported estimates.
Component B: Opportunity Share of New Entrepreneurs
Building from the same data used for component A, the Opportunity Share of New Entrepreneurs is defined as
Opportunity Share of New Entrepreneurs
• Proxyindicatorofthepercentofnewentrepreneurs starting businesses because they saw market opportunities.
• Measuresthepercentageofnewentrepreneurs who were not unemployed before starting their businesses (e.g., have been previously working for another organization or studying in school).
• Thisindicatorisimportantfortworeasons: 1) Entrepreneurs who were previously unemployed seem to be more likely to start businesses with lower growth potential, out of necessity. Thus, the Opportunity share of New Entrepreneurs serves as a broad proxy for growth prospects. 2) This measure helps us understand changes in the Rate of New Entrepreneurs motivated by weak job markets, such as the one we had after the recent Great Recession. If the Rate of New Entrepreneurs goes up but the Opportunity share of New Entrepreneurs is low, we can see that many new entrepreneurs are starting businesses coming out of unemployment, and arguably started their companies largely out of necessity.
• DatabasedontheCurrentPopulationsurvey jointly produced by the U.s. Census Bureau and the U.s. Bureau of Labor statistics.
• Whatthenumbermeans:
- For example, the United states Opportunity share of New Entrepreneurs was 79.57 percent in the 2015 Index. That means that approximately eight out of every ten new entrepreneurs in this year started their businesses coming out of another job, school, or other labor market states. Meanwhile, two out of ten started their businesses directly coming out of unemployment.
5. see http://www.bls.gov/opub/gp/pdf/gp13_27.pdf for Bureau of Labor statistics use of the CPs at the metropolitan-area level.

70 | 2 0 1 5 | T H E K A U F F M A N I N D E X | S T A R T U P A C T I V I T Y | S T A T E T R E N D S
the share of the new business owners that are coming out of wage and salary work, school, or other labor market statuses. Alternatively, individuals can start businesses coming out of unemployment. The initial labor market status is defined in the first survey month. Rate of New Entrepreneurs is measured in the second (or following) survey month.
Component C: Startup DensityThe Startup Density component of the
Kauffman Index: Startup Activity uses U.S. Census Bureau data from the Business
Dynamics Statistics, and it measures the number of new employer firms normalized by the population of a given area. We define startups here as employer firms that are younger than one year old, and we divide the number of startups in a region by every 100,000 people living in the area to arrive at the Startup Density measure. Our definition here is largely based on the entrepreneurship density measure suggested by our Kauffman Foundation colleagues Stangler and Bell-Masterson (2015) in their Measuring an Entrepreneurial Ecosystem paper.
Calculating the Startup Activity IndexThe Kauffman Index: Startup Activity provides a broad
index measure of business startup activity in the United States. It is an equally weighted index of three normalized measures of startup activity. The three component measures of the Startup Activity Index are: i) the Rate of New Entrepreneurs among the U.S. adult population, ii) the Opportunity Share of New Entrepreneurs, which
captures the percentage of new entrepreneurs primarily driven by “opportunity” vs. by “necessity,” and iii) the Startup Density (new employer businesses less than one year old, normalized by population).
Each of these three measures is normalized by subtracting the mean and dividing by the standard deviation for that measure (i.e., creating a z-score for each variable).6 This creates a comparable scale for including the three measures in the Startup Activity Index. We use national annual estimates from 1996 to the latest year available (2014) to calculate the mean and standard deviation for each of the CPS-based components. Similarly, we use national annual numbers from 1994 to the latest year available (2012) to calculate the mean and standard deviation for the BDS-based component of the Index. The same normalization method is used for all three geographical levels—national, state, and metropolitan area—for comparability and consistency over time.
The components we use for the national-level Startup Activity Index are all annual numbers. The Rate of New Entrepreneurs covers years from 1996 to the latest year available (2014). The Opportunity Share of New Entrepreneurs covers years from 1996 to the latest year available (2014). The Startup Density covers years from 1994 to the latest year available (2012).
The Rate of New Entrepreneurs and the Opportunity Share of New Entrepreneurs components of the state-level Startup Activity Index are calculated on three-year moving averages with the same yearly coverage as the national level numbers. The reason we do three-year moving
• Numberofstartupfirmsbytotalpopulation.
• Startupbusinessesherearedefinedasemployerfirmslessthanoneyearoldemployingatleastoneperson besides the owner. all industries are included on this measure.
• Measuresthenumberofnewemployerstartupbusinessesnormalizedbythepopulationofanarea.Because companies captured by this indicator have employees, they tend to be at a more advanced stage than are the companies in the Rate of New Entrepreneurs measure.
• DatabasedontheU.S.Census’sBusinessDynamicsStatistics.
• Whatthenumbermeans:
- For example, the 2015 Index startup Density for the New York metropolitan area was 197.3 by 100,000 population. That means that, for every 100,000 people living in the New York metro area, there were 197.3 employer startup firms that were less than one year old in this year.
Startup Density
6. This is one of the normalization methods recommended by the OECD and the Joint Research Centre from the European Commission in the Handbook on Constructing Composite Indicators (2008).

T H E K A U F F M A N I N D E X | S T A R T U P A C T I V I T Y | S T A T E T R E N D S | 2 0 1 5 | 71
averages on the sample-based CPS measures is to reduce sampling issues. Because these are three-year moving averages with annual estimates starting in 1996, the first year for which three-year moving averages are available is 1998. The Startup Density component of the Index is presented yearly, from 1994 to the latest year available (2012).
For the metropolitan area-level Startup Activity Index, we present the Rate of New Entrepreneurs component on a three-year moving average from 2008 to the latest year available (2014). Because these are three-year moving averages, annual estimates are first calculated in 2006. The Opportunity Share of New Entrepreneurs component of the Startup Activity Index is presented on five-year moving averages, starting in 2010 and going up to the latest year available (2014). Annual estimates used to calculate the moving average start in 2006. Again, the reason behind presenting moving averages is to reduce sampling issues. The Startup Density component of the Index is presented yearly, from 1994 to the latest year available (2012).
Data Sources and Component MeasuresData Sources
In this section, we discuss the underlying data sources used to calculate each of the components of the Startup Activity Index.
Rate of New Entrepreneurs and Opportunity Share of New Entrepreneurs
To calculate the Rate of New Entrepreneurs and the Opportunity Share of New Entrepreneurs, the underlying dataset used is the basic monthly files of the Current Population Survey. These surveys, conducted monthly by the U.S. Bureau of the Census and the Bureau of Labor Statistics, represent the entire U.S. population and contain observations for more than 130,000 people each month. By linking the CPS files over time, longitudinal data are created, allowing for the examination of the Rate of New Entrepreneurs. Combining the monthly files creates a sample size of roughly 700,000 adults ages twenty to sixty-four each year.
Households in the CPS are interviewed each month over a four-month period. Eight months later, they are re-interviewed in each month of a second four-month period. Thus, individuals who are interviewed in January, February, March, and April of one year are interviewed again in January, February, March, and April of the following year. The CPS rotation pattern makes it
possible to match information on individuals monthly and, therefore, to create two-month panel data for up to 75 percent of all CPS respondents. To match these data, the household and individual identifiers provided by the CPS are used. False matches are removed by comparing race, sex, and age codes from the two months. After removing all non-unique matches, the underlying CPS data are checked extensively for coding errors and other problems.
Monthly match rates generally are between 94 percent and 96 percent (see Fairlie 2005). Household moves are the primary reason for non-matching. A somewhat non-random sample (mainly geographic movers) will, therefore, be lost due to the matching routine. Moves do not appear to create a serious problem for month-to-month matches, however, because the observable characteristics of the original sample and the matched sample are very similar (see Fairlie 2005).
Startup DensityWe use two types of datasets to calculate Startup
Density: a firm-level dataset and a population dataset.
For the firm-level dataset, we use the U.S. Census Business Dynamics Statistics (BDS), which is constructed using administrative payroll tax records from the Internal Revenue Service (IRS). The BDS data present, among other things, numbers of firms tabulated by age and by geography (national, state, and metropolitan area). We make use of that data to calculate the raw number of employer firms younger than one year old by different geographical levels. We then normalize this number by population to arrive at the Startup Density of an area. To calculate population, we use data from Bureau of Economic Analysis (BEA).
Matching BDS state and national numbers to BEA population data is a non-issue, because the definitions of the geographical areas are the same. However, this is slightly different for metropolitan areas. Because metropolitan area definitions may vary across datasets, we used the Office of Management and Budget (OMB) definitions for metropolitan areas from December 2009 to calculate Startup Density. This is the definition of metros used on the BDS dataset, and it means that, to calculate population using the BEA, we aggregated population data from the county level up to the metropolitan level.
We match the forty largest metropolitan areas in the United States by population using the OMB 2009 definition of metros and the BEA population data to their counterparts in the CPS dataset. This was the most appropriate aggregation method because neither the CPS nor the BDS dataset provides county-level data. To diminish issues of changing metro definitions, we only

72 | 2 0 1 5 | T H E K A U F F M A N I N D E X | S T A R T U P A C T I V I T Y | S T A T E T R E N D S
present the top forty metropolitan areas in the United States—in which shifts in county composition are less likely to cause big shifts in total population or business activity—and only use CPS data for metros in the most recent years, from 2006 to the most recent year available (2014). The metropolitan area codes listed on the CPS have perfect matches to metropolitan area codes on BDS except for two metro areas: Boston-Cambridge-Quincy, MA-NH and Providence-New Bedford-Fall River, RI-MA.
Standard Errors and Confidence Intervals
Rate of New Entrepreneurs and Opportunity Share of New Entrepreneurs
The analysis of Rate of New Entrepreneurs by state includes confidence intervals that indicate confidence bands of approximately 0.15 percent around the Rate of New Entrepreneurs. While larger states have smaller confidence bands, the smallest states have larger confidence bands of approximately 0.20 percent. Oversampling in the CPS ensures that these small states have sample sizes of at least 5,000 observations and, therefore, provides a minimum level of precision.
The standard errors used to create the confidence intervals reported here may understate the true variability in the state estimates. Both stratification of the sample and the raking procedure (post-stratification) will reduce the variance of CPS estimates (Polivka 2000 and Train, Cahoon and Maken 1978). On the other hand, the CPS clustering (i.e., nearby houses on the same block and multiple household members) leads to a larger sampling variance than would have been obtained from simple random sampling. It appears as though the latter effect dominates in the CPS, and treating the CPS as random generally understates standard errors (Polivka 2000). National unemployment rate estimates indicate that treating the CPS as a random sample leads to an understatement of the variance of the unemployment rate by 23 percent. Another problem associated with the estimates reported here is that multiple observations (up to three) may occur for the same individual.
All of the reported confidence intervals should be considered approximate, as the actual confidence intervals may be slightly larger. The complete correction for the standard errors and confidence intervals involves obtaining confidential replicate weights from the BLS and employing sophisticated statistical procedures. Corrections
for the possibility of multiple observations per person, which may create the largest bias in standard errors, are made using statistical survey procedures for all reported confidence intervals. It is important to note, however, that the estimates of the Rate of New Entrepreneurs are not subject to any of these problems. By using the sample weights provided by the CPS, all estimates of the Rate of New Entrepreneurs are correct.
Startup DensityBecause the BDS is based on administrative data
covering the overall employer business population, sampling concerns like standard errors and confidence intervals are irrelevant. Nonetheless, nonsampling errors could still occur. These could be caused, for example, by data entry issues with the IRS payroll tax records or by businesses submitting incorrect employment data to the IRS. However, these are probably randomly distributed and are unlikely to cause significant biases in the data.7 Please see Jarmin and Miranda (2002) for a complete discussion of potential complications on the dataset caused by changes in the administrative data on which the BDS is based.
Advantages over Other Possible Measures of Entrepreneurship
The Kauffman Index: Startup Activity has several advantages over other possible measures of entrepreneurship based on household or business-level data. We chose to use two distinct datasets: one based on individuals (CPS) and another one based on businesses (BDS). This allows us to study both entrepreneurs and the startups they create. These datasets have complementary strengths that make this Index a robust measure of startup activity.
Rate of New Entrepreneurs and Opportunity Share of New Entrepreneurs
The Rate of New Entrepreneurs and Opportunity Share of New Entrepreneurs components of the Startup Activity Index are based on the CPS, and this dataset provides four prominent advantages as an early and broad measure of startup activity. First, the CPS data are available only a couple of months after the end of
7. Based on “Reliability of the Data” section of the Business Dynamics statistics Overview page. http://www.census.gov/ces/dataproducts/bds/overview.html#reliability.

T H E K A U F F M A N I N D E X | S T A R T U P A C T I V I T Y | S T A T E T R E N D S | 2 0 1 5 | 73
the year, whereas even relatively timely data such as the American Community Survey (ACS) take more than a year to be released. Second, these components of the Startup Activity Index include all types of business activities (employers, non-employers, unincorporated and incorporated businesses), but do not include small-scale side business activities such as consulting and casual businesses (because only the main job activity is recorded, and the individual must devote fifteen or more hours a week to working in the business). Third, the panel data created from matching consecutive months of the CPS allow for a dynamic measure of entrepreneurship, whereas most datasets only allow for a static measure of business ownership (e.g., ACS). Fourth, the CPS data include detailed information on demographic characteristics of the owner, whereas most business-level datasets contain no information on the owner (e.g., employer and non-employer data).
It is worth mentioning that the differences between the CPS components of the Kauffman Index also differ from another entrepreneurship measure that may, on afirstglance,looksimilar:theGlobalEntrepreneurshipMonitor’s Total early-stage Entrepreneurial Activity (TEA). The TEA captures the percentage of the age eighteen to sixty-four population who currently are nascent entrepreneurs (i.e., individuals who are actively involved in setting up a business) or who are currently owner-managers of new businesses (i.e., businesses with no payments to owners or employees for more than forty-two months). The nascent entrepreneurs captured in the TEA who are still in the startup phase of business creation are not necessarily captured in the Kauffman Index Rate of New Entrepreneurs because they may not be working on the new business for fifteen hours or more per week. The CPS components of the Kauffman Index also differ from the TEA in that, because they are based on panel data, they capture entrepreneurship at the point in time when thebusinessiscreated.Inaddition,theGEMmeasuresinthe United States use a much smaller sample, allowing for significant estimation challenges.
Startup DensityThe Startup Density component of the Startup Activity
Index, based on the BDS, presents four main advantages compared to other business-level datasets. First, it is based on administrative data covering the overall employer business population. As such, it has no potential sampling issues. Second, it has detailed coverage across all levels of geography, including metropolitan areas. Third, it provides firm-level data, rather than just establishment-level data. This is an important feature because new establishments may show another location of an existing firm, rather than an actual new business. Fourth, it provides detailed age
breakdown of firms, allowing us to clearly identify new and young firms.
A dataset that is similar to the BDS data we use is the Business Employment Dynamics product from the Bureau of Labor Statistics. We chose not to use it for this report because of two distinct advantages we see the BDS having over the BED. First, the BDS tracks firm-level data, as opposed to the establishment-level data tracked by the BED. Second, the BDS has data available at the metropolitan level, while the BED does not.
Because the BED tracks establishments rather than firms, the numbers from the BDS are different than the ones on the BED. Nonetheless, the trends on the two datasets move largely in tandem, and usually point in the same direction.
74 | 2 0 1 5 | T H E K A U F F M A N I N D E X | S T A R T U P A C T I V I T Y | S T A T E T R E N D S
REFERENCESBureau of Economic analysis. 2014. Regional Economic Accounts, http://www.bea.gov/regional/downloadzip.cfm.
Brown, stephen P.a., and Yücel, Mine K. 2013. Energy Brief: The Shale Gas and Tight Oil Boom: U.S. States’ Economic Gains and Vulnerabilities, New York: Council on Foreign Relations.
Bureau of Labor statistics. 2014. “Table 8. Private sector establishment births and deaths, seasonally adjusted,” Business Employment Dynamics (BED), http://www.bls.gov/news.release/cewbd.t08.htm.
Bureau of Economic analysis. 2014. “Widespread but slower Growth in 2013. advance statistics of GDP by state,” http://www.bea.gov/newsreleases/regional/gdp_state/gsp_highlights.pdf.
Bureau of Labor statistics. 2014. Labor Force Statistics from the Current Population Survey (CPS), http://www.bls.gov/cps/.
Fairlie, Robert W. 2014. Kauffman Index of Entrepreneurial Activity, 1996–2013, Kansas City: Ewing Marion Kauffman Foundation.
Fairlie, Robert W. 2013. Kauffman Index of Entrepreneurial Activity, 1996–2012, Kansas City: Ewing Marion Kauffman Foundation.
Fairlie, Robert W. 2011. “Entrepreneurship, Economic Conditions, and the Great Recession,” Journal of Economics and Management Strategy, 22(2): 207–231.
Fairlie, Robert W. 2006. Kauffman Index of Entrepreneurial Activity, 1996–2005, Kansas City: Ewing Marion Kauffman Foundation.
Fairlie, Robert W. 2005. Kauffman Index of Entrepreneurial Activity, 1996–2004, Kansas City: Ewing Marion Kauffman Foundation.
Feld, Brad. 2012. Startup communities: Building an entrepreneurial ecosystem in your city. Hoboken, NJ: John Wiley & sons.
Global Entrepreneurship Monitor Consortium. 2015. Global Entrepreneurship Monitor (GEM), http://www.gemconsortium.org/What-is-GEM.
Jarmin, Ron s., and Miranda, Javier. 2002. The Longitudinal Business Database, Washington, D.C.: U.s. Census Bureau.
Karabell, Zachary. 2014. The Leading Indicators: A Short History of the Numbers That Rule Our World. New York, NY: simon & schuster.

T H E K A U F F M A N I N D E X | S T A R T U P A C T I V I T Y | S T A T E T R E N D S | 2 0 1 5 | 75
Polivka, anne E. 2000. Using Earnings Data From the Monthly Current Population Survey, Washington, D.C.: Bureau of Labor statistics.
stangler, Dane, and Bell-Masterson, Jordan. 2015. Measuring an Entrepreneurial Ecosystem, Kansas City: Ewing Marion Kauffman Foundation.
Train, George, Cahoon, Lawrence, and Makens, Paul. 1978. “The Current Population survey Variances, Inter-Relationships, and Design Effects,” Proceedings of the Section on Survey Research Methods, american statistical association, Washington, D.C., 443–448.
U.s. Census Bureau. 2014. American Community Survey (ACS), http://www.census.gov/acs/www/.
U.s. Census Bureau. 2014. Business Dynamics Statistics (BDS), http://www.census.gov/ces/dataproducts/bds/overview.html.
U.s. Census Bureau. 2014. Survey of Business Owners (SBO), http://www.census.gov/ces/dataproducts/bds/overview.html.

76 | 2 0 1 5 | T H E K A U F F M A N I N D E X | S T A R T U P A C T I V I T Y | S T A T E T R E N D S
NOTES


4801 ROCKHILL ROaDKaNsas CITY, MIssOURI 64110
816-932-1000 www.kauffman.org
0615