pandoland 2015: q1-q2 state of startups | mattermark
TRANSCRIPT

© 2015 ALL RIGHTS RESERVED ● MATTERMARK TRACTION REPORT ● MATTERMARK.COM ● (415) 366-6587
PANDOLAND 2015: Q1-Q2 2015 STATE OF STARTUPSby Andy Sparks Mattermark Co-founder & COO
@SparksZilla
1

© 2015 ALL RIGHTS RESERVED ● MATTERMARK TRACTION REPORT ● MATTERMARK.COM ● (415) 366-6587
Q1-Q2 2015: ACQUISITIONS & IPO ACTIVITYMattermark tracked over 500 investor backed acquisitions and 140 IPOs in the United States between Q1 2014 and Q2 2015. These are companies that had received venture or private equity financing prior to liquidity and indicated positive growth according to the Mattermark Growth Score.
2

© 2015 ALL RIGHTS RESERVED ● MATTERMARK TRACTION REPORT ● MATTERMARK.COM ● (415) 366-6587
EXITS
3
Investor Backed Exits Q1 2014 - Q2 2015
Num
ber o
f IPO
s
0
40
80
120
160
Q1 2014 Q2 2014 Q3 2014 Q4 2014 Q1 2015 Q2 2015Acquisitions IPO

© 2015 ALL RIGHTS RESERVED ● MATTERMARK TRACTION REPORT ● MATTERMARK.COM ● (415) 366-6587
EXITS
4
Investor Backed Acquisitions by Industry, Q1 - Q2 2015
Num
ber o
f Exit
s
0
10
20
30
40
Enterprise Software Analytics Healthcare Advertising & Marketing E-CommerceCompanies that were acquired in 2015

© 2015 ALL RIGHTS RESERVED ● MATTERMARK TRACTION REPORT ● MATTERMARK.COM ● (415) 366-6587
EXITS
5
Time Taken to Acquisition, Q1 - Q2 2015
Num
ber o
f Com
panie
s
0
3
6
9
12
15
18
Time taken to Exit (Years)1 2 3 4 5 6 7 8 9 10 Untitled 1
Years to Acquisition
Of all the investor-backed companies that were acquired in Q1 and Q2 of 2015, the the median time taken was 7 years.

© 2015 ALL RIGHTS RESERVED ● MATTERMARK TRACTION REPORT ● MATTERMARK.COM ● (415) 366-6587
EXITS - M&A
6
Most Active Acquirers, Q1 - Q2 2015
Company Name: Google Website: google.com Acquisitions Launchpad Toys, InMobi, Tilt Brush, Timeful, Pulse.io, Lumedyne Technologies
Company Name: Apple Website: apple.com Acquisitions Semetric, OttoCat, Dryft, LinX Imaging, Coherent Navigation, Metaio
Company Name: Amazon Website: amazon.com Acquisitions Annapurna Labs, 21emetry, Shoefitr, Clusterk
Company Name: Sprinklr Website: sprinklr.com Acquisitions Launchpad Toys, InMobi, Tilt Brush, Timeful, Pulse.io, Lumedyne Technologies, Get Satisfaction
Company Name: Dropbox Website: dropbox.com Acquisitions CloudOn, Pixelapse, Umano

© 2015 ALL RIGHTS RESERVED ● MATTERMARK TRACTION REPORT ● MATTERMARK.COM ● (415) 366-6587
EXITS - IPO
7
Volume of IPOs, Q1 2014 - Q2 2015
Num
ber o
f IPO
s
0
25
50
75
100
Q1 2014 Q2 2014 Q3 2014 Q4 2014 Q1 2015 Q2 2015
2129
70
44
58
33
16
109
24
3539
Investor Backed IPOsOther IPOs

© 2015 ALL RIGHTS RESERVED ● MATTERMARK TRACTION REPORT ● MATTERMARK.COM ● (415) 366-6587 8
Investor Backed IPOs by Industry, Q1 - Q2 2015
Num
ber o
f Exit
s
0
4
8
12
16
Healthcare (Inc. Biotech) Enterprise Software Finance Human Resources Clean Technology
Companies that IPO’d in 2015
EXITS - IPO

© 2015 ALL RIGHTS RESERVED ● MATTERMARK TRACTION REPORT ● MATTERMARK.COM ● (415) 366-6587 9
Market Capitalization of Investor Backed IPOs, Q1 - Q2 2015
Mar
ket C
apita
lizat
ion
(In M
M)
0
1000
2000
3000
4000
Healthcare (Inc. Biotech) Enterprise Software E-Commerce Finance Clean Technology
Total Market Capitalization
EXITS - IPO

© 2015 ALL RIGHTS RESERVED ● MATTERMARK TRACTION REPORT ● MATTERMARK.COM ● (415) 366-6587
EXITS - IPO
10
Selected Investor Backed IPOs, Q1 - Q2 2015
Company
Total Funding $130,000,000 $564,000,000 $122,000,000 $85,000,000
Key Funding
04/11 Series A: $40M01/14 Series B: $25M11/14 Series C: $50M 03/15 Series D: $15M
10/06 Series A: $15M02/08 Series B: $6M
04/10 Series C: $15M10/11 Series D: $81M01/13 Series E: $125M12/13 Series F: $100M 07/14 Series G: $150M
12/10 Series A: $7M10/11 Series B: $15M
12/13 Series C: $100M
10/09 Series A: $23M10/10 Series B: $25M10/11 Series C: $37M
Key Investors
Redmile Group, Cowen Investments, RA Capital
Partners, Third Rock Ventures, Fidelity Biosciences
TPG, Coatue Management, Draper Fisher Jurvetson (DFJ),
Andreessen Horowitz, New Enterprise Associates
Felicis Ventures, Bessemer Venture Partners, OMERS
Ventures, Georgian Partners, FirstMark Capital
Norwest Venture Partners, Walden International, Opus Capital, Lightspeed Venture
Partners, GE Capital
*certain funding rounds were excluded for the purposes of this presentation

© 2015 ALL RIGHTS RESERVED ● MATTERMARK TRACTION REPORT ● MATTERMARK.COM ● (415) 366-6587
EXITS - IPO
11
Selected Technology IPO 1st Day Performance
Pric
e ($
USD
)
$0
$10
$20
$30
$40
$12.89
$29.27
$35.15
$17.19$16.42 $16.68
$26.15$25.86
$23.15
$30
$17
$20
$17
$14$16
IPO Share Price End of Day 1 Share Price Price 6/15/15
\

© 2015 ALL RIGHTS RESERVED ● MATTERMARK TRACTION REPORT ● MATTERMARK.COM ● (415) 366-6587 12
Selected Technology IPO: 1st Day v. Total Return to Date
Return (%)-22.5 0 22.5 45 67.5 90
-13%
45%
61%
24%
-4%
-2%
31%
51%
66%
88%
1st Day Return Total Return (to 6/4/15)
EXITS - IPO

© 2015 ALL RIGHTS RESERVED ● MATTERMARK TRACTION REPORT ● MATTERMARK.COM ● (415) 366-6587
Q1-Q2 2015 VENTURE CAPITAL FINANCING ACTIVTY
13
Mattermark identified over 1,600 venture capital financing events using natural language processing technology. Our analysis indicates that although deal volume is down, deal size is increasing, particularly at later stages.

© 2015 ALL RIGHTS RESERVED ● MATTERMARK TRACTION REPORT ● MATTERMARK.COM ● (415) 366-6587
VENTURE CAPITAL FINANCING
14
2015 Venture-Backed Startups: Key Statistics
# Startups Funded Avg. Company Size Avg. MoM Employee Growth Avg. Company Age
1,661 83 4.5% 5 Years
Number of Deals Venture Capital Deployed Avg. Deal Size # Startups Receiving Follow-on Investments
1,681 $27.6B $16.4M 46

© 2015 ALL RIGHTS RESERVED ● MATTERMARK TRACTION REPORT ● MATTERMARK.COM ● (415) 366-6587
VENTURE CAPITAL FINANCING
15
Q1-Q2 Venture Investment Amount and Deal Volume Comparison
Q1-Q2 Deal Volume
Num
er o
f Dea
ls0
100
200
300
400
500
600
700
800
900
1000
1100
Pre-Series A A B C D Late
6374
171
283
477
1,009
7887
170
297
445
584
2015 2014
Q1-Q2 Venture Investment Amount
Tota
l Ven
ture
Cap
ital D
eplo
yed
$0.00B
$1.00B
$2.00B
$3.00B
$4.00B
$5.00B
$6.00B
$7.00B
$8.00B
$9.00B
$10.00B
Pre-Series A A B C D Late
3.69
4.534.54.5
3.48
0.84
$9.03
$4.23
$4.84
$5.53
$3.74
$0.84
2015 2014

© 2015 ALL RIGHTS RESERVED ● MATTERMARK TRACTION REPORT ● MATTERMARK.COM ● (415) 366-6587
VENTURE CAPITAL FINANCING
16
Q1-Q2 Venture Investment Amount and Deal Volume Comparison
Q1-Q2 Deal Volume
Num
er o
f Dea
ls0
100
200
300
400
500
600
700
800
900
1000
1100
Pre-Series A A B C D Late
6374
171
283
477
1,009
7887
170
297
445
584
2015 2014
Q1-Q2 Venture Investment Amount
Tota
l Ven
ture
Cap
ital D
eplo
yed
$0.00B
$1.00B
$2.00B
$3.00B
$4.00B
$5.00B
$6.00B
$7.00B
$8.00B
$9.00B
$10.00B
Pre-Series A A B C D Late
3.69
4.534.54.5
3.48
0.84
$9.03
$4.23
$4.84
$5.53
$3.74
$0.84
2015 2014

© 2015 ALL RIGHTS RESERVED ● MATTERMARK TRACTION REPORT ● MATTERMARK.COM ● (415) 366-6587 17
Q1-Q2 Average Deal Size ComparisonAv
erag
e D
eal S
ize
$0.00M
$25.00M
$50.00M
$75.00M
$100.00M
Pre-Series A A B C D Late
$38.73M
$61.15M
$26.30M
$15.89M
$7.29M
$0.93M
$82.44M
$48.61M
$28.50M
$18.63M
$8.41M
$1.63M
2015 2014
VENTURE CAPITAL FINANCING

© 2015 ALL RIGHTS RESERVED ● MATTERMARK TRACTION REPORT ● MATTERMARK.COM ● (415) 366-6587
VENTURE CAPITAL FINANCING
18
2015 Venture Backed Startups: Total by Metropolitan Region
Bay Area
New York
Boston
Los Angeles
Seattle
Washington
Austin
Chicago
San Diego
Atlanta
Number of Startups (Financed in 2015)0 100 200 300 400 500
29
32
44
50
50
55
84
154
230
446

© 2015 ALL RIGHTS RESERVED ● MATTERMARK TRACTION REPORT ● MATTERMARK.COM ● (415) 366-6587
VENTURE CAPITAL FINANCING
19
2015 Venture Backed Startups: Average Company Size by Metropolitan RegionAv
erag
e C
ompa
ny S
ize
0
25
50
75
100
125
Seattle Los Angeles Bay Area New York Chicago Atlanta Boston San Diego Austin Washington
3543
4851
60
7276
90
103
121

© 2015 ALL RIGHTS RESERVED ● MATTERMARK TRACTION REPORT ● MATTERMARK.COM ● (415) 366-6587 20
Largest Seattle Companies (Financed from Q1 - Q2 2015)
Company Name: Docusign Website: docusign.com Employees: 1225 6 Month Employee Growth Rate; 22%
Company Name: Avalara Website: avalara.com Employees: 849 6 Month Employee Growth Rate; 18%
Company Name: K2 Website: k2.com Employees: 529 6 Month Employee Growth Rate; 13%
Company Name: Porch Website: porch.com Employees: 421 6 Month Employee Growth Rate; 43%
Company Name: Tune Website: tune.com Employees: 278 6 Month Employee Growth Rate; 22%
VENTURE CAPITAL FINANCING

© 2015 ALL RIGHTS RESERVED ● MATTERMARK TRACTION REPORT ● MATTERMARK.COM ● (415) 366-6587
VENTURE CAPITAL FINANCING
21
2015 Venture-Backed Startups: Avg. MoM Employee Growth by Metropolitan Region
Chicago
Los Angeles
New York
Atlanta
Boston
Seattle
San Diego
Bay Area
Washington
Austin
Average Month over Month Employee Growth0% 3% 6% 9% 12%
3%
3%
3%
4%
4%
4%
5%
5%
8%
12%

© 2015 ALL RIGHTS RESERVED ● MATTERMARK TRACTION REPORT ● MATTERMARK.COM ● (415) 366-6587 22
Fastest Growing Chicago Companies (Financed from Q1 - Q2 2015)
Company Name: TurboAppeal Website: turboappeal.com Employees: 7 MoM Employee Growth Rate; 200%
Company Name: Iris Mobile Website: irismobile.com Employees: 37 MoM Employee Growth Rate; 55%
Company Name: Thoughtly Website: thoughtly.co Employees: 3 MoM Employee Growth Rate; 50%
Company Name: Avant Website: avant.com Employees: 306MoM Employee Growth Rate; 13%
Company Name: Pangea Payments Website: gopangea.com Employees: 25 MoM Employee Growth Rate; 10%
VENTURE CAPITAL FINANCING

© 2015 ALL RIGHTS RESERVED ● MATTERMARK TRACTION REPORT ● MATTERMARK.COM ● (415) 366-6587
STARTUP SPACESMattermark identifies a subset of startups that are growing at a rate, which will require them to move within the next few months. The following slides examine the properties of these companies.
23

© 2015 ALL RIGHTS RESERVED ● MATTERMARK TRACTION REPORT ● MATTERMARK.COM ● (415) 366-6587
STARTUP SPACES
24
High Growth Startups: Key Statistics - San Francisco
Number of High Growth Startups Avg. Company Size Avg. MoM Employee Growth Avg. Compound
Monthly Growth
6,380 28 26 9%
Number of Venture Backed High Growth Startups Venture Capital Received Avg. Office Size Total SF Needed
1,717 $6.8B 5,075 32M SF

© 2015 ALL RIGHTS RESERVED ● MATTERMARK TRACTION REPORT ● MATTERMARK.COM ● (415) 366-6587
STARTUP SPACES
25
High Growth Startups: US Geographic Distribution

© 2015 ALL RIGHTS RESERVED ● MATTERMARK TRACTION REPORT ● MATTERMARK.COM ● (415) 366-6587
STARTUP SPACES
26
High Growth Startups: Bay Area Geographic Distribution
City!Total
Number of Startups!
Venture-Backed Startups!
Average Number of Employees!
Average Employee
MoM Growth!
Average Compound
Monthly Employee
Growth!
Average Office Size (SF) Needed!
Total SF Needed!
San Francisco! 502! 276! 32! 25%! 9%! 5,614 ! 2,728,239 !
Palo Alto! 76! 53! 16! 24%! 7%! 2,751 ! 187,068 !
San Jose! 44! 18! 12! 25%! 8%! 2,194 ! 92,166 !
Sunnyvale! 39! 21! 15! 21%! 5%! 2,587 ! 121,581 !
Mountain View! 39! 31! 57! 22%! 8%! 9,802 ! 382,294 !
Santa Clara! 28! 11! 16! 23%! 11%! 2,779 ! 77,808 !
Menlo Park! 23! 17! 20! 17%! 9%! 3,385 ! 74,474 !
San Mateo! 22! 10! 20! 22%! 10%! 3,374 ! 74,233 !
Redwood City! 20! 11! 31! 19%! 8%! 5,239 ! 104,783 !
Berkeley! 16! 5! 33! 17%! 9%! 5,614 ! 89,827 !

© 2015 ALL RIGHTS RESERVED ● MATTERMARK TRACTION REPORT ● MATTERMARK.COM ● (415) 366-6587
STARTUP SPACES
27
High Growth Startups: Bay Area Geographic Distribution
City!Total
Number of Startups!
Venture-Backed Startups!
Average Number of Employees!
Average Employee
MoM Growth!
Average Compound
Monthly Employee
Growth!
Average Office Size (SF) Needed!
Total SF Needed!
San Francisco! 502! 276! 32! 25%! 9%! 5,614 ! 2,728,239 !
Palo Alto! 76! 53! 16! 24%! 7%! 2,751 ! 187,068 !
San Jose! 44! 18! 12! 25%! 8%! 2,194 ! 92,166 !
Sunnyvale! 39! 21! 15! 21%! 5%! 2,587 ! 121,581 !
Mountain View! 39! 31! 57! 22%! 8%! 9,802 ! 382,294 !
Santa Clara! 28! 11! 16! 23%! 11%! 2,779 ! 77,808 !
Menlo Park! 23! 17! 20! 17%! 9%! 3,385 ! 74,474 !
San Mateo! 22! 10! 20! 22%! 10%! 3,374 ! 74,233 !
Redwood City! 20! 11! 31! 19%! 8%! 5,239 ! 104,783 !
Berkeley! 16! 5! 33! 17%! 9%! 5,614 ! 89,827 !

© 2015 ALL RIGHTS RESERVED ● MATTERMARK TRACTION REPORT ● MATTERMARK.COM ● (415) 366-6587
STARTUP SPACES
28
High Growth Startups: Los Angeles Geographic Distribution
City! Total Number of Startups!
Venture-Backed Startups!
Average Number of Employees!
Average Employee
MoM Growth!
Average Compound Monthly Employee
Growth!
Average Office Size
(SF) Needed ! Total SF Needed !
Los Angeles! 121! 36! 17! 25%! 6%! 3,025 ! 344,875 !
Santa Monica ! 41! 17! 16! 20%! 8%! 2,807 ! 106,669 !
Irvine ! 23! 6! 30! 16%! 7%! 5,059 ! 116,368 !
Venice! 18! 10! 16! 24%! 10%! 2,846 ! 51,234 !
Beverly Hills! 12! 3! 11! 24%! 7%! 1,870 ! 22,436 !
Culver City! 11! 3! 20! 30%! 7%! 3,490 ! 38,394 !
Lake Forest! 9! 1! 26! 29%! 11%! 4,437 ! 39,937 !
Newport Beach ! 8! 3! 15! 16%! 8%! 2,500 ! 19,997 !
Pasadena! 8! 5! 22! 13%! 5%! 3,626 ! 29,008 !
Anaheim! 7! 1! 12! 18%! 4%! 2,120 ! 14,841 !

© 2015 ALL RIGHTS RESERVED ● MATTERMARK TRACTION REPORT ● MATTERMARK.COM ● (415) 366-6587
STARTUP SPACES
29
High Growth Startups: New York Geographic Distribution
City!Total
Number of Startups!
Venture-Backed Startups!
Average Number of Employee
s!
Average Employee
MoM Growth!
Average Compound Monthly Employee
Growth!
Average Office Size
(SF) Needed!Total SF Needed!
Manhattan! 576! 196! 32 ! 26%! 8%! 5,993 ! 3,361,821 !
Brooklyn! 45! 11! 12 ! 28%! 10%! 2,137 ! 96,154 !
Newark! 6! 1! 10 ! 33%! 4%! 1,769 ! 8,844 !Long
Island City! 4! 1! 9 ! 14%! 2%! 1,446 ! 5,785 !
Melville! 4! 1! 27 ! 15%! 3%! 4,513 ! 18,051 !
Allentown ! 3! 0! 10 ! 15%! 5%! 1,732 ! 5,197 !
Edison! 3! 1! 14 ! 27%! 5%! 2,413 ! 7,238 !
Fairfield! 3! 1! 21 ! 9%! 3%! 3,422 ! 10,265 !
Fort Lee! 3! 0! 20 ! 11%! 3%! 3,383 ! 10,149 !
Hoboken! 3! 0! 15 ! 44%! 28%! 2,625 ! 7,876 !

© 2015 ALL RIGHTS RESERVED ● MATTERMARK TRACTION REPORT ● MATTERMARK.COM ● (415) 366-6587
STARTUP SPACES
30
High Growth Startups: New York Geographic Distribution
City!Total
Number of Startups!
Venture-Backed Startups!
Average Number of Employee
s!
Average Employee
MoM Growth!
Average Compound Monthly Employee
Growth!
Average Office Size
(SF) Needed!Total SF Needed!
Manhattan! 576! 196! 32 ! 26%! 8%! 5,993 ! 3,361,821 !
Brooklyn! 45! 11! 12 ! 28%! 10%! 2,137 ! 96,154 !
Newark! 6! 1! 10 ! 33%! 4%! 1,769 ! 8,844 !Long
Island City! 4! 1! 9 ! 14%! 2%! 1,446 ! 5,785 !
Melville! 4! 1! 27 ! 15%! 3%! 4,513 ! 18,051 !
Allentown ! 3! 0! 10 ! 15%! 5%! 1,732 ! 5,197 !
Edison! 3! 1! 14 ! 27%! 5%! 2,413 ! 7,238 !
Fairfield! 3! 1! 21 ! 9%! 3%! 3,422 ! 10,265 !
Fort Lee! 3! 0! 20 ! 11%! 3%! 3,383 ! 10,149 !
Hoboken! 3! 0! 15 ! 44%! 28%! 2,625 ! 7,876 !

© 2015 ALL RIGHTS RESERVED ● MATTERMARK TRACTION REPORT ● MATTERMARK.COM ● (415) 366-6587
THE CURVE OF DEATHWhile several investors use Mattermark to identify burgeoning startups, other dealmakers including real estate brokers and recruiters are using Mattermark to identify companies that are downsizing. Most failed startups demonstrate strongly similar growth score patterns. We call this pattern the “Curve of Death.”
31

© 2015 ALL RIGHTS RESERVED ● MATTERMARK TRACTION REPORT ● MATTERMARK.COM ● (415) 366-6587
THE CURVE OF DEATH
32
KOLOS: The First iPad Racing WheelKolos, the first racing wheel for full-sized iPads failed because the product did not serve a market need.
“I obviously thought I was going to create a new category. Yeah, right.”
Ivaylo Kalburdzhiev, KOLOS founder
© 2015 ALL RIGHTS RESERVED ● MATTERMARK TRACTION REPORT ● MATTERMARK.COM ● (415) 366-6587
THE CURVE OF DEATH
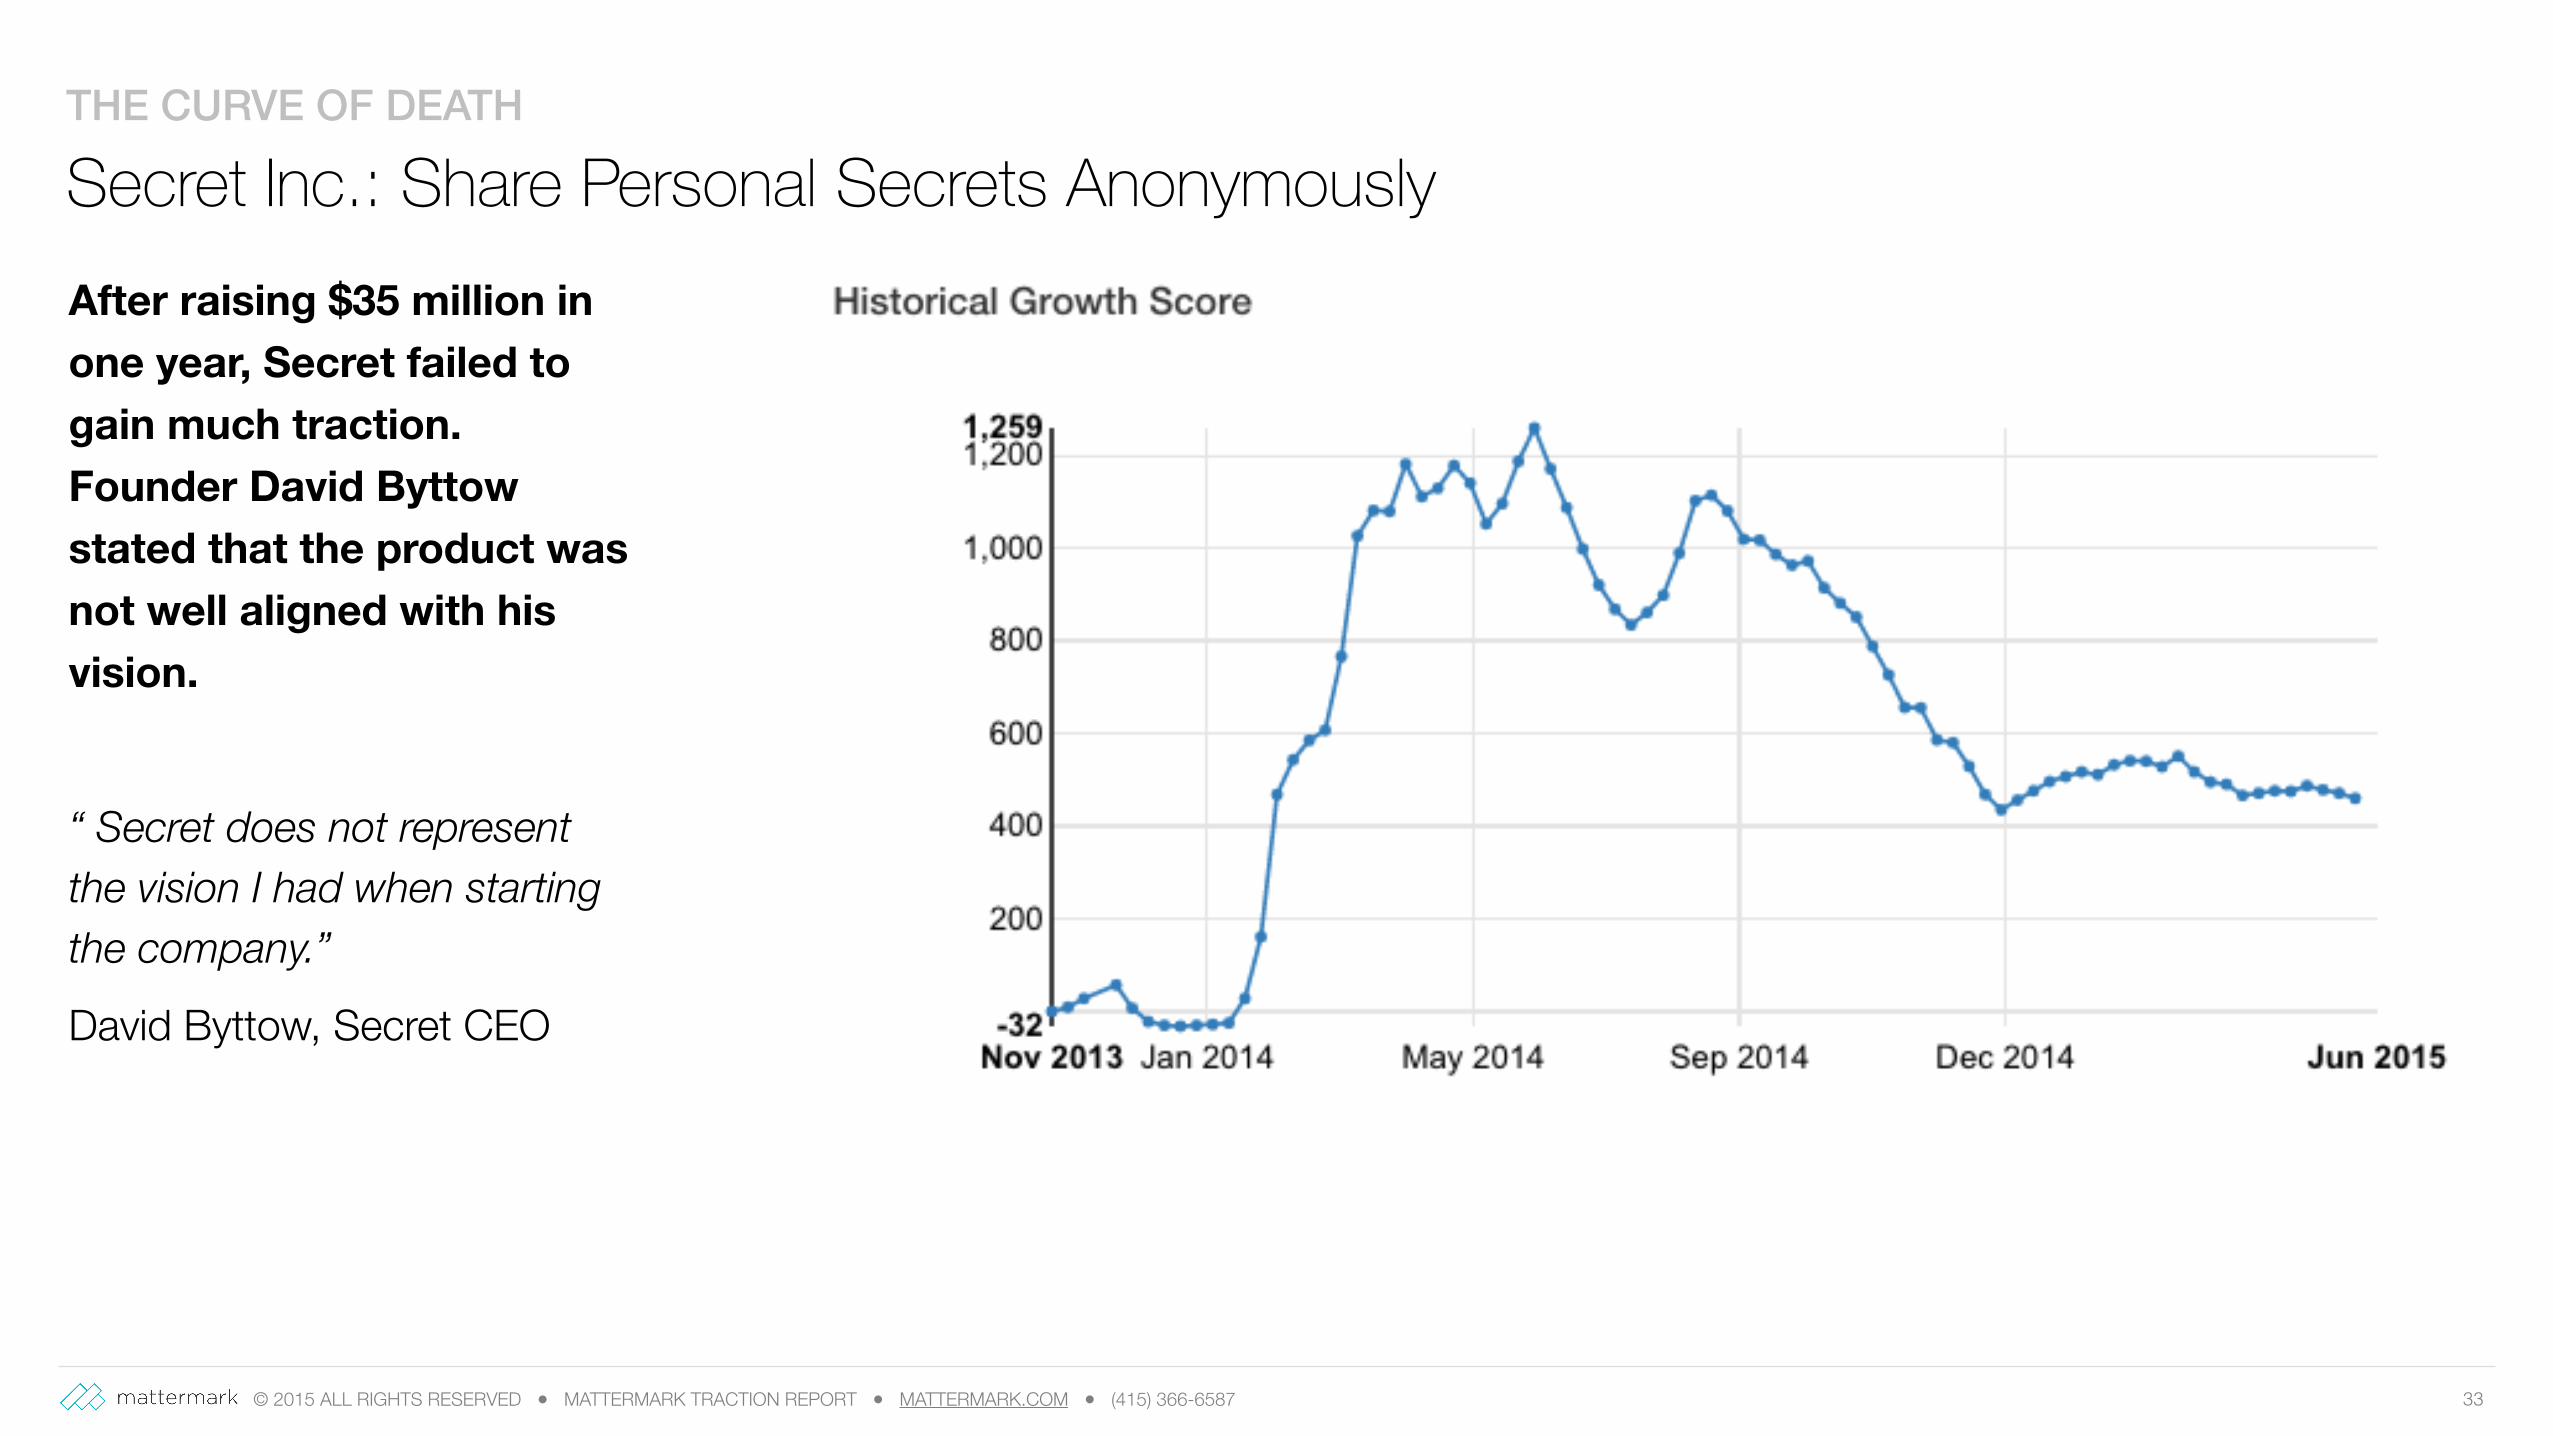
33
Secret Inc.: Share Personal Secrets AnonymouslyAfter raising $35 million in one year, Secret failed to gain much traction. Founder David Byttow stated that the product was not well aligned with his vision.
“ Secret does not represent the vision I had when starting the company.”
David Byttow, Secret CEO

© 2015 ALL RIGHTS RESERVED ● MATTERMARK TRACTION REPORT ● MATTERMARK.COM ● (415) 366-6587
THE CURVE OF DEATH
34
Moped: Making messaging more web-friendlyAlthough Moped had lofty ambitions - to revolutionize communication by making messaging and messaging infrastructure more web-friendly - but the company was unable to attract or retain users.
“But instead of focusing on why users weren’t coming back, we were trying to attract new users. We started costly development cycles that, in the end, won us some users, but, unfortunately, not enough…” Schuyler Deerman