stock code: 01070 - tcl multimedia – the creative...
TRANSCRIPT
TCL Multimedia Technology Holdings Limited Stock code: 01070
2015 Q1 Results Presentation Unaudited results for the three months ended 31 March
1 2 3
Agenda
Financial
Highlights Business
Review Outlook
Page 2

1. Financial Highlights A Cinematic Experience
Like Never Before
TCL TV+ Curved H8800 Series
2015 Q1 Results
Page 4
15
46
2014 Q1 2015 Q1
4,347 5,413
2,982
2,862
2014 Q1 2015 Q1
PRC Market Overseas Markets
8,275 (HK$ million) 2015
Q1
2014
Q1 Change
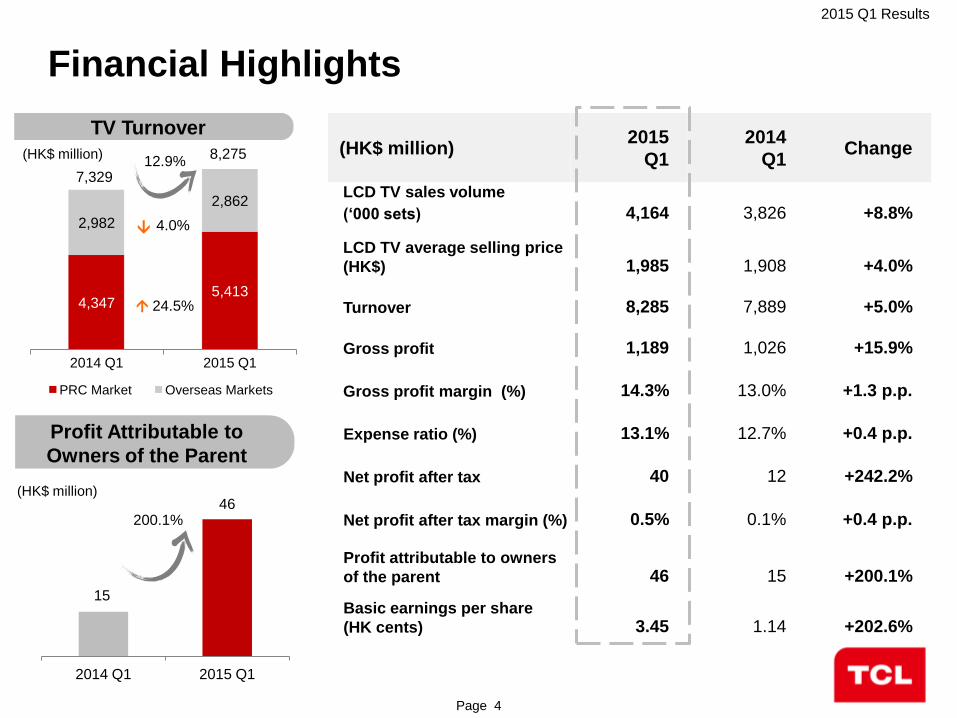
LCD TV sales volume
(‘000 sets) 4,164 3,826 +8.8%
LCD TV average selling price
(HK$) 1,985 1,908 +4.0%
Turnover 8,285 7,889 +5.0%
Gross profit 1,189 1,026 +15.9%
Gross profit margin (%) 14.3% 13.0% +1.3 p.p.
Expense ratio (%) 13.1% 12.7% +0.4 p.p.
Net profit after tax 40 12 +242.2%
Net profit after tax margin (%) 0.5% 0.1% +0.4 p.p.
Profit attributable to owners
of the parent 46 15 +200.1%
Basic earnings per share
(HK cents) 3.45 1.14 +202.6%
TV Turnover
(HK$ million)
7,329 12.9%
24.5%
4.0%
Profit Attributable to
Owners of the Parent
200.1%
(HK$ million)
Financial Highlights
2015 Q1 Results
Page 5
(HK$ million)
2015
Q1
2014
Q1 Change
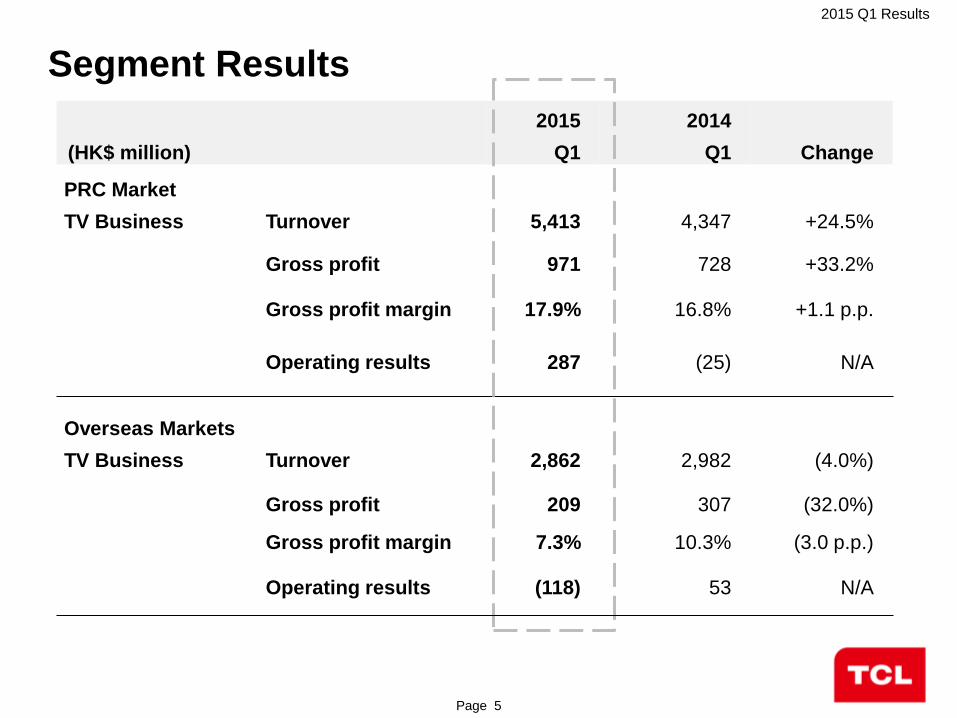
PRC Market
TV Business Turnover 5,413 4,347 +24.5%
Gross profit 971 728 +33.2%
Gross profit margin 17.9% 16.8% +1.1 p.p.
Operating results 287 (25) N/A
Overseas Markets
TV Business Turnover 2,862 2,982 (4.0%)
Gross profit 209 307 (32.0%)
Gross profit margin 7.3% 10.3% (3.0 p.p.)
Operating results (118) 53 N/A
Segment Results
2015 Q1 Results
Page 6
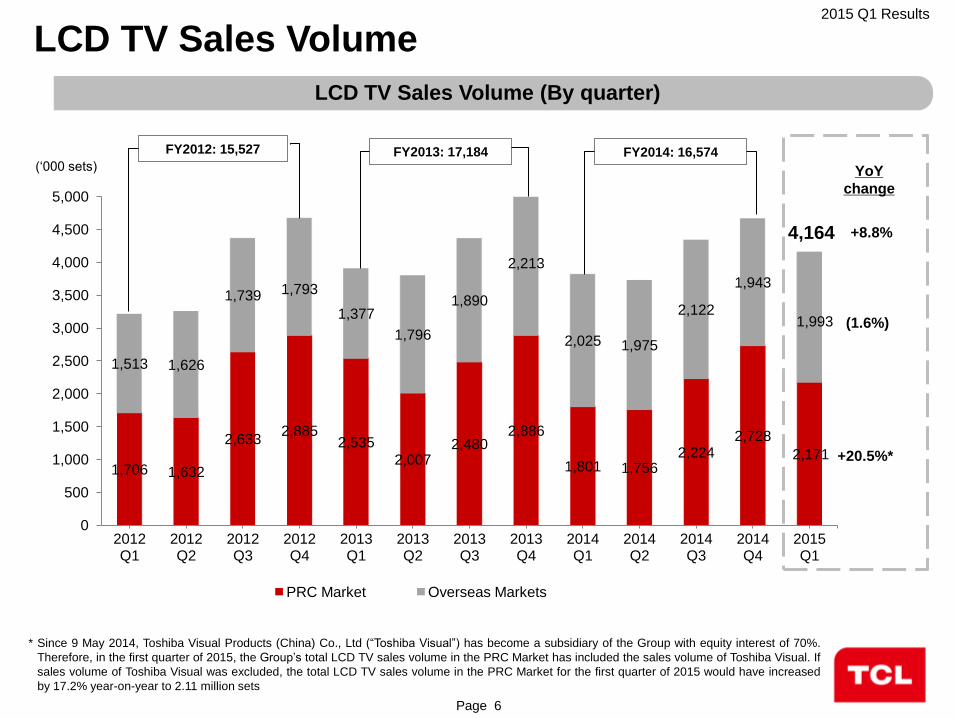
1,706 1,632
2,633 2,885
2,535
2,007 2,480
2,886
1,801 1,756 2,224
2,728
2,171
1,513 1,626
1,739 1,793
1,377
1,796
1,890
2,213
2,025 1,975
2,122
1,943
1,993
0
500
1,000
1,500
2,000
2,500
3,000
3,500
4,000
4,500
5,000
2012 Q1
2012 Q2
2012 Q3
2012 Q4
2013 Q1
2013 Q2
2013 Q3
2013 Q4
2014 Q1
2014 Q2
2014 Q3
2014 Q4
2015 Q1
PRC Market Overseas Markets
(‘000 sets) FY2014: 16,574 FY2013: 17,184 FY2012: 15,527
+20.5%*
(1.6%)
4,164
YoY
change
+8.8%
LCD TV Sales Volume (By quarter)
LCD TV Sales Volume
* Since 9 May 2014, Toshiba Visual Products (China) Co., Ltd (“Toshiba Visual”) has become a subsidiary of the Group with equity interest of 70%.
Therefore, in the first quarter of 2015, the Group’s total LCD TV sales volume in the PRC Market has included the sales volume of Toshiba Visual. If
sales volume of Toshiba Visual was excluded, the total LCD TV sales volume in the PRC Market for the first quarter of 2015 would have increased
by 17.2% year-on-year to 2.11 million sets

2015 Q1 Results
Page 7
2,154 2,114 2,128
2,356 2,322 2,183 2,098 2,052
1,908 2,182 2,099
2,115 1,985
2,614 2,513 2,506
2,737 2,636
2,729
2,494 2,534 2,414 2,728
2,337
2,539 2,494
1,000
2,000
3,000
4,000
2012 Q1
2012 Q2
2012 Q3
2012 Q4
2013 Q1
2013 Q2
2013 Q3
2013 Q4
2014 Q1
2014 Q2
2014 Q3
2014 Q4
2015 Q1
Overall The PRC
(HK$)
Super-smart
“Cloud” TVs
4K UHD TVs
TCL iQIYI TV+
Game TVs
TCL Mango TV+
Wechat-linked TV+
Curved H9600 Series
TCL TV+
Curved Quantum
Dot TVs
FY2014: 2,434
FY2014: 1,975
FY2013: 2,590
FY2013: 2,154
FY2012: 2,603
FY2012: 2,199
Average Selling Prices of LCD TVs (By quarter)
+4.0%
+3.3%
YoY
change
LCD TV Average Selling Prices
2015 Q1 Results
Page 8
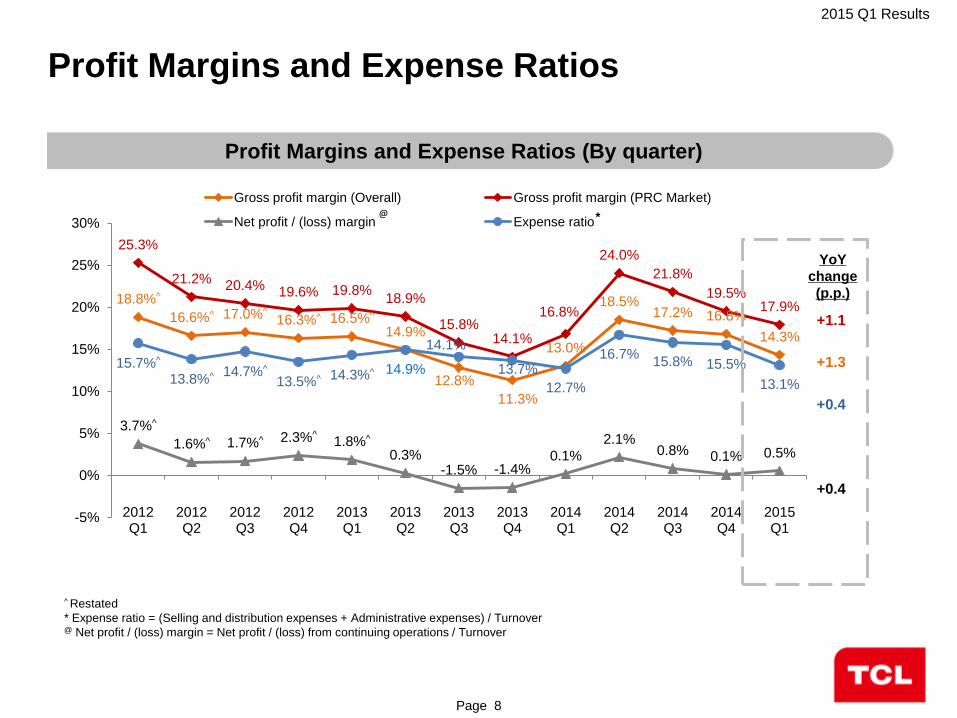
18.8%^
16.6%^ 17.0%^ 16.3%^ 16.5%^ 14.9%
12.8%
11.3%
13.0%
18.5% 17.2% 16.8%
14.3%
25.3%
21.2% 20.4% 19.6% 19.8% 18.9%
15.8% 14.1%
16.8%
24.0%
21.8%
19.5% 17.9%
3.7%^
1.6%^ 1.7%^ 2.3%^ 1.8%^ 0.3%
-1.5% -1.4% 0.1%
2.1% 0.8% 0.1% 0.5%
15.7%^ 13.8%^
14.7%^ 13.5%^ 14.3%^ 14.9%
14.1%
13.7%
12.7%
16.7% 15.8% 15.5%
13.1%
-5%
0%
5%
10%
15%
20%
25%
30%
2012 Q1
2012 Q2
2012 Q3
2012 Q4
2013 Q1
2013 Q2
2013 Q3
2013 Q4
2014 Q1
2014 Q2
2014 Q3
2014 Q4
2015 Q1
Gross profit margin (Overall) Gross profit margin (PRC Market)
Net profit / (loss) margin Expense ratio * @
+0.4
+0.4
YoY
change
(p.p.)
+1.3
+1.1
Profit Margins and Expense Ratios (By quarter)
Profit Margins and Expense Ratios
^ Restated
* Expense ratio = (Selling and distribution expenses + Administrative expenses) / Turnover @ Net profit / (loss) margin = Net profit / (loss) from continuing operations / Turnover
2015 Q1 Results
Page 9
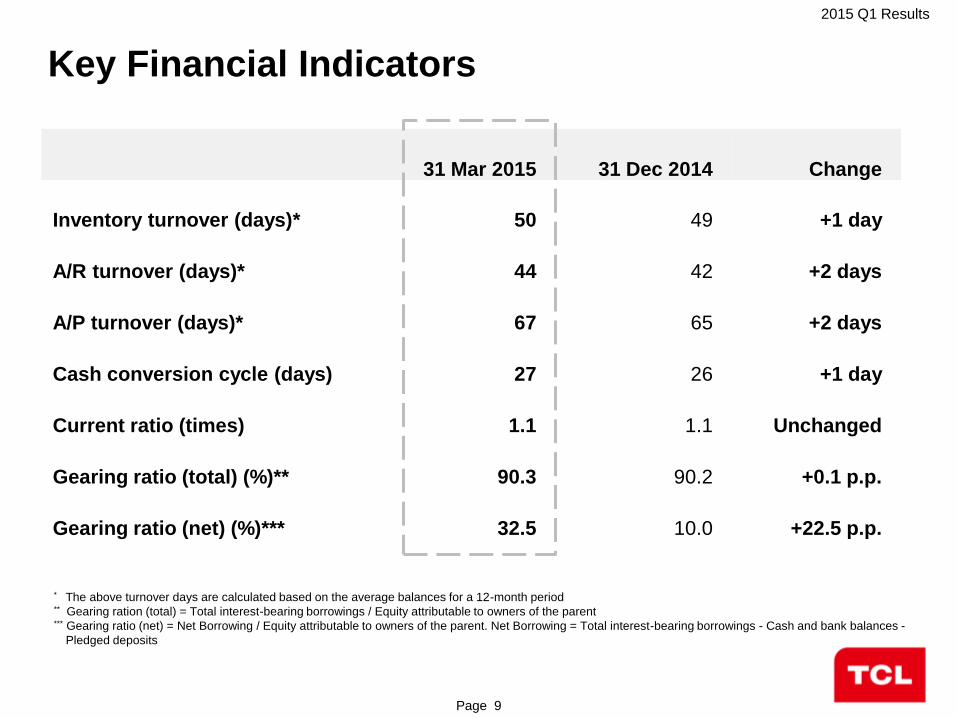
31 Mar 2015 31 Dec 2014 Change
Inventory turnover (days)* 50 49 +1 day
A/R turnover (days)* 44 42 +2 days
A/P turnover (days)* 67 65 +2 days
Cash conversion cycle (days) 27 26 +1 day
Current ratio (times) 1.1 1.1 Unchanged
Gearing ratio (total) (%)** 90.3 90.2 +0.1 p.p.
Gearing ratio (net) (%)*** 32.5 10.0 +22.5 p.p.
Key Financial Indicators
* The above turnover days are calculated based on the average balances for a 12-month period ** Gearing ration (total) = Total interest-bearing borrowings / Equity attributable to owners of the parent *** Gearing ratio (net) = Net Borrowing / Equity attributable to owners of the parent. Net Borrowing = Total interest-bearing borrowings - Cash and bank balances -
Pledged deposits
2015 Q1 Results
Page 10
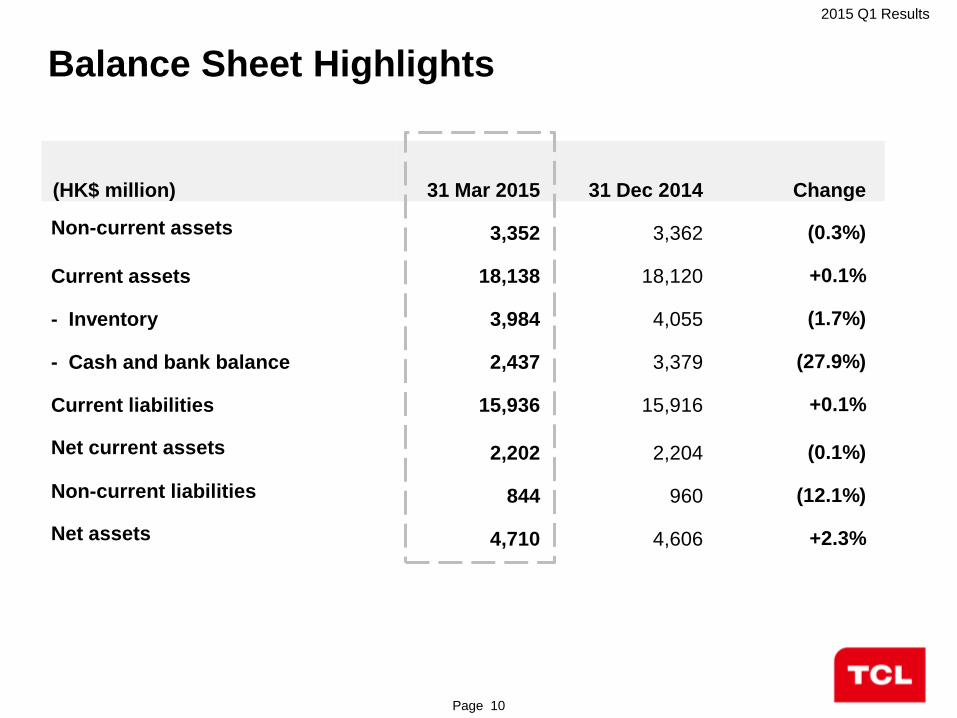
(HK$ million) 31 Mar 2015 31 Dec 2014 Change
Non-current assets 3,352 3,362 (0.3%)
Current assets 18,138 18,120 +0.1%
- Inventory 3,984 4,055 (1.7%)
- Cash and bank balance 2,437 3,379 (27.9%)
Current liabilities 15,936 15,916 +0.1%
Net current assets 2,202 2,204 (0.1%)
Non-current liabilities 844 960 (12.1%)
Net assets 4,710 4,606 +2.3%
Balance Sheet Highlights

2. Business
Review

2015 Q1 Results
Page 12 Source: DisplaySearch
Ranking Brand FY 2014 FY 2013
1 Samsung 21.8% 20.5%
2 LGE 14.2% 13.8%
3 Sony 6.5% 6.2%
4 TCL 5.4% 6.5% 5 Hisense 5.2% 4.7%
6 Skyworth 4.1% 4.4%
7 Panasonic 3.7% 3.9%
8 Toshiba 3.4% 4.2%
9 AOC/TP Vision 3.4% 4.1%
10 Vizio 3.1% 3.1%
Ranking Brand FY 2014 FY 2013
1 Skyworth 16.4% 16.1%
2 Hisense 16.3% 15.1%
3 TCL 16.0% 18.1% 4 Changhong 10.8% 11.9%
5 Konka 10.2% 11.3%
6 Haier 5.4% 5.7%
7 Samsung 5.0% 4.1%
8 Sharp 3.5% 3.5%
9 Sony 3.2% 3.4%
10 LGE 1.8% 1.9%
PRC LCD TV Market Share
Global LCD TV Market Share
2015 Q1 Results
Page 13
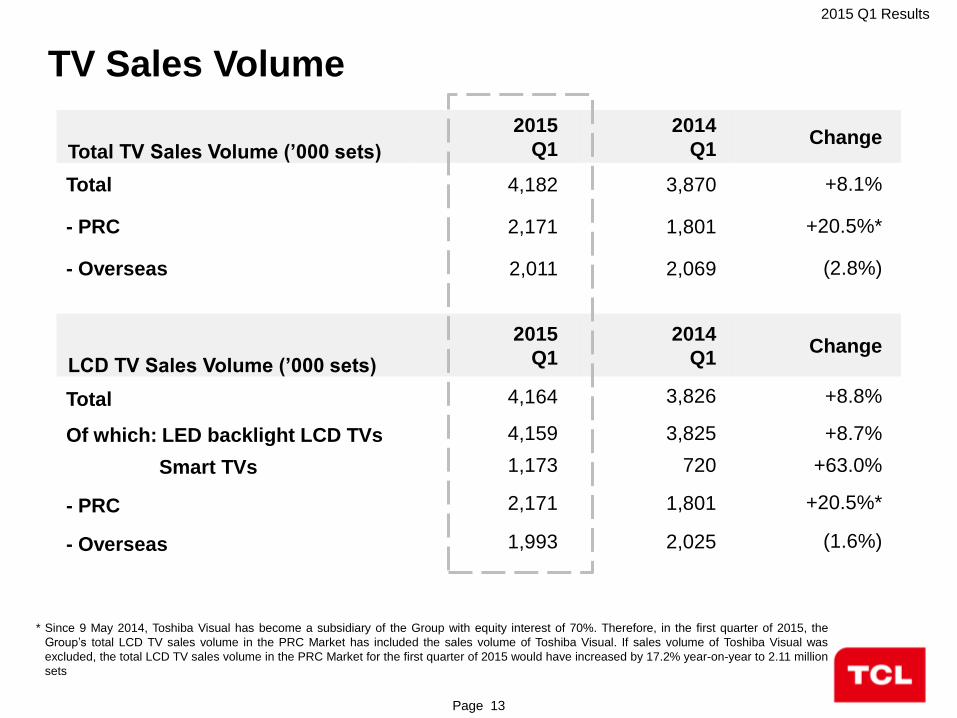
Total TV Sales Volume (’000 sets)
2015
Q1
2014
Q1 Change
Total 4,182 3,870 +8.1%
- PRC 2,171 1,801 +20.5%*
- Overseas 2,011 2,069 (2.8%)
LCD TV Sales Volume (’000 sets)
2015
Q1
2014
Q1 Change
Total 4,164 3,826 +8.8%
Of which: LED backlight LCD TVs
Smart TVs
4,159
1,173
3,825
720
+8.7%
+63.0%
- PRC 2,171 1,801 +20.5%*
- Overseas 1,993 2,025 (1.6%)
TV Sales Volume
* Since 9 May 2014, Toshiba Visual has become a subsidiary of the Group with equity interest of 70%. Therefore, in the first quarter of 2015, the
Group’s total LCD TV sales volume in the PRC Market has included the sales volume of Toshiba Visual. If sales volume of Toshiba Visual was
excluded, the total LCD TV sales volume in the PRC Market for the first quarter of 2015 would have increased by 17.2% year-on-year to 2.11 million
sets
2015 Q1 Results
Page 14
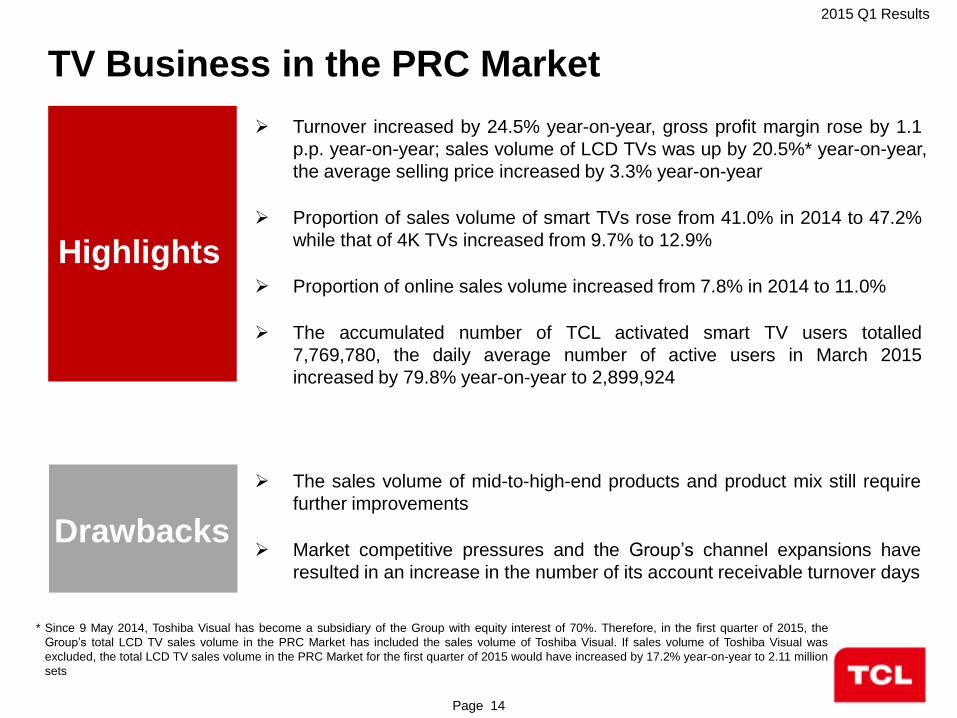
Highlights
Turnover increased by 24.5% year-on-year, gross profit margin rose by 1.1
p.p. year-on-year; sales volume of LCD TVs was up by 20.5%* year-on-year,
the average selling price increased by 3.3% year-on-year
Proportion of sales volume of smart TVs rose from 41.0% in 2014 to 47.2%
while that of 4K TVs increased from 9.7% to 12.9%
Proportion of online sales volume increased from 7.8% in 2014 to 11.0%
The accumulated number of TCL activated smart TV users totalled
7,769,780, the daily average number of active users in March 2015
increased by 79.8% year-on-year to 2,899,924
Drawbacks
The sales volume of mid-to-high-end products and product mix still require
further improvements
Market competitive pressures and the Group’s channel expansions have
resulted in an increase in the number of its account receivable turnover days
TV Business in the PRC Market
* Since 9 May 2014, Toshiba Visual has become a subsidiary of the Group with equity interest of 70%. Therefore, in the first quarter of 2015, the
Group’s total LCD TV sales volume in the PRC Market has included the sales volume of Toshiba Visual. If sales volume of Toshiba Visual was
excluded, the total LCD TV sales volume in the PRC Market for the first quarter of 2015 would have increased by 17.2% year-on-year to 2.11 million
sets

2015 Q1 Results
Page 15
There is still a disparity in sales of high-end products among its key
competitors
Comparison for market share and average selling price for UHD products (2015 Q1)
2015 Q1 4K UHD TV Market Penetration Rate of TCL, Skyworth and Hisense
TV Business in the PRC Market
Source: CMM (Mar 2015)
Brand Market share for sales
volume
Average selling price
(RMB)
Hisense 20.1% 5,740
Samsung 14.3% 8,792
Skyworth 14.4% 5,367
TCL 13.1% 4,999
Changhong 11.8% 4,765
23.0% 22.0%
26.8%
26.6% 23.8%
27.7%
31.2% 28.0%
34.6%
Jan Feb Mar
10.0%
15.0%
20.0%
25.0%
30.0%
35.0%
40.0%
TCL
Skyworth
Hisense

2015 Q1 Results
Page 16
Sales volume of LCD TVs in the Emerging Markets increased by
22.8% year-on-year to 1.17 million sets, average selling price
increased by 6.7% year-on-year
As the cooperation with TCL Roku TVs in the North American Market
has gradually achieved improvements, sales volume of LCD TVs in
the North American Market grew by 85.1% year-on-year
Overall performance did not meet expectations, turnover decreased by
4.0% year-on-year while gross profit margin dropped by 3.0 p.p.; sales
volume of LCD TVs down by 1.6% year-on-year; average selling price
down by 1.9% year-on-year
The European Market was impacted by the fluctuations of foreign
exchange rates, leading to declines in revenue and gross profit margin
Strategic ODM business was affected by major customers which led to
a drop of 34.7% year-on-year in sales volume of LCD TVs
TV Business in the Overseas Markets
Highlights
Drawbacks

2015 Q1 Results
Page 17
TCL Smart TV Operation Statistics in 2014 and 2015 Q1
2014 2015
1,459 1,575 1,613 1,668 1,745 1,813 1,864 1,938
2,001 2,026
2,191 2,269 2,560
2,825 2,900
376 154 169 178 191 164 169 174 194 223 226 256
386 411 226
376 530
699 877
1,068 1,231 1,400 1,575
1,769 1,992
2,218 2,474
2,860
3,271 3,497
4,648 4,802 4,971
5,149 5,340
5,504 5,673 5,847
6,041 6,264
6,490 6,747
7,132 7,544 7,770
-
1,000
2,000
3,000
4,000
5,000
6,000
7,000
8,000
Jan Feb Mar Apr May Jun Jul Aug Sep Oct Nov Dec Jan Feb Mar
Daily average number of active users
Number of new activated users for the month
Accumulated total number of activated users (from Jan 2014 to Mar 2015)
Accumulated total number of activated users
(’000 users)
3. Outlook
TCL TV+ True Colour E6800 Series

2015 Q1 Results
Page 19
0
10
20
30
40
50
60
Asia Pacific The PRC Japan Western Europe
Eastern Europe
North America
Latin America Middle East and Africa
2013 2014 2015 2016 2017 2018
7.3%
3.4%
6.7%
(2.7%)
(2.4%) 0.3% 13.2%
8.6%
Global LCD TV Market Forecasts
– Growth Rate of Market Size
The size of global LCD TV market is expected to grow by 3.9% in 2015
Source:DisplaySearch
(unit: million sets)
2015 Q1 Results
Page 20
Source:DisplaySearch and CMM
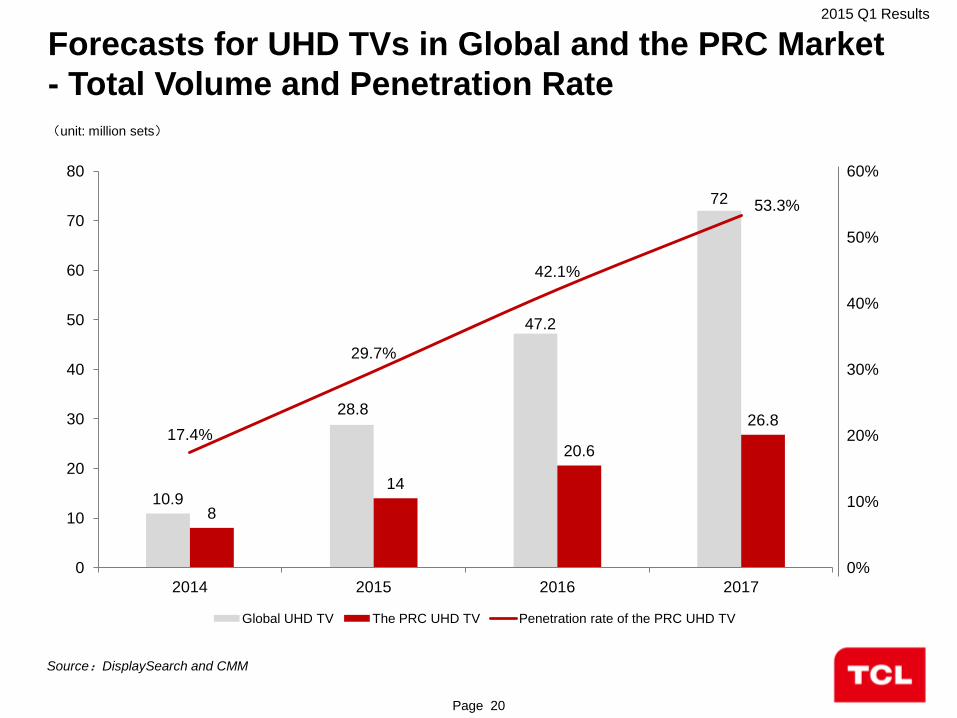
Forecasts for UHD TVs in Global and the PRC Market
- Total Volume and Penetration Rate
10.9
28.8
47.2
72
8
14
20.6
26.8 17.4%
29.7%
42.1%
53.3%
0%
10%
20%
30%
40%
50%
60%
0
10
20
30
40
50
60
70
80
2014 2015 2016 2017
Global UHD TV The PRC UHD TV Penetration rate of the PRC UHD TV
(unit: million sets)

2015 Q1 Results
Page 21
Source:AVC
Forecasts for Curved Screens and TVs in Global and
the PRC Market - Total Volume and Penetration Rate
2
7.8
9.9
11.7
1
6
7.9
9.4
0.32
1.8
2.6
3.9
0.8%
3.2%
3.8%
4.3%
0.5%
2.7%
3.4%
3.9%
0.7%
3.8%
5.3%
7.8%
0%
1%
2%
3%
4%
5%
6%
7%
8%
9%
0
2
4
6
8
10
12
14
2014 2015 2016 2017
Global Curved Screen Global Curved TV The PRC Curved TV
Penetration rate of global Curved Screen Penetration rate of global Curved TV Penetration rate of the PRC Curved TV
(unit: million sets)
2015 Q1 Results
Page 22
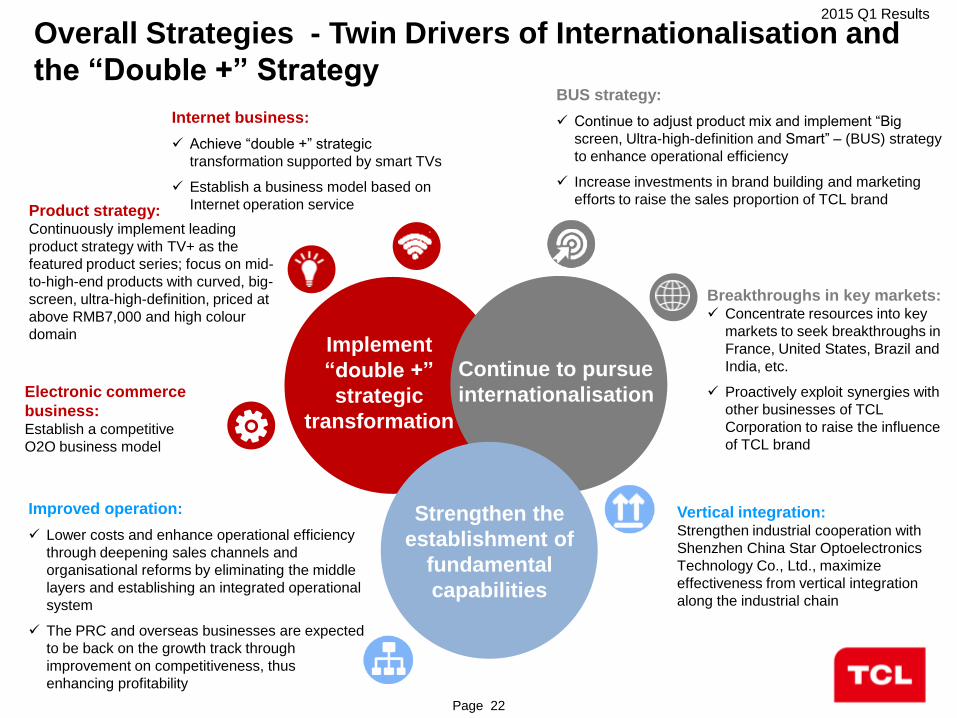
Overall Strategies - Twin Drivers of Internationalisation and
the “Double +” Strategy
Product strategy: Continuously implement leading
product strategy with TV+ as the
featured product series; focus on mid-
to-high-end products with curved, big-
screen, ultra-high-definition, priced at
above RMB7,000 and high colour
domain
Improved operation:
Lower costs and enhance operational efficiency
through deepening sales channels and
organisational reforms by eliminating the middle
layers and establishing an integrated operational
system
The PRC and overseas businesses are expected
to be back on the growth track through
improvement on competitiveness, thus
enhancing profitability
Electronic commerce
business: Establish a competitive
O2O business model
Continue to pursue
internationalisation
BUS strategy:
Continue to adjust product mix and implement “Big
screen, Ultra-high-definition and Smart” – (BUS) strategy
to enhance operational efficiency
Increase investments in brand building and marketing
efforts to raise the sales proportion of TCL brand
Breakthroughs in key markets: Concentrate resources into key
markets to seek breakthroughs in
France, United States, Brazil and
India, etc.
Proactively exploit synergies with
other businesses of TCL
Corporation to raise the influence
of TCL brand
Vertical integration: Strengthen industrial cooperation with
Shenzhen China Star Optoelectronics
Technology Co., Ltd., maximize
effectiveness from vertical integration
along the industrial chain
Internet business:
Achieve “double +” strategic
transformation supported by smart TVs
Establish a business model based on
Internet operation service
Strengthen the
establishment of
fundamental
capabilities
Implement
“double +”
strategic
transformation

2015 Q1 Results
Page 23
Operational Strategies
Substantial
improvements in
core business
performances
Significant
enhancements
in operational
efficiency
Effective
enactment of
integrated
business
model
1 2 3

2015 Q1 Results
Page 24
Internet Business Strategies
Implement “double +” strategic transformation and
establish a business model based on
Internet operation service through smart TVs
Establish operable business model
Establish scaled operational service revenue
Expand operable user base
Innovate and incubate new Internet business
1
2
3
4

2015 Q1 Results
Page 25
The PRC Market FY 2014 actual FY 2015 target 2015 Q1 actual
Proportion of smart TVs sales volume (%)
Proportion of 4K TVs sales volume (%)
Proportion of online sales volume (%)
41.0%
9.7%
7.8%
60%
20%
15%
47.2%
12.9%
11.0%
FY 2014 actual FY 2015 target 2015 Q1 actual
Number of TCL activated smart TV users
(Accumulated number at period end) (year-end /
quarter-end)1
Daily average number of active users (year-end /
month-end)2
Service revenue (RMB)
6,746,610
2,268,959
N/A
10,000,000
4,200,000
50,000,000
7,769,780
2,899,9243
1,393,700
2014 2015
Overall
actual
The PRC Market Overseas Markets Overall
target
The PRC Market Overseas Markets
FY
actual
Q1
actual
FY
actual
Q1
actual
FY
target
Q1
actual
FY
target
Q1
actual
LCD TVs sales volume
(‘0000 sets)
Turnover
(HK$ million)
1,657
33,526
851
180
4,347
806
203
2,982
1,750
40,500
870 217
( 20.5%) 4
5,413
( 24.5%)
880 199
(1.6%)
2,862
( 4.0%)
1. Number of TCL activated smart TV users (Accumulated number at period end) = Accumulated number of activated TV terminals
2. Daily average number of active users = Number of unrepeated individual users who visit within 7 days
3. March 2015 data
4. Since 9 May 2014, Toshiba Visual has become a subsidiary of the Group with equity interest of 70%. Therefore, in the first quarter of 2015, the Group’s total
LCD TV sales volume in the PRC Market has included the sales volume of Toshiba Visual. If sales volume of Toshiba Visual was excluded, the total LCD TV
sales volume in the PRC Market for the first quarter of 2015 would have increased by 17.2% year-on-year to 2.11 million sets
Targets for 2015 and Progress of Implementation

2015 Q1 Results
Page 26
• The information contained herein should not be utilised for any legal purposes with regards to
any investor's investment decision or results. In particular, this document does not constitute
any recommendation or invitation for subscribing for or sale and purchase of any securities in
TCL Multimedia Technology Holdings Limited (the “Company”). The Company hereby
expressly disclaims any liability for any loss or damage resulting from or in connection with
any reliance by any investor on the information contained herein.
• A number of forward-looking statements may be made from this presentation. Forward-
looking statements are statements that are not historical facts. These forward-looking
statements are based on the current expectations of the Company and there can be no
assurance that such expectations will prove to be correct. Because forward-looking
statements involve risks and uncertainties, the Company’s actual results could differ
materially from these statements.
Disclaimer
Q&A
Page 27